Article

Digital Twin-Assisted Urban Resilience: A Data-Driven Framework for Sustainable Regeneration in Paranoá, Brasilia

Department of Architecture, Built Environment and Construction Engineering, Politecnico di Milano, Via Giuseppe Ponzio 31, 20133 Milano, Italy
*
Author to whom correspondence should be addressed.
Urban Sci. 2025, 9(9), 333; https://doi.org/10.3390/urbansci9090333
Submission received: 12 June 2025 / Revised: 12 August 2025 / Accepted: 13 August 2025 / Published: 26 August 2025
(This article belongs to the Topic Spatial Decision Support Systems for Urban Sustainability)

Abstract

Rapid urbanization has intensified the systemic inequities of resources and infrastructure distribution in informal settlements, particularly in the Global South. Digital Twin Modeling (DTM), as an effective data-driven representation, enables real-time analysis, scenario simulation, and design optimization, making it a promising tool to support urban resilience. This study introduces the Integrated Modification Methodology (IMM), developed by Politecnico di Milano (Italy), to explore how DTM can be systematically structured and transformed into an active instrument, linking theories with practical application. Focusing on Paranoá (Brasília), a case study developed under the NBSouth project in collaboration with the Politecnico di Milano and the University of Brasília, this research integrates advanced spatial mapping with comprehensive key performance indicators (KPIs) analysis to address developmental and environmental challenges during the regeneration process. Key metrics—Green Space Diversity, Ecosystem Service Proximity, and Green Space Continuity—were analyzed by a Geographic Information System (GIS) platform on 30 m by 30 m sampling grids. Additional KPIs across urban structural, environmental, and mobility layers were calculated to support the decision-making process for strategic mapping. This study contributes to theoretical advancements in DTM and broader discourse on urban regeneration under climate stress, offering a systemic and practical approach for multi-dimensional digitalization of urban structure and performance, supporting a more adaptive, data-based, and transferable planning process in the Global South.

1. Introduction

1.1. Urbanization, Climate Exposure, and Informality in the Global South

Rapid urbanization is accompanied by ecological vulnerability and social inequality, which, consequently, present specific challenges to sustainable development in the Global South [1]. In Brazil, the industrialization process, which accelerated in the mid-20th century, initially driven by prosperous export trades [2], has intensified the disparity in resource distribution, leading to tension between urbanization and informality (or favelas) [3]. Informal settlements in Brazil (e.g., slums) often emerged without formal planning and have much less public service accessibility than formal urban areas [4]. These areas frequently struggle with intersecting challenges—escalated urban heat, insufficient infrastructure coverage, fragmented administration, and restricted service delivery—that aggravate their vulnerability to environmental stressors. Such risks are not evenly distributed, disproportionately affecting low-income urban residents who inhabit ecologically fragile zones [5]. Inadequate infrastructure in these areas, especially green space, drainage, and transportation accessibility, creates systemic spatial injustices and hinders climate adaptation [6,7].
Informal settlements reflect the urban expansion of the Global South. These areas are frequently characterized by significant infrastructural deficiencies and spatial disarray, as they are rarely subjected to formal planning [8]. The lack of a stable water supply, a reliable drainage system, and proper urban pavement affects the quality of life of residents and makes them extremely vulnerable to the urban heat island effect, flood risk, and infrastructure failure. Such areas (e.g., favelas in Rio de Janeiro) are often located in hazardous terrain or on the urban margins—such as hillsides or wetlands—whose occupation patterns often result from spontaneous informal processes, rather than planned urban growth. This intensifies vulnerability to natural disasters, and governmental protective measures frequently fail to reach promptly [6]. In addition, the limited connectivity of green to open spaces exacerbates urban thermal discomfort and reduces urban adaptivity [9,10,11].
Urban resilience has become recognized as a strategic framework for tackling multiscale vulnerability [12], particularly in the complex contexts of cities in the Global South. However, current mainstream resilience frameworks, mostly derived from European and American urban planning perspectives, often fail to respond to the socio-spatial realities of informal and marginalized settlements in the Global South [13]. Informal settlements (e.g., slums, self-constructed communities) prevalent in cities are not included in mainstream resilience frameworks, while these areas account for 30% to 60% of the urban population [14] in the global South. The urban planning strategies from the Global North are, most of the time, unfit due to their techno-managerial and market-driven characteristics, which do not align with the circumstances of underprivileged communities predominantly living in informal settings in the Global South [15]. Instead of adopting an “international standard,” a localized framework that takes into account urban informality and the rethinking of infrastructure should be addressed [16,17].
The aim of this paper is to propose a hybrid approach that integrates morphological assessment and socio-ecological diagnosis, enhancing both the theoretical expansion and practical application of the resilience framework in the informal context. Two key research questions are addressed: (1) How can the attributes of fragmentation and dynamics of informal context be digitalized? (2) What theoretical–methodological procedures are effective in translating diagnostic insights into strategic interventions?

1.2. Urban Digital Twins (UDTs) as Planning Instruments

Digital transformation is a crucial aspect of urban development. Every significant technical advancement reshapes the world landscape [18]. Urban Digital Twins (UDTs), as a digital mirror of physical cities in cyberspace, are increasingly becoming critical tools for smart city planning and management by replicating cities as complex adaptive systems [19]. Before the introduction of UDTs, land-use and transport interaction (LUTI) models, developed by pioneering researchers such as Lowry [20], Echenique [21], Batty [22], and Wegener [23], have significantly contributed to urban and infrastructure development since the 1960s [24]. Originally developed for engineering and logistics [25], UDTs involve multiple innovative technologies in crucial roles [18]. Surveying and mapping technologies form the foundation for the acquisition of static data regarding urban structures. Building Information Modeling (BIM) and City Information Modeling (CIM) technology support urban asset and infrastructure administration. Internet-of-Things (IoT) and 5G ensure the effective capture of dynamic data and feedback. UDTs integrate data streams, simulation models, and IoT infrastructures to support urban planning, management, and decision-making [26], and are considered “next-generation technology” for stakeholders due to their real-time dynamic interactions that enable monitoring the state of the city [19,24]. This ability to model complex systems is the foundation of UDTs as key planning instruments.
The potential of UDTs has been shown in many cases. In Herrenberg, Germany, UDTs are implemented to explore solutions for traffic congestion and air pollution through holistic integrations (e.g., 3D modeling, spatial syntax, traffic simulation) and real-time data fusion [26]. The Zurich Digital Twin develops a dynamic urban model that employs high-resolution 3D geographic data (including buildings, topography, and underground pipe networks) to support urban planning (such as high-density development and climate simulation), public engagement, and interdisciplinary collaboration, by utilizing Open Government Data and real-time sensor information [27]. Dynamic governance replaces static planning in a digital transformation, which indicates the value of UDTs for supporting participatory processes and improving transparency during spatial governance. Meanwhile, UDTs provided citizens with increased opportunities to engage in the planning process. Through the integration of BIM models, OpenStreetMap (OSM) road networks, and real-time sensor data, a Digital Twin is being introduced in Docklands, Dublin [28], with a Unity3D-based platform. It allows citizens to vote on planning alternatives, add proposed buildings directly, and indicate faults (such as damage to facilities). This transforms the conventional single-direction public announcement into a dynamic and participative loop.
However, current UDTs remain limited by critical research. Most models simulate physical infrastructure while overlooking the immaterial dynamics, like social networks or species immigration [25], especially in informal or marginal contexts [24]. In Porto Alegre, Brazil, the adoption of land use rules in suburban areas reveals that existing frameworks are insufficiently aligned with conservation of biodiversity requirements, showing deficiencies in current approaches of incorporating immaterial ecological dynamics into urban planning [4]. Ravid and Gutman [29] argue that the majority of UDTs are founded on technocratic assumptions that may strengthen existing inequities while neglecting the relational and contentious characteristics of urban space. This biased priority ignores the dynamic relationships of citizens [30], even non-human beings, as agents within the context, and hinders their applicability to urban fabrics characterized by fragmented government, high informality, and significant socio-spatial inequalities [18,25,31,32]. Especially in many areas (like favelas) of the Global South, incomplete data ecosystems and fragmented platform governance make it difficult to deploy UDTs but exacerbate the “data divide” and spatial exclusion [15,30].
Given the constraints of Urban Digital Twins, both technical capabilities and contextual adaptability, it is increasingly acknowledged that UDTs alone are not sufficient for supporting equitable and context-sensitive decision-making. Even if their considerable utility as analytical and visualization tools for the integration of real-time urban data and the enhancement of participatory dialogue [26], their outputs often remain superficial, technocratic, and exclusive—particularly in informal contexts—without a methodology capable of translating data analysis into the structural, systemic and localized attributes of the city [18,29].
This gap of theoretical–practical integration in current frameworks also reveals the potential for the fragmented and dynamic nature of informal settlements. This study takes the Paranoá administrative district as a case study, capturing its spatial structure and ecological complexity to explore the possibility of enabling targeted interventions to be simulated via the UDT model. The result framework is a holistic, multi-scale approach that enables the identification of infrastructural disconnections and multi-system coupling risk, bridging the theory of the Integrated Modification Methodology (IMM) with the digital modeling process.

2. Theoretical Background and Literature Review

2.1. Evolution and Typology of Urban Digital Twins (UDTs)

The concept of Urban Digital Twins has evolved significantly from industrial origins to sophisticated urban applications. In the early 2000s, it originated as a technical term in industrial sectors, defined by Michael Grieves [33], referring to digital representations of physical products to simulate their lifecycle management and performance in real time. Following this point, UDTs have articulated this notion, progressively transitioning from static representations of urban infrastructure to dynamic simulations integrated with real-time data and predictive analytics [34,35].
In the beginning, UDTs were mostly utilized as static visualization tools, mainly supported by Geographic Information Systems (GIS) and Building Information Modeling (BIM). Although these models provided significant visualization of urban structures, these static characteristics are incapable of revealing the hidden properties generated by dynamic and real-time urban movement [24,35,36]. The second phase is marked by an integration of comprehensive data support with real-time feedback facilitated by sensor networks and the Internet of Things (IoT). Real-time monitoring of urban and natural conditions (e.g., traffic and air quality sensors, satellite images, energy use) enhances urban management and operational responsiveness [26]. Caldarelli and Arcaute [25] underscored the importance of using real-time sensor data for dynamic urban modeling, thereby addressing the constraints of conventional static methods. This shift from “physical mirror” to “complex replication” emphasized the value of live data integration, fixing the limitations of conventional static models and facilitating the development of more sophisticated urban analytical frameworks through multi-information layers and complex system theory.
Urban Digital Twins are presently developing towards more advanced predictive and prescriptive analytics. Recent approaches involve artificial intelligence (AI), machine learning (ML), and principles from Complex Adaptive Systems (CAS) theory, allowing both real-time replication and proactive urban scenario modeling. Cities that are considered CAS are characterized by non-linearity, complexity, and dynamic adaptability, as their behavior is emergent rather than predetermined [37,38]. Zadeh [38] argues that learning cities as CAS calls for systemic thinking that urban performance is linked with intricate, adaptive interactions between structural modifications and their environmental, social, and financial consequences. The “CityTime” model, introduced by Politecnico di Milano, advocates context-sensitive and user-centered urban planning [34]. By taking Rio de Janeiro as a case study, this model employs refined GIS analysis to measure the proximity and diversity of urban daily amenities, hence improving the potential of digital twins to democratize and customize urban planning solutions across different morphological and socio-economic urban environments.
While Urban Digital Twins have evolved from static visualizations to data-rich predictive systems, their analytical scope remains on the surface. Most models continue to prioritize modeling the physical spatial element, even in quite a refined resolution, failing to uncover the deeper causality embedded within the urban form. These underlying dynamics—often emergent, nonlinear, and context-sensitive—articulate what remains absent in current dominant digital twins. Addressing this epistemic gap requires a shift toward frameworks that can engage with cities as complex, adaptive, and relational systems.

2.2. Complex Adaptive Systems (CAS) Theory and Urban Dynamics

Cities exhibit the characteristics of Complex Adaptive Systems (CAS): non-linearity, feedback, emergence, and distributed agency. They develop through local negotiations, iterative adaptation, and overlapping rules rather than being designed as fixed and centralized structures. In 1992, Holland [39] proposed the foundational theory of adaptive agents, which further enlightened urban researchers on how urban development is shaped by relational and multi-scalar processes beyond conventional top-down planning [40]. This insight echoes Jane Jacobs’ early argument that the dense, decentralized social interactions form urban safety and cohesion (at the street level), and maintain as a form of distributed intelligence long preceding CAS formalization [15]. This logic is also evident in some villages in Guangzhou (China), where morphological transformation was not guided by land-use plans, but proceeded through informal transactions, tenure ambiguity, and negotiations between villagers, migrants, and developers [41].
The observable features of CAS become even more pronounced in informal urban settlements. In Enugu, Nigeria, it was not technical blueprints that led to the development of fragmented infrastructure, but the feedback from tenants, landlords, and chieftaincies. These arrangements are often employed to accommodate seasonal or political contingencies [15]. This bottom-up feedback makes adaptive spatial outcomes more context-sensitive than formal planning. In Rocinha (Brazil), the built environment develops through gradual adaptation: homes expand toward social anchors, utilities are added informally, and pathways emerge based on proximity rather than being planned [7]. This resonates with Mitchell’s description of emergent order, where simple, local interactions give rise to stable, large-scale patterns without centralized control [42].
The challenge in understanding complex urban environments lies not in lacking data, but rather in failing to capture the invisible relationships shaping spatial performance. Take Rocinha as an example. The way people transport is not determined by road layouts on maps but by accumulated layered decisions, ramp extensions, informal paths, and circulation networks shaped by micro-scale interactions. Similarly, in Enugu’s informal settlements, infrastructure updating like rerouting footpaths or establishing shared water points tends to happen through agreements responding to immediate local negotiation. These crucial dynamics remain hidden in official databases that focus on recording physical structures rather than understanding their functional impacts. Different feedback processes functioning at multi-scales can make the same spatial footprint have very different levels of connectivity, porosity, or proximity. These examples demonstrate the limitations of spatial representations that ignore the causal logic underlying spatial structure, rather than the failure of digital tools in general.
This analytical blind spot hints at the need to shift the logic of modeling from “mapping objects” to “revealing mechanisms”. The CAS theory suggests that systemic behaviors do not originate from isolated elements, but rather from the linkages that arise between patterns, feedback, and boundary conditions. However, most current UDT models view “feedback” as a means of adaptation rather than as a structural generative mechanism. Without the ability to trace the chain of interactions and influences between spatial properties such as proximity, accessibility, porosity, etc., the models end up at the level of observation rather than explanation. To break through this limitation, we need frameworks that can model the logic of spatial relationships themselves.

2.3. The Blind Spot of Digital Twin Modeling in Informal Settlements

The basic prerequisite for Urban Digital Twin systems is the ability to collect, visualize, and simulate the measurable components of the urban system—such as buildings, roads, energy flows, and parcel ownership. This assumption makes sense in formal urban contexts like Milan, Shanghai, and New York, but begins to malfunction in informal contexts, where ownership is ambiguous, boundaries are porous, and infrastructure is adaptive rather than fixed. As highlighted by UN-Habitat [14] and Dovey. K [43], informal settlements function within dynamic systems of partial legality, temporary occupancy, and improvisational service provision. Such areas frequently exhibit intricate networking behaviors—such as collective path-making, rotational use of space, and social infrastructural evolution [44]—yet often lack the spatial codification necessary for interpretation by conventional investigating systems. In cities like Mumbai, Haifa, and Nairobi, residents may live right next to infrastructure but remain excluded from the system due to unclear land rights, unregistered addresses, or inaccessible built forms. Consequently, UDTs designed to represent clear, stable, and object-based urban forms tend to render informal urbanism statistically invisible.
The problem lies not only in technology but conceptualization. Digital Twin frameworks are usually rooted in assumptions of spatial fixity, bounded assets, and measurable infrastructure. These assumptions are inconsistent with the operational dynamics of informal settlements through social bonds, contingent negotiations, and incremental adaptation. Informality should not be treated as disorderliness but as a space with “emergent logic” [15,45], where the status is dynamic, relational, and frequently non-institutional. In such settings, a drainage canal may only form during the flood season, and a section of the walkway may appear only shortly during religious festivals. These non-predictable uses of space cannot be stabilized into raster or vector layers, regardless of current precise imaging technology. UDTs might duplicate the physical configuration of informal areas but are incapable of capturing the underlying logics that make the space operational [29]. What emerges is a disparity between the city as modeled and the city as lived.
Apart from the inability to represent emergent uses, another core limitation of UDTs is the incapacity to interpret the causality between spatial attributes and produced outcomes. Proximity does not imply accessibility, while density does not ensure serviceability. Transport systems, land use patterns, and social interactions rarely align with quantifiable logic according to CAS theory [37]. As Geurs, K.T., and Van Wee emphasized, accessibility is not merely a property of location, but the consequences of the interaction of land use, street network, and mobility capacities [46]. The Spatial Accessibility Poverty (SAP) fails to identify where walking is the dominant mode and infrastructure is mapped as fragmented [5], for example, favelas in Rio de Janeiro. This underfitting amplifies inaccuracies when standardized travel speed, consistent network, or formalized mobility options are assumed. Moreover, land-use changes in these areas tend to be driven by evolving access logic—not planning intent—making transport–land feedback essential for comprehending spatial inequality. To overcome this epistemic gap, what is needed is a modeling paradigm that can interpret structure–performance mismatches and reveal how spatial configurations shape socio-spatial opportunity.

2.4. Integrated Modification Methodology (IMM): A System-Compatible Modeling Framework

The previous sections have outlined how current Urban Digital Twins frameworks are inadequately equipped to support the causal and relational intricacies of informal settlements. Bridging this gap needs more than finer data resolution, but a methodological rethinking of the comprehension, organization, and transformation of urban systems. The Integrated Modification Methodology (IMM) offers such a possibility for the shift. Developed in 2011 at Politecnico di Milano, ABC Department, the Integrated Modification Methodology (IMM) has been applied in several international pilot cases—such as Dakar, Valona, Brasilia, Milan, and Rio de Janeiro—within funded research activities focusing on systemic urban transformation grounded in Complex Adaptive Systems theory, within the research group named IMMdesignlab coordinated by Prof. Massimo Tadi. Instead of a static collection of elements, IMM views the city as a CAS composed of interrelated subsystems rather than isolated properties. These structural relationships determine the performance of cities [40]. Compared with conventional models that concentrate on separate objects, IMM prioritizes synergistic interactions and emergent spatial configurations as the basis for understanding urban performance.
IMM applies this relational logic through the notion of Key Categories (KCs), which refer to spatial structures that emerge from interactions among urban components —volumes, voids, links, and types of uses—rather than from their individual qualities. These include porosity, permeability, proximity, diversity, interface, accessibility, effectiveness, and (green) continuity. Each KC is defined through a specific set of metrics that represent an aspect of system behavior. More significantly, because these KCs are derived from the same set of urban components, they possess latent interconnections that often remain overlooked in traditional urban analysis [47]. IMM uncovers these cross-category relationships and enables planners and decision-makers to understand how modifications in one spatial property— such as permeability—may trigger positive or negative chain effects in others, like accessibility and effectiveness. The use of GIS maps and diagrams to visualize the footprint of each KC allows for a multi-variable diagnosis that takes both spatial configuration and abstract synthesis, which drives urban analysis toward a compositional, comparative, and system-sensitive direction.
IMM differentiates itself not only as a diagnostic framework but as an approach for guiding transformation systemically through human intervention. The process includes four iterative phases: Investigation, Formulation, Modification, and Optimization. Each phase relies on the feedback from the previous steps. In the Formulation phase, one or more KCs are selected as “catalyst (s)”—the critical attribute that triggers the structural failure. In one of the early implementations, Rocinha favela (Rio de Janeiro) was tested. Interface was identified as the most vulnerable KC as the catalyst, based on indicators of fragmented connectivity, dysfunctional urban grain, and restricted access routes. Targeted interventions were organized according to Design Ordering Principles (DOPs) such as “create connected open spaces” and “balance ground use”. These principles forward a series of community-driven spatial strategies [40], indicating measures such as selective relocation, enhanced permeability, and multi-scalar linkages for systemically improving urban performance. Notably, these are rule-based rather than independent technical solutions, aiming to trigger systemic feedback. Thus, IMM empowers decision-makers to operate on the physical configuration and relational architecture of urban systems, and meantime enhances the ability of UDTs to reflect systemic interdependence and adaptive potential across urban systems by providing a conceptual and structural backbone. In the context of informal settlements, characterized by discontinuous spatial patterns, irregular infrastructure, and overlapping socio-ecological dynamics, IMM enables complexity to be decomposed into comparative and system-sensitive layers. This compositional framing allows latent disconnections and relational tensions to be revealed, forming a basis for spatial diagnosis and targeted intervention strategies.

3. Methodology

This research adopts Paranoá as the study area and applies the Integrated Modification Methodology (IMM) as the principal framework to articulate and reconfigure systemic urban complexity. By embedding IMM logic into a data-driven modeling process, this study leverages the Urban Digital Twin as a computational interface for diagnosis, simulation, and strategy design, enabling scenario-based planning and decision-making in the Global South context. Geospatial data were collected from official Brazilian repositories, such as the Federal Government platform. The spatial information was analyzed and processed through key categories—green space diversity, green service diversity and proximity, and green space continuity. The quantified attributes are further synthesized into key performance indicators (KPIs), which serve as the foundation for strategic mapping and urban planning decisions.

3.1. Study Area and Research Scope

Paranoá is located on the eastern edge of Brasília, as an administrative region that exemplifies the challenges of hybrid urbanization in the Global South. It was established originally to accommodate people displaced during the construction of the federal capital. Paranoá has evolved into a territory with social-spatial complexity, showing the mix of formal and informal settlements, fragmented infrastructure, and multi-scalar governance structures. It is adjacent to the central affluent district of Brasília and Lake Paranoá, at the intersection of environmental protection, housing provision, and real estate investment.
The institutional history and urban context of Paranoá reveal structural contradictions that are typically shown in the rapid urbanizing process: inconsistent service delivery, unplanned urban growth, and inadequate facilities, together with growing population density. The district displays an overlapping of planned grid layouts, unregistered neighborhood extensions, and irregular land occupation, which often co-exists with public housing projects and infrastructural voids. This condition is further exacerbated by fragmented jurisdictional authority and limited coordination between federal, district, and local government roles.
The research area is located on the eastern border of the Paranoá administrative district, situated above one of Brasília’s most important aquifer recharge zones. The total area is 20 km2, with 87.5% currently urbanized (including construction, managed green spaces, and brownfields), influencing the city’s long-term freshwater security. Uncontrolled urban expansion has weakened rainwater infiltration capacity and raised flood risk and biodiversity loss. These ecological stresses are further intensified by climate change, including droughts, extreme heat, and low humidity, which Brasília frequently experiences.
The NBSouth project—“Nature-Based Solutions via Retrofitting for Climate Adaptation”—provides a framework for rethinking Paranoá’s urban transformation through ecological and data-driven approaches. Coordinated by Politecnico di Milano, with the support of Polisocial and in collaboration with institutions such as the University of Brasília, NBSouth identifies Paranoá as a testing ground for comprehensive regeneration strategies in the Global South. Within this project, the Integrated Modification Methodology was adopted as a digital diagnostic framework to assess multiple urban dimensions—including socio-ecological conditions such as landscape structure, ecological connectivity, and accessibility to ecosystem services. The analytical results were further developed and synthesized into this paper, which focuses on the urban diagnosis of green space systems and their implications for resilience-oriented planning.
This study takes the Paranoá as a unit of analysis instead of fragmented areas, to incorporate its spatial structure and ecological complexity comprehensively. This holistic, multi-scale approach enables the identification of infrastructural disconnections and multi-system coupling risk through the Integrated Modification Methodology operationalized through an Entity-Relationship (ER) modeling strategy, to pinpoint and simulate the critical intervention through a UDT model for providing a basis for decision-making.

3.2. Methodological Framework: Embedding Digital Twin Modeling Within IMM

Integrated Modification Methodology is taken as the principal framework to articulate and reconfigure systemic urban complexity, presenting an application in the global south contexts. While the methodology itself is not newly developed here, the novelty of this work lies in its use to develop and test a digitalized diagnostic strategy aimed at investigating and transforming informal settlements in support of livability and climate resilience. Rather than viewing Digital Twin technology simply as a visualization tool, this research embeds IMM logic into a data-driven modeling process, where the Digital Twin functions as a computational interface for diagnosis, simulation, and strategy design. This approach represents a significant methodological innovation, extending the potential of IMM for scenario-based planning and decision-making in complex urban environments. The objective is to structure the diagnosis–intervention–simulation loop through spatial relationships, quantifiable indicators, and decision-making logic.
Figure 1 illustrates the methodological framework guiding this research, developed by adapting the IMM model to the urban context of Paranoá. It visualizes the full data flow—from digital spatial mapping using GIS platforms and the calculation of indicators, to the subsequent exploration of intervention pathways. The latter involves the definition of Design Ordering Principles (DOPs) and the selection of Inner and Outer Actions. They are grounded in the long-term theoretical development of the IMM framework (see Appendix A for the complete list), while the associated actions are identified through a review of relevant literature and projects. The methodological framework of IMM is organized into three interactive phases, shown as a continuous loop of data-driven transformation. The core sequence is composed of the following:
  • Urban Diagnosis, involving spatial data preparation for mapping and computing morphological structures through the GIS platform;
  • Design Optioneering, identifying catalyst(s) through Key Categories (KCs), and building causality networks based on Design Ordering Principles (DOPs) for activating Inner/Outer Actions;
  • Strategic Mapping, in which master planning outputs and descriptive strategies are finalized and interactively tested/refined by UDT simulation.
The diagnosis phase starts with assembling a set of geospatial and administrative datasets. These include voids, volumes, types of uses, administrative boundaries, and so on. In this case study, the data were supported and sourced from official Brazilian repositories, including the Federal Government Site, Secretaria de Desenvolvimento Urbano e Habitação (SEDUH), and Sistema Distrital de Informações Ambientais(SISDIA). The population data are collected from the Humanitarian Data Exchange (HDX). These datasets were further classified and calculated into spatial indicators such as tree canopy coverage, housing density, public transportation capacity, and so on. Meanwhile, specific Key Categories were mapped and quantified. Since this research aims to improve the environmental performance of Paranoá, the Key Categories of Green Space Diversity, Green Service Diversity and Proximity, and Green Continuity are highlighted, compared with other KCs in IMM, like accessibility, effectiveness, or interface. The KCs and Indicators are summarized using QGIS and normalized to enable comparison across layers and zones. The flexibility of the IMM categorization allows it to adapt to heterogeneous data availability and diverse urban layers in the Global South territories.
When the weak-structured category named catalyst is identified, the framework invokes the corresponding Design Ordering Principle (DOP) to provide synthetic guidelines for design interventions. The DOPs are linked with each other through Actions and create a relational intervention network. The actions directly associated with the selected DOP are considered Inner Actions, while those derived from structural or functionally linked DOPs are called Outer Actions. This network is generated based on Actions’ coordinated influences on a shared urban layer or goal, such as ecological connectivity or accessibility. These interdependent actions are visualized as nodes within a causality network, through which the DT can simulate the configuration and its systemic impacts.
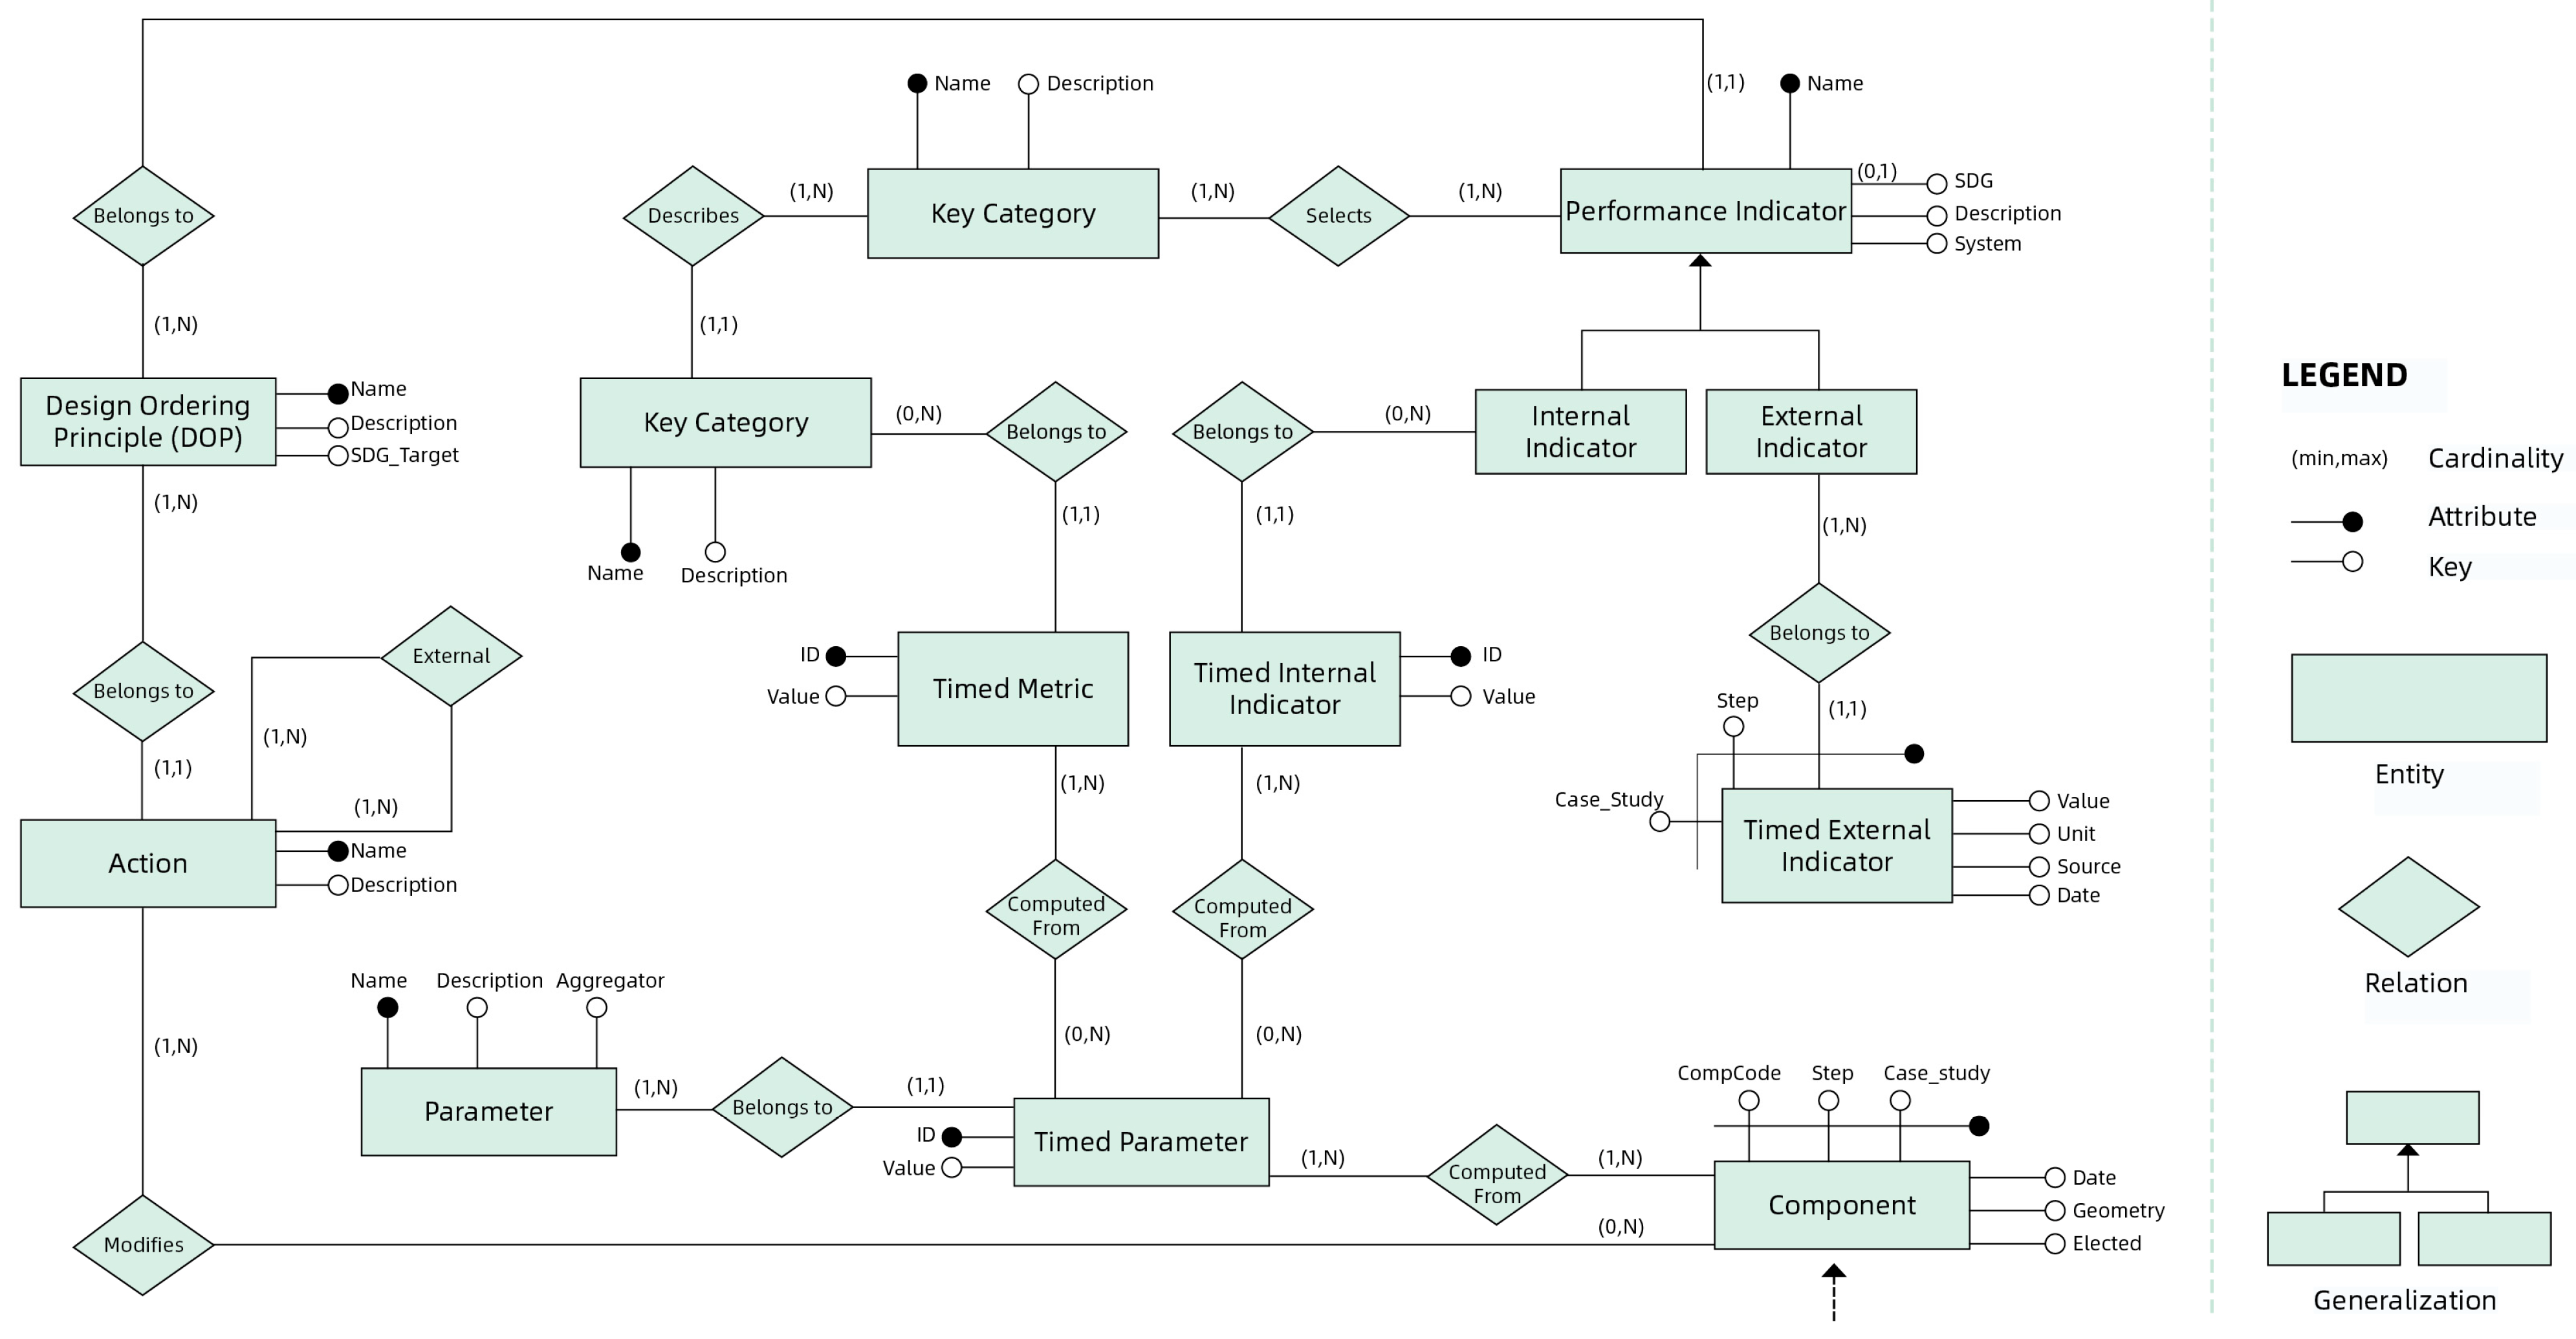
To support the IMM-Digital Twin integration, the relationships among KCs, Indicators, DOPs, and Actions are formalized through an Entity-Relationship (ER) model, shown in Figure 2, which works as the backbone of the data architecture. Each KC owns one or more performance indicators that are generated from input spatial attributes, time-stamped metrics, and other modifiable parameters. The model supports the operational encoding of intervention logic: DOPs point out Actions, which modify Parameters and ultimately influence Indicators. These connections are embedded in temporal structures, making feedback loops possible by timed metrics and components.
Figure 2 presents the most updated version of the IMM schema, redesigned by the authors based on the latest conceptual models developed by the IMM research team. It includes full support for time-sensitive evaluation, relational networking across DOPs, and linkages to geospatial components. It supports real-time UDT integration and enables performance-based urban scenario testing in the Global South context. This relational logic is not only technically robust but also allows planners to navigate between abstract design principles and localized urban realities.

3.3. Operationalizing Data for Urban Diagnosis

After following the methodological framework presented in the last section, this section outlines how IMM-UDT operates to analyze spatial performance and extract strategic intervention logic. The process begins with urban diagnosis, identifying underperforming urban layers based on quantifiable indicators and maps, and continues through optioneering and strategic mapping by working on relevant urban components (volume, voids, and so on).
As presented in Section 3.2, the resource data come from official repositories. In this research, the GIS data of Paranoá is collected and categorized into volumes, “type of uses”, and links (from Federal Government Site, SEDUH), voids including land use (from SISDIA), and administrative information (from HDX). These data are used as input for the Key Categories analysis. The diagnostic analysis is conducted through the QGIS platform, with some parametric sections supported by Rhino and Grasshopper. The geospatial datasets are layered and translated into performance indicators aligned with IMM Key Categories. In the case of Paranoá, the categories of green space diversity, green service diversity/proximity, and green (ecological) continuity were prioritized and deeply mapped, given their relevance to urban resilience and environmental equity through 30 by 30 m sampling grids.

3.3.1. Diversity

To refine mapping diversity, Alpha and Beta diversity indices are introduced to describe the variation of sampling grids. Alpha Diversity (Simpson’s Index), developed by E.H. Simpson [48], was originally designed to assess species richness at a given location and has also been applied to the evaluation of urban services, building typologies, and administrative characteristics in both urban and landscape contexts. The diversity index for the nine kinds of green areas in Paranoá (Street Green Space, Gardens, Urban Parks, Cultivated lands, Urban Forest, Reforestation, Savanna, Residual Green Space, and Water Element) is computed through the following Equation (1):
D   =   1     n i N 2
D represents the Simpson’s Index (SI), n i is the area of each green resource accessible, and N indicates the total green space area within each 10 min isochrone. The value of SI ranges from 0 and 1, which could be understood as follows: low values mean a balanced area proportion among the types of green spaces, while higher values signify the dominance of particular space types over others.
Since SI is used to quantify the “within-sample diversity”, to avoid the deceptive “balance”, Beta Diversity is introduced to assess the similarity between different samples. It is often referred to as the “Similarity Index”. Whittaker first defined it in 1960 as “the magnitude of compositional variation of communities associated with complex environmental gradients or patterns [34].” The Euclidean metric (Equation (2)) is often utilized to quantify the similarity of chosen samples to a specified study case.
D B x , x r e f = i = 1 n x i x i r e f 2
where D B x , x r e f stands for the beta diversity (similarity) of x to x r e f , x i is the value of items in the i t h category for the chosen case, and x i r e f is the value of items in the i t h category for the reference case.

3.3.2. Proximity

As an attribute describing the possibility of reaching adjacent resources, green spaces are mapped as service destinations for citizens. A 10 min walking isochrone is generated for each sampling grid using the QGIS network analysis tool. By comparing actual distances to the isochrone radius, the estimated walking time from each grid to the nearest green space is calculated—this value is referred to as City Time [34].
The Gini Coefficient is then used to evaluate the inequalities of distribution of green areas, based on the resident population in Paranoá. The use of this method for the measurement of economic inequality was advocated by Atkinson [49] and Sen [50], and after that, it has been receiving continuous attention. The Gini Coefficient represents concentration on the (0,1) scale and is invariant concerning the population and the Pigou–Dalton transfer principle, but it is not translation invariant [51]. The Lorenz curve shows the cumulative distribution of resources, for example, the green space, among the population. A greater deviation with respect to the diagonal increases inequality. The Gini Coefficient measures this inequality from 0 (perfect equality) to 1 (total inequality), usually considering that the values above 0.4 point to great inequality.

3.3.3. Green Continuity

The simulation of Green Continuity focuses on integrating green-blue infrastructures (core areas, ecological corridors, and restoration nodes) into a systemic network that supports biodiversity, climate adaptation, and urban resilience. The simulation model used in this study was developed based on the Physarealm plugin for Rhino Grasshopper. It pre-processes the geometry of urban components in the input layers (volumes and voids) in QGIS and samples the attributes of urban green spaces through 30 by 30 m grids. The Physarealm consists of modules of Emitter, Food, Environment, and the central processing core.
Agent points move from Emitter to green spaces (Food) across Obstacles (Environment), with a maximum travel radius of 500 m for general urban pollinators [52] like bees or birds (Formula (3)); movements exceeding this limit are excluded. Since Physarealm is a dynamic simulation, once the agents’ movement stabilizes, time slices can be taken for further analysis of the movement network and location.
i = 1 n R i A R r a d i u s

3.3.4. Indicator

To provide supplementary insights into the general performance of the study area, all indicator values were normalized based on two scales—block and district—taking into account varying patterns of vulnerability across neighborhoods. The indicators were then categorized into three thematic groups aligned with the structural layers of analysis: (1) Spatial Morphology and Use Diversity at the block scale; (2) Green Infrastructure and Ecological Performance at the district scale; and (3) Mobility and Access Infrastructure at the district scale. This categorization supports cross-scalar comparisons and forms the analytical basis for the subsequent diagnosis and strategic mapping. The indicator system is informed by a synthesis of the relevant literature and planning standards, selected to enhance contextual understanding of spatial, ecological, and mobility-related vulnerabilities.

3.4. From Diagnosis to Strategic Mapping

Once the weakest property is spatially identified, the corresponding Key Category is selected as a catalyst for focused analysis, serving as the entry point for the overall intervention process. Because urban performance stems from physical morphology, interventions should operate on spatial components to indirectly reshape performance outcomes. In order to choose the proper components, the Design Ordering Principle (DOP) is activated, which triggers Actions to tackle corresponding urban elements. The DOPs are synthesized from the literature and project reviews encompassing diverse aspects of urban intervention, ranging from volume modification, mobility optimization, to waste and water management, and so on (see Appendix A for the full list). Inner Actions refer to interventions directly associated with the selected DOP, while Outer Actions are derived from structurally or functionally related DOPs that support or complement the primary intervention strategy [47]. In the case of Paranoá, “DOP 5: Create a connected open space system” was activated, with Green Continuity selected as the catalyst. The Inner and Outer Actions of DOP 5 weaved an intervention network based on shared influence over urban green spaces and ecosystem services. This network supports scenario generation and informs the selection of design options to be tested through the next step—Design Optioneering through Digital Twin simulation.
The pre-simulation process is conducted based on identified and assembled Actions. Based on alternative combinations of Actions tested in QGIS and Grasshopper, the updated catalyst is mapped and time-marked for comparing the effects of interventions. Meanwhile, the other Key Categories are mapped as the consequences of the catalyst’s variation. Leveraging the real-time responsiveness of the Urban DT and systemic networking embedded in the IMM ER model, this process enables cross-layer monitoring of how each option influences the whole urban system through the catalyst. The indicators can be calculated at the same time to better explain the trade-off quantitatively. This provides a dynamic base for choosing the most context-appropriate combination among all strategies.
As a result of the simulation through UDT by the IMM framework, the strategic map summarizes these design options into design guidelines and outlines the most critical zones for thematic priorities, like green linking enhancement, service redistribution, and public transportation integration. This map is not a static plan but can be continuously adjusted through iterative feedback in the UDT environment.

4. Results—Case Study of IMM-UDT Implementation in Paranoá, Brasília

This section shows the results obtained from the application of the IMM with UDT modeling for the case of Paranoá, an informal urban district in Brasília. It follows the methodology presented in Section 3 and translates the diagnosis into strategic output.

4.1. Vulnerability Identified Through Urban Diagnosis

The Paranoá site is sampled using 30 by 30 m grids for refined mapping of the Key Categories. To preserve the continuity of the urban context, surrounding volumes, voids, and links are retained in the diagnosis. The diagnosis is structured into two analytical dimensions: human-scaled and non-human-scaled perspectives, corresponding to green service analysis and green space analysis. The human-scaled analysis summarizes urban green spaces as service providers for citizens and defines their spatial catchment based on the 15 min neighborhood concept through isochrone simulation, which reflects the daily activity radius of urban residents. In contrast, the non-human-scaled analysis adopts the ecological behavior of key urban pollinators such as birds and bees, taking their ecological catchment as the measurement unit. While the human-oriented analysis focuses on Key Categories of Urban (Green Service) Diversity and Urban (Green Service) Proximity, the non-human-scaled analysis works on Green Space Diversity and Green Space Continuity.
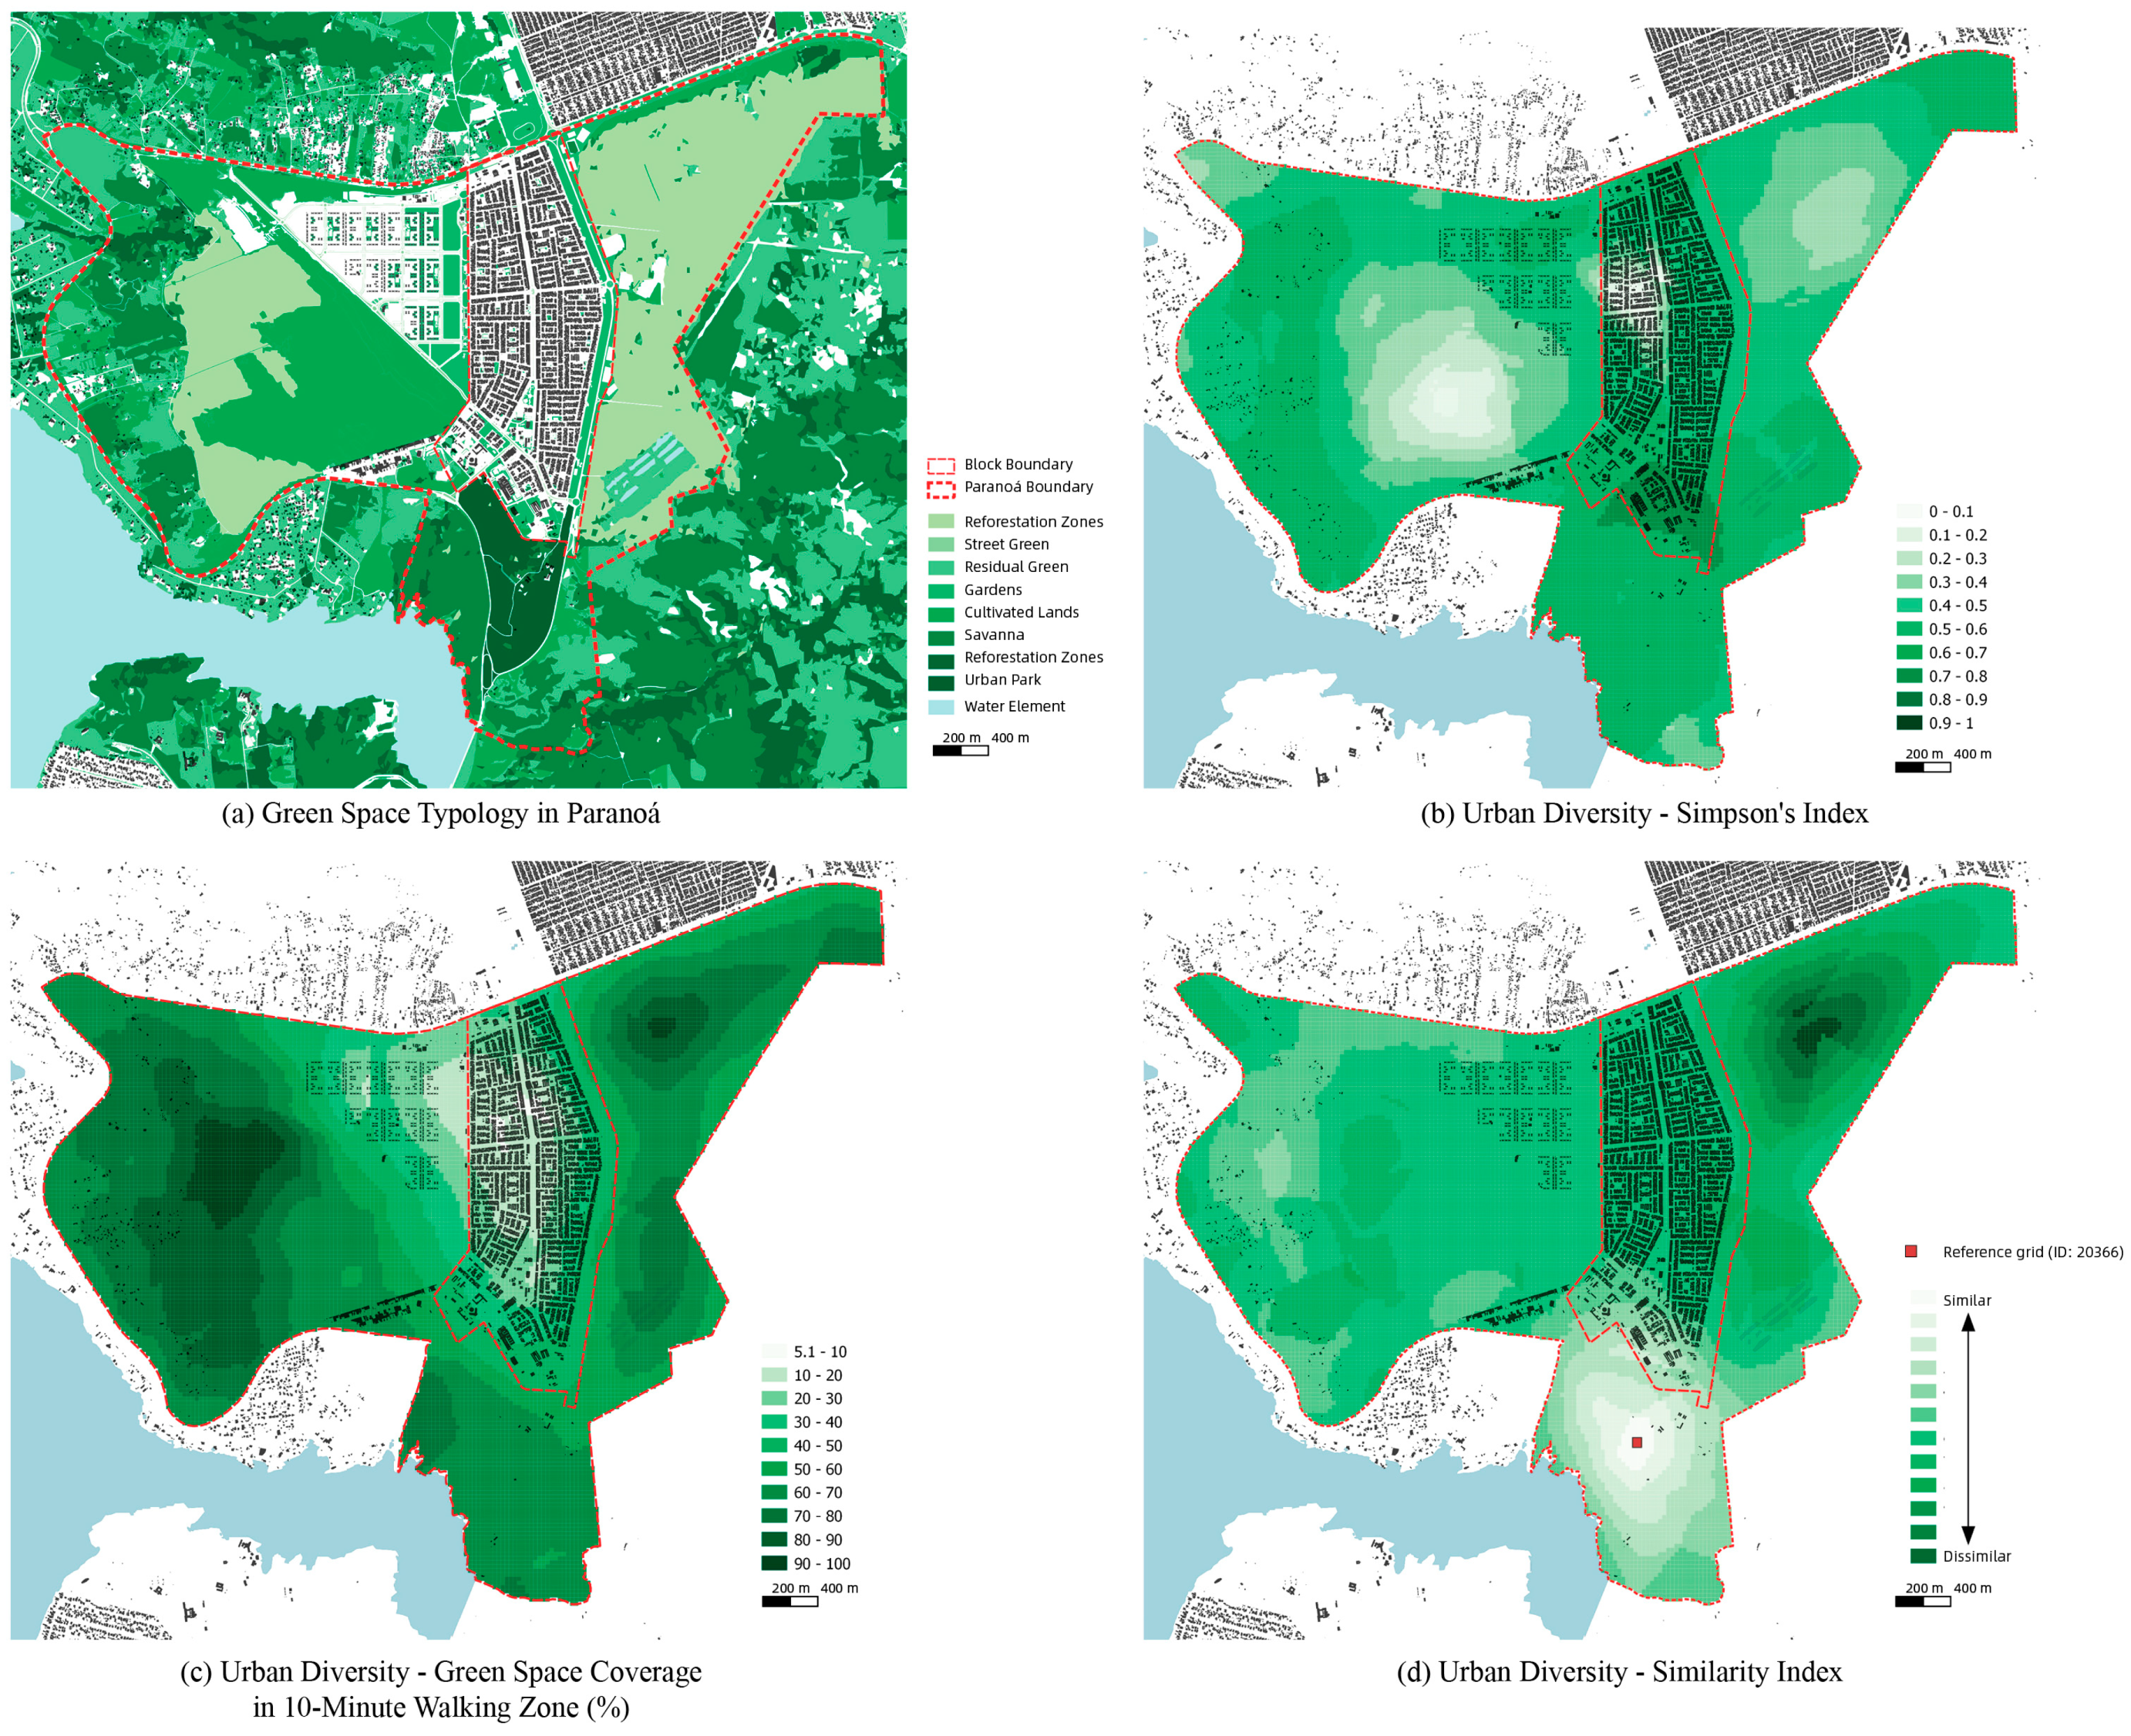
To refine map Key Categories, urban green spaces (including water resources) are classified into nine types based on their vegetation characteristics and functional roles: Street Green Spaces, Gardens, Urban Parks, Cultivated Lands, Urban Forests, Reforestation Zones, Savanna (mixed woodland–grassland), Residual Green Space, and Water Element, as shown in Figure 3a.
Figure 3b–d present the Urban Service Diversity, including Alpha and Beta diversity indices mapped by QGIS. As introduced in Section 3, Urban Diversity and Urban Proximity to natural services are assessed at the scale of residents, so the concept of the 15 min city is introduced. Given the scale of Paranoá, 10 min isochrones by walking were generated for each sample grid using the QGIS network analysis tool. Based on these isochrones, the number and area of natural services within each isochrone were calculated. Due to the heterogeneity of green spaces, the natural services accessible by each sample grid vary. The areas of different green spaces within the 10 min walking range surrounding each grid were used for the calculation of the Simpson’s Index. The comparison of these results reveals the inequality and discontinuity in citizens’ access to ecosystem services within the research area, providing a reference basis for subsequent interventions aimed at improving the living environment and service provision across different urban zones.
Although Paranoá possesses rich green resources, the distribution is highly uneven. And the constructed zones contain limited green spaces and behave as barriers separating the cultivated lands from the east and west sides. Even if reforestation strategies have been in progress in recent years, the impact on improving the environmental quality within residential blocks remains limited.
It is worth noting that the SI values in Figure 3b reveal two low-extremity zones. The first appears in the city center, with values ranging from 0 to 0.2. This apparent “balance” results from the lack of green space distribution—when only a few green spaces are accessible, such low values can generate a misleading sense of balance. The second case is located on the western side of Paranoá, near the waterfront, also ranging from 0 to 0.2. As shown in the typology map in Figure 3a, this area functions solely as cultivated land in terms of land use. This kind of single-function land use can also lead to a deceptive “balance.”
In Figure 3d, the Urban Park zone within the Paranoá residential blocks shows the highest Beta diversity, reflecting balanced accessibility to various green space types. In contrast, the reforestation zone in the north-east corner of the city center shows the lowest similarity, primarily due to its considerable distance from the waterfront and the limited green space types.
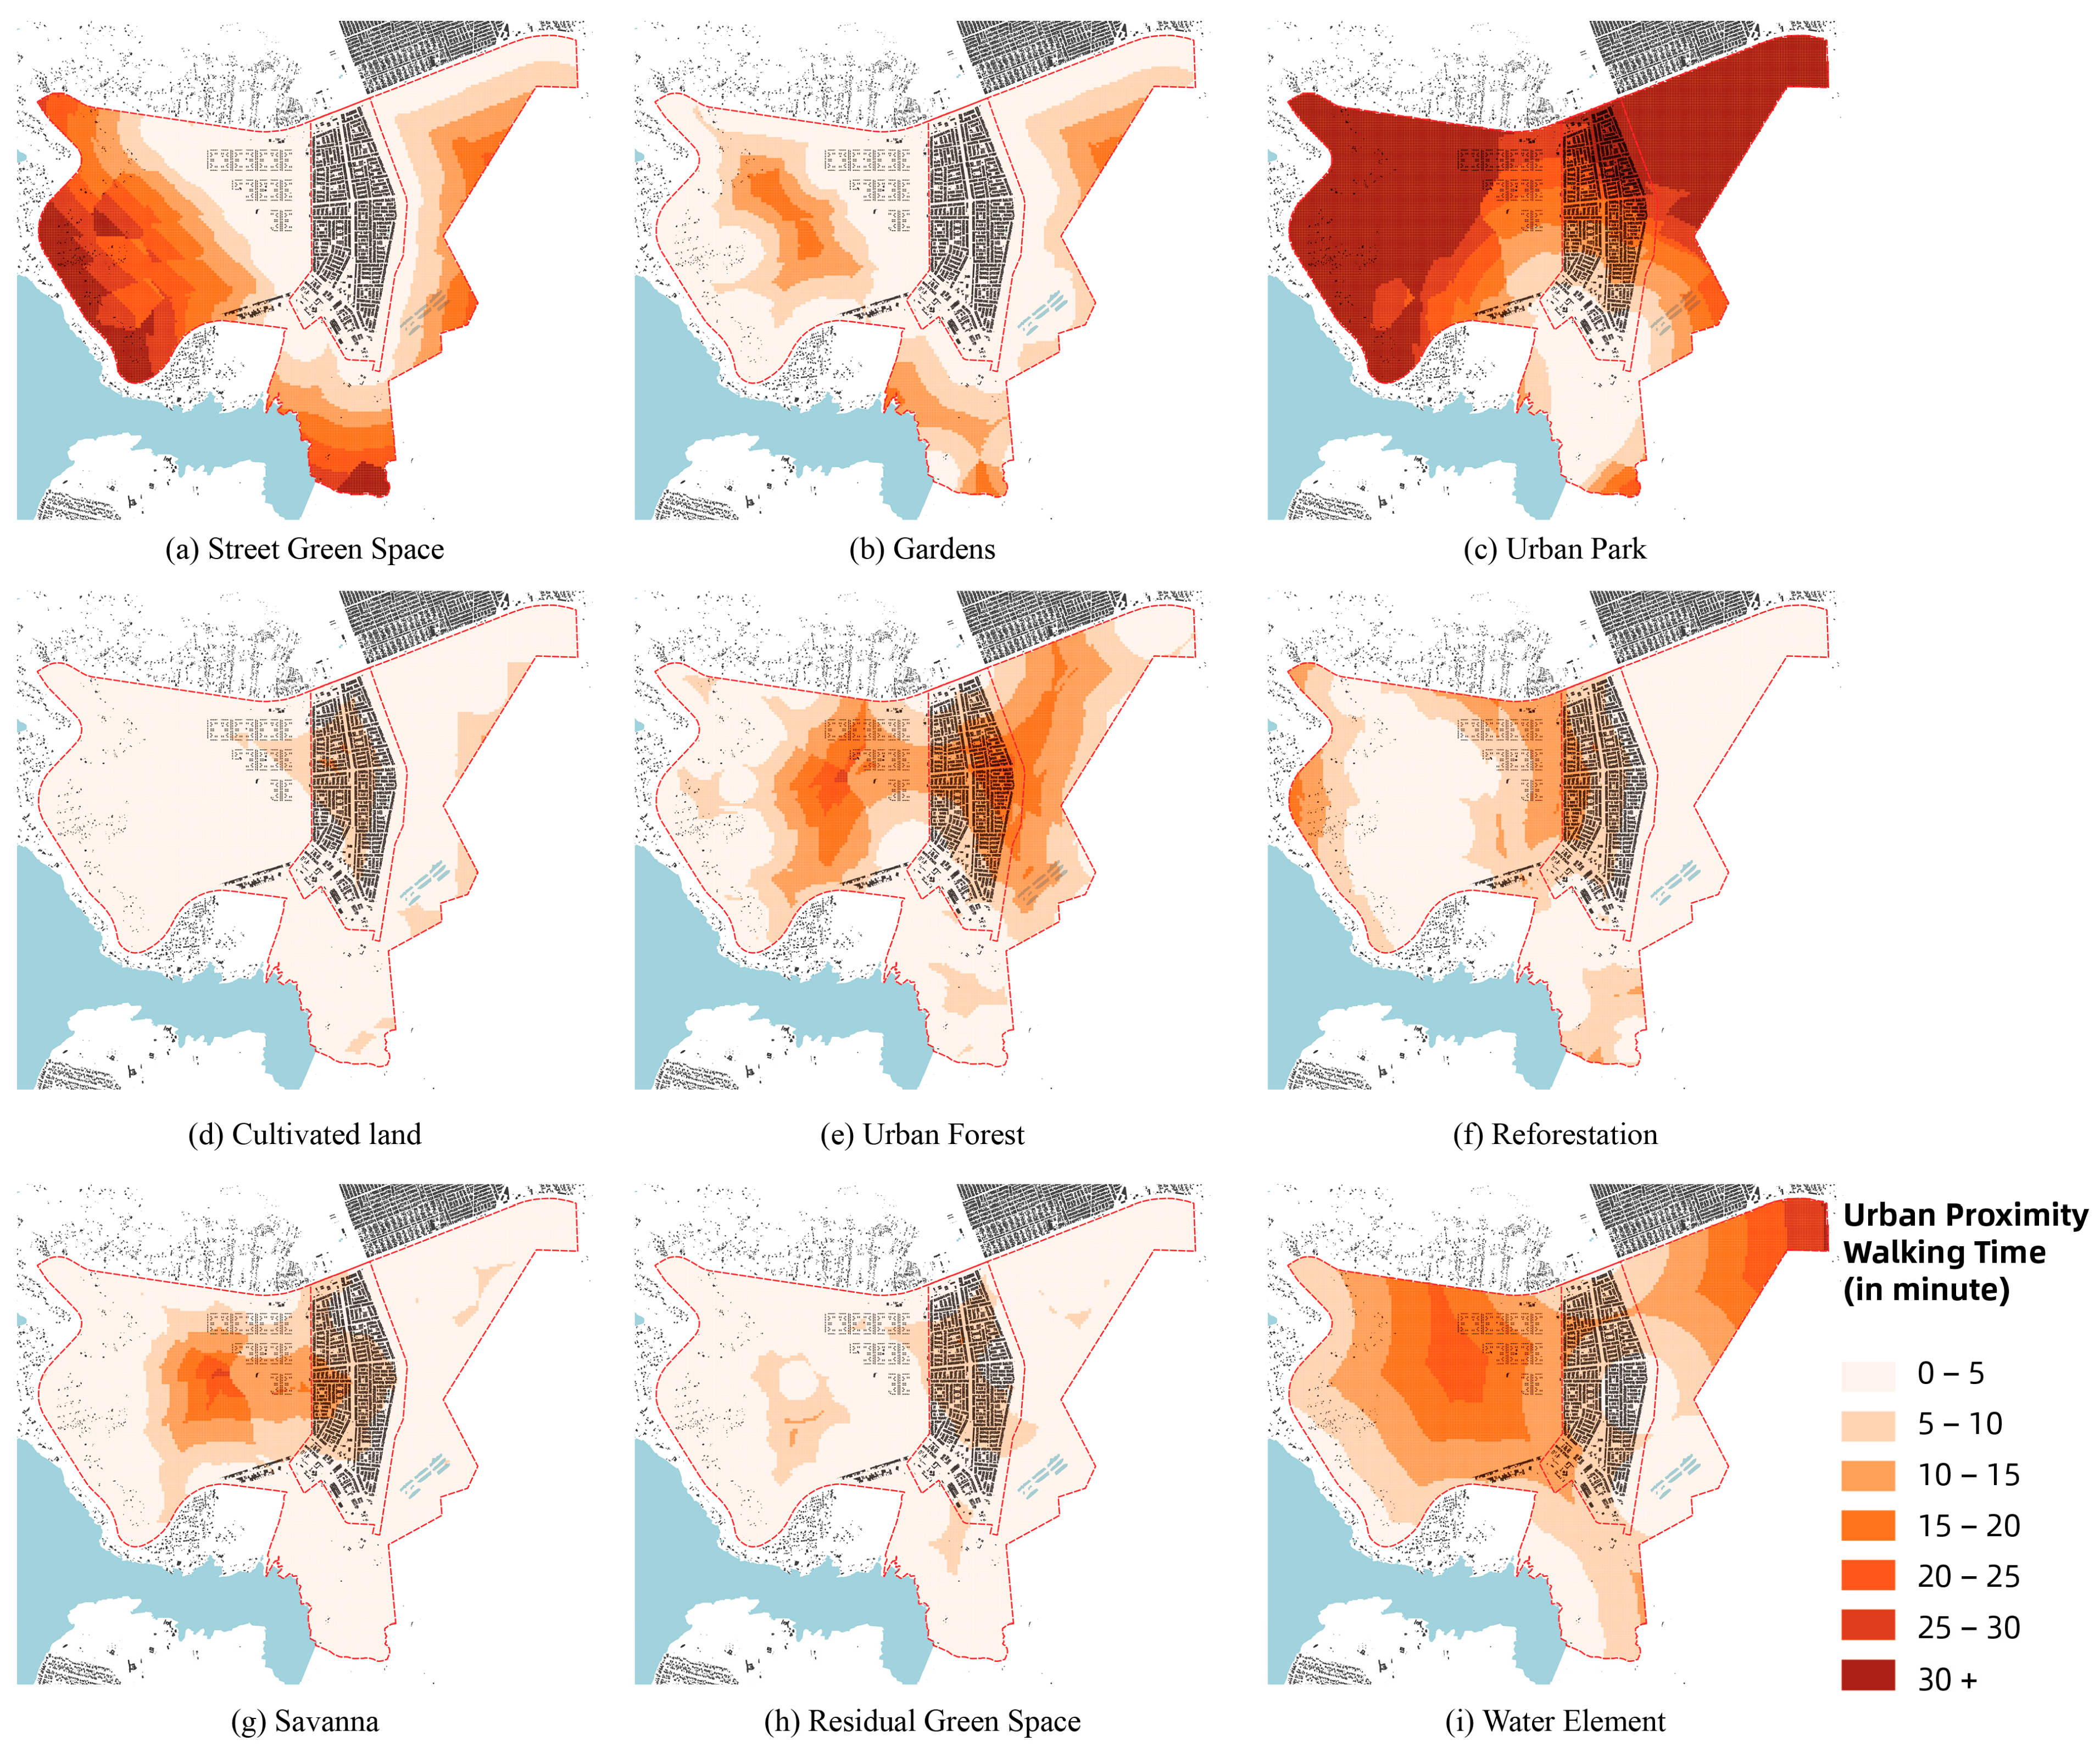
Figure 4 indicates that the distribution of green space accessibility in Paranoá is generally unequal, particularly in relation to key green services such as urban parks, gardens, and urban forests. The presence of water bodies further contributes to the spatial unevenness of the urban context.
Urban Proximity is another measure of green space service capacity. The radius of isochrones generated from QGIS represents the 10 min walking distance, which is converted into context-specific walking speed for each grid through the detour factor—the ratio between the estimated (reported or network-derived) distance and the reference linear distance [53]. Based on the walking time simulation, Figure 5 illustrates the time required to reach different types of green spaces from sampling points. Unlike diversity, which describes the overall green space condition (quality) surrounding each sampling point, proximity refers to the distance—measured in time—to specific types of green spaces (quantity). This distinction helps to understand the demand for different types of ecosystem services in each area and supports efforts to improve green space accessibility and configuration.
In the urban center of Paranoá, most urban green spaces are within a 20 min walking distance. However, Figure 5c highlights the scarcity of urban parks. Although gardens exist within constructed zones, differences in land ownership mean that not all of them are accessible to the community, further underscoring the lack of public urban parks. Urban forests and reforestation areas also show discontinuous proximity, especially in the central part of Paranoá. The Water Element is absent in residential blocks.
Similar in method to Urban Diversity, Green Space Diversity shifts the focus to non-human perception, particularly the diversity of natural habitats. Instead of using a 10 min walking isochrone, a 500 m circular catchment is applied, which better reflects how pollinators move [54,55]—not along streets, but across patches of vegetation based on plant density and ecological quality. This creates an “invisible network” of ecological continuity, which is rarely captured through human-centered spatial models. In IMM, this pattern is formalized as the Key Category called Green (Space) Continuity. Figure 6 and Figure 7 present the Green Space Diversity and Continuity, respectively. By using green space quality as an indicator of non-human habitat conditions, the analysis incorporates ecological equity and highlights the spatial needs of non-human species within urban environments.
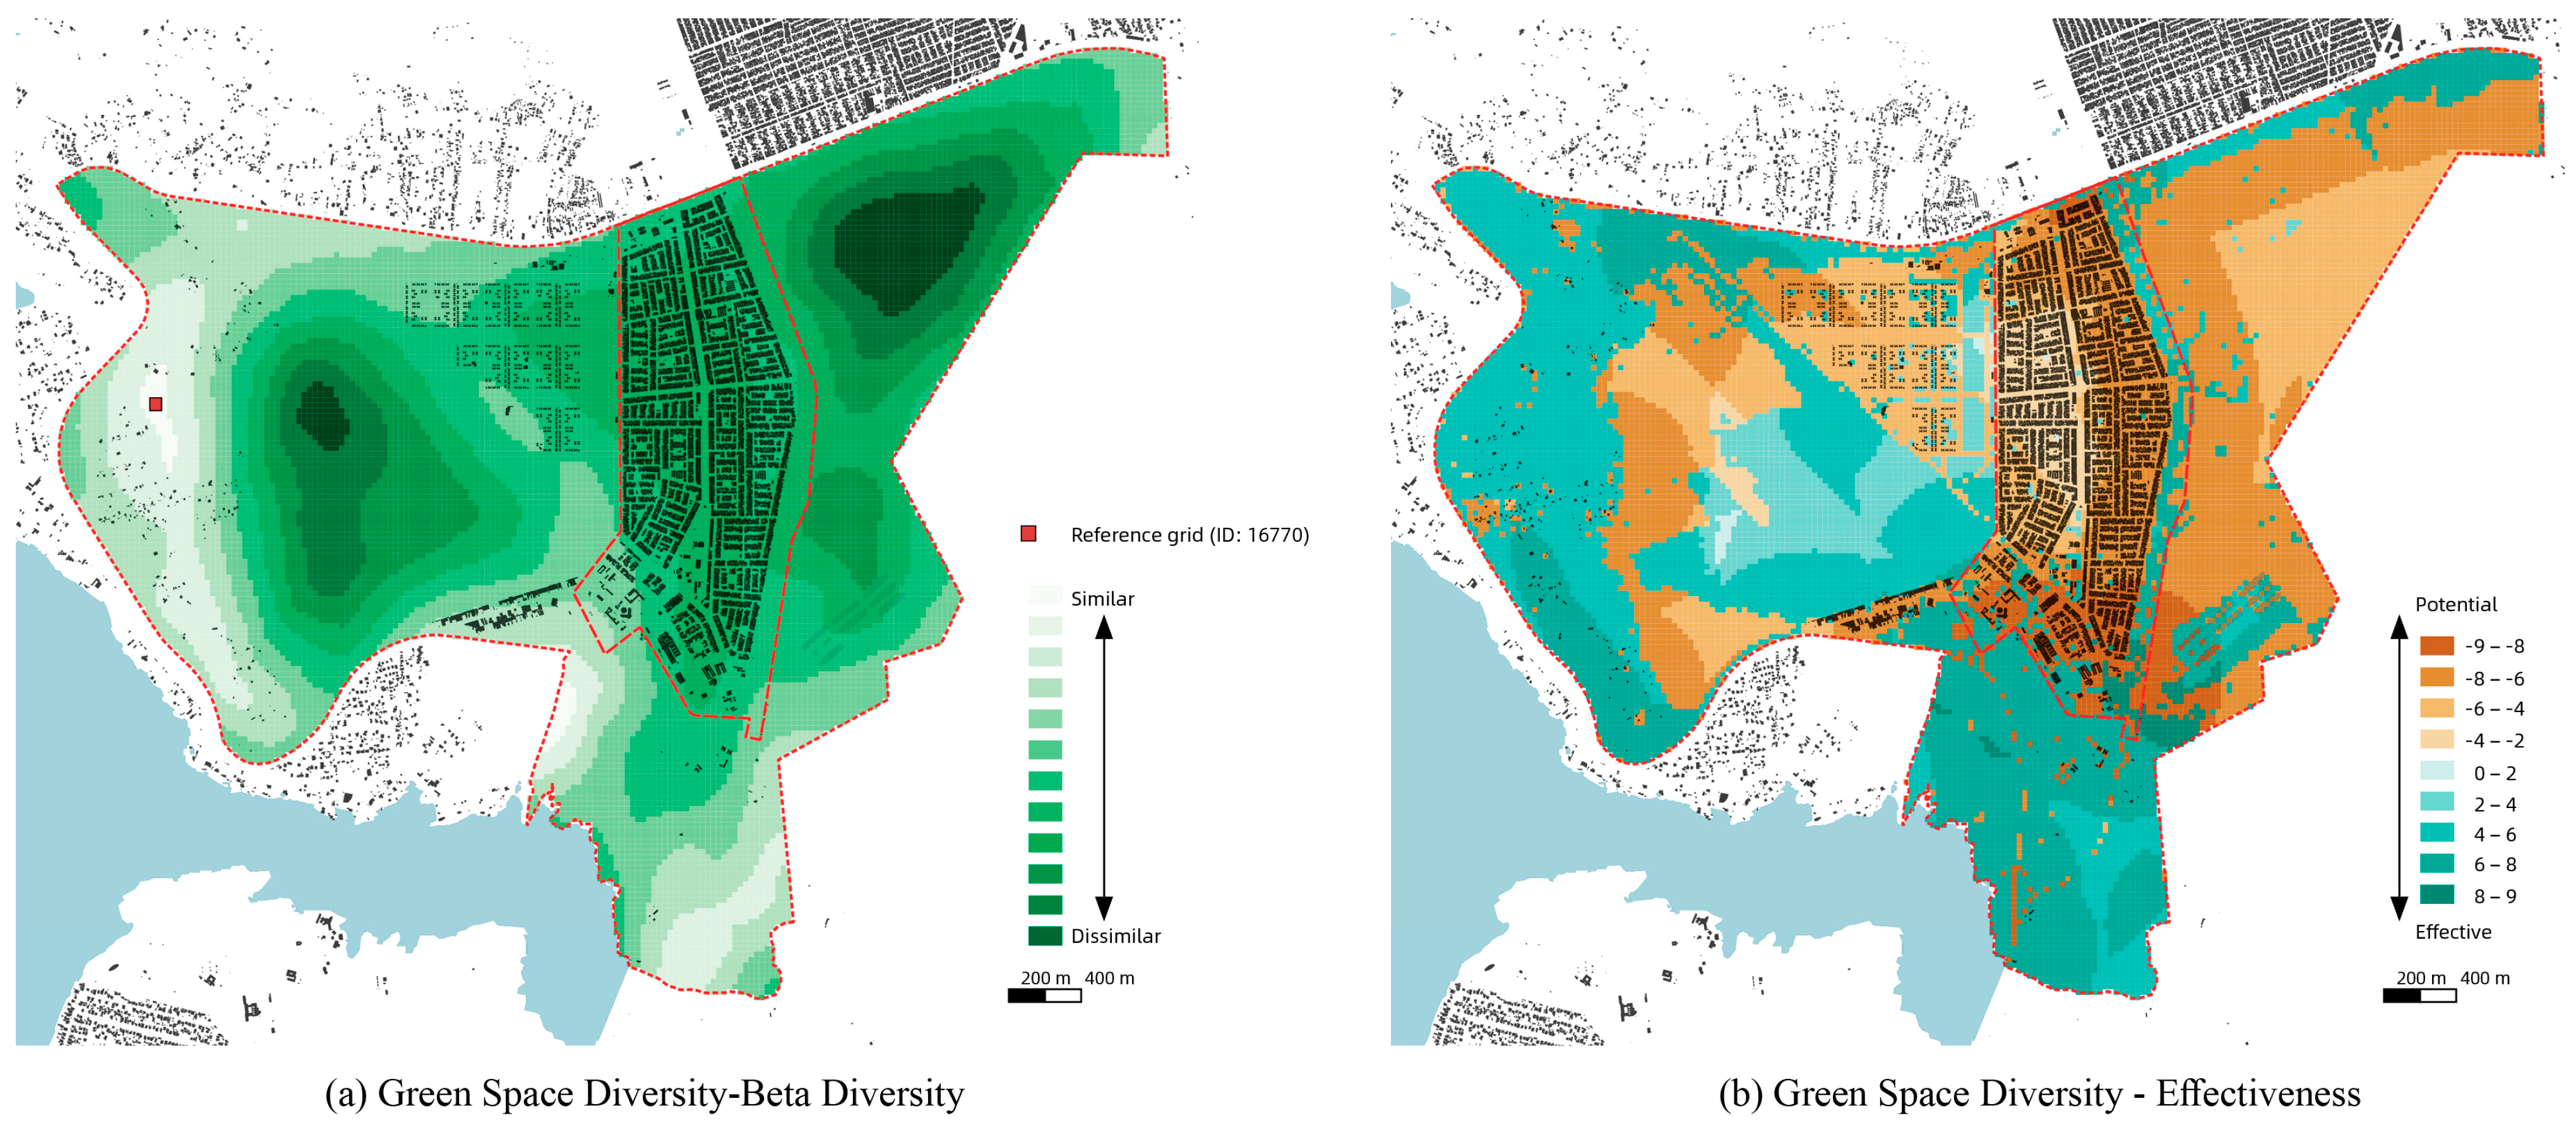
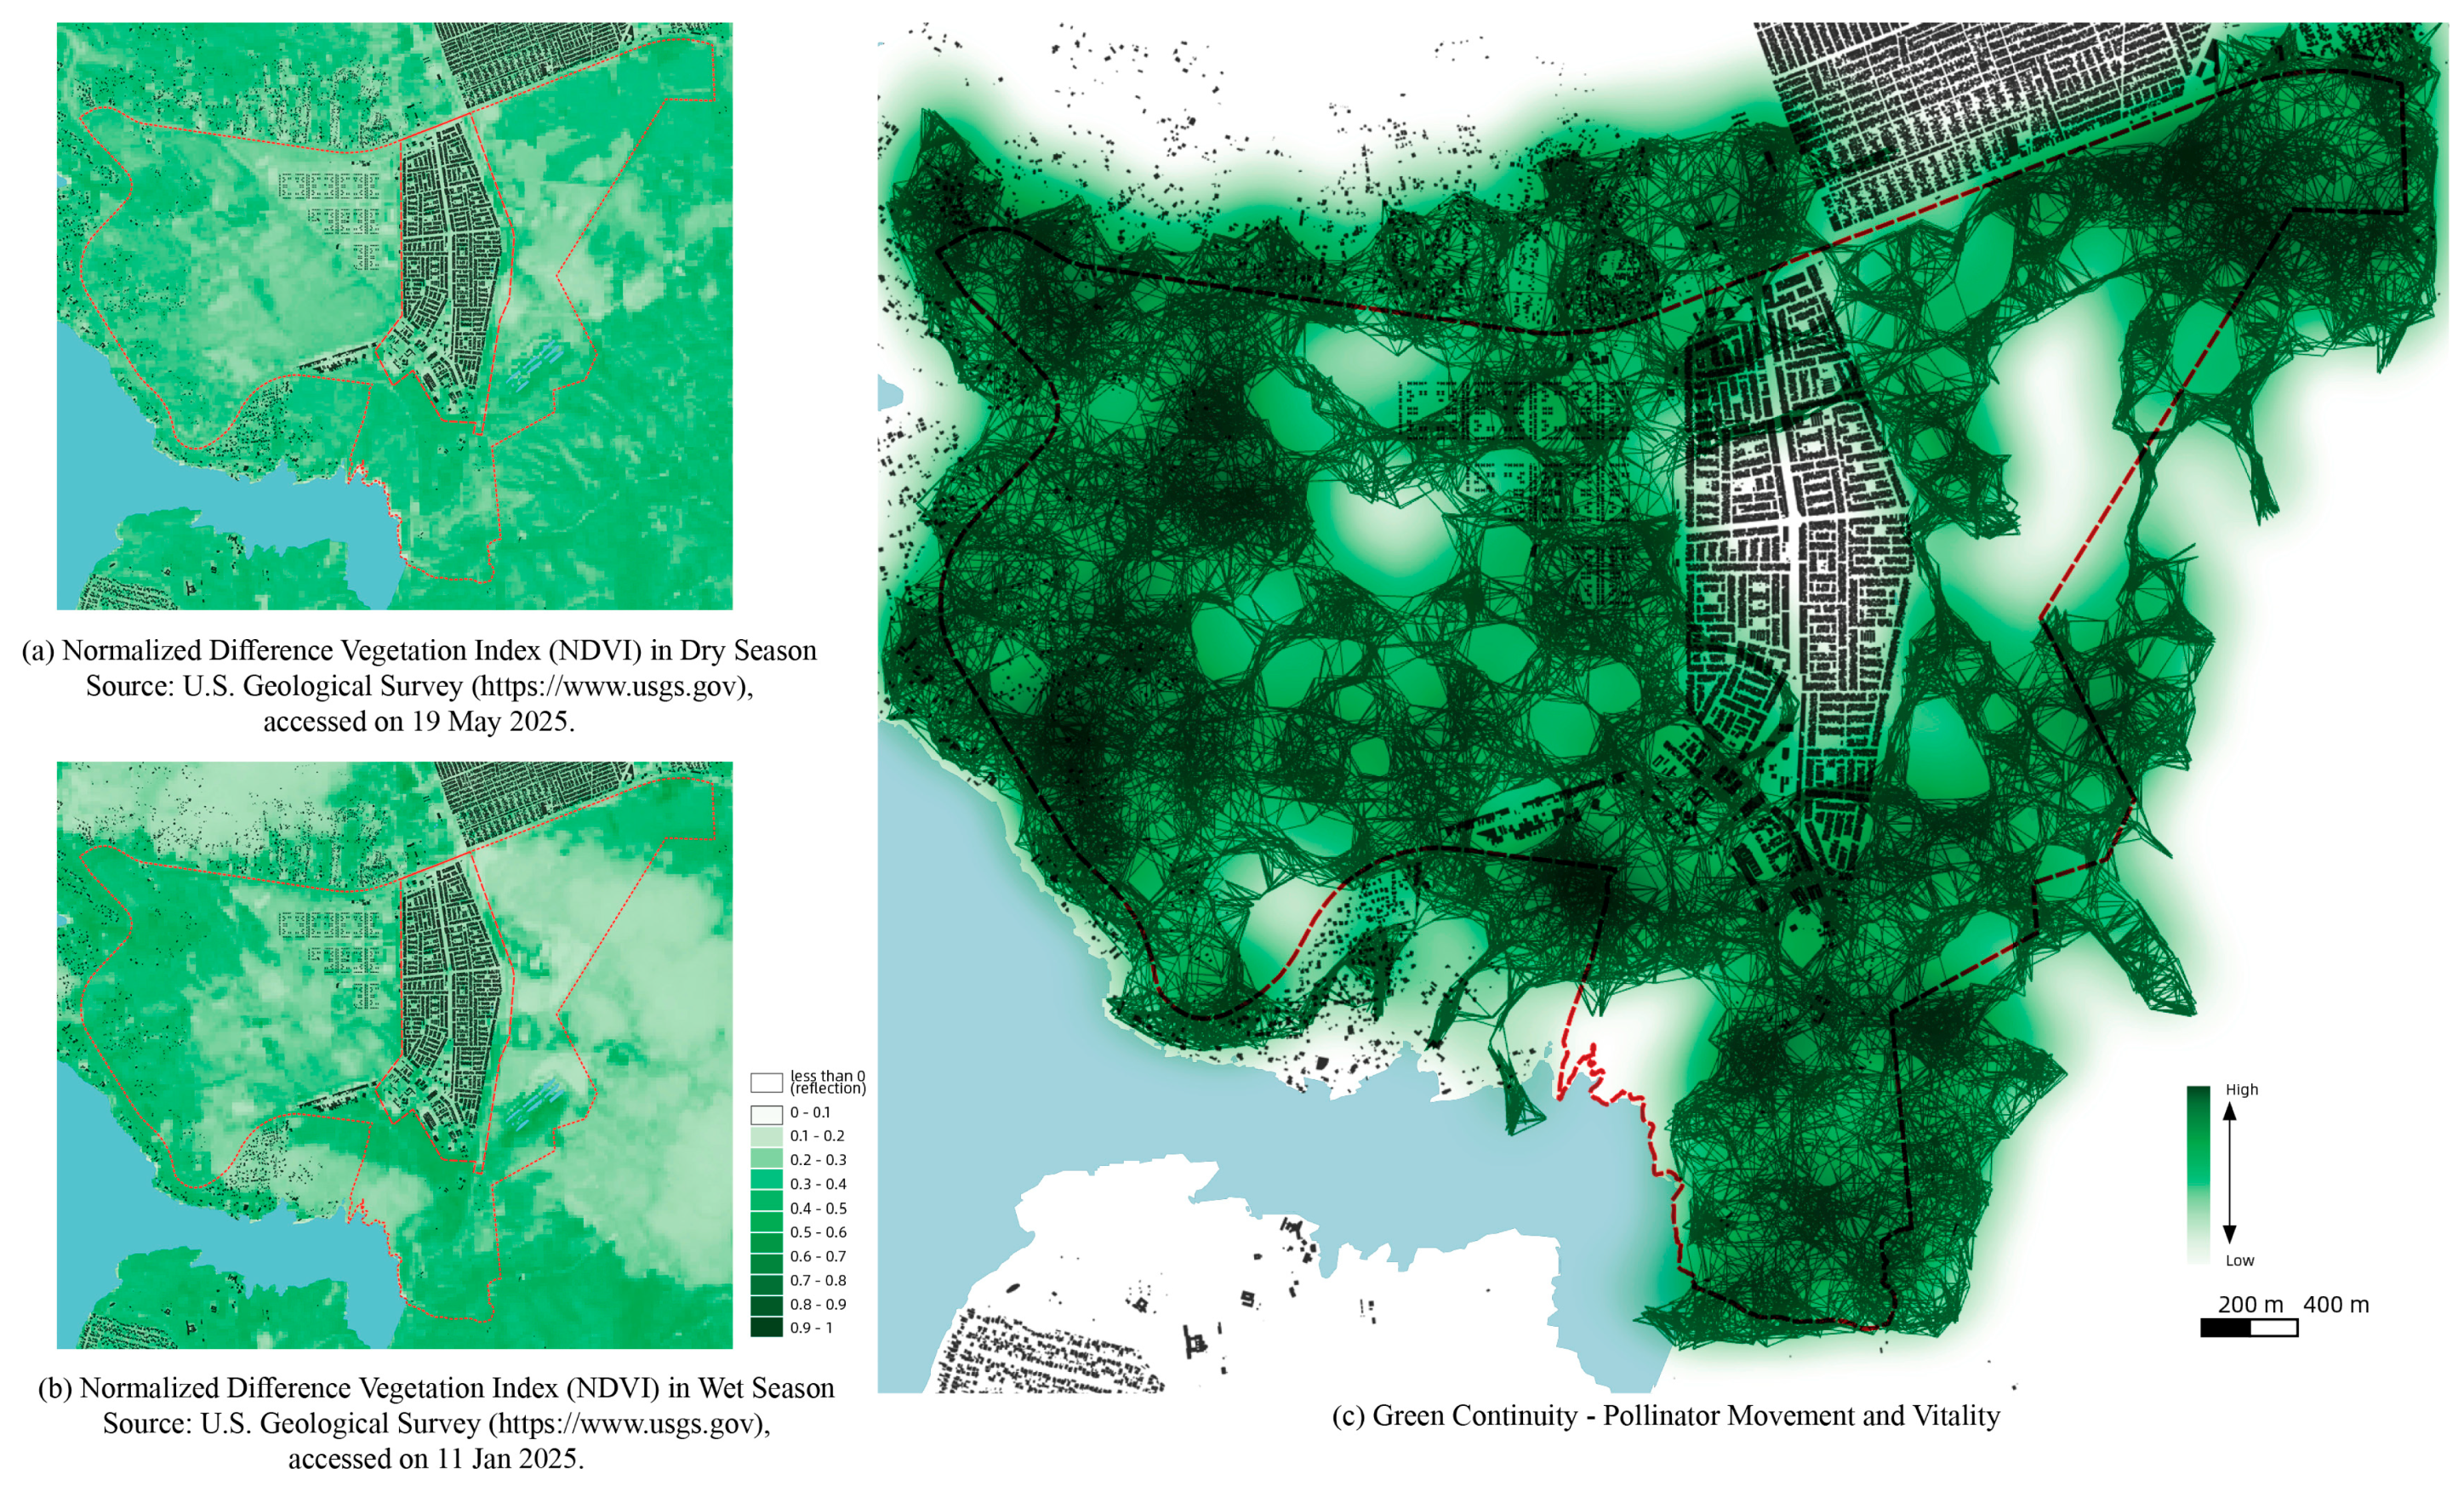
In the analysis of Green Diversity Figure 6, the areas near the waterfront are selected as the reference due to their high homogeneity regarding different types of ecosystems. Grid ID: 16770 is the locally most balanced case, with approximately 1 km2 of green space within the 500 m catchment, including all types of green space, as seen in Figure 6a. In this area, Forest, Cultivated Land, and Savanna dominate by area share, and their adjacency to water elements further enhances habitat suitability for biological activity. This grid was used as a baseline and compared with other sampling grids, measured using Euclidean distance. The results are summarized as Beta Diversity. In Figure 6a, grids that are more similar to Grid 16770 are shown in lighter green, indicating higher spatial similarity. This tendency is also visible in Green Continuity (Figure 7c). Although the reforestation zone in the northeast corner features a more monofunctional green resource, it demonstrates high pollinator vitality due to its dense vegetation and relatively high Normalized Difference Vegetation Index (NDVI).
Figure 6b extends the scope by showing areas with potential for improving green diversity. Zones with high effectiveness indicate green fields that currently support relatively diverse green resource structures. In contrast, areas marked as potential—mostly built-up and reforestation zones—represent spaces that could accommodate ecological enhancement, either through the introduction of new green spaces or enriching existing vegetation. In Paranoá’s city center, particularly along its eastern edge, such areas are clearly visible. Although currently limited in diversity, they suggest spatial conditions favorable for future ecological interventions.
According to the discussion in the previous section, the Normalized Difference Vegetation Index (NDVI) is introduced to the Green Continuity analysis as input for the intensity of pollinator production and habitat support. It is a common measure of vegetation health, ranging from 0 to 1, calculated from the difference between the near-infrared and red-light reflectance for healthy photosynthetic-active vegetation. Impervious and non-vegetated surfaces show minimal spectral contrast, resulting in NDVI values near zero.
Pollinator richness tends to peak at intermediate NDVI values (approximately 0.4–0.6), aligning with the Intermediate Productivity Hypothesis [56,57] under static conditions. The NDVI data from Landsat 8–9 were used to estimate the initial distribution and intensity of pollinators, at a resolution of 30 × 30 m (Figure 7a,b). The movement dynamics were simulated and mapped through the Physarealm plugin in Grasshopper, aiming to uncover the latent connectivity across green spaces.
Figure 7c visualizes Green Continuity in Paranoá, revealing the absence of ecological movement corridors across the city center. Most constructed areas show no signs of pollinator vitality, with only a limited, scattered presence near the southern urban park. The resulting movement network reflects the broader scarcity of green resources in the built-up fabric of Paranoá. The few fragmented green patches are insufficient to support the entry or flow of ecological systems into the urban core, leading to a clear pattern of ecological fragmentation.
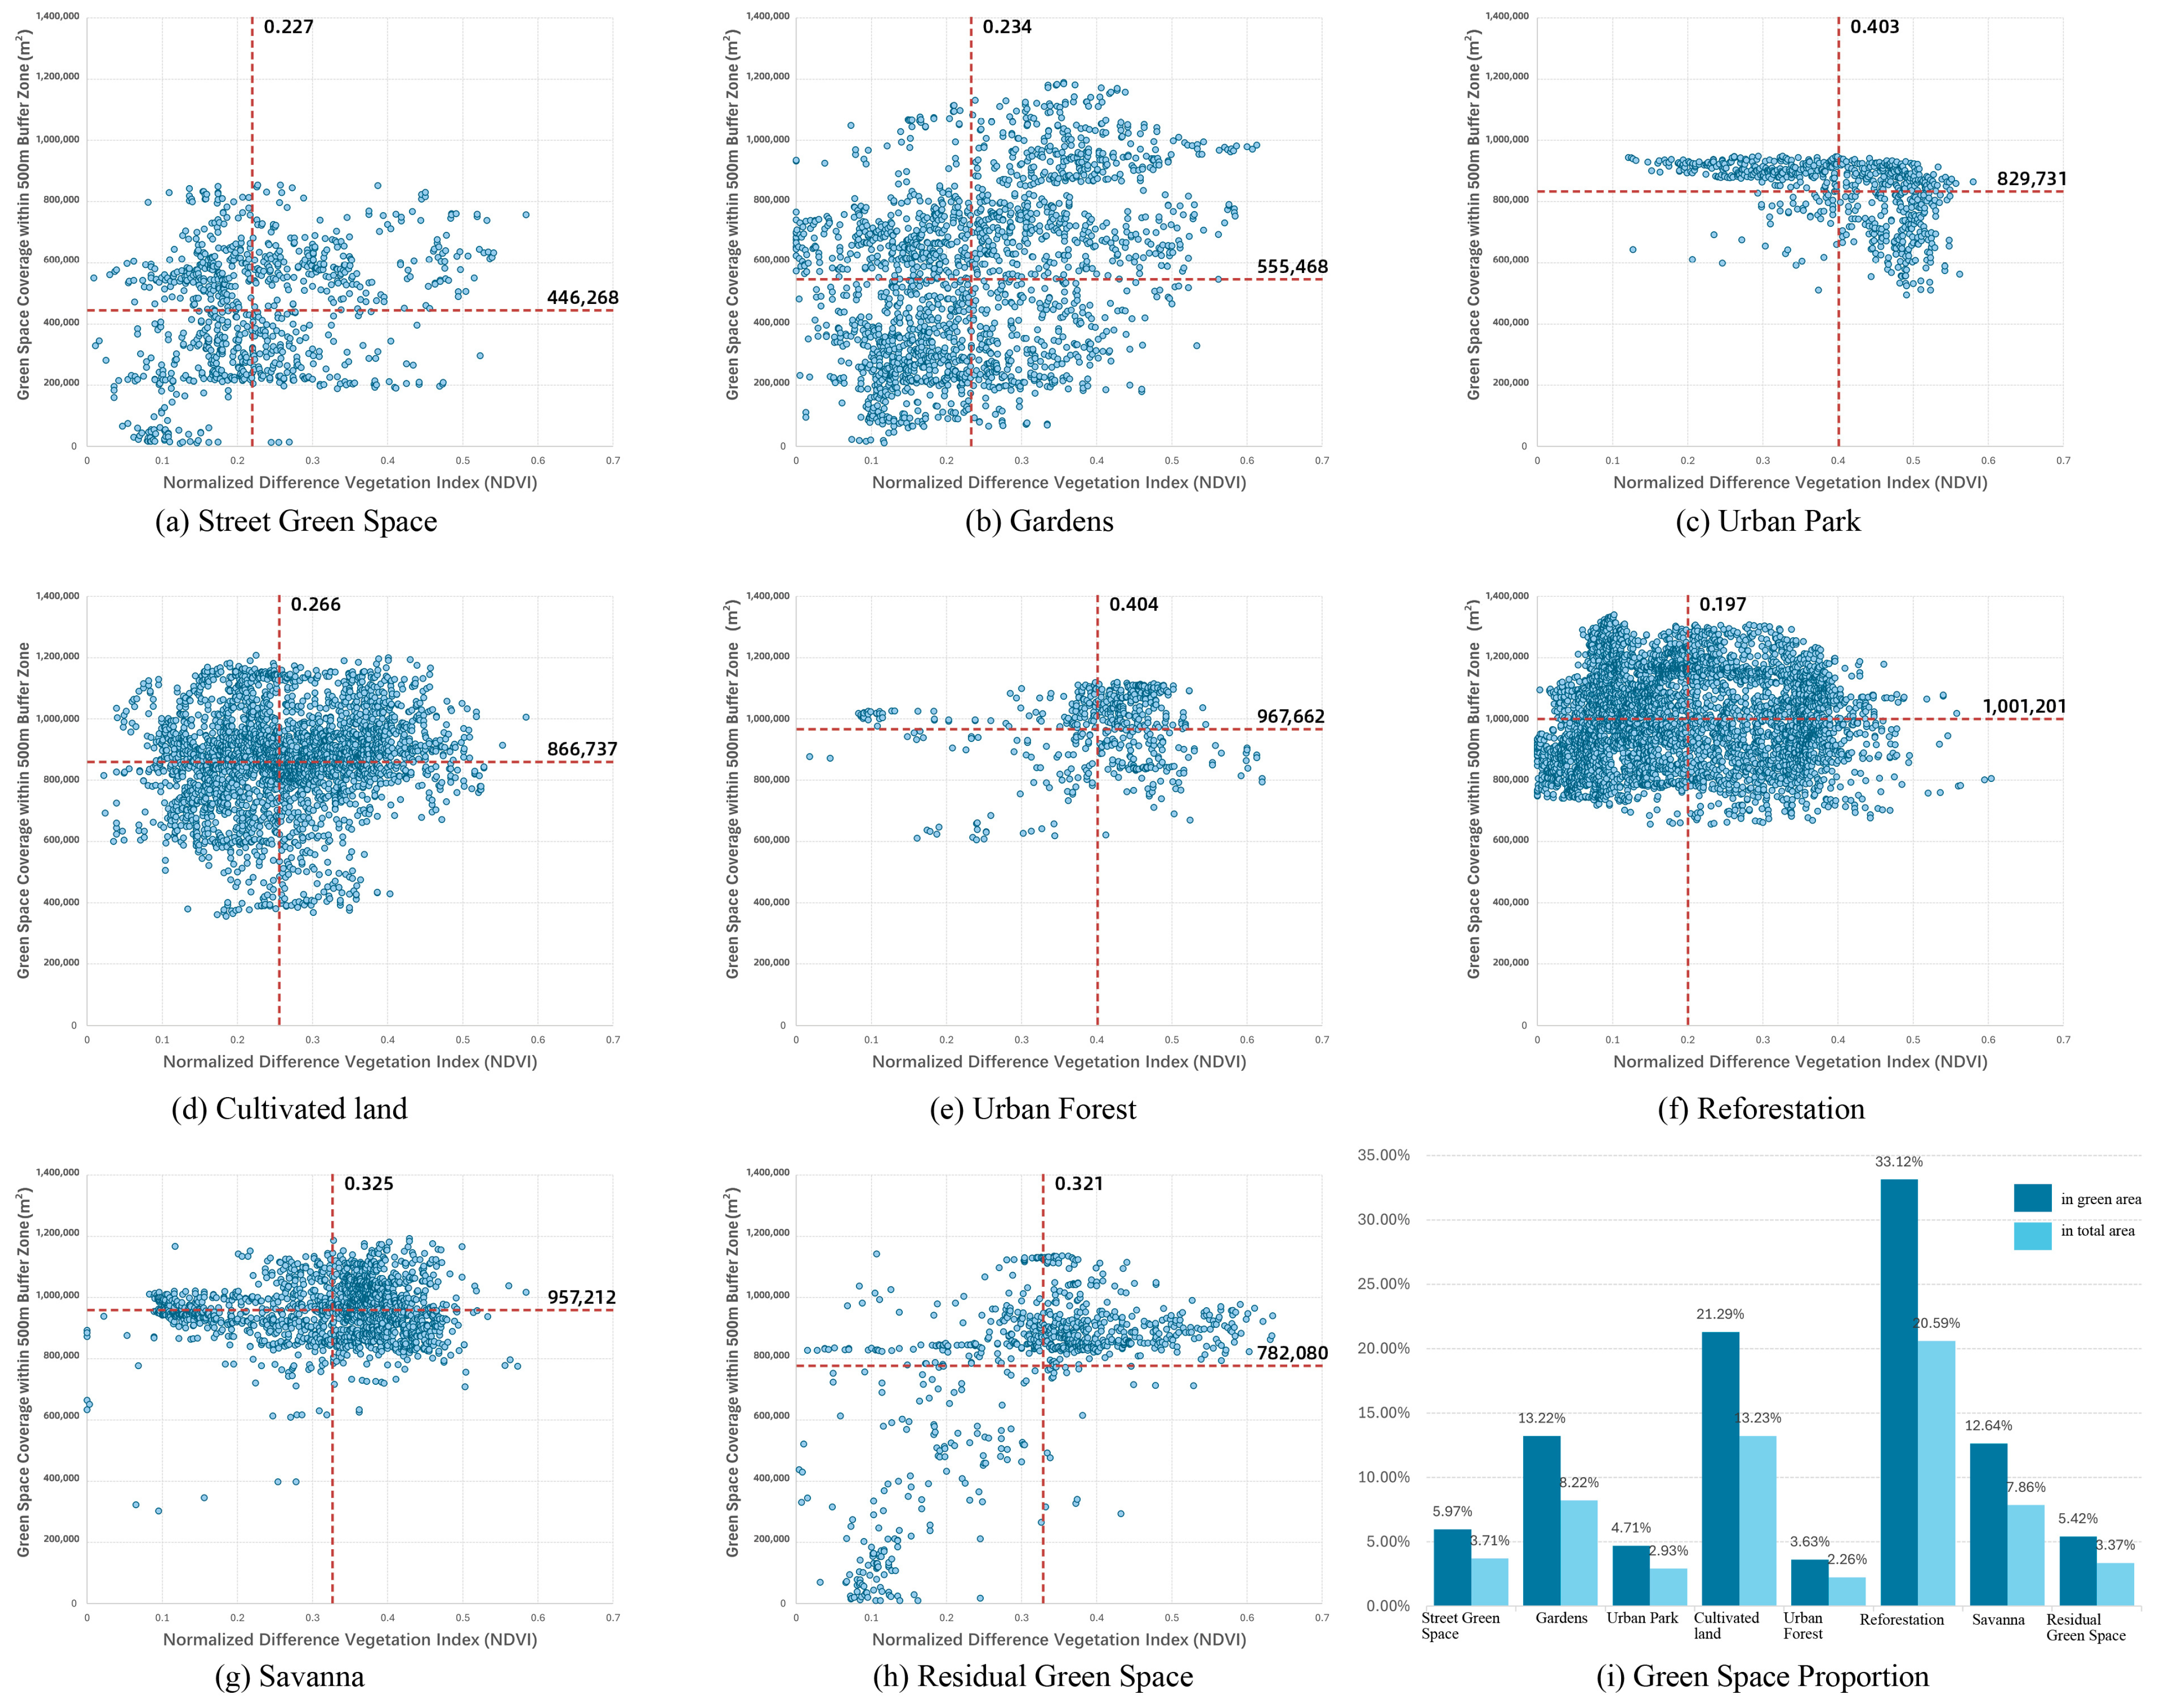
The proximity of different types of green space is illustrated in Figure 8 by comparing the area of adjacent green resources with their NDVI value. Urban parks, Urban Forests, and Savannas exhibit a relatively concentrated distribution, with NDVI clustering around 0.35, indicating an intermediate level of vegetation growth. Street green spaces, gardens, and residual green areas, due to their roles as components of urban service infrastructure, display a more dispersed proximity distribution and a wider range of vegetation conditions. Last but not least, Cultivated land and Reforestation show a stronger aggregation trend, with rich proximity to neighboring green resources ranging from 0.6 km2 to 1.3 km2. However, the NDVI value exhibits a lower coverage and health conditions of vegetation, ranging from 0.20 to 0.25.
Generally, green space accounts for 62% of the total land area in Paranoá, but its distribution is highly uneven. While the overall continuity and proximity between green areas are relatively high, the constructed zone (city center) forms an ecological island, disconnected from surrounding natural resources. In addition, urban service-oriented spaces such as urban parks, gardens, and street green spaces do not efficiently serve residents’ daily lives, with high Gini Coefficient values ranging from 0.7 to 0.9 (Figure 4) reflecting a significant degree of spatial inequality.

4.2. From Key Indicators to Design Actions: Translating Diagnosis into Intervention

To bridge the urban diagnosis and design strategies, Key Indicators are introduced to measure the spatial, ecological, and mobility conditions. Table 1 presents the urban performance in two scales—the Block scale for the boundary of the city center of Paranoá and the District Scale for the administrative boundary. This table functions as an operational cue to activate the Design Ordering Principles (DOPs) and identify actionable entry points. Based on the IMM framework, identifying the weakest or most structurally significant Key Category as the Catalyst operationalizes the translation from systemic diagnosis to design actions.
The Key Performance Indicator Table (Table 1) reveals structural rupture in the green infrastructure system of Paranoá, especially regarding its ecological continuity and service provision. Although the overall vegetation coverage reaches 62.16% and 98.99% of residents are theoretically within 300 m of a park or garden, key indicators demonstrate a disconnection between spatial green coverage and actual ecological function. The Tree Coverage Ratio is a mere 2.98%, which indicates a lack of vertical ecological mass and shading continuity. Similarly, Lawn Coverage Ratio is only 25.01%, reflecting a weak surface-level nature performance. The Green Proximity map aligns with the indicator Ecosystem Types, showing isolated patches without functional connectivity in block scale—a case of fragmented proximity.
This disconnection in the green infrastructure is more than structural. It plays in the daily experience in Paranoá. Despite a residential density of 14.86% and 141 people per hectare, only 681 individuals are able to access public activity spaces within a 15 min walk, which points to a noticeable shortage of proximate public amenities. In addition, 35.76% of the land in the city center is recognized as a “Food Desert”, lacking basic amenities such as supermarkets. These indicators reveal that despite the presence of green space, there is a lack of effective functional embedding between green space and the daily lives of residents, failing to form an organic linkage between ecological services, public activities, and urban life.
The above analysis indicates the Key Category of Green Continuity is both structurally weak and ecologically significant to be the Catalyst. Therefore, the corresponding DOP—“DOP 5: Create a connected open space system, activate urban metabolism” is selected for entering the intervention phase.
Figure 9 illustrates the interlinkage between actions across different DOPs, and the connections are established based on shared objectives, functional overlaps, and co-benefit potentials. Specifically, actions are linked when addressing similar spatial operations like green corridor design and interface activation or the inevitable trade-offs that sometimes arise due to ecological constraints, spatial form, or socio-political context.
DOP 5 (Continuity) forms a particularly dense and central cluster, with its key actions—such as 5.3 and 5.5—connecting strongly to actions under DOP 1 (Porosity), DOP 4 (Diversity), and DOP 6 (Interface). Rather than serving a single disciplinary aim, Green Continuity acts as a structural hinge that supports multiple intervention directions and mediates trade-offs across spatial, ecological, and social layers.

4.3. Urban Digital Twin-Enabled Scenario Testing and Priority Mapping for Regeneration Strategies

Grounded in the result of Urban Diagnosis and Actions informed by Key Indicators, a set of potentially effective design strategies has been developed, with Green Continuity serving as the focal point. Focusing on the urban green spaces, these strategies seek to improve the urban performance of Paranoá by reorganizing and strengthening pertinent natural resources, providing the methodological basis for testing with the Urban Digital Twin Model.
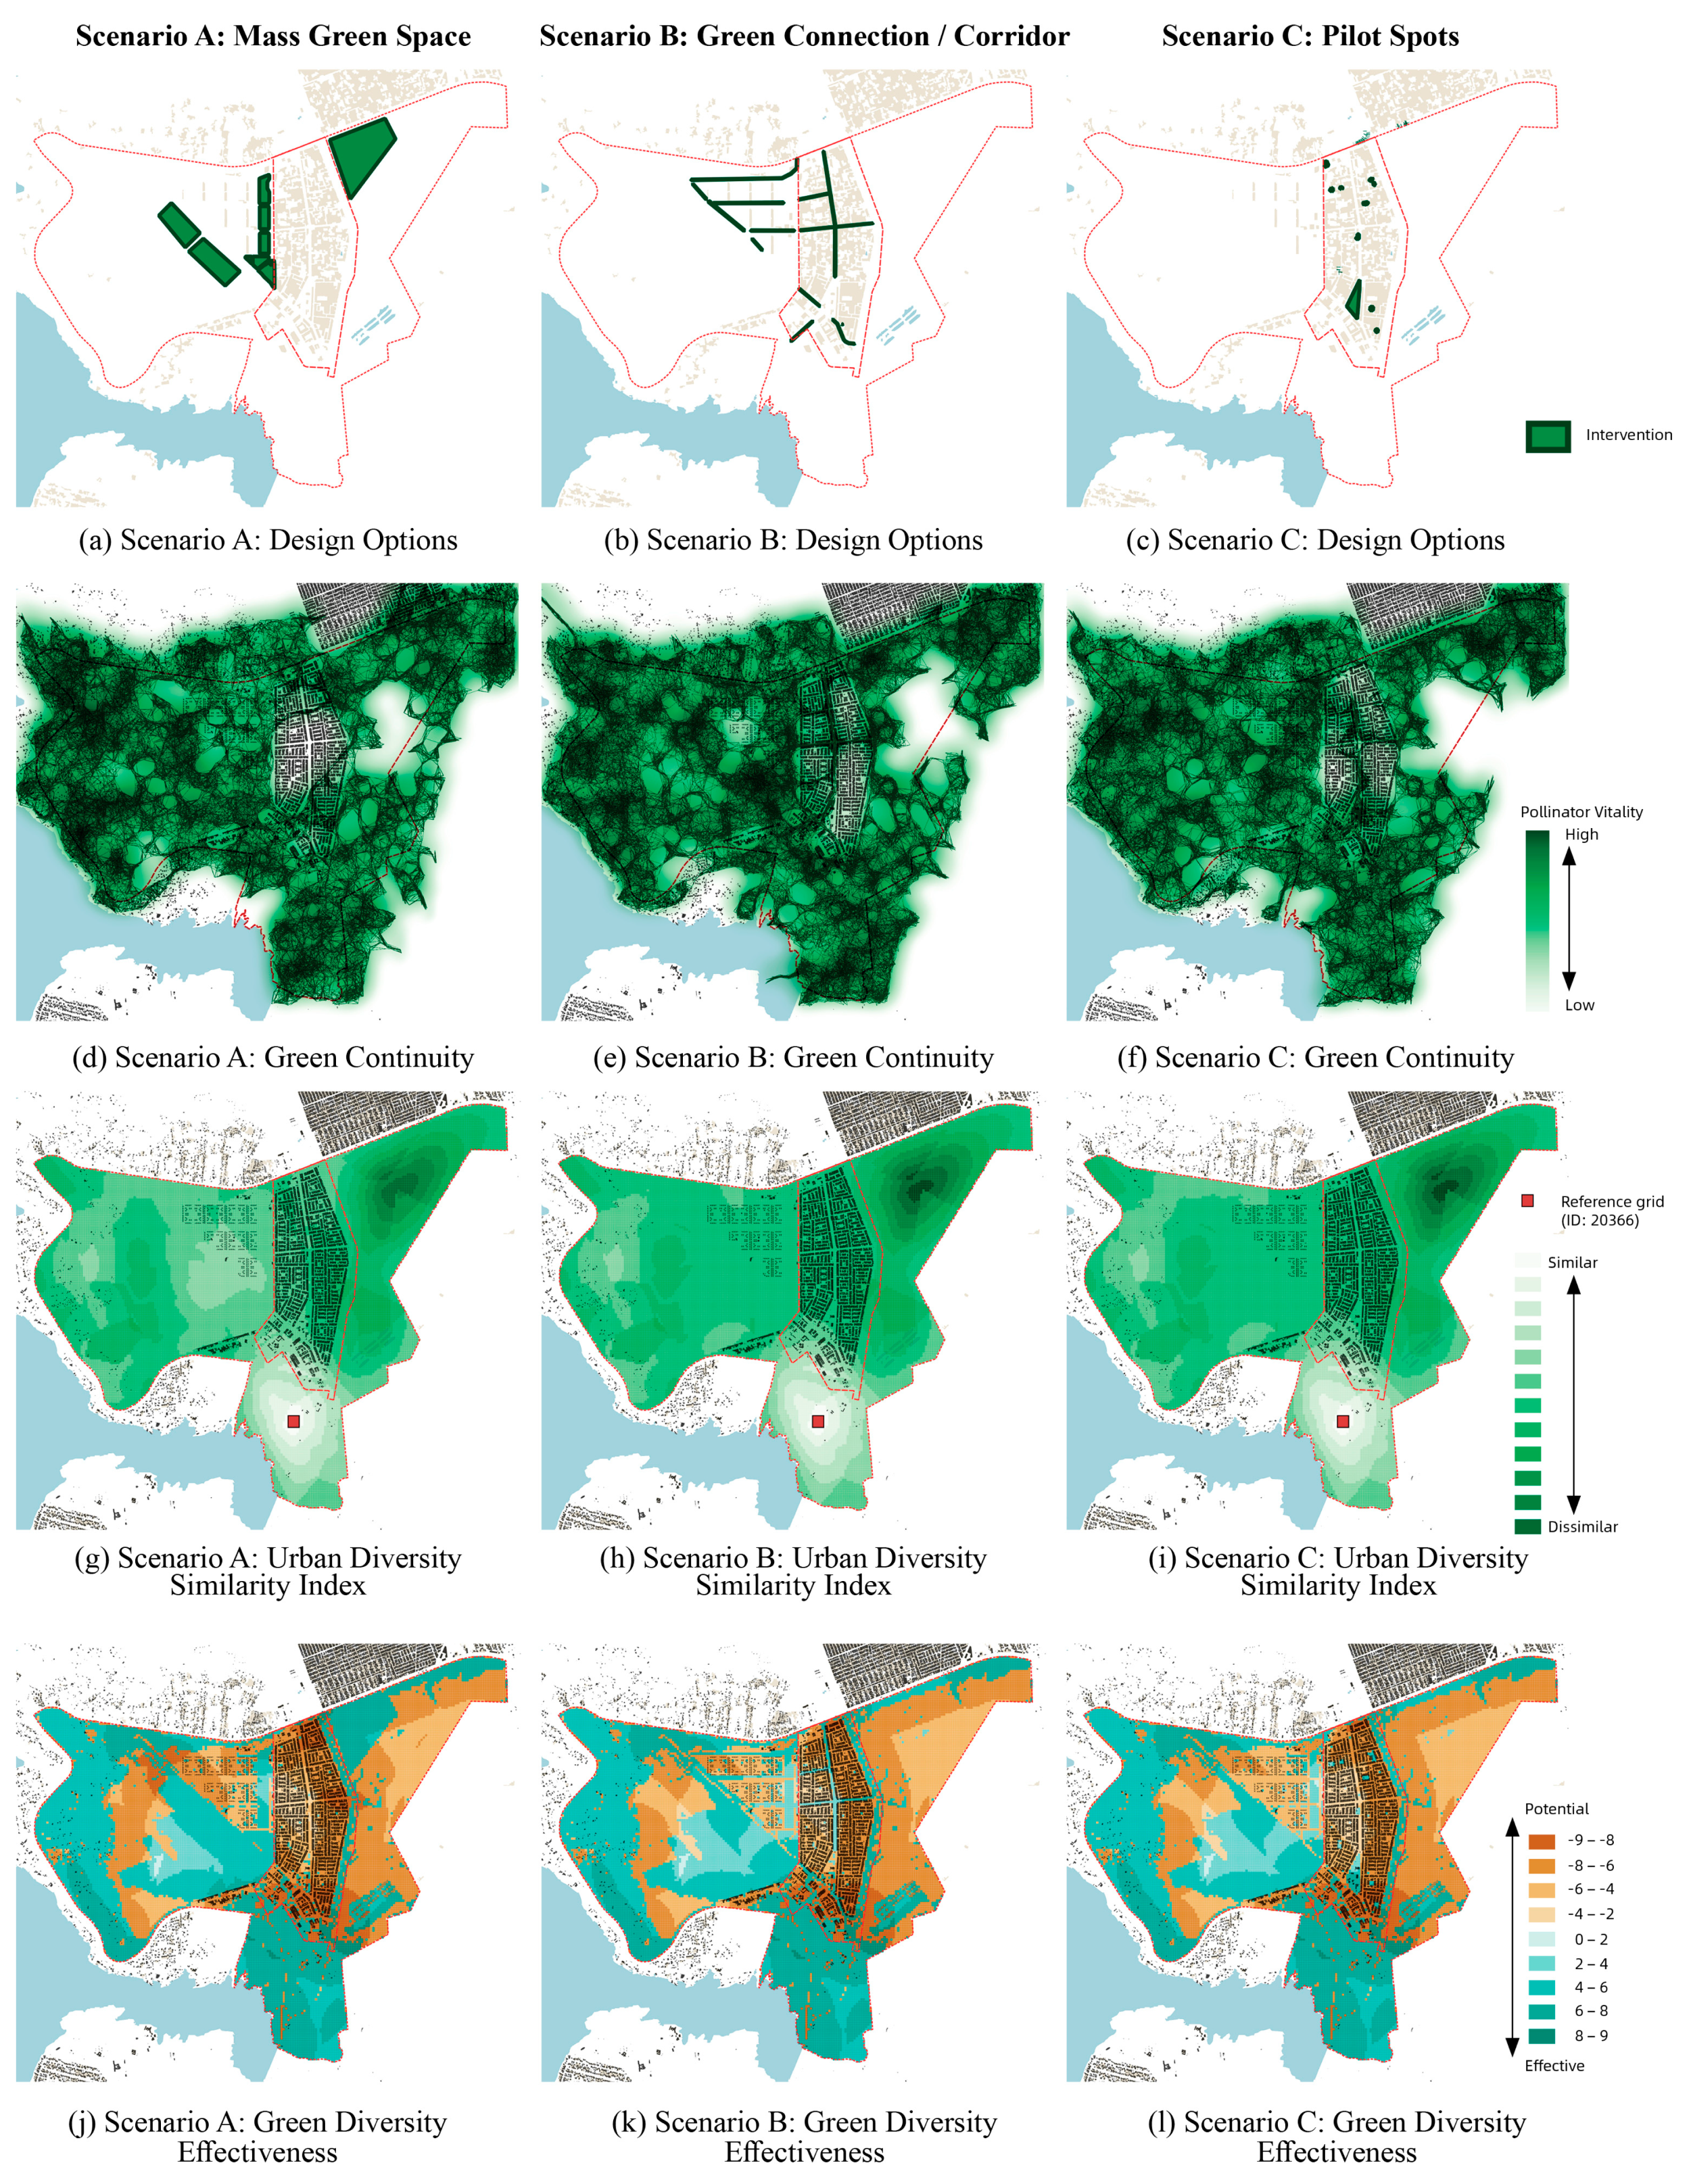
Based on the proposal defined by Inner and Outer Actions, three design scenarios were developed and tested through the UDT.
  • Scenario A focuses on enforcing the existing mass green spaces while improving their accessibility to citizens.
  • Scenario B introduces additional green connections and corridors to enhance permeability for non-humans.
  • Scenario C transforms existing public and semi-public areas/squares in Paranoá that have a high potential for green diversity into community gardens/parks, thereby improving the neighborhood environment and expanding public green space accessibility.
These three scenarios were simulated individually and are presented in Figure 10, with their corresponding interventions illustrated in Figure 10a–c.
By increasing the vegetation density in the reforestation zones (Scenario A), the mass green spaces contribute significantly to the Green Diversity. Furthermore, transforming these spaces into urban parks provides citizens with more opportunities to access nature. Figure 10e demonstrates that green connections (Scenario B) provide a powerful corridor for non-humans to connect green spaces on both the east and west sides, allowing nature to penetrate the city center and mitigate the negative impacts of green space fragmentation. Pocket zones (Scenario C) for landing are provided for pollinators, connecting the original Urban Park to the northern forestation zones via Paranoá’s Central Avenue, and contributing to a reduction in the original Gini Coefficient (Garden) from 0.69 to 0.63, thereby improving the green equity.
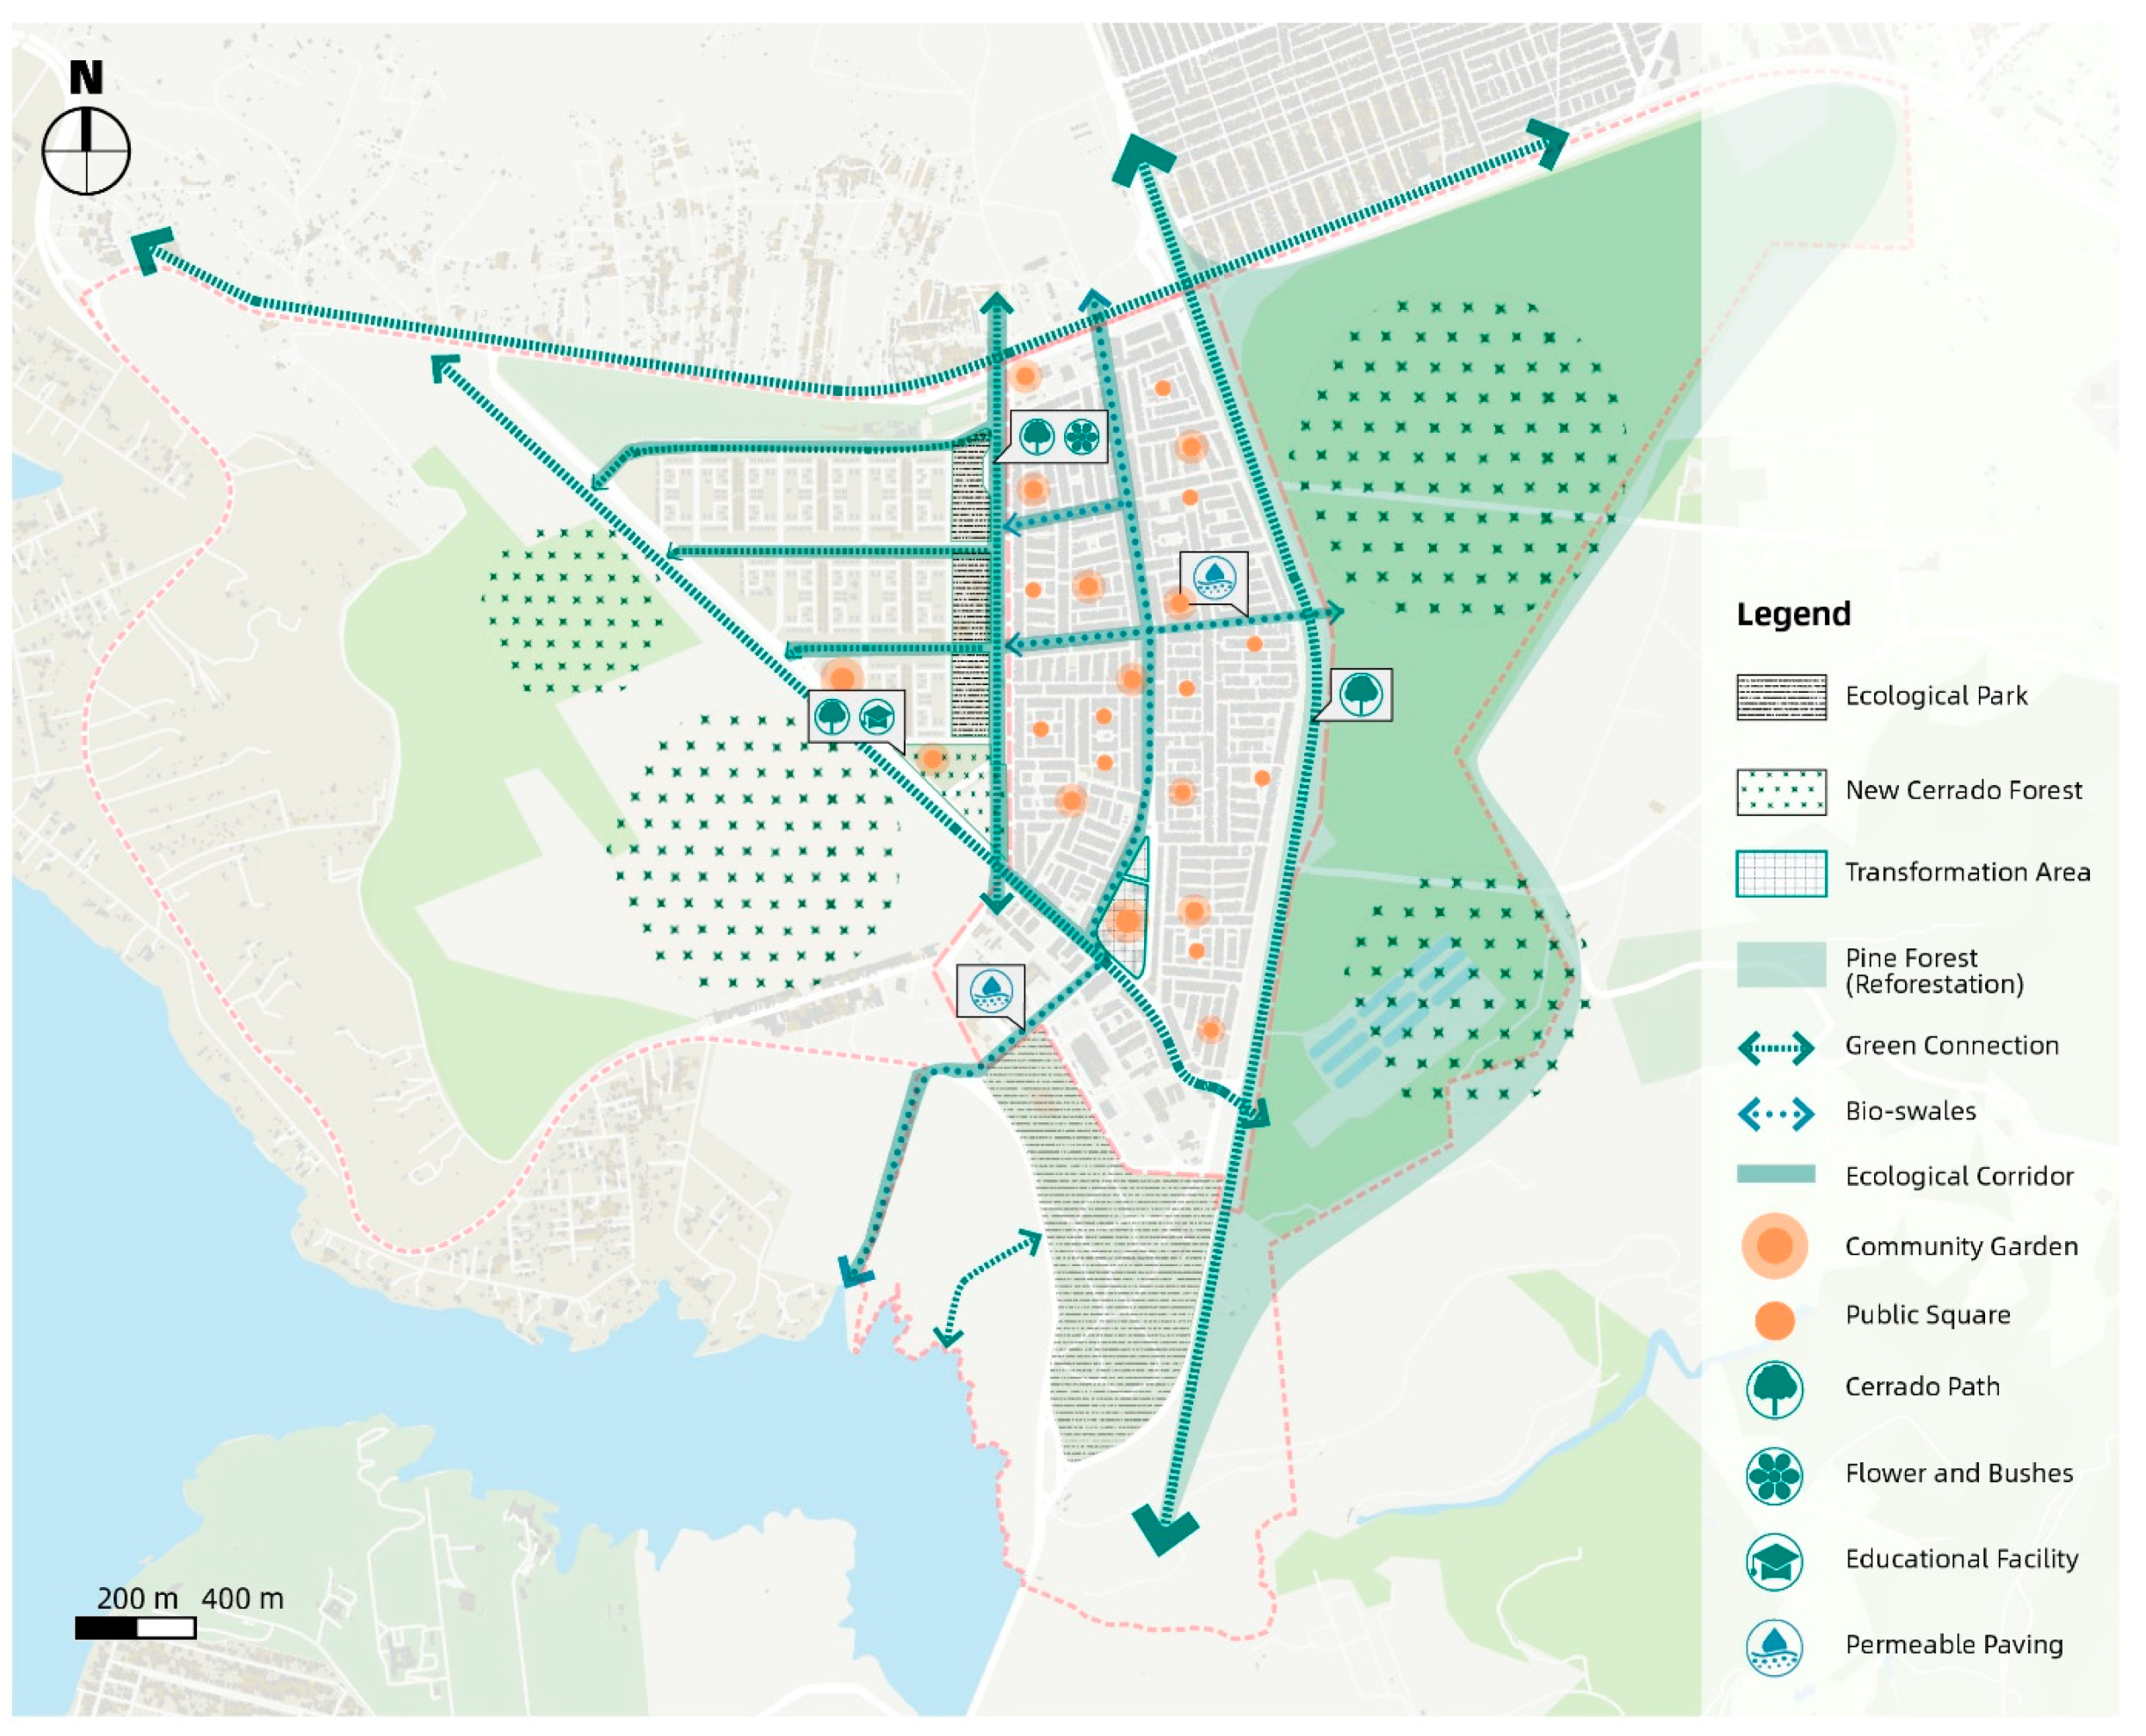
Following a thorough comparison of the simulation results through the digital twin model, the final strategic map was not derived from a single scenario but an integration that combines the strengths of three cases. A single scenario alone could not fully address the multi-aspect challenges of ecological performance, spatial homogeneity, and green equity in a complex urban system.
Specifically, the centralized mass green space enhancement provides a foundational capacity for ecology; the green connectivity network supports east–west green continuity and species movement; and the distributed pocket gardens increase everyday accessibility for residents while helping to reduce spatial inequality. These strategies were selectively integrated based on morphological and functional synergies identified through simulation feedback.
Consequently, the final proposal exhibits the synergy of green space structure at multiple levels, while reflecting a deliberate balance between ecological continuity and urban equity. As an output of an integrated spatial strategy, Figure 11 marks the completion of the methodological loop—from Urban Diagnosis to intervention logic construction, to scenario testing, and ultimately to strategic spatial synthesis.

5. Conclusions

This study primarily focuses on developing and testing a hybrid methodological framework that embeds the Integrated Modification Methodology (IMM) into Urban Digital Twin (UDT) modeling, while also evaluating its applicability to informal settlements in the Global South. It demonstrates the feasibility of embedding the IMM theory into UDT, particularly in integrating multiple dimensions of urban green spaces with strong adaptability. IMM not only enables the structured representation of multidimensional urban systems but, with the help of the Entity–Relationship (ER) model, clarifies the logical relationship within complex urban data. It provides theoretical support for the spatial analysis of informal settlements and the development of intervention strategies. Although this study focuses on green spaces, this framework is highly scalable and can be extended to other urban dimensions with strong potential.
The spatial patterns revealed through this framework directly respond to the research objective of digitalizing informal settlement complexity and transforming diagnostic insight into actionable intervention. The unequal access to green infrastructure, as shown through diversity and proximity analysis, exposes systemic spatial injustices within Paranoá’s informal fabric. These insights demonstrate the value of combining IMM and Digital Twin tools to inform more equitable green space planning—targeting specific morphological or social imbalances, rather than relying on generalized metrics. As a result, this study supports a more nuanced understanding of social equity and ecological continuity in informal urban structures.
As a theoretical framework, IMM offers a systemic workflow for urban diagnosis. Using Paranoá as a case study, this approach translates the seemingly disordered spatial layout of informal settlements into quantifiable attributes (Key Categories). By analyzing the interrelations and performance among these categories, IMM enables the identification of the most sensitive urban layers and provides grounded suggestions for strategic intervention. The UDT serves as both a modeling and analytical platform, supporting not only the visualization but also the quantification of urban conditions and enabling multi-scenario simulations. In this context, IMM functions as the “software,” embedded within the UDT “hardware,” to integrate Paranoá’s urban morphology and performance in a coherent and structured manner—demonstrating the feasibility of applying IMM from theory to practice and offering a reference for future studies.
The Key Categories selected in this research—diversity, proximity, and continuity—also provide valuable foundations for more detailed urban analysis beyond their roles in the overall methodology. For instance, Urban Service Diversity and Proximity are assessed through green space as a case, allowing for a fine-grained evaluation of service coverage within an informal context, and offering a quantitative reference for future green infrastructure planning. Meanwhile, the Green Space Diversity and NDVI-based Green Continuity analyses convert static remote sensing data into dynamic, measurable indicators, thereby advancing the analysis of urban green space conditions from descriptive mapping to predictive modeling.
As a result of combining IMM with UDT, this study demonstrates that systemic thinking offers greater comprehensiveness and relevance in urban diagnosis compared to conventional analytical approaches. The interrelations between Key Categories are made visible and measurable through maps, diagrams, and their linkages via design actions. This workflow—grounded in systemic correlation rather than isolated symptoms—represents the core contribution of this study, moving beyond the symptom-oriented logic common in existing literature and addressing the structural interdependencies underlying urban challenges.
At the same time, this study faces certain limitations in technical implementation. The current cross-platform workflow (QGIS, Rhino, Python) requires some manual conversion and synchronization, which constrains the real-time responsiveness expected from UDT. Furthermore, the simulation only captures the snapshots of the wet and dry seasons during 2024–2025, which limits the accuracy to reflect the dynamic nature of ecological systems. These findings mark a significant step toward practice-oriented transformation. Future work can further enhance the framework through improved data integration workflows and responsiveness to temporal ecological change.
In summary, this research provides a feasible methodological framework to support multi-stakeholder decision-making and offers a systemic and practical approach for the multi-dimensional digitalization of urban structure and performance. The framework promotes a more adaptive, data-driven, and transferable planning process, with strong potential to inform sustainable transition in the Global South and beyond. By aligning digital tools with context-specific strategies and integrated design principles, the study helps pave the way for more inclusive, resilient, and ecologically grounded approaches to urban regeneration. Beyond its specific case application, the proposed framework offers a transferable pathway for other urban contexts, bridging diagnostic precision with actionable strategies, and contributing to both theoretical discourse and practical urban resilience planning.

Supplementary Materials

The complete set of data, tables, and maps can be accessed at https://drive.google.com/drive/folders/1dKwDXYTuPSxTnabpUCgC-qk7C4oFnkoq?usp=sharing (accessed on 12 June 2025).

Author Contributions

Conceptualization, T.D. and M.T.; methodology, T.D. and M.T.; formal analysis, T.D.; visualization, T.D.; writing—original draft preparation, T.D.; writing—review and editing, M.T.; supervision, M.T. All authors have read and agreed to the published version of the manuscript.

Funding

T. Dong is supported by the China Scholarship Council (CSC) doctoral fellowship under grant No. 202107820015. No additional external funding was received for this research.

Data Availability Statement

The original contributions presented in this study are included in the article/Supplementary Materials. Further inquiries can be directed to the corresponding author(s).

Conflicts of Interest

The authors declare no conflicts of interest.

Abbreviations

The following abbreviations are used in this manuscript:
AIArtificial Intelligence
BIMBuilding Information Modeling
CASComplex Adaptive Systems
CIMCity Information Modeling
DTDigital Twin
DTMDigital Twin Modeling
DOPDesign Ordering Principle
EREntity–Relationship
GISGeographic Information System
HDXHumanitarian Data Exchange
IMMIntegrated Modification Methodology
IoTInternet of Things
KCKey Category
MLMachine Learning
OGDOpen Government Data
OSMOpenStreetMap
SAPSpatial Accessibility Poverty
SEDUHSecretaria de Desenvolvimento Urbano e Habitação
SISimpson’s Index
SISDIASistema Distrital de Informações Ambientais
UDTUrban Digital Twin
UN-HabitatUnited Nations Human Settlements Programme

Appendix A

Due to page limitations, the full list of IMM’s Design Ordering Principles and Actions can be accessed via the following link: https://drive.google.com/file/d/1Yo4ZpZ738amVrMQid_MdrmVmUJJ7gH25/view?usp=drive_link (accessed on 12 August 2025).

References

  1. Bhadouria, R.; Tripathi, S.; Singh, P.; Joshi, P.K.; Singh, R. Urban Metabolism and Global Climate Change: An Overview. In Urban Metabolism and Climate Change; Bhadouria, R., Tripathi, S., Singh, P., Joshi, P.K., Singh, R., Eds.; Springer International Publishing: Cham, Switzerland, 2023; pp. 3–22. ISBN 978-3-031-29421-1. [Google Scholar]
  2. Dean, W. The Industrialization of São Paulo, 1800–1945; University of Texas Press: Austin, TX, USA, 1969; ISBN 978-1-4773-0406-8. [Google Scholar]
  3. Tone, B.B.; Guerreiro, I. Sérgio Ferro arquitetura e trabalho livre. PósFAUUSP 2006, 20, 240. [Google Scholar] [CrossRef]
  4. Guadagnin, D.L.; Gravato, I.C.F. Value of Brazilian environmental legislation to conserve biodiversity in suburban areas. A case study in Porto Alegre, Brazil. Nat. Conserv. 2009, 7, 133–145. [Google Scholar]
  5. Benevenuto, R.; Caulfield, B. Measuring Access to Urban Centres in Rural Northeast Brazil: A Spatial Accessibility Poverty Index. J. Transp. Geogr. 2020, 82, 102553. [Google Scholar] [CrossRef]
  6. Fix, M.; Arantes, P.F. On Urban Studies in Brazil: The Favela, Uneven Urbanisation and Beyond. Urban Stud. 2022, 59, 893–916. [Google Scholar] [CrossRef]
  7. Truelove, Y.; Cornea, N. Rethinking Urban Environmental and Infrastructural Governance in the Everyday: Perspectives from and of the Global South. Environ. Plan. C Politics Space 2021, 39, 231–246. [Google Scholar] [CrossRef]
  8. Kamelifar, M.J.; Rustaei, S.; Ahadnejad, M.; Kamelifar, Z. The Assessment of Road Network Vulnerability in Formal and Informal (Slum) Urban Tissues to Earthquake Hazards with Crisis Management Approach (Case Study: Zone 1 Tabriz). J. Civ. Eng. Urban. 2013, 3, 380–385. [Google Scholar]
  9. United Nations Environment Programme. Ecosystems and Human Well-Being: Wetlands and Water Synthesis: A Report of the Millennium Ecosystem Assessment; Millennium Ecosystem Assessment (Program), Ed.; World Resources Institute: Washington, DC, USA, 2005; ISBN 978-1-56973-597-8. [Google Scholar]
  10. Gamero-Salinas, J.; Kishnani, N.; Sánchez-Ostiz, A.; Monge-Barrio, A.; Benitez, E. Porosity, Openness, and Exposure: Identification of Underlying Factors Associated with Semi-Outdoor Spaces’ Thermal Performance and Clustering in Tropical High-Density Singapore. Energy Build. 2022, 272, 112339. [Google Scholar] [CrossRef]
  11. Vazin, F. Investigating the Role of Environmental Comfort on Citizens’ Behavior in an Urban Street: A Case Study of Khosravi Street, Mashhad. Creat. City Des. 2020, 3, 141–154. [Google Scholar]
  12. Weisz, C. Resilient Design: ‘Systems Thinking’ as a Response to Climate Change. Archit. Des. 2018, 88, 24–31. [Google Scholar] [CrossRef]
  13. Shukla, N.; Das, A.; Mazumder, T. Assessment of Urban Form Resilience: A Review of Literature in the Context of the Global South. Environ. Dev. Sustain. 2023, 27, 2863–2899. [Google Scholar] [CrossRef]
  14. UN-Habitat. World Cities Report, The Value of Sustainable Urbanization; UN-Habitat: Nairobi, Kenya, 2020; ISBN 978-92-1-132872-1. [Google Scholar]
  15. Watson, V. Seeing from the South: Refocusing Urban Planning on the Globe’s Central Urban Issues. Urban Stud. 2009, 46, 2259–2275. [Google Scholar] [CrossRef]
  16. Lawhon, M.; Ernstson, H.; Silver, J. Provincializing Urban Political Ecology: Towards a Situated UPE Through African Urbanism: Provincialising Urban Political Ecology. Antipode 2014, 46, 497–516. [Google Scholar] [CrossRef]
  17. McFarlane, C.; Silver, J. The Poolitical City: “Seeing Sanitation” and Making the Urban Political in Cape Town: The Poolitical City. Antipode 2017, 49, 125–148. [Google Scholar] [CrossRef]
  18. Deng, T.; Zhang, K.; Shen, Z.-J.M. A Systematic Review of a Digital Twin City: A New Pattern of Urban Governance Toward Smart Cities. J. Manag. Sci. Eng. 2021, 6, 125–134. [Google Scholar] [CrossRef]
  19. Liu, C.; Tian, Y. Recognition of Digital Twin City from the Perspective of Complex System Theory: Lessons from Chinese Practice. J. Urban Manag. 2023, 12, 182–192. [Google Scholar] [CrossRef]
  20. Lowry, I.S. A Model of Metropolis; Rand Corporation: Santa Monica, CA, USA, 1964. [Google Scholar]
  21. Echenique, M.H.; Grinevich, V.; Hargreaves, A.J.; Zachariadis, V. LUISA: A Land-Use Interaction with Social Accounting Model; Presentation and Enhanced Calibration Method. Environ. Plan. B Plan. Des. 2013, 40, 1003–1026. [Google Scholar] [CrossRef]
  22. Batty, M. Urban Modelling: Algorithms, Calibrations, Predictions; Cambridge Urban and Architectural Studies; Cambridge University Press: Cambridge, UK, 1976; ISBN 978-0-521-20811-6. [Google Scholar]
  23. Wegener, M. Operational Urban Models State of the Art. J. Am. Plan. Assoc. 1994, 60, 17–29. [Google Scholar] [CrossRef]
  24. Wan, L.; Jin, Y.; Echenique, M.; Batty, M.; Wegener, M. From urban modelling to city digital twins—Reflections from the applied urban modelling (AUM) symposia. Environ. Plan. B: Urban Anal. City Sci. 2024, 23998083241279601. [Google Scholar] [CrossRef]
  25. Caldarelli, G.; Arcaute, E.; Barthelemy, M.; Batty, M.; Gershenson, C.; Helbing, D.; Mancuso, S.; Moreno, Y.; Ramasco, J.J.; Rozenblat, C.; et al. The Role of Complexity for Digital Twins of Cities. Nat. Comput. Sci. 2023, 3, 374–381. [Google Scholar] [CrossRef]
  26. Dembski, F.; Wössner, U.; Letzgus, M.; Ruddat, M.; Yamu, C. Urban Digital Twins for Smart Cities and Citizens: The Case Study of Herrenberg, Germany. Sustainability 2020, 12, 2307. [Google Scholar] [CrossRef]
  27. Schrotter, G.; Hürzeler, C. The Digital Twin of the City of Zurich for Urban Planning. PFG 2020, 88, 99–112. [Google Scholar] [CrossRef]
  28. White, G.; Zink, A.; Codecá, L.; Clarke, S. A Digital Twin Smart City for Citizen Feedback. Cities 2021, 110, 103064. [Google Scholar] [CrossRef]
  29. Yossef Ravid, B.; Aharon-Gutman, M. The Social Digital Twin: The Social Turn in the Field of Smart Cities. Environ. Plan. B Urban Anal. City Sci. 2023, 50, 1455–1470. [Google Scholar] [CrossRef]
  30. March, H.; Swyngedouw, E. Resilience for All or for Some? Reflections Through the Lens of Urban Political Ecology. In Urban Resilience to the Climate Emergency; Ruiz-Mallén, I., March, H., Satorras, M., Eds.; The Urban Book Series; Springer International Publishing: Cham, Switzerland, 2022; pp. 3–19. ISBN 978-3-031-07300-7. [Google Scholar]
  31. Liu, X.; Song, Y.; Wu, K.; Wang, J.; Li, D.; Long, Y. Understanding Urban China with Open Data. Cities 2015, 47, 53–61. [Google Scholar] [CrossRef]
  32. Shahat, E.; Hyun, C.T.; Yeom, C. City Digital Twin Potentials: A Review and Research Agenda. Sustainability 2021, 13, 3386. [Google Scholar] [CrossRef]
  33. Grieves, M.W. Product Lifecycle Management: The New Paradigm for Enterprises. IJPD 2005, 2, 71. [Google Scholar] [CrossRef]
  34. Biraghi, C.A.; Ogut, O.; Dong, T.; Tadi, M. CityTime: A Novel Model to Redefine the 15-Minute City Globally Through Urban Diversity and Proximity. Urban Sci. 2025, 9, 36. [Google Scholar] [CrossRef]
  35. Batty, M. Digital Twins. Environ. Plan. B Urban Anal. City Sci. 2018, 45, 817–820. [Google Scholar] [CrossRef]
  36. Arroyo Ohori, K.; Diakité, A.; Krijnen, T.; Ledoux, H.; Stoter, J. Processing BIM and GIS Models in Practice: Experiences and Recommendations from a GeoBIM Project in The Netherlands. IJGI 2018, 7, 311. [Google Scholar] [CrossRef]
  37. Tadi, M.; Zadeh, M.H.M.; di Milano, P. Urban Porosity. A Morphological Key Category for the Optimization of the CAS’s Environmental and Energy Performance. GSTF J. Eng. Technol. 2017, 4, 138. [Google Scholar]
  38. Mohammad Zadeh, H.; Lenzi, E.; Dong, T.; Biraghi, C.A.; Pucci, E.; Cerutti, F.; Tadi, M. A Conceptual Data Model for IMM: A Methodological Interpretation of Targets and Indicators in SDG11. Sci. Total Environ. 2024, 956, 177269. [Google Scholar] [CrossRef]
  39. Holland, J.H. Complex Adaptive Systems. Daedalus 1992, 121, 17–30. [Google Scholar]
  40. Masera, G.; Tadi, M. (Eds.) Environmental Performance and Social Inclusion in Informal Settlements: A Favela Project Based on the IMM Integrated Modification Methodology; Research for Development; Springer International Publishing: Cham, Switzerland, 2020; ISBN 978-3-030-44351-1. [Google Scholar]
  41. Randolph, G.F.; Storper, M. Is Urbanisation in the Global South Fundamentally Different? Comparative Global Urban Analysis for the 21st Century. Urban Stud. 2023, 60, 3–25. [Google Scholar] [CrossRef]
  42. Mitchell, M. Complexity: A Guided Tour; Oxford University Press: Oxford, UK; New York, NY, USA, 2009; ISBN 978-0-19-512441-5. [Google Scholar]
  43. Dovey, K. Informal Urbanism and Complex Adaptive Assemblage. Int. Dev. Plan. Rev. 2012, 34, 349–368. [Google Scholar] [CrossRef]
  44. Economist Intelligence Unit. Latin American Green City Index: Assessing the Environmental Performance of Latin America’s Major Cities; Economist Intelligence Unit: Munich, Germany, 2010. [Google Scholar]
  45. Roy, A. Urban Informality: Toward an Epistemology of Planning. J. Am. Plan. Assoc. 2005, 71, 147–158. [Google Scholar] [CrossRef]
  46. Geurs, K.T.; Van Wee, B. Accessibility Evaluation of Land-Use and Transport Strategies: Review and Research Directions. J. Transp. Geogr. 2004, 12, 127–140. [Google Scholar] [CrossRef]
  47. Dong, T.; Colucci, A.; Tadi, M. Systemic Action Network for Improving Blue–Green Infrastructure Based on the Natural Capital Investigation: The Strategic Plan in Vlorë, Albania. In Blue-Green Infrastructure for Sustainable Urban Settlements; Joshi, P.K., Rao, K.S., Bhadouria, R., Tripathi, S., Singh, R., Eds.; Springer Nature: Cham, Switzerland, 2024; pp. 387–412. ISBN 978-3-031-62292-2. [Google Scholar]
  48. Simpson, E.H. Measurement of Diversity. Nature 1949, 163, 688. [Google Scholar] [CrossRef]
  49. Atkinson, A.B. On the Measurement of Inequality. J. Econ. Theory 1970, 2, 244–263. [Google Scholar] [CrossRef]
  50. Sen, A. On Economic Inequality; Oxford University Press: Oxford, UK, 1997; ISBN 0-19-828193-5. [Google Scholar]
  51. Fabrizi, E.; Trivisano, C. Small Area Estimation of the Gini Concentration Coefficient. Comput. Stat. Data Anal. 2016, 99, 223–234. [Google Scholar] [CrossRef]
  52. Fenoglio, M.S.; Videla, M.; Salvo, A.; Valladares, G. Beneficial Insects in Urban Environments: Parasitism Rates Increase in Large and Less Isolated Plant Patches via Enhanced Parasitoid Species Richness. Biol. Conserv. 2013, 164, 82–89. [Google Scholar] [CrossRef]
  53. Witlox, F. Evaluating the Reliability of Reported Distance Data in Urban Travel Behaviour Analysis. J. Transp. Geogr. 2007, 15, 172–183. [Google Scholar] [CrossRef]
  54. Zanini, S.; Dainese, M.; Kopf, T.; Leitinger, G.; Tappeiner, U. Maintaining Habitat Diversity at Small Scales Benefits Wild Bees and Pollination Services in Mountain Apple Orchards. Ecol. Solut. Evid. 2024, 5, e12320. [Google Scholar] [CrossRef]
  55. Graffigna, S.; González-Vaquero, R.A.; Torretta, J.P.; Marrero, H.J. Importance of Urban Green Areas’ Connectivity for the Conservation of Pollinators. Urban Ecosyst. 2024, 27, 417–426. [Google Scholar] [CrossRef]
  56. Gould, W. Remote Sensing of Vegetation, Plant Species Richness, and Regional Biodiversity Hotspots. Ecol. Appl. 2000, 10, 1861–1870. [Google Scholar] [CrossRef]
  57. Huston, M.A. Disturbance, Productivity, and Species Diversity: Empiricism vs. Logic in Ecological Theory. Ecology 2014, 95, 2382–2396. [Google Scholar] [CrossRef]
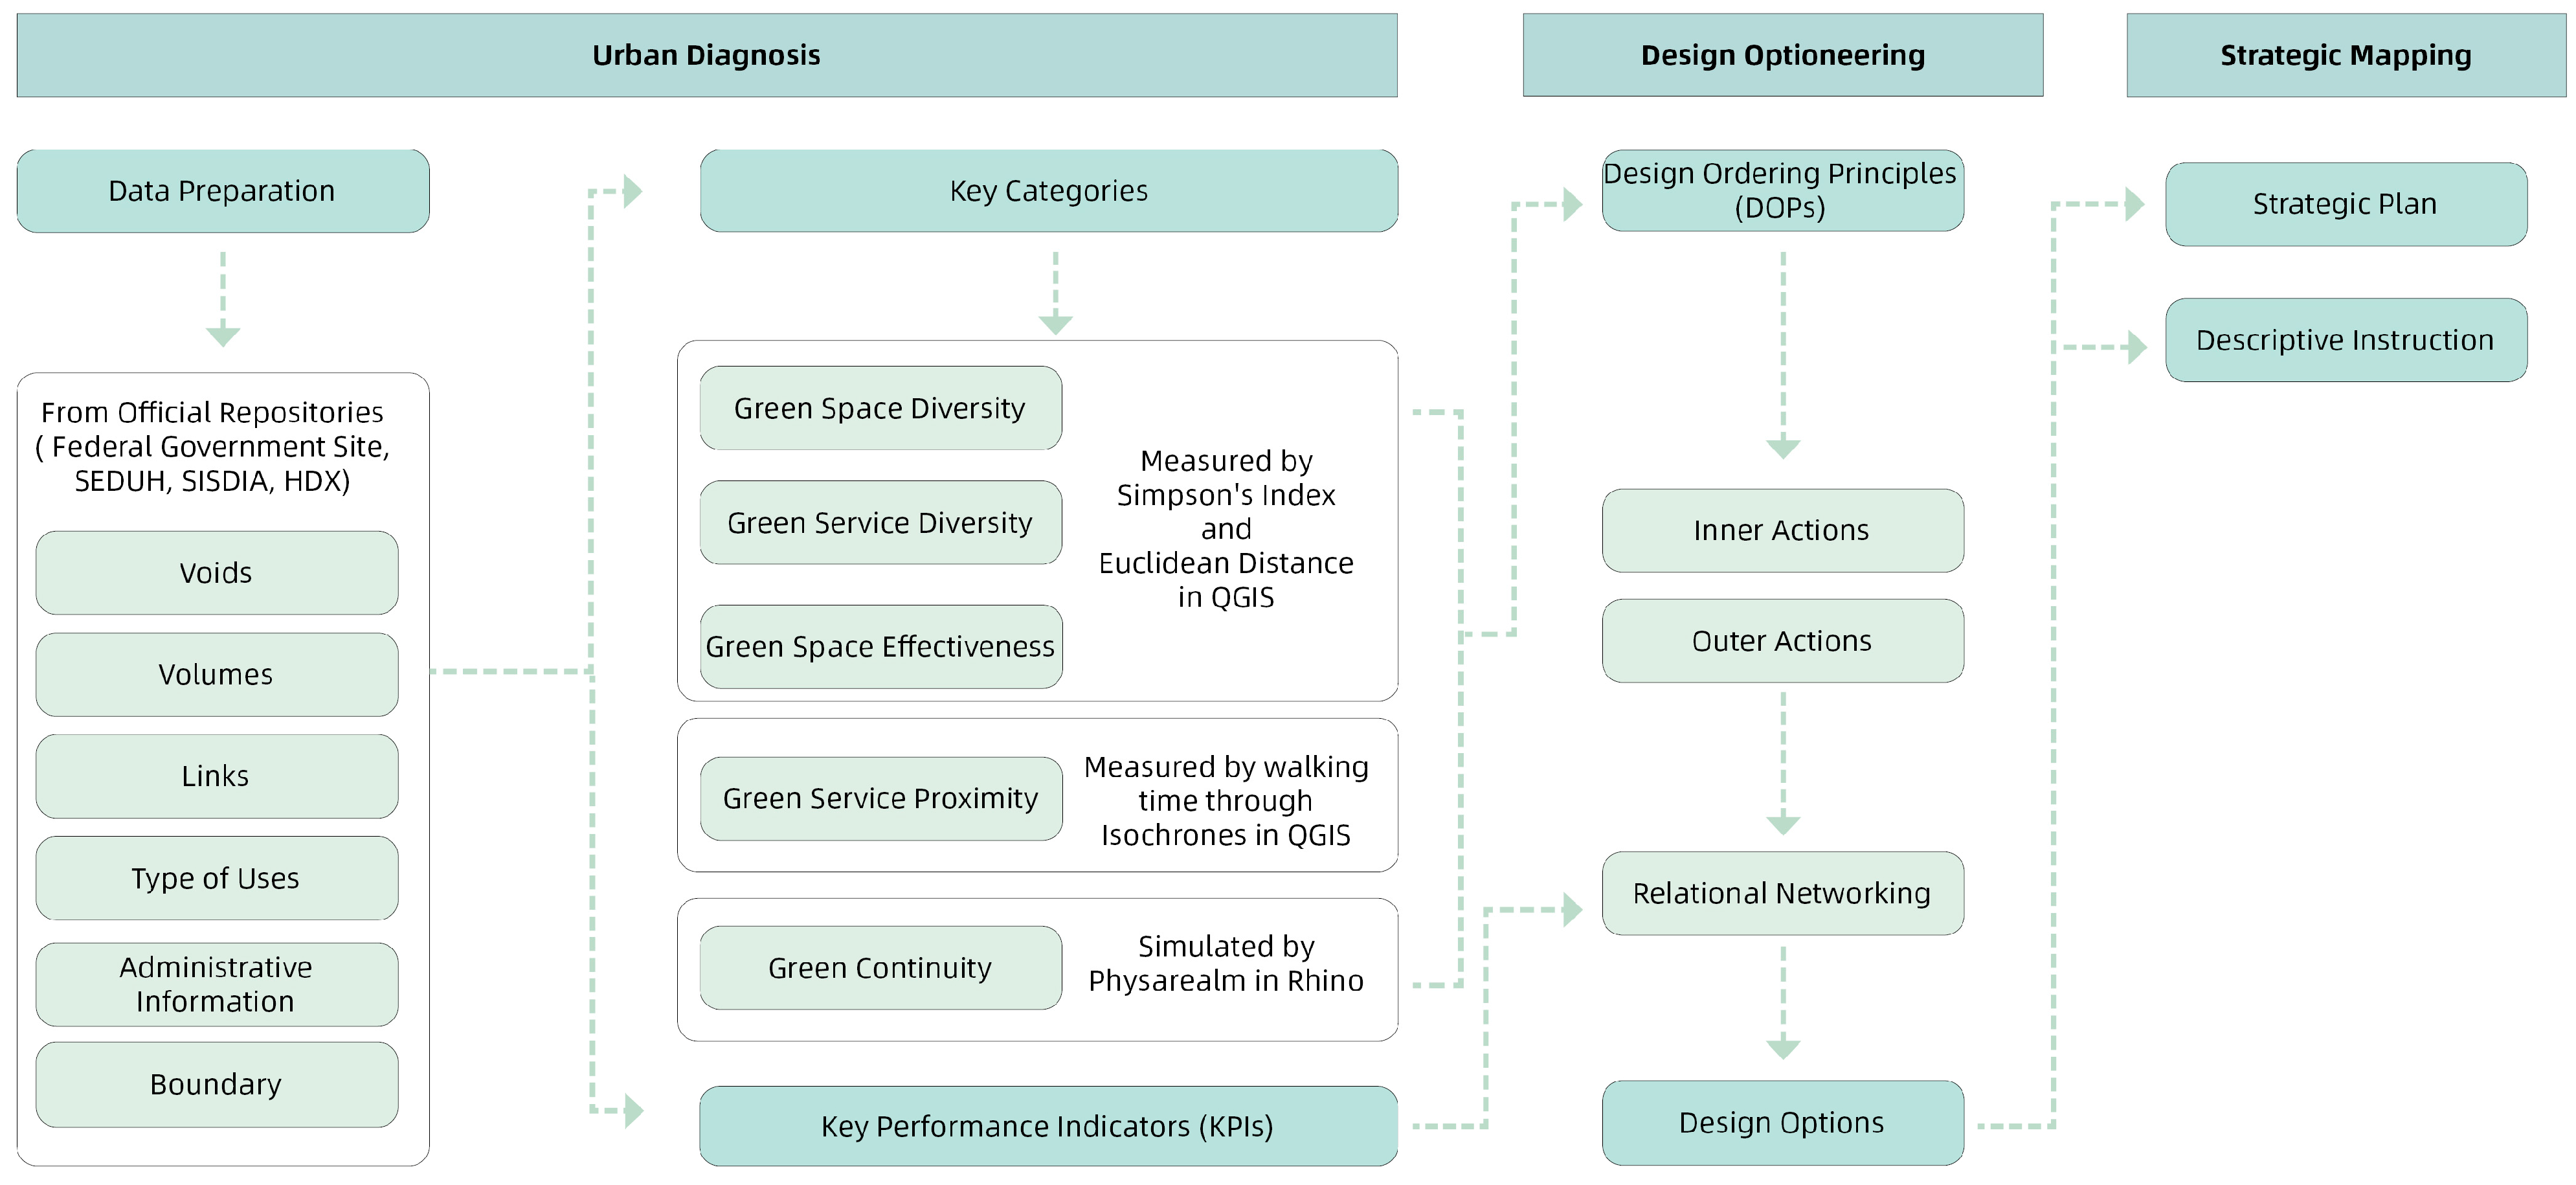
Figure 1. Methodological framework of IMM based on the Paranoá context.
Urbansci 09 00333 g001
Figure 2. The Entity-Relationship Schema of IMM, source: adapted from a previous publication co-authored by the authors Mohammad Zadeh, H. et al. (2024), A Conceptual Data Model for IMM: A Methodological Interpretation of Targets and Indicators in SDG11 [38].
Urbansci 09 00333 g002
Figure 3. Green Space Resource (a) and Urban Diversity Analysis (bd) in Paranoá.
Urbansci 09 00333 g003
Figure 4. Access inequality across green space types by GINI coefficient and Lorenz Curves. The light area represents the cumulative distribution of accessible green space across the population, while the dark area between the Lorenz curve and the diagonal indicates the degree of inequality used to compute the Gini coefficient.
Urbansci 09 00333 g004
Figure 5. Urban proximity analysis based on walking time to all kinds of green resources.
Urbansci 09 00333 g005
Figure 6. Green diversity analysis in Paranoá.
Urbansci 09 00333 g006
Figure 7. Green continuity analysis in Paranoá by Physarealm agent-based simulation.
Urbansci 09 00333 g007
Figure 8. NDVI of sample grids and area of green space within 500 m buffer zone.
Urbansci 09 00333 g008
Figure 9. Interlinkage of actions under DOPs.
Urbansci 09 00333 g009
Figure 10. Scenario simulation by IMM urban digital twin model.
Urbansci 09 00333 g010
Figure 11. Strategic map of synergistic interventions in Paranoá.
Urbansci 09 00333 g011
Table 1. Key performance indicators of Paranoá.
ClassificationIndicatorValue
1. Spatial Morphology and Use Diversity
Block Scale
(Structural Layer)
(a) Urban Built Footprint Density (%)35.52%
(b) Housing Density (%)14.86%
(c) Street Cover Ratio (%)18%
(d) Annual Solar Energy Potential (GWh)2965.27
(e) Block Density (%)12.24%
(f) Land Permeability (%)20.36%
(g) Number of Buildings per Hectare30
(h) Number of Inhabitants per Hectare 141
(i) Resident-to-Activity Ratio within 15 min Walk (person/activity)681
(j) Food Deserts in the Area35.76%
(k) Supermarkets in Local Area4
2. Green Infrastructure and Ecological Performance
District Scale
(Environmental Layer)
(a) Designated Conservation Areas under International, National Schemes (%)28.24%
(b) Vegetation Coverage (%)62.16%
(c) Tree Cover Ratio (%)2.98%
(d) Residents within 300 m of Park/Garden (%)98.99%
(e) Ecosystem Types in Resident Area5
(f) Lawn Cover Ratio (%)25.01%
3. Mobility and Access Infrastructure
District Scale
(Movement Layer)
(a) Biking Road Length per Capita (m/person)0.30
(b) Population with Walkable Access to Bike Trails (%)96.96%
(c) Residents within 15 min Walk to Public Transit (%)88.76%
(d) Residents within 2.5 min Walk to Public Transit (%)45.00%
(e) Length of Roads per capita (m/person)3.07
(f) Pedestrian-Accessible Street Ratio (%)80.17%
(g) Key Functions Within 2.5 min Walk from Residential Area39
Disclaimer/Publisher’s Note: The statements, opinions and data contained in all publications are solely those of the individual author(s) and contributor(s) and not of MDPI and/or the editor(s). MDPI and/or the editor(s) disclaim responsibility for any injury to people or property resulting from any ideas, methods, instructions or products referred to in the content.