Article

A Comparative Analysis of Circular Economy Index in Urban and Rural Municipalities

Faculty of Social Sciences, Riga Stradins University, Dzirciema Street 16, LV-1007 Riga, Latvia
*
Authors to whom correspondence should be addressed.
Urban Sci. 2025, 9(8), 321; https://doi.org/10.3390/urbansci9080321
Submission received: 10 July 2025 / Revised: 7 August 2025 / Accepted: 13 August 2025 / Published: 15 August 2025

Abstract

The transition to a circular economy (CE) is crucial to sustainable development, necessitating tailored assessment tools to measure circularity at various levels. Recent studies assessing the CE at the municipal level by using statistical data have highlighted the challenge of comparing indicators of differently populated and resourced areas. With existing methodologies, there remains a need for comprehensive approaches that integrate both qualitative and quantitative data to ensure fair and meaningful comparisons. In 2024, Latvia developed and conducted the first CE index at the municipal level. It was based on a self-assessment from municipal governments and citizens, with results calculated into a single index value and four category indices. By applying a mixed methods statistical analysis, this research aimed to compare CE performance, measured by the CE index, and selected socioeconomic and environmental variables between 7 cities and 36 counties or rural municipalities of Latvia. The research concluded that the CE performance is significantly shaped by socioeconomic and spatial factors, with population density and unemployment emerging as consistent predictors. Urban municipalities generally performed better, emphasizing the need for tailored, context-specific CE strategies.

1. Introduction

Comparative analyses of the CE index in urban and rural municipalities reveal notable differences in both performance and adoption of CE practices. Urban municipalities generally score higher on CE indices, driven by greater population density, industrial specialization, and proactive investment in CE infrastructure, as seen in studies from Sweden and Italy [1,2]. Larger cities tend to be more advanced in implementing CE strategies, particularly in areas like green enterprise, sustainable mobility, and energy, while smaller or rural municipalities often lag due to slower adoption and fewer resources [3,4,5,6]. However, some rural areas, when supported by tailored policies and local engagement, can perform well, especially if they leverage unique local assets or benefit from knowledge transfer and targeted incentives [2]. The literature emphasizes that both urban and rural areas require context-specific approaches: urban areas benefit from innovation and policy frameworks, while rural areas need strategies adapted to their built environment and resource availability [7,8]. Methodological frameworks and composite indicators, such as the Municipal Indicator of Circular Economy (MICE), help detect these patterns and guide local decision-making [2,9]. Overall, advancing the CE in both settings depends on aligning policies with local economic structures, fostering stakeholder involvement, and ensuring knowledge and resource sharing between high- and low-performing municipalities [10,11,12]. A CE index in urban and rural municipalities serves as a tool to measure and compare the efficiency of resource utilization, waste reduction, and overall sustainability practices in these different settings [13]. Municipalities play a crucial role in transitioning to a circular economy through policies affecting resource use, waste disposal, and material recovery [14].
Research on the CE index in urban vs. rural municipalities is a growing field, with recent studies highlighting both methodological advances and practical challenges. Key publications include a Swedish municipal assessment, showing variations in CE index scores linked to local economic factors [1], and the MICE study in Italy, demonstrating that urban municipalities adopt circular economy practices more readily than rural ones [2]. Research also points out a gap in the literature regarding rural areas, with new frameworks and tools being developed to adapt CE strategies to the unique context of rural municipalities [4]. Methodological frameworks for urban systems stress the importance of local stakeholder involvement and flexible, context-specific approaches to implementing CE strategies [9]. Systematic reviews further underscore the central role of cities in driving circularity but also note ongoing uncertainty and the need for innovation in policy and practice to bridge the urban–rural divide [15]. Overall, the field is moving toward more nuanced, data-driven comparisons and the development of adaptable tools to support CE transitions in diverse municipal contexts [16,17,18,19,20].
Other topical research focuses on the application of the CE principles within both urban and rural municipalities, emphasizing resource utilization and waste reductions [21,22,23]. Key publications explore sustainable value chains for end-of-life management, the progression of sustainable development goals in tourism, and visions for climate neutrality in European cities [24,25,26]. The implementation and assessment of the CE in urban and rural areas is marked by several controversial and diverging hypotheses, stemming from the concept’s inherent complexity and multifaceted nature. The three core themes and the subsequent thesis applicable to this research are summarized in Figure 1 and described below.
Regarding conceptual divergences in the CE, there are three key factors. The definition disputes surrounding the CE reflect deep-seated inconsistencies in how the concept is applied in academic and policy settings [15,27,28,29,30]. While some define CE narrowly as strategies focused on recycling and material recovery, others adopt a broader systems-based perspective that incorporates sustainable production, behavioural change, and circular design principles [27,29,31,32,33,34]. This leads to confusion and varied benchmarks for implementation. The paradigm status of the CE is also contested. Some proponents see it as a transformative alternative to the linear economic model that can enable sustainable development [28,30]. Others argue it is merely a repackaged version of existing environmental policies, lacking the radical shift needed to address systemic issues like overconsumption and inequality [29,35]. A third point of divergence concerns the social vs. environmental focus of the CE. Many existing frameworks privilege environmental and economic outcomes, such as reduced material use or increased efficiency, while neglecting social dimensions such as justice, equity, education, and community involvement [28,31,36]. This raises concerns about the inclusiveness and long-term viability of CE strategies, especially in diverse socio-spatial contexts.
Regarding implementation hypotheses, one of the core debates concerns the non-universality of CE models. Scholars emphasize that circular solutions cannot be applied uniformly across urban and rural areas [37]. Urban municipalities benefit from denser infrastructure, access to innovation, and economies of scale, while rural areas often lack the logistical and institutional capacity to support the same models [37,38]. This uneven distribution of resources leads to an urban-centric research bias, where most CE studies and pilot projects are developed in or for urban settings [15,28,33]. As a result, rural limitations remain underexplored [37]. These include lower recycling rates, fewer treatment facilities, limited public awareness, and a reliance on traditional waste practices such as burning or dumping [37,38]. Implementing a CE in rural areas often requires alternative strategies that account for dispersed populations and limited service networks [39,40]. Another layer of complexity is introduced by the top-down vs. bottom-up divide [29]. Some countries have imposed national CE strategies through top-down policy frameworks, often aligned with international or EU mandates [41]. In contrast, other regions, especially in Europe, adopt bottom-up models where local governments, civil society, and businesses collaboratively shape CE initiatives [42,43]. This divergence affects how adaptable and context-sensitive CE strategies can be [3].
Finally, there are significant disagreements on assessment and indicators to measure and monitor the CE transition effectively. One key issue is the metrics gap, where scholars point out that robust, consistent indicators for assessing CE, particularly at local or municipal levels, are lacking [13,27,29]. Many existing frameworks remain theoretical due to data unavailability or incompatibility with local governance structures [20,27,32]. Closely related is the overfocus on materials. Current assessments prioritize material flow analysis, waste management rates, and carbon emissions, but overlook less tangible but equally important factors like social participation, institutional readiness, and governance capacity [20,27,29,33,44]. This narrow scope contributes to a scale mismatch, where national-level indices cannot be meaningfully transferred to subnational levels due to missing localized data or unrepresentative indicators [33]. Another controversial area involves rebound risks, where increasing circularity may unintentionally cause environmental harm, such as through heightened energy use or shifts in consumption that negate material savings [20,33,45,46]. Finally, scholars highlight a persistent place-based oversight in CE measurement frameworks [27]. These often fail to consider spatial characteristics, such as land use or urban form, which influence the feasibility and impact of CE actions [47,48]. Ignoring these contextual factors reduces the practical relevance of CE assessments for regional and municipal decision-makers [49,50,51].
Despite the growing body of literature on CE practices, significant research gaps remain in understanding the uneven implementation and performance of CE strategies across urban and rural contexts, particularly at the municipal level. While comparative analyses and CE indices like MICE have highlighted differences between cities and smaller settlements, there is limited empirical research that quantitatively investigates the underlying socioeconomic and environmental drivers of CE performance in diverse territorial settings. Much of the existing work is either conceptual, focused on urban systems, or lacks localized data, leaving rural municipalities underrepresented and contextual influences underexplored. Moreover, current CE assessment tools often overlook place-based factors and rely heavily on material-centric indicators, failing to capture the full complexity of circular transitions. This study addresses these shortcomings by applying a newly developed CE index across Latvian municipalities and linking it to external contextual variables. In doing so, it contributes to closing the urban–rural knowledge gap, offers methodological advancement through multivariate analysis, and provides evidence-based insights for tailoring CE policies to local needs. Thus, it offers both topical relevance and novel analytical perspectives.
The main objective of this study is to examine the difference between urban and rural municipalities, based on the CE index scores, and to examine the socioeconomic and environmental factors that may influence the CE performance across Latvian municipalities. The CE index, developed through an original survey instrument [52], provides a comprehensive picture of how local governments manage and implement circularity principles. However, this research seeks to deepen the analysis by identifying external contextual drivers, such as population characteristics, economic development, and environmental indicators that may correlate with or predict CE performance.
To achieve the objective, the following research questions (RQ) were formulated:
  • RQ1: Are there statistically significant differences in CE index values between rural and urban municipalities?
  • RQ2: What is the nature and strength of the relationships between CE index values and selected socioeconomic and environmental factors?
  • RQ3: Which of these factors, if any, significantly predict CE index values in a multivariate model?
  • RQ4: Are there underlying dimensions or hidden patterns among the most relevant variables that could explain variance in CE performance across municipalities?
From the RQs, the main hypotheses (H) were derived:
  • H1: Urban municipalities score higher on the CE index than rural municipalities.
  • H2: Higher population density, higher GDP per capita, and lower unemployment are associated with higher CE index values.
  • H3: Lower GHG emissions per capita and a higher share of inventoried forest land are associated with higher CE index values.
  • H4: A smaller number of latent factors can explain the relationships between multiple variables and CE index values.

2. Materials and Methods

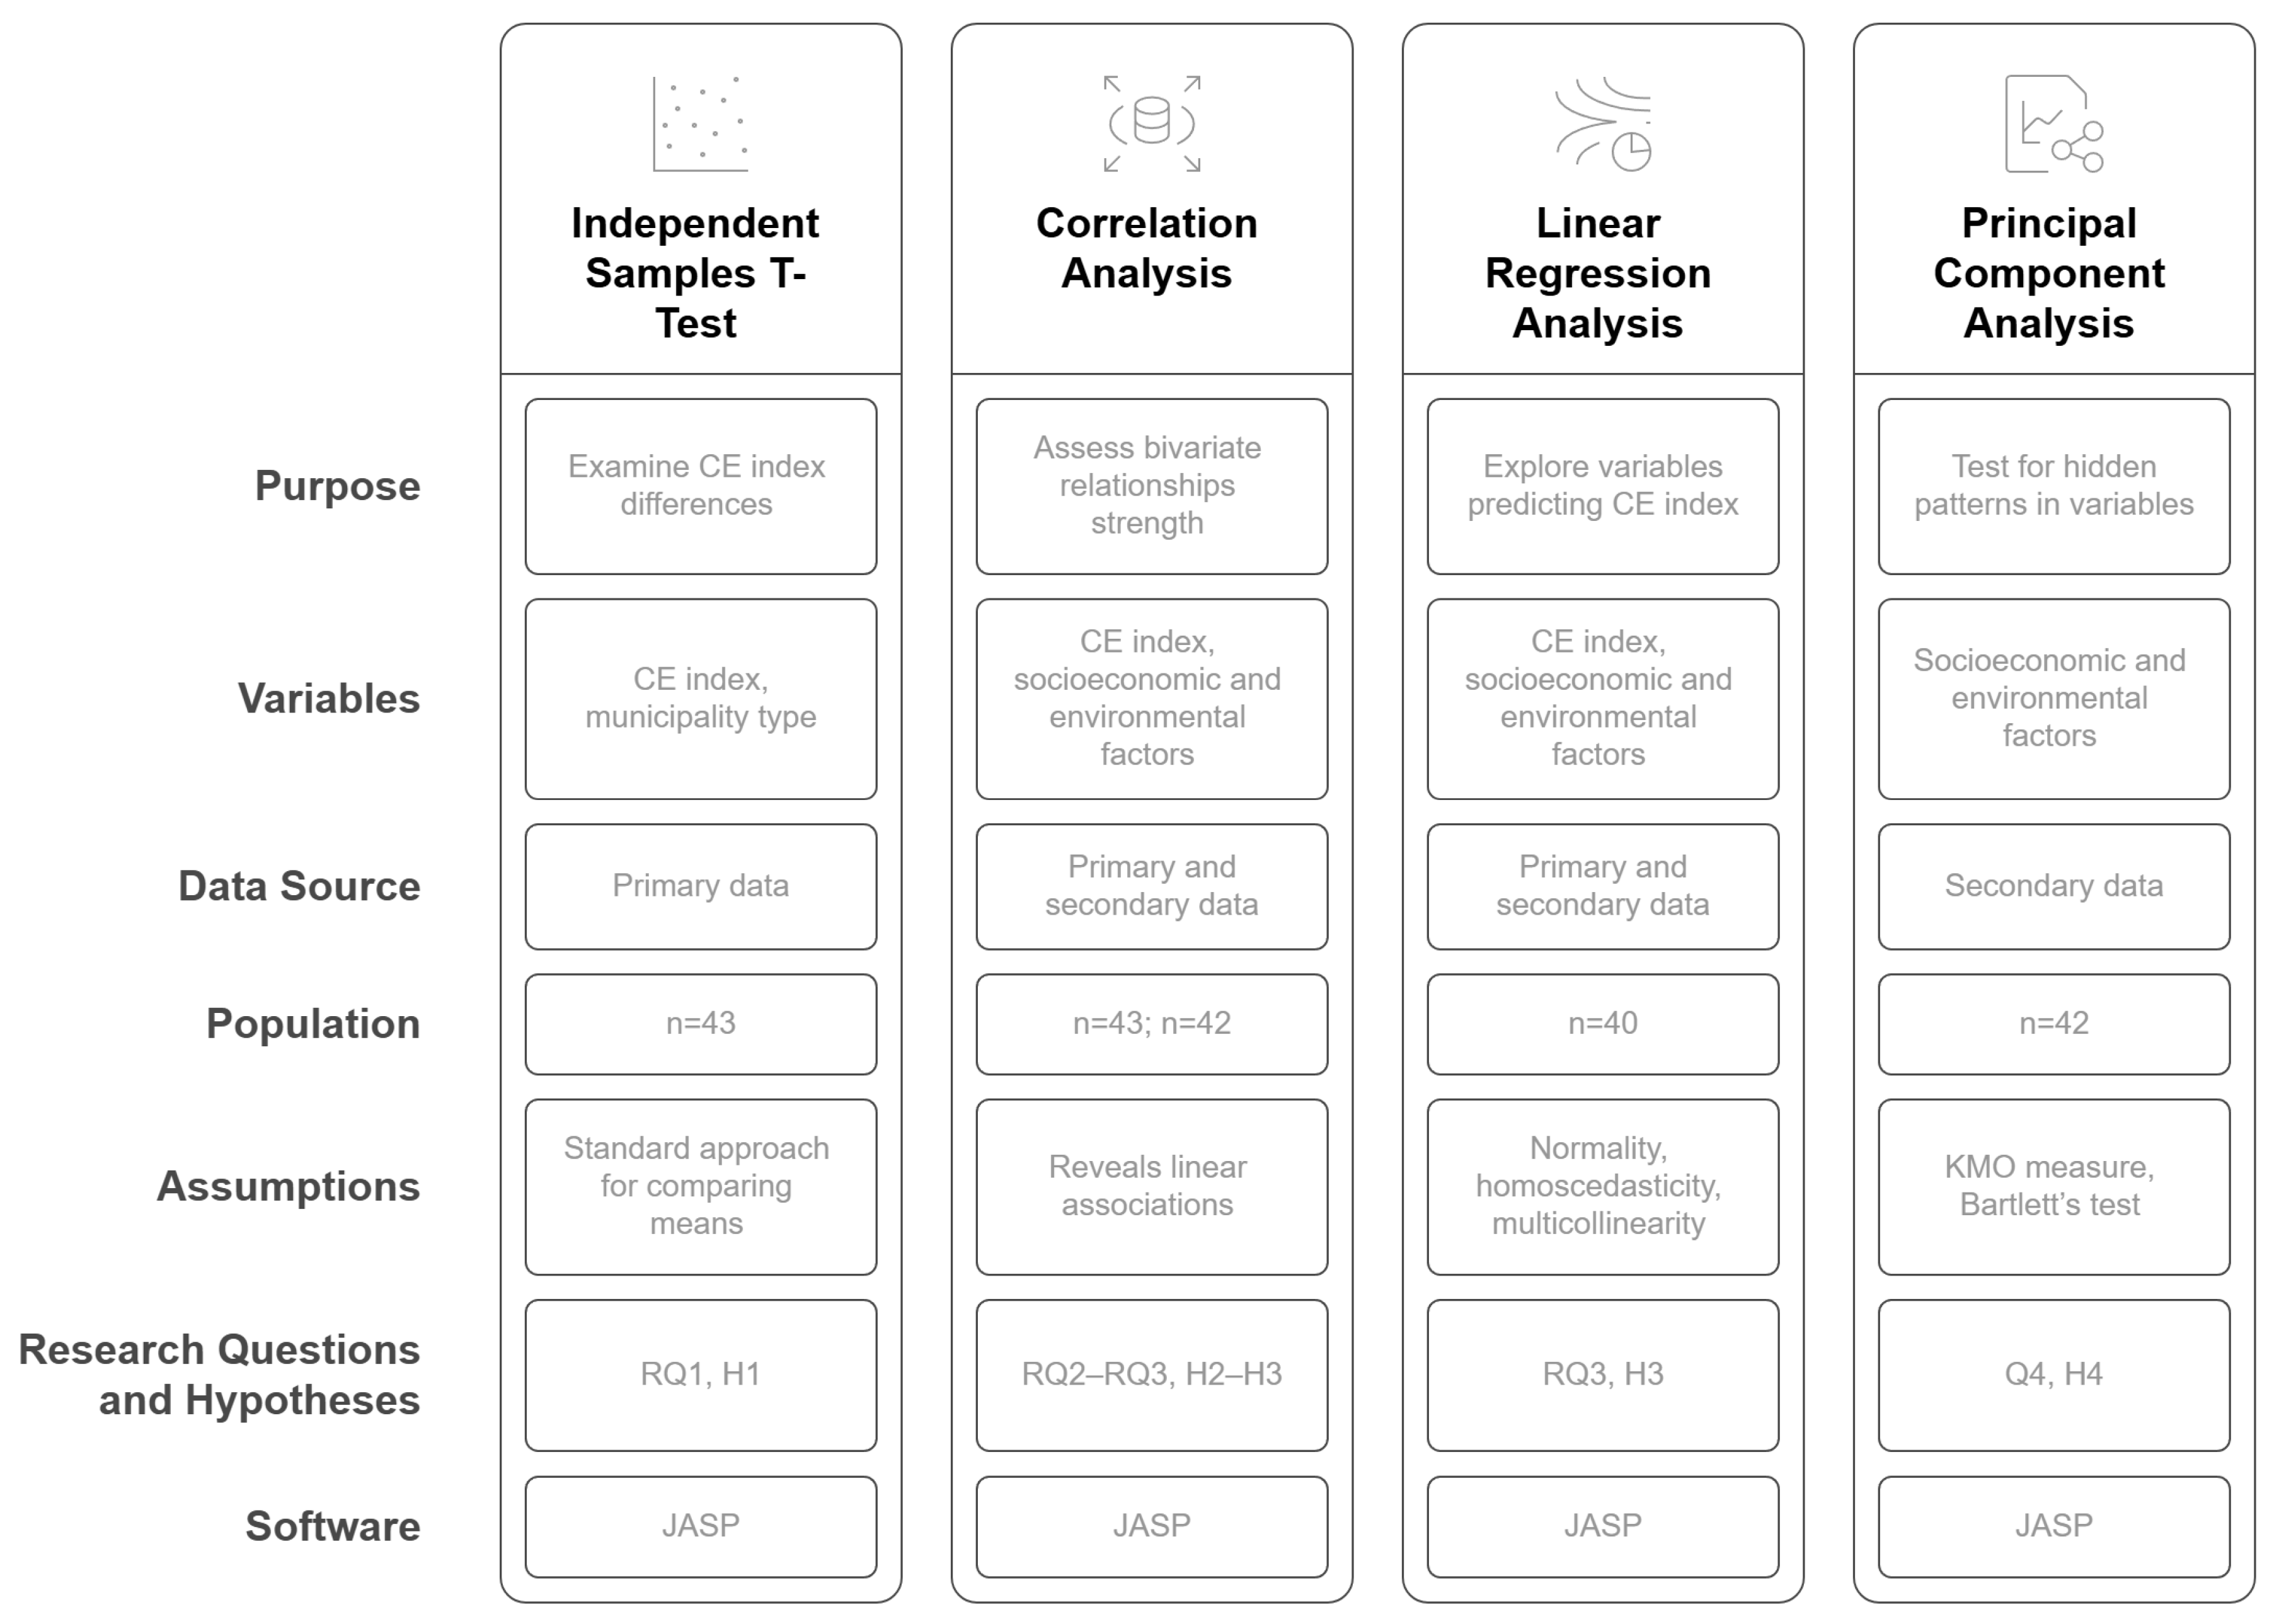
To address the research questions and test the proposed hypotheses, this study employed a quantitative research design combining survey-based CE index scores with secondary statistical indicators. A series of statistical methods was applied to examine differences, associations, and predictive patterns across municipalities. The overall research methodology is presented in Figure 2.
To investigate these research questions and test the hypotheses, a multi-method quantitative approach was applied:
  • Independent samples t-test (n = 43): to examine differences in CE index values between rural and urban municipalities (RQ1, H1). This method was selected as a standard approach for comparing means between two independent groups [53].
  • Correlation analysis (Pearson’s and Spearman’s) (n = 42 or n = 43): to assess the strength and direction of bivariate relationships between CE index values and six contextual variables: population density, GDP per capita, unemployment rate, municipal waste per capita, GHG emissions per capita, and share of inventoried forest land (RQ2RQ3, H2H3). This method helps to reveal linear associations between variables without causality [54].
  • Linear regression analysis (n = 40): to explore which variables significantly predict CE index values when controlling others and to estimate the overall explanatory power of the model (RQ3, H4) [55]. Assumptions regarding normality, homoscedasticity, multicollinearity, and independence of residuals were checked. The Durbin–Watson statistic was used to detect potential autocorrelation, which was minor but statistically significant and noted in the respective results sub-section.
  • Principal Component Analysis (PCA) (n = 42): to test whether the selected variables contain hidden patterns that represent distinct contextual dimensions of CE implementation (RQ4, H4). PCA is a dimension-reduction technique used to identify underlying constructs that summarize variance in the data—an increasingly common approach in sustainability research when variables are interrelated [56,57]. PCA was applied only after checking assumptions through the Kaiser–Meyer–Olkin (KMO) measure and Bartlett’s test of sphericity. It did not yield a statistically robust solution due to low sampling adequacy. Nevertheless, its brief application is discussed in the article to maintain transparency and to document the exploratory nature of this part of the research.
The research relies on two types of data sources:
  • Primary data: CE index values were developed through a structured survey instrument that assessed multiple dimensions of circularity within municipalities. The population consists of the overall CE index values and four sub-indices for all 43 municipalities of Latvia.
  • Secondary data: socioeconomic and environmental variables were retrieved from the Official Statistics of Latvia database [58]. These include data on population density, GDP per capita, unemployment rate, municipal waste generation per capita, share of inventoried forest area in total land, and GHG emissions per capita, all collected for the most recent year available (2022 or 2023, depending on the indicator). Exclusion of several anomalous data points is explained in the respective results sub-sections.
All statistical analyses were conducted using JASP (Version 0.95.0) [59], a free and open-source statistical software programme that supports reproducible research practices.
The selection of the five socioeconomic variables was guided by both theoretical relevance and empirical precedence in CE research:
  • Population density (population per km2) is used as a proxy for infrastructure concentration, shared services, and agglomeration economies that enhance resource efficiency and facilitate recycling and waste management networks. Urban scaling theory and studies on material flows show that higher density supports site reuse and reduced transport distances for waste processing facilities [60,61,62,63].
  • GDP per capita (EUR) reflects a municipality’s economic ability to invest in green infrastructure, eco-innovation, and circular business models. Studies across the EU have demonstrated a generally positive relationship between GDP per capita and both recycling performance and ecologically oriented innovation metrics [64,65,66,67,68].
  • Unemployment rate (%) captures socioeconomic stress, indicating how effectively labour is engaged in productive or green sectors. Lower unemployment may reflect institutional capacity and community resilience, both of which support CE initiatives, whereas high unemployment may indicate social fragmentation. Research on EU SMEs shows that green employment and environmental expertise are strongly associated with the adoption of resource efficiency practices [69,70,71].
  • Generated municipal waste per capita (t) is a direct and tangible measure of material throughput and efficiency that is the core dimension of the CE frameworks. Comparative panel studies in Lithuania and the EU reveal that declining per capita waste is associated with improved municipal waste management and alignment with climate-neutral goals [72,73,74].
  • Share of inventoried forests in total area (%) provides insight into natural capital, carbon sequestration capacity, and land use policy context. Although often treated as a static geographic attribute, municipalities influence forest outcomes through zoning, conservation, and resource management. Forests are recognized for carbon sequestration and are relevant to climate neutrality [75,76,77,78].
  • GHG emissions (kg of CO2 eq per capita) are a critical outcome metric for the CE, reflecting the goal of decoupling economic activity from carbon intensity. Studies from the Netherlands and Germany highlight the links between CE strategies—such as recycling, reuse, and waste prevention—and reductions in GHG emissions across industrial systems. This factor allows for the exploration of whether circularity-related indicators are associated with and can drive climate neutrality [79,80,81].
These indicators were chosen to capture a balance between social, economic, and environmental dimensions of circular performance at the municipal level.

3. Results

This section describes a brief review of the data points used in the analysis, as well as the detailed results of the statistical methods used in the research.

3.1. Data Review

The last reform of the administrative territory in Latvia was concluded in 2021. As a result of this reform, Latvia is split into seven state city governments and 36 municipality governments [82]. The geographical distribution of this population (n = 43) is shown in Figure 3.
For this research, the seven state city governments have been categorized as urban municipalities, and 36 municipality governments as rural municipalities. The binary classification of municipalities as “urban” or “rural” follows the national administrative structure. Below the level of these 43 municipalities, there is no policy power, independent governance, or nuanced statistical data to apply finer gradients.
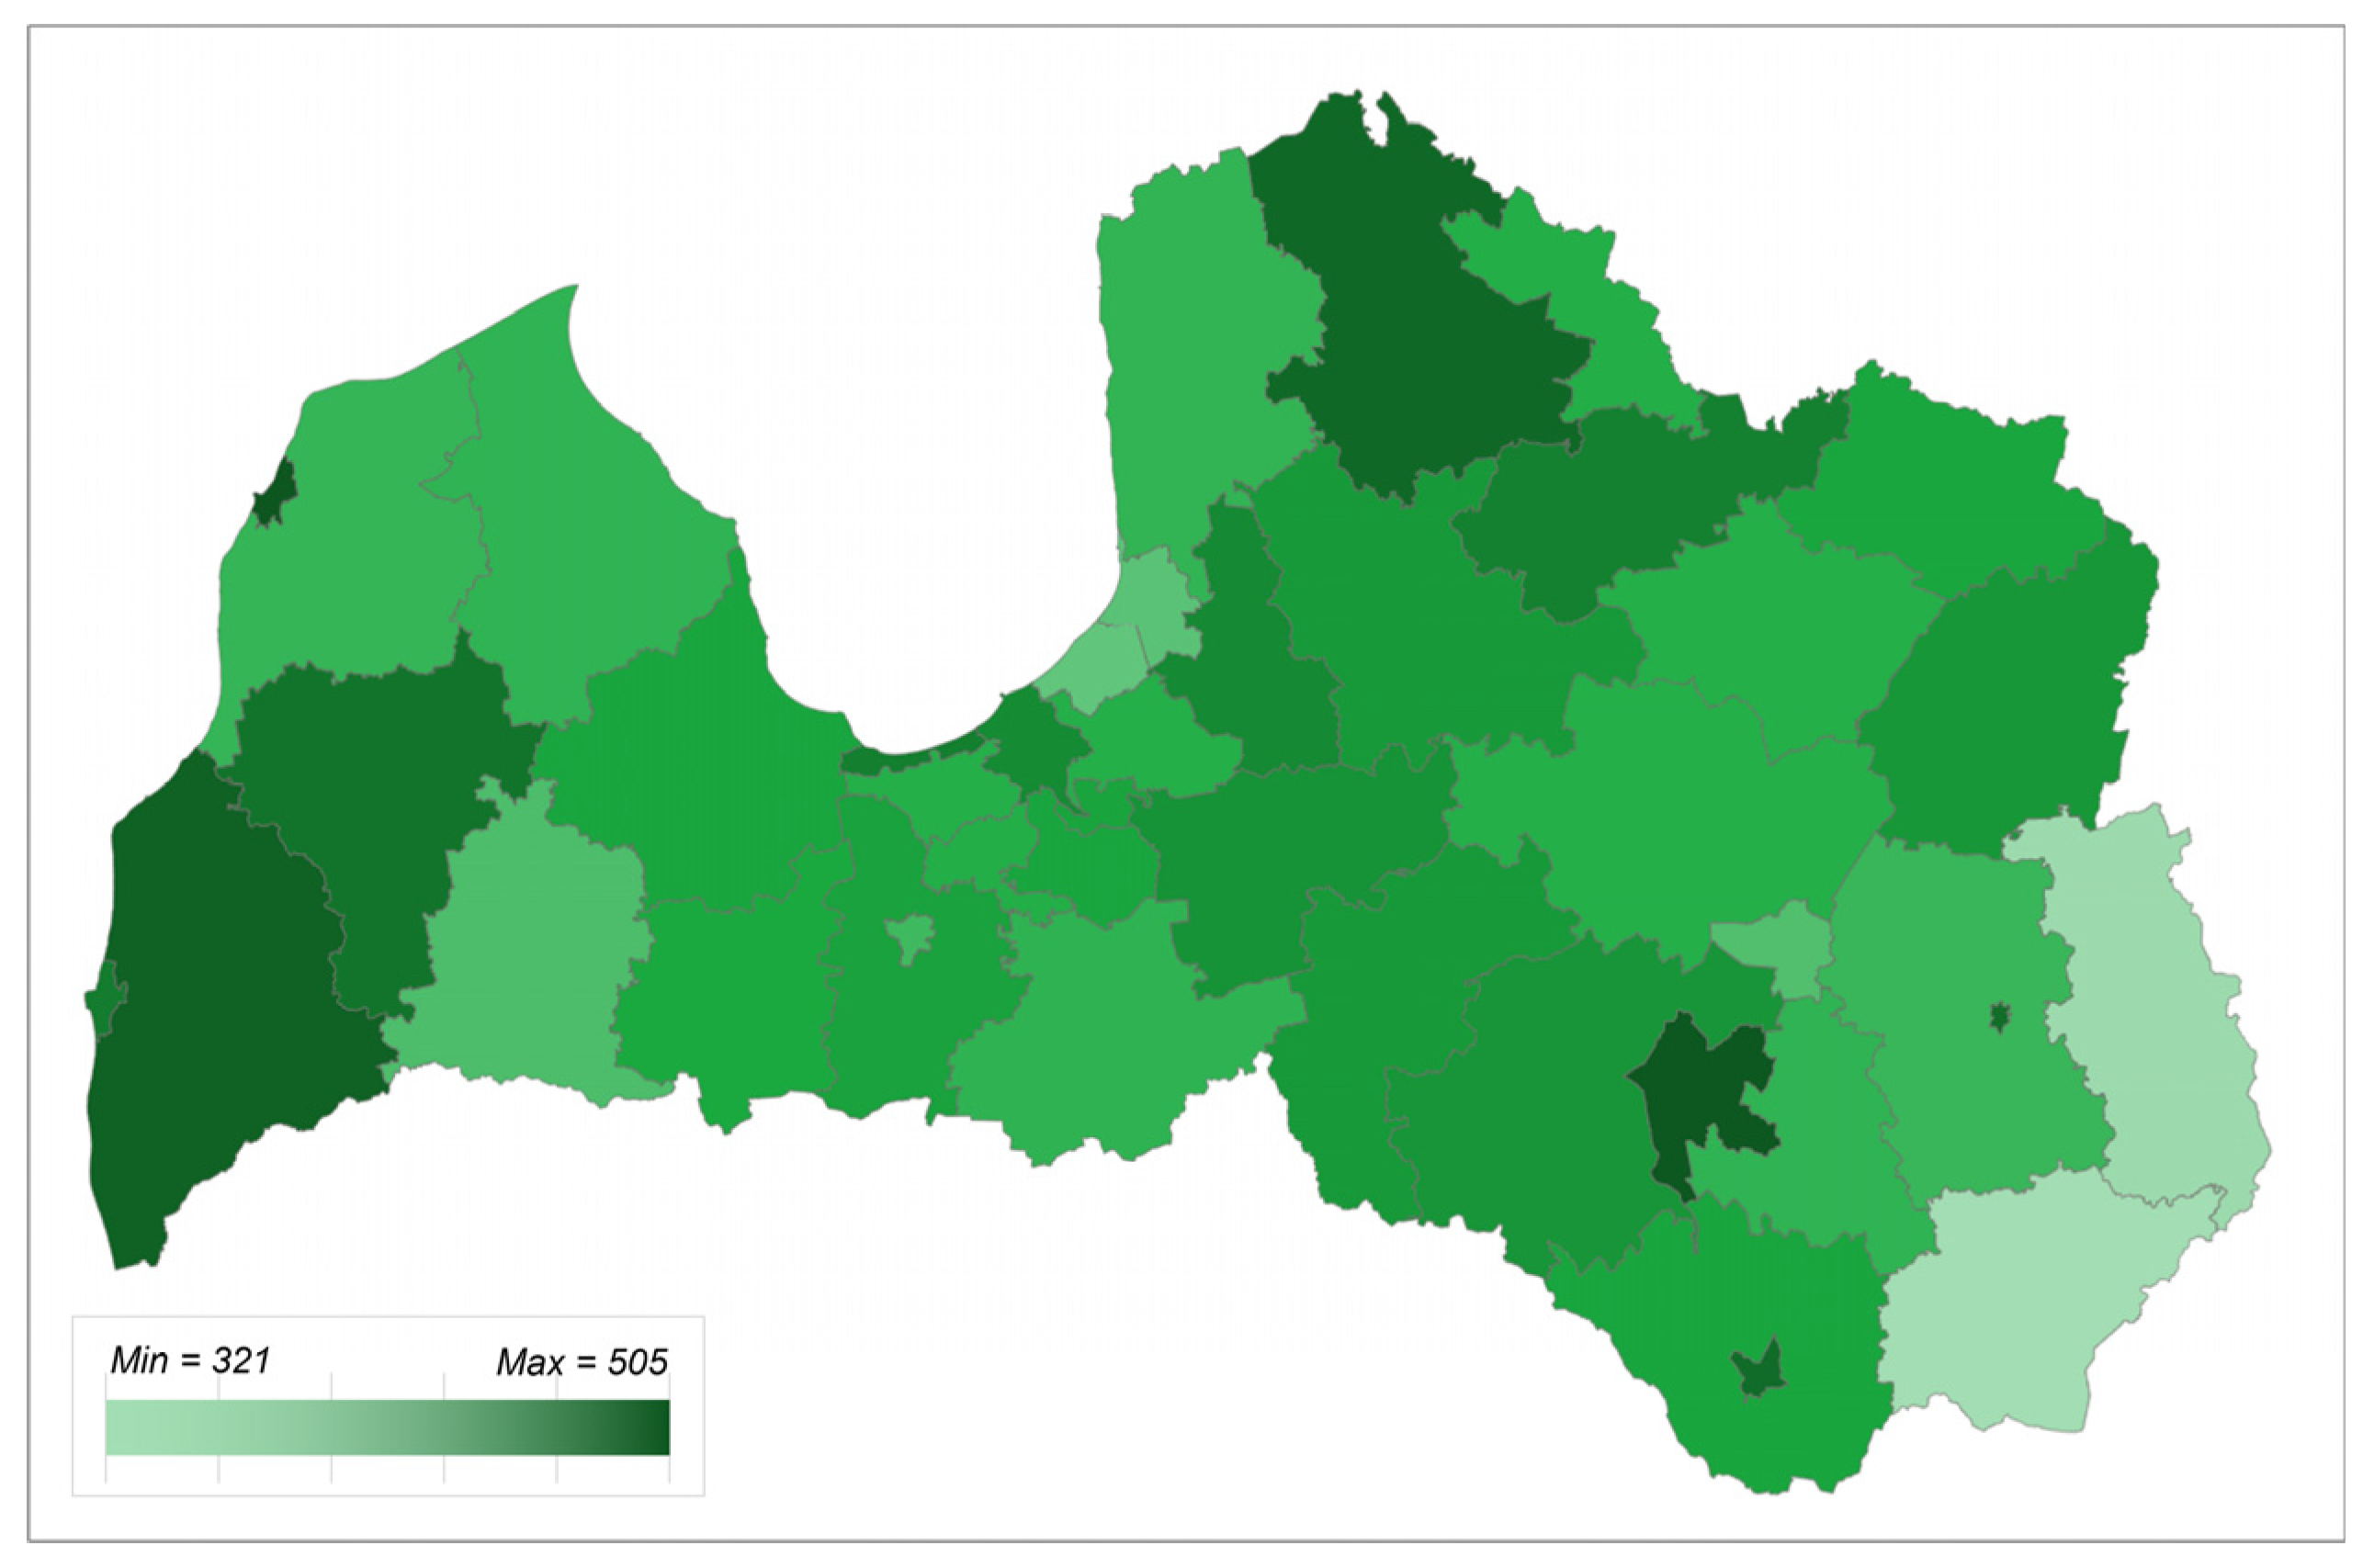
During the previous research project [52], CE index values were established across all 43 municipalities in Latvia and are visualized in Figure 4.
Although the maximal index value was 1000 points, the average result across all municipalities scored 422 points. The average index value amongst cities and rural municipalities was 461 and 415, respectively.
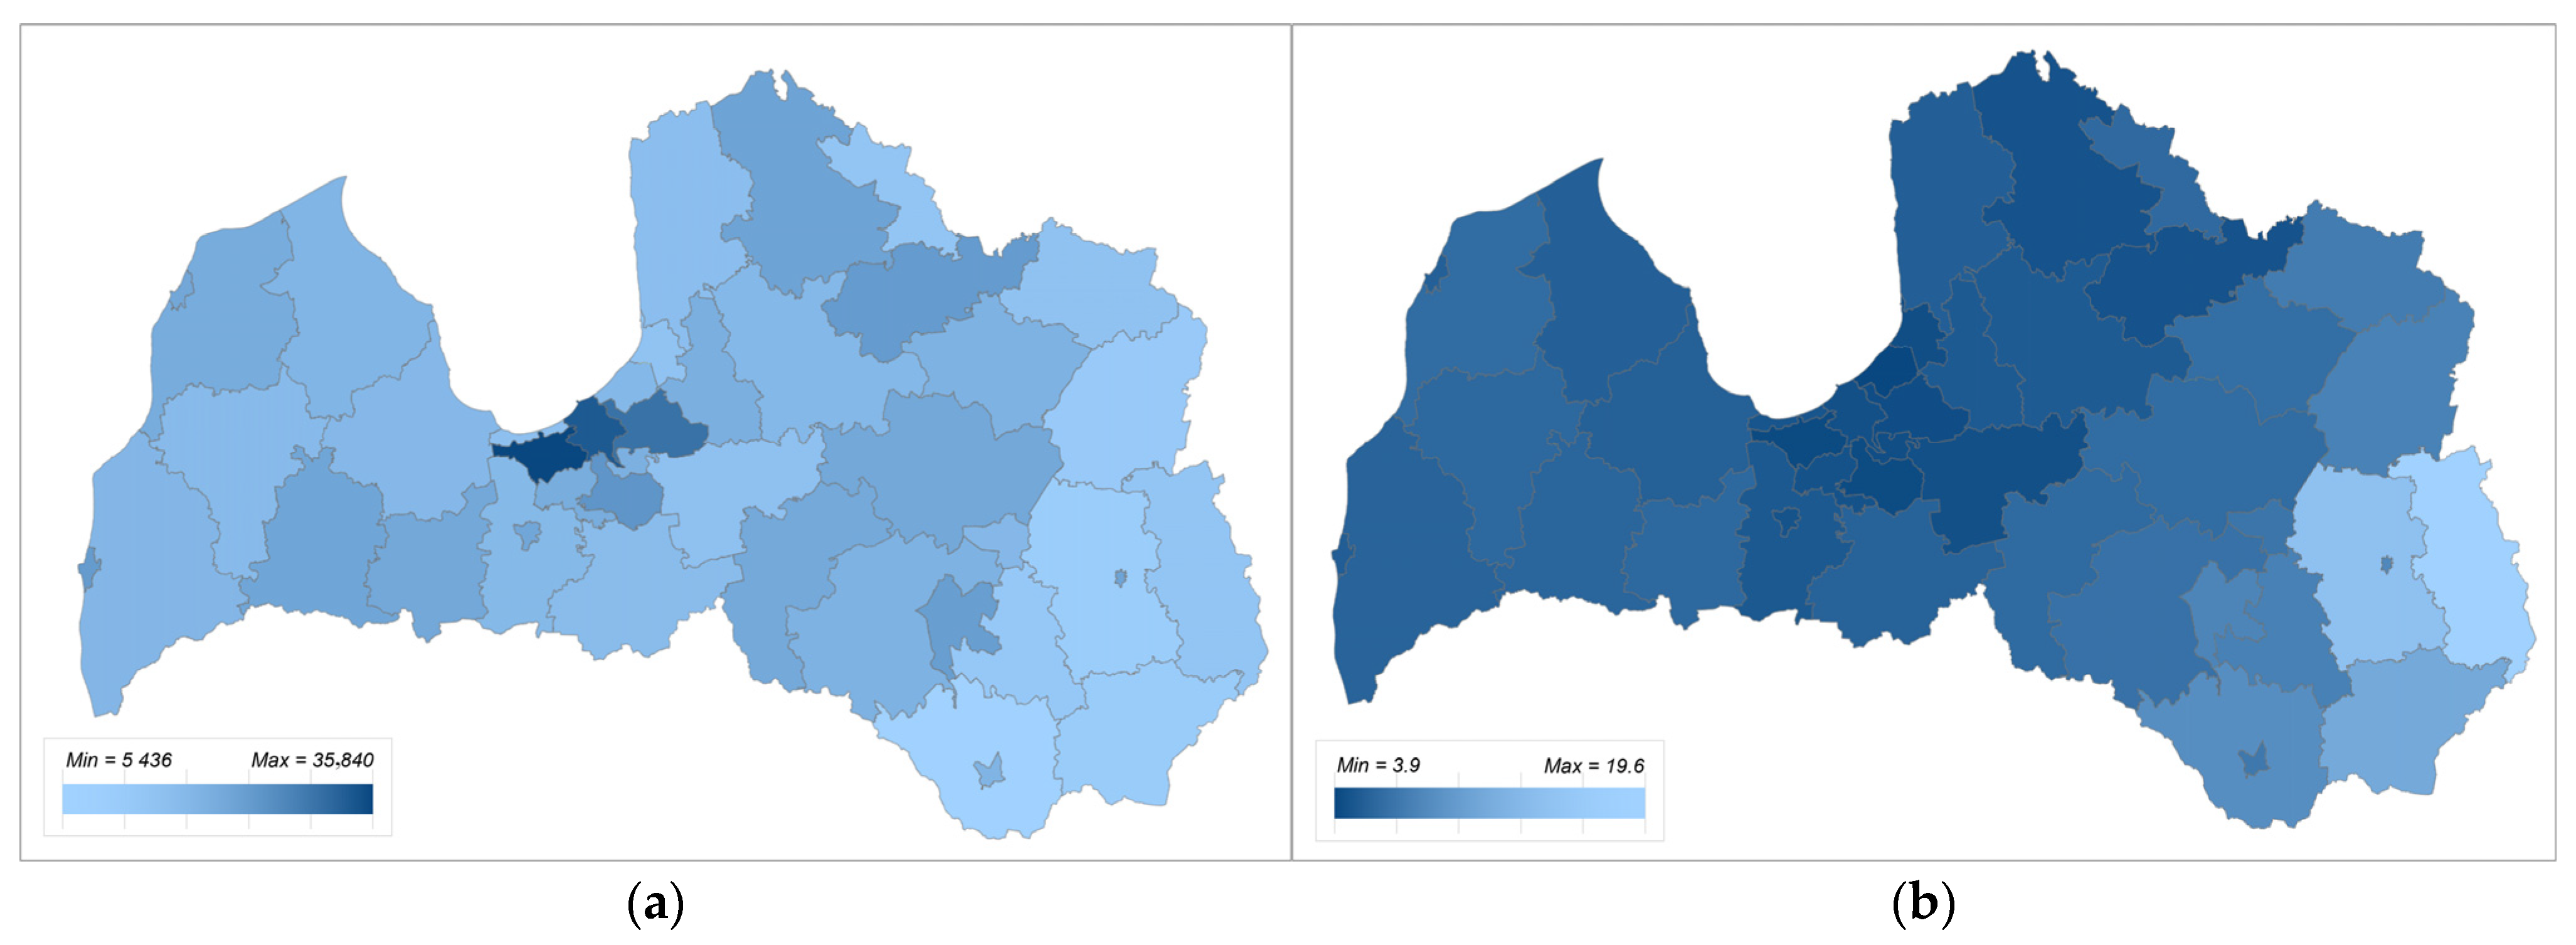
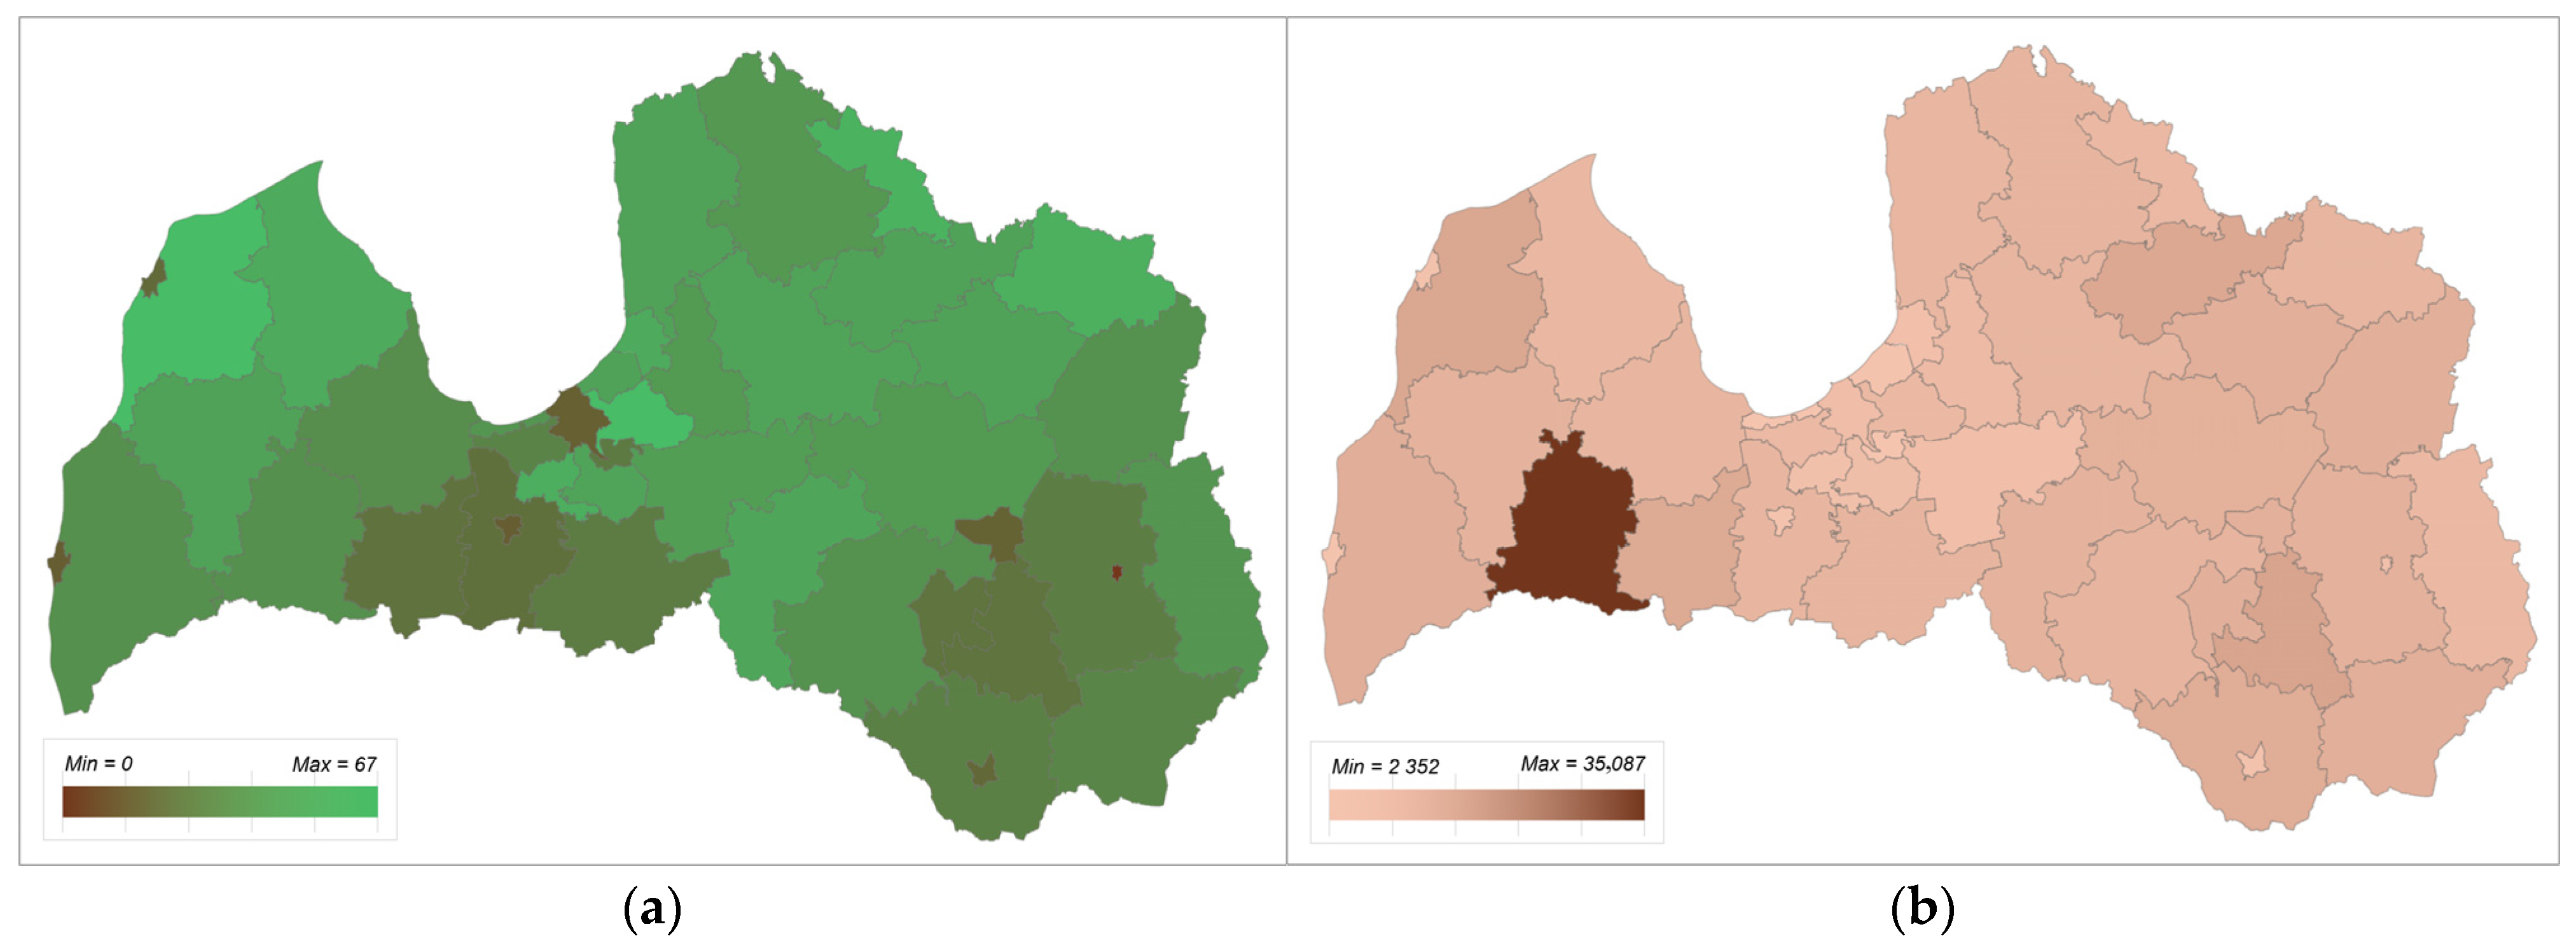
For the economic factors, the (Figure 5a) GDP per capita (EUR, 2022) [83] and (Figure 5b) unemployment rate (%, 2023) [84] data were used to map all 43 municipalities (see Figure 5). These maps serve to identify whether economic activity and labour market conditions are spatially concentrated or dispersed, and how they correspond to municipal classification.
These data points confirm that urban municipalities lead economically with the average GDP per capita of 16,462 EUR vs. 12,480 EUR in rural areas, and a lower unemployment rate (7.10% vs. 7.94%). This spatial pattern mirrors broader European trends, where major urban centres concentrate economic productivity and lower unemployment [85], reinforcing the urban–rural divide in Latvia.
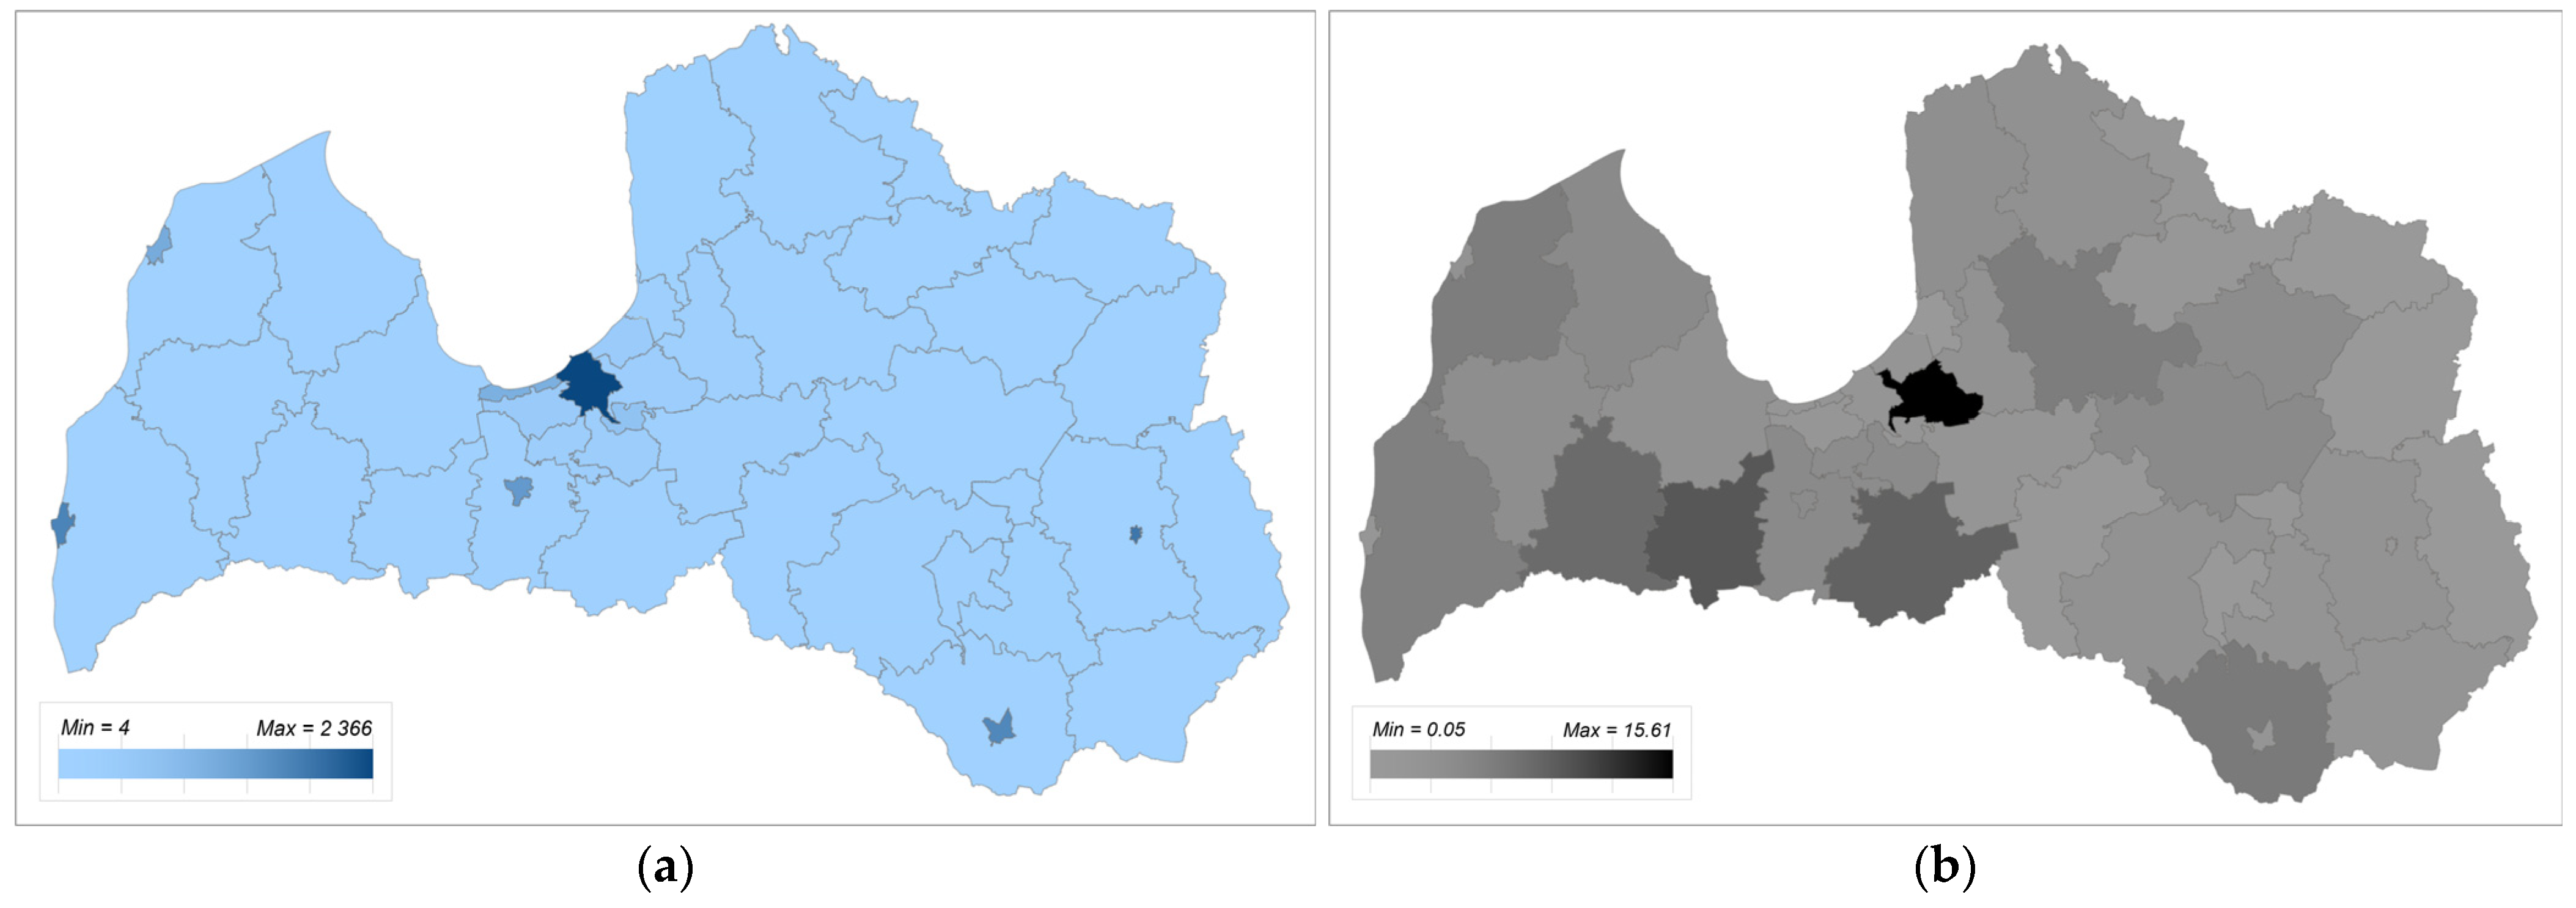
Relevant to the CE, (Figure 6a) population density per km2 (at the beginning of 2024, to retrospectively indicate the measure during 2023) [86] was selected for further analysis. To reflect on the environmental aspect of the CE, the (Figure 6b) generated municipal waste per capita was calculated by dividing the total generated municipal waste (t, 2023) [87] by the annual average population (2023) [88] in each municipality (see Figure 6).
In the urban municipalities, the population density (on average, 1240 people/km2) is significantly higher than in the rural areas (on average, 31 people/km2). However, the distribution of the generated municipal waste does not visually correlate with the population density in urban areas. The national average of 1.57 t of generated municipal waste in 2023 significantly exceeds the EU average of 0.51 t per person [89]. For the waste indicator, one rural municipality (Ropažu novads) has almost 10 times the amount of waste as the country’s average. This indicates a data allocation issue, as the largest landfill is located in this municipality.
For the environmental aspect and the effect of the CE on climate neutrality, (Figure 7a) share of inventoried forests in the total land area (2023) [90] and (Figure 7b) GHG emissions (kg of CO2 eq per capita, 2023) [91] were selected (see Figure 7). These factors allow us to explore the aspect of environmental outcomes and the land use patterns relative to the CE.
The average forest share in the total land in rural municipalities (47%) is significantly higher than in the urban municipalities (23%). The national average of 43% is slightly higher than the EU benchmark of 39% [92]. However, despite abundant forest cover, rural municipalities release higher GHG emissions per capita (6.7 t of CO2 eq per capita) than the urban areas (2.9 t of CO2 eq per capita). In contrast, urban emissions align closer to EU production-based norms. All municipalities are under the EU consumption-based average of 10.7 t CO2 eq [93]. This stark rural emissions profile suggests industrial operations, rather than population density, are the primary drivers in Latvia. For this factor, one rural municipality (Saldus municipality) stands out due to the leading building materials producer (cement, concrete, etc.) being located in this area. The highest total number of GHG emissions (t of CO2 eq) is produced in the capital city, Riga, but this rural municipality stands out in the per capita indicator due to having a lower population density.

3.2. Statistical Analysis

3.2.1. Independent Samples t-Test

To assess whether there were statistically significant differences in CE performance between urban and rural municipalities, a series of independent samples t-tests was conducted. The analysis compared the mean scores of the overall CE index as well as four CE sub-indices—Resource Management, Economic/Business Transformation, Public Engagement, and Efficient Management—between the two municipal types. The test was performed on the population (n = 43) consisting of 7 urban and 36 rural municipalities, with each municipality serving as a unit of analysis. The grouping variable was municipality type (urban vs. rural), and each CE index or sub-index was treated as a continuous dependent variable. Before running the tests, assumptions were assessed. Levene’s test for equality of variances indicated that the assumption of homogeneity of variances was met for all dependent variables (p > 0.05). Therefore, the standard Student’s t-test was used. A two-tailed alternative hypothesis was applied, testing for the presence of any statistically significant difference between the groups without assuming directionality. For the results, refer to Table 1.
The results of the independent samples t-tests revealed statistically significant differences between urban and rural municipalities across all CE indices. Urban municipalities scored significantly higher than rural ones on the overall CE index, t(41) = −2.865, p = 0.007, with a large effect size (Cohen’s d = −1.184). Similar patterns were observed across all four CE sub-indices. Specifically, urban municipalities demonstrated higher levels of Resource Management (t(41) = −2.602, p = 0.013, d = −1.075), Economic/Business Transformation (t(41) = −2.626, p = 0.012, d = −1.085), Public Engagement (t(41) = −2.356, p = 0.023, d = −0.973), and Efficient Management (t(41) = −2.790, p = 0.008, d = −1.152). According to Cohen’s guidelines [94], all effect sizes fall within the large range, suggesting meaningful differences in CE implementation between urban and rural contexts.
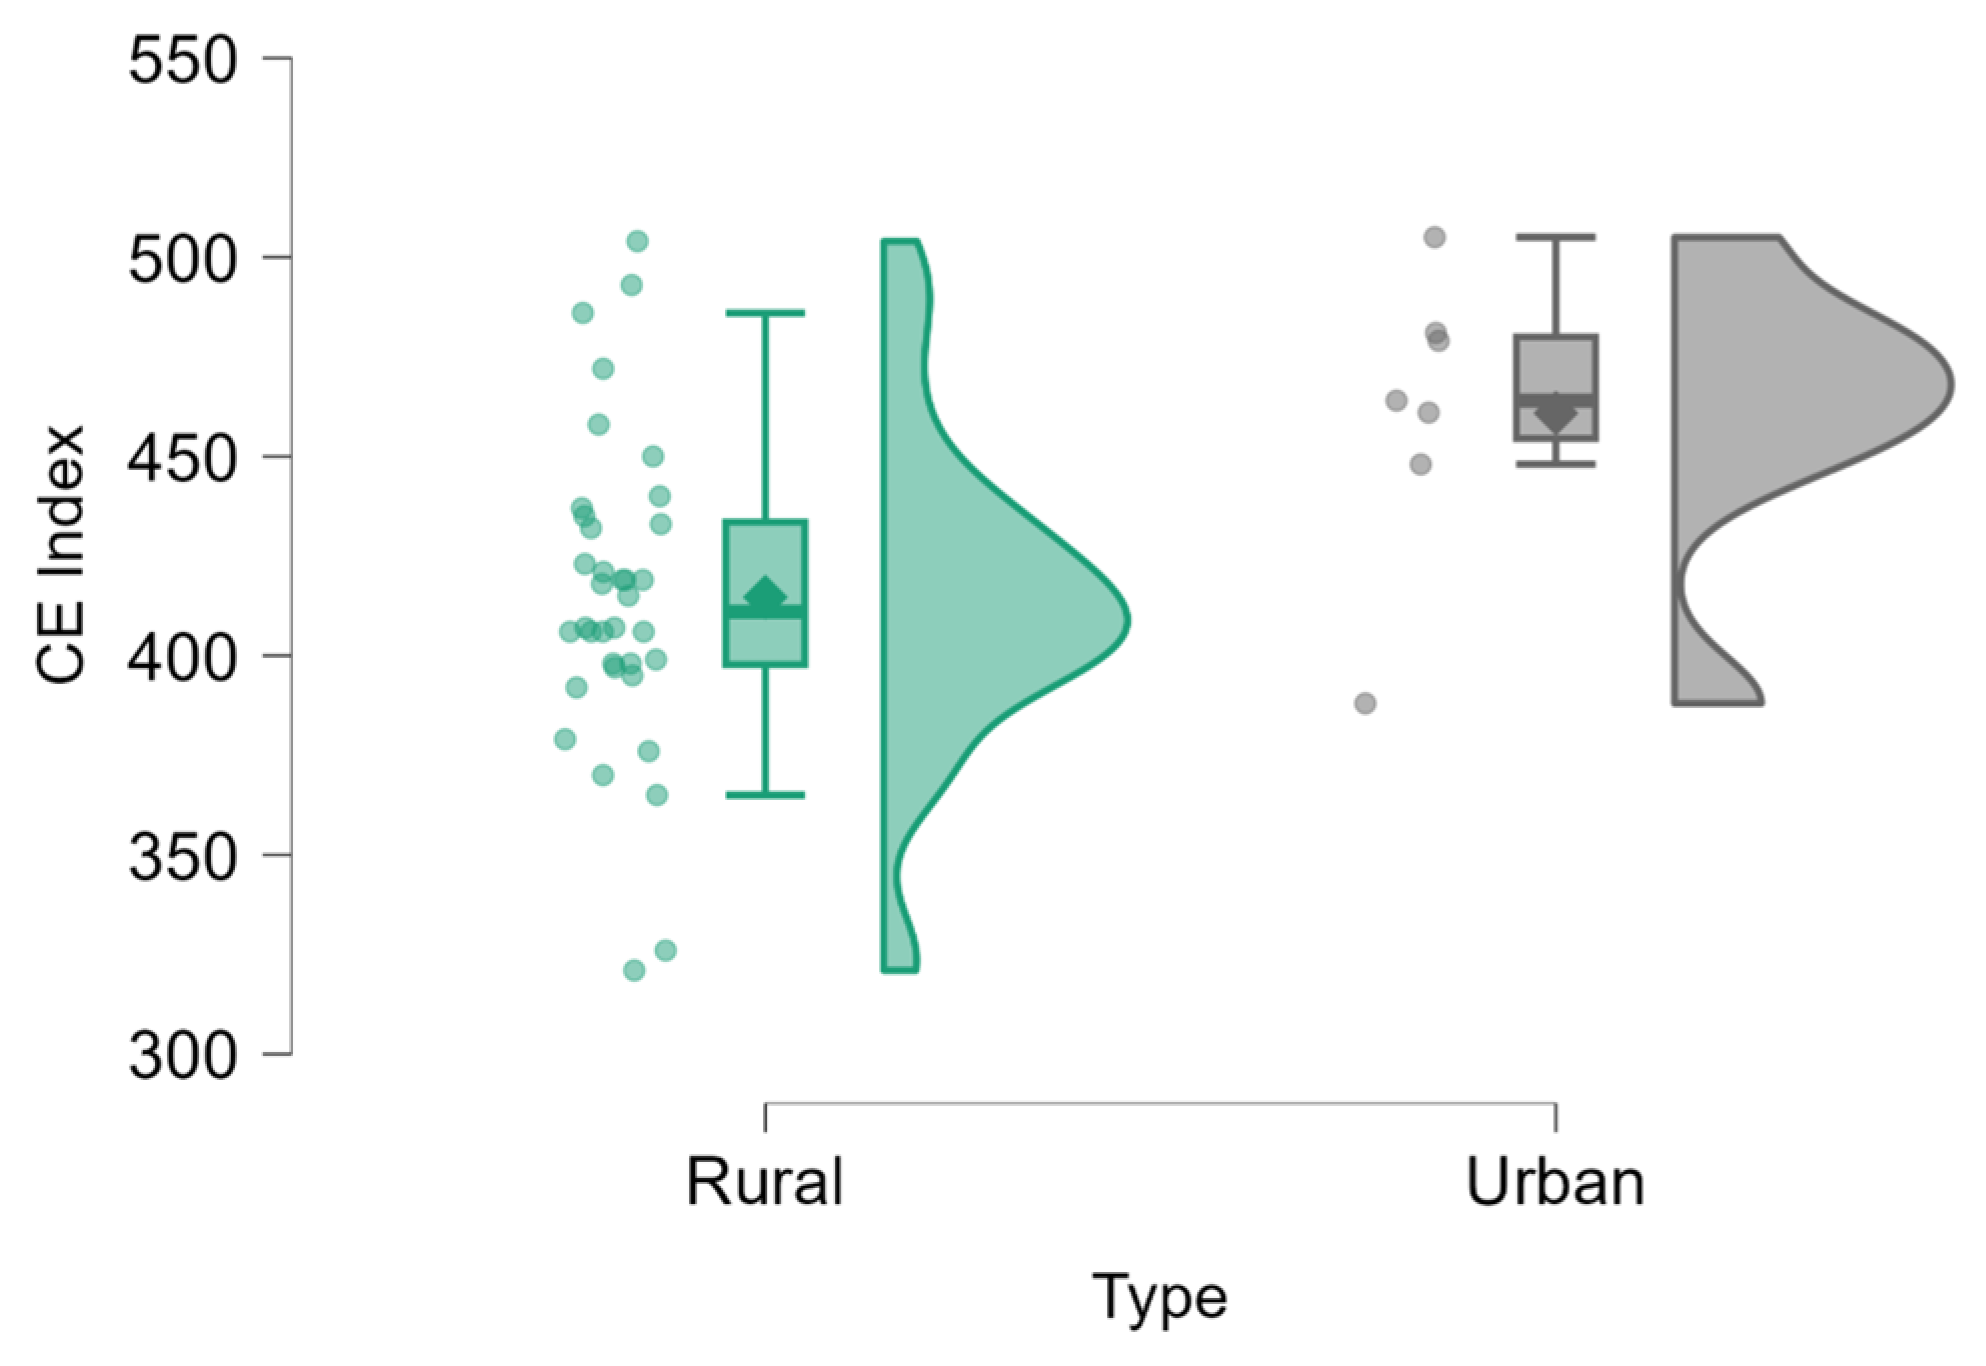
The raincloud plot (see Figure 8) shows the distribution of the overall CE index values compared between urban and rural municipalities.
The visual confirms that urban municipalities tend to show higher CE index scores than rural ones.

3.2.2. Correlation Analysis

To explore the relationships between CE implementation levels and socioeconomic indicators, a Pearson and Spearman correlation analysis was performed. The dependent variable was the overall CE index, and the independent variables included GDP per capita (EUR, 2022), unemployment rate (%, 2023), municipal waste generated per capita (t, 2023), share of inventoried forests in total land area (2023), and GHG emissions per capita (kg of CO2 equivalent, 2023). Pearson’s r was used to assess linear relationships, while Spearman’s rho was included as a non-parametric measure of rank–order correlation to account for potential non-linearity or outliers. Significance thresholds were set at p < 0.05, p < 0.01, and p < 0.001. One municipality was excluded from the waste factor and one for the GHG-related variable due to anomalous data linked to infrastructure and potential distortion of the results (e.g., a national landfill and cement production facility), reducing the number of observations for those comparisons to 42. All correlations were calculated across the full sample of 43 municipalities, irrespective of type (urban or rural), to maximize statistical power. Results are displayed in Table 2.
In the full sample of municipalities (n = 43), the correlation between CE index values and population density was moderate and statistically significant, providing one of the more robust associations in the analysis. Pearson’s correlation was r = 0.344 (p = 0.024), indicating a moderate positive linear relationship, while Spearman’s rank correlation was slightly lower but still significant at ρ = 0.311 (p = 0.042). These results suggest that municipalities with higher population density tend to perform better in terms of CE implementation. This finding is consistent with the existing literature and policy assumptions that more densely populated areas often benefit from greater economies of scale, infrastructure availability, public service integration, and citizen engagement—all of which are conducive to CE practices. Additionally, dense urban environments may foster innovation ecosystems and shorter material loops, further strengthening their CE capacity. However, this correlation also reflects the structural differences between urban and rural municipalities in terms of administrative resources and institutional capacity.
The correlation analysis between the CE index and GDP per capita revealed a weak-to-moderate positive association. While Pearson’s correlation coefficient was r = 0.220 (p = 0.157), suggesting a nonsignificant linear relationship, Spearman’s rank correlation coefficient was ρ = 0.334, which reached statistical significance (p = 0.029). This indicates that although the exact linear increase in CE index values with rising GDP per capita may not be strong, there is a clear and consistent monotonic trend: municipalities with higher economic output tend to rank higher in terms of CE implementation. This aligns with broader theoretical expectations that economic resources can support infrastructure, innovation, and policy adoption relevant to circular economy practices.
The relationship between the CE index and the unemployment rate was weaker and more nuanced. Pearson’s correlation was r = −0.285 with a p-value of 0.064, suggesting a moderate negative linear trend that narrowly misses the conventional threshold for statistical significance. However, the Spearman correlation was much weaker at ρ = −0.071 (p = 0.652), indicating no significant monotonic relationship. These results imply that while higher unemployment may slightly correlate with lower CE performance in some municipalities, the overall pattern is inconsistent and likely influenced by other structural or contextual variables. (There is a potential weak negative linear association—i.e., higher unemployment might correlate with lower CE scores, but the effect is borderline and not strong enough to conclude confidently.)
The analysis of municipal waste generation per capita relative to the CE index values yielded no significant findings. Pearson’s correlation was r = −0.105 (p = 0.507), and Spearman’s was similarly low at ρ = −0.085 (p = 0.593). These weak and nonsignificant correlations suggest that there is no meaningful association between the quantity of waste generated per person and the level of CE implementation as measured by the index.
The correlation between forest cover and CE index was negative, with Pearson’s r = −0.256 (p = 0.097), supported by the Spearman correlation (ρ = −0.220, p = 0.155), though with a weaker effect size and significance. While this result does not meet the conventional threshold for statistical significance (p < 0.05), it suggests a modest inverse relationship, i.e., municipalities with a higher share of forest land tend to have lower CE index scores.
Similarly, the correlation between CE index values and GHG emissions per capita did not yield statistically significant results. The Pearson correlation was r = −0.122 (p = 0.440), and Spearman’s ρ = −0.118 (p = 0.456). These findings suggest that municipal-level GHG emissions are not clearly linked to the extent of CE practices, at least in the current state of implementation.
Since the sample of urban municipalities in this study is limited (n = 7), statistical analyses on this subgroup are vulnerable to instability and prone to the risk of overinterpreting weak or unstable patterns. Therefore, a separate correlation analysis was conducted exclusively on rural municipalities (n = 36) to ensure greater reliability and to explore more generalizable patterns of association between CE implementation and socioeconomic characteristics in the rural context (see Table 3). This focus is also justified by the fact that rural municipalities constitute the majority of the sample and often face distinct resource and policy challenges in transitioning to circular economy practices [11,95].
The analysis showed no significant relationship between population density and the CE index in the subgroup of rural municipalities. Pearson’s correlation was weak and negative (r = −0.051, p = 0.766), while Spearman’s rank correlation was slightly positive (ρ = 0.111, p = 0.521), indicating no consistent linear or monotonic relationship. Compared to the full sample, where population density had a significant positive association with the CE index, this finding suggests that density is not a key factor influencing CE development in rural areas.
For rural municipalities, GDP per capita showed a positive but nonsignificant association with the CE index. Pearson’s r = 0.196 (p = 0.251) and Spearman’s ρ = 0.297 (p = 0.079) both suggest a trend where higher-income rural areas may perform better in a CE, although the relationship is not statistically robust. In the full dataset, this association reached significance at the non-parametric level, indicating a slightly stronger link when urban areas are included.
A significant negative Pearson correlation was observed between the unemployment rate and CE index in rural areas (r = −0.356, p = 0.033), while Spearman’s ρ was weaker and nonsignificant (−0.144, p = 0.401). This suggests that higher levels of unemployment may be associated with lower CE performance, with a stronger effect seen in linear (parametric) terms. Compared to the full sample, where the negative trend was borderline significant, this finding reinforces the idea that labour market health is a more influential driver in rural CE transitions.
No meaningful correlation was found between waste generation per capita and the CE index in rural municipalities (Pearson’s r = −0.006, p = 0.974; Spearman’s ρ = 0.029, p = 0.869). The relationship is essentially nonexistent, echoing the full sample’s result, where no significant trend was detected. This confirms that the quantity of waste alone is not a reliable indicator of CE maturity at the local level.
In the rural-only subsample (n = 36), this relationship between forest cover and CE index disappears entirely, with virtually zero correlation (r = −0.006, p = 0.972). This suggests that the inverse trend observed in the full sample may be driven by urban–rural contrast, rather than within-group variation.
The relationship between per capita GHG emissions and CE index in rural areas was weak and nonsignificant (Pearson’s r = 0.153, p = 0.379; Spearman’s ρ = 0.096, p = 0.581). Interestingly, this weak positive trend contrasts slightly with the negative but also nonsignificant direction observed in the full sample. It suggests that in rural areas, emissions levels may not align well with circularity progress, potentially due to agriculture- or industry-specific emission patterns unrelated to CE.
Focusing on the rural subset allows the identification of factors that matter more or less in dispersed, lower density, often economically disadvantaged contexts. Compared to the full sample analysis, it reveals that unemployment plays a clearer role, while population density and GDP become less predictive.

3.2.3. Regression Analysis

To examine whether the selected socioeconomic variables can predict the CE index across municipalities, multiple linear regression analysis was performed to quantify the individual effect of each variable, to determine how well all variables together explain variations in the CE index, and to assess which predictors are statistically significant.
A multiple linear regression analysis was conducted to assess the extent to which selected socioeconomic and environmental factors predict the CE index across 41 municipalities that have a full dataset on all five covariates of population density, GDP per capita, unemployment rate, municipal waste generated per capita, and GHG emissions per capita. A summary of the results is included in Table 4.
The overall model was not statistically significant at the 0.05 level, F(6, 34) = 1.832, p = 0.122, although it explained 24.4% of the variance in the CE index (adjusted R2 = 0.111). This suggests that, collectively, the selected variables provide limited explanatory power for differences in municipal CE performance. However, one individual predictor reached the threshold of statistical significance, and another showed a moderate effect, which may warrant further exploration:
  • Unemployment rate was negatively associated with the CE index (β = −0.455, p = 0.050), indicating that higher unemployment corresponds to lower CE performance. This finding supports the interpretation that socioeconomic vulnerability may hinder the institutional or community-level capacity to engage in CE activities.
  • Population density demonstrated a positive but statistically nonsignificant association with the CE index (β = 0.300, p = 0.244). Despite the lack of significance in the regression model, this relationship aligns with the earlier correlation analysis and reflects a meaningful trend, i.e., municipalities with higher population density are more likely to perform better in circular economy metrics, possibly due to more efficient infrastructure, access to innovation, and better administrative resources.
The remaining predictors—GDP per capita, municipal waste generation per capita, the share of inventoried forests in total land area, and the GHG emissions per capita—did not show statistically significant associations with the CE index. Among these, GHG emissions (β = 0.272) and forest cover (β = −0.210) showed moderate effect sizes, though they did not reach significance within this sample.
The diagnostic plots for the multiple regression model are presented in Figure 9, providing a visual assessment of the assumptions of linearity, normality, homoscedasticity, and potential outliers.

3.2.4. PCA Method

PCA was initially considered as a method for dimensionality reduction and to explore underlying patterns among socioeconomic factors. Based on the previous regression and correlation results, population density, unemployment rate, and GHG emissions were selected for PCA with Varimax rotation to understand how these factors cluster together across municipalities for further interpretation or possible use in future modelling. As a result of the PCA, performed in JASP, the Kaiser–Meyer–Olkin (KMO) measure of sampling adequacy fell below the minimum acceptable threshold (the overall MSA = 0.499), indicating that the dataset was not suitable for this type of analysis. Although Bartlett’s test was statistically significant (χ2 = 18.88, df = 3, p < 0.001), suggesting some inter-variable correlation, the KMO result led to a decision to omit PCA from further analysis. Future studies with a larger variable pool or sample size may revisit this approach.
Although exploratory factor analysis was considered as an alternative, the data’s low sampling adequacy made any other factor extraction method statistically inappropriate for this research.

4. Discussion

This research revealed clear and statistically significant differences in CE performance between urban and rural municipalities, addressing RQ1 and supporting H1. Urban areas consistently scored higher across all CE sub-indices. This pattern suggests that factors such as infrastructure, administrative capacity, and higher population concentration are instrumental in enabling CE implementation. These findings align with previous studies emphasizing the advantages of urban settings in fostering sustainability transitions.
The correlation analysis offered insights into RQ2 by examining how each independent variable relates to CE performance. The strongest relationships were observed with population density and unemployment rate to support H2. Municipalities with higher population densities tended to perform better, likely benefiting from centralized infrastructure and knowledge sharing. In contrast, higher unemployment rates correlated with lower CE index values. This may reflect reduced institutional capacity, limited access to sustainable employment, or diminished civic engagement in communities facing economic hardship.
Interestingly, variables such as waste generation, GHG emissions per capita, and forest share did not show strong associations with CE index values. This partially refutes H3, which suggested a link between lower emissions and higher CE performance. These results may suggest that CE-related policies have yet to produce measurable environmental changes. Alternatively, such outcomes may be more influenced by industrial activity than by local CE governance. For instance, forest cover seems more indicative of rural character than a driver of circularity, though its inclusion adds contextual depth related to land use and environmental stewardship.
The regression model addressed RQ3 by evaluating the simultaneous effects of multiple predictors. While the overall model did not reach statistical significance, population density and unemployment rate emerged as individually significant predictors. This finding is consistent with the correlation results and reinforces the robustness of these variables in shaping CE performance. In particular, unemployment retained its significance. This underscores the potential barriers that economic and financial constraints pose for municipalities attempting to implement CE strategies.
GDP per capita and GHG emissions, despite theoretical relevance, did not emerge as significant predictors in the regression model. This outcome weakens support for H2 and H3 in the context of multivariate relationships. These factors may still play indirect roles or may become more relevant over time, especially as CE practices mature and become more integrated with environmental metrics. The observed positive regression coefficient for GHG emissions may indicate that higher-performing municipalities also host more industrial activity, contributing both to emissions and economic flows. Given that municipalities generally have limited authority over industrial emissions, emissions linked to economic activity and those that are policy-sensitive might be distinguished in future research.
Analyzing rural municipalities separately provided important insights into spatial variability in CE determinants. In rural settings, neither GDP per capita nor population density significantly correlated with CE index values. This indicates that strategies reliant on urban density or scale may not translate well into sparsely populated areas. Instead, social variables like employment conditions proved more relevant. Unemployment was the only variable with a significant association in rural municipalities, reinforcing the idea that socioeconomic resilience is a key enabler of CE progress outside of cities.
Collectively, these findings highlight the importance of designing place-based policies that reflect the social and spatial context of each municipality. Structural challenges such as unemployment and depopulation require targeted interventions that promote CE-compatible employment and build institutional capacity. Such approaches may include investment in sustainable infrastructure, cross-municipal cooperation, or the development of decentralized systems.

5. Conclusions

This research confirmed that circular economy performance is significantly influenced by socioeconomic and spatial characteristics, thereby addressing Research Questions 1, 2, and 3 and partially supporting Hypotheses 1 and 2. Urban municipalities showed stronger engagement with CE practices, particularly in Resource Efficiency and Business Transformation. Their advantage is likely driven by denser populations, stronger infrastructure, and better governance capacity.
Population density and unemployment emerged as the most consistent predictors across both analytical methods. These findings reinforce the idea that CE transitions are not purely technical but are intertwined with broader issues of social equity and institutional strength. Municipalities with lower unemployment and higher density are better positioned to adopt circular approaches.
Contrary to Hypothesis 3, environmental factors such as forest cover and GHG emissions were not strongly associated with CE index values. This may be due to time lags in environmental improvement or the limited influence of municipal governments over large-scale emission sources. Forest share remains thematically relevant, even if not a direct determinant of CE performance.
These findings imply that CE-related policy should be tailored to the characteristics of local contexts. In rural municipalities, effective strategies may include decentralized solutions, support for green job creation, and regional partnerships. Attention to unemployment as a constraint could enable more inclusive and feasible circular transitions.
Looking ahead, Research Question 4 and Hypothesis 4 could be more fully explored by incorporating more advanced techniques such as PCA or factor analysis. While this study was not able to extract reliable latent dimensions due to sample limitations, future work with expanded datasets may reveal hidden variable groupings that drive CE variance. Longitudinal studies and mixed-method designs could further clarify causal mechanisms.
In summary, a CE is shaped not only by environmental goals but also by the socioeconomic realities and spatial dynamics of municipalities. Policymakers and researchers alike should consider these contextual dimensions to ensure that CE transitions are both effective and equitable.

Author Contributions

Conceptualization, I.L. and D.A.; methodology, I.L.; software, I.L.; validation, I.L. and D.A.; formal analysis, I.L.; investigation, I.L.; resources, I.L.; data curation, I.L. and D.A.; writing—original draft preparation, I.L.; writing—review and editing, D.A.; visualization, I.L.; supervision, D.A.; project administration, D.A.; funding acquisition, D.A. All authors have read and agreed to the published version of the manuscript.

Funding

The research was funded by the Ministry of Climate and Energy, the project “Climate Neutrality Decision Models in Action” of the National Research Program “Decision Support System for Achieving Climate Neutrality Goals” (VPP-KEM-Klimatneitralitāte-2023/1-0002).

Data Availability Statement

The data will be made available upon request.

Conflicts of Interest

The authors declare no conflicts of interest.

References

  1. Heshmati, A.; Rashidghalam, M. Assessment of the Urban Circular Economy in Sweden. J. Clean. Prod. 2021, 310, 127475. [Google Scholar] [CrossRef]
  2. Ghinoi, S.; Silvestri, F.; Spigarelli, F.; Tassinari, M. A Methodological Proposal for Developing a Municipality Indicator of Circular Economy (MICE). Resour. Conserv. Recycl. 2024, 211, 107871. [Google Scholar] [CrossRef]
  3. Kirchherr, J.; Yang, N.-H.N.; Schulze-Spüntrup, F.; Heerink, M.J.; Hartley, K. Conceptualizing the Circular Economy (Revisited): An Analysis of 221 Definitions. Resour. Conserv. Recycl. 2023, 194, 107001. [Google Scholar] [CrossRef]
  4. Bote Alonso, I.; Montalbán Pozas, B. Following the Circular Economy in European Rural Municipalities through the Spanish Urban Agenda. Ecol. Econ. 2024, 224, 108263. [Google Scholar] [CrossRef]
  5. Christis, M.; Athanassiadis, A.; Vercalsteren, A. Implementation at a City Level of Circular Economy Strategies and Climate Change Mitigation—The Case of Brussels. J. Clean. Prod. 2019, 218, 511–520. [Google Scholar] [CrossRef]
  6. Brglez, K.; Perc, M.; Lukman, R.K. The Complexity and Interconnectedness of Circular Cities and the Circular Economy for Sustainability. Sustain. Dev. 2024, 32, 2049–2065. [Google Scholar] [CrossRef]
  7. Abujder Ochoa, W.A.; Iarozinski Neto, A.; Vitorio Junior, P.C.; Calabokis, O.P.; Ballesteros-Ballesteros, V. The Theory of Complexity and Sustainable Urban Development: A Systematic Literature Review. Sustainability 2025, 17, 3. [Google Scholar] [CrossRef]
  8. Banzhaf, E.; Anderson, S.; Grandin, G.; Hardiman, R.; Jensen, A.; Jones, L.; Knopp, J.; Levin, G.; Russel, D.; Wu, W.; et al. Urban-Rural Dependencies and Opportunities to Design Nature-Based Solutions for Resilience in Europe and China. Land 2022, 11, 480. [Google Scholar] [CrossRef]
  9. Sánchez Levoso, A.; Gasol, C.M.; Martínez-Blanco, J.; Durany, X.G.; Lehmann, M.; Gaya, R.F. Methodological Framework for the Implementation of Circular Economy in Urban Systems. J. Clean. Prod. 2020, 248, 119227. [Google Scholar] [CrossRef]
  10. Abu-Bakar, H.; Charnley, F. Developing a Strategic Methodology for Circular Economy Roadmapping: A Theoretical Framework. Sustainability 2024, 16, 6682. [Google Scholar] [CrossRef]
  11. Bourdin, S.; Jacquet, N. Closing the Loop at the Local Scale: Investigating the Drivers of and Barriers to the Implementation of the Circular Economy in Cities and Regions. Ecol. Econ. 2025, 231, 108542. [Google Scholar] [CrossRef]
  12. Ddiba, D.; Andersson, K.; Koop, S.H.A.; Ekener, E.; Finnveden, G.; Dickin, S. Governing the Circular Economy: Assessing the Capacity to Implement Resource-Oriented Sanitation and Waste Management Systems in Low- and Middle-Income Countries. Earth Syst. Gov. 2020, 4, 100063. [Google Scholar] [CrossRef]
  13. De Pascale, A.; Arbolino, R.; Szopik-Depczyńska, K.; Limosani, M.; Ioppolo, G. A Systematic Review for Measuring Circular Economy: The 61 Indicators. J. Clean. Prod. 2021, 281, 124942. [Google Scholar] [CrossRef]
  14. Dagilienė, L.; Varaniūtė, V.; Bruneckienė, J. Local Governments’ Perspective on Implementing the Circular Economy: A Framework for FuturIe Solutions. J. Clean. Prod. 2021, 310, 127340. [Google Scholar] [CrossRef]
  15. Lakatos, E.S.; Yong, G.; Szilagyi, A.; Clinci, D.S.; Georgescu, L.; Iticescu, C.; Cioca, L.-I. Conceptualizing Core Aspects on Circular Economy in Cities. Sustainability 2021, 13, 7549. [Google Scholar] [CrossRef]
  16. Bals, L.; Taylor, K.M.; Rosca, E.; Ciulli, F. Toward a Circular Supply Chain: The Enabling Role of Information and Financial Flows in Open and Closed Loop Designs. Resour. Conserv. Recycl. 2024, 209, 107781. [Google Scholar] [CrossRef]
  17. Elustondo, D.; Stocchero, A.; Gaunt, D. A Definition for Circular Bio-Based Cities Based on a Reductionist Metabolic Approach. City Environ. Interact. 2023, 20, 100121. [Google Scholar] [CrossRef]
  18. Zandvoort, M.; Campos, I.S.; Vizinho, A.; Penha-Lopes, G.; Lorencová, E.K.; van der Brugge, R.; van der Vlist, M.J.; van den Brink, A.; Jeuken, A.B.M. Adaptation Pathways in Planning for Uncertain Climate Change: Applications in Portugal, the Czech Republic and the Netherlands. Environ. Sci. Policy 2017, 78, 18–26. [Google Scholar] [CrossRef]
  19. Aguado, S.; Cotler, H.; Astier, M.; Padilla-Rivera, A. Evaluation Methodologies for Circular Economy in Municipal Composting and Urban Agriculture: A Literature Review with Focus on Latin America. Circ. Econ. Sust. 2025, 5, 1–26. [Google Scholar] [CrossRef]
  20. Papageorgiou, A.; Henrysson, M.; Nuur, C.; Sinha, R.; Sundberg, C.; Vanhuyse, F. Mapping and Assessing Indicator-Based Frameworks for Monitoring Circular Economy Development at the City-Level. Sustain. Cities Soc. 2021, 75, 103378. [Google Scholar] [CrossRef]
  21. Ding, Z.; Hamann, K.T.; Grundmann, P. Enhancing Circular Bioeconomy in Europe: Sustainable Valorization of Residual Grassland Biomass for Emerging Bio-Based Value Chains. Sustain. Prod. Consum. 2024, 45, 265–280. [Google Scholar] [CrossRef]
  22. Alcalde-Calonge, A.; Sáez-Martínez, F.J.; Ruiz-Palomino, P. Evolution of Research on Circular Economy and Related Trends and Topics. A Thirteen-Year Review. Ecol. Inform. 2022, 70, 101716. [Google Scholar] [CrossRef]
  23. Leone, R.; La Scalia, G.; Saeli, M. A Critical Review on Reuse Potentials of Wood Waste for Innovative Products and Applications: Trends and Future Challenges. Sustain. Futures 2025, 10, 100869. [Google Scholar] [CrossRef]
  24. Lund, K.W.; Madsen, E.S. State-of-the-Art Value Chain Roadmap for Sustainable End-of-Life Wind Turbine Blades. Renew. Sustain. Energy Rev. 2024, 192, 114234. [Google Scholar] [CrossRef]
  25. Kılkış, Ş.; Ulpiani, G.; Vetters, N. Visions for Climate Neutrality and Opportunities for Co-Learning in European Cities. Renew. Sustain. Energy Rev. 2024, 195, 114315. [Google Scholar] [CrossRef]
  26. Strippoli, R.; Gallucci, T.; Ingrao, C. Circular Economy and Sustainable Development in the Tourism Sector—An Overview of the Truly-Effective Strategies and Related Benefits. Heliyon 2024, 10, e36801. [Google Scholar] [CrossRef] [PubMed]
  27. Dąbrowski, M. Going Circular: Unlocking the Potential of Regions and Cities to Drive the Circular Economy Transition. In Regional Studies Policy Impact Books, 1st ed.; Taylor & Francis Group: Oxfordshire, UK, 2025; ISBN 978-1-041-00225-3. [Google Scholar]
  28. Bolger, K.; Doyon, A. Circular Cities: Exploring Local Government Strategies to Facilitate a Circular Economy. Eur. Plan. Stud. 2019, 27, 2184–2205. [Google Scholar] [CrossRef]
  29. Merli, R.; Preziosi, M.; Acampora, A. How Do Scholars Approach the Circular Economy? A Systematic Literature Review. J. Clean. Prod. 2018, 178, 703–722. [Google Scholar] [CrossRef]
  30. Reike, D.; Vermeulen, W.J.V.; Witjes, S. The Circular Economy: New or Refurbished as CE 3.0?—Exploring Controversies in the Conceptualization of the Circular Economy through a Focus on History and Resource Value Retention Options. Resour. Conserv. Recycl. 2018, 135, 246–264. [Google Scholar] [CrossRef]
  31. Remeikienė, R.; Gasparėnienė, L.; Bankauskienė, J. Assessment of the Circular Economy Indicators in the EU Member States. Discov. Sustain. 2025, 6, 611. [Google Scholar] [CrossRef]
  32. Wandl, A.; Dąbrowski, M.; Berruti, G.; Acke, A.; Obersteg, A.; Varjú, V.; Taelman, S.E.; Arlati, A.; Grodzicka-Kowalczyk, M.; Kowalczyk, M. A Holistic Self-Assessment Tool for Circular Economy Transitions in Cities and Regions. Eur. XXI 2024, 44, 15–35. [Google Scholar] [CrossRef]
  33. Kruse, M.; Wedemeier, J. Quantifying the Circular Economy in European Regions: A Bridge towards Smart Specialisation? REGION 2023, 10, 105–136. [Google Scholar] [CrossRef]
  34. Paiho, S.; Mäki, E.; Wessberg, N.; Paavola, M.; Tuominen, P.; Antikainen, M.; Heikkilä, J.; Rozado, C.A.; Jung, N. Towards Circular Cities—Conceptualizing Core Aspects. Sustain. Cities Soc. 2020, 59, 102143. [Google Scholar] [CrossRef]
  35. Panchal, R.; Singh, A.; Diwan, H. Does Circular Economy Performance Lead to Sustainable Development?—A Systematic Literature Review. J. Environ. Manag. 2021, 293, 112811. [Google Scholar] [CrossRef]
  36. Goyal, S.; Chauhan, S.; Mishra, P. Circular Economy Research: A Bibliometric Analysis (2000–2019) and Future Research Insights. J. Clean. Prod. 2021, 287, 125011. [Google Scholar] [CrossRef]
  37. Arista, N.I.D.; Handayani, D.; Ernawati, N. Is It Possible to Implement the Same Circular-Economy Concept in Rural and Urban Areas? Study on Willingness to Pay for Household Waste. Sustainability 2023, 15, 5843. [Google Scholar] [CrossRef]
  38. Golebiewski, J.; Takala, J.; Juszczyk, O.; Drejerska, N. Local Contribution to Circular Economy. A Case Study of a Polish Rural Municipality. Econ. AGRO-Aliment. 2019, 21, 771–791. [Google Scholar] [CrossRef]
  39. Kanda, W.; Klofsten, M.; Bienkowska, D.; Henry, M.; Hjelm, O. Challenges of Circular New Ventures: An Empirical Analysis of 70 Cases. J. Clean. Prod. 2024, 442, 141103. [Google Scholar] [CrossRef]
  40. Takacs, F.; Brunner, D.; Frankenberger, K. Barriers to a Circular Economy in Small- and Medium-Sized Enterprises and Their Integration in a Sustainable Strategic Management Framework. J. Clean. Prod. 2022, 362, 132227. [Google Scholar] [CrossRef]
  41. Sanz-Torró, V.; Calafat-Marzal, C.; Guaita-Martinez, J.M.; Vega, V. Assessment of European Countries’ National Circular Economy Policies. J. Environ. Manag. 2025, 373, 123835. [Google Scholar] [CrossRef]
  42. Kevin van Langen, S.; Vassillo, C.; Ghisellini, P.; Restaino, D.; Passaro, R.; Ulgiati, S. Promoting Circular Economy Transition: A Study about Perceptions and Awareness by Different Stakeholders Groups. J. Clean. Prod. 2021, 316, 128166. [Google Scholar] [CrossRef]
  43. Sinha, E. Identifying Enablers and Outcomes of Circular Economy for Sustainable Development: A Systematic Literature Review. Bus. Strategy Dev. 2022, 5, 232–244. [Google Scholar] [CrossRef]
  44. Patil, R.A.; van Langen, S.K.; Ramakrishna, S. Circularity Assessment: Developing a Comprehensive Yardstick. In Circularity Assessment: Macro to Nano; Patil, R.A., Ramakrishna, S., Eds.; Springer: Singapore, 2023; pp. 3–14. [Google Scholar] [CrossRef]
  45. Kulakovskaya, A.; Knoeri, C.; Radke, F.; Blum, N.U. Measuring the Economic Impacts of a Circular Economy: An Evaluation of Indicators. Circ. Econ. Sust. 2023, 3, 657–692. [Google Scholar] [CrossRef]
  46. Bellezoni, R.A.; Adeogun, A.P.; Paes, M.X.; de Oliveira, J.A.P. Tackling Climate Change through Circular Economy in Cities. J. Clean. Prod. 2022, 381, 135126. [Google Scholar] [CrossRef]
  47. Feng, Y.; Wang, L.; Nie, C. Can Place-Based Policy Reduce Carbon Emissions? Evidence from Industrial Transformation and Upgrading Exemplary Zone in China. Humanit. Soc. Sci. Commun. 2024, 11, 877. [Google Scholar] [CrossRef]
  48. Schiller, G.; Gao, X.; Lanau, M.; Blum, A.; Zhang, N.; Çıdık, M.S. How Does Space Matter? On the Importance of Embedding Spatialities in Industrial Ecology Frameworks for Circularity in the Built Environment. J. Ind. Ecol. 2025, 29, 645–655. [Google Scholar] [CrossRef]
  49. Chartier, A.; Pot, W. How to Decide upon Circular Cities: The Role of Evidence in Local Tender Procedures. J. Clean. Prod. 2024, 472, 143449. [Google Scholar] [CrossRef]
  50. Bianchi, M.; Cordella, M.; Menger, P. Regional Monitoring Frameworks for the Circular Economy: Implications from a Territorial Perspective. Eur. Plan. Stud. 2023, 31, 36–54. [Google Scholar] [CrossRef]
  51. Arsova, S.; Genovese, A.; Ketikidis, P.H. Implementing Circular Economy in a Regional Context: A Systematic Literature Review and a Research Agenda. J. Clean. Prod. 2022, 368, 133117. [Google Scholar] [CrossRef]
  52. Atstaja, D.; Liepa, I.; Vembris, A.; Rivza, B.; Osipova, S.; Cudecka-Purina, N. Circular Economy Index: A New Methodology for Evaluating Circularity in Municipalities. Sustainability 2025, 17, 4867. [Google Scholar] [CrossRef]
  53. Archie, J.W. Statistical analysis of heterozygosity data: Independent sample comparisons. Evolution 1985, 39, 623–637. [Google Scholar] [CrossRef] [PubMed]
  54. Cohen, J.; Cohen, P.; West, S.G.; Aiken, L.S. Applied Multiple Regression/Correlation Analysis for the Behavioral Sciences, 3rd ed.; Routledge: New York, NY, USA, 2013; ISBN 978-0-203-77444-1. [Google Scholar]
  55. Seber, G.A.F.; Lee, A.J. Linear Regression Analysis. In Wiley Series in Probability and Statistics, 2nd ed.; John Wiley & Sons: Hoboken, NJ, USA, 2012; ISBN 978-1-118-27442-2. [Google Scholar]
  56. Gray, V. Principal Component Analysis: Methods, Applications and Technology. In Mathematics Research Developments; Nova Science Publishers: Hauppauge, NY, USA, 2017; ISBN 978-1-5361-0911-5. [Google Scholar]
  57. Jolliffe, I.T. Principal Component Analysis. In Springer Series in Statistics; Springer: New York, NY, USA, 2002; ISBN 978-0-387-95442-4. [Google Scholar]
  58. Central Statistics Bureau Republic of Latvia. Official Statistics of Latvia. Available online: https://stat.gov.lv/en/search (accessed on 24 June 2025).
  59. The JASP Team. Download JASP 2025, version 0.95.0; University of Amsterdam: Amsterdam, The Netherlands, 2025.
  60. Magdalena, A.S.; Fernández, B.C.; Callén, Y.F. Financial Performance of New Circular Economy Companies in Rural Settings. Small Bus. Econ. 2025, 64, 1953–1980. [Google Scholar] [CrossRef]
  61. OECD. The Circular Economy in Cities and Regions of the European Union. In OECD Urban Studies; OECD Publishing: Paris, France, 2025; ISBN 978-92-64-79604-1. [Google Scholar]
  62. Hysa, E.; Kruja, A.; Rehman, N.U.; Laurenti, R. Circular Economy Innovation and Environmental Sustainability Impact on Economic Growth: An Integrated Model for Sustainable Development. Sustainability 2020, 12, 4831. [Google Scholar] [CrossRef]
  63. Zhang, N.; Gruhler, K.; Schiller, G. A Review of Spatial Characteristics Influencing Circular Economy in the Built Environment. Environ. Sci. Pollut. Res. Int. 2023, 30, 54280–54302. [Google Scholar] [CrossRef] [PubMed]
  64. Cialani, C.; Mortazavi, R.; Sarcinella, F. Material Footprint and Circular Economy for a Sustainable Consumption and Production Pattern. Circ. Econ. Sust. 2025, 5, 1–20. [Google Scholar] [CrossRef]
  65. Andabaka, A.; Sertić, M.B.; Harc, M. Eco-Innovation and Economic Growth in the European Union. Zagreb. Int. Rev. Econ. Bus. 2019, 22, 43–54. [Google Scholar] [CrossRef]
  66. Georgescu, L.P.; Fortea, C.; Antohi, V.M.; Balsalobre-Lorente, D.; Zlati, M.L.; Barbuta–Misu, N. Economic, Technological and Environmental Drivers of the Circular Economy in the European Union: A Panel Data Analysis. Environ. Sci. Eur. 2025, 37, 76. [Google Scholar] [CrossRef]
  67. Radivojević, V.; Rađenović, T.; Dimovski, J. The Role of Circular Economy in Driving Economic Growth: Evidence from EU Countries. SAGE Open 2024, 14, 21582440241240624. [Google Scholar] [CrossRef]
  68. D’Adamo, I.; Daraio, C.; Di Leo, S.; Gastaldi, M.; Rossi, E.N. Driving EU Sustainability: Promoting the Circular Economy through Municipal Waste Efficiency. Sustain. Prod. Consum. 2024, 50, 462–474. [Google Scholar] [CrossRef]
  69. Nademi, Y.; Sedaghat Kalmarzi, H. Breaking the Unemployment Cycle Using the Circular Economy: Sustainable Jobs for Sustainable Futures. J. Clean. Prod. 2025, 488, 144655. [Google Scholar] [CrossRef]
  70. de Andrade, R.D.; Benfica, V.C.; de Oliveira, H.V.E.; Suchek, N. Investigating Green Jobs and Sustainability in SMEs: Beyond Business Operations. J. Clean. Prod. 2025, 486, 144477. [Google Scholar] [CrossRef]
  71. Bassi, F.; Guidolin, M. Resource Efficiency and Circular Economy in European SMEs: Investigating the Role of Green Jobs and Skills. Sustainability 2021, 13, 12136. [Google Scholar] [CrossRef]
  72. Bobinaite, V.; Naujokas, G. Effectiveness of Municipal Waste Collection and Management Policy in Lithuania. Sustainability 2025, 17, 4623. [Google Scholar] [CrossRef]
  73. Maalouf, A.; Mavropoulos, A. Re-Assessing Global Municipal Solid Waste Generation. Waste Manag. Res. 2023, 41, 936–947. [Google Scholar] [CrossRef]
  74. Laureti, L.; Costantiello, A.; Anobile, F.; Leogrande, A.; Magazzino, C. Waste Management and Innovation: Insights from Europe. Recycling 2024, 9, 82. [Google Scholar] [CrossRef]
  75. Lazaridou, D.C.; Michailidis, A.; Trigkas, M. Exploring Environmental and Economic Costs and Benefits of a Forest-Based Circular Economy: A Literature Review. Forests 2021, 12, 436. [Google Scholar] [CrossRef]
  76. Köhl, M.; Martes, L.M. Forests: A Passive CO2 Sink or an Active CO2 Pump? For. Policy Econ. 2023, 155, 103040. [Google Scholar] [CrossRef]
  77. Kocoglu, M.; Nghiem, X.-H.; Barak, D.; Bruna, K.; Jahanger, A. Can Forests Realize the Carbon Neutrality Dream? Evidence from a Global Sample. J. Environ. Manag. 2024, 366, 121827. [Google Scholar] [CrossRef] [PubMed]
  78. Psistaki, K.; Tsantopoulos, G.; Paschalidou, A.K. An Overview of the Role of Forests in Climate Change Mitigation. Sustainability 2024, 16, 6089. [Google Scholar] [CrossRef]
  79. Del Borghi, A.; Gallo, M.; Silvestri, N.; Baccelli, O.; Croci, E.; Molteni, T. Impact of Circular Measures to Reduce Urban CO2 Emissions: An Analysis of Four Case Studies through a Production- and Consumption-Based Emission Accounting Method. J. Clean. Prod. 2022, 380, 134932. [Google Scholar] [CrossRef]
  80. Knäble, D.; de Quevedo Puente, E.; Pérez-Cornejo, C.; Baumgärtler, T. The Impact of the Circular Economy on Sustainable Development: A European Panel Data Approach. Sustain. Prod. Consum. 2022, 34, 233–243. [Google Scholar] [CrossRef]
  81. Hailemariam, A.; Erdiaw-Kwasie, M.O. Towards a Circular Economy: Implications for Emission Reduction and Environmental Sustainability. Bus. Strategy Environ. 2023, 32, 1951–1965. [Google Scholar] [CrossRef]
  82. Saeima. Law on Administrative Territories and Populated Areas. Available online: https://likumi.lv/ta/en/en/id/315654-law-on-administrative-territories-and-populated-areas (accessed on 24 June 2025).
  83. CSB. Gross Domestic Product and Gross Value Added by Region, State City and Municipality at Current Prices, (Thousand Euro) 2000–2022. Available online: https://data.stat.gov.lv/pxweb/en/OSP_PUB/START__VEK__IK__IKR/IKR060/table/tableViewLayout1/ (accessed on 24 June 2025).
  84. CSB. Activity Rate, Employment Rate and Unemployment Rate by Gender and Age Group in Regions, State Cities and Municipalities at the Beginning of the Year (Per Cent) 2021–2024. Available online: https://data.stat.gov.lv/pxweb/en/OSP_PUB/START__EMP__NBB__NBA/EKA140/table/tableViewLayout1/ (accessed on 24 June 2025).
  85. Carter, T.J. Urban Productivity, Urban Unemployment, and Labor Market Policies. Reg. Sci. Urban. Econ. 1998, 28, 329–344. [Google Scholar] [CrossRef]
  86. CSB. Usually Resident Population Density in Regions, Cities and Towns, Municipalities, and Rural Territories, at the Beginning of Year 2022–2025. Available online: https://data.stat.gov.lv/pxweb/en/OSP_PUB/START__POP__IR__IRD/IRD062/table/tableViewLayout1/ (accessed on 24 June 2025).
  87. CSB. Waste Generation in Businesses by State City and Municipality (Tonnes) 2021–2023. Available online: https://data.stat.gov.lv/pxweb/en/OSP_PUB/START__ENV__AK__AKB/AKB050/table/tableViewLayout1/ (accessed on 24 June 2025).
  88. CSB. Population at the Beginning of Year and Population Change and Key Vital Statistics in Regions, Cities, Towns and Municipalities 2012–2025. Available online: https://data.stat.gov.lv/pxweb/en/OSP_PUB/START__POP__IR__IRS/IRS031/table/tableViewLayout1/ (accessed on 24 June 2025).
  89. Eurostat. Municipal Waste Generated per Person in the EU. Available online: https://www.voronoiapp.com/other/Municipal-waste-generated-per-person-in-the-EU-4068 (accessed on 9 July 2025).
  90. CSB. Share of Inventoried Forests in Total Land Area and Standing Timber Density in Regions, State Cities and Municipalities 2019–2024. Available online: https://data.stat.gov.lv:443/pxweb/en/OSP_PUB/START__NOZ__ME__MEP/MEP063/ (accessed on 6 July 2025).
  91. CSB. Greenhouse Gas Emissions in Regions, State Cities and Municipalities 2020–2023. Available online: https://data.stat.gov.lv/pxweb/en/OSP_PUB/START__ENV__GP__GPE/GPE020/ (accessed on 24 June 2025).
  92. European Commission. Forests, Forestry and Logging. Available online: https://ec.europa.eu/eurostat/statistics-explained/index.php?title=Forests,_forestry_and_logging (accessed on 9 July 2025).
  93. Eurostat. EU Greenhouse Gas Footprint: 10.7 Tonnes per Capita. Available online: https://ec.europa.eu/eurostat/web/products-eurostat-news/w/ddn-20250219-1?utm_source=chatgpt.com (accessed on 9 July 2025).
  94. Cohen, J. Statistical Power Analysis for the Behavioral Sciences, 2nd ed.; Routledge: New York, NY, USA, 2013; ISBN 978-0-203-77158-7. [Google Scholar]
  95. Manolchev, C.; Cherrington, R.; Crabolu, G. Untangling Circularity: Transitioning to a Regional Circular Economy in the Clothing and Textile Sector in England. J. Clean. Prod. 2024, 482, 144188. [Google Scholar] [CrossRef]
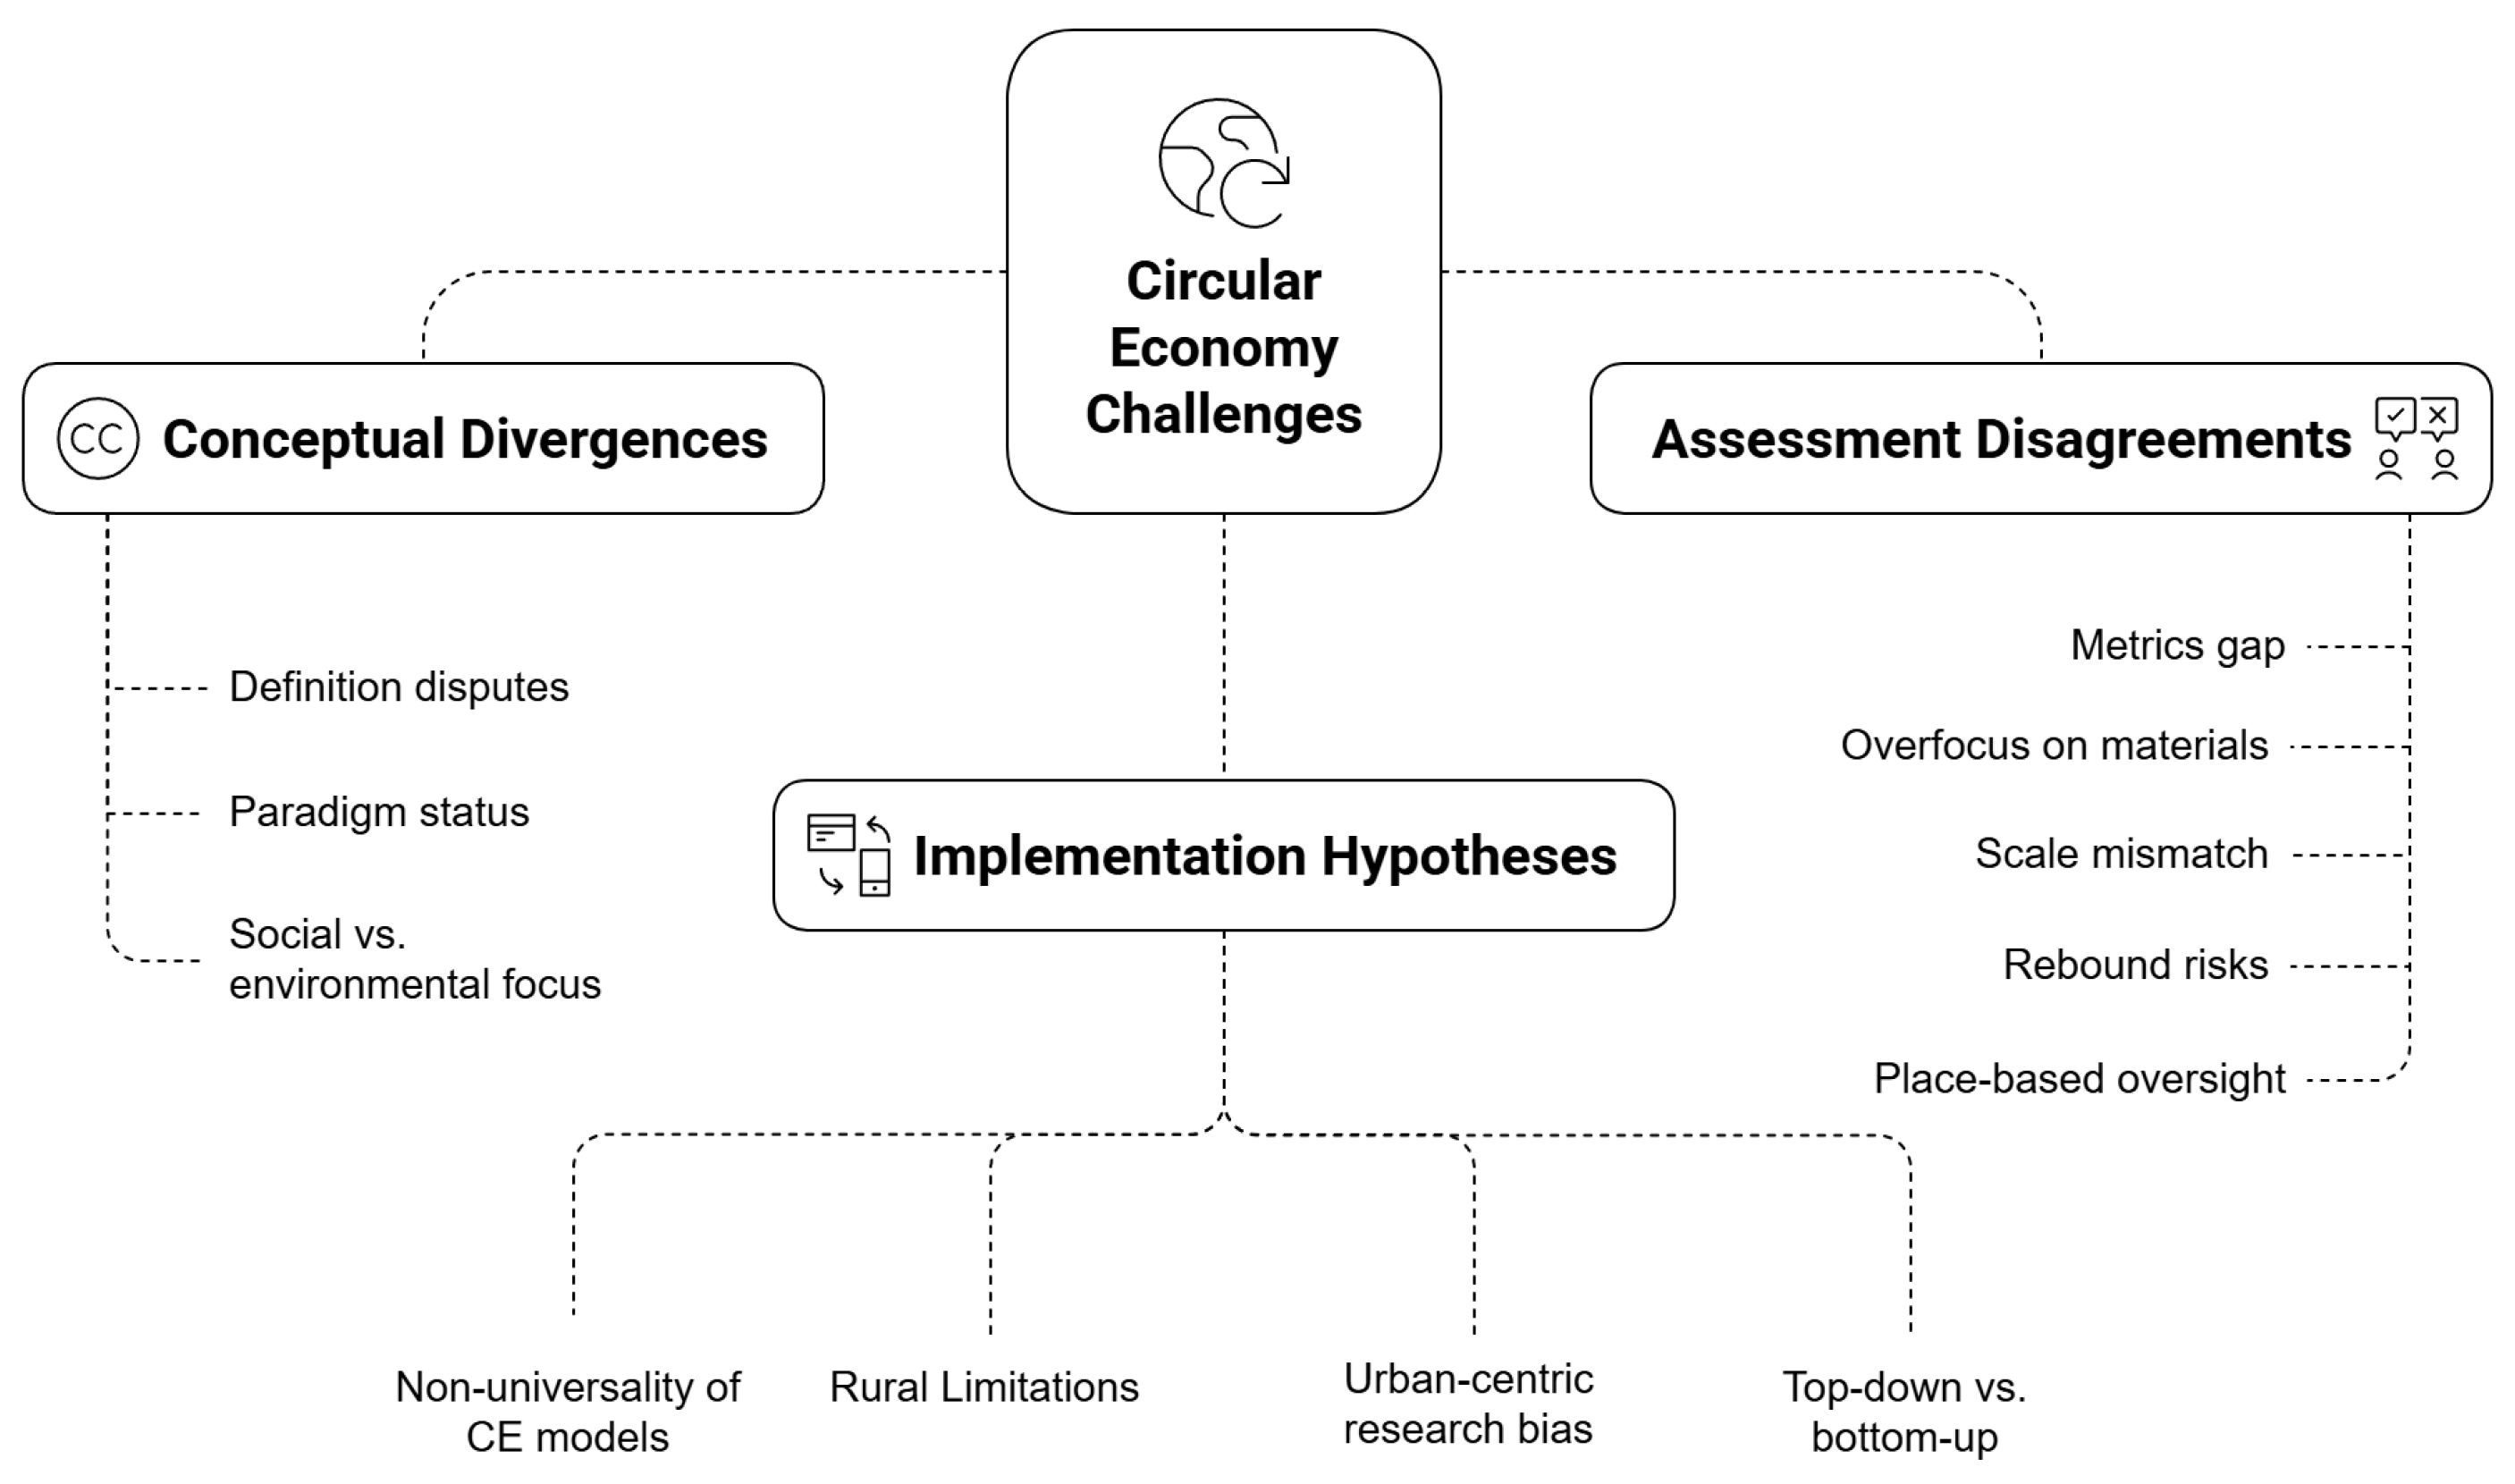
Figure 1. Challenges in CE implementation and assessment (developed by authors).
Urbansci 09 00321 g001
Figure 2. Research design and statistical methods used in the research.
Urbansci 09 00321 g002
Figure 3. Urban and rural municipalities in Latvia (developed by authors).
Urbansci 09 00321 g003
Figure 4. The overall CE index values (developed by the authors).
Urbansci 09 00321 g004
Figure 5. Economic factors: (a) GDP per capita, EUR, 2022, and (b) unemployment rate, %, 2023 [83,84].
Urbansci 09 00321 g005
Figure 6. Socio-environmental factors: (a) Population density, population per km2, at the beginning of 2024, and (b) generated municipal waste per capita, t, 2023 [86,87,88].
Urbansci 09 00321 g006
Figure 7. Environmental factors: (a) share of inventoried forests in total land area, 2023, and (b) GHG emissions, kg of CO2 eq per capita, 2023 [90,91].
Urbansci 09 00321 g007
Figure 8. Raincloud plot: CE index values.
Urbansci 09 00321 g008
Figure 9. Residual plots. Visual inspection of residual plots ((a) residuals vs. predicted, (b) residuals histogram, (c) Q-Q plot) does not suggest violations of the assumptions of normality or homoscedasticity.
Urbansci 09 00321 g009
Table 1. Independent samples T-test for CE indices.
tdfpCohen’s dSE Cohen’s d
CE index−2.865410.007−1.1840.436
CE sub-index: Resource Management−2.602410.013−1.0750.432
CE sub-index: Economic/business transformation−2.626410.012−1.0850.432
CE sub-index: Public Engagement−2.356410.023−0.9730.429
CE sub-index: Efficient Management−2.790410.008−1.1520.435
Note. Student’s t-test.
Table 2. Correlation analysis of the CE index values and socioeconomic factors.
VariablesCE Index
nPearson’s rp-ValueSpearman’s Rhop-Value
1. Population density, population per km2, at the beginning of 2024430.344 *0.0240.311 *0.042
2. GDP per capita, EUR, 2022430.2200.1570.334 *0.029
3. Unemployment rate, %, 202343−0.2850.064−0.0710.652
4. Generated municipal waste per capita, t, 202342−0.1050.507−0.0850.593
5. Share of inventoried forests in total land area, 202343−0.2560.097−0.2200.155
6. GHG emissions, kg of CO2 eq per capita, 202342−0.1220.440−0.1180.456
* p < 0.05.
Table 3. Correlation analysis of the CE index values and socioeconomic factors in rural municipalities.
VariablesCE Index
nPearson’s rp-ValueSpearman’s Rhop-Value
1. Population density, population per km2, at the beginning of 202436−0.0510.7660.1110.521
2. GDP per capita, EUR, 2022360.1960.2510.2970.079
3. Unemployment rate, %, 202336−0.356 *0.033−0.1440.401
4. Generated municipal waste per capita, t, 202335−0.0060.9740.0290.869
5. Share of inventoried forests in total land area, 202336−0.0060.972−0.0370.830
6. GHG emissions, kg of CO2 eq per capita, 2023350.1530.3790.0960.581
* p < 0.05.
Table 4. Regression analysis.
Model Summary—CE index
ModelR2Adjusted R2F Changedf1df2pDurbin–Watson
Auto-CorrelationStatisticp
M10.2440.1111.8326340.122−0.3882.7340.020
Coefficients
Model—M1UnstandardizedStandard ErrorStandardized (β)tp
(Intercept)468.15749.091 9.537<0.001
Population density, population per km2, at the beginning of 20240.0250.0210.3001.1870.244
GDP per capita, EUR, 2022−5.669 × 10−40.001−0.077−0.3910.698
Unemployment rate, %, 2023−5.5992.506−0.455−2.2350.050
Generated municipal waste per capita, t, 2023−4.1715.047−0.140−0.8270.414
Share of inventoried forests in total land area, 2023−60.63761.704−0.210−0.9830.333
GHG emissions, kg of CO2 eq per capita, 20230.0060.0050.2721.3010.202
Note. M1 includes population density, population per km2, at the beginning of 2024; GDP per capita, EUR, 2022; unemployment rate, %, 2023; Generated municipal waste per capita, t, 2023; share of inventoried forests in total land area, 2023; GHG emissions, kg of CO2 eq per capita, 2023.
Disclaimer/Publisher’s Note: The statements, opinions and data contained in all publications are solely those of the individual author(s) and contributor(s) and not of MDPI and/or the editor(s). MDPI and/or the editor(s) disclaim responsibility for any injury to people or property resulting from any ideas, methods, instructions or products referred to in the content.