Article

Improving Urban Resilience Through a Scalable Multi-Criteria Planning Approach

by
Carmine Massarelli
1,* and
Maria Silvia Binetti
1,2
1
Environment and Territory Research Unit, Construction Technologies Institute, Italian National Research Council (ITC-CNR), 70124 Bari, Italy
2
Department of Earth and Geoenvironmental Sciences, University of Bari Aldo Moro, 70125 Bari, Italy
*
Author to whom correspondence should be addressed.
Urban Sci. 2025, 9(8), 309; https://doi.org/10.3390/urbansci9080309
Submission received: 20 May 2025 / Revised: 23 June 2025 / Accepted: 5 August 2025 / Published: 7 August 2025

Abstract

In highly urbanised and industrialised settings, managing environmental pressures and enhancing urban resilience demand integrated, spatially explicit approaches. This study presents a methodological framework that integrates topographic data, land cover information, and open geodata to produce a high-resolution vulnerability map. A multi-criteria analysis was performed using indicators such as land use, population density, proximity to emission sources, vegetation cover, and sensitive services (e.g., schools and hospitals). The result is a high-resolution vulnerability map that classifies the urban, peri-urban, and coastal zones into five levels of environmental risk. These evaluation levels are derived from geospatial analyses combining pollutant dispersion modelling with land-use classification, enabling the identification of the most vulnerable urban zones. These findings support evidence-based planning and can guide local governments and environmental agencies in prioritising Nature-based Solutions (NBSs), enhancing ecological connectivity, and reducing exposure for vulnerable populations.

1. Introduction

Urbanisation, as a defining and irreversible phenomenon of the contemporary era, has reshaped territorial dynamics by disrupting ecological balances, altering natural resource cycles, and intensifying ecosystem pressures. With over 56% of the global population residing in urban areas—a figure projected to reach 70% by 2050—this trend, despite socio-economic advantages, necessitates integrated and sustainable planning to mitigate its environmental consequences [1]. Urbanisation induces multiple environmental impacts—notably, soil sealing, which reduces vegetation cover; impairs rainwater infiltration; and contributes to surface runoff, urban flooding, and diminished groundwater recharge [2,3]. Furthermore, urbanisation leads to a fragmentation of natural habitats, putting biodiversity at risk and reducing ecological connectivity [4].
Additionally, urbanisation intensifies the Urban Heat Island (UHI) effect driven by artificial surfaces and reduced vegetation, thereby increasing cooling energy demand and exacerbating public health risks during heat waves [5,6,7].
Tokyo exemplifies this trend, with urban expansion contributing to an average temperature rise exceeding 2 °C in recent decades [8].
Urbanisation significantly exacerbates air pollution, with cities such as New Delhi, Beijing, and Mexico City frequently exceeding safe PM10 and NO2 levels, posing serious risks to respiratory and cardiovascular health. Major emission sources include vehicular traffic, industrial activities, and domestic heating [9,10,11].
From a water perspective, urban expansion intensifies stress on both the quantity and quality of water resources. The 2018 “Day Zero” crisis in Cape Town exemplifies the compounded effects of drought, climate change, and unregulated urban growth. Coastal cities like Jakarta also face mounting challenges due to land subsidence and sea-level rise, increasing vulnerability to extreme hydrological events [12].
Urban areas account for a large share of global emissions and resource use but also represent strategic nodes for ecological innovation [13,14].
The phenomenon of urbanisation requires a holistic and multidisciplinary approach capable of combining economic development, social inclusion, and protection of urban ecosystems [15].
The growing complexity of urban contexts, combined with the strong spatial and temporal variation of environmental phenomena, requires the adoption of advanced tools for effective and dynamic management of the territory. In this scenario, the concept of urban resilience takes on a central role in territorial planning, as it represents the capacity of a city to absorb, adapt to, and recover from environmental, social, and economic shocks while maintaining the functionality of its systems.
However, resilience is not a static goal but a continuous process that requires the integration of data, knowledge, and sectoral strategies. Contemporary cities face increasingly intense and complex environmental pressures, particularly related to air pollution, climate change, land consumption, ecological fragmentation, and the degradation of the quality of life. In many European and international metropolises, such as Milan, Paris, or Seoul, high concentrations of PM10, heat islands, and urban floods are just some of the tangible manifestations of an urban transformation that, if not governed, amplifies vulnerabilities.
To address these challenges, it is essential to resort to sustainable land management practices, which valorise green infrastructure, nature-based solutions, soft mobility, and intelligent environmental monitoring systems [16,17,18]. For example, Rotterdam has implemented an urban network of green roofs and drainage squares to mitigate the impact of heavy rainfall, improving the adaptive capacity of the urban fabric. Similarly, Singapore has integrated climate resilience into its planning through ecological corridors, vertical parks, and policies to contain urban sprawl.
A useful tool for analysing urban environmental dynamics in a structured way is the Driving Forces, Pressures, State, Impact, Response (DPSIR) model, also adopted by the European Environment Agency [19,20]. This model allows for the linking of main causes, such as urbanisation to environmental pressures (pollution, resource consumption), the effects on the state of the environment, the impacts on health and ecosystems, and the responses of public policies. However, the traditional application of the DPSIR model has some limitations. It is often used descriptively and statistically, with indicators aggregated at a municipal or regional level, not reflecting intra-urban variations, rapid temporal dynamics, or the real spatialisation of the parameters. This approach risks producing generic environmental diagnoses, which are not very useful in guiding localised interventions or evaluating the effectiveness of adaptive strategies. In highly urbanised contexts, it is essential to have spatially explicit and time-updated analyses. To overcome these critical issues, it is necessary to use advanced geospatial analysis tools, predictive models and simulations capable of supporting decisions based on scenarios and localised impact assessments. The adoption of spatially connoted database systems, information from citizen science, and pollutant dispersion modelling (such as AERMOD, the atmospheric dispersion modelling system developed by the U.S. Environmental Protection Agency (EPA)) now offers new possibilities for building more dynamic, proactive, and urban reality-related decision-making frameworks [21,22].
Understanding and monitoring these processes is crucial to developing sustainable natural resource management strategies. Traditional applications often rely on static and aggregated descriptive analyses, typically at the municipal or regional scale. This approach can mask spatial heterogeneity and temporal dynamics, limiting the predictive capacity of the analysis. For example, when evaluating soil degradation or pollution, merely aggregating data at the administrative level fails to capture local criticalities or identify vulnerable areas with sufficient precision.
To address these limitations, predictive tools such as total deposition maps can be integrated into the analysis. One particularly effective method involves the use of AERMOD [23,24]. It simulates the transport and deposition of pollutants in the lower atmosphere, allowing for the creation of high-resolution maps that quantify the spatial distribution of atmospheric deposition on the topsoil. These maps provide detailed, site-specific data that can be used to assess the vulnerability of soils to contamination, particularly in areas influenced by industrial emissions [25].
In this context, the AERMOD model can simulate the dispersion of particulate matter with a diameter of 10 micrometres or smaller, known as PM10, in the atmosphere [26]. This helps create high-resolution maps showing the spatial distribution of PM10, which is crucial for identifying pollution hotspots and planning mitigation strategies. PM10 particles are known to cause a range of adverse health effects, including respiratory issues, cardiovascular problems, and an increased risk of cancer [27,28]. Environmentally, PM10 contributes to visibility reduction and leads to soil and water contamination. These impacts underscore the importance of monitoring and managing PM10 levels to protect both public health and the environment. The AERMOD dispersion model has been widely used to assess the impact of air pollutants, particularly PM10, in built-up and industrial areas, as demonstrated by studies conducted in Kuala Lumpur to estimate emissions from vehicle traffic, at the Shazand thermal power plant in Iran and in the vicinity of an industrial complex area in Thailand [29,30,31]. By combining geospatial modelling with empirical monitoring data, AERMOD-based soil deposition maps enhance the diagnostic and forecasting capabilities of environmental assessments, offering a more robust basis for early warning systems and targeted mitigation strategies [32,33].
Urban resilience requires integrated, adaptive, and evidence-based governance capable of anticipating and responding to complex socio-environmental challenges while fostering an ecological transition through innovative, inclusive, and sustainability-driven urban planning.
To this end, this work aims to develop an integrated methodology based on Multi-Criteria Decision Analysis (MCDA) for the assessment of environmental and urban vulnerability in highly urbanised areas with significant industrial pressures.
MCDA offers a robust framework for addressing complex problems involving multiple heterogeneous and interdependent variables that must be considered simultaneously [34,35].
The proposed approach aims to fill the methodological gap in spatial planning tools that are capable of integrating geospatial data, environmental monitoring (traditional and from widespread sensors), socio-economic indicators, and urban infrastructure into a single vulnerability assessment framework. The adopted methodology is replicable and scalable for territorial analysis and can be adapted to other urban industrial contexts facing similar environmental challenges.
The output of the analysis is not limited to cartographic representation alone but takes on a proactive role in supporting decision-making processes through the identification and spatial classification of environmental criticalities, thereby enabling the targeted implementation of Nature-based Solutions (NBSs) calibrated according to the environmental, infrastructural, and social characteristics of individual urban areas [36]. In particular, the methodology can guide the identification of suitable areas for the implementation of green belts, vegetative barriers, artificial wetlands for wastewater treatment, green roofs, and multifunctional urban forests, to improve air quality, reduce the impact of heat islands, mitigate hydraulic risk, and contribute to carbon sequestration.
In summary, this research aims to answer these questions: How can an MCDA framework be constructed to assess urban and environmental vulnerability in a data-rich, heterogeneous context? What are the most suitable types of NBS that can be spatially matched to the identified levels of vulnerability? How can this framework guide mitigation strategies that are both evidence-based and socially inclusive, contributing to long-term urban resilience?

2. Materials and Methods

2.1. Research Design Overview

This study aims to develop a spatially explicit framework for assessing territorial environmental vulnerability in a highly urbanised and industrialised coastal city. The research design is structured in four main phases:
  • Definition of objectives and study area to identify and map territorial vulnerability patterns using open and harmonised spatial data in the municipality of Taranto (Southern Italy), an area exposed to multiple anthropogenic pressures;
  • Selection of indicators and data processing based on the literature and policy relevance. We selected a set of indicators (land use, population density, proximity to emission sources, vegetation cover, presence of sensitive services, and AERMOD pollutant dispersion data) and harmonised them using a GIS-based environment. All layers were rasterised and normalised to ensure comparability;
  • Multi-criteria analysis (MCA) based on a weighted overlay approach to integrate the indicators into a composite Territorial Vulnerability Index (TVI), using expert judgment and sensitivity analysis to define weights. The vulnerability values were classified into five levels, from low to high;
  • Validation and spatial interpretation to validate the spatial coherence of the results through hotspot analysis, consistency checks with known pollution and population exposure data, and qualitative comparison with previous studies and environmental reports.
This structured and replicable workflow ensures methodological robustness and supports practical applications in urban planning and environmental policy.

2.2. Study Area

The study area represents a territory of considerable environmental, social, and morphological complexity. This is an area with a strong functional mix, in which historical and recent residential settlements, natural areas of ecological importance, and strategic infrastructure alternate.
In the urban sector that extends towards the north and northeast, there are numerous high-density residential sectors that also contain school buildings, health facilities, and social services. These areas are particularly exposed to significant environmental pressures linked to the proximity to the industrial and port area, the prevailing winds, and the compact urban morphology that hinders the dispersion of pollutants.
Along the coastal axis, there are alternating discontinuous urbanised areas, tourist areas, and residual green spaces, which, although fragmented, constitute important elements of microclimatic mitigation and potential ecological connection. In the innermost part, near the salt pan and the northern reaches of the sea, there are areas with an agricultural and transitional vocation, with the presence of natural and semi-natural habitats, including protected areas of the ZSC and ZPS types (Special Conservation Zones and Special Protection Zones), which protect humid ecosystems and significant biodiversity [37].
From a morphological point of view, the territory shows a certain heterogeneity: in the hilly areas to the northeast, there are steep slopes, with critical issues related to inefficient surface drainage, which accentuate the hydrogeological risk in the event of intense rainfall events. On the contrary, in the coastal plain, the low slope and low permeability of the soils favour water stagnation and accumulation of pollutants, accentuating the vulnerability of the environmental matrices.
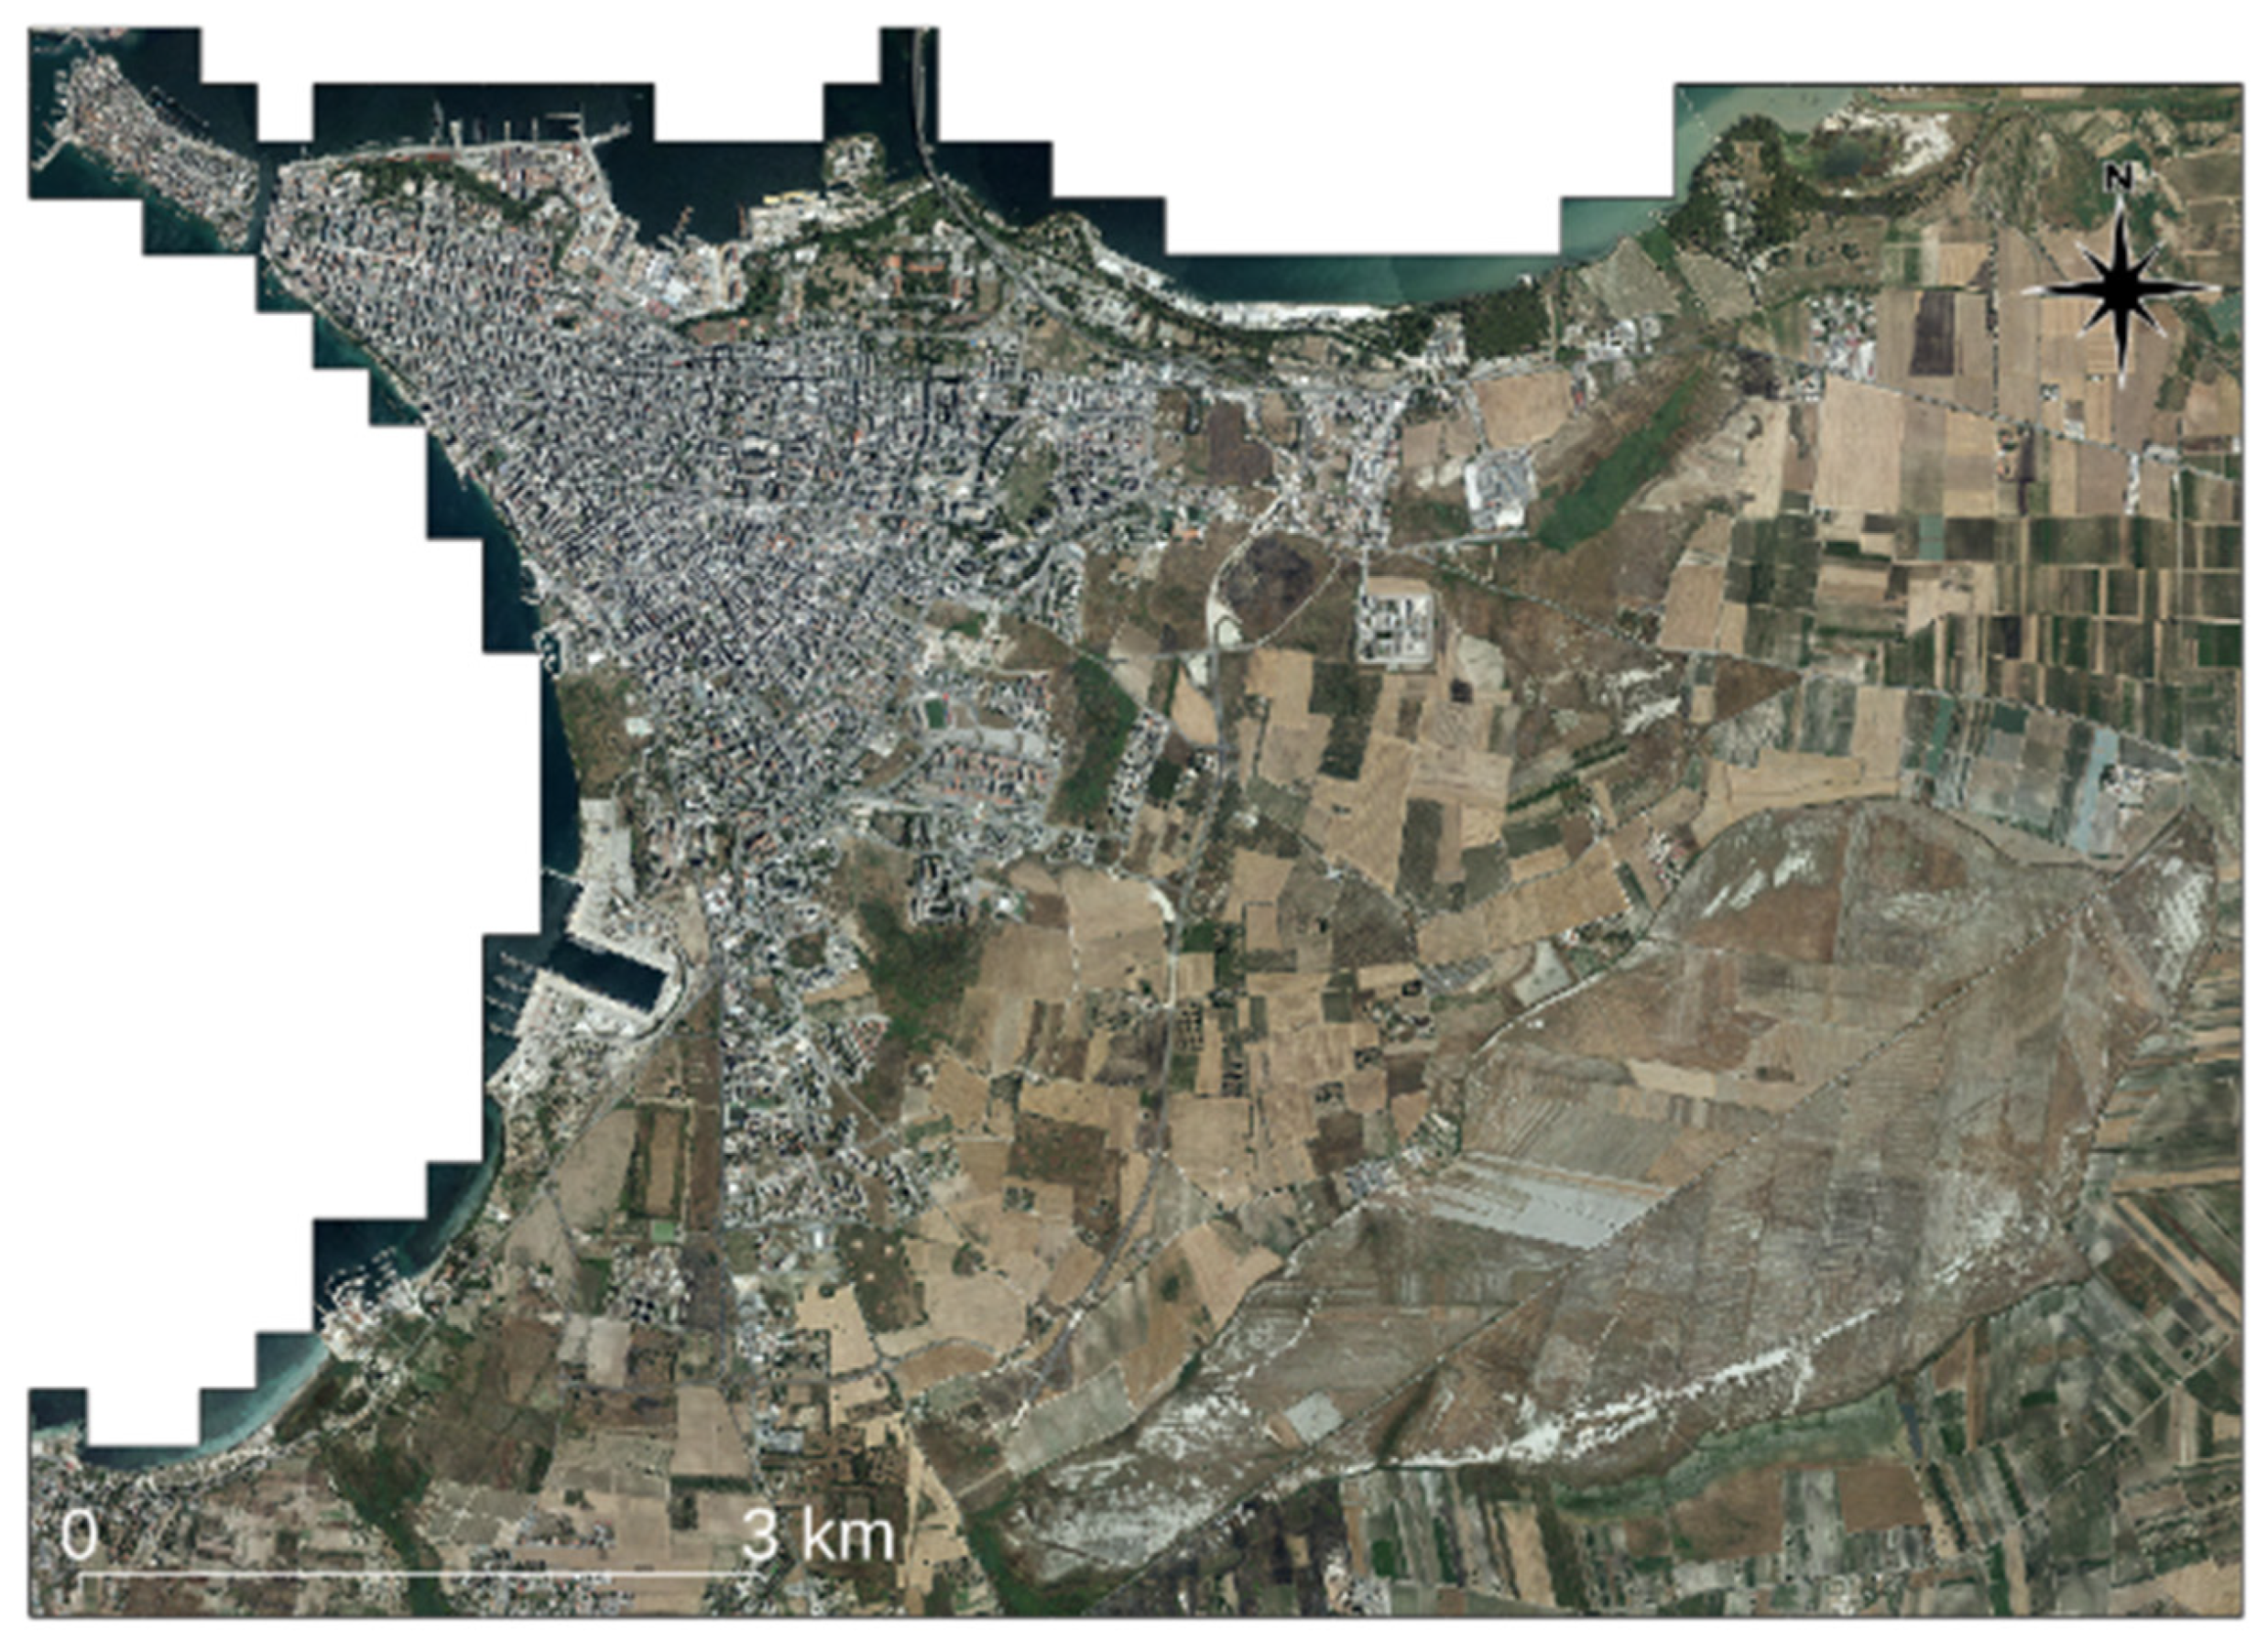
Land use in the Taranto area is highly fragmented and characterised by a complex spatial configuration. According to the Corine Land Cover (CLC) dataset—produced by the European Environment Agency (EEA) through a standardised methodology—the territory includes a mix of artificial surfaces (CLC code 1), agricultural areas (code 2), forest and semi-natural areas (code 3), wetlands (code 4), and coastal waters (code 5). Each land cover class is hierarchically organised using a three-level nomenclature and a numerical code system. In the Taranto municipality, dominant land cover types include continuous and discontinuous urban fabric, industrial and port infrastructure, heterogeneous agricultural zones, and limited forested or semi-natural areas. Residual green areas are often disconnected and fragmented by transport networks and built-up zones. Coastal strips are subject to seasonal anthropogenic pressure, particularly from tourism. The presence of overlapping residential, industrial, and agricultural functions nearby highlights the need for integrated planning approaches aimed at ecological connectivity, land restoration, and sustainable urban regeneration (Figure 1).

2.3. Data Processing

2.3.1. Creation of Ground Fallout Maps and Identification of Isoconcentration Areas

For the assessment of atmospheric pollutant dispersion, the inhalable particulate matter (PM10) was modelled using the AERMOD system developed by the US EPA [24]. The model application followed the standardised procedure, integrating the core AERMAP, AERMET, and AERMOD modules as described below [23].
The AERMAP preprocessor was used for the orographic characterisation of the study area. This module assigns terrain elevations and exposure sectors to each receptor using high-resolution 10 m Digital Elevation Model (DEM) data. The assessment of emissions from the steelworks present in the industrial area was made considering the main processes known to contribute significantly to atmospheric emissions. All data were converted into the format required by AERMOD and georeferenced according to the model’s reference system. The adopted coordinate systems were ETRS89 UTM Zone 33N for horizontal referencing and the EVRF2000 (UELN-95/98) European Vertical Reference Frame for altimetry, compatible with the model.
Meteorological conditions required for the simulation were processed using the AERMET preprocessor, following US EPA guidelines [38]. Two data sources were employed: surface data and upper air (sounding) data. Surface meteorological data were obtained from the Grottaglie weather station (Latitude 40.51 N, Longitude 17.40 E), providing hourly information on temperature and dew point (°C), cloud cover (feet), visibility, wind speed and direction (knots), relative humidity, and atmospheric pressure (hPa). The considered period covered a full year, from January 1 to December 31. Upper air-sounding data were obtained from the Brindisi synoptic weather station (Latitude 40.66 N, Longitude 17.95 E), located near the study site, and were essential for defining the vertical atmospheric profile. The parameters included pressure (hPa), temperature (°C), relative humidity (%), wind speed (knots), and wind direction (°). The preprocessing phase included the computation of atmospheric boundary-layer parameters such as boundary-layer height, Monin-Obukhov length, and atmospheric stability classification [39].
The AERMOD model was used to simulate the atmospheric dispersion of PM10 emissions. Annual average concentrations were calculated for each of the total receptors across the entire year. For each of the pollutant sources, the following stack parameters were specified: geographic coordinates; elevation; and stack characteristics, including emission rate (QS, g/s), stack height (HS, m), stack exit temperature (TS, K), exit velocity (VS, m/s), and stack diameter (DS, m). The model output provided the annual average concentrations of PM10 at each receptor in the defined grid.
The data used are those relating to 2018, in the pre-COVID era, when the industrial areas were in full activity. The purpose of this technique is to identify theoretical areas with isoconcentration of pollutants at the soil level through the development of raster maps derived from dispersion models. The methodology involves the use of GIS algorithms to generate contour lines representing constant concentration intervals. These curves allow for the delineation of homogeneous zones, facilitating the spatial analysis of exposure levels and supporting targeted environmental decision-making.

2.3.2. Identification of Useful Themes and Calculation Grid

A geospatial database was developed incorporating the following parameters: land use based on the Corine Land Cover (CLC) dataset provided by the Institute for Environmental Protection and Research [40], sensitive services extracted from OpenStreetMap (OSM) through custom queries [41,42], and pollutant dispersion maps generated using the AERMOD atmospheric dispersion modelling system.
The CLC dataset was categorised into four primary land use classes: artificial, agricultural, wetlands, and woodland. The artificial category includes all anthropogenically influenced areas, such as industrial and commercial zones, isolated buildings, continuous and discontinuous urban fabric, transportation networks, mining sites, landfills, and construction areas. The agricultural class encompasses croplands, orchards, permanent grasslands, simple arable systems, agroforestry systems, olive groves, and vineyards. The wetlands category includes inland wetlands, artificial lakes, and reservoirs. The woodland class comprises rocky environments, sparsely vegetated areas, coniferous forests, broad-leaved forests, mixed forests, transitional woodland–shrub areas, and evolving shrub vegetation. Sensitive services were identified using OSM data, focusing on areas with high human presence, including places of worship, schools and universities, hospitals, sports centres, shopping centres, and green spaces. These locations were designated as buffer zones due to their vulnerability. Atmospheric dispersion maps of PM10 particulate matter were produced to assess emissions originating from an industrial area located in the northwestern sector of the study area. A spatial grid with a resolution of 250 m was established across the study area. Each grid cell was assigned a vulnerability index value, calculated according to the methodology described in the following section.

2.3.3. Multi-Criteria Analysis for the Calculation of the Territorial Vulnerability Index

The proposed approach aims to identify, classify, and map territorial vulnerability through the construction of territorial indicators resulting from the integration of geospatial data and the presence of urban structures and places of aggregation. The criteria considered include the following:
  • The concentration levels of PM10 air pollutants;
  • The presence of sensitive infrastructure (e.g., schools, hospitals, and places of worship);
  • The presence of urban and peri-urban green areas and the presence of natural areas to mitigate polluting loads;
  • The presence of other sources of widespread pollution, such as intensive agriculture;
  • The presence and extension of urban areas through land use.
With the availability of these data, a matrix of criteria normalised and weighted through consolidated methods (e.g., AHP—Analytic Hierarchy Process) was created. This allows for the generation of territorial vulnerability maps, which are useful in supporting local administrations in strategic planning and in defining intervention priorities. In environmental and urban planning studies, several indices of territorial vulnerability have been proposed to identify areas at risk or particularly sensitive to anthropogenic and natural impacts. Among these, the Environmental Vulnerability Index (EVI) developed by SOPAC (South Pacific Applied Geoscience Commission) and UNEP in 2005 is one of the best known and considered among over 50 indicators divided into climatic, geophysical, biological, anthropogenic, and social categories [43]. Other examples include the Territorial Vulnerability Index (IVT), which integrates socio-economic, infrastructural and environmental indicators to support territorial governance and risk prevention [44]. The Integrated Vulnerability Index (IVI), which has been adopted in various regional studies, incorporates factors such as land use, population density, accessibility to services, vegetation cover, land morphology (slopes, soils, and drainage), and infrastructural pressure (e.g., presence of roads, industrial activities).
In particular, parameters frequently used in the construction of these indices include land use (residential, agricultural, and industrial), density and accessibility of sensitive services (schools, hospitals, religious centres, and sports facilities), extension of green and protected areas, soil morphology (slope, permeability, and drainage capacity), and anthropogenic pressure (building density, traffic, and emissions). The construction of these indices often uses multi-criteria weighting techniques, such as the analytic hierarchy process (AHP) [45,46], to establish the relative importance of the factors and GIS tools for their spatial representation. These approaches allow for the identification of priority areas for mitigation and adaptation interventions, especially in urban and peri-urban contexts subject to high environmental pressures [47].
Considering that there is currently no univocal index capable of fully integrating all the parameters necessary for mapping territorial vulnerability—aimed at identifying homogeneous areas where different types of nature-based solutions can be specifically applied—it is considered appropriate to define a specific indicator for the study area. Although there are already consolidated models and indices of territorial vulnerability, especially in the fields of environmental planning, risk management, and urban resilience, it is necessary to develop a methodology that allows for the inclusion and valorisation of the peculiar factors of the local context. This approach will allow for more effective targeting of mitigation and adaptation strategies, in line with the morphological, socio-environmental, and infrastructural characteristics of the analysed territory.
Multi-criteria analysis is a decision-making technique that allows for the evaluation of complex alternatives by simultaneously considering multiple often heterogeneous and conflicting criteria. It is used in the environmental, territorial, and urban planning fields to support strategic choices in the presence of multiple factors, assigning weights and priorities to each criterion. It allows for a transparent and structured evaluation of alternative scenarios.
Therefore, a vulnerability index of the territory was created based on the following methodological proposal for a composite multi-criteria index based on the analytic hierarchy process (AHP) with analysis in a GIS environment [48] by weighting each of the following parameters according to importance (Table 1):
To ensure comparability between the different variables used in the calculation of the vulnerability index and to minimise potential biases due to differences in scale, all numerical series were normalised by dividing the values of each series by its maximum value. This process allowed for the transformation of the data into dimensionless series with values between 0 and 1, thereby facilitating comparison between the elements, the uniformity of the analysis scale, and the interpretation of the results. Furthermore, this normalisation makes it easier to identify patterns and trends, improving the overall readability of the model.
The values thusly obtained were subsequently compared through a weighting process, assigning each parameter a specific weight based on its relevance within the evaluation system. Therefore, the overall vulnerability index is calculated as a weighted combination of the normalised values relating to each macro-theme: U (land use and human density), S (sensitive services), E (ecological mitigation elements), and D (pressures deriving from industrial and infrastructural activities).
The determination of the weights was carried out through a multi-criteria analysis according to the analytic hierarchy process (AHP) procedure based on comparative judgments that reflect the perceived relative importance of the criteria. The weights were assigned based on an in-depth knowledge of the study area—gained through years of direct work addressing various environmental issues—and on an informed understanding of the relative influence of the analysed variables (U, S, E, and D) in assessing the overall environmental condition. Each indicator was normalised and weighted through a knowledge-based approach, considering their impact on exposure and sensitivity. It is important to underline that the green component (E), as an element that contributes to risk mitigation, is considered with a negative sign in the overall formula of the index, since it represents a factor that reduces the vulnerability of the territory.
Below is the matrix of criteria developed according to the AHP methodology (Table 2), with the corresponding weighted average values used to calculate the final index according to Formula (1).
Therefore, the formula for calculating vulnerability with multi-criteria analysis is expressed as follow:
IVT = 0.1 × U + 0.45 × S + 0.24 × (1 − E) + 0.22 × D
where
U—the normalised value of land use;
S—the normalised value of sensitive services;
E—the normalised value of ecosystems;
D—the normalised value of dispersion.
The value of the Consistency Ratio (CR), a metric used in the analytic hierarchy process (AHP) to assess the consistency of pairwise comparisons made in a decision-making process, is 0.04; therefore, being less than 0.1, the judgments in the matrix are considered consistent.

2.3.4. Classification Model

This data informed a five-level territorial classification model designed to categorise areas as high, medium, or low impact. To facilitate the interpretation and spatial analysis of environmental vulnerability across the study area, the normalised raster values (ranging from 0 to 1) were classified into five ordinal vulnerability classes using a threshold-based approach. The classification thresholds were defined based on equal-width intervals of 0.1, with an additional upper class for extreme values, as follows:
  • Very High Vulnerability: >0.70
  • High Vulnerability: 0.70–0.60
  • Moderate Vulnerability: 0.60–0.50
  • Low Vulnerability: 0.50–0.40
  • Very Low Vulnerability: <0.40
This classification allows for a consistent comparison of spatial patterns, simplifies cartographic representation, and enables the identification of priority areas for mitigation actions, such as the targeted implementation of nature-based solutions (NBSs). The chosen thresholds are empirically defined and reflect increasing levels of environmental pressure and exposure as determined by the multi-criteria vulnerability model.
Some boundaries highlighted by the classification thresholds have been slightly modified to make them coincide more precisely with the layout of urban areas and extra-urban roads.
These levels corresponded to urbanised or industrial areas characterised by high levels of soil sealing, pollutant deposition, and anthropogenic pressure and mixed-use or peri-urban areas that represent transitional spaces between high-density urban fabrics and rural landscapes, predominantly agricultural or natural areas, with limited anthropogenic disturbance and greater ecological continuity, respectively.
These areas were identified through the values of the territorial vulnerability index and expert judgement based on knowledge of the places [49,50,51,52,53].

2.4. Nature-Based Solution Catalogue

Based on the outlined territorial classification, a decision-making workflow was structured for the allocation of nature-based solutions (NBSs) [36,54,55,56,57]. This workflow is differentiated according to several key factors: territorial typology, pollution level, and intervention objective.
The territorial typology includes categories such as urban, urban–industrial, urban-natural, natural/green, and coastal areas, recognising the distinct environmental characteristics and challenges associated with each land use type. The pollution level considers the degree of pollution within each territorial typology, distinguishing between low, medium, and high levels. The objective of the intervention recognises in the NBS catalogue methods for the mitigation of pollution (reducing air or water contaminants), the improvement of water filtration (improving groundwater recharge and reducing runoff), and the promotion of ecological connectivity (creating green corridors for wildlife movement). This multi-criteria approach ensures that the selection and implementation of NBSs are context-specific and aligned with both the environmental challenges and the desired outcomes for each territorial category and pollution level. By considering these differentiating factors, the decision-making workflow aims to optimise the effectiveness and sustainability of nature-based solutions across a diverse range of landscapes.

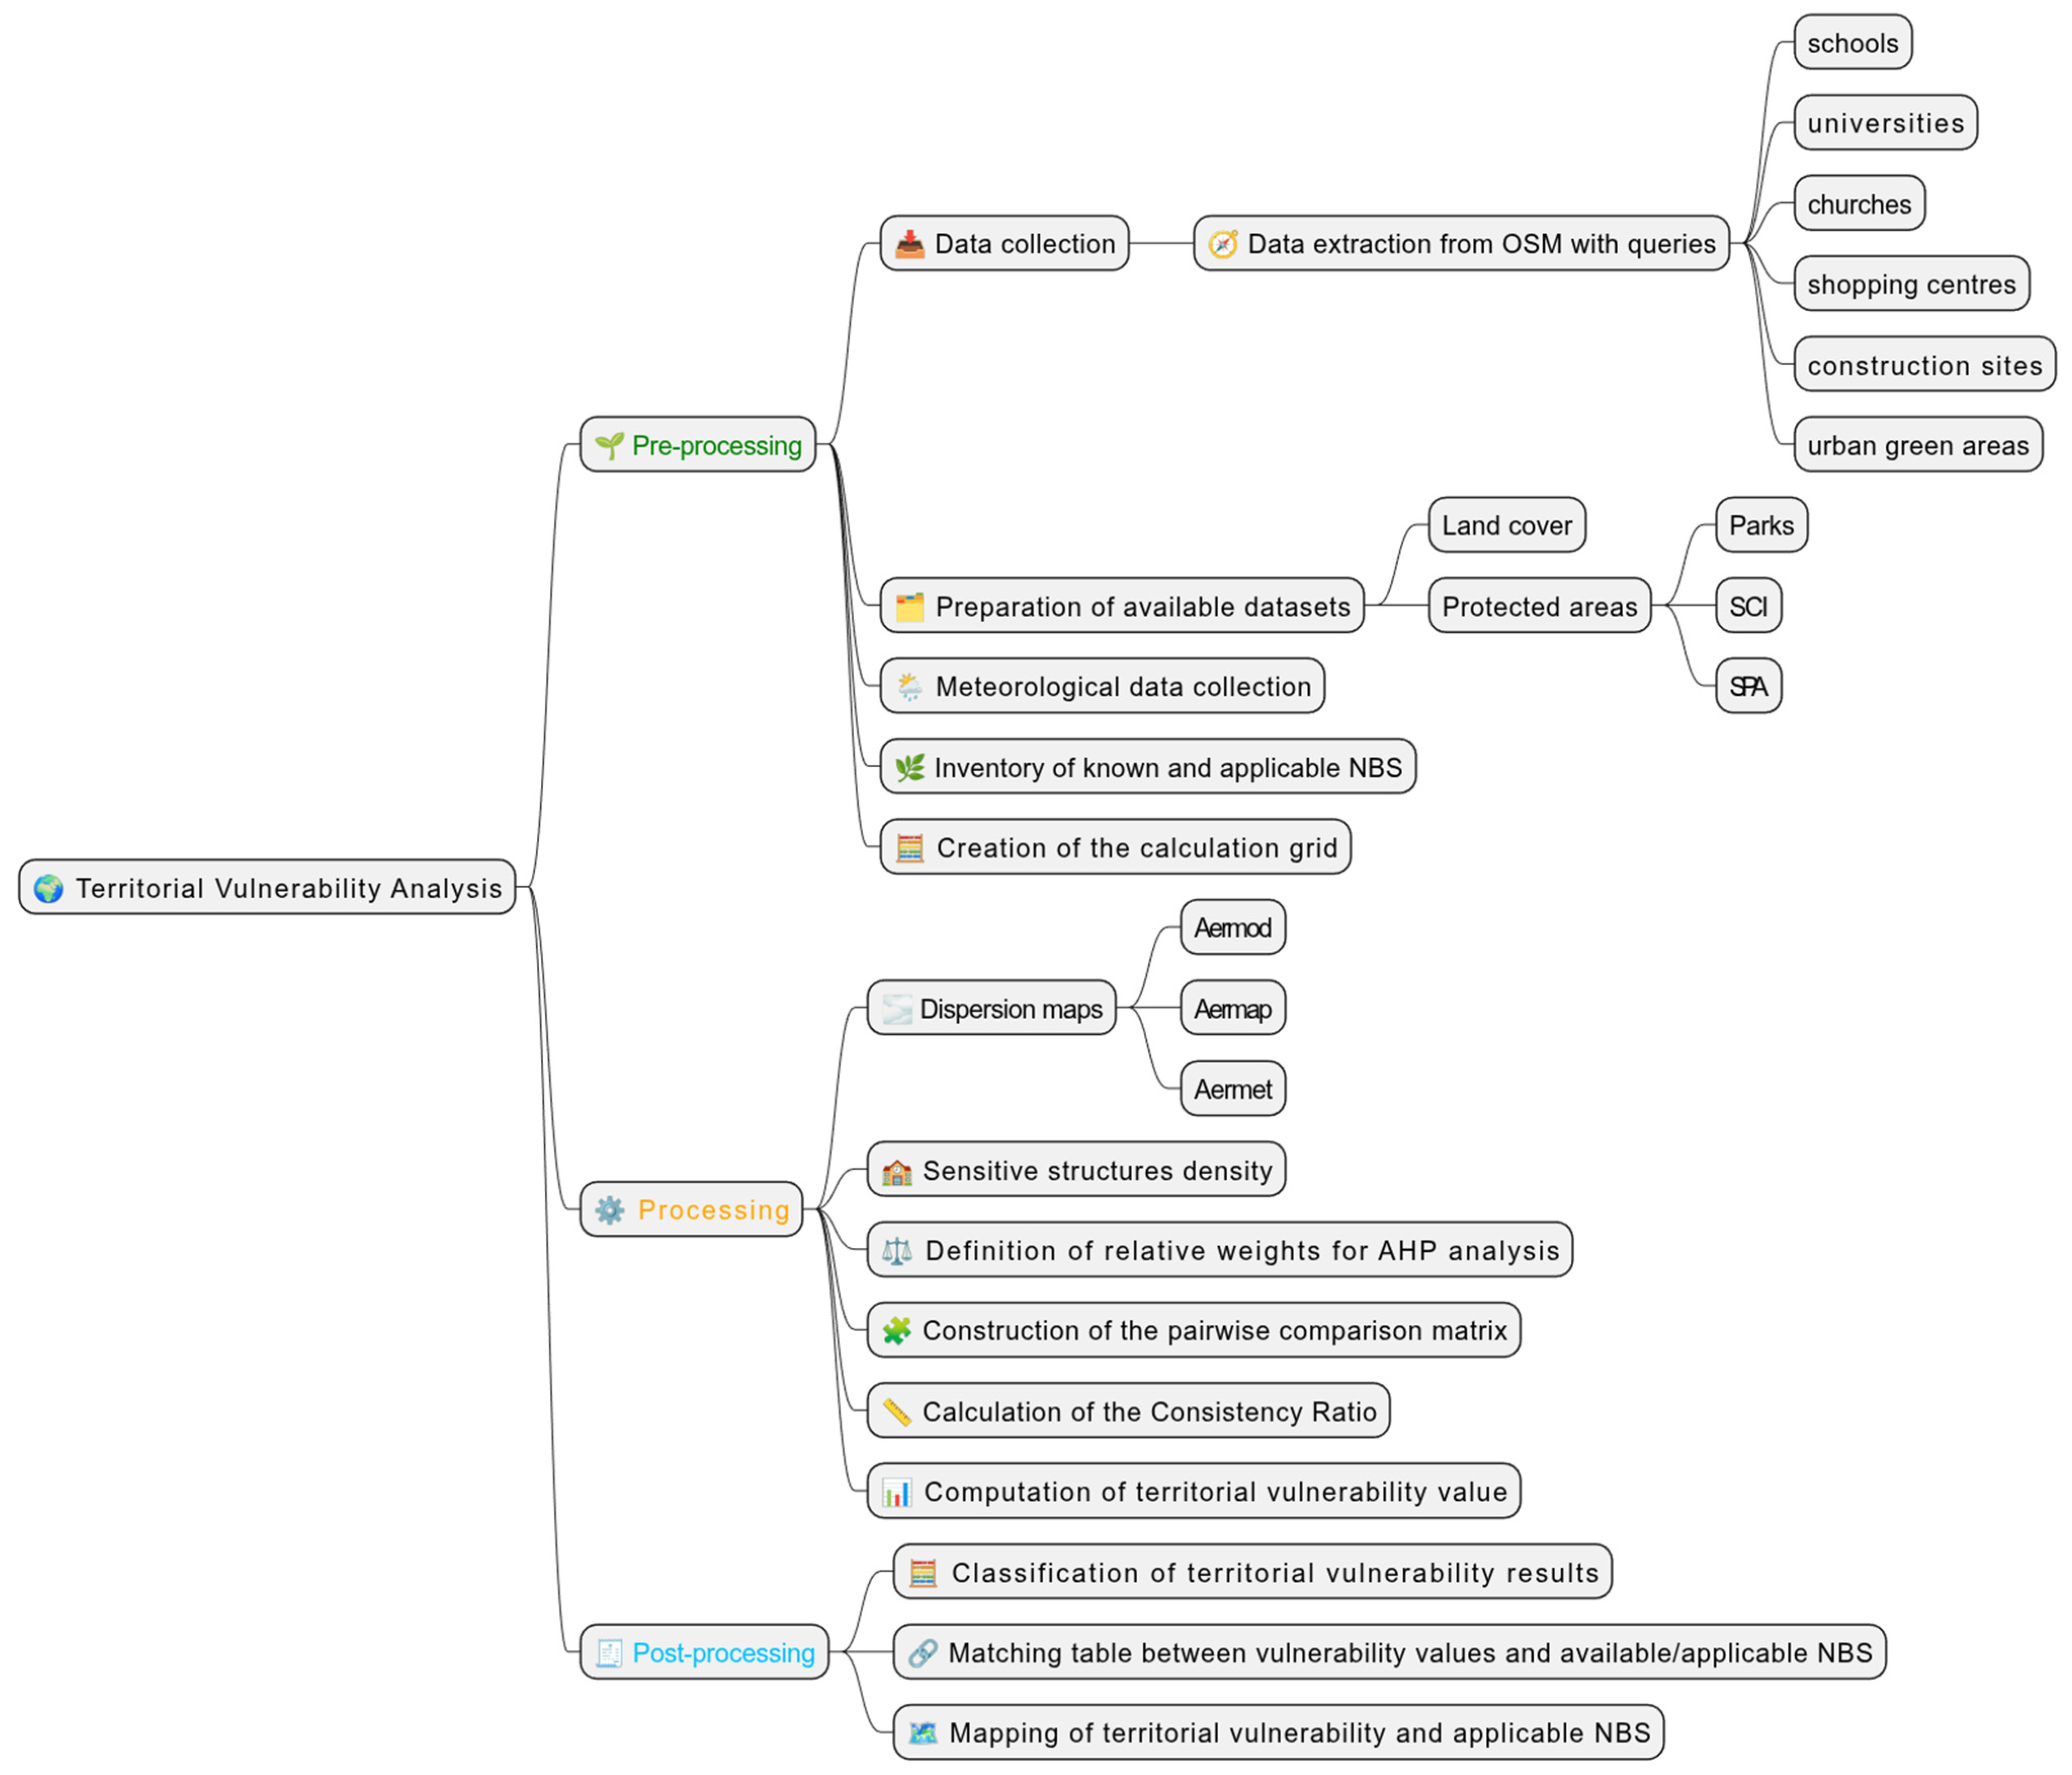
2.5. The Data Elaboration Workflow

Below is the complete data processing workflow developed for the assessment of territorial vulnerability within the study area.
This workflow integrates spatial, environmental, and socio-territorial data (Figure 2).
It serves as a decision-support tool for the identification of critical areas and appropriate mitigation strategies.

3. Results

The analysis of exposure to fine dust was carried out by identifying and classifying the theoretical values of the annual mean concentration of PM10 (expressed in μg/m3) using the results of the AERMOD environmental modelling software. The fallout maps were generated using QGIS software (version 3.22), integrating the AERMOD output data using spatial interpolation and isoline representation (Figure 3). The concentration values were classified by order of magnitude to distinguish the areas with different exposure intensities and facilitate the reading of the pollution gradients. This cartographic representation allows for identification of the areas of greatest environmental criticality, offering visual and analytical support to territorial planning and the definition of mitigation measures based on the targeted application of nature-based solutions.
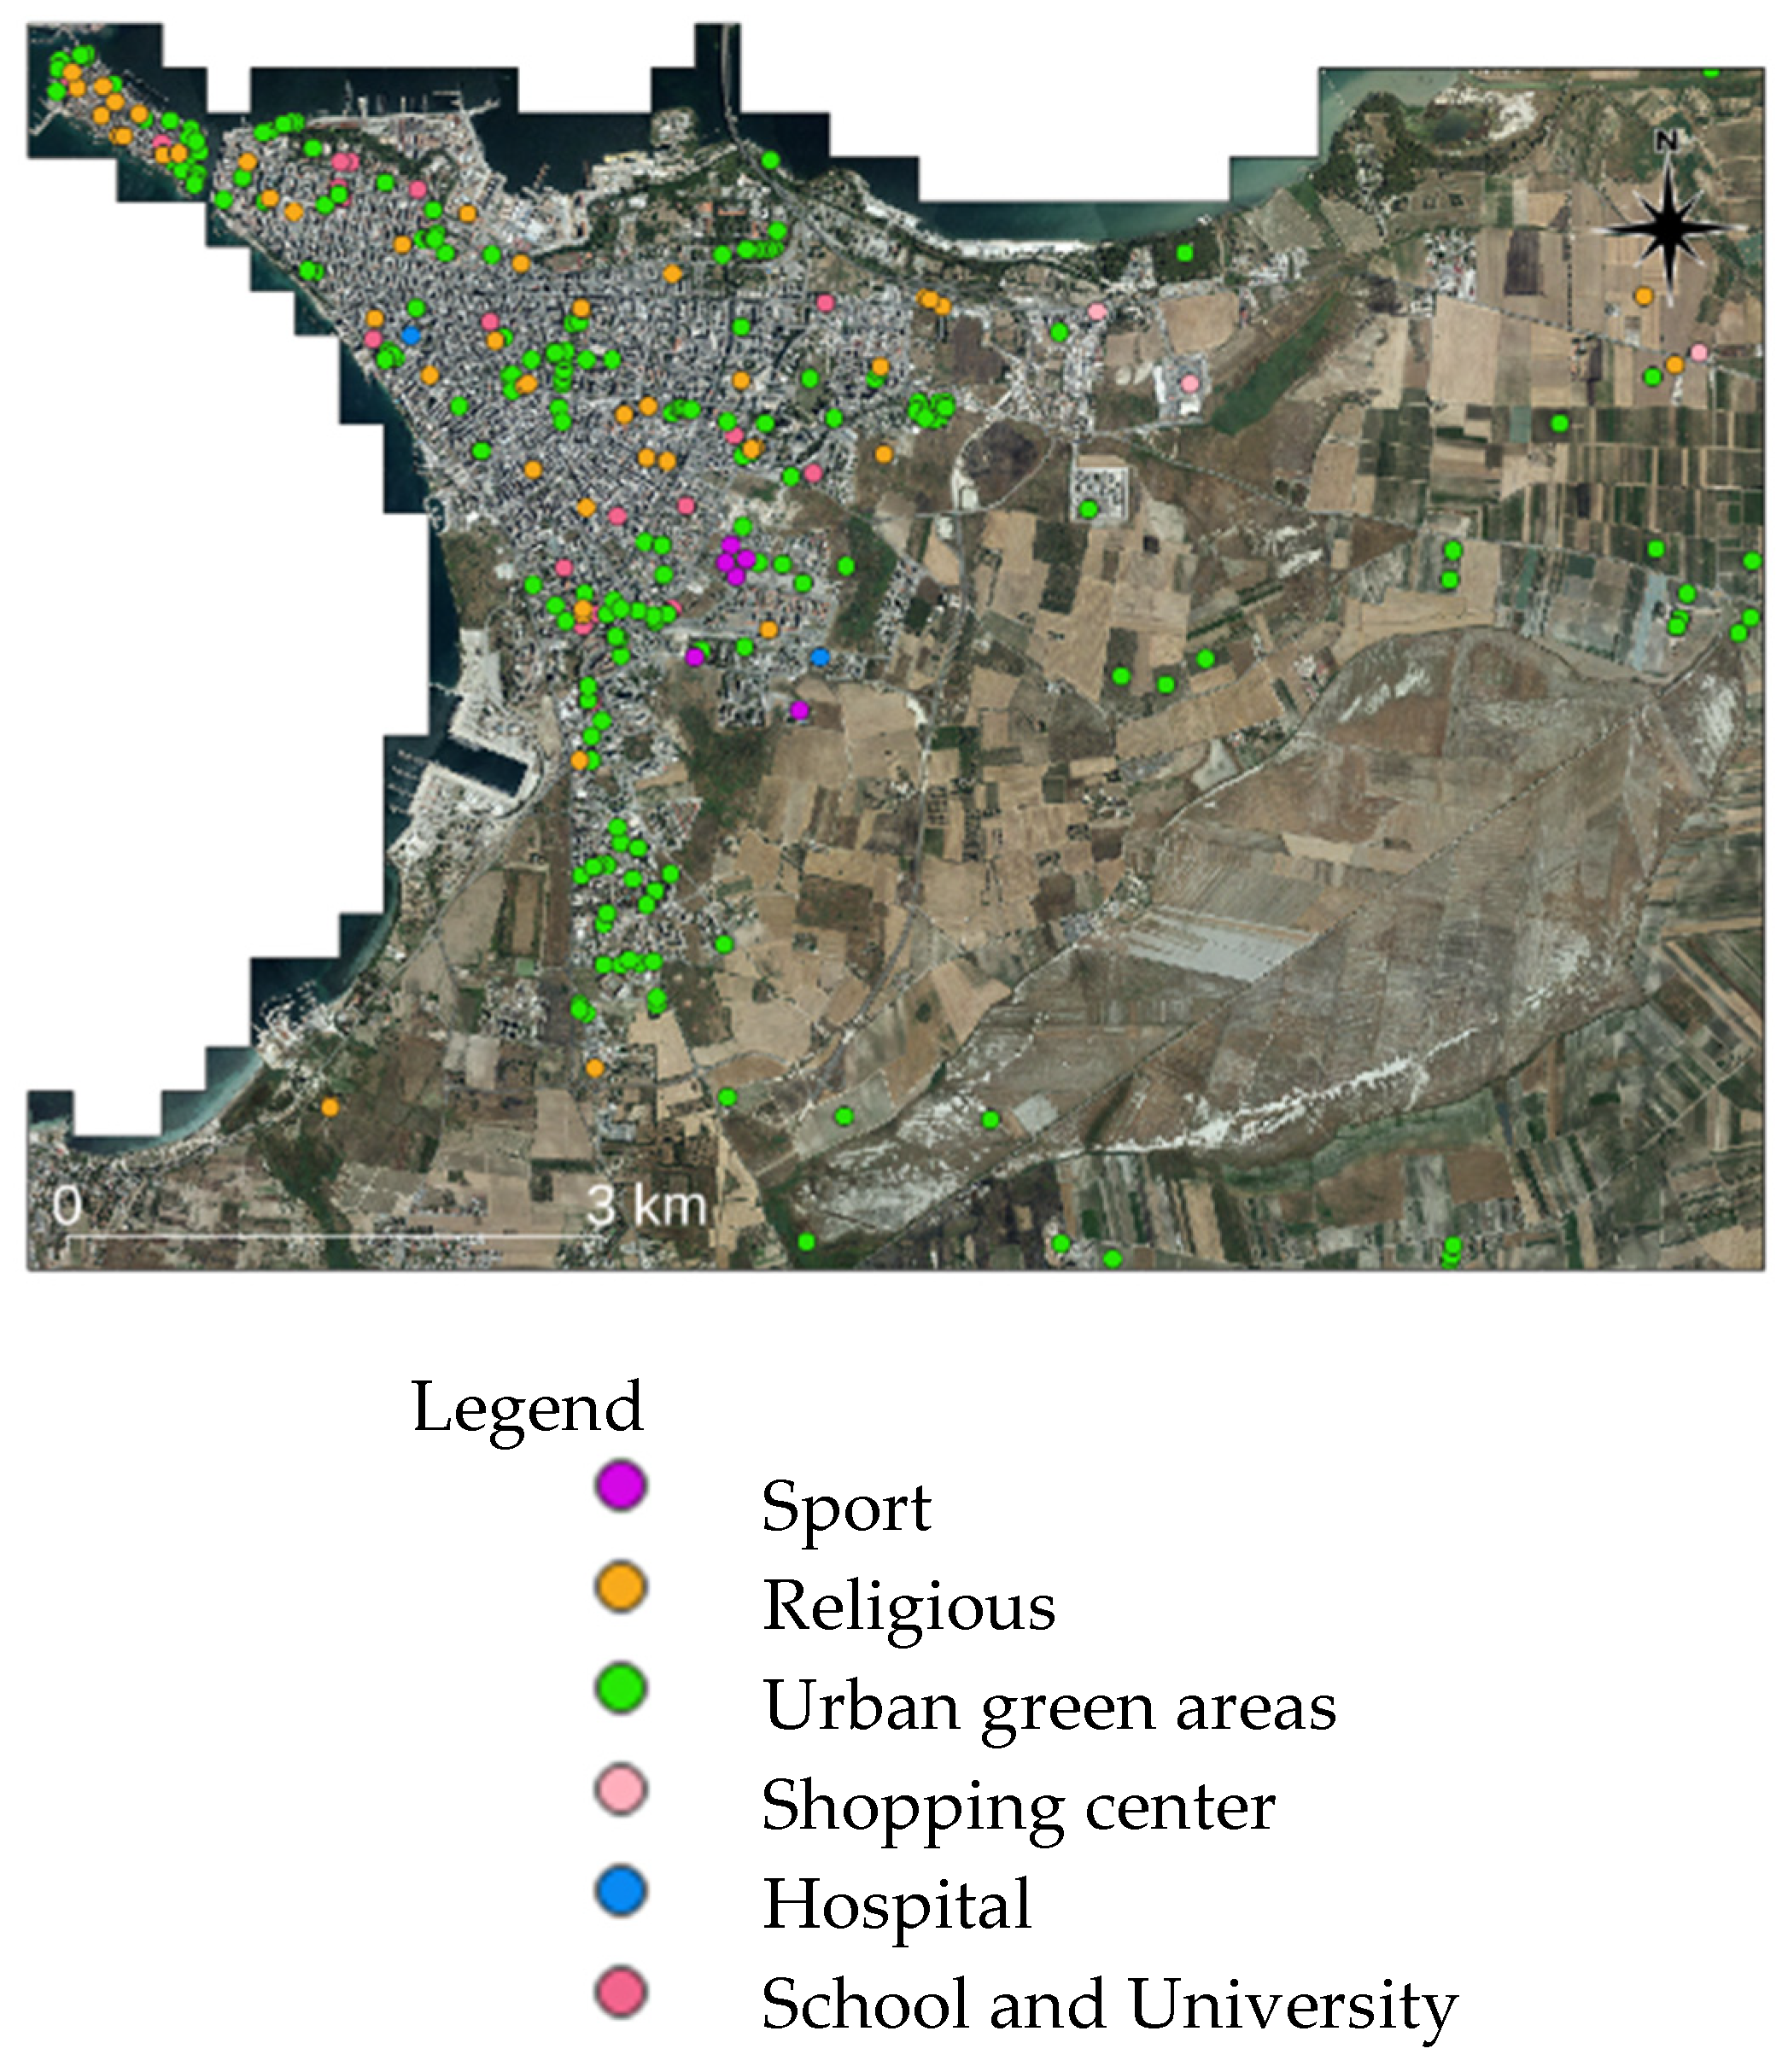
Through a series of OpenStreetMap queries, several themes of urban and social relevance were extracted, which were useful for the analysis of territorial vulnerability. The obtained data includes the centroid and area value of elements such as schools, churches, universities, shopping centres, meeting places, and urban green areas. These elements, once georeferenced and integrated into the territorial information system, constitute an important contribution to the understanding of the distribution of sensitive services and social infrastructure in urban areas. The acquired information is particularly significant from a citizen science perspective, as it derives from open, updatable, and continuously improvable collaborative data, thanks to the active contribution of citizens. Therefore, these themes represent an essential support in evaluating the relationship between environmental exposure and the presence of vulnerable populations and are fundamental in identifying priority areas for mitigation interventions and sustainable planning (Figure 4).
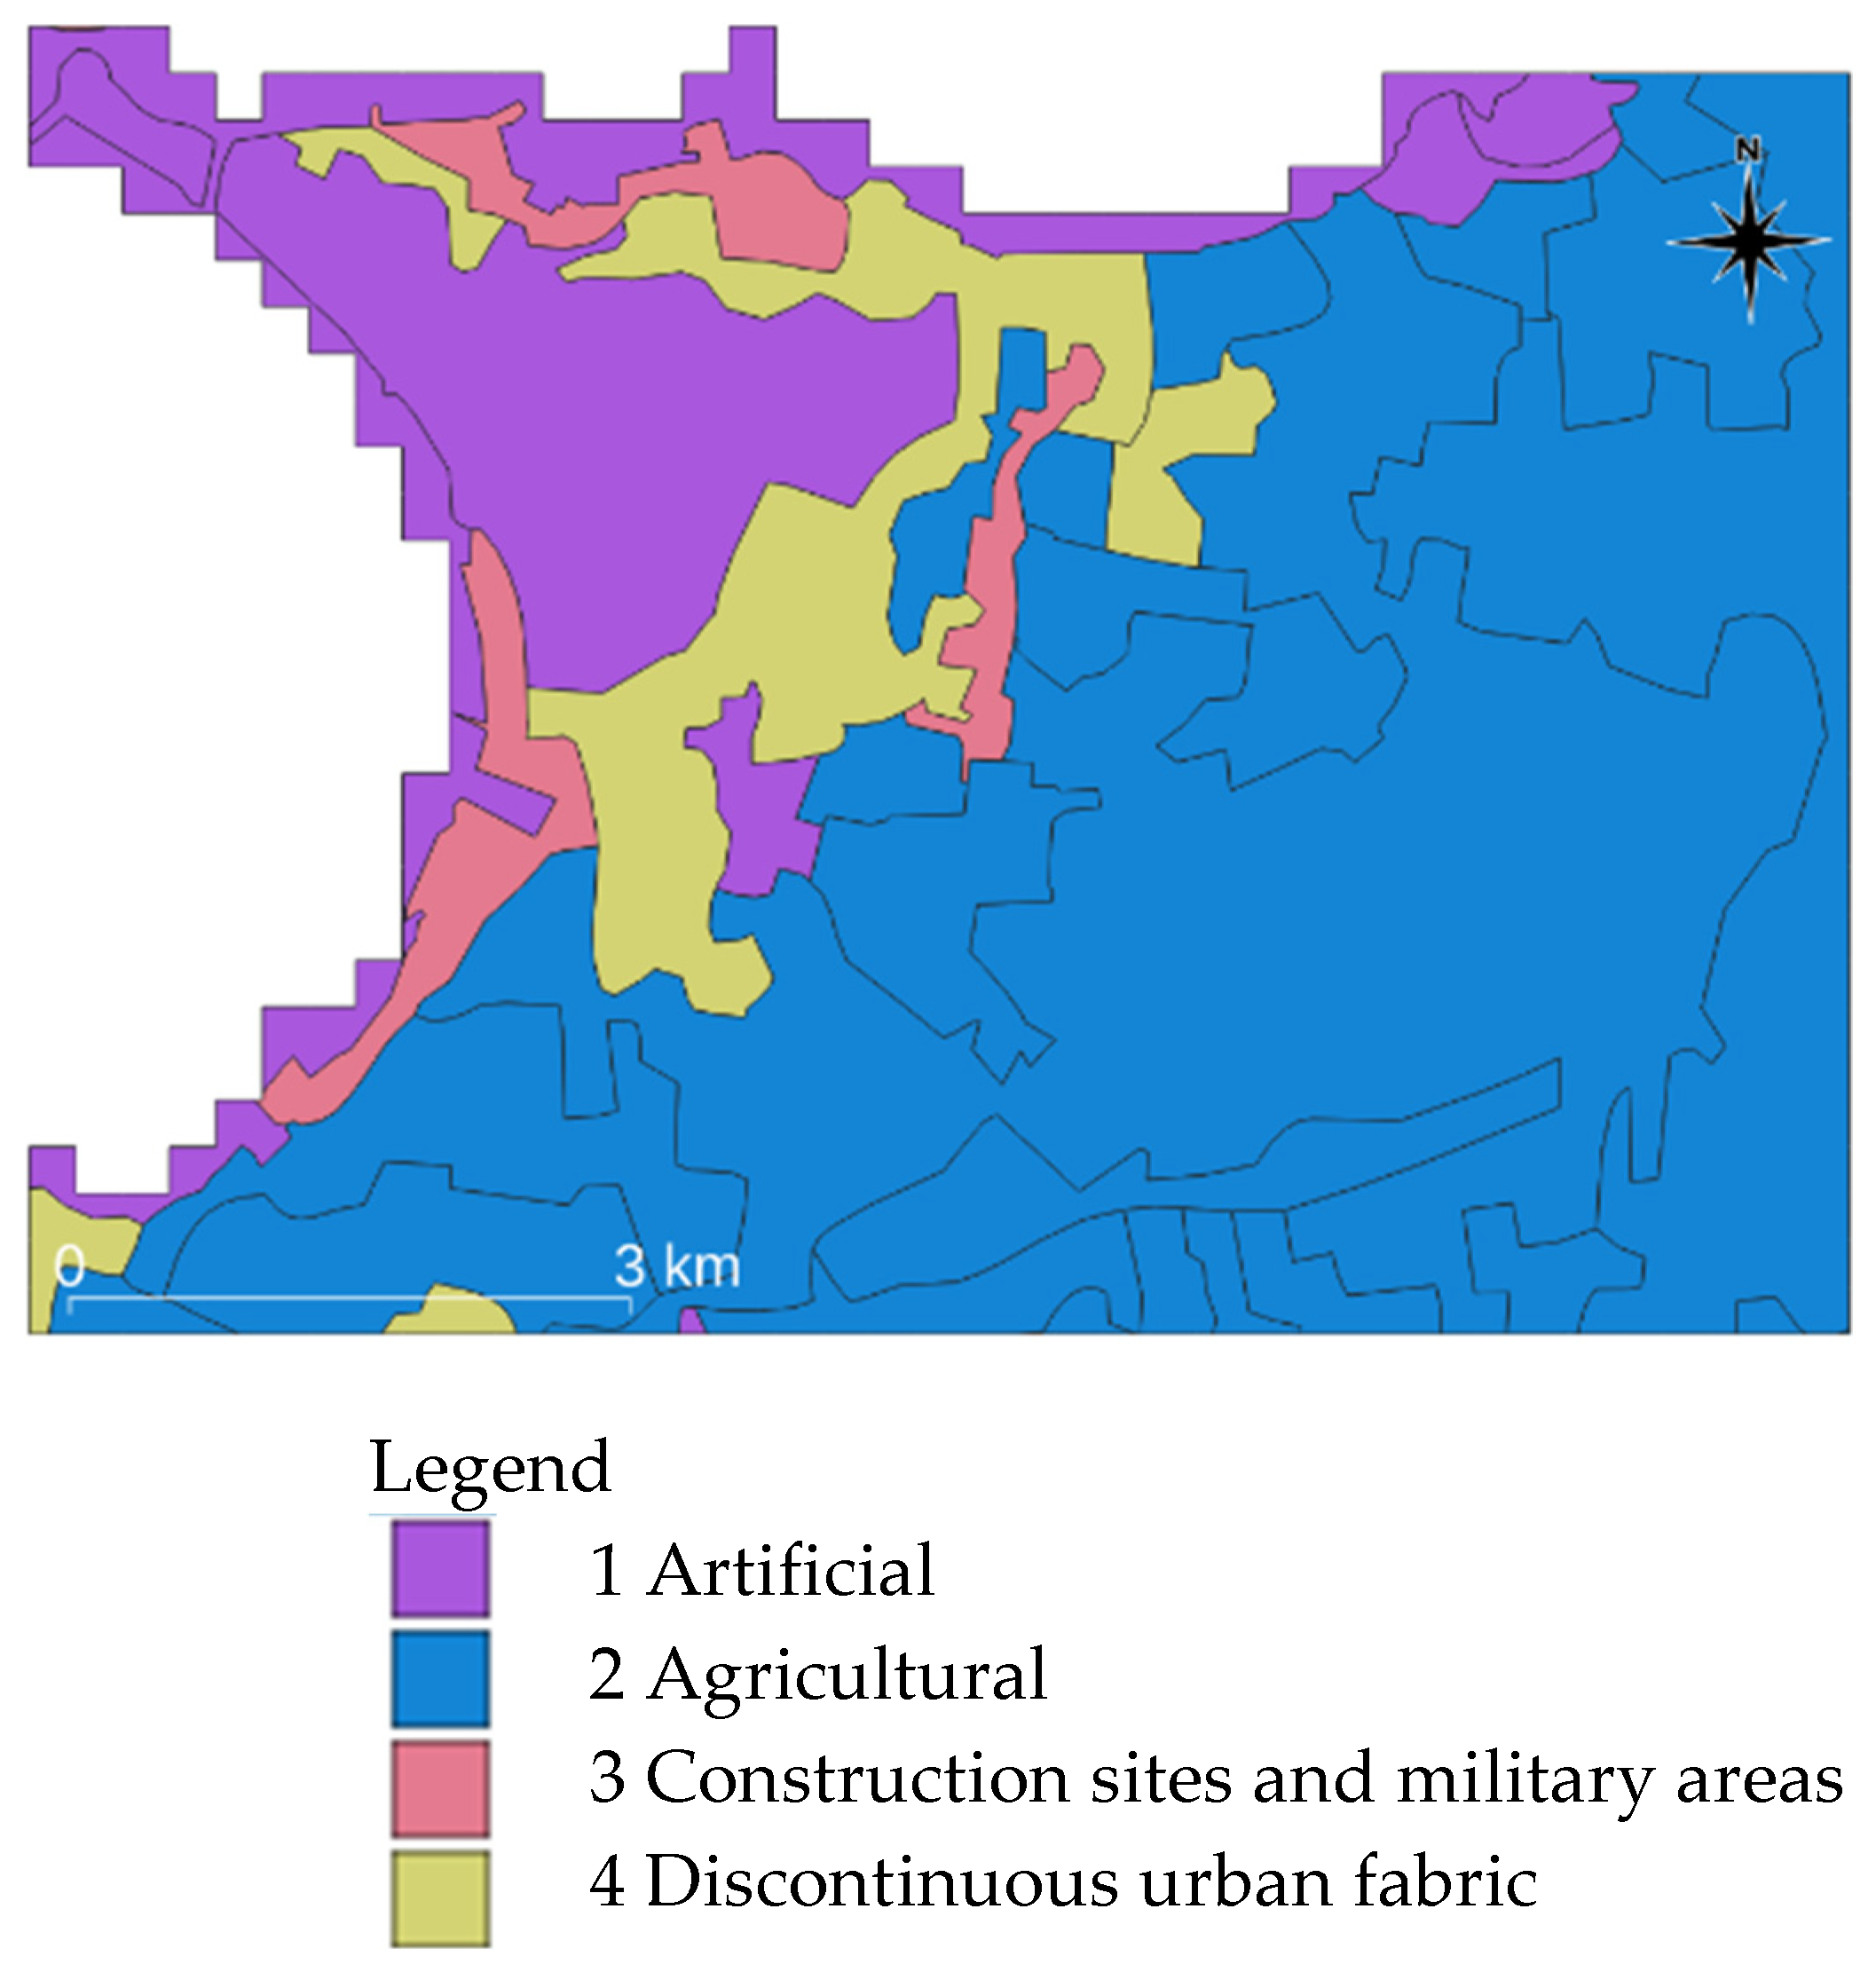
Land use mapping was carried out using the Corine Land Cover data classification, which allowed us to distinguish the main land cover categories in the study area. The identified themes include agricultural areas (Agricultural), artificial surfaces both residential and industrial (Artificial), wooded areas (Woodland), and wetlands (Wetland). The spatial analysis of these categories allows us to evaluate the interaction between anthropogenic pressures and natural components of the landscape, contributing to the definition of territorial vulnerability as a function of the intensity of use and the resilience capacity of the different environments. Artificial areas represent potential sources of environmental pressure, while wooded and humid areas play a mitigating role in air pollution and climate change. The classification by Corine codes (Figure 5) also facilitated the integration with other thematic indicators in a GIS environment for multi-criteria analysis. The values of the CLC codes were normalised according to their contribution to the identification of vulnerability according to the following scheme: artificial continuous urban fabric = 1; artificial discontinuous urban fabric = 0.8; artificial construction sites and works in progress = 0.6; agricultural = 0.4; woodland and wetland = 0.2.
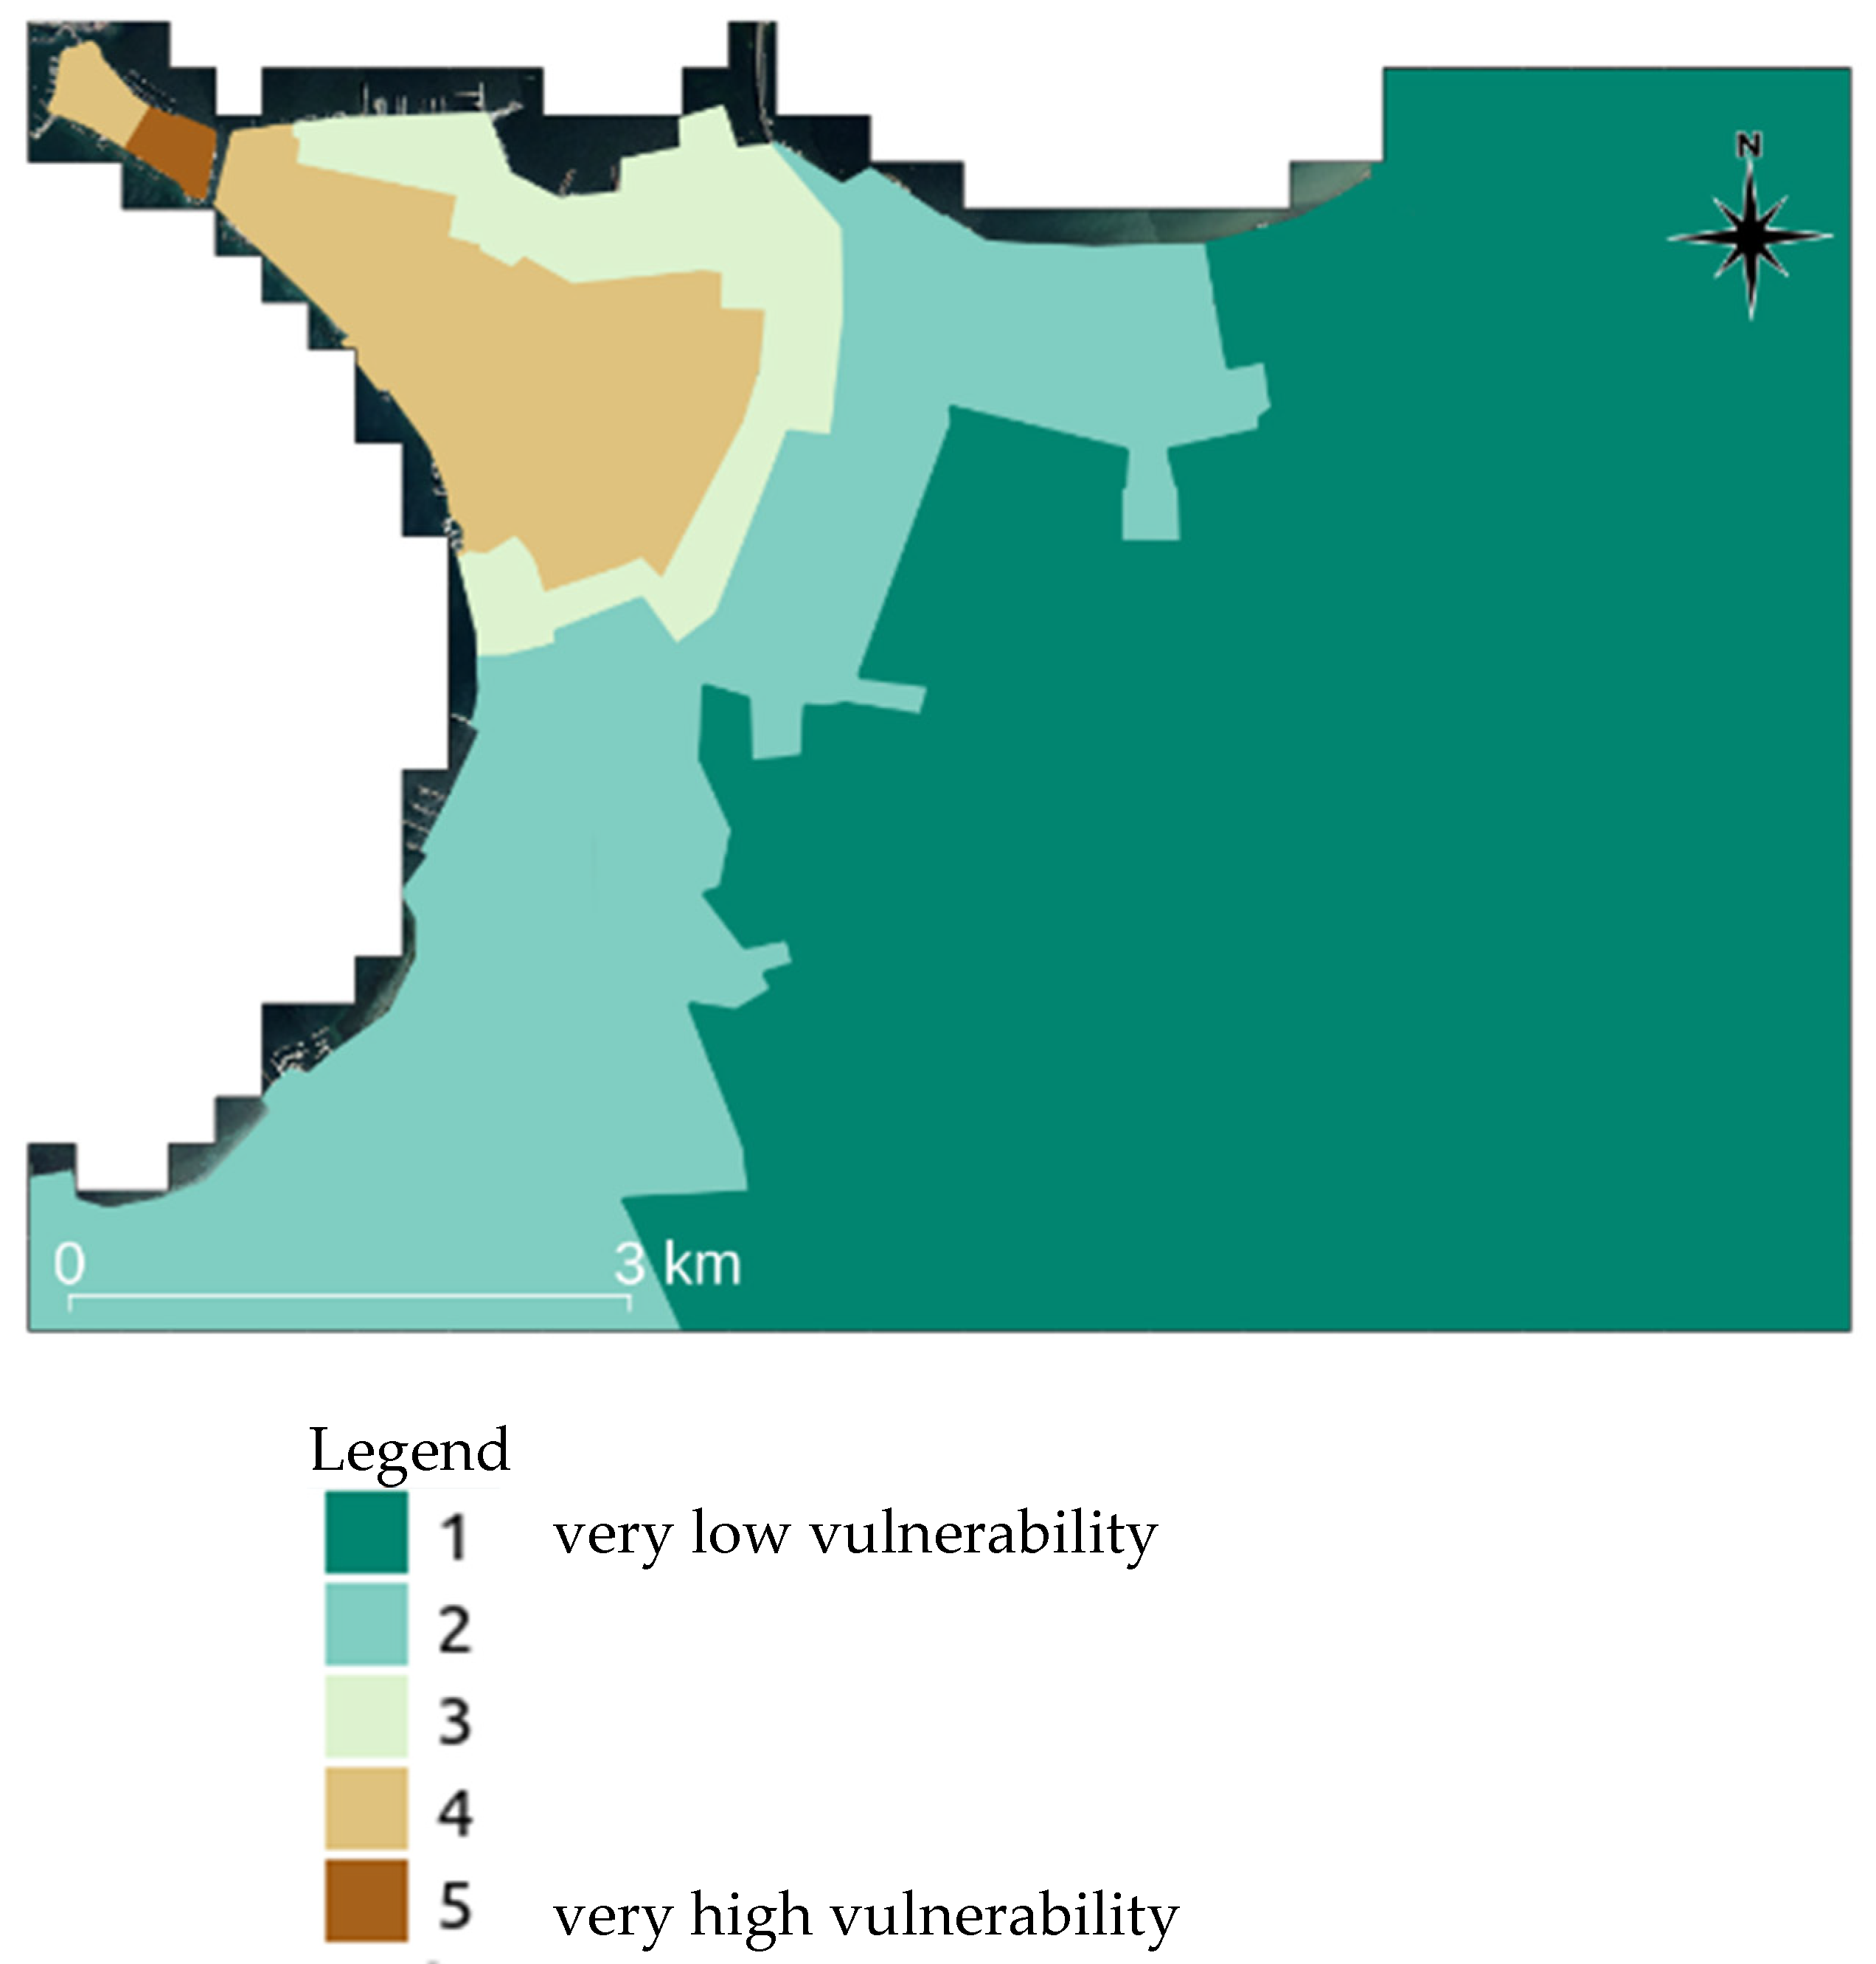
The conducted spatial analysis enabled the identification of five distinct zones characterised by a progressive gradient of pollution intensity, corresponding to classifications outlined in the nature-based solution (NBS) catalogue. These zones are as follows:
  • Low-vulnerability areas (agricultural or natural areas);
  • Medium-vulnerability areas (transition or mixed zones);
  • Vulnerability areas (urbanised and industrial zones) with low pollution levels;
  • High-vulnerability areas (urbanised and industrial zones) with medium pollution levels;
  • High-vulnerability areas (urbanised and industrial zones) with high pollution levels.
The first zone, classified as a low-vulnerability area, is predominantly composed of agricultural and natural landscapes, characterised by minimal anthropogenic disturbance. The second zone corresponds to a medium-vulnerability area, representing transitional or mixed-use environments with moderate levels of urbanisation. The remaining three zones are categorised as high-vulnerability areas, encompassing urbanised and industrial territories with increasing gradients of pollution, specifically low, medium, and high pollution levels (Figure 6). These zones are subject to escalating environmental stress resulting from intensified urban and industrial activities. This stratified framework facilitated the identification and selection of targeted nature-based solutions (NBSs) tailored to the specific pollution intensity and land use typology of each zone.
In the context of the multi-criteria analysis conducted for the assessment of territorial vulnerability, a proposal for a match table was developed between the identified vulnerability levels and the most suitable nature-based solutions (NBSs) to adopt. The table allows for systematic association of each vulnerability class (low, medium, high, and very high) with a set of NBSs consistent with the environmental and socio-territorial characteristics of the area. For example, in areas with very high vulnerability, characterised by high building density and proximity to emission sources, the adoption of vegetative barriers, green roofs, and urban forestry interventions is proposed. In areas of medium vulnerability, with the presence of sensitive services and limited natural cover, vegetal buffer strips and rain gardens are suggested. This table serves as an operational tool to guide climate and environmental adaptation policies, promoting the integration of NBSs into urban and territorial planning (Table 3).

4. Discussion

The results of the conducted multi-criteria analysis allowed us to identify and classify five macro-areas of the Taranto territory based on different levels of environmental vulnerability, expressed on a scale from 1 (low vulnerability) to 5 (high vulnerability).
This classification integrates factors such as land use, population density, proximity to emission sources (industrial and urban), presence of sensitive services (schools, hospitals, etc.), vegetation cover, and PM10 dispersion data from AERMOD. These variables highlight areas where anthropogenic pressures and vulnerable populations converge, increasing environmental and health risks [58].
The historic centre of Taranto ranks highest in vulnerability due to dense construction, significant residential and daily population flows, scarce green areas, sealed soil, and proximity to pollution sources. Recommended interventions include green roofs and walls on public buildings, rain gardens, targeted micro-plantings, and smart sensors for air and soil monitoring.
Areas of lower vulnerability include dense urban neighbourhoods with heavy traffic, limited permeability, and scarce green infrastructure. Suggested nature-based solutions (NBS) involve linear urban forests, green belts separating industrial and residential zones, and the requalification of green areas with drought-resistant species.
Peripheral and northern coastal areas, with mixed land uses and low-density settlements, face additional issues such as salinisation and seasonal tourism. Hybrid strategies are proposed, including halophytic buffer zones, ecological corridors, riparian buffers, artificial wetlands near industrial and agricultural sites, vegetated strips along waterways to reduce nitrate and pesticide loads [59,60], peri-urban forestry for ecological connectivity [4], and soil monitoring for heavy metals through participatory campaigns.
The lowest vulnerability level encompasses rural zones with low population density, agricultural land use, and rich natural vegetation. Despite occasional scattered settlements and small-scale production, these areas function as ecological lungs and require preservation, as demonstrated in urban models like Paris, Philadelphia, and Mexico City [61,62,63,64,65,66,67]. Recommended NBSs include sustainable agricultural practices such as agroforestry and permanent grassland; ecological networks that connect protected areas with urban ecosystems [68]; interventions for the protection and renaturalisation of water bodies, with restoration of riparian zones [69]; and monitoring programs for chemical residues in soil and water, with the support of the network of regional agencies.
Given the complexity and multi-dimensional nature of the study area, which includes highly urbanised and industrial zones, areas of transitional land use, and agricultural/rural contexts, we employed a qualitative validation strategy based on multiple sources:
(1)
Ground-truth comparison in which the vulnerability outputs were cross-checked and supported by historical environmental data and thematic maps of environmental criticalities in the area, including known pollution hotspots (e.g., proximity to industrial facilities, areas of limited vegetation cover, and contaminated and potentially contaminated sites);
(2)
Citizen-reported data consisting of additional confirmation of vulnerable areas obtained from citizen science data (e.g., location of sensitive receptors, perceived environmental risks, and green space accessibility), which were integrated into the analysis and contributed to model calibration.
A sensitivity analysis of the AHP weighting scheme showed that the model remained robust, even when weights varied by ±10%. The classification was especially stable in areas of very high or very low vulnerability, highlighting the model’s resilience to moderate changes in expert input.
A study conducted in the Taranto area provided the first report on the elemental composition of five Mediterranean plant species (Pinus pinaster, Eucalyptus camaldulensis, Nerium oleander, Olea europaea, and Pittosporum heterophyllum) used to trace industrial emissions in a mixed industrial–urban context [70].
The analysis identified major pollution sources, including vehicular traffic, steel and cement plants, and a petrochemical refinery. All plant samples exhibited elevated concentrations of toxic metals, with interspecies variability. Spatial analysis using the Contamination Factor (CF) and Pollution Load Index (PLI) based on background values revealed pollution hotspots near industrial sites and major roads, while green areas showed minimal contamination. CF-based statistical analysis linked nickel and chromium to steel and refinery activities; iron and aluminium to traffic emissions; and calcium, magnesium, potassium, and sodium to geogenic sources such as sea spray and Saharan dust. The findings confirm that combining multiple plant species with pollution indices offers an effective, low-cost biomonitoring strategy for air quality assessment and the development of dense monitoring networks [70].
Numerous international studies confirm the effectiveness of integrated approaches to air quality assessment. In Barcelona, research combining land use, school distribution, and population density data revealed a strong correlation between social vulnerability, building density, and exposure to PM10 and NO2, with implications for sustainable urban planning [71].
In Tehran, data from 2014–2017 were analysed using IDW interpolation, geographically weighted regression (GWR), and the Fuzzy Analytic Network Process (FANP) to assess the environmental impact of PM2.5 and simulate alternative management scenarios, highlighting the influence of traffic, land use, and energy consumption on pollutant distribution [72].
In China, a GMCDM (Group Multiple-Criteria Decision Making) model was applied to SO2, NO2, and PM10 data from three stations (2017–2019) to reflect decision-makers’ preferences, showing a gradual improvement in air quality, with November 2019 recording the best condition [73].
In Hong Kong, a least squares formulation of robust non-negative factor analysis [74] was used to evaluate PM composition from campaigns in 2000–2001 and 2004–2005, revealing a decline in air quality and identifying key sources such as diesel emissions, sea salts, secondary sulphates, and oil combustion. This multi-criteria approach provided a robust scientific basis for policy development [75].
A recent study explored the link between urban morphology and summer thermal discomfort in a tropical city. Using remote sensing data and spatial analysis, it was possible to map the distribution of climate disruption and identify the most exposed areas, especially where building coverage exceeds 68% and buildings reach intermediate heights (5.8–9.3 m). The study proposes mitigation solutions such as road spraying and increased area of green pavement, identifying 38 km of roads suitable for specific interventions [76].
Nature-based solutions (NBSs) encompass sustainable strategies leveraging natural processes to address environmental, social, and economic challenges. In densely urbanised and industrialised coastal cities, often under pressure from sensitive services (e.g., schools, hospitals, universities, and churches) and intensive agricultural activities, NBSs can effectively mitigate air pollution, support sustainable water management, and enhance urban quality of life.
Key NBS interventions for reducing airborne pollutants such as PM10 include vegetative barriers, green belts, and green walls, which function as natural filters, especially near emission sources like roads, industrial plants, and logistics hubs. Green belts around sensitive infrastructure (e.g., schools and hospitals) lower exposure for vulnerable groups, while green walls improve microclimatic conditions and aesthetics. In densely built environments, green roofs contribute to particulate filtration and thermal regulation. Complementary systems such as rain gardens and biofiltration gardens enhance stormwater treatment and water quality, particularly near educational and healthcare facilities.
Riparian vegetation zones, which are critical in coastal and agriculturally intensive contexts, offer ecosystem services such as nutrient uptake (nitrates and phosphates), heavy metal and pesticide retention, and sediment filtration. When linked via ecological corridors, they enhance biodiversity and environmental connectivity. Artificial wetlands near industrial areas serve as natural infrastructure for the treatment of urban and industrial wastewater, improving hydrological resilience.
Furthermore, the presence of urban and peri-urban forests represents a fundamental component of NBS in cities with high building and industrial density. These forested areas absorb CO2, contribute to the reduction of the heat island effect [77], and act as natural traps for fine dust and gaseous pollutants. These forests can be integrated into carbon credit programs, fostering cooperation between municipalities and private stakeholders. Additionally, they function as ecological corridors, reinforcing territorial resilience and rebalancing urban–natural gradients.
Empirical evidence confirms the effectiveness of NBSs in reducing air pollutants such as PM10 [78] and VOCs. Well-planned urban vegetation can reduce local PM10 concentrations by 20–25%, sequester CO2, enhance biodiversity, improve thermal comfort, and promote inclusive use of public space.
In coastal urban–industrial settings, NBS planning requires an integrated approach that combines mitigation, adaptation, and protection of natural capital while accounting for urban complexity and population vulnerability.
Unlike previous studies that have often relied on either statistical interpolation (e.g., IDW or GWR in Tehran) or single-method frameworks such as CF/PLI indices or biomonitoring with vegetation (as applied in the Taranto area), our methodology adopts an integrated multi-criteria decision-making framework (MCDA) combined with geospatial analysis, pollution dispersion modelling (AERMOD), and the mapping of sensitive receptors (schools, hospitals, etc.). This combination allows for a more systemic assessment of urban and environmental vulnerability that is not limited to environmental monitoring alone but also includes socioeconomic dimensions and urban infrastructure.
Moreover, in contrast to many case studies where NBSs are proposed conceptually, our approach provides spatially explicit guidance on where and how NBS interventions should be prioritised based on a vulnerability index calibrated through AHP weighting and validated with local environmental data, improving both the strategic relevance and operational feasibility of the proposed solutions.
A critical comparison also reveals the limitations of our approach: while it integrates a variety of data sources, the subjectivity in the AHP weighting process, despite being grounded in local knowledge, may still introduce uncertainty. The reliance on land use data from 2018 may not fully capture recent urban developments or land cover changes, potentially affecting the accuracy of the environmental vulnerability assessment, even if, over the last few years, the changes will have been minimal. Furthermore, the lack of high-resolution temporal data in some layers may limit the model’s ability to capture short-term environmental dynamics. However, the modular and replicable structure of the method ensures that it can be adapted and improved as more granular data becomes available. Another limitation concerns the use of open-source data sources such as OpenStreetMap, which, while widely adopted and accessible, may contain inconsistencies or incomplete features, especially in less urbanised or marginal areas.

5. Conclusions

The differentiated adoption of nature-based solutions (NBSs) based on the level of territorial vulnerability allows for more efficient, adaptive, and targeted environmental planning capable of responding to the specific needs of each urban, peri-urban, or rural context. The proposed vulnerability assessment framework can support municipalities, urban planners, and environmental agencies in prioritising interventions and allocating resources more effectively. By integrating open-source data and spatial analysis techniques, the tool can be adapted to different territorial contexts to identify critical areas, guide the deployment of nature-based solutions (NBS), and inform regulatory planning.
The multi-criteria approach was necessary due to the complexity and specificity of the study area, characterised by a compact urban fabric; overlooking the coast; highly industrialised; and, at the same time, rich in naturalistic and productive elements. The possibility of weighing each factor differently based on its impact on environmental vulnerability allowed us to build a coherent, flexible, and reproducible model capable of identifying critical areas and guiding choices towards the most effective and contextualised NBS.
While individual datasets or techniques used in this study may be established, their integrated application to generate vulnerability-based spatial zoning of a highly industrialised coastal urban area represents a methodological innovation. The approach provides a replicable framework for municipalities to prioritise planning interventions, allocate resources for pollution mitigation, and operationalise NBS strategies in a spatially targeted way.
In conclusion, the adoption of an integrated and systemic approach that combines environmental planning with robust analytical tools, digital technologies, and social involvement practices represents the main way to build more resilient, sustainable, and inclusive territories. However, challenges remain in terms of institutional capacity, data availability, and long-term monitoring. Successful implementation requires intersectoral coordination, the adoption of dynamic data updating systems, and the involvement of stakeholders to ensure both technical feasibility and public acceptance.

Author Contributions

Conceptualization, C.M. and M.S.B.; methodology, C.M. and M.S.B.; Software, C.M. and M.S.B.; Validation, C.M. and M.S.B.; Formal analysis, C.M. and M.S.B.; Investigation, C.M. and M.S.B.; Resources, C.M. and M.S.B.; Data curation, C.M. and M.S.B.; writing—original draft preparation, C.M. and M.S.B.; writing—review and editing, C.M. and M.S.B.; Visualization, C.M. and M.S.B.; Supervision, C.M. and M.S.B.; Project administration, C.M. and M.S.B.; Funding acquisition, C.M. and M.S.B. All authors have read and agreed to the published version of the manuscript.

Funding

This research was funded by the DIANA project (From data to decisions with AI in complex environmental systems) under the funding scheme D.M. 13 July 2023—Entrepreneurial Discovery within the areas of the National Strategy for Intelligent Specialization (SNSI).

Data Availability Statement

Data are contained within the article.

Acknowledgments

We thank Ferdinando Balice for his valuable contribution to the collection and organisation of data from citizen-driven mapping activities and Vittorio Leandro for the preparation and structuring of the GIS project, which was essential for the development and calculation of the territorial vulnerability index.

Conflicts of Interest

The authors declare no conflicts of interest.

References

  1. United Nations Human Settlements Programme (UN-Habitat). World Cities Report 2022: Envisaging the Future of Cities; UN-Habitat: Nairobi, Kenya, 2022. [Google Scholar]
  2. Li, X.; Yang, L.; Ren, Y.; Li, H.; Wang, Z. Impacts of Urban Sprawl on Soil Resources in the Changchun–Jilin Economic Zone, China, 2000–2015. Int. J. Environ. Res. Public Health 2018, 15, 1186. [Google Scholar] [CrossRef]
  3. Surya, B.; Salim, A.; Hernita, H.; Suriani, S.; Menne, F.; Rasyidi, E.S. Land Use Change, Urban Agglomeration, and Urban Sprawl: A Sustainable Development Perspective of Makassar City, Indonesia. Land 2021, 10, 556. [Google Scholar] [CrossRef]
  4. Massarelli, C. Developing a Calculation Workflow for Designing and Monitoring Urban Ecological Corridors: A Case Study. Urban Sci. 2024, 8, 169. [Google Scholar] [CrossRef]
  5. Liu, L.; Zhang, Y. Urban Heat Island Analysis Using the Landsat TM Data and ASTER Data: A Case Study in Hong Kong. Remote Sens. 2011, 3, 1535–1552. [Google Scholar] [CrossRef]
  6. de Almeida, C.R.; Teodoro, A.C.; Gonçalves, A. Study of the Urban Heat Island (UHI) Using Remote Sensing Data/Techniques: A Systematic Review. Environments 2021, 8, 105. [Google Scholar] [CrossRef]
  7. Zhou, D.; Xiao, J.; Bonafoni, S.; Berger, C.; Deilami, K.; Zhou, Y.; Frolking, S.; Yao, R.; Qiao, Z.; Sobrino, J.A. Satellite Remote Sensing of Surface Urban Heat Islands: Progress, Challenges, and Perspectives. Remote Sens. 2018, 11, 48. [Google Scholar] [CrossRef]
  8. Liu, F.; Hou, H.; Murayama, Y. Spatial Interconnections of Land Surface Temperatures with Land Cover/Use: A Case Study of Tokyo. Remote Sens. 2021, 13, 610. [Google Scholar] [CrossRef]
  9. Heaviside, C.; Macintyre, H.; Vardoulakis, S. The Urban Heat Island: Implications for Health in a Changing Environment. Curr. Environ. Health Rep. 2017, 4, 296–305. [Google Scholar] [CrossRef]
  10. Mirzaei, M.; Verrelst, J.; Arbabi, M.; Shaklabadi, Z.; Lotfizadeh, M. Urban Heat Island Monitoring and Impacts on Citizen’s General Health Status in Isfahan Metropolis: A Remote Sensing and Field Survey Approach. Remote Sens. 2020, 12, 1350. [Google Scholar] [CrossRef]
  11. Piracha, A.; Chaudhary, M.T. Urban Air Pollution, Urban Heat Island and Human Health: A Review of the Literature. Sustainability 2022, 14, 9234. [Google Scholar] [CrossRef]
  12. Shepherd, N. Making Sense of “Day Zero”: Slow Catastrophes, Anthropocene Futures, and the Story of Cape Town’s Water Crisis. Water 2019, 11, 1744. [Google Scholar] [CrossRef]
  13. Massarelli, C.; Uricchio, V.F. The Contribution of Open Source Software in Identifying Environmental Crimes Caused by Illicit Waste Management in Urban Areas. Urban Sci. 2024, 8, 21. [Google Scholar] [CrossRef]
  14. Olsson, P.; Galaz, V. Social-Ecological Innovation and Transformation. In Social Innovation; Palgrave Macmillan: London, UK, 2012; pp. 223–247. [Google Scholar] [CrossRef]
  15. Massarelli, C.; Campanale, C.; Uricchio, V.F. Characterization of Synanthropic Habitats on Shallow Seabeds Using Map Clustering Techniques: A Case Study in Taranto, Apulia, Italy. Ecologies 2024, 5, 627–646. [Google Scholar] [CrossRef]
  16. Brasil, J.; Macedo, M.; Lago, C.; Oliveira, T.; Júnior, M.; Oliveira, T.; Mendiondo, E. Nature-Based Solutions and Real-Time Control: Challenges and Opportunities. Water 2021, 13, 651. [Google Scholar] [CrossRef]
  17. Dushkova, D.; Haase, D. Not Simply Green: Nature-Based Solutions as a Concept and Practical Approach for Sustainability Studies and Planning Agendas in Cities. Land 2020, 9, 19. [Google Scholar] [CrossRef]
  18. Ferreira, V.; Barreira, A.P.; Loures, L.; Antunes, D.; Panagopoulos, T. Stakeholders’ Engagement on Nature-Based Solutions: A Systematic Literature Review. Sustainability 2020, 12, 640. [Google Scholar] [CrossRef]
  19. Kyere-Boateng, R.; Marek, M.V. Analysis of the Social-Ecological Causes of Deforestation and Forest Degradation in Ghana: Application of the DPSIR Framework. Forests 2021, 12, 409. [Google Scholar] [CrossRef]
  20. Wantzen, K.M.; Alves, C.B.M.; Badiane, S.D.; Bala, R.; Blettler, M.; Callisto, M.; Cao, Y.; Kolb, M.; Kondolf, G.M.; Leite, M.F.; et al. Urban Stream and Wetland Restoration in the Global South—A DPSIR Analysis. Sustainability 2019, 11, 4975. [Google Scholar] [CrossRef]
  21. Khan, M.M.H.; Kurniawan, T.A.; Chandra, I.; Lei, T.M.T. Modeling PM10 Emissions in Quarry and Mining Operations: Insights from AERMOD Applications in Malaysia. Atmosphere 2025, 16, 369. [Google Scholar] [CrossRef]
  22. US EPA. Air Quality Dispersion Modeling—Preferred and Recommended Models. Available online: https://www.epa.gov/scram/air-quality-dispersion-modeling-preferred-and-recommended-models (accessed on 19 May 2025).
  23. US EPA. AERMOD Modeling System Development. Available online: https://www.epa.gov/scram/aermod-modeling-system-development (accessed on 16 May 2025).
  24. US EPA. Interactive Map of Air Quality Monitors. Available online: https://www.epa.gov/outdoor-air-quality-data/interactive-map-air-quality-monitors (accessed on 4 August 2025).
  25. Kumar, A.; Dixit, S.; Varadarajan, C.; Vijayan, A.; Masuraha, A. Evaluation of the AERMOD Dispersion Model as a Function of Atmospheric Stability for an Urban Area. Environ. Prog. 2006, 25, 141–151. [Google Scholar] [CrossRef]
  26. Karagulian, F.; Belis, C.A.; Dora, C.F.C.; Prüss-Ustün, A.M.; Bonjour, S.; Adair-Rohani, H.; Amann, M. Contributions to Cities’ Ambient Particulate Matter (PM): A Systematic Review of Local Source Contributions at Global Level. Atmos. Environ. 2015, 120, 475–483. [Google Scholar] [CrossRef]
  27. Chen, J.; Hoek, G. Long-Term Exposure to PM and All-Cause and Cause-Specific Mortality: A Systematic Review and Meta-Analysis. Environ. Int. 2020, 143, 105974. [Google Scholar] [CrossRef]
  28. Goel, K.; Sen, A. Epidemiology of Fine Particulate Air Pollution and Human Health Impacts. In Air Quality and Human Health; Springer: Singapore, 2024; pp. 111–119. [Google Scholar] [CrossRef]
  29. Tunlathorntham, S.; Thepanondh, S. Prediction of Ambient Nitrogen Dioxide Concentrations in the Vicinity of Industrial Complex Area, Thailand. Air Soil Water Res. 2017, 10, 906. [Google Scholar] [CrossRef]
  30. Siahpour, G.; Jozi, S.A.; Orak, N.; Fathian, H.; Dashti, S. Estimation of Environmental Pollutants Using the AERMOD Model in Shazand Thermal Power Plant, Arak, Iran. Toxin Rev. 2022, 41, 1269–1279. [Google Scholar] [CrossRef]
  31. Mohd Shafie, S.H. Application of AERMOD Dispersion Model for Assessment PM10 Concentrations from Mobile Sources in Kuala Lumpur Metropolitan City, Malaysia. Environ. Monit. Assess. 2024, 196, 969. [Google Scholar] [CrossRef]
  32. Jittra, N.; Pinthong, N.; Thepanondh, S. Performance Evaluation of AERMOD and CALPUFF Air Dispersion Models in Industrial Complex Area. Air Soil Water Res. 2015, 8, 87–95. [Google Scholar] [CrossRef]
  33. Tartakovsky, D.; Broday, D.M.; Stern, E. Evaluation of AERMOD and CALPUFF for Predicting Ambient Concentrations of Total Suspended Particulate Matter (TSP) Emissions from a Quarry in Complex Terrain. Environ. Pollut. 2013, 179, 138–145. [Google Scholar] [CrossRef] [PubMed]
  34. Torrieri, F.; Batà, A. Spatial Multi-Criteria Decision Support System and Strategic Environmental Assessment: A Case Study. Buildings 2017, 7, 96. [Google Scholar] [CrossRef]
  35. Basílio, M.P.; Pereira, V.; Costa, H.G.; Santos, M.; Ghosh, A. A Systematic Review of the Applications of Multi-Criteria Decision Aid Methods (1977–2022). Electronics 2022, 11, 1720. [Google Scholar] [CrossRef]
  36. Verstand, D.; Berkhof, M.J.J.; de Haas, M.B.J.; Pellens, N.; Voskamp, I.M.; Diersmann, M.G.D. Nature-Based Solutions Catalogue: An Elaboration of 10 NbS Categories in the Dutch Situation 2024; WUR: Wageningen, The Netherlands, 2024. [Google Scholar]
  37. Aree Protette in Puglia—Paesaggio—SIT Puglia. Available online: https://pugliacon.regione.puglia.it/web/sit-puglia-paesaggio/aree-protette-in-puglia (accessed on 19 May 2025).
  38. National Centers for Environmental Information (NCEI). Available online: https://www.ncei.noaa.gov/ (accessed on 19 May 2025).
  39. Jacobson, M.Z. Fundamentals of Atmospheric Modeling, 2nd ed.; Cambridge University Press: Cambridge, UK, 2005; pp. 1–813. ISBN 9780521839709. [Google Scholar] [CrossRef]
  40. CORINE Land Cover—Copernicus Land Monitoring Service. Available online: https://land.copernicus.eu/en/products/corine-land-cover (accessed on 19 May 2025).
  41. Mooney, P. An Outlook for OpenStreetMap BT—OpenStreetMap in GIScience: Experiences, Research, and Applications; Springer: Berlin/Heidelberg, Germany, 2015; pp. 319–324. [Google Scholar]
  42. OpenStreetMap. Available online: https://www.openstreetmap.org/#map=14/40.46210/17.25600 (accessed on 19 May 2025).
  43. EVI. Sopac Unep Building Resilience in SIDS: The Environmental Vulnerability Index; South Pacific Applied Geoscience Commission and United Nations Environment Programme: Nairobi, Kenya, 2005. [Google Scholar]
  44. Di, M.C.; Nordvik, J.P.; Andrea, C.; Golia, E. Redazione Di Carte Tematiche Di Vulnerabilità e Rischio—Metodologia per l’Analisi Di Vulnerabilità Territoriale Su Scala Regionale. Rapporto Finale. 2007. Available online: https://publications.jrc.ec.europa.eu/repository/handle/JRC36070 (accessed on 4 August 2025).
  45. Saaty, T.L. Analytic Hierarchy Process. In Encyclopedia of Biostatistics; Wiley: New York, NY, USA, 2005. [Google Scholar] [CrossRef]
  46. Saaty, R.W. The Analytic Hierarchy Process—What It Is and How It Is Used. Math. Model. 1987, 9, 161–176. [Google Scholar] [CrossRef]
  47. Cutter, S.L.; Boruff, B.J.; Shirley, W.L. Social Vulnerability to Environmental Hazards. Soc. Sci. Q. 2003, 84, 242–261. [Google Scholar] [CrossRef]
  48. Malczewski, J. GIS and Multicriteria Decision Analysis; Wiley: New York, NY, USA, 1999; p. 392. [Google Scholar]
  49. Labianca, C.; De Gisi, S.; Todaro, F.; Notarnicola, M. DPSIR Model Applied to the Remediation of Contaminated Sites. A Case Study: Mar Piccolo of Taranto. Appl. Sci. 2020, 10, 5080. [Google Scholar] [CrossRef]
  50. Mangia, C.; Gianicolo, E.A.L.; Bruni, A.; Vigotti, M.A.; Cervino, M. Spatial Variability of Air Pollutants in the City of Taranto, Italy and Its Potential Impact on Exposure Assessment. Environ. Monit. Assess. 2013, 185, 1719–1735. [Google Scholar] [CrossRef]
  51. Gennaro, V.; Cervellera, S.; Cusatelli, C.; Miani, A.; Pesce, F.; De Gennaro, G.; Distante, A.; Vimercati, L.; Gesualdo, L.; Piscitelli, P. Use of Official Municipal Demographics for the Estimation of Mortality in Cities Suffering from Heavy Environmental Pollution: Results of the First Study on All the Neighborhoods of Taranto from 2011 to 2020. Environ. Res. 2022, 204, 112007. [Google Scholar] [CrossRef]
  52. Banini, T.; Palagiano, C. Environment and Health in Italian Cities: The Case of Taranto. In Environmental Deterioration and Human Health: Natural and Anthropogenic Determinants; Springer: Dordrecht, The Netherlands, 2014; pp. 17–37. [Google Scholar] [CrossRef]
  53. Bruno, P.; Caselli, M.; de Gennaro, G.; de Gennaro, L.; Tutino, M. High Spatial Resolution Monitoring of Benzene and Toluene in the Urban Area of Taranto (Italy). J. Atmos. Chem. 2006, 54, 177–187. [Google Scholar] [CrossRef]
  54. Cohen-Shacham, E.; Andrade, A.; Dalton, J.; Dudley, N.; Jones, M.; Kumar, C.; Maginnis, S.; Maynard, S.; Nelson, C.R.; Renaud, F.G.; et al. Core Principles for Successfully Implementing and Upscaling Nature-Based Solutions. Environ. Sci. Policy 2019, 98, 20–29. [Google Scholar] [CrossRef]
  55. Dorst, H.; van der Jagt, A.; Raven, R.; Runhaar, H. Urban Greening through Nature-Based Solutions—Key Characteristics of an Emerging Concept. Sustain. Cities Soc. 2019, 49, 101620. [Google Scholar] [CrossRef]
  56. Keesstra, S.; Nunes, J.; Novara, A.; Finger, D.; Avelar, D.; Kalantari, Z.; Cerdà, A. The Superior Effect of Nature Based Solutions in Land Management for Enhancing Ecosystem Services. Sci. Total Environ. 2018, 610–611, 997–1009. [Google Scholar] [CrossRef]
  57. Seddon, N.; Chausson, A.; Berry, P.; Girardin, C.A.J.; Smith, A.; Turner, B. Understanding the Value and Limits of Nature-Based Solutions to Climate Change and Other Global Challenges. Philos. Trans. R. Soc. B 2020, 375, 20190120. [Google Scholar] [CrossRef]
  58. García, L.; Mungaray-Moctezuma, A.; Montoya-Alcaraz, M.; Sánchez-Atondo, A.; Calderón-Ramírez, J.; Gutiérrez-Moreno, J.M. Analysis of Socio-Environmental Vulnerability in Areas with Overpopulation and Natural Risks Induced by Their Urban-Territorial Conditions. Appl. Sci. 2024, 14, 6535. [Google Scholar] [CrossRef]
  59. Massarelli, C.; Losacco, D.; Tumolo, M.; Campanale, C.; Uricchio, V.F. Protection of Water Resources from Agriculture Pollution: An Integrated Methodological Approach for the Nitrates Directive 91–676-Eec Implementation. Int. J. Environ. Res. Public Health 2021, 18, 13323. [Google Scholar] [CrossRef] [PubMed]
  60. Sabzevari, S.; Hofman, J. A Worldwide Review of Currently Used Pesticides’ Monitoring in Agricultural Soils. Sci. Total Environ. 2022, 812, 152344. [Google Scholar] [CrossRef] [PubMed]
  61. Feldman, E.E.; Eric, E. 1973-From Linear Spaces to Linear Places: Recycling Rail Corridors in Urban Areas; Massachusetts Institute of Technology: Cambridge, MA, USA, 2002. [Google Scholar]
  62. Benítez, G.; Alvarado-Castillo, G.; Guerrero, R.A.P.; Lara, M.A.C.; Williams, K.; Acosta, I. Designing a Green Belt for Xalapa City: Veracruz under Current Mexican Policies. Reg. Cohes. 2018, 8, 94–115. [Google Scholar] [CrossRef]
  63. Clevenot, L.; De Chastenet, C.; Frascaria, N.; Jacob, P.; Raymond, R.; Simon, L.; Pech, P. Do Linear Transport Infrastructures Provide a Potential Corridor for Urban Biodiversity? Case Study in Greater Paris, France. 2017. Available online: https://doi.org/10.4000/cybergeo.27895 (accessed on 4 August 2025).
  64. Hansen, A.L.M. 12 Remapping Philadelphia’s Postindustrial Terrain. In A Greene Country Towne; Penn State University Press: University Park, PA, USA, 2021; pp. 208–220. [Google Scholar] [CrossRef]
  65. Heathcott, J. The Promenade Plantée: Politics, Planning, and Urban Design in Postindustrial Paris. J. Plan. Educ. Res. 2013, 33, 280–291. [Google Scholar] [CrossRef]
  66. Zuniga-Teran, A.A.; González-Méndez, B.; Scarpitti, C.; Yang, B.; Murrieta Saldivar, J.; Pineda, I.; Peñúñuri, G.; Hinojosa Robles, E.; Irineo, K.S.; Müller, S.; et al. Green Belt Implementation in Arid Lands through Soil Reconditioning and Landscape Design: The Case of Hermosillo, Mexico. Land 2022, 11, 2130. [Google Scholar] [CrossRef]
  67. Mancilla, D.; Robledo, S.; Esenarro, D.; Raymundo, V.; Vega, V. Green Corridors and Social Connectivity with a Sustainable Approach in the City of Cuzco in Peru. Urban Sci. 2024, 8, 79. [Google Scholar] [CrossRef]
  68. Massarelli, C.; Galeone, C.; Savino, I.; Campanale, C.; Uricchio, V.F. Towards Sustainable Management of Mussel Farming through High-Resolution Images and Open Source Software—The Taranto Case Study. Remote Sens. 2021, 13, 2985. [Google Scholar] [CrossRef]
  69. Massarelli, C.; Campanale, C. Climatic, Bioclimatic, and Pedological Influences on the Vegetation Classification of “Bosco Dell’Incoronata” in Southern Italy. Rend. Lincei 2023, 34, 537–552. [Google Scholar] [CrossRef]
  70. Cavazzin, B.; MacDonell, C.; Green, N.; Rothwell, J.J. Air Pollution Biomonitoring in an Urban-Industrial Setting (Taranto, Italy) Using Mediterranean Plant Species. Atmos. Pollut. Res. 2024, 15, 102105. [Google Scholar] [CrossRef]
  71. Arriazu-Ramos, A.; Santamaría, J.M.; Monge-Barrio, A.; Bes-Rastrollo, M.; Gabriel, S.G.; Frias, N.B.; Sánchez-Ostiz, A. Health Impacts of Urban Environmental Parameters: A Review of Air Pollution, Heat, Noise, Green Spaces and Mobility. Sustainability 2025, 17, 4336. [Google Scholar] [CrossRef]
  72. Zarandi, S.M.; Shahsavani, A.; Nasiri, R.; Pradhan, B. A Hybrid Model of Environmental Impact Assessment of PM2.5 Concentration Using Multi-Criteria Decision-Making (MCDM) and Geographical Information System (GIS)—A Case Study. Arab. J. Geosci. 2021, 14, 177. [Google Scholar] [CrossRef]
  73. Hadi-Vencheh, A.; Tan, Y.; Wanke, P.; Loghmanian, S.M. Air Pollution Assessment in China: A Novel Group Multiple Criteria Decision Making Model under Uncertain Information. Sustainability 2021, 13, 1686. [Google Scholar] [CrossRef]
  74. Paatero, P. Least Squares Formulation of Robust Non-Negative Factor Analysis. Chemom. Intell. Lab. Syst. 1997, 37, 23–35. [Google Scholar] [CrossRef]
  75. Friend, A.J.; Ayoko, G.A.; Guo, H. Multi-Criteria Ranking and Receptor Modelling of Airborne Fine Particles at Three Sites in the Pearl River Delta Region of China. Sci. Total Environ. 2011, 409, 719–737. [Google Scholar] [CrossRef]
  76. Gupta, A.; De, B.; Shukla, A.K.; Pignatta, G. Vulnerability Assessment of a Highly Populated Megacity to Ambient Thermal Stress. Sustainability 2024, 16, 3395. [Google Scholar] [CrossRef]
  77. Vujovic, S.; Haddad, B.; Karaky, H.; Sebaibi, N.; Boutouil, M. Urban Heat Island: Causes, Consequences, and Mitigation Measures with Emphasis on Reflective and Permeable Pavements. CivilEng 2021, 2, 459–484. [Google Scholar] [CrossRef]
  78. Marando, F.; Salvatori, E.; Fusaro, L.; Manes, F.; Escobedo, F.; Livesley, S.J.; Morgenroth, J. Removal of PM10 by Forests as a Nature-Based Solution for Air Quality Improvement in the Metropolitan City of Rome. Forests 2016, 7, 150. [Google Scholar] [CrossRef]
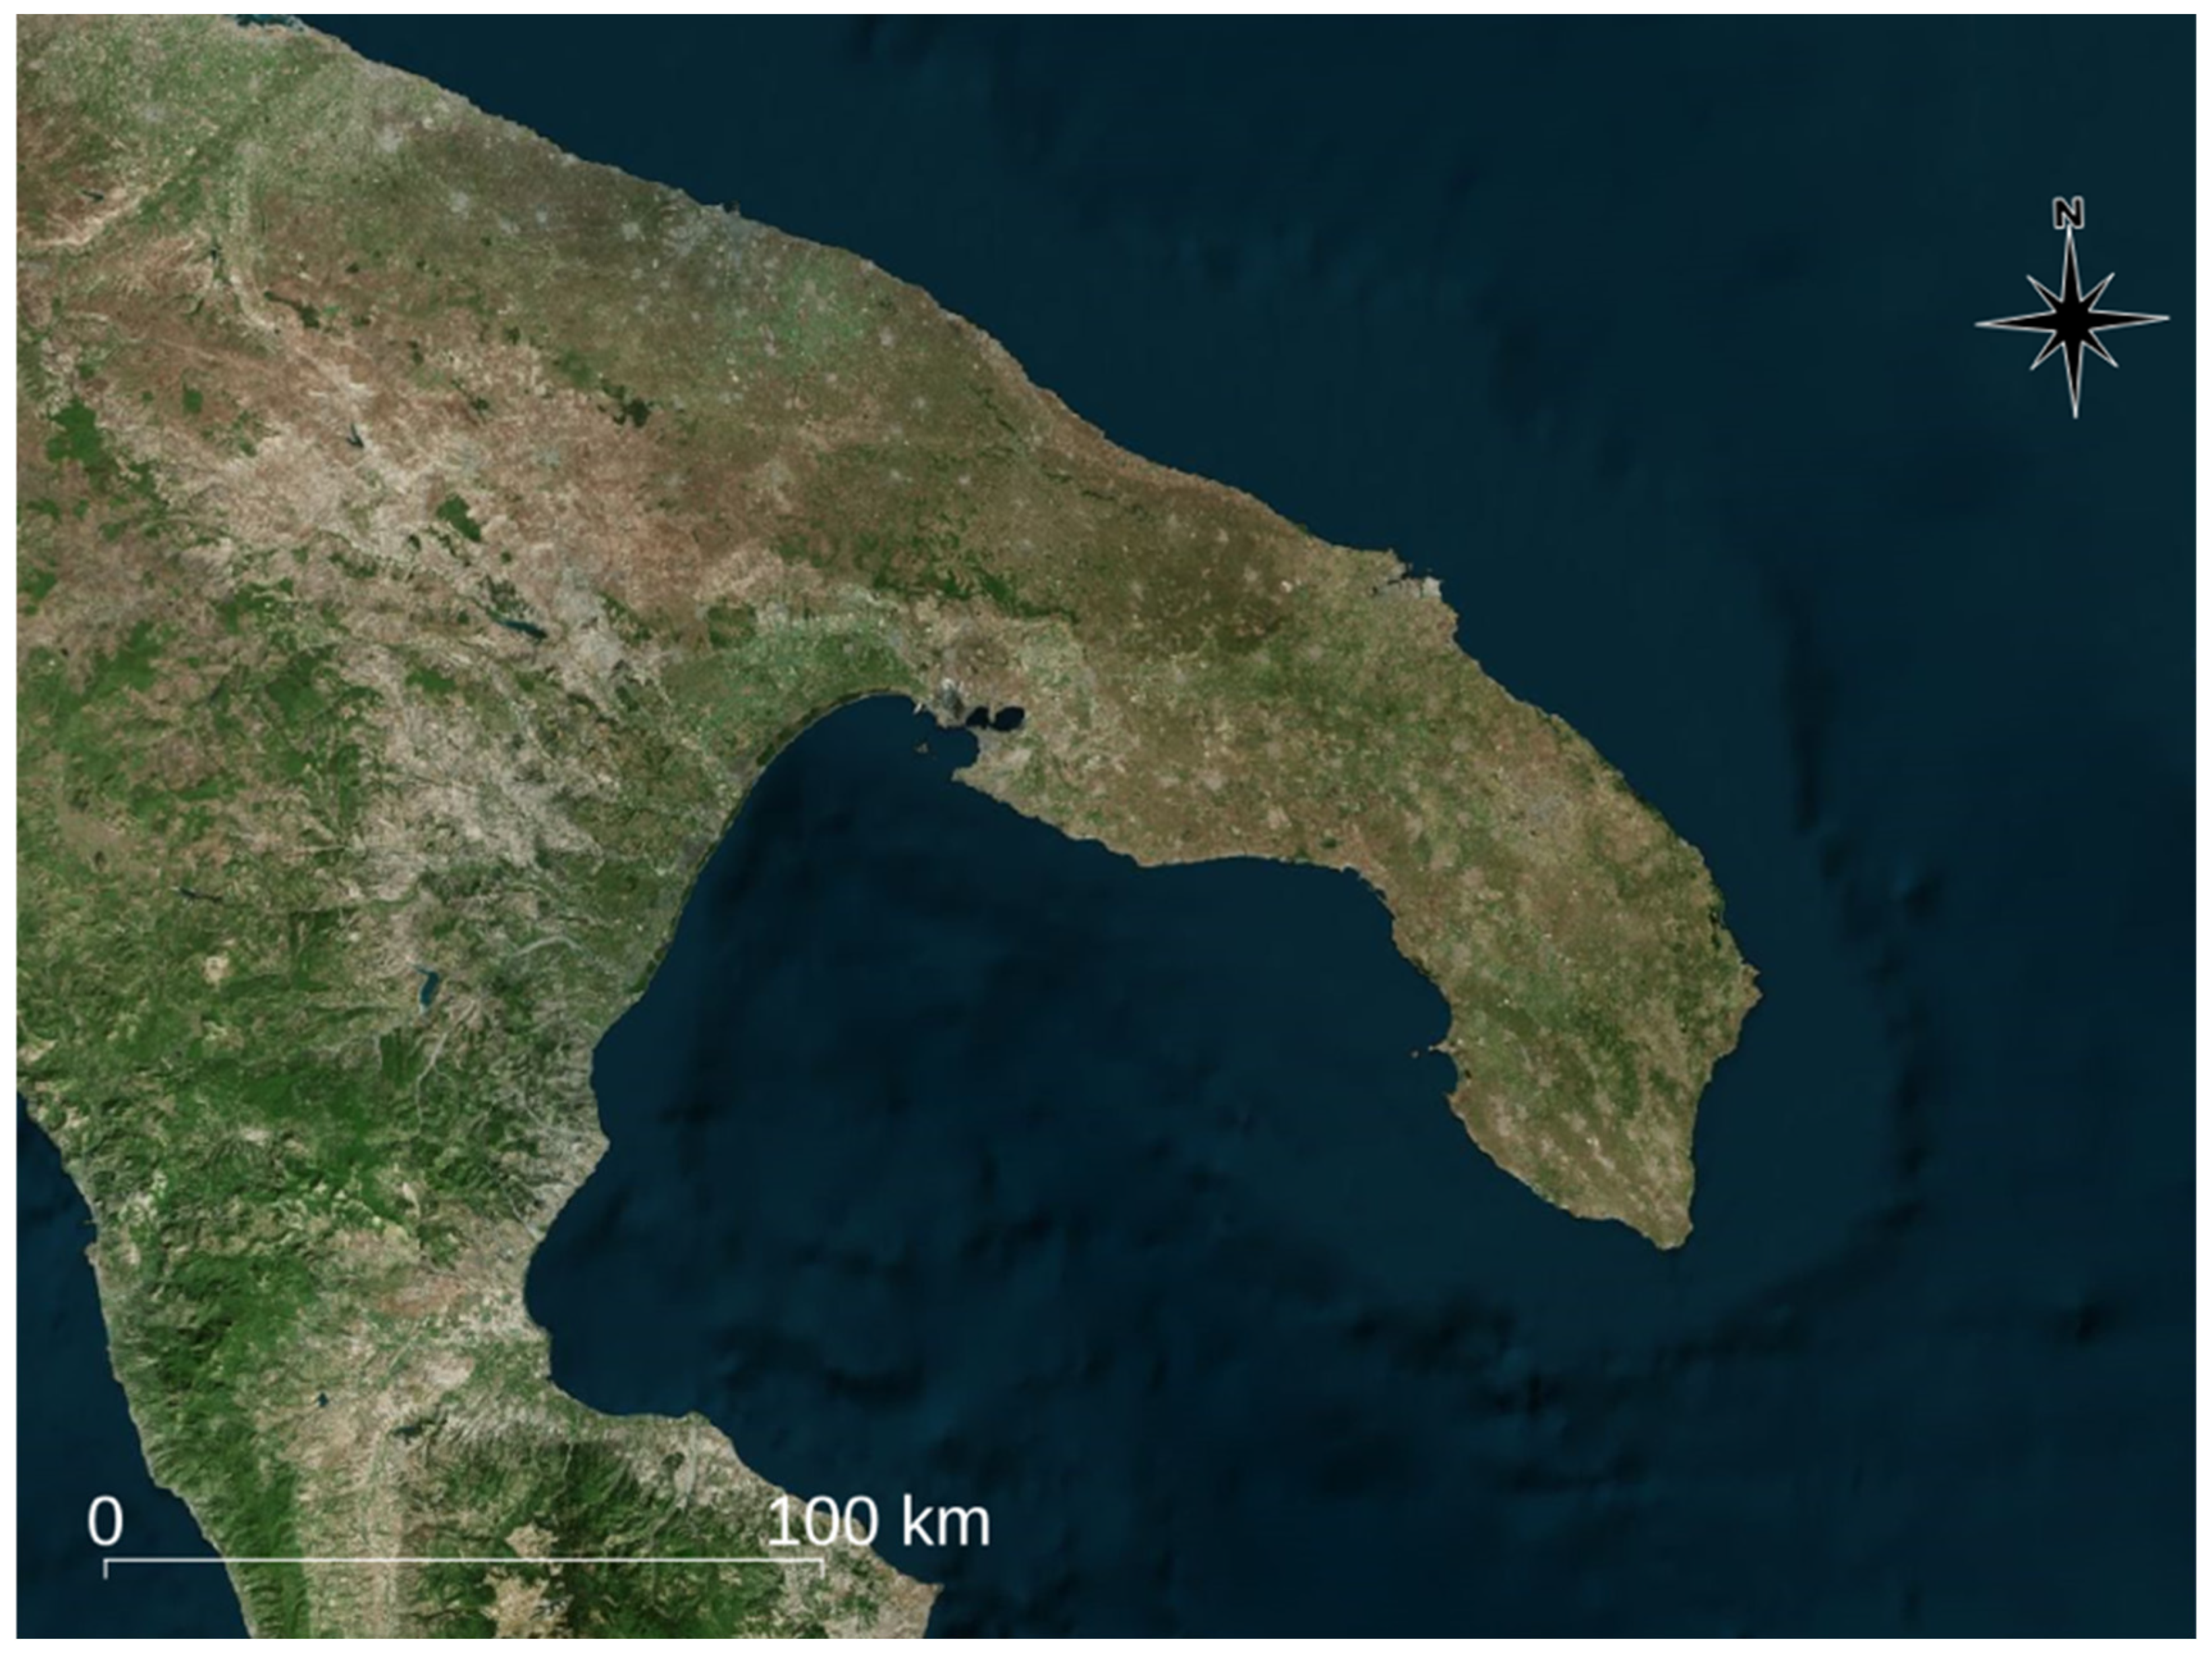
Figure 1. Study area.
Urbansci 09 00309 g001aUrbansci 09 00309 g001b
Figure 2. The developed data processing workflow.
Urbansci 09 00309 g002
Figure 3. PM10 concentration isolines in annual average.
Urbansci 09 00309 g003
Figure 4. Thematics extracted from OpenStreetMap.
Urbansci 09 00309 g004
Figure 5. Soil mapping according to Corine Land Cover.
Urbansci 09 00309 g005
Figure 6. Vulnerability values of areas.
Urbansci 09 00309 g006
Table 1. Components analysed for the calculation of the index.
CodeComponentParameterDescription
ULand UseAgricultural, artificial (residential and industrial), woodland, or wetlandAssessment of anthropogenic pressure
SSensitive servicesSchools and universities, churches, hospitals, shopping centres, and sports fieldsSocial vulnerability indicators
EEcosystemsGreen areas and protected areasEnvironmental mitigation capacity
DDispersionAccumulated concentration of PM10 contaminants at ground levelThe value of PM10 concentration accumulated on the ground
Table 2. Construction of the pairwise comparison matrix.
C1C2C3C4SumWeighted Mean
C11.000.330.330.332.000.10
C23.001.002.003.009.000.45
C33.000.501.001.005.500.24
C43.000.331.001.005.330.22
Table 3. Match table between identified vulnerability level and applicable NBS proposal.
Vulnerability AreaSuggested NBS Measures
Low Pollution LevelMedium Pollution LevelHigh Pollution Level
Highly urbanised and industrial zonesGreen roofs/walls, rainwater harvesting systems, and pocket parksRain gardens and bioswales, permeable pavements, and constructed wetlands for industryExtensive green roofs, vegetative barriers, urban forests and trees, and natural restoration
Medium-transition or mixed zonesGreen corridors and rainwater reuse systemsRiparian buffer zones, channel naturalisation, and urban regenerative agricultureUrban forests and trees, floodplain restoration, bioengineering interventions, and large-scale stormwater parks
Low-agricultural or natural areasTerraces and slope stabilisation, agroforestry, living shorelines, and seagrass plantingNatural water retention measures (dams and ponds), soil conservation, and dune restorationAfforestation and reforestation, large wetland/coastal wetland restoration, and dune creation
Disclaimer/Publisher’s Note: The statements, opinions and data contained in all publications are solely those of the individual author(s) and contributor(s) and not of MDPI and/or the editor(s). MDPI and/or the editor(s) disclaim responsibility for any injury to people or property resulting from any ideas, methods, instructions or products referred to in the content.