Article

New Weighting System for the Ordered Weighted Average Operator and Its Application in the Balanced Expansion of Urban Infrastructures

by
Matheus Pereira Libório
1,*,
Petr Ekel
2,*,
Marcos Flávio Silveira Vasconcelos D’Angelo
1,
Chris Brunsdon
3,
Alexandre Magno Alves Diniz
4,
Sandro Laudares
4 and
Angélica C. G. dos Santos
1
1
Graduate Program in Computational Modeling and Systems, State University of Montes Claros, Montes Claros 39401-089, Brazil
2
Graduate Program in Informatics, Pontifical Catholic University of Minas Gerais, Belo Horizonte 30535-901, Brazil
3
National Centre for Geocomputation, Maynooth University, W23 F2H6 Maynooth, Ireland
4
Graduate Program in Geography–Spatial Information Treatment, Pontifical Catholic University of Minas Gerais, Belo Horizonte 30535-901, Brazil
*
Authors to whom correspondence should be addressed.
Urban Sci. 2025, 9(8), 300; https://doi.org/10.3390/urbansci9080300 (registering DOI)
Submission received: 9 June 2025 / Revised: 20 July 2025 / Accepted: 29 July 2025 / Published: 1 August 2025

Abstract

Urban infrastructure, such as water supply networks, sewage systems, and electricity networks, is essential for the functioning of cities and, consequently, for the well-being of citizens. Despite its essentiality, the distribution of infrastructure in urban areas is not homogeneous, especially in cities in developing countries. Socially vulnerable areas often face significant deficiencies in sewage and road paving, exacerbating urban inequalities. In this regard, urban planners must consider the multiple elements of urban infrastructure and assess the compensation levels between them to reduce inequality effectively. In particular, the complexity of the problem necessitates considering the multidimensionality and heterogeneity of urban infrastructure. This complexity qualifies the operational framework of composite indicators as the natural solution to the problem. This study develops a new weighting system for the balanced expansion of urban infrastructures through composite indicators constructed by the Ordered Weighted Average operator. Implementing these weighting systems provides an opportunity to analyze urban infrastructure from different perspectives, offering transparency regarding the weaknesses and strengths of each perspective. This prevents unreliable representations from being used in decision-making and provides a solid basis for allocating investments in urban infrastructure. In particular, the study suggests that adopting weighting systems that prioritize intermediate values and avoid extreme values can lead to better resource allocation, helping to identify areas with deficient infrastructure and promoting more equitable urban development.

1. Introduction

Cities in developing countries exhibit high levels of inequality in public infrastructure and services [1], such as water scarcity [2], limited accessibility [3], and inadequate public health facilities [4]. These inequalities arise from several factors, including limited resources, population growth, ineffective urban planning, or a combination of these factors [5]. This context makes infrastructure planning challenging, as it is necessary to meet new demands and, as a priority, address unmet needs, thereby reducing inequalities in a scenario of scarce resources.
Urban public infrastructure comes in different forms [6]. Public facilities, such as hospitals, police stations, and schools, are associated with the principle of universality, or unrestricted accessibility for the entire population [7]. In turn, public goods such as streets, sidewalks, water, and sewage systems share the principle of universality and are characterized by indivisibility, which means that the good cannot be divided without losing its essential characteristics [8]. This study examines a second form of urban public infrastructure that contributes to well-being but is not directly associated with physical infrastructure, such as garbage collection.
Planning public infrastructure in urban areas requires the simultaneous analysis of multiple factors [9]. This simultaneous analysis requires considerable cognitive effort, which can limit and hinder decision-making [10]. One solution to this problem is the adoption of an operational framework using composite indicators [11,12,13].
Composite indicators are one-dimensional measures that result from aggregating weighted or unweighted normalized sub-indicators [14]. These one-dimensional measures enable decision-makers to represent and understand complex, multidimensional phenomena, thereby facilitating informed decision-making across various areas of knowledge [15,16].
Scholars’ interest in improving methods for constructing composite indicators is growing [17,18,19,20]. This study contributes to these efforts by exploring new methods for constructing composite indicators that represent public infrastructure in urban areas, incorporating innovations into the Ordered Weighted Averaging operator.
The Ordered Weighted Averaging is an aggregation operator proposed by Yager [21,22] whereby sub-indicators are weighted according to their respective performance [23]. Its weighing system allows for the construction of composite indicators with flexibility to emphasize the positive or negative aspects of the multidimensional phenomenon [24]. Additionally, the Ordered Weighted Averaging weighing system allows for the adjustment of compensation levels between sub-indicators with poor and above-average performance [25]. Finally, its weighting system considers the heterogeneity principle, in which the influence of a sub-indicator in the multidimensional phenomenon varies according to the decision-making unit [7,26].
However, despite these advantages, Ordered Weighted Averaging is little employed to construct composite indicators (see Section 2) compared to other methods (e.g., [27,28]). Additionally, existing studies have concentrated on geography, where raster images are processed [29,30,31,32]. In contrast, studies that use Ordered Weighted Averaging to construct composite indicators based on vector data are fewer in number (e.g., [33]). These studies do not comprehensively explore the different weighting systems of Ordered Weighted Averaging and their consequences in representing the multidimensional phenomenon. This gap leaves researchers in the dark about which weighting system to use or whether any weighting system should be avoided altogether.
This study aims to shed light on the repercussions of different weighting systems of Ordered Weighted Averaging on representing public infrastructures in urban areas, which are demonstrated through the case of the urban infrastructure of the city of São Sebastião do Paraíso, Brazil.
The study presents four points of originality. First, it offers a specific portrait of the literature on composite indicators constructed by Ordered Weighted Averaging. Second, the study examines the impact of different weighting systems on composite indicators, identifying which ones are suitable for representing public infrastructures in urban areas. Third, the study introduces a new set of weighting systems that simultaneously address the presence of outliers and compensate for poor and above-average performance sub-indicators. Fourth, the study proposes a mechanism for the balanced expansion of infrastructure in cities, assigning a higher property tax to areas that benefit most from urban infrastructure while prioritizing investment in areas with deficient urban infrastructure.
The findings obtained from these innovations contribute to expanding the literature on urban planning and composite indicators by offering alternatives for representing public infrastructures in urban areas and other multidimensional phenomena. Specifically, the composite indicator of urban infrastructure helps decision-makers understand a complex reality without losing generality. In turn, the new set of weighting systems enables the obtaining of reliable representations of urban infrastructure, thereby avoiding inaccurate or mistaken decisions.
In addition to this introduction, Section 2 reviews the literature on public infrastructures in urban areas and composite indicators, with a particular emphasis on the low frequency of use of Ordered Weighted Averaging. Section 3 explains how Ordered Weighted Averaging works, lists its most well-known weighting systems, and presents the weighting system proposed in this study. The data and methods are presented in Section 4. Section 5 presents an application example that compares the repercussions of different Ordered Weighted Averaging weighting systems on the representation of public infrastructures in urban areas. Finally, Section 6 presents the final considerations, research limitations, and future lines of investigation.

2. Literature Review

2.1. Public Infrastructure in Urban Areas

Infrastructure and public services are crucial for the operation of cities and, consequently, for the overall well-being of citizens [34]. Infrastructure refers to the physical facilities that support cities’ economic, social, and administrative activities. These facilities include water supply networks, sewage systems, electricity networks, garbage collection, and public lighting networks [7]. Public services are actions that the public administration provides to meet demands for health, education, public safety, and public transportation [35,36]. This study deals specifically with the infrastructure of cities.
Although important to all citizens, the distribution of infrastructure in urban areas is not homogeneous [37]. Brazilian cities, for example, have profound inequalities in access to these services, with clear disparities between central and peripheral areas [8]. More advantaged areas, commonly located in central neighborhoods, have more infrastructure. In turn, peripheral areas, including favelas, face significant deficiencies in urban public infrastructure. In particular, these areas have deficiencies, especially in terms of sewage and paving of public roads. These deficiencies further reduce the well-being of the most vulnerable populations, accentuating city inequalities [38].
The lack of basic infrastructure in more vulnerable areas compromises the quality of life of its inhabitants and contributes to the perpetuation of cycles of poverty and social exclusion. The lack of sewage is related to higher levels of infant mortality. The absence of garbage collection, in turn, can increase the transmission of diseases.
Although there is consensus on the need to reduce inequalities in urban infrastructure, this task is quite challenging. In principle, the analysis of the distribution of public infrastructure requires the simultaneous consideration of all its elements [7]. An area may have low levels concerning the water network and high levels concerning other elements, such as sewage, road paving, and garbage collection. In this case, investments in water networks in these areas may further exacerbate inequalities, given that other areas have intermediate levels in all other elements [8]. In this regard, expansion planning must consider multiple elements of urban infrastructure and assess the compensation levels between these elements to reduce inequality effectively. In other words, the complexity of the problem necessitates approaches that consider multidimensionality and the heterogeneity of areas in terms of urban infrastructure, as this reflects the diverse needs of citizens. These challenges qualify the operational framework of composite indicators as the natural path to solving the problem and achieving equitable and sustainable urban development [18].

2.2. Composite Indicators

Composite indicators are mathematical tools that simplify the representation and understanding of phenomena that cannot be measured through a monocriteria approach [15]. They offer a synthetic measure to capture the multiple aspects associated with multidimensional phenomena, such as human development, innovation, economic development, and social and environmental sustainability [14,16]. Their ease of implementation and advantages in understanding complex realities have also made composite indicators very popular in urban sciences. Composite indicators in urban planning are widely used, making significant contributions to the evaluation of urban planning policies [18], urban sustainability [39], and promoting place-based policy interventions [40].
The construction of composite indicators is relatively simple. First, scale normalization ensures that the different measurement units of the sub-indicators are compatible with a single, comparable scale [41]. Second, the weighting system allows assigning relative importance to sub-indicators [42]. Thirdly, the aggregation combines the normalized and weighted sub-indicators into a one-dimensional measure to represent the multidimensional concept [20,43,44].
Once constructed, the OECD’s [15] guide recommends verifying the robustness of the composite indicator (in terms of uncertainty and sensitivity) and its relationship with a reference indicator [15]. The former checks how much the rank/score of the results varies due to changes in the normalizing, weighting, and aggregating of the sub-indicators [14]. The second verifies how much the composite indicator captures the conceptually key indicator of the multidimensional phenomenon [45].

2.3. Methodological Gaps in Composite Indicators

Scholars have a natural interest in composite indicators since solving multidimensional problems requires the application of multicriteria decision-making methods [46,47]. At this point, it is possible to present some multicriteria methods, including the Analytic Hierarchy Process, Technique for Order Preference by Similarity to Ideal Solution, Preference Ranking Organization Method for Enrichment Evaluation, Ordered Weighted Averaging, and Élimination et Choix Traduisant la Réalité [27]. Composite indicators can also be constructed by statistical methods such as Data Envelopment Analysis, Factor Analysis, Principal Component Analysis, Benefit-of-the-Doubt, and k-means [28].
Literature review studies on composite indicators indicate that Principal Component Analysis, Factor Analysis [28], Data Envelopment Analysis, and Benefit-of-the-Doubt [27] are the most frequently used statistical methods. The endogenous definition of sub-indicator weights characterizes these methods. In particular, Principal Component Analysis and Factor Analysis aim to maximize the variance of input data, assigning greater weights to the most intercorrelated sub-indicators [48]. Data Envelopment Analysis and Benefit-of-the-Doubt are methods that seek to maximize the scores of decision-making units, assigning greater weights to the sub-indicators with the highest performance [49].
Finally, the non-statistical Analytic Hierarchy Process method is also frequently used by academics and researchers in the field. It defines the weights of the sub-indicators exogenously, disregarding the input data when defining the weights, which are determined by experts [50].
A search of the abstracts, titles, and keywords of research published in Scopus up to 31 December 2024, indicates the frequency with which these methods are employed. Table 1 shows that the five most commonly used methods are present in 81% of studies, indicating a gap in the use of outranking relations and Ordered Weighted Averaging methods in these studies.
The results show a scarcity of studies that apply Ordered Weighted Averaging to the construction of composite indicators. Although rarely used, there are examples of Ordered Weighted Averaging being applied to the construction of composite indicators of vulnerability [51], disaster resilience [52], social inequality [23], quality of life [52], and child well-being [25]. Among these studies, Shu et al. [52] and Libório et al. [23] explore different weighting systems. Both studies validate the results based on the uncertainty and the link of the composite indicator with a relevant indicator, disregarding other validations, such as the average variance extracted. Furthermore, these studies do not analyze the compensation levels between sub-indicators, providing no evidence of the effectiveness of non-compensatory aggregation.
In this context, the comprehensive analysis of the repercussions of weighting systems makes this study valuable for scholars interested in representing multidimensional phenomena through composite indicators constructed by Ordered Weighted Averaging.

3. Ordered Weighted Averaging

Firstly, explaining how the method proposed by Yager [21,22] works is opportune. Although quite peculiar, Ordered Weighted Averaging is very easy to implement. In short, the construction of a composite indicator using the method is carried out through the six steps below:
  • Normalize the data to the range [0, 1];
  • Transpose the data matrix, leaving the sub-indicators in the rows and the decision-making units in the columns;
  • Order the data in the transposed matrix from largest to smallest;
  • Define weights for each line, ensuring that the sum of the weights is equal to 1 (one);
  • Multiply the weights of each line by the values of the decision-making units in the same line;
  • Obtain the composite indicator scores by adding the weighted values of each column.
These steps emphasize the importance of defining the Ordered Weighted Averaging weights, as they are now associated with the row of the transport matrix and no longer with the sub-indicators [8]. The method defines the weights based on the decision-making unit’s performance in each sub-indicator, generating scores that are sensitive to the local context [25]. The weighting logic directed at the ordered sub-indicators operationalizes the concept of spatial heterogeneity, as the sub-indicator weights vary according to the decision-making unit [7]. In short, Ordered Weighted Averaging enables the construction of composite indicators that are sensitive to the spatial context, highlighting positive or negative characteristics to varying degrees depending on the adopted weighting system.

3.1. Ordered Weighted Averaging Linguistic Operators

At this point, addressing the linguistic operators [53] that enable the implementation of different weighting systems in Ordered Weighted Averaging is relevant. Linguistic operators are generally presented through their respective formulations [54]. In the present case, these formulations are transcribed into text to facilitate their understanding.
  • Max operator: Assigns a weight of one to the first line (sub-indicators with the highest performance) and a weight of zero to the other lines, performing an utterly non-compensatory aggregation that skews the scores upward to the maximum.
  • Min operator: Assigns a weight equal to one to the last line (sub-indicators with the lowest performance) and a weight of zero to the other lines, performing an utterly non-compensatory aggregation, which skews the scores downwards to the maximum.
  • Simple average operator: Assigns equal weights to all lines, performing an utterly compensatory aggregation, not skewing the scores in any direction.
Note that these operators do not allow regulation of the compensation levels between sub-indicators or directing the bias of the scores, making it necessary to implement operators such as:
  • More than J criteria: Assigns a weight of one to the last j criteria defined by the decision-maker, performing a non-compensatory aggregation, which biases the scores downwards, with the compensation levels and the intensity of the bias controlled by the value of j.
  • At least J criteria: Assigns a weight of one to the first j criteria defined by the decision-maker, performing a non-compensatory aggregation, which biases the scores upwards, with the compensation levels and the intensity of the bias controlled by the value of j.
Although there are many other linguistic operators, the flexibility offered by the More than J and At least J criteria operators allows for representing a multidimensional phenomenon from different perspectives. Other weighting systems can be implemented with Ordered Weighted Averaging.

3.2. Goal-Based Ordered Weighted Averaging

Entropy weighting is a widely used weighting system [55,56], which is also applied in the literature on composite indicators [57]. This weighting system assigns higher weights to data with greater informational diversity [58]. Factor analysis is another standard weighting system in the literature on composite indicators [27]. This weighting system has already been applied in the definition of weights for Ordered Weighted Averaging [24]. It consists of finding a weight vector that maximizes the variance of the input data [14]. In short, weighting systems frequently used in the construction of composite indicators can be adapted and implemented in Ordered Weighted Averaging as follows:
  • Entropy: Higher weights are assigned to lines with greater informational diversity, maximizing discrimination between decision-making units [57];
  • Average variance extracted: Higher weights are assigned to the most correlated lines, maximizing the variance of the ordered data [14,59].

3.3. Extreme Values Reduction Ordered Weighted Averaging

Finally, the extreme values reduction weighting system prioritizes intermediate values to reduce the influence of divergent opinions on the results [60,61]. This weighting system prevents possible outliers from biasing the composite indicator scores or increasing the trade-off between poor and above-average performance sub-indicators. The extreme values reduction weighting system assigns zero weight to lines with higher or lower values, preventing outliers from being included in the aggregation and ensuring non-compensation between poor and above-average performance sub-indicators, which can be summarized as follows:
  • EVR-Symmetric weights: Equal weights are assigned to the intermediate lines, with the number of lines with non-zero weights defined by the decision-maker.
This study develops a new set of weighting systems that reconcile the core idea of extreme value reductions (EVR) in prioritizing intermediate values and statistical objectives such as variance maximization, phenomenon explanation, and informational diversity.

3.4. Novel Weighting Systems for Ordered Weighted Averaging

The new weighting systems introduced in this study define the intermediate weights of the EVR-Symmetric weights through data-driven methods. This combination enables the development of the following set of new weighting systems:
  • EVR-Factor Analysis: Greater weights are assigned to the intermediate lines in such a way as to maximize the correlations of the input data with the composite indicator.
  • EVR-Max link: Greater weights are assigned to the intermediate lines, with these weights defined based on a function that maximizes the correlation of the composite indicator with the reference indicator.
  • EVR-Entropy: Greater weights are assigned to lines that allow the construction of a composite indicator with the greatest possible informational diversity measured by the entropy index.
Subsequently, these new weighting systems are compared to the operator’s maximum, minimum, simple average, More than J, and At least J criteria in representing urban infrastructure.

3.5. Defining the w i Weights in Ordered Weighted Averaging and EVR Weighting Systems

Initially, it is necessary to point out that the Max and Min operators assign non-zero weights to only one row of the transposed matrix constructed in Step 3 (Section 3). Therefore, these operators do not offer the decision-maker flexibility in defining the weights. In turn, the At least J and More than J criteria operators offer the decision-maker complete flexibility in defining the weights. This definition is entirely subjective and is associated with the trade-off between emphasis intensity and information in the model. In short, a greater emphasis intensity results in more information weighted with zero weight, and, consequently, less information in the model. Table 2 exemplifies this logic for the More than J criteria operator.
In turn, EVR-based weighting systems define weights based on statistical objectives. The EVR-Factor Analysis is an adaptation of the function proposed by Santos et al. [62]. These weighting systems set the b i weights in (2) in such a way as to maximize the variance extracted from the input data of the composite indicator:
i = 1 n c o v X , a n X × a n 2 m a x 0 w i 1
where X corresponds to the composite indicator as defined in (2).
EVR-Max link is an adaptation of the function proposed by Correa Machado et al. [63]. These weighting systems set the b i weights in (2) to maximize the correlation of the reference indicator income ( Y ) with the composite indicator:
c o v X , Y σ X σ Y m a x 0 w i 1
where cov is the covariance, σ X is the standard deviation of X , σ Y is the standard deviation of Y .
EVR-Entropy is an adaptation of the function proposed by Libório et al. [64]. These weighting systems define the weights b i in (2) to maximize the entropy index of the indicator composed by the following function:
1 ln n i = 1 n x i ln x i max 0 w i 1
where n   is the number of decision-making units, x i is the i -th score of the composite indicator.

4. Application Example: Urban Infrastructure

4.1. Data: Sub-Indicators and Relevant Indicator

The urban infrastructure considered in this study includes waste collection, sewage systems, water and electricity supply, roads, traffic lights, and stormwater networks [35,36]. Public services, such as administration, recreation, health, education, social services, and public safety, associated solely with the universality principle, were disregarded because their infrastructure can change location, making planning analyses difficult.
The infrastructure data used in the study are associated with the 97 urban census tracts of the city of São Sebastião do Paraiso, Brazil. Table 3 presents the descriptive statistics of the sub-indicators used in constructing the composite indicator of urban infrastructure.
At this point, it is essential to emphasize the close relationship between urban infrastructure and household income, as areas with more urban infrastructure are generally more valued, attracting wealthier families, while property values often exclude more vulnerable families [8]. For this reason, average income is used as a reference indicator to verify the link between the composite indicator and theory.

4.2. Composite Indicators, Weighting System, and Their Repercussions

The first step in constructing the composite indicator is to transform the sub-indicator scale into a dimensionless measure [41]. Ordered Weighted Averaging requires sub-indicators normalized in the interval [0, 1], which the following function can accomplish:
a n o = S b o S b o min S b o max S b o min
where a n o is the normalized value of the sub-indicator o for alternative n , S b o min is the lowest value of the sub-indicator o , and S b o max is the highest value of the sub-indicator o .
Then, the Ordered Weighted Averaging operator of dimension n and function 0 , 1 n 0 , 1 is implemented from the aggregation of normalized sub-indicators a 1 ,   a 2 ,     , a n as follows:
OWA a 1 , a 2 , , a n = i = 1 n w i b i
where b i is the highest value sub-indicator between a 1 , a 2 , , a n and the weights w i satisfy the following conditions: w i 0 , 1 and i = 1 n w i = 1 .
Note that the w i weights are assigned according to the sub-indicator performance as detailed in Section 3. This study evaluates the repercussions of the nine weighting systems presented in Section 3 on the composite indicator of public infrastructure. More specifically, the impact of the nine weighing systems on the representation of urban infrastructure was assessed based on the following elements of the composite indicator:
  • Average scores: Identifies the intensity and direction of bias in the scores of the composite indicator;
  • Coefficient of variation: Reveals the level of compensation between poor and above-average performance sub-indicators and a measure of proximity between the scores, signaling the difficulty of analyzing or differentiating the areas of the city;
  • Correlation with reference indicator: Measures the connection between the composite indicator and the reference indicator of the multidimensional phenomenon;
  • Average extracted variance: Corresponds to the proportion of information from the input data that is retained in the composite indicator;
  • Uncertainty: Represents the coefficient of agreement of the classification of public infrastructure of the different weighting systems concerning the simple average system.
These results are analyzed to guide the choices for constructing reliable composite indicators.

4.3. Defining the Number of J Criteria and Obtaining the Weights

The number of J criteria in the At least J and More than J criteria operators was defined based on two decision parameters. The first decision parameter is associated with the attempt to find a balance between the intensity of emphasis and the amount of information in the model. In this context, Table 4 shows that a J = 4 allows for capturing both the positive and negative aspects of urban infrastructure, while simultaneously not implying a significant reduction in information in the model.
The second decision parameter that led to the choice of J = 4 is associated with its replicability for the EVR (Symmetric weights) weighting system. EVR (Symmetric weights) assumes that pairs of values, i.e., the largest and smallest values, are assigned zero weights. In this respect, J = 4 is particularly suitable, as the two largest and smallest values are weighted with zero weights, and 69% of the information is retained in the model.
Once the value of J is defined, it is possible to define the weights w i for each b i . Table 5 shows the weights assigned to each row of the transposed matrix, according to the weighting system. The Max operator assigns a non-zero weight only to the best-performing sub-indicator, represented by b 1 . In practice, this action implies an overestimation of the decision-making unit’s best-performing sub-indicator while simultaneously underestimating the other sub-indicators. This logic biases the composite indicator’s scores upwards maximally. Note that the opposite occurs with the Min operator, where only b 13 is weighted with a non-zero weight.
Note that the other weighting systems provide more balanced combinations regarding the trade-off between emphasis intensity and information in the model. On the one hand, the At least J and More than J criteria allow emphasizing local positive or negative aspects without significant loss of information. On the other hand, the EVR weighting systems allow attenuating prominent positive or negative aspects in the composite indicator, offering a representation opposite to that of the At least J and More than J criteria. Except for EVR-Entropy, these weighting systems enable the representation of urban infrastructure from various perspectives. More specifically, these weighting systems allow for the emphasis or attenuation of positive or negative local aspects without a significant loss of information.

5. Results and Discussions

5.1. Strengths and Weaknesses of Weighting Systems in the Representation of Urban Infrastructure

The Max and At least J operators are similar. They assign greater weights to the first lines, increasing the composite indicator scores, as sub-indicators with higher values are positioned in these lines during the sorting step. Composite indicators constructed by these operators have average scores of 0.994 and 0.910.
Conversely, the Min and More than J operators are similar in that they assign greater weights to the last lines, where sub-indicators with lower values are located, thereby reducing the composite indicator scores. Biasing the composite indicator scores upwards or downwards helps the decision-maker highlight the positive or negative aspects of the multidimensional phenomenon. Composite indicators constructed by these operators have average scores of 0.010 and 0.503.
Table 6 shows that indicators constructed using the logic of extreme value reductions present intermediate average scores. This result indicates the presence of outliers that bias the scores in traditional weighting systems. In particular, the average score of the simple average operator composite indicator is 0.650. This average score is lower than that observed in the EVR-Symmetric weights composite indicator, which was 0.717. This example suggests the presence of poor performance sub-indicators between extreme values.
In addition to highlighting the positive and negative aspects of multidimensional phenomena, weighting by ordering prevents poor performance sub-indicators from being compensated by above-average performance sub-indicators [25]. This non-compensatory approach is advantageous because it differentiates composite indicators with different data structures but with the same mean. In other words, composite indicators with the same mean are treated differently, where one aggregates sub-indicators with performance close to the mean and the other aggregates sub-indicators with performance far from the mean [24].
At this point, it is important to note that the Max and Min operators do not offer flexibility in regulating the bias intensity or compensation levels between sub-indicators. Both construct a composite indicator with total bias (positive or negative) and zero compensation level, as indicated by their coefficient of variation in Table 7.
The results in Table 7 show that the highest compensation level is observed between sub-indicators in the composite indicator More than J criteria. This result reinforces previous evidence on poor performance sub-indicators, particularly those with extreme values, as they increase the coefficient of variation of the scores. This evidence is corroborated by the coefficients of variation of the composite indicator’s simple average operator and EVR-Symmetric weights. The compensation levels between sub-indicators in the EVR-Symmetric weights are 0.484 and 0.635 in the simple average operator. Naturally, this result is expected, as extreme values increase the compensation levels between sub-indicators, increasing the coefficient of variation of the scores.
Another repercussion of the critical weighting systems to be evaluated is the correlation of the composite indicator with the reference indicator of income. This correlation is significant because it enables us to evaluate the extent to which the composite indicator aligns with the concept of the multidimensional phenomenon. Table 8 shows that the Max and Min operators do not capture the essence of urban infrastructure. The correlation coefficients of these composite indicators with the city areas’ urban infrastructure are 0.147 and 0.278. According to the rule of thumb of Hinkle et al. [65], these correlations are negligible. The other seven composite indicators correlate with income between 0.412 and 0.343 and are more closely aligned with the urban infrastructure construct.
The average extracted variance informs how much sub-indicator data was retained in the composite indicator. Table 9 shows that the constructed composite indicators extract about 20% of the information from the sub-indicators. However, the Max and Min composite indicators capture a much smaller percentage, 0.142 and 0.021, respectively.
These results prove that Max and Min operators can construct unreliable composite indicators. In particular, these operators also perform poorly in correlation with the reference indicator and show excessive bias in the scores.
Furthermore, composite indicators constructed by Max and Min operators show considerable deviations in urban infrastructure ranking. Table 10 shows that the uncertainty associated with the Max and Min weighting systems is, on average, 3.045 and 3.658 times greater than the mean.
A relevant point to highlight is the zero ranking uncertainty observed in the composite indicators’ simple average and EVR-Symmetric weights. On the one hand, this result suggests that the weighting that favors intermediate values may not significantly impact the ranking of urban infrastructure. On the other hand, the results suggest that extreme values may underestimate urban infrastructure, as they increase the compensability between sub-indicators.

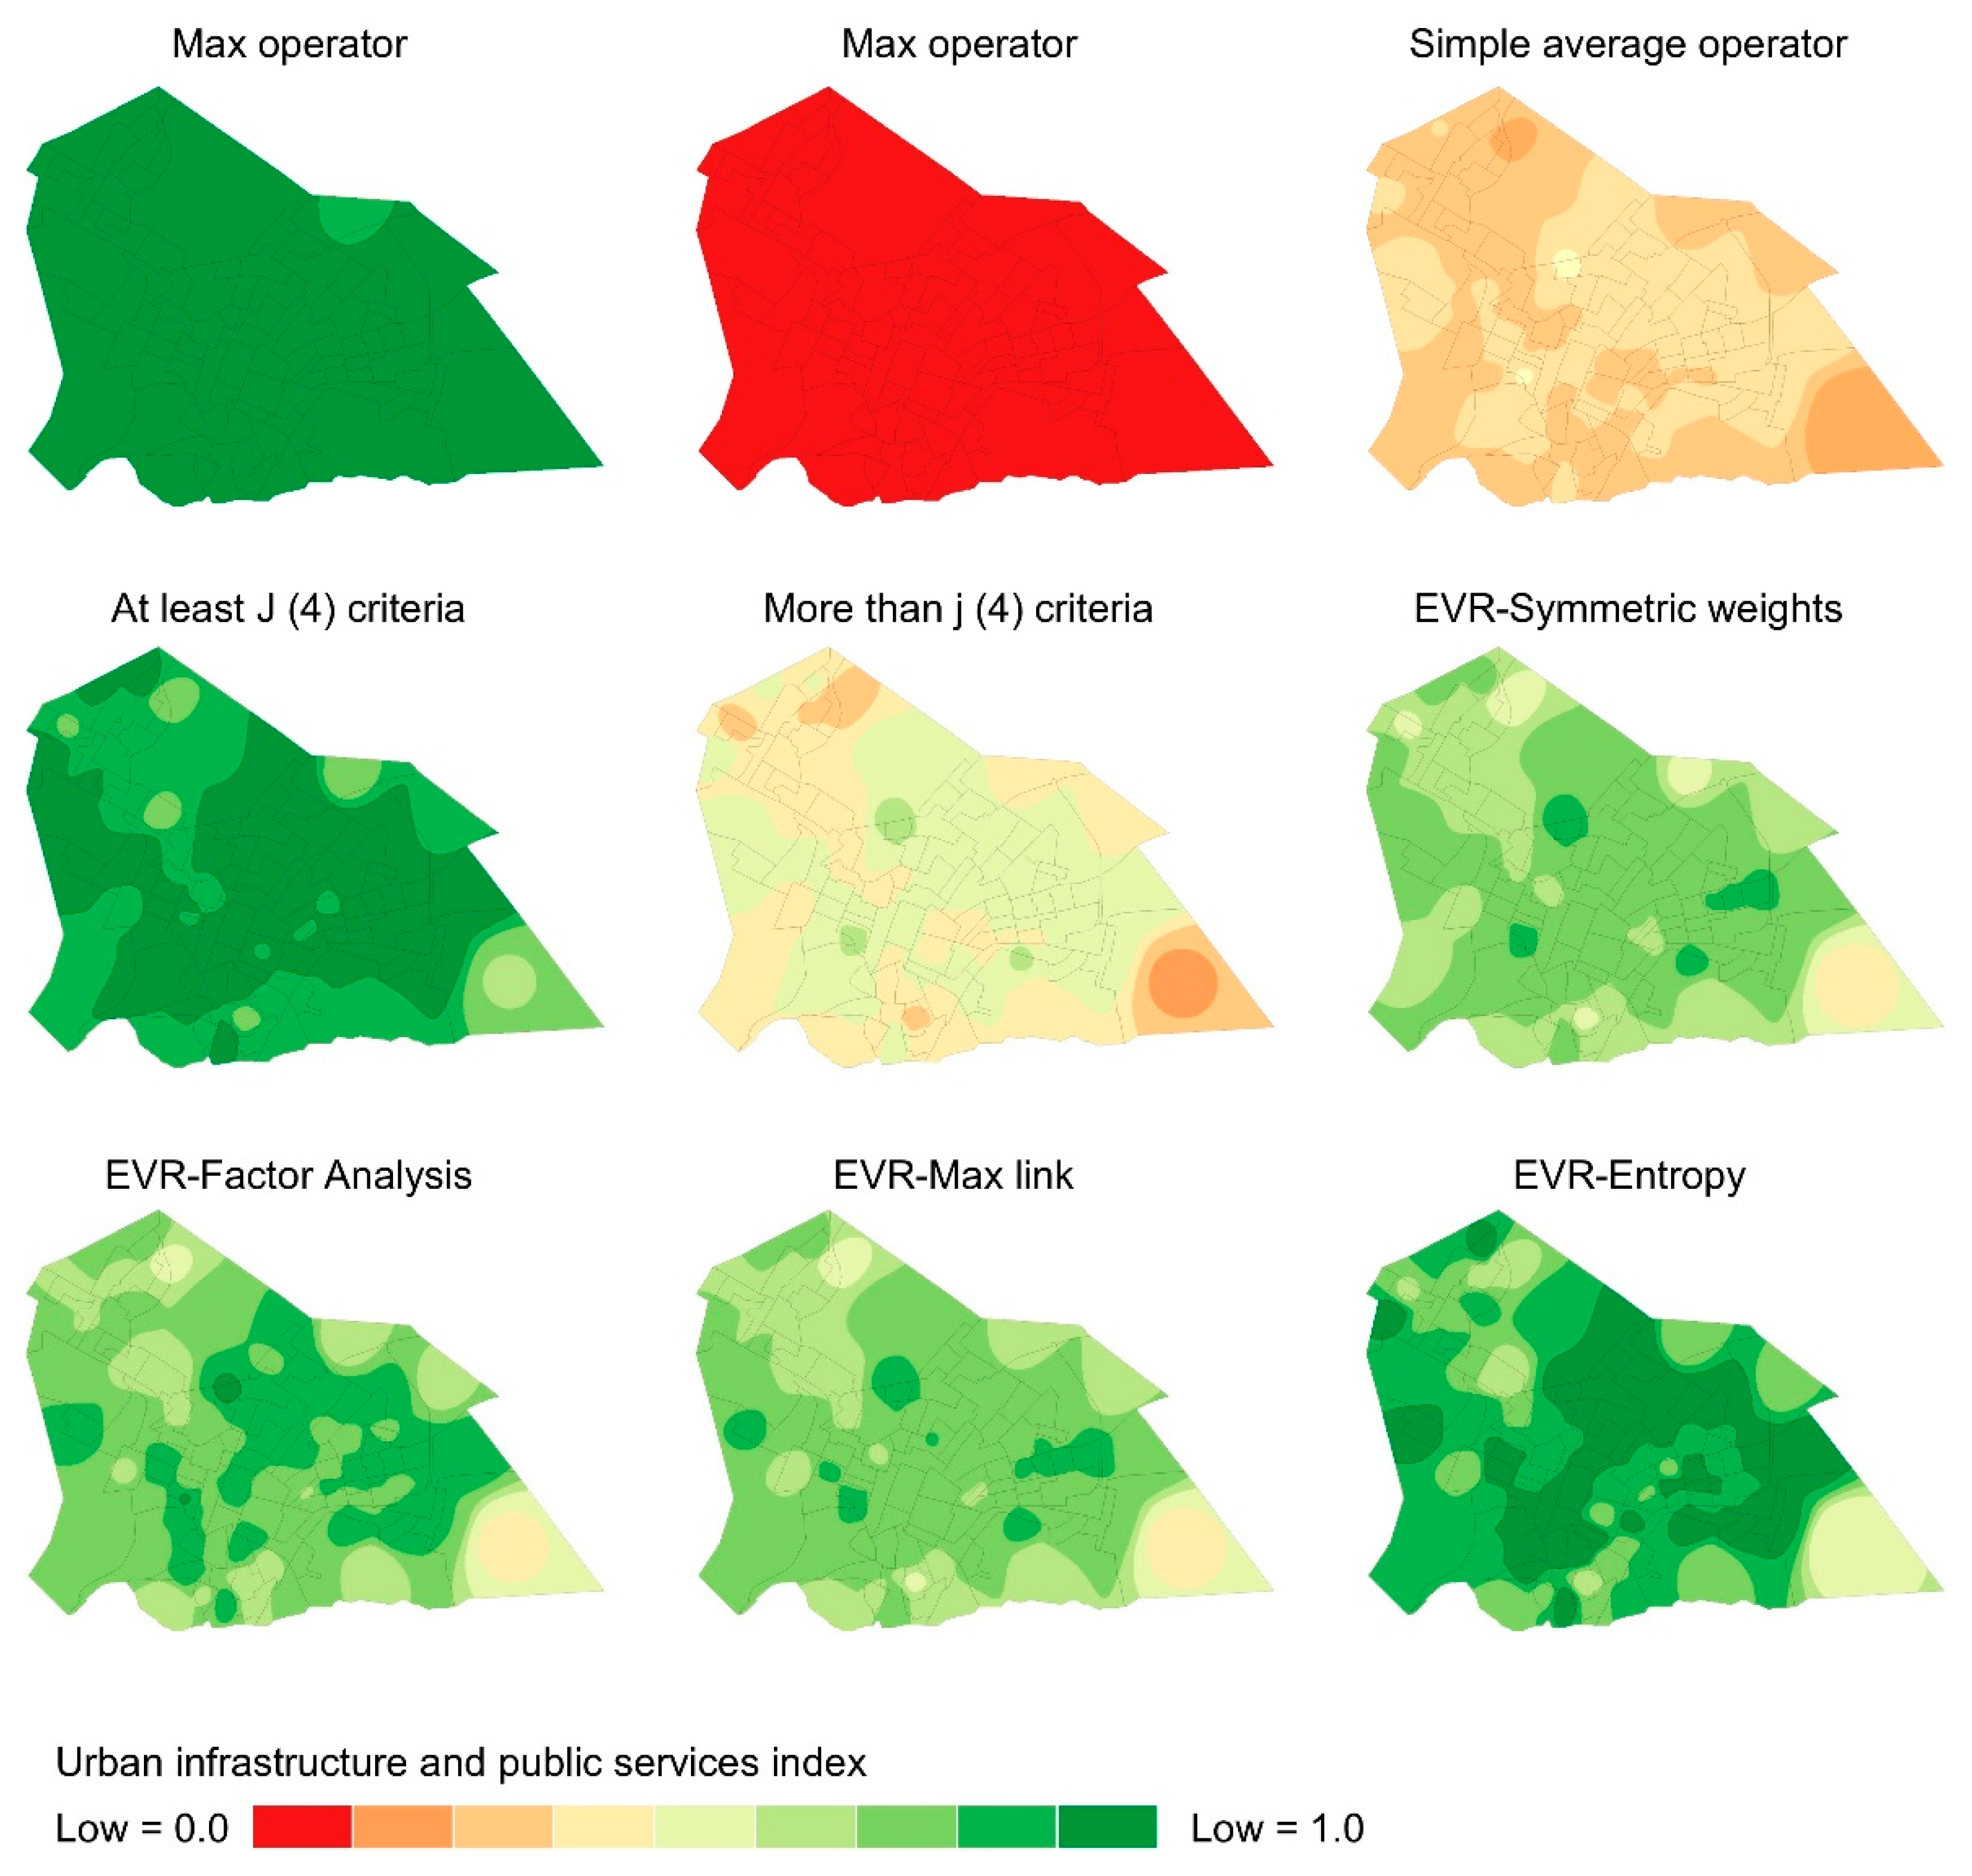
5.2. Visualization of the Repercussions of Weighting Systems in the Representation of Urban Infrastructures

The Max and Min weighting systems are generally unsuitable for representing composite indicators, as they fail to capture the concept of multidimensional phenomena, resulting in significant information loss and high-ranking uncertainty. Figure 1 illustrates that the Max and Min weighting systems also excessively bias the composite indicator scores, thereby creating difficulties in differentiating between decision-making units.
Weighting systems based on extreme value reduction logic are ideal for representing multidimensional phenomena for different reasons. These weighting systems avoid the aggregation of sub-indicators with extreme performance, avoiding excessive bias in the scores and reducing the compensation levels between sub-indicators. They also offer composite indicators with the highest degrees of correlation with the multidimensional phenomenon concept and representation concerning the input sub-indicators. Furthermore, they do not cause significant variations in the ranking of urban infrastructure, indicating a stable internal structure.
However, weighting systems implemented based on extreme value reduction logic fail to highlight the negative aspects of the multidimensional phenomenon. This limitation prevents public managers from identifying priority areas for investments in urban infrastructure. In this case, it is possible to consider using composite indicators constructed by the More than J (4) criteria and simple average weightings to overcome this limitation.

5.3. Strategies for a Balanced Expansion of Urban Infrastructure

Implementing different weighting systems provides an opportunity to develop strategies for the balanced expansion of urban infrastructure. On the one hand, implementing the More than j (4) weighting system enables the identification of areas in the city with the most deficient urban infrastructure. Prioritizing investments in these areas is a natural choice, as they reduce inequality in the distribution of urban infrastructure more significantly. On the other hand, EVR-Entropy allows the implementation of a second strategy for the balanced expansion of urban infrastructure. Governments can adjust property tax rates in consideration of the supply of urban infrastructure. Thus, the property tax would consider the welfare benefits and real estate appreciation that urban infrastructure generates. In short, higher rates are attributed to areas that benefit most from urban infrastructure.
The combination of the strategies mentioned above enables the implementation of a mechanism for balancing the city’s infrastructure. In this case, areas with the greatest deficiencies in urban infrastructure (those exceeding the J criteria) correspond to areas with the lowest property tax rates (as measured by EVR-Entropy) and vice versa. This mirroring enables the implementation of a mechanism for fiscal justice, directing investments in urban infrastructure to enhance the well-being of all citizens. Figure 2 illustrates the areas of the city with the most significant deficiencies in urban infrastructure.
Figure 2 illustrates the areas of São Sebastião do Paraíso (MG) with the most significant deficiencies in urban infrastructure, revealing a clear center–periphery pattern typical of Latin American socio-spatial urban organization [66]. In this structure, central areas tend to exhibit better living conditions and infrastructure provision, while peripheral zones face pronounced deficiencies, often equated with those of the underprivileged.
Under these circumstances, the combination of the More than J criteria and EVR-Entropy weighting systems provides valuable insights for public planners aiming to develop balanced infrastructure strategies. Specifically, the areas identified as most deficient by the More than J criteria align with those showing the lowest property tax rates under the EVR-Entropy system, and vice versa. This mirroring enables the implementation of a redistributive mechanism that promotes fiscal justice, in which revenue collected from wealthier, well-served areas can be reinvested in underserved neighborhoods. After all, better infrastructure increases property value and quality of life. Therefore, residents in these areas can contribute more through taxes, while inhabitants of vulnerable areas can be protected from excessive taxation and prioritized for infrastructure investment. Such an approach not only enhances social equity but also improves the efficiency and transparency of urban planning decisions.

5.4. External Validation

The external validation of the More than J criteria and EVR-Entropy weighting systems aims to ensure robust results and a balanced expansion of urban infrastructure. Table 11 shows that the selected weighting systems are robust from both perspectives. First, the scores of the composite indicators constructed using the More than J criteria and EVR-Entropy weighting systems exhibit very strong correlations with the scores of the composite indicators constructed by the methods most frequently employed in the literature.
Secondly, Table 12 shows that the ranking of census sectors in terms of infrastructure and urban services does not exhibit significant fluctuations due to changes in the weighting system of the More than J criteria or the EVR-Entropy method.
These results indicate that the priority areas for investment in public infrastructure or for adjusting the property tax rate, as indicated by the More than J criteria or EVR-Entropy weighting systems, are stable and do not present significant fluctuations in relation to the Principal Component Analysis, Entropy, and Benefit-of-the-Doubt methods.

6. Conclusions

This study highlights several significant findings on constructing composite indicators using the Ordered Weighted Average operator. First, composite indicators constructed using the Max and Min operators proved inadequate, as they presented high information loss and uncertainty, thereby compromising their usefulness in evaluating urban infrastructure. Second, weighting systems based on extreme value reduction logic are more effective in representing multidimensional phenomena, as they avoid aggregating sub-indicators with extreme performance and, thus, reduce bias in the scores of composite indicators.
These results have significant practical implications for urban planners, as they provide a solid basis for directing investments in urban infrastructure. The study suggests that adopting weighting systems that prioritize intermediate values can lead to more effective resource allocation, helping to identify areas with deficient infrastructure and promoting more equitable urban development. Furthermore, the correlation of composite indicators with reference indicators, such as average income, was significantly improved with the new weighting systems, indicating greater adherence to the concept of multidimensional phenomena.
The new weighting systems for the Ordered Weighted Average operator enable the consideration of heterogeneity in sub-indicators within each area, allowing for the planning of balanced urban infrastructure expansion that takes into account the characteristics of each area. Furthermore, the non-compensability between sub-indicators prevents one infrastructure from replacing another, preventing deficiencies in one type of infrastructure from being masked by the presence of other infrastructures. The capacity of the composite indicators to capture the multidimensional concept is another valuable piece of information for urban planners, as it signals whether the composite indicator is appropriate for use. Finally, the informational loss inherent in sub-indicator aggregation helps urban planners verify the compatibility between the conceptual and operational frameworks by revealing the transfer rate of the data defined in the conceptual framework to the composite indicator.
These novelties open up new directions for future investigations, particularly concerning the analysis of variation in the importance of sub-indicators across spatial units, which can further enrich our understanding of urban phenomena. Within this line of research, it is essential to note that the ordering of the transposed matrix presents considerable challenges in tracking the weights assigned to the sub-indicators within each decision-making unit. This limitation hinders the interpretation of spatial heterogeneity, such as identifying the most relevant sub-indicators by geographic context, and measuring the sensitivity levels of the weighting systems in the composite indicator scores. In this context, developing a mechanism for tracking the weights assigned to sub-indicators within each decision-making unit is also a promising line of future research.

Author Contributions

Conceptualization, M.P.L. and P.E.; Methodology, M.P.L., P.E., S.L. and A.C.G.d.S.; Validation, M.F.S.V.D., C.B. and A.M.A.D.; Investigation, M.F.S.V.D., A.M.A.D. and S.L.; Data curation, M.P.L. and A.C.G.d.S.; Writing—original draft, M.P.L., P.E., A.M.A.D. and A.C.G.d.S.; Writing—review & editing, M.F.S.V.D., C.B. and S.L.; Visualization, S.L. All authors have read and agreed to the published version of the manuscript.

Funding

This research was funded by Fundação de Amparo à Pesquisa do Estado de Minas Gerais: PPE-00087-24, APQ 01042-23, and APQ-01157-24; National Council for Scientific and Technological Development: 308265/2022-0, 407180/2023-0, 402464/2024-9, 311922/2021-0, and 303733/2019-5.

Data Availability Statement

The data used in this study are available for download at: Libório, Matheus (2025), “Composite indicator of public goods”, Mendeley Data, V2, https://doi.org/10.17632/twmp5yf59r.1 or https://data.mendeley.com/datasets/twmp5yf59r/1.

Conflicts of Interest

The authors declare no conflict of interest.

References

  1. Nicoletti, L.; Sirenko, M.; Verma, T. Disadvantaged communities have lower access to urban infrastructure. Environ. Plan. B: Urban Anal. City Sci. 2023, 50, 831–849. [Google Scholar] [CrossRef]
  2. Piazza, S.; Sambito, M.; Maglia, N.; Puoti, F.; Raimondi, A. Enhancing urban water resilience through stormwater reuse for toilet flushing. Sustain. Cities Soc. 2025, 119, 106074. [Google Scholar] [CrossRef]
  3. Rabiei-Dastjerdi, H.; Matthews, S.A. Who gets what, where, and how much? Composite index of spatial inequality for small areas in Tehran. Reg. Sci. Policy Pract. 2021, 13, 191–205. [Google Scholar] [CrossRef]
  4. Rabiei-Dastjerdi, H.; Matthews, S.A.; Ardalan, A. Measuring spatial accessibility to urban facilities and services in Tehran. Spat. Demogr. 2018, 6, 17–34. [Google Scholar] [CrossRef]
  5. Kajiita, R.M.; Kang’ethe, S.M. Socio-Economic Dynamics Inhibiting Inclusive Urban Economic Development: Implications for Sustainable Urban Development in South African Cities. Sustainability 2024, 16, 2803. [Google Scholar] [CrossRef]
  6. Pandey, B.; Brelsford, C.; Seto, K.C. Infrastructure inequality is a characteristic of urbanization. Proc. Natl. Acad. Sci. USA 2022, 119, e2119890119. [Google Scholar] [CrossRef]
  7. Fusco, E.; Libório, M.P.; Rabiei-Dastjerdi, H.; Vidoli, F.; Brunsdon, C.; Ekel, P.I. Harnessing spatial heterogeneity in composite indicators through the ordered geographically weighted averaging (OGWA) Operator. Geogr. Anal. 2024, 56, 530–553. [Google Scholar] [CrossRef]
  8. Libório, M.P.; Rabiei-Dastjerdi, H.; Brunsdon, C.; de Rezende Pinto, M.; Fusco, E.; Vidoli, F. Ordered weighted averaging for the evaluation of urban inequality in sao Sebastião Do Paraíso. Cities 2024, 150, 104993. [Google Scholar] [CrossRef]
  9. Robati, M.; Monavari, S.M.; Majedi, H. Urban environment quality assessment by using composite index model. Environ. Prog. Sustain. Energy 2015, 34, 1473–1480. [Google Scholar] [CrossRef]
  10. Libório, M.P.; Ekel, P.I.; Bernardes, P.; Gomes, L.F.A.M.; Vieira, D.A.G. Specialists’ knowledge and cognitive stress in making pairwise comparisons. Opsearch 2024, 61, 51–70. [Google Scholar] [CrossRef]
  11. Rodrigues, M.; Franco, M. Measuring the urban sustainable development in cities through a Composite Index: The case of Portugal. Sustain. Dev. 2020, 28, 507–520. [Google Scholar] [CrossRef]
  12. Cao, M.; Yao, Q.; Chen, B.; Ling, Y.; Hu, Y.; Xu, G. Development of a composite regional vulnerability index and its relationship with the impacts of the COVID-19 pandemic. Comput. Urban Sci. 2023, 3, 1. [Google Scholar] [CrossRef]
  13. Tahmasbi, B.; Hajian, P.; Tahmasbi, F.; He, Q. Measuring integrated accessibility for sustainable mobility: A fuzzy set approach case study. Comput. Urban Sci. 2024, 4, 35. [Google Scholar] [CrossRef]
  14. Nardo, M.; Saisana, M.; Saltelli, A.; Tarantola, S. Tools for composite indicators building. Eur. Com. Ispra 2005, 15, 19–20. [Google Scholar]
  15. OECD; Joint Research Centre-European Commission. Handbook on Constructing Composite Indicators: Methodology and User Guide; OECD Publishing: Paris, France, 2008. [Google Scholar]
  16. Kuc-Czarnecka, M.; Lo Piano, S.; Saltelli, A. Quantitative storytelling in the making of a composite indicator. Soc. Indic. Res. 2020, 149, 775–802. [Google Scholar] [CrossRef]
  17. Fusco, E. Enhancing non-compensatory composite indicators: A directional proposal. Eur. J. Oper. Res. 2015, 242, 620–630. [Google Scholar] [CrossRef]
  18. Attardi, R.; Cerreta, M.; Sannicandro, V.; Torre, C.M. Non-compensatory composite indicators for the evaluation of urban planning policy: The Land-Use Policy Efficiency Index (LUPEI). Eur. J. Oper. Res. 2018, 264, 491–507. [Google Scholar] [CrossRef]
  19. Figueira, J.R.; Oliveira, H.M.; Serro, A.P.; Colaço, R.; Froes, F.; Cordeiro, C.R.; Diniz, A.; Guimarães, M. A multiple criteria approach for building a pandemic impact assessment composite indicator: The case of COVID-19 in Portugal. Eur. J. Oper. Res. 2023, 309, 795–818. [Google Scholar] [CrossRef]
  20. Greco, S.; Ishizaka, A.; Tasiou, M.; Torrisi, G. The ordinal input for cardinal output approach of non-compensatory composite indicators: The PROMETHEE scoring method. Eur. J. Oper. Res. 2021, 288, 225–246. [Google Scholar] [CrossRef]
  21. Yager, R.R. On ordered weighted averaging aggregation operators in multicriteria decisionmaking. IEEE Trans. Syst. Man Cybern. 1988, 18, 183–190. [Google Scholar] [CrossRef]
  22. Yager, R.R. Multicriteria decision making using fuzzy quantifiers. In Proceedings of the 1995 Conference on Computational Intelligence for Financial Engineering (CIFEr), New York, NY, USA, 9–11 April 1995; IEEE: New York, NY, USA, 1995; pp. 42–46. [Google Scholar]
  23. Libório, M.P.; Martinuci, O.D.S.; Ekel, P.I.; Hadad, R.M.; Lyrio, R.D.M.; Bernardes, P. Measuring inequality through a non-compensatory approach. GeoJournal 2022, 87, 4689–4706. [Google Scholar] [CrossRef]
  24. Libório, M.P.; Ekel, P.I.; Laudares, S.; da Silva Martins, C.A.P. A goal-based weighting for composite indicators constructed through Ordered Weighted Averaging (OWA) operator. MethodsX 2024, 12, 102575. [Google Scholar] [CrossRef]
  25. Ribeiro, L.C.; Libório, M.P.; Mannan, H.; Laudares, S.; Ekel, P.I.; Vieira, D.A.G.; Nobre, C.N. Software for building and measuring the quality of composite indicators using ordered weighted averaging: So-called S-CI-OWA. SoftwareX 2024, 26, 101660. [Google Scholar] [CrossRef]
  26. Sarra, A.; Nissi, E. A spatial composite indicator for human and ecosystem well-being in the Italian urban areas. Soc. Indic. Res. 2020, 148, 353–377. [Google Scholar] [CrossRef]
  27. El Gibari, S.; Gómez, T.; Ruiz, F. Building composite indicators using multicriteria methods: A review. J. Bus. Econ. 2019, 89, 1–24. [Google Scholar] [CrossRef]
  28. Fernandez, E.J.; Martos, M.J.R. Review of some statistical methods for constructing composite indicators. Stud. Appl. Econ. 2020, 38, 1–15. [Google Scholar] [CrossRef]
  29. Malczewski, J. GIS-based land-use suitability analysis: A critical overview. Prog. Plan. 2004, 62, 3–65. [Google Scholar] [CrossRef]
  30. Malczewski, J. GIS-based multicriteria decision analysis: A survey of the literature. Int. J. Geogr. Inf. Sci. 2006, 20, 703–726. [Google Scholar] [CrossRef]
  31. Feizizadeh, B.; Blaschke, T. GIS-multicriteria decision analysis for landslide susceptibility mapping: Comparing three methods for the Urmia lake basin, Iran. Nat. Hazards 2013, 65, 2105–2128. [Google Scholar] [CrossRef]
  32. Feizizadeh, B.; Jankowski, P.; Blaschke, T. A GIS based spatially-explicit sensitivity and uncertainty analysis approach for multicriteria decision analysis. Comput. Geosci. 2014, 64, 81–95. [Google Scholar] [CrossRef]
  33. Alvaracín Jarrín, A.A.; Cuji León, S.D.; Orozco, J.A.Z.; Sanjar, M. Information Fusion for the Development of a Composite Indicator of Criminogenic Factors Using OWA Operators. Fusion Pract. Appl. 2023, 12, 108–117. [Google Scholar]
  34. Wang, S.; Corcoran, J. Spatially integrated social sciences: Opportunities for computational urban science. Comput. Urban Sci. 2025, 5, 11. [Google Scholar] [CrossRef]
  35. Narbón-Perpiñá, I.; De Witte, K. Local governments’ efficiency: A systematic literature review—Part I. Int. Trans. Oper. Res. 2018, 25, 431–468. [Google Scholar] [CrossRef]
  36. Narbón-Perpiñá, I.; De Witte, K. Local governments’ efficiency: A systematic literature review—Part II. Int. Trans. Oper. Res. 2018, 25, 1107–1136. [Google Scholar] [CrossRef]
  37. Wiesel, I.; Liu, F. Conceptualising modes of redistribution in public urban infrastructure. Urban Stud. 2021, 58, 1561–1580. [Google Scholar] [CrossRef]
  38. van Veghel, J.; Dane, G.; Agugiaro, G.; Borgers, A. Human-centric computational urban design: Optimizing high-density urban areas to enhance human subjective well-being. Comput. Urban Sci. 2024, 4, 13. [Google Scholar] [CrossRef]
  39. Lo-Iacono-Ferreira, V.G.; Garcia-Bernabeu, A.; Hilario-Caballero, A.; Torregrosa-López, J. Measuring urban sustainability performance through composite indicators for Spanish cities. J. Clean. Prod. 2022, 359, 131982. [Google Scholar] [CrossRef]
  40. Ballantyne, P.; Singleton, A. Using composite indicators and city dashboards to promote place-based policy interventions. Cities 2024, 154, 105329. [Google Scholar] [CrossRef]
  41. Cinelli, M.; Spada, M.; Kim, W.; Zhang, Y.; Burgherr, P. MCDA Index Tool: An interactive software to develop indices and rankings. Environ. Syst. Decis. 2021, 41, 82–109. [Google Scholar] [CrossRef]
  42. Becker, W.; Saisana, M.; Paruolo, P.; Vandecasteele, I. Weights and importance in composite indicators: Closing the gap. Ecol. Indic. 2017, 80, 12–22. [Google Scholar] [CrossRef]
  43. Munda, G. Measuring sustainability: A multi-criterion framework. Environ. Dev. Sustain. 2005, 7, 117–134. [Google Scholar] [CrossRef]
  44. Munda, G. Intensity of preference and related uncertainty in non-compensatory aggregation rules. Theory Decis. 2012, 73, 649–669. [Google Scholar] [CrossRef]
  45. Dialga, I.; Thi Hang Giang, L. Highlighting methodological limitations in the steps of composite indicators construction. Soc. Indic. Res. 2017, 131, 441–465. [Google Scholar] [CrossRef]
  46. Rogge, N. Composite indicators as generalized benefit-of-the-doubt weighted averages. Eur. J. Oper. Res. 2018, 267, 381–392. [Google Scholar] [CrossRef]
  47. Pereira, M.A.; Camanho, A.S.; Figueira, J.R.; Marques, R.C. Incorporating preference information in a range directional composite indicator: The case of Portuguese public hospitals. Eur. J. Oper. Res. 2021, 294, 633–650. [Google Scholar] [CrossRef]
  48. Libório, M.P.; Diniz, A.M.A.; de Rezende Pinto, M.; Laudares, S.; Bernardes, P. Representing social exclusion in geographic space: Interpretability or informational power? Socio-Econ. Plan. Sci. 2025, 101, 102262. [Google Scholar] [CrossRef]
  49. Fusco, E. Potential improvements approach in composite indicators construction: The Multi-directional Benefit of the Doubt model. Socio-Econ. Plan. Sci. 2023, 85, 101447. [Google Scholar] [CrossRef]
  50. Saisana, M.; Saltelli, A. Expert panel opinion and global sensitivity analysis for composite indicators. In Computational Methods in Transport: Verification and Validation; Springer: Berlin/Heidelberg, Germany, 2008; pp. 251–275. [Google Scholar]
  51. Machado, E.A.; Ratick, S. Implications of indicator aggregation methods for global change vulnerability reduction efforts. Mitig. Adapt. Strateg. Glob. Change 2018, 23, 1109–1141. [Google Scholar] [CrossRef]
  52. Shu, Z.; Carrasco, R.A.; García-Miguel, J.P.; Sánchez-Montañés, M. Multiple scenarios of quality of life index using fuzzy linguistic quantifiers: The case of 85 countries in numbeo. Mathematics 2022, 10, 2091. [Google Scholar] [CrossRef]
  53. Zadeh, L.A. A computational approach to fuzzy quantifiers in natural languages. Comput. Math. Appl. 1983, 9, 149–184. [Google Scholar] [CrossRef]
  54. Yager, R.R. Quantifier guided aggregation using OWA operators. Int. J. Intell. Syst. 1996, 11, 49–73. [Google Scholar] [CrossRef]
  55. O’Hagan, M. Aggregating template or rule antecedents in real-time expert systems with fuzzy set logic. In Proceedings of the Twenty-Second Asilomar Conference on Signals, Systems and Computers, Pacific Grove, CA, USA, 31 October–2 November 1988; IEEE: New York, NY, USA, 1988; Volume 2, pp. 681–689. [Google Scholar]
  56. Chen, Z.S.; Yu, C.; Chin, K.S.; Martínez, L. An enhanced ordered weighted averaging operators generation algorithm with applications for multicriteria decision making. Appl. Math. Model. 2019, 71, 467–490. [Google Scholar] [CrossRef]
  57. Karagiannis, R.; Karagiannis, G. Constructing composite indicators with Shannon entropy: The case of Human Development Index. Socio-Econ. Plan. Sci. 2020, 70, 100701. [Google Scholar] [CrossRef]
  58. Macedo, P.; Madaleno, M.; Moutinho, V. A new composite indicator for assessing energy poverty using normalized entropy. Soc. Indic. Res. 2022, 163, 1139–1163. [Google Scholar] [CrossRef]
  59. Greco, S.; Ishizaka, A.; Tasiou, M.; Torrisi, G. On the methodological framework of composite indices: A review of the issues of weighting, aggregation, and robustness. Soc. Indic. Res. 2019, 141, 61–94. [Google Scholar] [CrossRef]
  60. García-Zamora, D.; Labella, Á.; Rodríguez, R.M.; Martínez, L. Symmetric weights for OWA operators prioritizing intermediate values. The EVR-OWA operator. Inf. Sci. 2022, 584, 583–602. [Google Scholar] [CrossRef]
  61. García-Zamora, D.; Labella, Á.; Rodríguez, R.M.; Martínez, L. Nonlinear preferences in group decision-making. Extreme values amplifications and extreme values reductions. Int. J. Intell. Syst. 2021, 36, 6581–6612. [Google Scholar] [CrossRef]
  62. Santos, A.C.; D’Angelo, M.F.; Carvalho, P.F.; Ekel, P.I.; Pedrycz, W. Subjective-objective method of maximizing extracted variance (Sommev) from governance sub-indicators: Understanding the governance of countries from an integrated and impartial perspective. Sci. Talks 2025, 13, 100431. [Google Scholar] [CrossRef]
  63. Correa Machado, A.M.; Ekel, P.I.; Libório, M.P. Goal-based participatory weighting scheme: Balancing objectivity and subjectivity in the construction of composite indicators. Qual. Quant. 2023, 57, 4387–4407. [Google Scholar] [CrossRef]
  64. Libório, M.P.; Karagiannis, R.; Diniz, A.M.A.; Ekel, P.I.; Vieira, D.A.G.; Ribeiro, L.C. The use of information entropy and expert opinion in maximizing the discriminating power of composite indicators. Entropy 2024, 26, 143. [Google Scholar] [CrossRef]
  65. Hinkle, D.E.; Wiersma, W.; Jurs, S.G. Applied Statistics for the Behavioral Sciences; Houghton Mifflin: Boston, MA, USA, 2003; Volume 663. [Google Scholar]
  66. Griffin, E.; Ford, L. A model of Latin American city structure. Geogr. Rev. 1980, 70, 397–422. [Google Scholar] [CrossRef]
Figure 1. Urban infrastructure represented by different Ordered Weighted Average weighting systems.
Urbansci 09 00300 g001
Figure 2. Priority areas for investment (More than (j) criteria) and for adjustments in property tax (EVR-Entropy).
Urbansci 09 00300 g002
Table 1. Frequency of use of the method in the construction of composite indicators.
MethodFrequency
Principal Component Analysis660
Data Envelopment Analysis344
Factor Analysis251
Analytic Hierarchy Process167
Benefit-of-the-Doubt150
Distance function methods150
Value and utility-based methods107
k-means46
Outranking relation methods32
Simple Additive Weighting19
Ordered Weighted Averaging13
Note: Outranking relation methods: ELECTRE and PROMETHEE. Value and utility-based methods: Multi-Attribute Value Theory (MAVT) and Multi-Attribute Utility Theory (MAUT). Distance functions method: Technique for Order Preferences by Similarity to Ideal Solutions (TOPSIS).
Table 2. Intensity of emphasis and information in the model for the More than J criteria operator.
Emphasis Intensity Information in the Model
J = 00%100%
J = 125%80%
J = 250%60%
J = 375%40%
J = 4100%20%
Table 3. Descriptive statistics.
CodeDescriptionMeanStandard DeviationMaximumMinimum
V002Street identification0.820.171.000.21
V008Public lighting0.980.041.000.78
V014Street paving0.940.121.000.32
V020Sidewalks0.910.151.000.21
V026Curbs on sidewalks0.950.101.000.40
V032Manholes in the streets0.180.220.910.00
V038Wheelchair ramps0.030.100.800.00
V044Urban trees0.790.151.000.30
V050Open sewage0.010.040.200.00
V056Accumulated waste0.050.090.390.00
V062Water supply0.990.021.000.82
V102Rainwater drainage0.820.171.000.21
V162Cleaning service0.970.091.000.28
VR01 *Monthly income2.1741.1006.360949
Note: * reference indicator used to measure the link of the composite indicator with the multidimensional construct of urban infrastructure.
Table 4. Trade-off between intensity of emphasis and information in the model.
Emphasis Intensity Information in the Model
J = 00%100%
J = 18%92%
J = 217%85%
J = 325%77%
J = 433%69%
J = 542%62%
J = 650%54%
J = 758%46%
J = 867%38%
J = 975%31%
J = 1083%23%
J = 1192%15%
J = 12100%8%
Table 5. Weights assigned to lines ordered by weighting system.
b Max OperatorMin OperatorSimple Average OperatorAt Least J (4) CriteriaMore Than J (4) CriteriaEVR-Symmetric WeightsEVR-Factor AnalysisEVR-Max LinkEVR-Entropy
b 1 1.000.000.080.110.000.000.000.000.00
b 2 0.000.000.080.110.000.000.000.000.00
b 3 0.000.000.080.110.000.110.080.100.00
b 4 0.000.000.080.110.000.110.080.100.00
b 5 0.000.000.080.110.110.110.080.100.00
b 6 0.000.000.080.110.110.110.180.130.33
b 7 0.000.000.080.110.110.110.180.130.33
b 8 0.000.000.080.110.110.110.180.130.33
b 9 0.000.000.080.110.110.110.080.100.00
b 10 0.000.000.080.000.110.110.080.100.00
b 11 0.000.000.080.000.110.110.080.100.00
b 12 0.000.000.080.000.110.000.000.000.00
b 13 0.001.000.080.000.110.000.000.000.00
Table 6. Repercussion of the Ordered Weighted Averaging weighting systems on the composite indicators’ average scores.
Weighting SystemAverage Score
Max operator0.994
Min operator0.010
Simple average operator0.650
At least J (4) criteria0.910
More than J (4) criteria0.503
EVR-Symmetric weights0.717
EVR-Factor Analysis0.764
EVR-Max link 0.729
EVR-Entropy0.864
Table 7. Impact of the Ordered Weighted Average weighting systems on the compensation levels between sub-indicators (coefficient of variation of composite indicators).
Weighting SystemCoefficient of Variation
Max operator0.000
Min operator0.000
Simple average operator0.635
At least J (4) criteria0.127
More than J (4) criteria0.819
EVR-Symmetric weights0.484
EVR-Factor Analysis0.682
EVR-Max link 0.500
EVR-Entropy0.089
Table 8. Repercussion of the Ordered Weighted Averaging weighting systems on the composite indicators correlation with income.
Weighting SystemCorrelation with Income
Max operator0.147
Min operator0.278
Simple average operator0.412
At least J (4) criteria0.343
More than j (4) criteria0.404
EVR-Symmetric weights0.411
EVR-Factor Analysis0.408
EVR-Max link 0.412
EVR-Entropy0.375
Table 9. Repercussion of the Ordered Weighted Averaging weighting systems on the composite indicators’ average extracted variance.
Weighting SystemAverage Extracted Variance
Max operator0.142
Min operator0.021
Simple average operator0.220
At least J (4) criteria0.229
More than j (4) criteria0.201
EVR-Symmetric weights0.215
EVR-Factor Analysis0.221
EVR-Max link 0.218
EVR-Entropy0.208
Table 10. Repercussion of the Ordered Weighted Averaging weighting systems on the composite indicators’ uncertainty.
Weighting SystemUncertainty Index
Max Operator0.412
Min Operator0.495
Simple average operator0.000
At least J (4) criteria0.099
More than j (4) criteria0.019
EVR-Symmetric weights0.000
EVR-Factor Analysis0.053
EVR-Max link 0.015
EVR-Entropy0.125
Table 11. Correlation of the scores of the composite indicators constructed by the More than J criteria and EVR-Entropy weighting systems with the scores of the composite indicators constructed by the Principal Component Analysis, Entropy, and Benefit-of-the-Doubt methods.
Principal Component AnalysisEntropyBenefit-of-the-Doubt
More than J (4) criteria0.7720.7760.746
EVR-Entropy0.8050.8050.758
Table 12. Relative ranking uncertainty.
Principal Component AnalysisEntropyBenefit-of-the-Doubt
More than J (4) criteria0.1680.1680.176
EVR-Entropy0.1480.1480.152
Disclaimer/Publisher’s Note: The statements, opinions and data contained in all publications are solely those of the individual author(s) and contributor(s) and not of MDPI and/or the editor(s). MDPI and/or the editor(s) disclaim responsibility for any injury to people or property resulting from any ideas, methods, instructions or products referred to in the content.

