Article

The Shifting Geography of Innovation in the Era of COVID-19: Exploring Small Business Innovation and Technology Awards in the U.S.

by
Bradley Bereitschaft
Department of Geography/Geology, University of Nebraska at Omaha, 6001 Dodge Street, Omaha, NE 68182, USA
Urban Sci. 2025, 9(8), 296; https://doi.org/10.3390/urbansci9080296
Submission received: 24 June 2025 / Revised: 21 July 2025 / Accepted: 23 July 2025 / Published: 30 July 2025

Abstract

This research examines the shifting geography of small firm innovation in the U.S. by tracking the location of small business innovation research (SBIR) and small business technology transfer (STTR) awardees between 2010 and 2024. The SBIR and STTR are “seed fund” awards coordinated by the Small Business Administration (SBA) and funded through 11 U.S. federal agencies. Of particular interest is whether the number of individual SBA awards, awarded firms, and/or funding amounts are (1) becoming increasingly concentrated within regional innovation hubs and (2) exhibiting a shift toward or away from urban centers and other walkable, transit-accessible urban neighborhoods, particularly since 2020 and the COVID-19 pandemic. While the rise of remote work and pandemic-related fears may have reduced the desirability of urban spaces for both living and working, there remain significant benefits to spatial agglomeration that may be especially crucial for startups and other small firms in the knowledge- or information-intensive industries. The results suggest that innovative activity of smaller firms has indeed trended toward more centralized, denser, and walkable urban areas in recent years while also remaining fairly concentrated within major metropolitan innovation hubs. The pandemic appears to have resulted in a measurable, though potentially short-lived, cessation of these trends.

1. Introduction

Whether measured in terms of patents, venture capital investment, or competitive government grants, innovative firms—and particularly startups—tend to cluster in metropolitan regions with a fertile mix of supportive infrastructure and human and financial capital [1,2,3]. The most significant innovative centers have historically been large, well-connected global cities with world-class research institutions and a thick labor market of skilled workers. Within these urban regions, innovative firms have concentrated geographically in both suburban and urban environments, with established science- and technology-focused firms often exhibiting a preference for lower-density suburban areas, while new innovative firms and industries are most often located in the downtown core or other relatively dense and diverse urban settings [4,5,6,7].
Emerging evidence suggests that the geography of innovation is undergoing a subtle yet potentially significant transformation, shaped by evolving firm preferences, labor market dynamics, and advances in digital communication and AI technologies. While large global cities continue to dominate as hubs of innovation, secondary cities and smaller urban regions are beginning to attract a growing share of innovative firms, due in part to improvements in digital telecommunications infrastructure and shifts in pandemic-driven preferences and behaviors [8,9,10]. The rise of hybrid and remote work models has also allowed certain types of firms—especially those in the early stages of development—to weigh lifestyle, affordability, and flexibility more heavily when choosing a location, or even shift to an entirely online presence [11,12,13]. New models of collaboration enabled by digital platforms are also reshaping how innovation occurs across space. Open innovation web-based platforms can foster collaboration among geographically dispersed firms, potentially reducing the need for physical proximity [14]. These changes may reduce the pull of relatively dense, centralized, and transit-accessible locations, even among startup firms for whom proximity and accessibility may be particularly crucial [15,16,17].
Despite the evolving landscape of innovation geographies, few studies have examined how these dynamics interact with intra-metropolitan urban form and design over time. As urban planners and policymakers continue to promote innovation districts and mixed-use urban redevelopment strategies, a critical question remains as to whether such built-environment interventions align with the evolving locational preferences and innovative activity of firms [18,19]. Additionally, while pre-pandemic research largely confirmed the benefits of walkability, transit accessibility, and land use diversity for fostering knowledge spillovers and entrepreneurial activity among new enterprises, it remains unclear whether these advantages persist amid widespread telecommuting and decentralization pressures [20,21].
Existing research tends to offer either cross-sectional snapshots or case-specific analyses, with limited attention to the longitudinal evolution of firm location patterns in response to major shocks such as the COVID-19 pandemic. Moreover, most empirical studies rely on aggregate economic or patent data, offering limited insight into the neighborhood-scale geography of early-stage innovative activity. This study contributes to the literature by combining a longitudinal (2010–2024) analysis with fine-grained spatial data on SBIR and STTR awards and awardees, which serve as a useful proxy for early-stage, research-oriented entrepreneurship. By leveraging this institutional dataset, the research offers a systematic and spatially detailed examination of firm-level innovation across different phases of the COVID-19 pandemic, capturing both temporal and geographic shifts at the inter- and intra-regional levels. Of primary interest is whether innovative firms have recently (1) become less or more concentrated within high-performing metropolitan regions, (2) exhibited a growing or declining preference for walkable, transit-oriented, and centrally located urban neighborhoods, and (3) responded to COVID-19 by shifting away from large urban centers. These findings may be of use to policymakers seeking to understand how innovative ecosystems are evolving spatially and how place-based strategies such as innovation districts may need to adapt.

2. Background

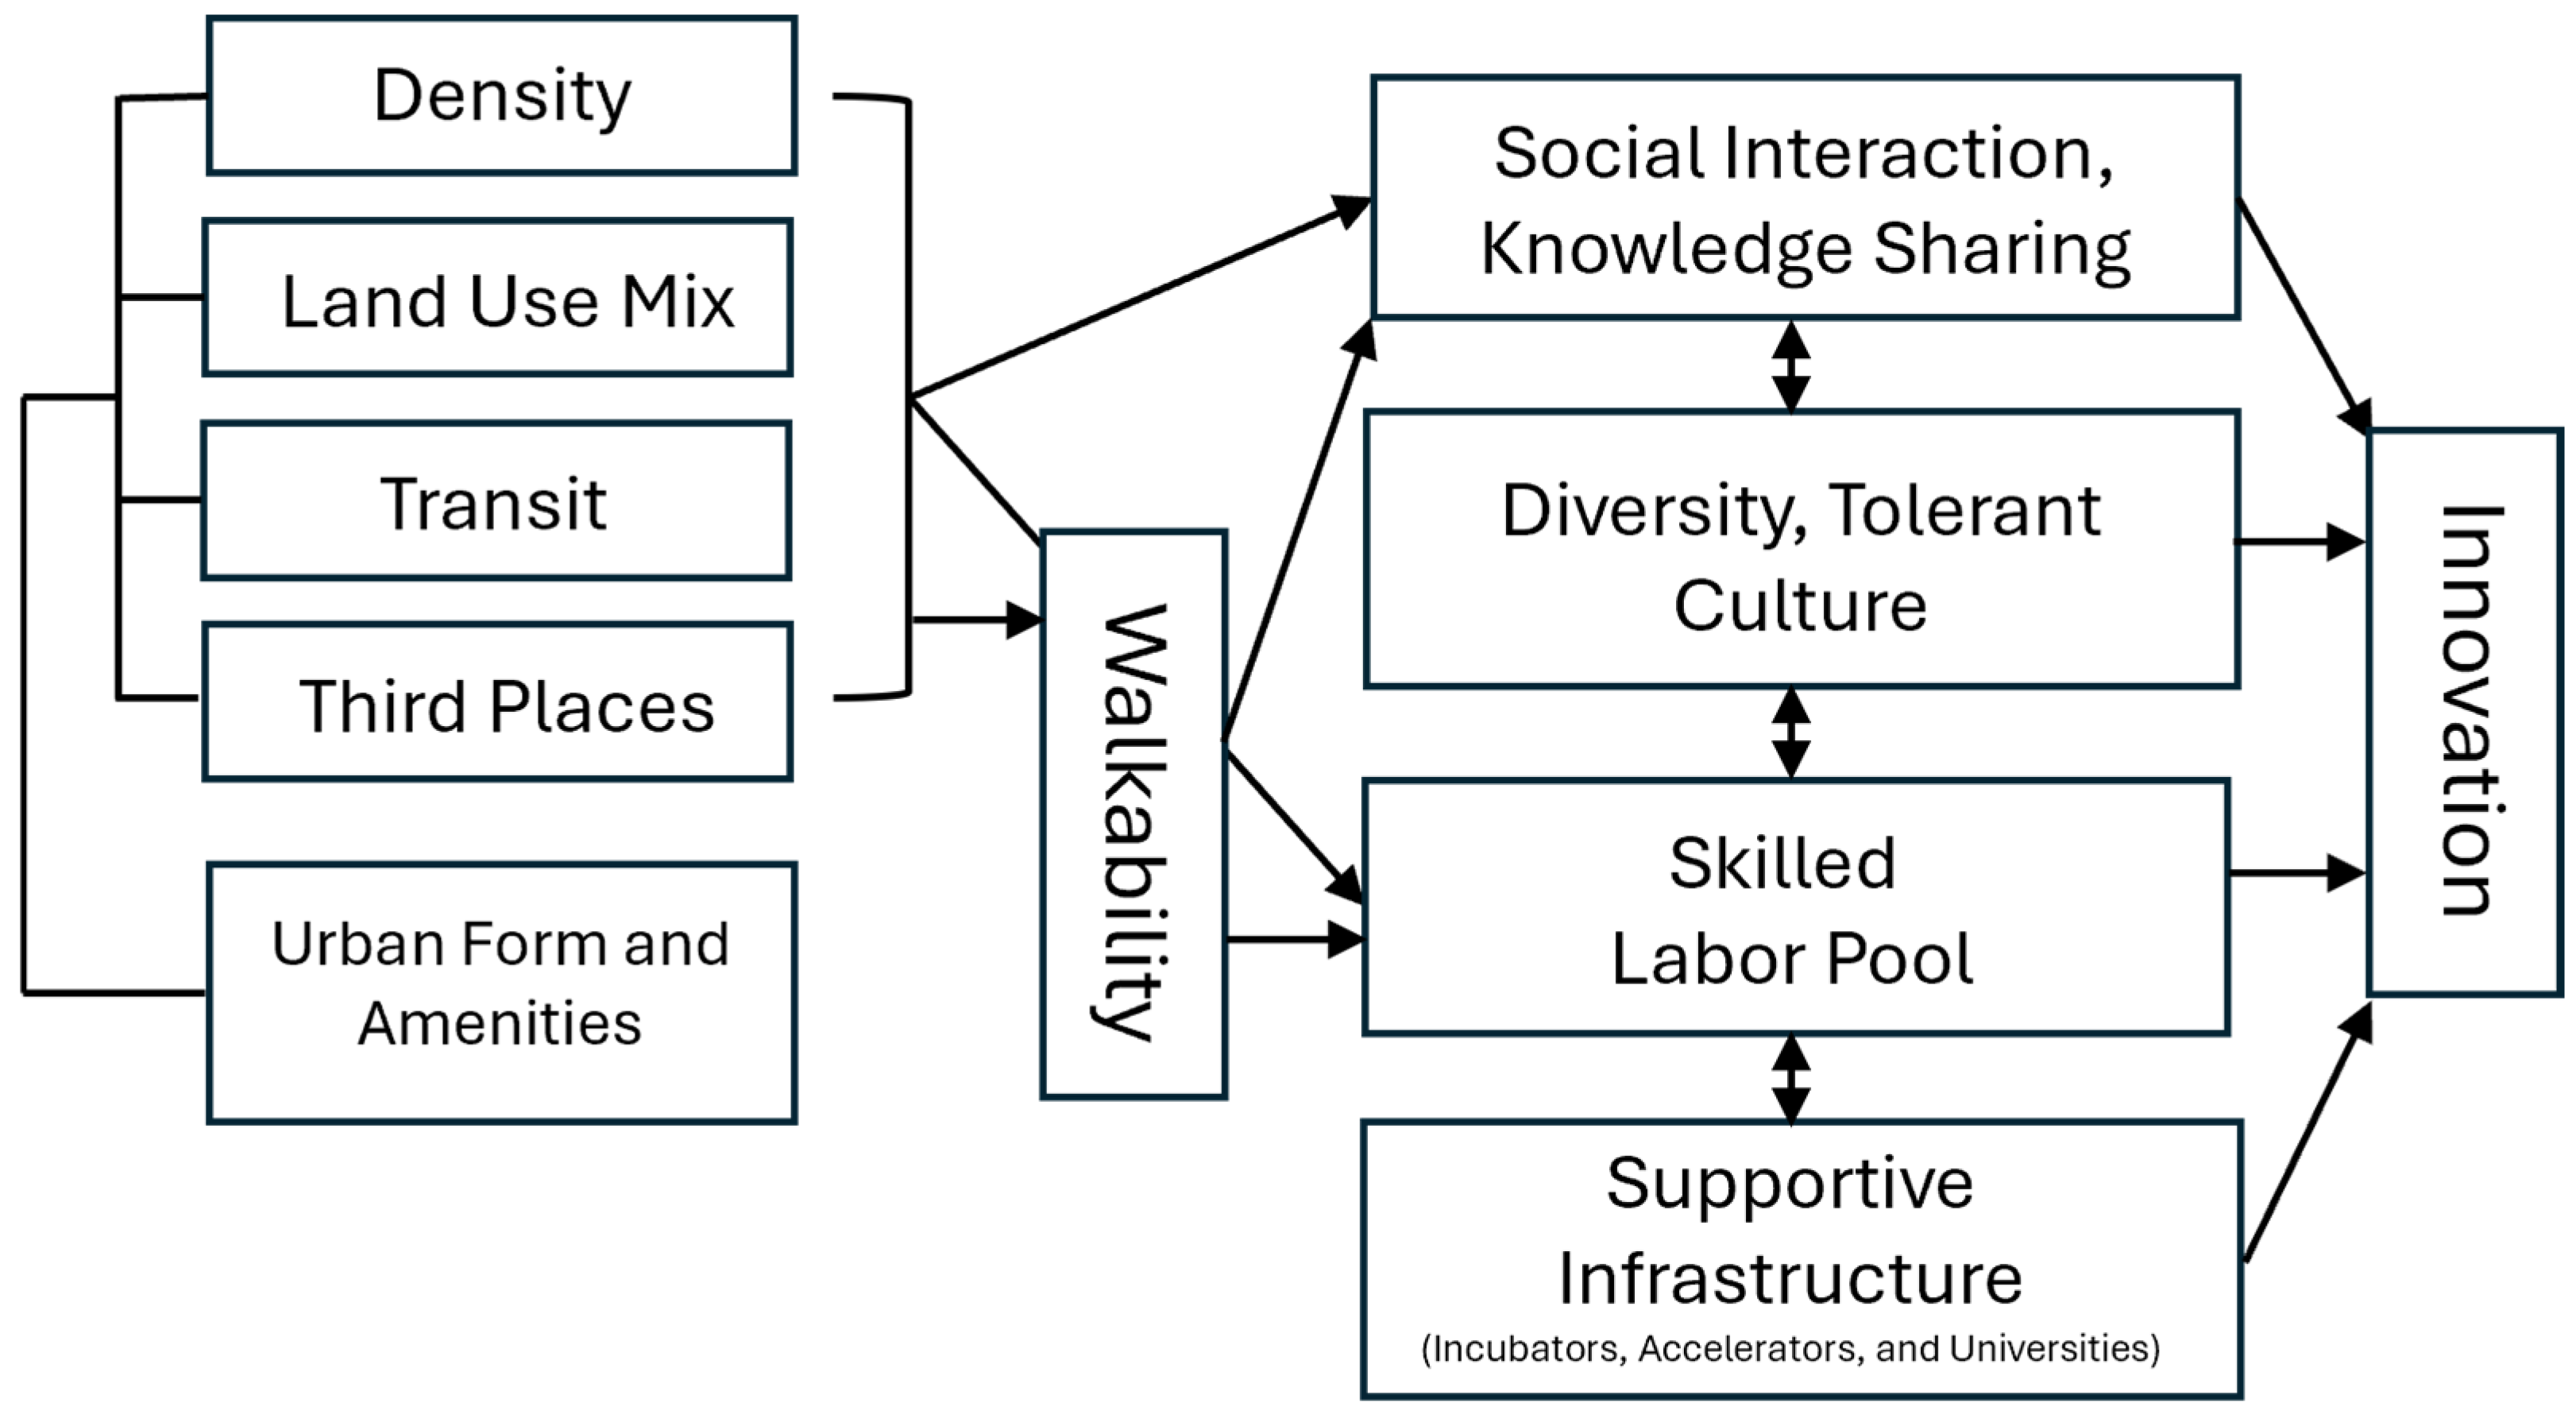
2.1. Innovation and the Built Environment

Recent research suggests that denser, more socially diverse, walkable, and transit-oriented cities and regions may be more effective at attracting and incubating innovative firms [1,17,22]. Florida and Mellander [1], for example, observed that venture capital investment was higher in U.S. metropolitan areas with greater overall densities and higher social diversity, while Hamidi and Zandiatashbar [17] confirmed that the number of innovative firms by U.S. metropolitan areas was positively associated with regional compactness. The authors utilized Ewing and Hamidi’s [23] metropolitan compactness index, which considers development density, land use mix, population and employment centering, and street connectivity.
Within cities and urban regions, there is evidence that innovation can flourish across a variety of urban and suburban typologies, though different industries and firms of particular sizes and ages may benefit from specific locations and locational amenities. Established science- and technology-oriented firms, for example, frequently locate in suburban settings and campus-like office parks [2,4,6,24]. Mature technology firms, which depend more heavily on internal knowledge flows and intra-firm learning, may be able to function effectively in suburban campuses [4]. Even here, however, larger firms often cluster in research/science parks and in proximity to local universities to take advantage of knowledge spillovers [25,26,27]. Indeed, spatial clustering of knowledge-intensive business services (KIBSs) (e.g., information technology and research and development) is common, with relatively dense urban cores and suburban business districts/“edge cities” [28] also being home to a large proportion of knowledge/information/technology firms [29,30,31].
Compared to larger, established firms, startups may be more likely to benefit from denser and more diverse urban locations where they can more readily establish supportive inter-firm networks and take advantage of shared infrastructure and knowledge spillovers [3,4,6,29,32,33]. For these fledgling businesses, dense, mixed-use urban environments with high-quality public spaces, “third places” such as coffee shops, bars, and restaurants [34], and a variety co-working spaces help facilitate both planned and chance encounters, thereby potentially raising innovation capacity through inter-firm interactions and idea sharing [32,35,36,37]. Similarly, proximity to business incubators, accelerators, universities, and other sources of venture capital and collaborative talent, which are often concentrated in central, transit-accessible urban centers and nodes, may be particularly valuable to startups [1,2,31,38]. Figure 1 presents a conceptual model illustrating some of the key connections between urban form and local innovation potential.
While much research emphasizes the functional benefits of dense, diverse, and transit-accessible environments for innovation, firms may also choose locations based on symbolic and strategic considerations. Battistella et al. [39], building on Verganti’s [40,41] work on design-driven innovation, suggest that firms increasingly utilize “meaning strategies”, in which they intentionally work to shape how they are perceived through both products and organizational choices, including location. For many startups and creative firms, place is part of their brand identity. Technology startups, for example, may locate in tech districts or renovated industrial buildings that convey a culture of innovation and dynamism [2,42,43]. Similarly, businesses in the creative industries such as fashion, branding, and media may choose to locate in arts districts or culturally vibrant neighborhoods that align with stated corporate values such as originality and authenticity [35,44]. Location and urban design have thus been leveraged to attract talent, clients, and investors by signaling alignment with an innovative culture [45].
Generally, in support of these theories, Florida and King [1] observed that hotspots of startup activity and venture capital investment in the U.S. was found in both urban and suburban environments yet tended to concentrate most heavily in urban metropolitan neighborhoods with relatively high density, land use mix, and transit accessibility. Similarly, Fang and Rao [46] documented higher patent activity in those areas of Baltimore, Maryland (U.S.), and Melbourne, Australia, with more industry diversity and higher levels of walkability. In other recent studies, fast growing and innovative firms (the latter assessed using U.S. Small Business Administration (SBA) innovation awards) in the U.S. have also been found to concentrate in relatively walkable, diverse, and transit-accessible employment centers [22,31,47]. Given these connections, many municipalities have designated “innovation districts” in central city neighborhoods or other dense, mixed-use urban areas to support local startup ecosystems and stimulate the emergence of innovative firms [5,7,48].

2.2. The Shifting Geography of Innovation and Startup Activity

To date, our understanding of the geography of innovative and entrepreneurial firms and activities and potential associations with urban form, design, and locational amenities has been limited mainly to snapshots in time that highlight patterns and correlation with limited consideration for temporal evolution. A few recent studies, however, have begun to consider shifts in the spatial patterns and locational preferences of innovative and startup firms in light of recent economic changes and disruptions, most notably COVID-19 and the expansion of remote work. In a sweeping historical analysis, Balland et al. [3] revealed that innovative economic activity in U.S. metropolitan areas, as measured using patents, research papers, industries, and occupations, has become more concentrated since at least 1850, primarily within large coastal metros. This may not be the case, however, for other countries or in the post-COVID-19 era. In a comparison of public research innovation and development (RDI) funding across rural and urban regions in Finland prior to and during the COVID-19 pandemic, Makkonen and Mitze [49] found that firms in rural areas performed especially well during the pandemic, significantly narrowing the funding gap with their urban counterparts. In a broader analysis of patent activity across 14 developed countries between 2000 and 2015, Fritsch and Wyrwich [8] found no trend of increasing concentration over time within the largest urban areas of most countries. Lastly, Huggins and Thompson’s [9] analysis of startup activity across a number of cities worldwide, in combination with surveys and interviews, suggests that innovation is becoming more spatially dispersed over time, a trend that was likely hastened by the pandemic. The authors argue, however, that the growth of entrepreneurial ecosystems in smaller “secondary” cities is not likely to diminish global innovation hubs.
With most evidence suggesting some recent deconcentration of innovative activity away from the largest urban centers, we wonder if this applies to intra-urban patterns as well; that is, are innovative firms and startups also exhibiting a shift away from more urban neighborhoods? In a novel analysis of firm movement and intra-metropolitan urban form and design, Motoyama [50] used a case study approach to explore whether “high-growth” firms (i.e., those with at least 100 percent sales growth over three years) in Franklin County, Ohio—the core county of the Columbus metropolitan area—moved away or toward more “vibrant” areas of the county between 2016 and 2019. Urban vibrancy was assessed using a combination of measures including density, land use diversity, walkability, transit accessibility, and connectivity, sourced from the U.S. Environmental Protection Agency’s (EPA) Smart Location Database (SLD). Of the high-growth firms that relocated during this time, the majority made only short moves with no significant change in urban vibrancy score. Those that made more significant moves were approximately equally split between those that moved to less and more vibrant areas of the county. The authors note that the majority of the high-growth firms were not in high-tech or medical/pharmaceutical industries but rather wholesale, retail, and transportation. Samani et al.’s [51] analysis of firm relocation prior to, during, and following the COVID-19 pandemic in Tennessee further suggests some shift in the locational preferences of firms. Smaller firms were more likely to relocate both prior to and during the pandemic, with firms in denser neighborhoods also more likely to relocate. Additionally, population density and accessibility to highways became more important predictors of firm relocation during the pandemic. Finally, Fazio et al. [52] examined new business formation in 2019 and 2020 in relation to neighborhood demographics and found that new startup activity, which declined during the first few months of the pandemic but accelerated by late 2020, was elevated in neighborhoods with higher incomes and a larger share of Black residents. Although the USD 2.3 trillion Coronavirus Aid, Relief and Economic (CARE) Act of 2020 and USD 900 billion Relief Supplemental Appropriations Act of 2021 did not fund new business formation directly, the authors suggest that the two federal stimulus bills appear to have had a significant positive impact on entrepreneurship, particularly within historically under-represented Black communities.
Although insightful, the aforementioned studies have either focused on (1) spatial shifts in innovation without much regard to urban form, design, and specific locational attributes or (2) the establishment and/or relocation of firms classified by industry or growth but not innovation or innovative potential. In the following analysis, these approaches are combined by examining the evolving geography of firm innovation and innovation potential (measured using SBIR/STTR awards), asking whether innovative firms have become more or less concentrated within top innovative regions, urban centers, and walkable and transit-accessible neighborhoods amid potential deconcentration pressures including COVID-19 and the widespread adoption of videoconferencing and collaboration technologies. It is hypothesized that the pandemic instigated some spatial diffusion in innovative activity due to both a reduction in the attractiveness of dense urban places resulting from fear of the contagion and the closure of supporting businesses and from an increase in the attractiveness of suburban, exurban, and rural areas amid growth in remote work and work from home policies [53,54,55,56].

3. Methods

This study represents one of the first attempts to examine changes in the geography of innovation over time in relation to local attributes of urban form using SBIR/STTR award data. The spatial scope of this investigation is limited to the United States to provide standardized data on innovation awards and urban form. Where necessary, some analyses are further limited to county-based Core-Based Statistical Areas (CBSAs), which can be divided into larger Metropolitan Statistical Areas (i.e., MSAs; regions with an urban core population exceeding 50,000) and smaller Micropolitan Statistical Areas (μSAs; regions with an urban core population between 10,000 and 50,000).

3.1. Measuring Innovation: SBIR/STTR Awards

Each year, the U.S. government awards billions of dollars of seed funding to thousands of small businesses (≤500 employees) to develop new technologies and bring new products and services to market. Coordinated by the Small Business Administration (SBA), eleven federal agencies currently participate in the “Small Business Innovation Research” (SBIR) and the “Small Business Technology Transfer” (STTR) award programs, the largest of which by total grant dollars include the Department of Defense (DOD; USD 2.3 billion), Department of Health and Human Services (HHS; USD 1.2 billion), and Department of Energy (DOE; USD 315 million) [57]. The STTR award program requires that firms partner with a non-profit research institution. Firms initially apply for “Phase I” grants, which total up to USD 150,000, and are designed to “establish the technical merit and feasibility of R&D ideas” that have the potential for commercialization [58]. Phase I recipients can later apply for a Phase II grant worth up to USD 2 million, which extends funding support for the commercial development of promising technologies and products. Given the large number (~6000/year) of SBIR/STTR awards granted annually, scholars have used them effectively to investigate the role of location in small firm innovation, particularly those in knowledge industries [16,22,59,60].
Fifteen years (2010–2024) of SBIR and STTR award data were gathered from the SBIR.gov online database for use in this study. Although the dataset includes awards issued as far back as 1983, the analysis begins in 2010 to better align with the urban form and location data (discussed below), most of which was collected in the 2010s or 2020s. Additionally, the use of a full decade of award data prior to the pandemic should provide enough time to detect pre-existing tends as well as provide a solid baseline against which any observed changes during COVID-19 could be compared. The SBIR/STTR dataset included 53,370 firms with at least one award, 95,538 total awards across all firms, and USD 57.4 billion of funding over the 15-year study period. Awarded firms (with the number of awards and award amount for each year) were geolocated for further analysis using ArcGIS Pro v.3.4. Approximately 99 percent of firm addresses were matched successfully (assigned a latitude/longitude coordinate and mapped) using the ArcGIS World Geocoding Service.

3.2. Intra-Urban Location and Urban Form

Changes in the mean location and locational attributes of awarded firms were tracked over the 2010–2024 study period using six variables: distance to the city center, combined housing and employment density (i.e., “activity” density), the EPA’s National Walkability Index (NWI), Walk Score®, transit service per square mile, and distance to the nearest fixed rail station. Distance to the city center was calculated as the distance from each firm to the city hall of the most populous municipality within the encompassing MSA. In the case of MSAs with two dominant urban centers, including Dallas–Fort Worth, Minneapolis–St. Paul, and Tampa–St. Petersburg, the city halls of both cities were used in the calculation. Note that this measure was limited to the 391 MSAs in the U.S., which contained about 97 percent of all awarded firms and SBIR/STTR awards issued during the study period.
The NWI and transit service per square mile variables were gathered from the EPA’s Smart Location Database (SLD) v. 3.0. The NWI is a composite index, available at the census block group (approximately neighborhood-scale) level, derived from the weighted sum (as ranked values) of four variables: land use diversity (using two entropy measures), street intersection density (weighted with auto-oriented intersections eliminated), and distance to the nearest transit stop. A complete overview of the index and associated sub-components can be found in the EPA’s NWI and SLD documentation [61,62]. Transit service per square mile was calculated using General Transit Feed Specification (GTFS) system data sourced from 573 transit agencies nationwide in 2020. The measure represents aggregate transit service frequency divided by block group area.
Walk Score® and distance to the nearest fixed rail station were included as alternative walkability and transit accessibility measures, respectively. Walk Score® is a publicly available online tool (www.walkscore.com) that assesses the walkability of a given address, zip code, or city based on population density, block length, intersection density, and the availability of amenities such as parks, schools, restaurants, grocery stores, and cafés [63]. Walk scores range from 0 to 100, with higher values indicating superior walkability. Scores were gathered for each awarded firm using the Walk Score® API. Distance to the nearest fixed rail station was calculated using a nationwide public transit station dataset available through the NASA Center for Climate Simulation (NCCS) data directory. Fixed rail stations included cable car, commuter rail, heavy rail, inclined plane, light rail, monorail/automated guideway, and streetcar rail, as defined by the U.S. Federal Transit Administration.
One of the benefits of using these alternative measures is that they can be obtained for each discrete firm location rather than representing an average for the encompassing census block group as in the SLD. However, while the SLD measures are based on data collected between 2017 and 2020, the Walk Score® data were collected more recently in 2024 and therefore do not align as well temporally with the earlier award data used in the study. Nevertheless, alternative measures provide a test of robustness for any observed trends or relationships between innovation and walkability/transit accessibility.

3.3. Statistical Analyses

Changes in the number of innovation awards, award dollars, and awarded firms over time, including the percentage located in the top 10 CBSAs, Micropolitan Statistical Areas and non-CBSA areas, and CBSA periphery, were graphed for visual inspection. Z-scores were calculated for each year to determine whether these percentages, and thus the location and concentration of small business innovation award activity, changed significantly over the study period (Figure 2, Figure 3, Figure 4 and Figure 5). Additionally, changes over time in firm locational/urban form variables were assessed for statistical significance (α = 0.05) using a one-way Analysis of Variance (ANOVA) and Games–Howell (equal variances not assumed) post hoc test in SPSS v.29 (Figure 6). Lastly, as a test of robustness, regression analysis was performed to determine whether changes in the walkability and transit accessibility associated with awarded firms could be explained by other locational factors.

4. Results

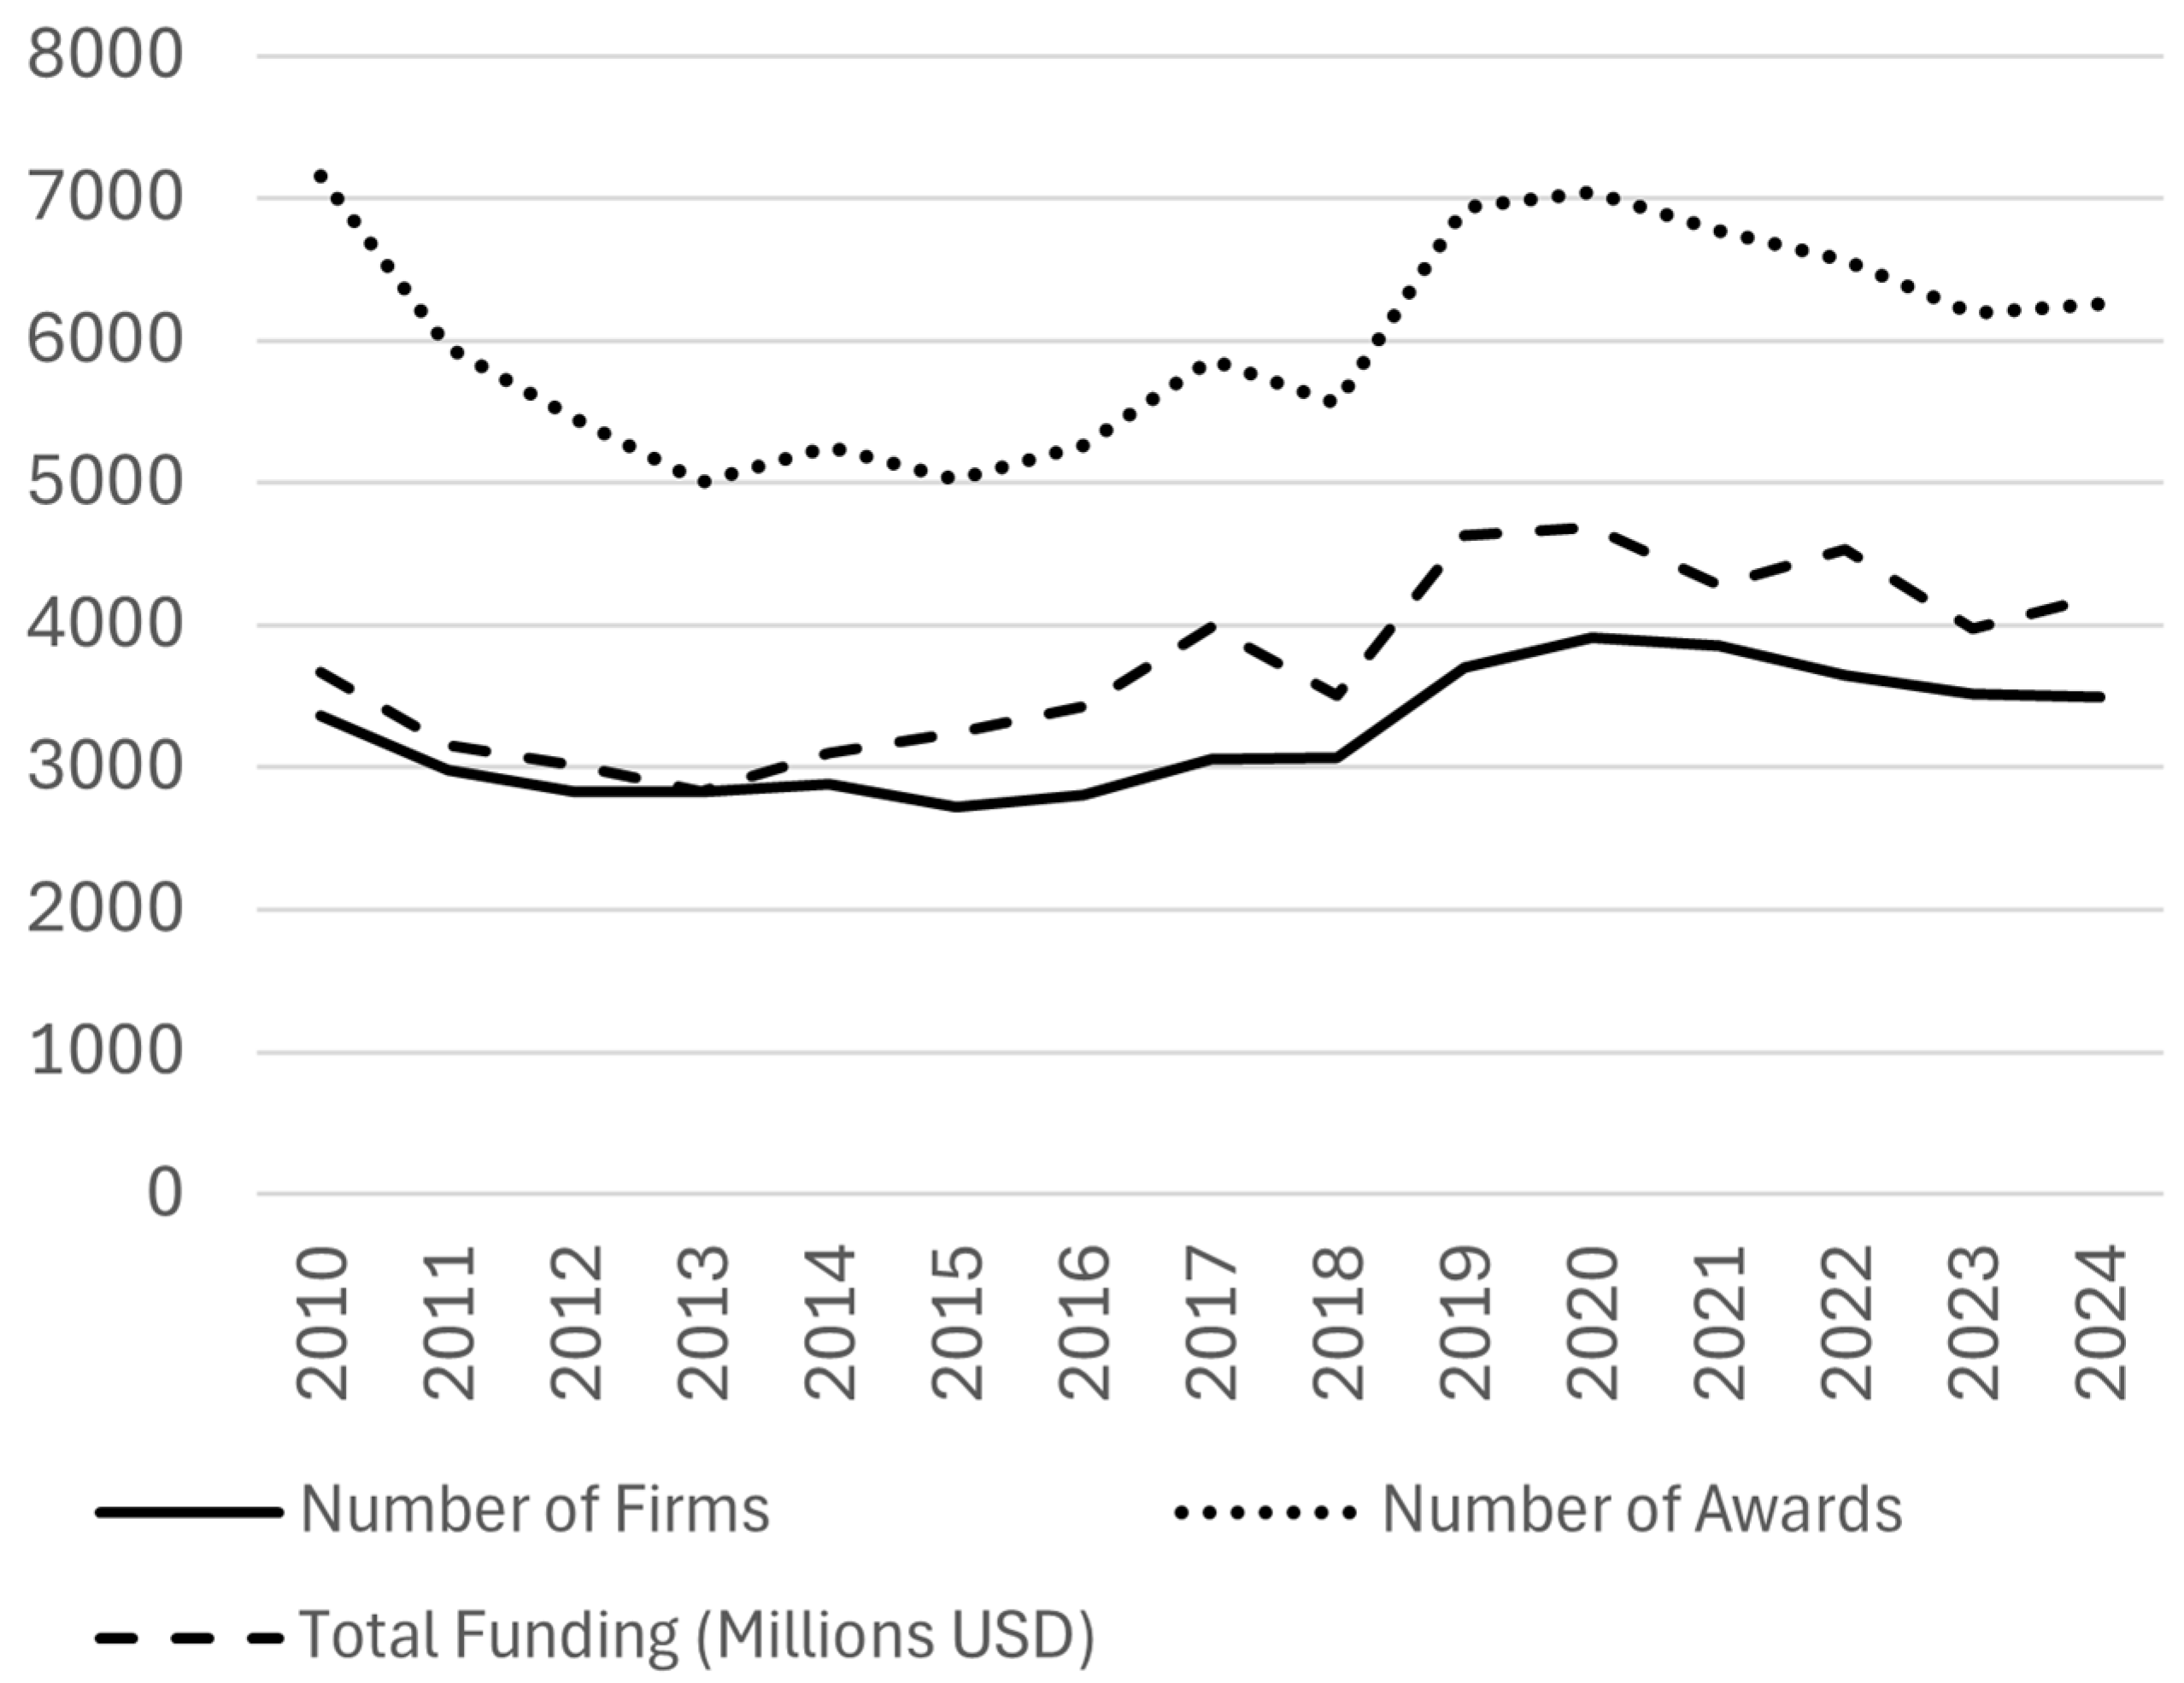
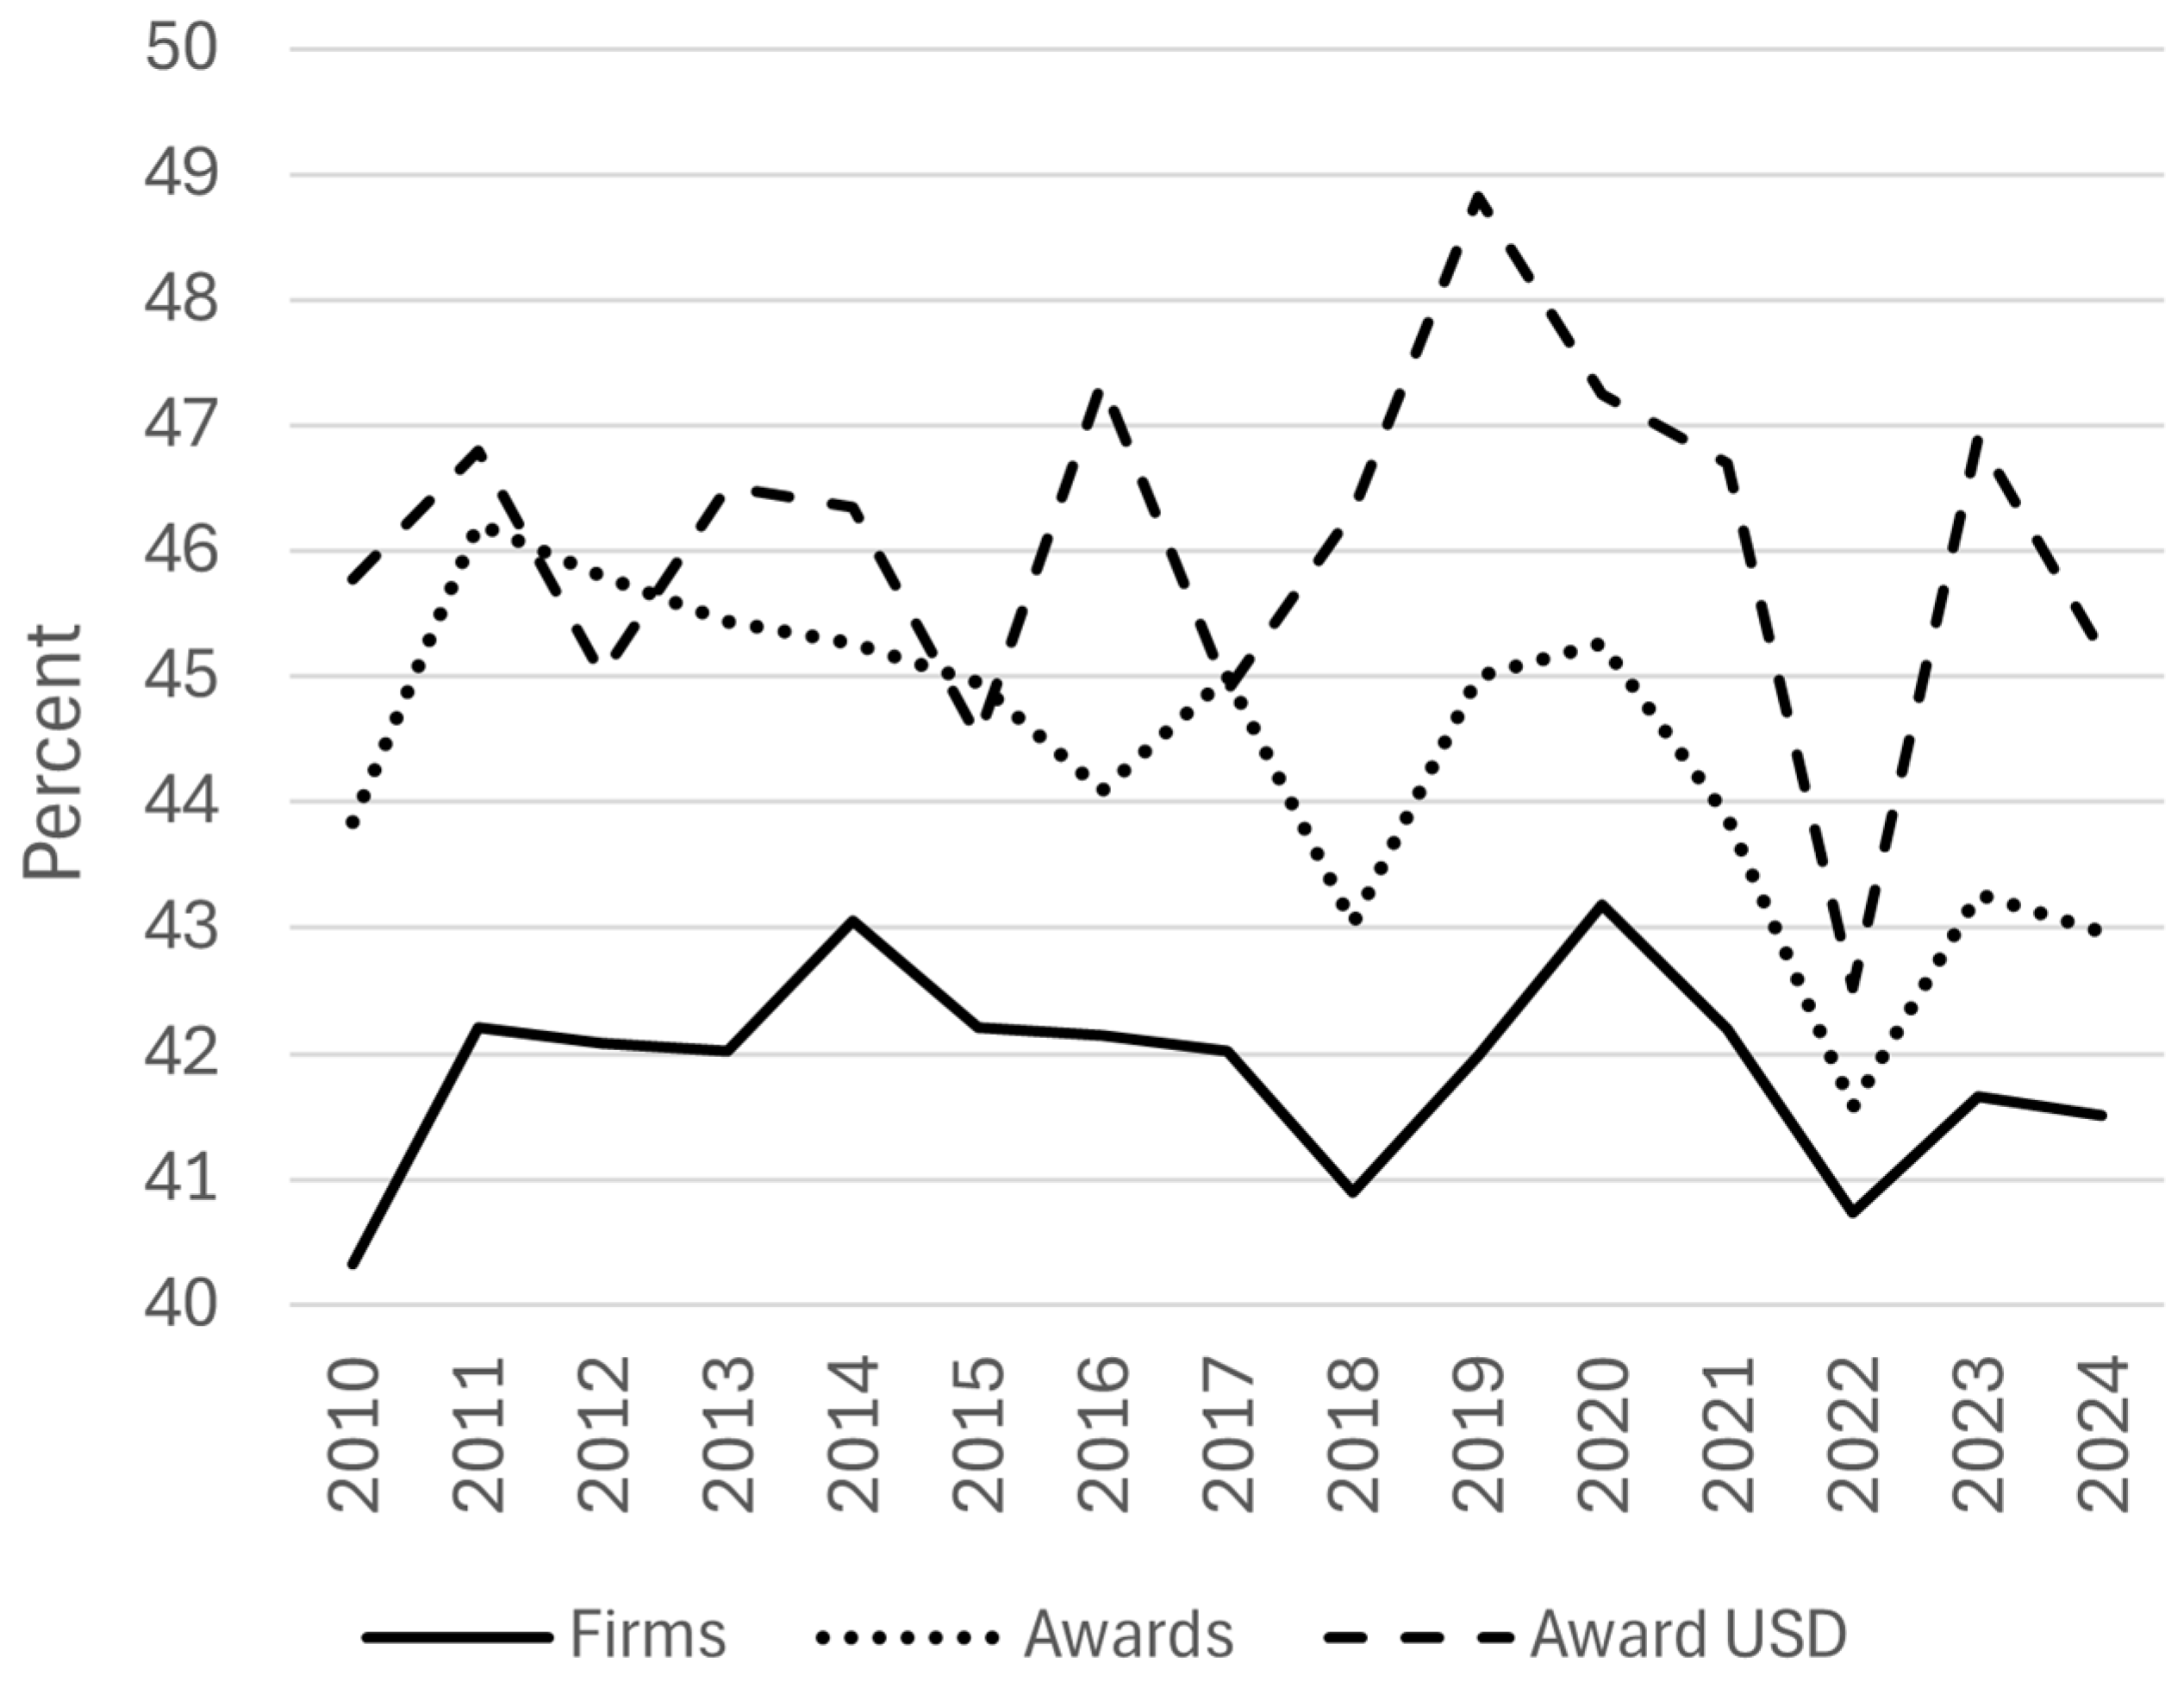
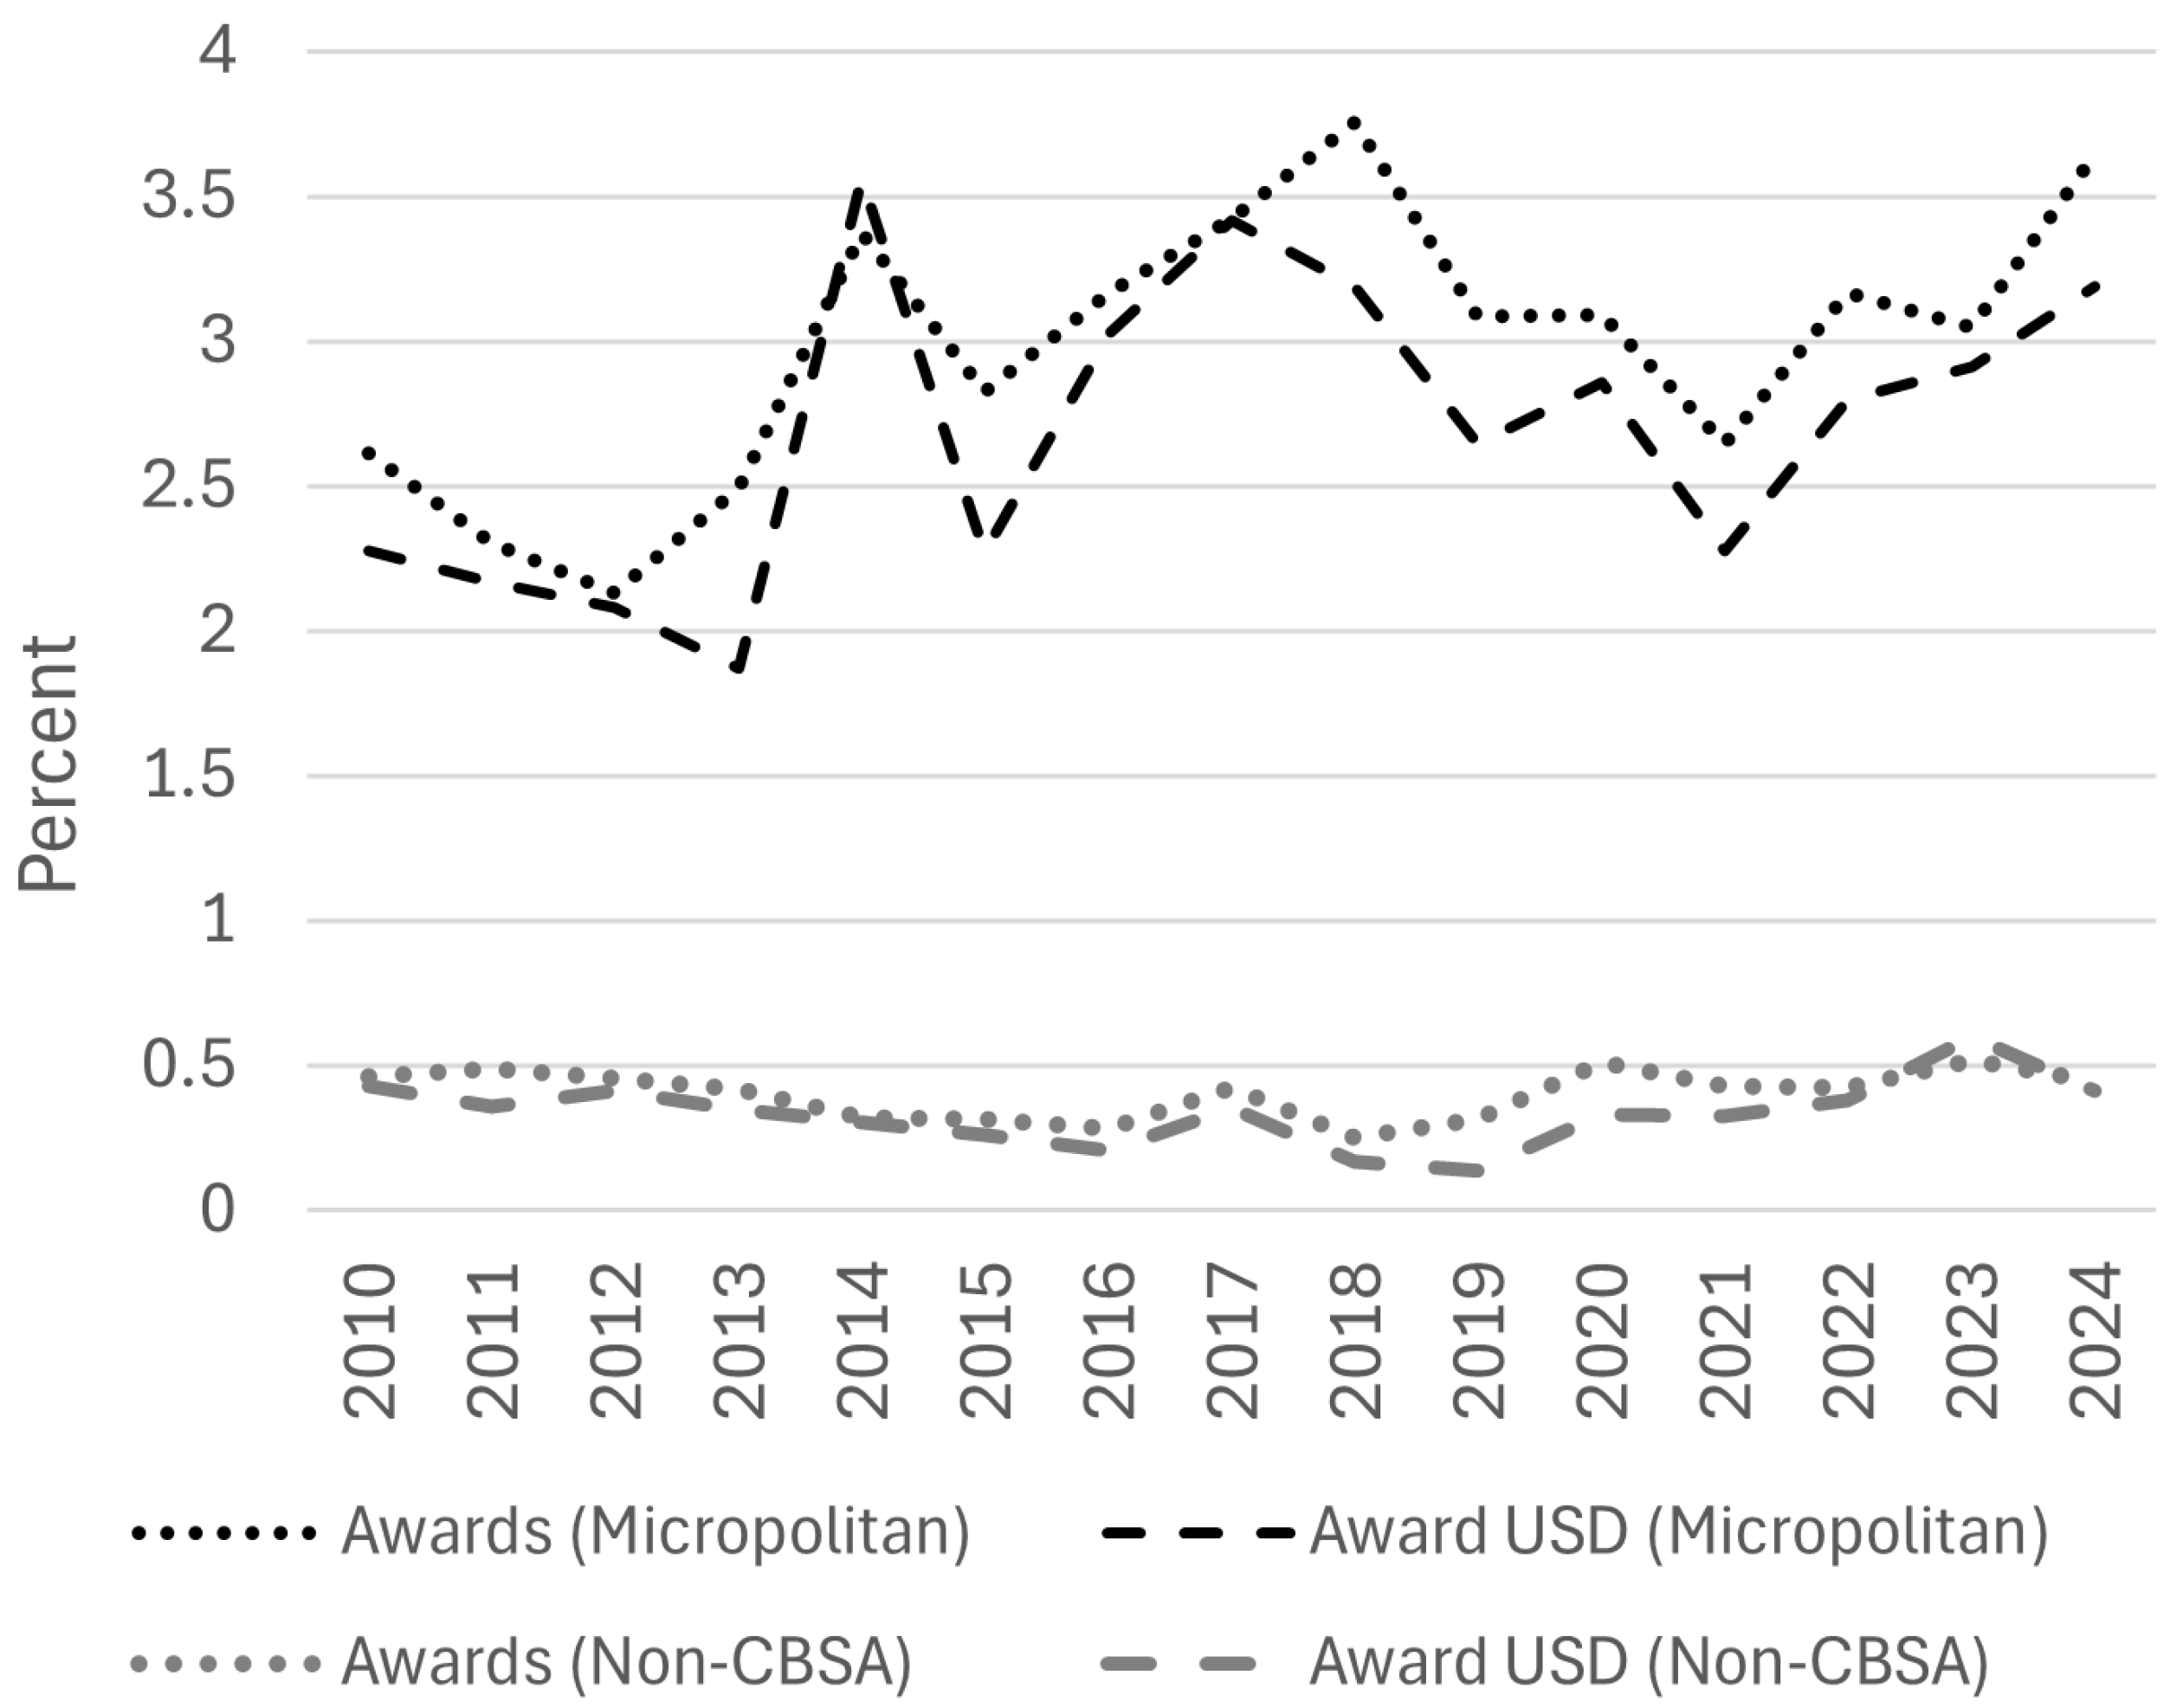
4.1. Number and Spatial Concentration of SBIR/STTR Awards

Between 2010 and 2024, the SBIR/STTR award program initially experienced a moderate contraction in the years following the Great Recession (~2010–2013), generally expanded during the latter half of the 2010s, then plateaued or declined slightly between 2020 and 2024 (Figure 2). Overall, while the number of firms and total funding in 2024 inflation-adjusted dollars (~USD 4 billion) remained about the same over the 15-year study period, the average number of annual awards declined by 12 percent.
The proportion of awarded firms, SBIR/STTR awards, and total dollars awarded (inflation adjusted to 2024) located within the top 10 CBSAs (assessed individually for each year of the study) was fairly consistent over the study period, averaging 46 percent for firms, 44 percent for awards, and 42 percent for award funding (Figure 3). Notably, however, the proportion of awards and award amount was significantly (p < 0.05) lower than average in 2022. Similar patterns were observed when examining the top five and top three CBSAs, which represented about a third and a quarter, respectively, of all SBIR/STTR awards, firms, and funding. Across all 15 years, Boston remained the top CBSA in terms of award funding, while Washington, D.C., Los Angeles, San Francisco, and San Diego were most consistently among the top five.
The significant drop in the proportion of SBIR/STTR awards and award funding within the top CBSAs from 2020–2021 to 2022 suggests some degree of award deconcentration during the second and third year of the COVID-19 pandemic. An examination of awards within micropolitan CBSAs indicates a modest rise in the proportion of awards and award funding within these smaller urban areas from about 2.5 percent in 2010 to nearly 3.5 percent in 2024 (Figure 4). Micropolitan areas, however, also experienced a slight proportional decline in awards and award funding during the initial COVID-19 years (2020–2021), and a 1 percent increase would not be sufficient to explain the 3+ percent decline observed among the top 10 CBSAs (Figure 3). Areas entirely outside CBSAs—comprised primarily of small towns and rural spaces—only accounted for about half of one percent of all awards and award funding over the study period (Figure 4). The proportional shift in awards and funding in 2022 was therefore going to other Metropolitan Statistical Areas outside of the top 10 CBSAs.
While the proportion of SBIR/STTR awards within the top 10 CBSAs was similar at the beginning and end of the study period, the percentage of awarded firms, SBIR/STTR awards, and award amount within the predominately suburban “CBSA periphery” (i.e., areas within CBSAs but outside the largest core cities) declined significantly (α = 0.05) between 2010 and 2024 (Figure 5). In fact, during the last five years of the study period, 2020 to 2024, all three quantities were significantly lower relative to the first two years. The increase in the proportion of awards, awarded firms, and award dollars within CBSA core cities was similarly significant, rising from about 32 to 37 percent of the total over the study period. No significant reversal of this trend was observed for the COVID-19 years 2020 through 2024.

4.2. Firm Location, Neighborhood Walkability, and Transit Accessibility

Further examination of the intra-urban location of awarded firms indicates that they are, on average, located significantly closer to the nearest CBSA core city center (i.e., city hall) in 2024 compared to 2010 (Figure 6A). They are also located in census block groups with significantly higher “activity density” (i.e., combined housing and employment density) at the end of the study period relative to the beginning (Figure 6B). The mean NWI score for awarded firms grew modestly but significantly from 12.35 to 12.7 (maximum 20; 1.7 percent increase), while the mean Walk Score® increased by a wider margin from 45.3 to 49.7 (maximum 100; 4.4 percent increase) (Figure 6C,D). Congruent with these findings, awarded firms were also located in census block groups with higher mean transit service per square mile at the end of the study period (Figure 6E). While not decreasing significantly over the entire study period, the distance from awarded firms to the nearest fixed rail station did decline significantly from an average of 6.9 km to 6 km between 2010 and 2013 before rising slightly over the next decade to 6.2 km in 2024 (Figure 6F).
Taken together, the results suggest that firms awarded SBIR/STTR grants were more likely to be located closer to the urban center and in neighborhoods with higher walkability (though still classified as “auto-dependent”, on average) and transit service at the end of the study period relative to the beginning. Yet, during the COVID-19 pandemic, and from 2020 onward, many of these trends appear to have ended or potentially reversed (Figure 6). The minimum average distance from awarded firms to the nearest city center, for example, was reached in 2019, while the activity density of encompassing census block groups peaked in 2020. Additionally, both walkability indexes and mean transit service plateaued or declined (non-significantly) from 2019 or 2020 through 2024, and the mean distance to the nearest fixed rail station began to rise, though by a non-significant amount, from 2020 onward.

4.3. Regression Analysis: Controlling for Confounding Locational Attributes

A regression analysis was performed to test whether the observed significant increases in walkability and transit service frequency (Figure 6C–E) in the vicinity of SBIR/STTR awarded firms may have been due to changes in proximity to the city center or other locational factors/amenities. Three ordinary least squares (OLS) regression models were developed with the NWI, Walk Score®, and frequency of transit service per square mile as dependent variables regressed against other locational and firm attributes (Table 1). To control for change over time, the 15 years of the study were divided into three 5-year periods, each re-coded into binary dummy variables: (1) post-recession years 2010–2014, (2) pre-COVID-19 years 2015–2019, and (3) COVID-19 years 2020–2024. It was necessary to omit the first 5-year period (2010–2014) from the models to serve as a reference category against which the latter two time periods are compared. Distance to city center, gross activity density, and transit service frequency were natural log transformed to improve normality. Distance to the nearest rail station, R1 university (i.e., universities classified by the Carnegie Foundation as having the highest level of research spending and doctoral student production), and interstate highway were treated as binary variables, with each awarded firm classified as adjacent to these amenities if located within one kilometer. Binary adjacency variables were used in place of raw distance measures, as the latter would require limiting the sample of firms to only those located within CBSAs featuring all three amenities. Differences among awarded firms were represented using two binary variables that indicate whether the firm has been awarded at least one Phase II or STTR award. The collinearity of all models was acceptably low (CI < 30, VIF < 3).
While awarded firms in this study are located across a range of metropolitan areas, the analysis is focused on temporal changes in firm-level locational attributes rather than cross-sectional comparisons between metropolitan regions. To partially account for unobserved heterogeneity across metropolitan areas, key locational covariates were included in the regression models. Nonetheless, future research could explore metropolitan-level influences more explicitly by incorporating fixed effects or hierarchical modeling to better assess the potential influence of different public policies, planning regimes, and urban morphologies on the geography of innovation.
Each of the three regression models were statistically significant (p < 0.05), with the independent variables accounting for 54 to 72 percent of the variance in the dependent variables (Table 1). The results of the first regression model, with NWI as the dependent variable, indicate a significant positive association between the walkability index and firms with at least one Phase II award, gross activity density, Walk Score®, and proximity (≤1 km) to an interstate highway. Significant negative associations were observed between NWI and distance from the city center (indicating higher walkability values closer to the city center), and proximity (≤1 km) to a fixed rail station and R1 university. Neither pre-COVID-19 years (2015–2019) nor COVID-19 years (2020–2024) were significant in the model relative to the earlier post-recession years (2010–2014).
The significant negative association observed between the NWI and proximity to a fixed rail station was unexpected. The index gives equal weight to all transit stops, however, which are overwhelmingly buses rather than rail or other forms of transit. When also controlling for locational factors such as gross activity density and distance from the city center, this may result in higher NWI scores among block groups with fewer rail stations but more transit stops in total. When omitting the activity density variable from the model, proximity to rail station is significant and positively associated with the NWI, as expected.
The use of the alternative walkability measure, Walk Score®, as the dependent variable in the second model, resulted in several notable differences. Firstly, whether or not firms have a Phase II award was no longer a significant predictor of walkability, while the presence of at least one STTR award was significantly associated with lower walk scores (Table 1). Additionally, proximity to rail station, R1 university, and interstate highway were, as with the NWI, significant predictors of walkability around awarded firms; however, the relationships are now reversed: the mean walk score of awarded firms is positively associated with proximity to rail stations and R1 universities and negatively related to proximity to interstate highways. Among the two time variables, the COVID-19 years 2020–2024 are now positive and significant in the model, indicating that awarded firms, on average, were associated with higher walk scores in 2020–2024 relative to 2010–2014.
The modeling results for transit service frequency were similar to those observed for Walk Score® with three exceptions (Table 1). Firstly, the Phase II award is significant and negative in the model, suggesting that firms with Phase II awards were, on average, more likely to be located in census block groups with lower transit service frequency when controlling for other variables. This is not the case for firms with STTR awards, however, as this variable is no longer statistically significant. Lastly, both time variables, representing the years 2015–2019 and 2020–2024, are statistically significant and positive when compared to the post-recession 2010–2014 time period.

5. Discussion

The results of this study suggest that the geography of innovation among small- and mid-sized firms in the U.S. is indeed evolving. While there does not appear to be strong diffusion at the regional or metropolitan level, micropolitan areas did experience modest gains in the number of SBIR/STTR awards and award funding over the 15-year study period. The proportion of awards and award funding allocated to the top ten metropolitan areas also declined significantly in 2022, the second full year of the pandemic. Much of the proportional gains in awards and award funding during this time, however, appear to have gone primarily to other metropolitan areas rather than smaller micropolitan areas or rural counties. Any effect appears to have been short lived, with values near 15-year averages by 2023. While analyses of population and employment migration during COVID-19 also suggest some shift away from large cities and metropolitan areas due to the expansion of remote work opportunities and other factors [64,65,66], these impacts are not uniform and may already be reversing [55,67].
At the intra-urban level, several temporal trends in location and locational attributes over the study period point to a landscape of innovation that is, overall, becoming increasingly centralized (within metropolitan core cities), denser, more walkable, and potentially more transit accessible. Amid an overall trend toward suburbanization since the Second World War, the outward expansion of urban development in the United States appears to have slowed during the first decades of the 21st century [68], with knowledge-intensive service industries having “remained relatively centralized and concentrated” [69]. While our observations here suggest that the innovation activity of small- and mid-sized (<500 employees) firms is trending toward denser, more central, and walkable areas over time, it is worth noting that the average distance of awarded firms—about 16.5 km (10.2 miles) from the nearest city center—suggests that many firms are still located predominately in suburban areas. This is reinforced by relatively modest average NWI and walk score values, the latter of which averaged just 48 out of 100, a score that Walk Score® describes as low walkability or “car dependent.” While Hamidi and Zandiatashbar [22] did find significant positive associations between the number of SBIR/STTR awarded firms per census tract and both Walk Score® and transit service frequency, they also noted that their compactness index (composed of multiple variables including population and employment density) was negative and statistically significant in their regression model. The authors suggest that small, innovative firms, despite exhibiting a strong affinity for co-locating with other innovative firms, may avoid more compact/dense areas due to prohibitively high land and property values. Growing demand for rail station access and the construction of new rail lines has also contributed to rising land values, potentially displacing small businesses and discouraging new enterprises from forming in close proximity [70,71]. This may provide one explanation as to why distance between awarded firms and the nearest rail station did not continue to decline after 2013. Bereitschaft [31] similarly observed positive associations between SBIR/STTR award density and Walk Score®, Transit Score®, and land use diversity but also found that award density was positively related to distance from the city center within the Washington, D.C., metropolitan area. The author noted that innovation awards were particularly clustered within both the urban core and suburban businesses districts or “edge cities” [28] in a polycentric fashion. Recent work on edge cities suggest that most still exhibit a predominately auto-dependent character with office employment densities about half that of traditional downtowns [72,73].
The COVID-19 pandemic may have impacted the temporal trend observed here of innovative firms favoring more centralized, denser, and walkable neighborhoods over time. Indeed, these trends appear to have either plateaued or begun to reverse (to a non-significant degree) by the early 2020s, suggesting that (1) there was some relocation among innovative firms that in aggregate favored more suburban locations and/or (2) firms in more suburban locations were more successful at competing for SBIR/STTR awards during the pandemic. It is recommended that future work map the movements of individual firms over time, similar to Motoyama’s [50] case study of Columbus, OH, to evaluate these scenarios. If innovative firms are in fact relocating away from urban centers or walkable neighborhoods, this is likely to have a longer-term impact on the geography of innovation in the post-pandemic period. Advanced telecommunications technologies coupled with digital collaboration platforms that enable open innovation among geographically dispersed employees and firms may further reduce the need for co-location [14]. Suburban and rural areas may be expected to benefit economically—potentially at the expense of central cities—if such trends continue. The design of innovation districts and other development aimed at incubating, attracting, and growing local innovative ecosystems may also need to be re-evaluated according to the evolving preferences and needs of innovative firms. Data on innovation productivity and firm preferences in the coming years will be vital to gauging the longer-term impacts of the pandemic and formulating policy prescriptions.
At the time of this paper’s writing in mid-2025, the geography of innovation in the U.S. may be experiencing yet another significant period of disruption owing to shifting federal policies and widespread reductions in government grants and other funding for scientific and technological research and development [74,75]. Currently, the 2026 federal budget plan would reduce the budgets of the National Institutes of Health (NIH) by more than a third and the National Science Foundation (NSF) by more than half [76]. The Department of Energy (DOE), National Aeronautics and Space Administration (NASA), National Oceanic and Atmospheric Administration (NOAA), U.S. Geological Survey, and the U.S. Department of Agriculture (USDA) would also experience significant cuts. Each of these federal agencies participate in the SBIR/STTR award program as well as other crucial R&D pipelines. These cuts will almost certainly reduce the innovative potential of small firms, undermining product development, capital investment, revenue, and economic growth across a number of industries [77]. A recent report by the Small Business Technology Council (SBTC) suggests that SBIR Phase II awards have provided a return on investment of USD 22–33 for every dollar spent, depending on the agency [78]. Federal grants awarded to institutions of higher education may also now be subject to a 15 percent indirect cost cap, significantly reducing support for facilities and administration (F&A) costs that typically comprise 25–33 percent of total direct expenditures [79,80]. If it continues, this policy is likely to have a severe impact on research universities and surrounding communities, particularly institutions in larger cities and dense urban areas, where F&A expenses tend to be higher [75].

6. Conclusions

This study has provided new insights into the evolving geography of innovation in the United States, building on previous analyses of innovation, location, and urban form by tracking changes over time and assessing potential impacts of the COVID-19 pandemic. While large metropolitan regions continue to play a dominant role in innovative activity, the share of SBIR/STTR awards allocated to the top-performing metros showed signs of a modest decline during the pandemic. These changes were not uniform or sustained, however, and innovation remains largely concentrated within select metropolitan areas, albeit with increasing diversity in firm location patterns. Intra-urban trends reveal a gradual shift toward more centralized, walkable, and transit-accessible locations, though many awarded firms also remain situated in auto-dependent, suburban environments. This likely reflects the persistent tension between the benefits of agglomeration and desire to promote innovative brand identities and the constraints of affordability, space, and land use in dense urban cores. The onset of the COVID-19 pandemic, coupled with remote work and recent cuts to federal R&D funding, may be reshaping the spatial landscape of innovation in significant ways. Our analysis, for example, suggests that the pandemic may have paused or even reversed some of the trends observed over the previous decade, including the tendency of innovative firms to locate closer to the city center and in denser and more walkable areas. To what degree these changes were a direct response to COVID-19 (e.g., declining desirability of dense urban places, adoption of remote work, etc.) rather than public policy or economic forces remain a subject for future work. As urban planners and policymakers continue to invest in innovation districts and mixed-use redevelopment, it is worthwhile to consider whether such strategies remain aligned with the evolving preferences and needs of innovative firms. Additional research is needed to explore firm-level mobility over time, as well as additional indicators of innovation (e.g., patents, venture capital financing, and total R&D expenditures), to better capture the multifaceted impacts of recent technological, political, and social transformations on the geography of innovation.

Funding

This research received no external funding.

Data Availability Statement

Datasets available on request from the authors.

Conflicts of Interest

The authors declare no conflict of interest.

References

  1. Florida, R.; Mellander, C. Rise of the Startup City: The Changing Geography of the Venture Capital Financed Innovation. Calif. Manag. Rev. 2017, 59, 14–38. [Google Scholar] [CrossRef]
  2. Adler, P.; Florida, R.; King, K.; Mellander, C. The city and high-tech startups: The spatial organization of Schumpeterian entrepreneurship. Cities 2019, 87, 121–130. [Google Scholar] [CrossRef]
  3. Balland, P.-A.; Jara-Figueroa, C.; Petralia, S.; Steijn, M.; Rigby, D.; Hidalgo, C.A. Complex economic activities concentrate in large cities. Nat. Hum. Behav. 2020, 4, 248–254. [Google Scholar] [CrossRef] [PubMed]
  4. Spencer, G.M. Knowledge neighbourhoods: Urban form and evolutionary economic geography. Reg. Stud. 2015, 49, 883–898. [Google Scholar] [CrossRef]
  5. Esmaeilpoorarabi, N.; Yigitcanlar, T.; Guaralda, M.; Kamruzzaman, M. Does place quality matter for innovation districts? Determining the essential place characteristics from Brisbane’s knowledge precincts. Land Use Policy 2018, 79, 734–747. [Google Scholar] [CrossRef]
  6. Bereitschaft, B. Are walkable places tech incubators? Evidence from Nebraska’s ‘Silicon Prairie’. Reg. Stud. Reg. Sci. 2019, 6, 339–356. [Google Scholar] [CrossRef]
  7. Yigitcanlar, T.; Abu-McVie, R.; Erol, I. How can contemporary innovation districts be classified? A systematic review of the literature. Land Use Policy 2020, 95, 104595. [Google Scholar] [CrossRef]
  8. Fritsch, M.; Wyrwich, M. Is innovation (increasingly) concentrated in large cities? An international comparison. Res. Policy 2021, 50, 104237. [Google Scholar] [CrossRef]
  9. Huggins, R.; Thompson, P. Cities, innovation and entrepreneurial ecosystems: Assessing the impact of the COVID-19 pandemic. Camb. J. Reg. Econ. Soc. 2022, 15, 635–661. [Google Scholar] [CrossRef]
  10. Mozaffarian, L.; Zandiatashbar, A.; Reyes-Sanchez, A. How Remote Working and Placelessness Affect Future Planning for Innovation Districts: A Systematic Review of the Literature. J. Plan. Lit. 2024, 40, 218–234. [Google Scholar] [CrossRef]
  11. Curran, D.; Lynn, T.; O’Gorman, C. The role of personal factors in the location decision of software services start-up firms. Eur. Plan. Stud. 2016, 24, 551–567. [Google Scholar] [CrossRef]
  12. Bryan, K.A.; Guzman, J. Entrepreneurial migration. Rev. Econ. Stat. 2023, 1–45. [Google Scholar] [CrossRef]
  13. Felzensztein, C.; Tretiakov, A. Technology adaptation: Micro new ventures in a COVID-19 lockdown. Int. J. Entrep. Behav. Res. 2023, 29, 1007–1026. [Google Scholar] [CrossRef]
  14. Battistella, C.; Nonino, F. Open innovation web-based platforms: The impact of different forms of motivation on collaboration. Innovation 2012, 14, 557–575. [Google Scholar] [CrossRef]
  15. Florida, R.; King, K. Rise of the Urban Startup Neighborhood: Micro-Clusters of Venture Capital and Startup Activity at the Neighborhood Level. Martin Prosperity Institute Working Paper Series, June 2016. Available online: https://creativeclass.com/_wp/wp-content/uploads/2019/11/2016-MPIWP-003_Rise-of-the-Urban-Startup-Neighborhood_Florida-King.pdf (accessed on 6 April 2025).
  16. Zandiatashbar, A.; Hamidi, S.; Foster, N.; Park, K. The missing link between place and productivity? The impact of transit-oriented development on knowledge and creative economy. J. Plan. Educ. Res. 2019, 39, 429–441. [Google Scholar] [CrossRef]
  17. Tang, H.; Zhang, J.; Fan, F.; Zhengwen, W. High-speed rail, urban form, and regional innovation: A time-varying difference-in-differences approach. Technol. Anal. Strateg. Manag. 2022, 36, 195–209. [Google Scholar] [CrossRef]
  18. Pancholi, S.; Yigitcanlar, T.; Guaralda, M. Place making for innovation and knowledge-intensive activities: The Australian experience. Technol. Forecast. Soc. Chang. 2019, 146, 616–625. [Google Scholar] [CrossRef]
  19. Yigitcanlar, T.; Pancholi, S.; Esmaeilpoorarabi, N.; Adu-McVie, R. Innovation District Planning: Concept, Framework, Practice; CRC Press: Boca Raton, FL, USA, 2024. [Google Scholar]
  20. Denham, T. The limits of telecommuting: Policy challenges of counterurbanisation as a pandemic response. Geogr. Res. 2021, 59, 514–521. [Google Scholar] [CrossRef]
  21. Lim, J.; Kang, E.; Lim, H.; Jung Won, S. Rise of work from home & post-pandemic urban form in global cities. J. Korea Plan. Assoc. 2023, 58, 5–26. [Google Scholar] [CrossRef]
  22. Hamidi, S.; Zandiatashbar, A. Does urban form matter for innovation productivity? A national multi-level study of the association between neighbourhood innovation and urban sprawl. Urban Stud. 2019, 56, 1576–1594. [Google Scholar] [CrossRef]
  23. Ewing, R.; Hamidi, S. Measuring Urban Sprawl and Validating Sprawl Measures; National Institutes of Health; Smart Growth America: Washington, DC, USA, 2014.
  24. Kotkin, J. The New Geography: How the Digital Revolution Is Reshaping the American Landscape; Random House: New York, NY, USA, 2001. [Google Scholar]
  25. Lindelöf, P.; Löfsten, H. Proximity as a Resource Base for Competitive Advantage: University–Industry Links for Technology Transfer. J. Technol. Transf. 2004, 29, 311–326. [Google Scholar] [CrossRef]
  26. Montoro-Sánchez, A.; Ortiz-de-Urbina-Criado, M.; Mora-Valentín, E.M. Effects of knowledge spillovers on innovation and collaboration in science and technology parks. J. Knowl. Manag. 2011, 15, 948–970. [Google Scholar] [CrossRef]
  27. Helmers, C. Choose the neighbor before the house: Agglomeration externalities in a UK science park. J. Econ. Geogr. 2019, 19, 31–55. [Google Scholar] [CrossRef]
  28. Garreau, J. Edge City: Life on the New Frontier; Doubleday: New York, NY, USA, 1991. [Google Scholar]
  29. Serrano, V.R.D. The intrametropolitan geography of knowledge-intensive business services (KIBS): A comparative analysis of six European and U.S. city-regions. Econ. Dev. Q. 2019, 33, 279–295. [Google Scholar] [CrossRef]
  30. Di Giacinto, V.; Micucci, G.; Tosoni, A. The agglomeration of knowledge-intensive business services firms. Ann. Reg. Sci. 2020, 65, 557–590. [Google Scholar] [CrossRef]
  31. Bereitschaft, B. Exploring the spatial intersection of small firm innovation, urban form, and demographics in the Washington, DC, metropolitan area. Prof. Geogr. 2023, 75, 1006–1023. [Google Scholar] [CrossRef]
  32. Glaeser, E.L. Learning in cities. J. Urban Econ. 1999, 46, 254–277. [Google Scholar] [CrossRef]
  33. Homan, S. Liveability and creativity. City Cult. Soc. 2014, 5, 149–155. [Google Scholar] [CrossRef]
  34. Oldenburg, R. The Great Good Place: Cafes, Coffee Shops, Bookstores, Bars, Hair Salons, and Other Hangouts at the Heart of a Community, 3rd ed.; Marlowe: Washington, DC, USA, 1999. [Google Scholar]
  35. Rantisi, N.M.; Leslie, D. Materiality and creative production: The case of the Mile End neighborhood in Montréal. Environ. Plan. A 2010, 42, 2824–2841. [Google Scholar] [CrossRef]
  36. Soares, I.; Weitkamp, G.; Yamu, C. Public spaces as knowledgescapes: Understanding the relationship between the built environment and creative encounters at Dutch university campuses and science parks. Int. J. Environ. Res. Public Health 2020, 17, 7421. [Google Scholar] [CrossRef]
  37. Coll-Martínez, E.; Méndez-Ortega, C. Agglomeration and coagglomeration of co-working spaces and creative industries in the city. Eur. Plan. Stud. 2023, 31, 445–466. [Google Scholar] [CrossRef]
  38. Madaleno, M.; Nathan, M.; Overman, H.; Waughts, S. Incubators, accelerators and urban economic development. Urban Stud. 2022, 59, 281–300. [Google Scholar] [CrossRef]
  39. Battistella, C.; Biotto, G.; De Toni, A.F. From design driven innovation to meaning strategy. Manag. Decis. 2012, 50, 718–743. [Google Scholar] [CrossRef]
  40. Verganti, R. Design as Brokering of Languages: Innovation Strategies in Italian Firms. Des. Manag. J. 2003, 14, 34–42. [Google Scholar] [CrossRef]
  41. Verganti, R. Design, Meanings, and Radical Innovation: A Metamodel and a Research Agenda. J. Prod. Innov. Manag. 2008, 25, 436–456. [Google Scholar] [CrossRef]
  42. Zukin, S. Seeing like a city: How tech became urban. Theory Soc. 2020, 49, 941–964. [Google Scholar] [CrossRef] [PubMed]
  43. Kayanan, C.M. A critique of innovation districts: Entrepreneurial living and the burden of shouldering urban development. Environ. Plan. A Econ. Space 2022, 54, 50–66. [Google Scholar] [CrossRef]
  44. Pratt, A.C. Urban Regeneration: From the Arts `Feel Good’ Factor to the Cultural Economy: A Case Study of Hoxton, London. Urban Stud. 2009, 46, 1041–1061. [Google Scholar] [CrossRef]
  45. Zukin, S. The Innovation Complex: Cities, Tech, and the New Economy; Oxford University Press: New York, NY, USA, 2020. [Google Scholar]
  46. Fang, L.; Rao, F. When industry diversity meets walkability: An analysis of innovation in Baltimore, United States, and Melbourne, Australia. J. Plan. Educ. Res. 2021, 44, 958–969. [Google Scholar] [CrossRef]
  47. Malizia, E.; Motoyoma, Y. Vibrant centers as locations for high-growth firms: An analysis of thirty U.S. metropolitan areas. Prof. Geogr. 2019, 71, 15–28. [Google Scholar] [CrossRef]
  48. Morisson, A. A Framework for Defining Innovation Districts: Case Study from 22@ Barcelona. In Urban and Transit Planning. Advances in Science, Technology & Innovation; Bougdah, H., Versaci, A., Sotoca, A., Trapani, F., Migliore, M., Clark, N., Eds.; Springer: Cham, Switzerland, 2020. [Google Scholar] [CrossRef]
  49. Makkonen, T.; Mitze, T. The geography of innovation in times of crisis: A comparison of rural and urban RDI patterns during COVID-19. Geogr. Ann. Ser. B Hum. Geogr. 2024, 106, 96–118. [Google Scholar] [CrossRef]
  50. Motoyama, Y. Where do high-growth firms go? GeoJournal 2023, 88, 493–510. [Google Scholar] [CrossRef]
  51. Samani, A.R.; Riahisamani, R.; Mishra, S.; Golias, M.M.; Jung-Hwi Lee, D. Evaluating relocation behavior of establishments: Evidence for the short-term effects of COVID-19. Environ. Plan. B Urban Anal. City Sci. 2024, 51, 2012–2030. [Google Scholar] [CrossRef]
  52. Fazio, C.E.; Guzman, J.; Liu, Y.; Stern, S. How Is COVID Changing the Geography of Entrepreneurship? Evidence from the Startup Cartography Project; National Bureau of Economic Research Working Paper 2021, No. 28787; National Bureau of Economic Research: Cambridge, MA, USA, 2021. [Google Scholar]
  53. Rosenthal, S.S.; Strange, W.C.; Urrego, J.A. JUE insight: Are city centers losing their appeal? Commercial real estate, urban spatial structure, and COVID-19. J. Urban Econ. 2022, 127, 103381. [Google Scholar] [CrossRef]
  54. Florida, R.; Rodríguez-Pose, A.; Storper, M. Critical commentary: Cities in a post-COVID world. Urban Stud. 2023, 60, 1509–1531. [Google Scholar] [CrossRef] [PubMed]
  55. Kotsubo, M.; Nakaya, T. Urban exodus or suburbanization? Medium-term COVID-19 pandemic impacts on internal migration in Japan. GeoJournal 2024, 89, 149. Available online: https://link.springer.com/article/10.1007/s10708-024-11162-y (accessed on 1 June 2025).
  56. Bereitschaft, B. The declining impact of walkability and transit accessibility on U.S. home values during the COVID-19 pandemic. J. Hous. Res. 2025. [Google Scholar] [CrossRef]
  57. SBIR.gov. Participating Federal Agencies. Small Business Innovation (SBIR) and Small Business Technology Transfer (STTR). U.S. Small Business Administration, Washington, D.C. Available online: https://www.sbir.gov/participating-agencies (accessed on 1 June 2025).
  58. NIH. Small Business Innovation Research Grants (SBIR)—Phase I (R43). National Institutes of Health: Bathesda, MD, USA. Available online: https://grants.nih.gov/funding/activity-codes/R43 (accessed on 1 June 2025).
  59. Rosenbloom, J.L. The geography of innovation commercialization in the United States during the 1990s. Econ. Dev. Q. 2007, 21, 3–16. [Google Scholar] [CrossRef]
  60. Onken, J.; Aragon, R.; Calcagno, A.M. Geographically-related outcomes of U.S. funding for small business research and development: Results of the research grant programs of a component of the National Institutes of Health. Eval. Program Plan. 2019, 77, 101696. [Google Scholar] [CrossRef]
  61. Chapman, J.; Fox, E.H.; Bachman, W.; Frank, L.D.; Thomas, J.; Reyes, A.R. Smart Location Database Technical Documentation and User Guide. Version 3.0; United States Environmental Protection Agency (EPA): Washington, DC, USA, 2021. Available online: https://www.epa.gov/system/files/documents/2023-10/epa_sld_3.0_technicaldocumentationuserguide_may2021_0.pdf (accessed on 20 April 2025).
  62. Thomas, J.; Reyes, R. National Walkability Index Methodology and User Guide; United States Environmental Protection Agency (EPA): Washington, DC, USA, 2021. Available online: https://www.epa.gov/sites/default/files/2021-06/documents/national_walkability_index_methodology_and_user_guide_june2021.pdf (accessed on 30 April 2025).
  63. Walk Score®. Walk Score Methodology. 2025. Available online: https://www.walkscore.com/methodology.shtml (accessed on 1 June 2025).
  64. Nelson, P.B.; Frost, W. Migration responses to the COVID-19 pandemic: A case study of New England showing movements down the urban hierarchy and ensuing impact on real estate markets. Prof. Geogr. 2022, 75, 415–429. [Google Scholar] [CrossRef]
  65. Zhao, P.; Gao, Y. Discovering the long-term effects of COVID-19 on jobs-housing relocation. Humanit. Soc. Sci. Commun. 2023, 10, 633. [Google Scholar] [CrossRef]
  66. Ilham, M.A.; Fonzone, A.; Fountas, G.; Mora, L. To move or not to move: A review of residential relocation trends after COVID-19. Cities 2024, 151, 105078. [Google Scholar] [CrossRef]
  67. Kane, K. How have American migration patterns changed in the COVID era? Growth Chang. 2024, 55, e12742. [Google Scholar] [CrossRef]
  68. Richter, S.M. Revisiting urban expansion in the continental United States. Landsc. Urban Plan. 2020, 204, 103911. [Google Scholar] [CrossRef]
  69. Heider, B.; Siedentop, S. Employment suburbanization in the 21st century: A comparison of German and US city regions. Cities 2020, 104, 102802. [Google Scholar] [CrossRef]
  70. Ray, R. Open for business? Effects of Los Angeles metro rail construction on adjacent businesses. J. Transp. Land Use 2017, 10, 725–742. [Google Scholar] [CrossRef]
  71. Iseki, H.; Jones, R.P. Analysis of firm location and relocation in relation to Maryland and Washington, DC metro rail stations. Res. Transp. Econ. 2018, 67, 29–43. [Google Scholar] [CrossRef]
  72. Day, J.P.; Veeroja, P.; Yang, X. From edge city to city? Planning intentions for edge cities. J. Am. Plan. Assoc. 2022, 88, 565–577. [Google Scholar] [CrossRef]
  73. Bereitschaft, B. No longer just work and play? Exploring recent residential growth within America’s “edge cities”. GeoJournal 2024, 89, 230. [Google Scholar] [CrossRef]
  74. Bhatia, A.; Cabreros, I.; Elkeurti, A.; Singer, E. Trump Has Cut Science Funding to Its Lowest Level in Decades. The New York Times. 22 May 2025. Available online: https://www.nytimes.com/interactive/2025/05/22/upshot/nsf-grants-trump-cuts.html (accessed on 1 June 2025).
  75. Drollette, D., Jr. The impact of DOGE’s funding cuts on biomedical research, from the point of view of former NIH director Monica Bertagnolli. Bull. At. Sci. 2025, 81, 202–207. [Google Scholar] [CrossRef]
  76. Science News Staff. Trump Proposes Massive Cuts to Research Spending. Funding for Key Science Agencies Would Be Cut in Half Under 2026 Budget Plan. Science. 8 May 2025. Available online: https://www.science.org/doi/pdf/10.1126/science.ady8072?casa_token=b20YfGOyeGEAAAAA:GE6hHVeiz7tzVmhufelzScSRLPKO81ejVqWspbeBEchAs_PVZ43GrFHNBPAjbgPYxubWIutmg4fNXkw (accessed on 15 May 2025).
  77. Howell, S.T. Financing innovation: Evidence from R&D grants. Am. Econ. Rev. 2017, 107, 1136–1164. [Google Scholar] [CrossRef]
  78. SBTC; SBIR: Small Business Innovating America. Testimony of Jere W. Glover, Executive Director Small Business Technology Council, Before the United States House Small Business Subcommittee on Economic Growth, Tax and Capital Access. Small Business Technology Council, Washington D.C. 16 April 2024. Available online: https://www.congress.gov/118/meeting/house/117064/witnesses/HHRG-118-SM27-Wstate-GloverJ-20240416.pdf (accessed on 1 June 2025).
  79. AAU. Frequently Asked Questions About Facilities and Administrative (F&A) Costs of Federally Sponsored University Research; Association of American Universities: Washington, DC, USA, 2025; Available online: https://www.aau.edu/key-issues/frequently-asked-questions-about-facilities-and-administrative-costs (accessed on 30 May 2025).
  80. NSF. Policy Notice: Implementation of Standard 15% Indirect Cost Rate; U.S. National Science Foundation: Alexandria, VA, USA, 2025. Available online: https://www.nsf.gov/policies/document/indirect-cost-rate (accessed on 10 May 2025).
Figure 1. Conceptual model linking attributes of urban form to local innovation among smaller firms.
Urbansci 09 00296 g001
Figure 2. Number of awarded firms, SBIR/STTR awards, and total dollars awarded (inflation adjusted to 2024) between 2010 and 2024.
Urbansci 09 00296 g002
Figure 3. Percent of awarded firms, SBIR/STTR awards, and total dollars awarded (inflation adjusted to 2024) located within the top 10 CBSAs for each year, 2010–2024.
Urbansci 09 00296 g003
Figure 4. Percent of SBIR/STTR awards and total dollars awarded (inflation adjusted to 2024) located within Micropolitan Statistical Areas and non-CBSA areas.
Urbansci 09 00296 g004
Figure 5. Percent of awarded firms, SBIR/STTR awards, and award dollars located within U.S. CBSAs but outside core cities (i.e., the “CBSA periphery”).
Urbansci 09 00296 g005
Figure 6. Changes in select locational attributes of firms awarded SBIR/STTR grants between 2010 and 2024, including (A) mean distance to the nearest CBSA city center, (B) mean housing and employment density (i.e., “activity density”), (C) mean national walkability index (NWI), (D) mean Walk Score®, (E) mean transit service per square mile, and (F) mean distance to the nearest fixed rail station. Vertical bars represent a 95 percent confidence interval; years that do not share a letter (a–d) in common have statistically (α = 0.05) different values.
Urbansci 09 00296 g006
Table 1. Regression model results.
NWIWalk Score®Transit Service Freq.
N49,38549,38539,479 a
Constant9.123 **−1.225 *0.127 **
Phase II Award (≥1)0.056 *−0.289−0.108 **
STTR Award (≥1)−0.053−0.741 **0.010
Ln Distance City Center−0.420 **−3.388 **−0.329 **
Ln Gross Activity Density0.872 **9.274 **0.495 **
NWI--2.731 **0.073 **
Walk Score0.058 **--0.023 **
≤1 km Rail Station−0.186 **7.933 **0.850 **
≤1 km R1 University−0.138 **4.276 **0.464 **
≤1 km Interstate Highway0.365 **−3.527 **−0.071 **
Pre-COVID-19 Years 2015–20190.0070.2580.084 **
COVID-19 Years 2020–2024−0.0430.831 **0.142 **
Model Adjusted R20.5400.6360.723
* p < 0.05; ** p < 0.01. a The number of firms is less, as it includes only those located within census block groups with transit service.
Disclaimer/Publisher’s Note: The statements, opinions and data contained in all publications are solely those of the individual author(s) and contributor(s) and not of MDPI and/or the editor(s). MDPI and/or the editor(s) disclaim responsibility for any injury to people or property resulting from any ideas, methods, instructions or products referred to in the content.

