1. Introduction
Global urbanization is rapidly accelerating and the projections indicate that 68% of the population will live in urban areas by 2050, up from 55% in 2018 [
1] while European rates are expected to exceed 80% [
2]. Urbanization has reshaped the consumer behavior, driving demand for convenience, speed and proximity in retail and the retail landscape has adapted accordingly through neighborhood stores, urban commercial centers and rapid delivery services [
3]. This evolution was dramatically accelerated during the COVID-19 pandemic when the e-commerce turnover within EU reached €718 billions in 2021 indicating a 13% increase from 2020 [
4] and global projections suggest a continued growth with e-commerce expanding by approximately 51% from 2024 to 2029, particularly in urban centers [
5]. Greece has mirrored these EU trends, experiencing a notable 77% e-commerce growth during the pandemic [
6]. Specifically Thessaloniki, a northern port city, has an important role in the national logistics sector with more than 11% of the total logistics companies being located there [
7]. Building on this, the recent climate neutrality contract published by the Municipality of Thessaloniki reported that about 43% of the vehicles moving in the city are freight [
8], while only the 18% of the total parcels are originated from Thessaloniki [
9].
This increase in last-mile deliveries has created significant urban infrastructure challenges and complex stakeholder trade-offs. On the one hand, logistics companies aim to maximize operational efficiency through optimal routing, strategic distribution centers and increased delivery density; residents demand healthier environments with reduced emissions, minimum noise pollution, enough public space and limited freight traffic [
10] and municipal authorities try to balance these competing interests, while safeguarding revenue streams, urban livability and stakeholder satisfaction [
11].
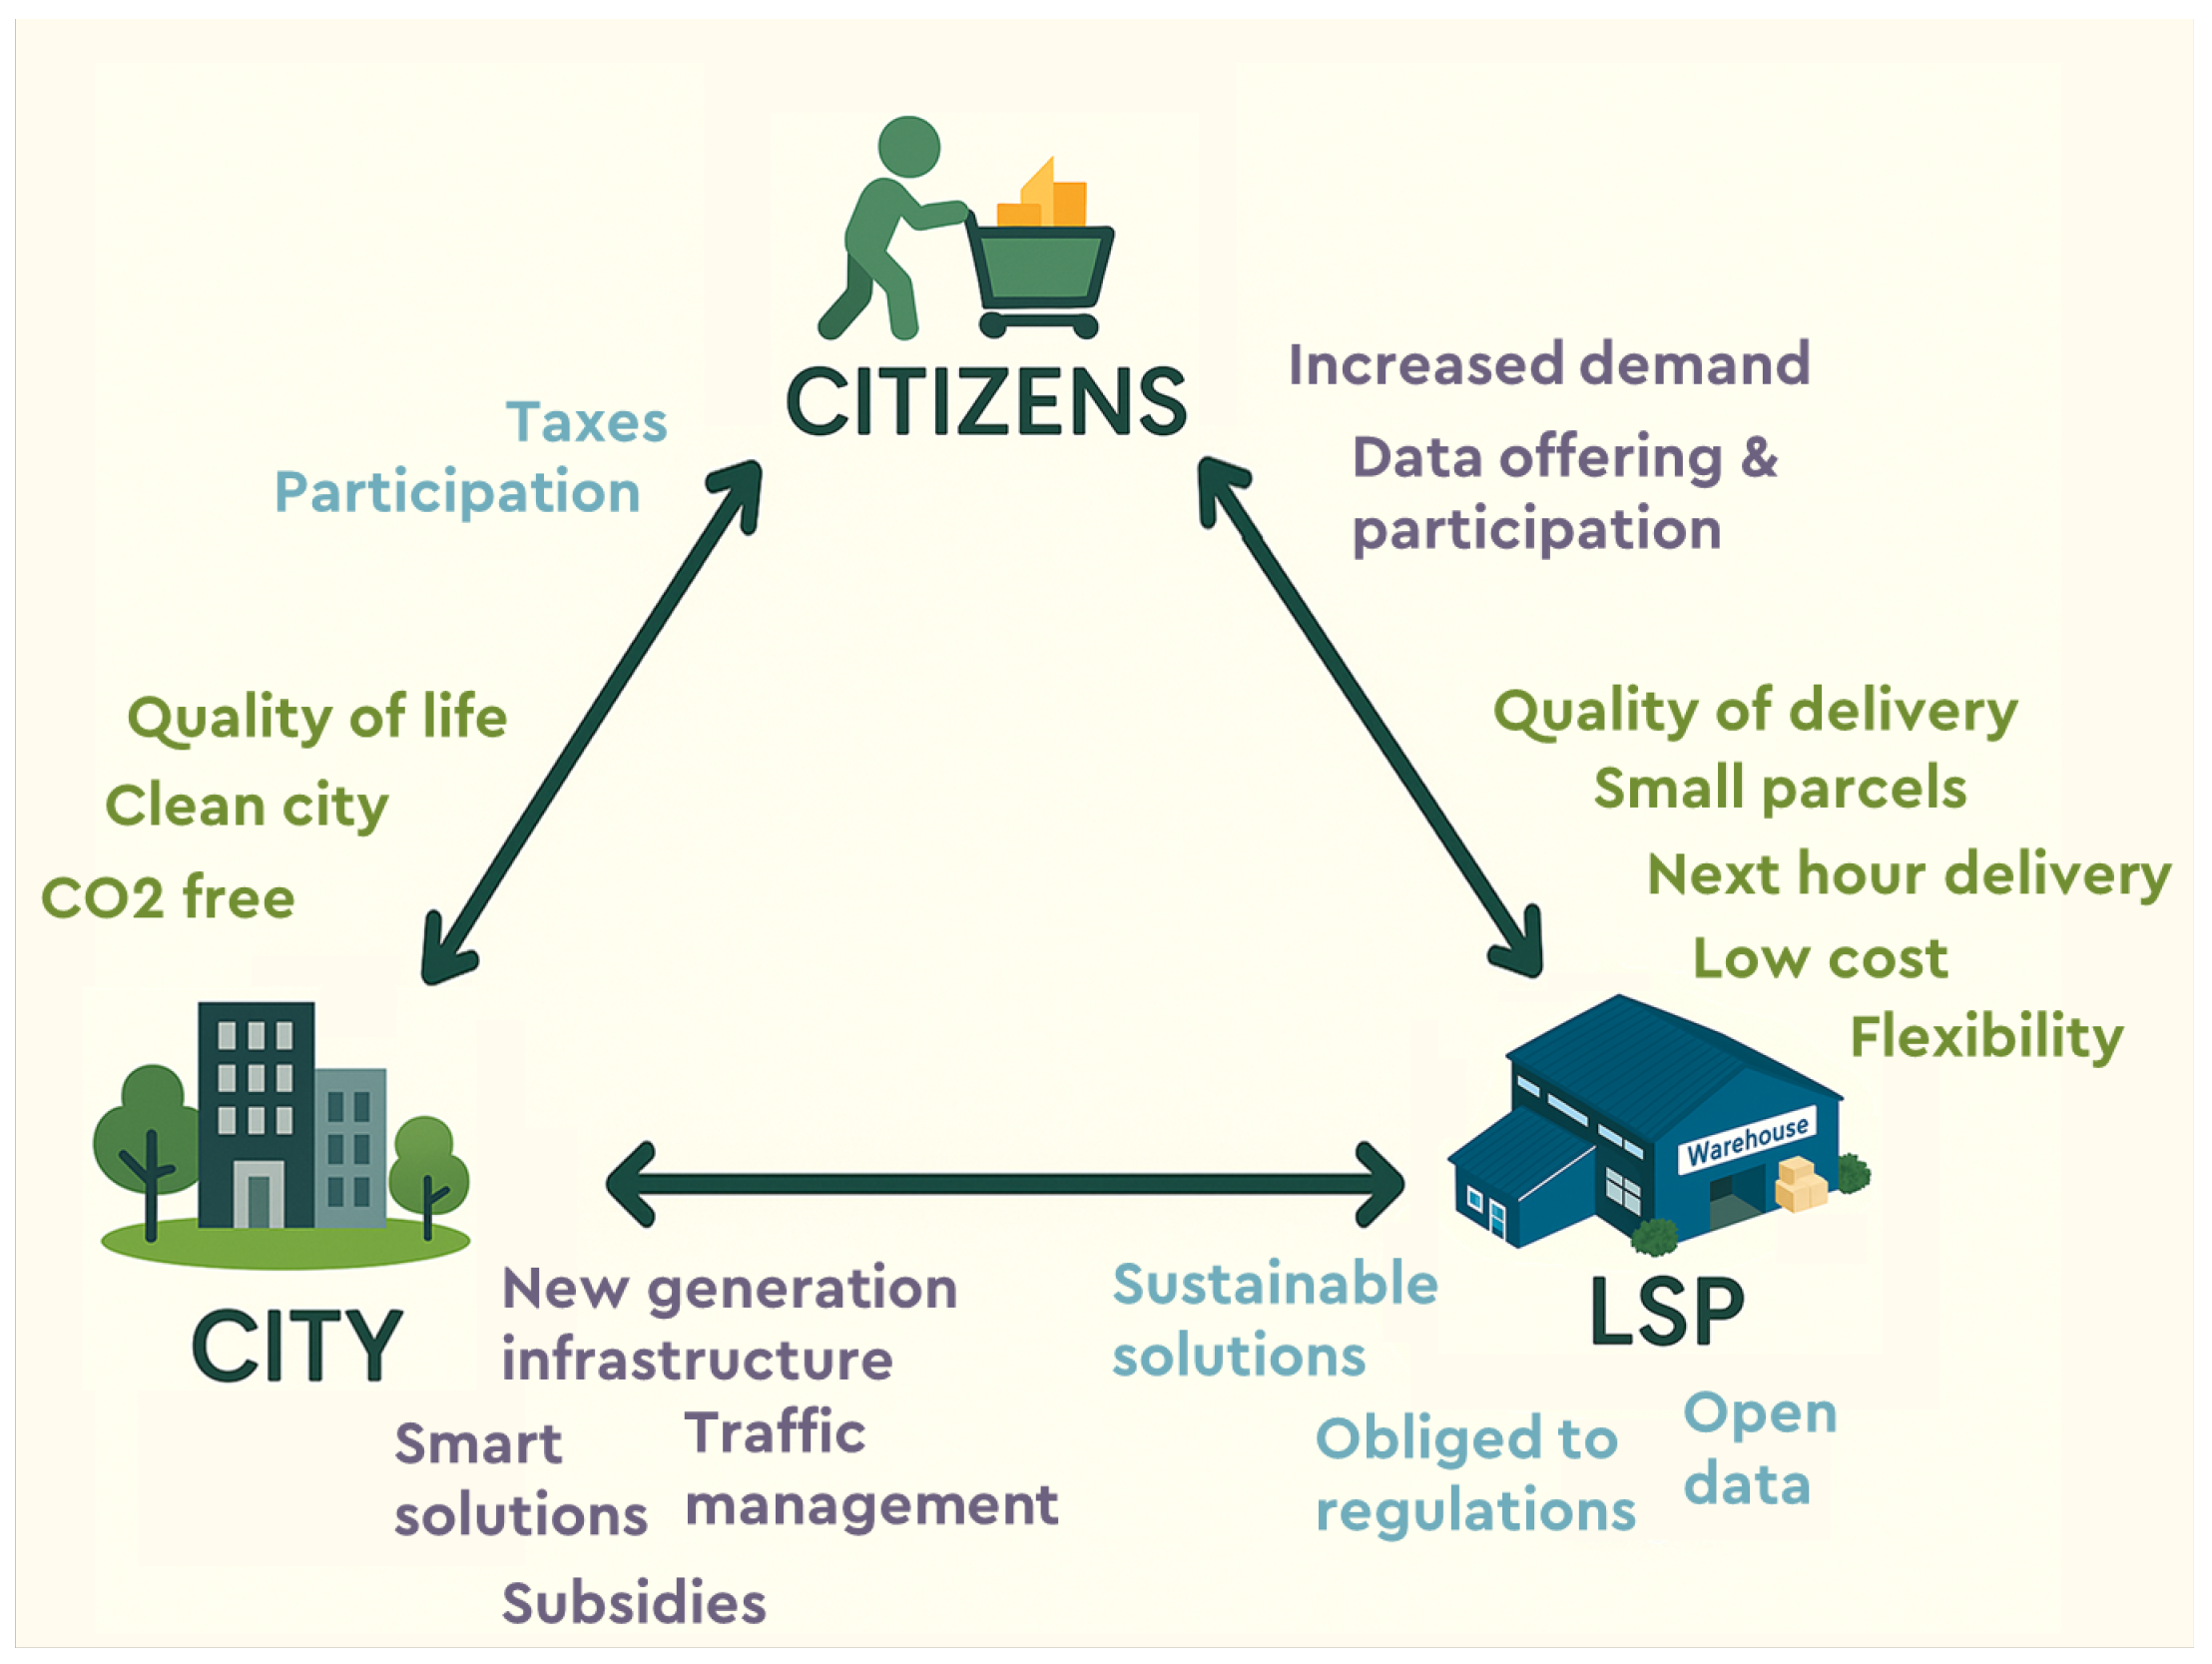
Figure 1 illustrates the dynamic interplay between the key urban logistics stakeholders—citizens (being the end users within the supply chain sector), Logistics Service Providers (LSP) and city authorities and highlights their expectations from each other in the pursuit of sustainable and efficient last-mile delivery solutions.
Urban form in terms of sprawl degree and spatial arrangement of land uses is widely recognised as a primary determinant of last-mile logistics performance. Recent studies project that continued unchecked expansion of e-commerce can increase last-mile delivery traffic in major metropolitan regions by more than 30% until 2030 [
12]. Although carriers have deployed facility location algorithms to move depots closer to demand clusters, real estate dynamics often push freight infrastructure in the opposite direction. For example, the rising property prices and shrinking land availability in central Paris have forced the average parcel hub approximately 10 km farther from the city center, a fact that causes about 15,000 tonnes of CO2 emissions each year [
13]. Between 2000 and 2012, suburban warehousing in both the monocentric Paris region and the polycentric Dutch Randstad grew by 33% demonstrating that logistics decentralization unfolds at a similar pace regardless of underlying urban form [
14]. Comparative analysis of different cities shows that auto-oriented Los Angeles exhibits the greatest spatial disconnect between population and freight facilities while denser and tightly regulated cities like Paris and Seoul display a much closer co-location of residential and warehousing functions [
15]. In rapidly expanding Chinese metropolises like Wuhan, the concentration of logistics parks along ring roads similarly extends last-mile delivery routes [
16]. Nevertheless, a countermovement towards “proximity logistics” has emerged both by a study conducted in different cities and megacities [
17] and an interesting study of the Amazon network [
18] highlighted the recent re-centralisation of logistics utilizing micro-fulfilment and urban delivery stations.
While the spatial placement of facilities is critical and they tend to move closer to city centers, vehicle-miles travelled are affected by several interacting factors including customer density, road-network structure, service-area size, land-use mix and distance between depots and their service area [
19]. Dense urban fabrics consistently generate higher per-capita parcel demand; neighbourhood-level analyses in Singapore [
20], Brazil and Portugal [
21] and the Netherlands [
22] all report increased home delivery volumes in compact districts. In Singapore, districts far from malls display higher delivery rates [
20] and a similar study likewise finds that less attractive city center shopping spurs online orders [
23]. Conversely, another study observes that good brick and mortar accessibility can co-exist with high e-commerce uptake and several U.S. studies detect no systematic distance effect [
24]. In a similar vein, it is argued that e-shopping substitution is highly dependent on and mediated by cultural and lifestyle variables [
25]. Socio-demographic factors further shape land-use impacts with wealthier, car-owning households place more e-commerce orders [
26] and larger families generate a greater total parcel volume [
27]. Evidence from Columbus, Ohio reinforces the importance of social context which shows that neighbourhoods with lower access to non-daily shopping show a slightly higher likelihood and frequency of e-shopping once internet experience and socio-demographics are controlled [
28].
Land-use configuration does not merely influence where logistics facilities are installed but potentially affects freight activity directly [
17]. Recent evidence found that specific density mixes such as high population combined with high employment rate are correlated with intense parcel demand [
15]. Significantly, the study of ref. [
29] demonstrates that incorporating urban-form indicators into freight trip-generation models markedly improves explanatory power in Delhi, which found that mixed-use zones attract additional inbound parcels and specialised industrial districts emit more outbound freight, underscoring the need to capture spatial heterogeneity in demand forecasting.
Building upon these insights, recent research has attempted to predict freight trip generation at increasingly precise spatial scales [
30,
31,
32,
33]. However, effective orchestration of urban logistics requires sophisticated, data-driven policymaking based on granular logistics data on delivery volumes, spatial demand patterns and operational metrics [
34]. Logistics companies remain reluctant to share such detailed operational information (e.g., vehicle routes, stop-level delivery addresses, spatial distribution of demand, load factors) since it constitutes proprietary business intelligence and raises data-protection concerns. Consequently, they provide only coarse aggregated indicators such as total annual deliveries that are insufficient for evidence-driven planning [
35]. This creates a critical methodological gap where the granular data needed for evidence-based policy development remains largely inaccessible to researchers and urban planners, despite micro-level analysis requiring precisely such detailed delivery records and complex sociodemographic data. Beyond the challenge of data access, a critical methodological barrier hinders the effective integration of diverse spatial datasets with varying resolutions.
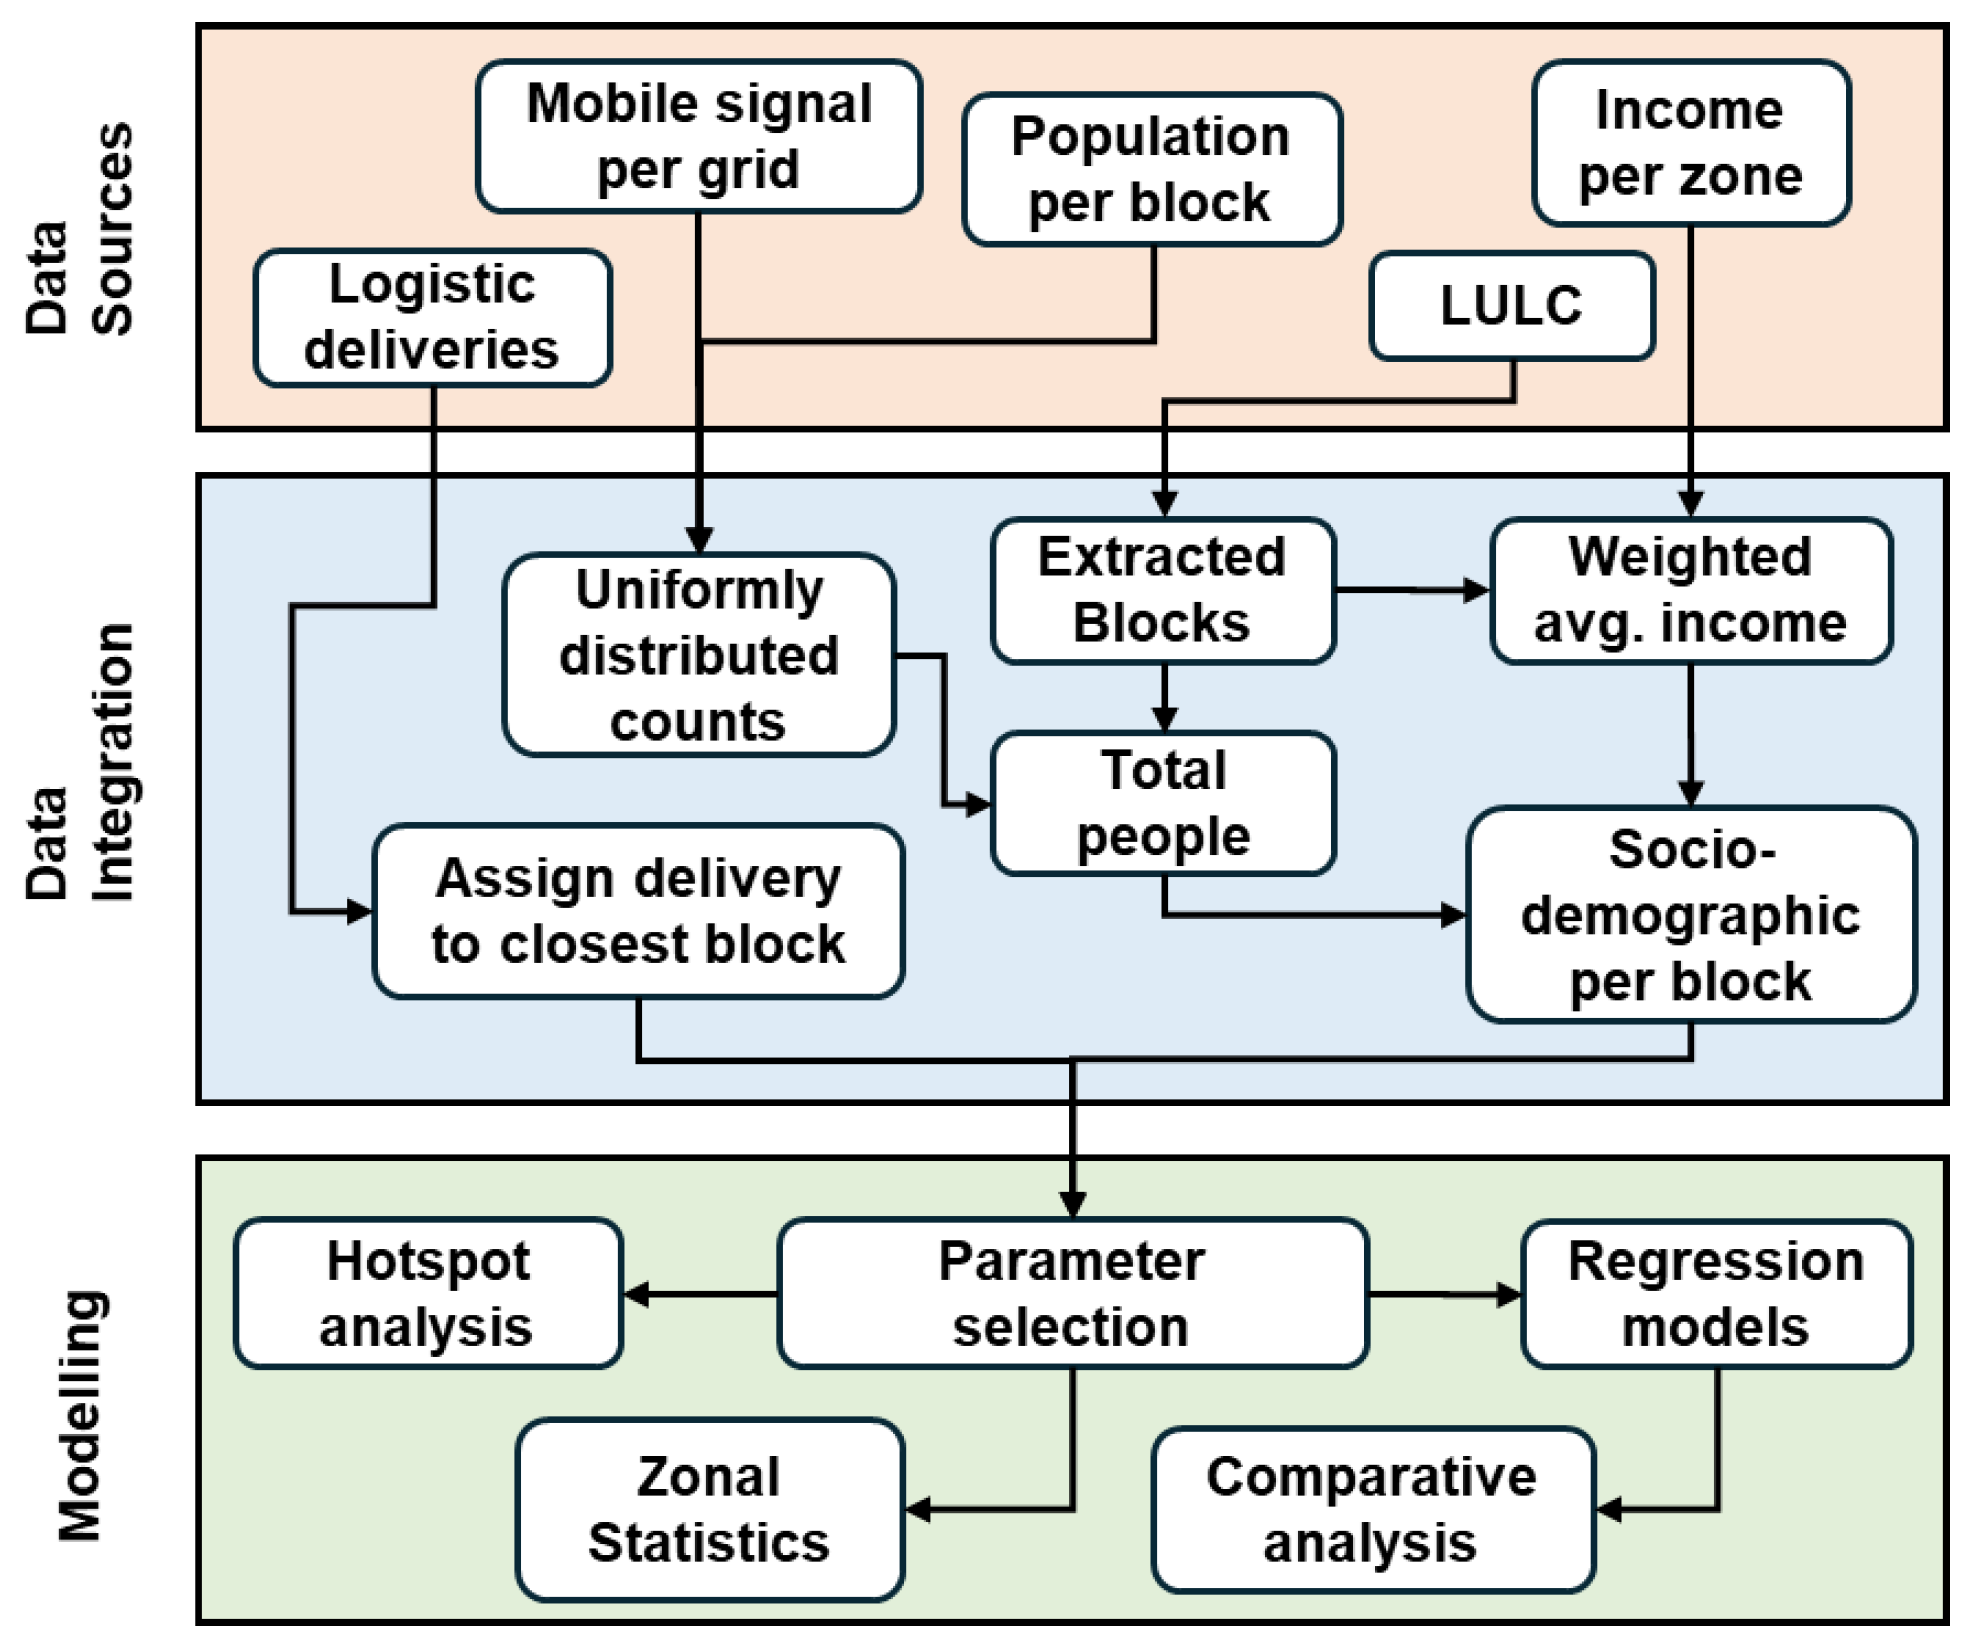
Literature revealed the existence of sophisticated spatial data integration techniques are utilized, particularly when harmonizing datasets with varying resolutions and administrative boundaries. Dasymetric mapping is a method that redistributes data from source zones to target zones using ancillary spatial information and has emerged as a standard approach for improving spatial estimation accuracy in urban studies [
36]. This technique has proven particularly valuable in studies with integration of census data with land use classifications [
37] and disaggregation of socioeconomic variables across different administrative units [
38]. This methodology’s ability to handle the spatial heterogeneity within administrative boundaries makes it especially suitable for this study, in order resample the different data into the same boundaries.
Although a growing body of work links urban form to last-mile performance, most empirical studies still rely on coarse or synthetic datasets because parcel operators rarely disclose sensitive operational data. This data embargo hinders the potential exploration of how urban factors (land-use mixes and socio-demographic patterns) jointly shape delivery demand. Consequently, planners lack spatial distributed evidence for calibrating freight-generation models or designing targeted policy interventions in dense European cities.
In the absence of granular evidence and while city authorities which need to apply successful planning for urban logistics (e.g., regulate curb access, emissions and land allocation) are largely in the dark. This heightens the risk of either over-restricting freight activity or under-regulating it and exacerbating congestion, emissions and public-space conflicts. There is therefore an urgent need for an empirically grounded framework that translates detailed courier data into actionable insights on how land-use configuration and socio-demographics drive spatial variations in last-mile parcel flows.
Leveraging a full year of proprietary origin-destination records from a leading courier in Thessaloniki, this study pursues three inter-related objectives:
To what extent do readily available socio-demographic indicators (e.g., population, income) and land-use metrics influence the spatial patterns of last-mile demand?
How do last-mile delivery intensities vary across distinct urban land-use configurations and how effectively do spatially explicit models capture these variations compared to global regression approaches?
What modeling approach provides the optimal balance of accuracy, interpretability and transferability for evidence-based urban logistics planning?
The main contributions of this research include: (1) the development of calibrated spatial demand models using proprietary courier data that can predict city-wide freight generation patterns using publicly available data; (2) the comparative evaluation of different regression modeling approaches for capturing urban freight demand patterns; and (3) the provision of practical insights for urban planners and policymakers in Thessaloniki and similar Greek cities for developing more sustainable last-mile delivery systems.
The rest of this article is organized as follows.
Section 2 details the data sources preprocessing and integration and the variable construction and presents study’s methodological framework;
Section 3 presents the empirical findings and
Section 4 discusses them in relation with other similar studies and presents the limitations of the current study;
Section 5 summarizes the main contributions and suggests directions for future research.
4. Discussion
4.1. Spatial and Temporal Characteristics
The distinct spatial patterns observed in last-mile demand reveal a complex urban logistics landscape, with the highest concentration of deliveries occurring in the city center, particularly in the eastern portion where mixed-use development creates compounded demand from both commercial activities and dense residential populations. This dual-nature environment generates layered delivery requirements, combining business-to-business logistics with residential e-commerce and service deliveries. Beyond the traditional monocentric pattern, the historical data reveal significant demand concentration in the eastern residential areas of the city where high population density creates secondary demand hotspots that operate independently of commercial hierarchies. This pattern suggests an evolution beyond the classic monocentric urban structure toward a more complex demand distribution where both mixed-use centrality and residential density serve as primary drivers of logistics intensity.
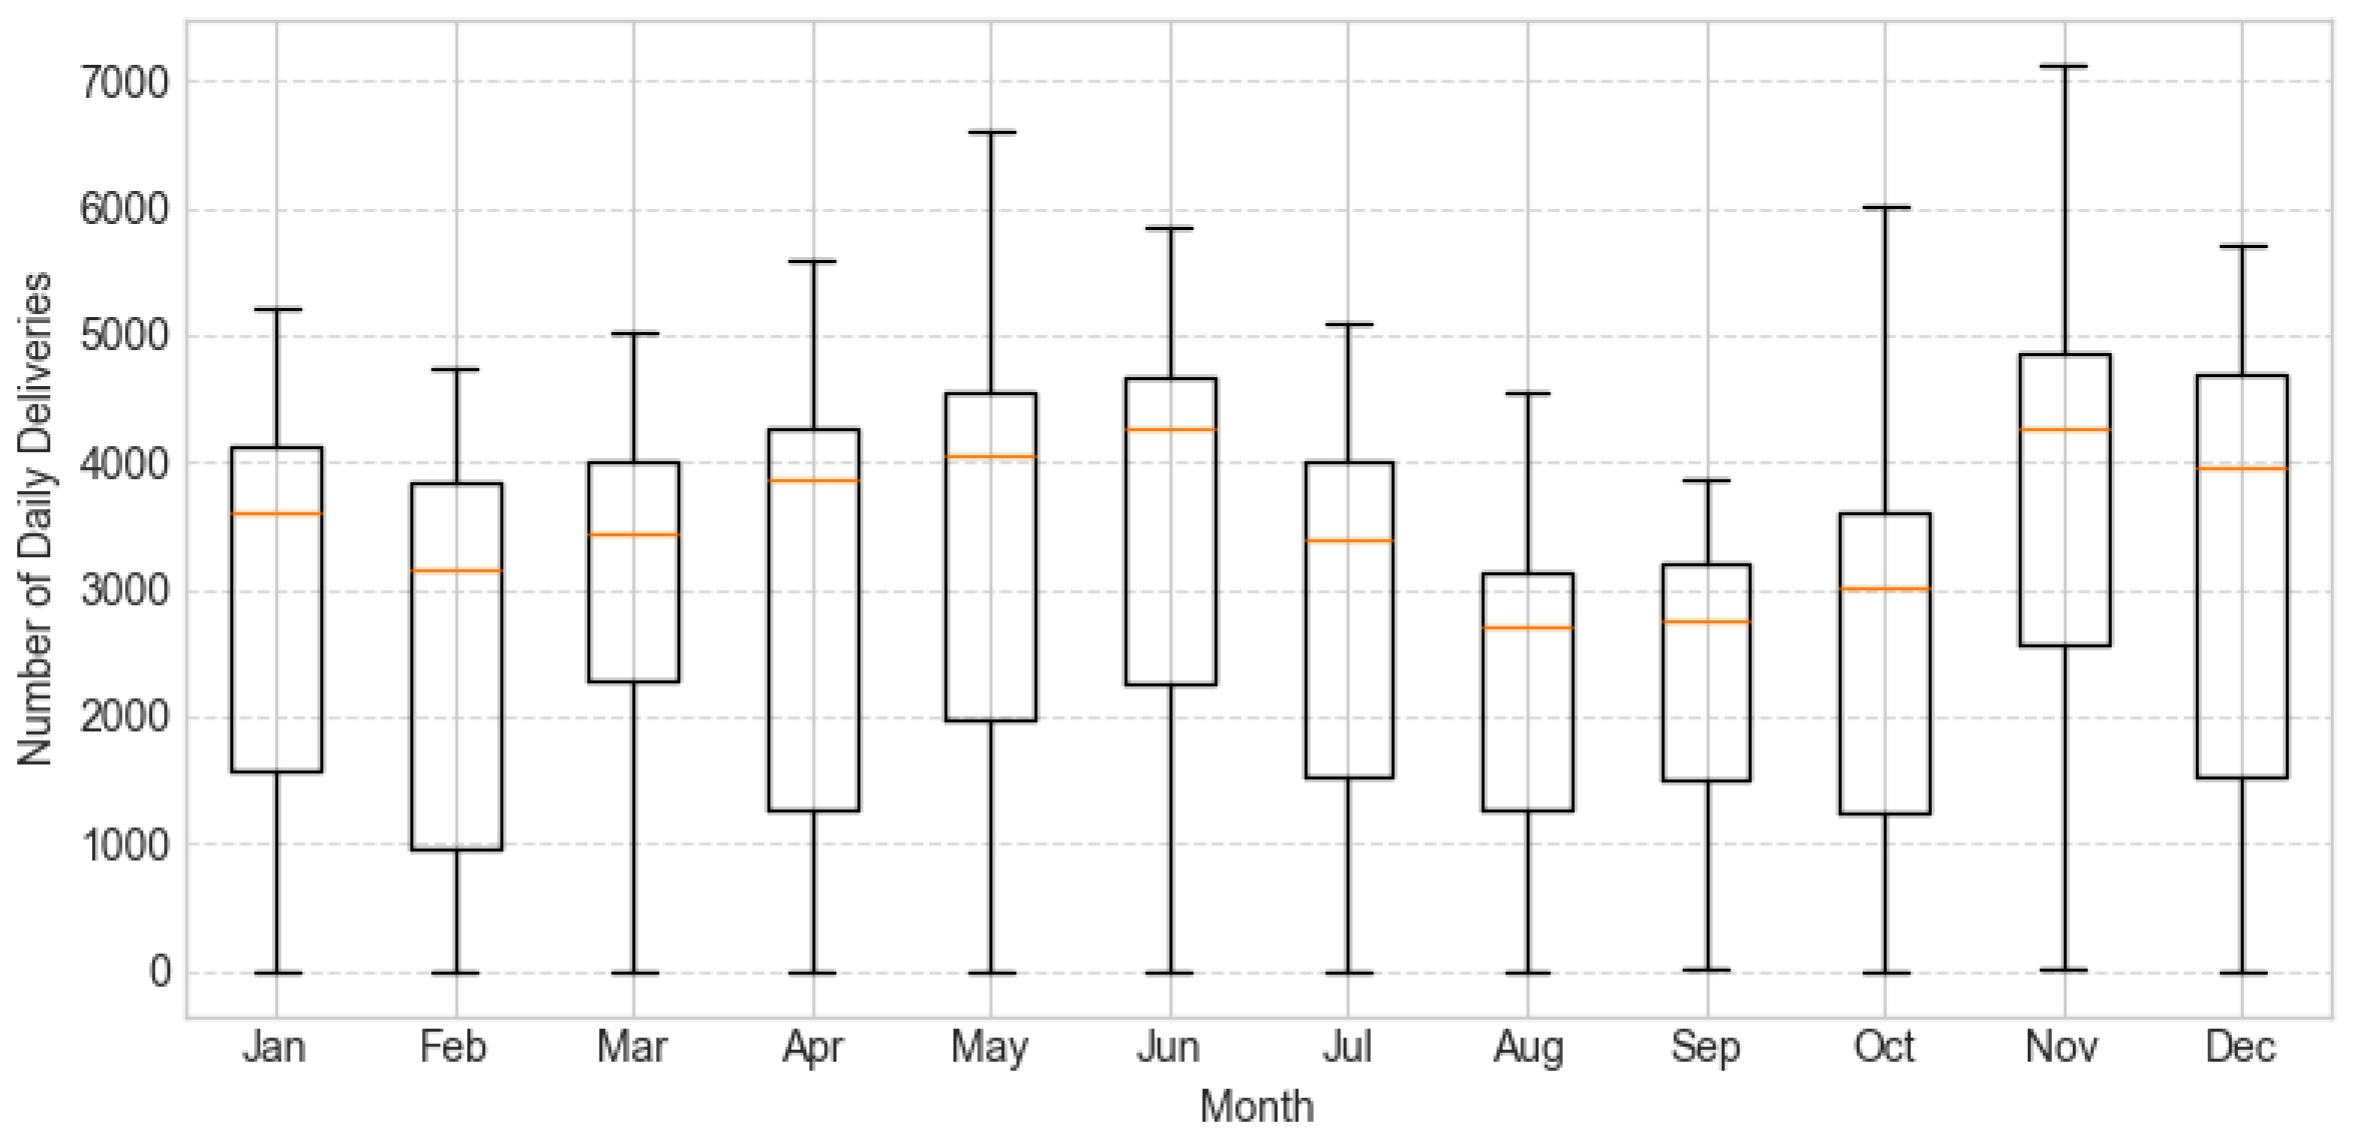
The pronounced bimodal seasonality in daily delivery volumes, with significant demand peaks during May–July and November–December reflects the typical consumer behavior influenced by promotional periods (mid-year sales) and the holiday shopping season (Christmas, Black Friday) in Greece and other European countries. Conversely, the lowest median delivery volumes in August reflect the widespread commercial deceleration and temporary population absence during the traditional summer holidays, a characteristic feature of Greek urban life where a significant share of the population leaves cities for vacation.
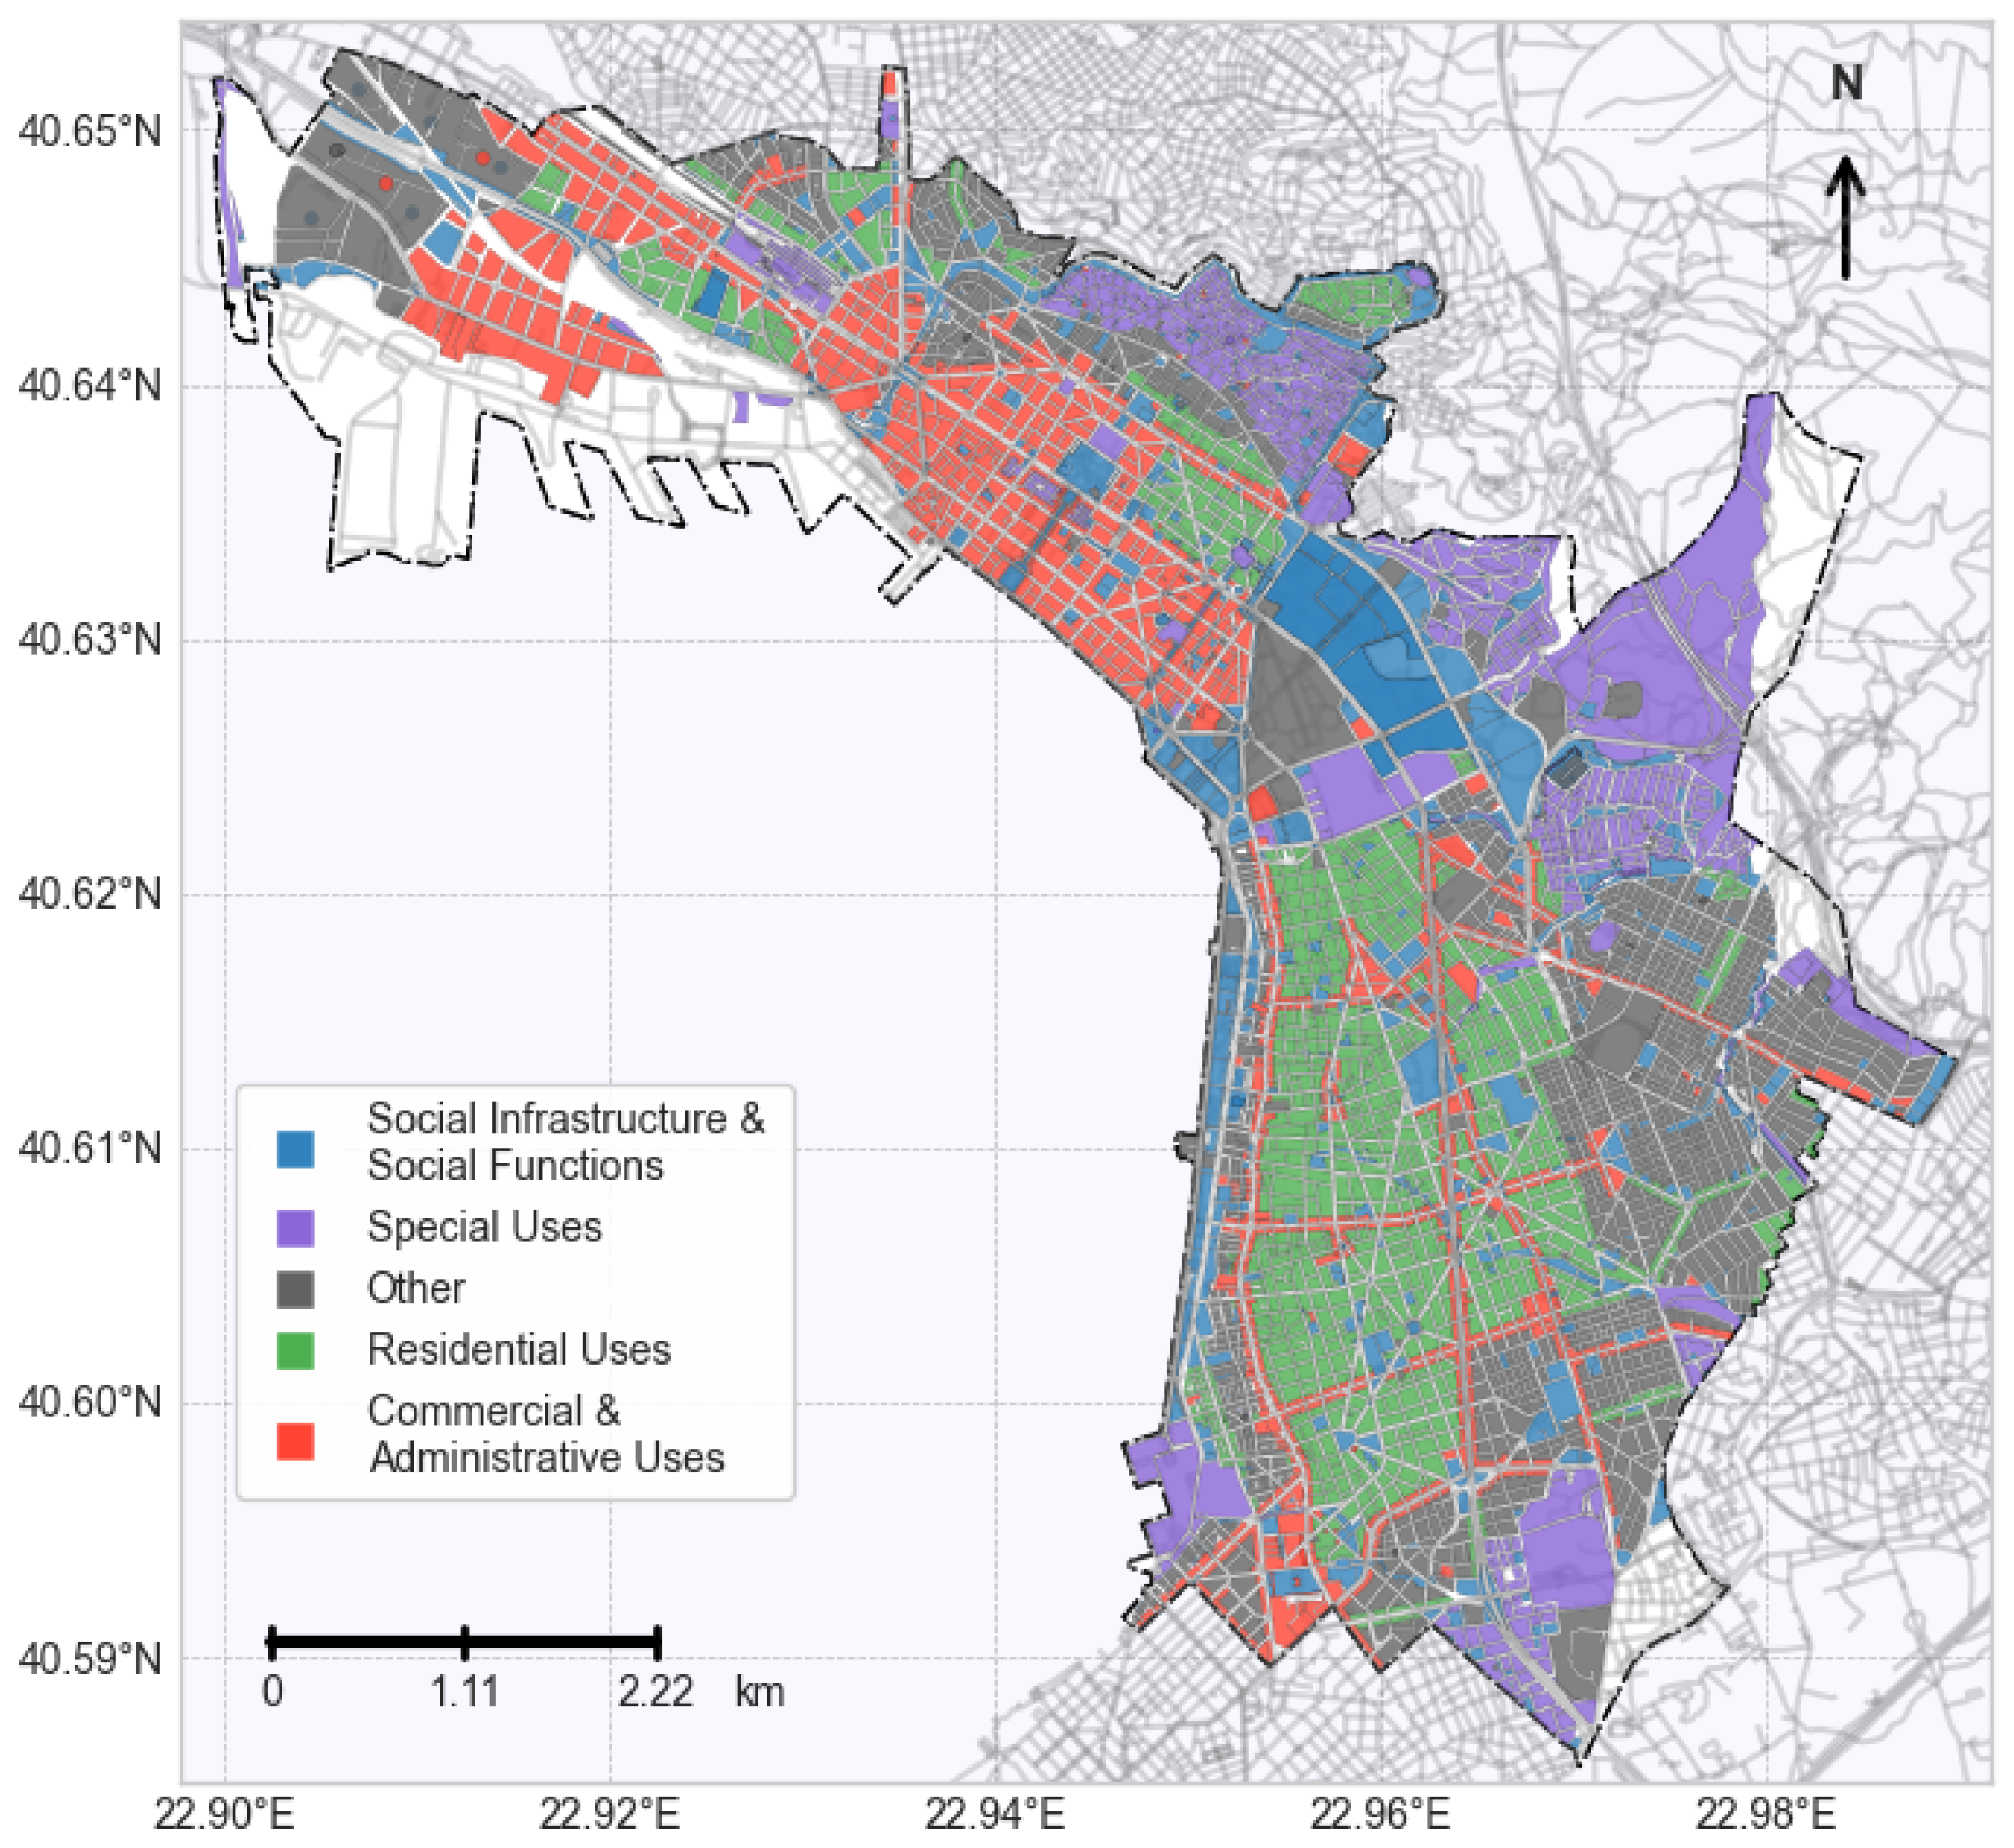
The significant variations in delivery intensity across different land-use types in Thessaloniki, as revealed by the zonal statistics, underscore the dual nature of e-commerce demand. The high delivery intensity per hectare in Commercial and Administrative zones (1148.99) and Residential areas (1114.37) reflects both business-to-business (B2B) deliveries in commercial and administrative districts and business-to-consumer (B2C) deliveries in residential areas. The consistency in delivery rates per capita across all categories (3.06 to 3.72) is particularly interesting for Thessaloniki while suggest a relatively uniform per-person consumption of e-commerce services regardless of the primary land use, which might be attributed to the city’s relatively compact and mixed-use urban fabric. The markedly lower delivery metrics in Special Uses (449.14 deliveries per hectare), such as archaeological sites, conservation areas and ecologically protected zones are directly aligned with regulatory frameworks that restrict commercial activities in these sensitive areas. Similarly, intermediate values in Social Infrastructure & Public Services (715.55 deliveries per hectare) reflect institutional procurement patterns which operate at a lower intensity than consumer-driven retail demand.
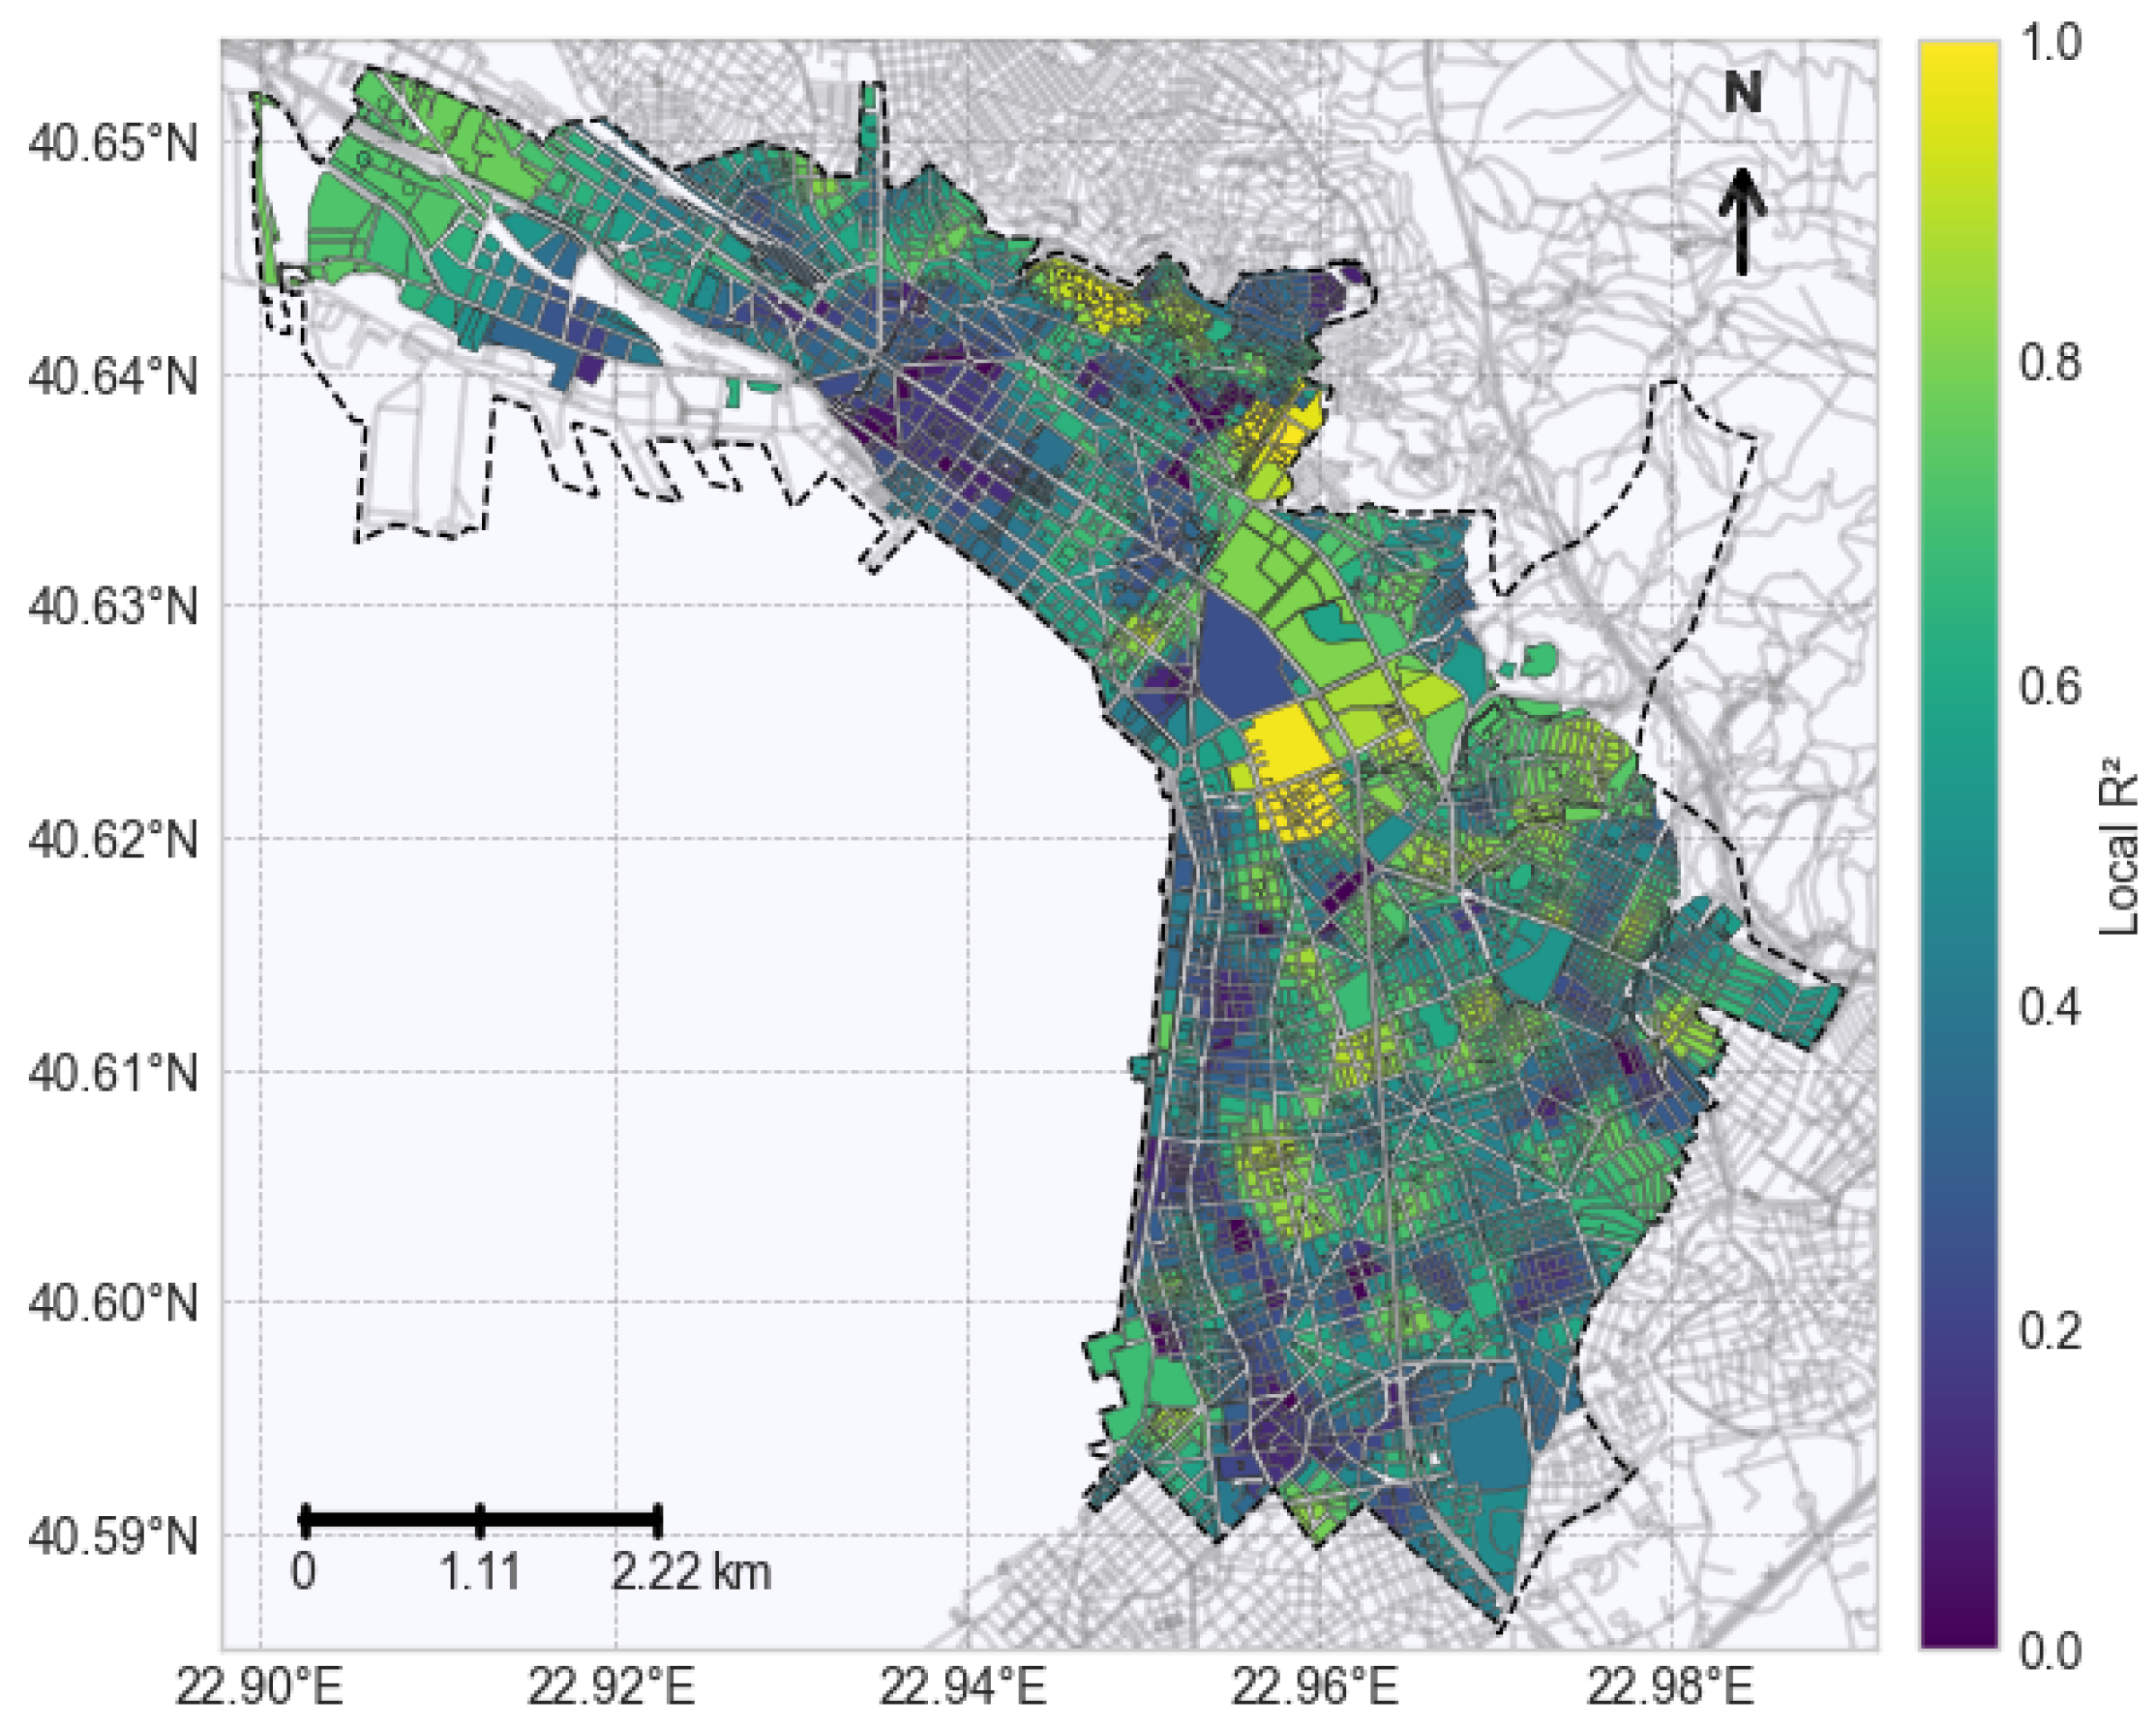
The fragmented pattern of delivery hotspots, revealed by the Getis-Ord Gi* analysis (
Figure 8), suggests that delivery intensity is driven by localized factors such as increased population density or demanding establishments rather than broad land use categories alone.
The spatial clustering analysis which performed through the Getis-Ord Gi* statistic revealed several distinct hotspots of high delivery demand, each with unique underlying causes. The blue area (characterized by a dense residential population) naturally exhibits high demand due to the sheer concentration of people requiring various goods and services delivered to their homes. Similarly, the red area which encompasses the city center is a significant hotspot, driven by a combination of numerous commercial establishments and a considerable residential base that leads to high delivery volumes for both businesses and residents. Notably, high demand is also observed around hospitals, particularly Ippokrateio; this can be attributed to a consistent need for deliveries of medical equipment, supplies and even postal services crucial for hospital operations and patient care. The Valaoritou district also presents as a significant area of high demand due to the presence of local manufacturers likely contributes to daytime demand for business-to-business deliveries. Furthermore, the Papafi district shows expected high demand which is largely driven by its unique concentration of car service businesses, since establishments often lacking extensive on-site warehousing, likely generate substantial delivery requests for specialized equipment and parts. Finally, the broader Agia Sofia district stands out as a critical hotspot within the city center combining a high density of residences with a demographic characterized by higher income levels, making it a prime location for last-mile delivery services. A similar situation is observed in the cluster located just northern of the Papafi District that suggests a comparable blend of residential density and economic factors contributing to elevated delivery activity. The absence of significant coldspots indicates a baseline presence of delivery demand across the urban fabric, even if it concentrates in specific nodes.
4.2. Univariate and Multivariate Regression
The univariate regression models provide initial insights into the explanatory power of population as a singular predictor of freight demand. The finding that approximately 2.5–3.0 deliveries per year are assigned to each resident in Thessaloniki, regardless of the immediate urban context, underscores the intensive nature of e-commerce adoption throughout the city. These results remain consistent with most European cities, where delivery ranges of 5–10 deliveries per person annually, but stand in contrast to dense Asian cities where numbers can exceed 100 [
57]. This difference likely reflects varying levels of e-commerce maturity, urban density, and consumer behavior across different global regions. Our findings, however, are contradicted by a US study [
58] which found significantly more deliveries per unit area hosted by mixed-use and high-intensity commercial zones compared to purely residential districts, suggesting contextual differences in how land use influences delivery patterns. The varying R
2 values, with weaker fits in Commercial & Administrative districts, suggest that workplace-oriented parcels obscure the residential signal in these mixed-use environments. Conversely, in “Other Uses” categories, largely free of competing generators, population alone explains nearly half of the observed variance. This implies that for a comprehensive understanding of last-mile demand in Thessaloniki, especially in mixed-use areas, additional predictors beyond population are necessary.
The multivariate regression analysis, incorporating workforce presence and household average income, demonstrates improved model fit across all land-use categories, particularly in Social Infrastructure & Public Services and Residential Uses. These improvements corroborate findings from multiple studies [
20,
21], highlighting the enhanced explanatory power achieved by incorporating additional socioeconomic dimensions. While residential population remains the strongest predictor, a fact supported by literature [
22], the notable influence of workforce presence, particularly in Residential and Social Infrastructure zones, aligns with recent urban logistics research in China [
31,
59] regarding the importance of the workforce in generating delivery demand. The comparatively modest effect of household average income echoes the low income elasticity observed in a significant study reviewing spatial attributes and e-shopping behavior [
25]. However, these results contrast with findings from a U.S. study that identified income as a significant determinant of last-mile delivery patterns [
30]. This discrepancy could be attributed to the limited spatial resolution of the household income in the current study for Thessaloniki, which might obscure its true impact. The smallest improvement in model fit for Commercial & Administrative zones suggests that these areas may benefit from additional variables such as perceived retail attractiveness and road-network structure to better capture their delivery dynamics [
23].
4.3. GWR Implementation and Sensitivity Analysis
The implementation of a GWR approach provides crucial evidence of substantial spatial variation in the effects of sociodemographic factors on last-mile delivery demand in Thessaloniki. The marked improvement in explanatory power of GWR models over their global counterparts underscores the critical importance of accounting for spatial non-stationarity in urban freight planning. The particularly pronounced improvements in Social Infrastructure & Public Services and Residential Uses indicate that the local regression approach effectively captures variations in delivery demand in these categories within Thessaloniki. The considerable variation in optimal bandwidth parameters across land-use categories reflects differing spatial scales at which relationships between sociodemographic factors and delivery demand operate in the city. The lack of improvement in the GWR model for Commercial & Administrative Uses reinforces the conclusion that the selected sociodemographic predictors alone are insufficient to capture the complex dynamics driving delivery patterns in these zones, necessitating the inclusion of other factors more relevant to commercial activity.
A comprehensive sensitivity analysis was conducted to evaluate the robustness of the GWR models’ optimal bandwidth selection, addressing the fundamental trade-off between model flexibility and overfitting that characterizes bandwidth selection in spatial regression. This analysis systematically varied the bandwidth from 0.5 to 2.0 times the automatically determined optimal bandwidth for each land-use category and the aggregated dataset, assessing the impact on model fit metrics (AICc), explanatory power (global R2), coefficient stability, and statistical significance patterns. The bandwidth selection challenge lies in balancing local detail capture (smaller bandwidths) against model stability and generalizability (larger bandwidths) where overly small bandwidths risk overfitting while overly large bandwidths may obscure genuine spatial heterogeneity. The AICc was minimized or near-minimized at the automatically selected optimal bandwidth (1.0 multiplier) for all land-use types. While global R2 values expectedly decreased with increasing bandwidth due to spatial smoothing effects (from 0.6438 at 0.5× to 0.4534 at 2.0×) this pattern confirms appropriate model behavior rather than indicating poor selection. Coefficient stability analysis revealed exceptional robustness for population estimates across all categories (CV: 0.0040–0.0275) that demonstrate that this key relationship is not an artifact of bandwidth choice. Income coefficients similarly showed strong stability (CV: 0.0389–0.3885), while workforce coefficients exhibited higher variability (CV: 0.0984–1.5372) particularly in “Special Uses” where coefficients ranged from 0.1043 (0.5×) to -0.0145 (2.0×). This variability suggests that workforce relationships operate at multiple spatial scales and are appropriately captured through the optimal bandwidth’s balance between local detail and regional stability. Statistical significance patterns remained consistent across bandwidth variations, with population coefficients maintaining 60–90% significance rates, confirming the reliability of detected spatial relationships. These results provide strong evidence that the bandwidth selection procedure successfully navigated the flexibility-stability trade-off.
The summary statistics for the GWR coefficient estimates further highlight the spatial heterogeneity of sociodemographic drivers with the local population coefficient generally remaining strongest but exhibiting large standard deviations (especially in specific cases) that confirm “one-size-fits-all” planning approaches are inadequate for managing contemporary urban logistics challenges in Thessaloniki. The varying impact of workforce across categories (strong in Commercial & Administrative Uses to negligible in Special Uses) further emphasizes the need for tailored interventions, while the uniformly small income effects across categories suggest either that it might be less a direct driver of delivery volume than other factors or its influence is masked by other localized phenomena, though it should be considered that the low spatial resolution of income data can also be the barrier for this low influence. The complex mosaic pattern of local values which goes beyond a simple center-periphery gradient, reveals that both delivery intensity and the factors driving it vary at a highly localized scale and distinct clusters of high explanatory power in the northeast quadrant and mid-city neighborhoods contrasted with pockets of poor model fit in western districts and specific central areas (e.g., between the port and train station, coinciding with reduced building density) suggesting that the underlying mechanisms of delivery demand are not uniformly distributed. This comprehensive analysis demonstrates that urban last-mile delivery patterns are governed by a complex interplay of sociodemographic factors which operate at highly localized scales with the progression from global regression models ( = 0.385) to geographically weighted regression ( = 0.542) underscoring the critical importance of accounting for spatial non-stationarity in urban freight planning. The heterogeneous pattern together with the fragmented hotspot distribution and the heterogeneous explanatory power of sociodemographic variables across the urban fabric, indicates that effective last-mile management requires spatially differentiated policy interventions tailored to local contexts within Thessaloniki. These findings align with emerging paradigms in urban freight governance that emphasize micro-zoning approaches over city-wide regulations supporting the development of precision logistics policies that can adapt to the “mosaic” patterns of contemporary e-commerce demand while maintaining operational efficiency and urban livability.
4.4. Land-Use Specific Model Performance
The notably weaker performance of regression models in Commercial & Administrative zones (R2 = 0.215 in univariate, 0.248 in multivariate and 0.206 in GWR) compared to other land-use categories reveals the inherent complexity of delivery demand patterns in these mixed-use environments. Unlike residential areas where delivery patterns are predominantly driven by consumer behavior, Commercial & Administrative zones exhibit a dual nature of delivery demand by encompassing both business-to-business (B2B) and business-to-consumer (B2C) transactions that operate under fundamentally different logics. Deliveries to businesses are characterized by larger shipment sizes, scheduled delivery windows and procurement cycles that may be decoupled from local population density while B2C deliveries to commercial establishments follow different temporal and spatial patterns. Additionally, B2B deliveries are often governed by specific agreements between businesses or contractual arrangements with particular logistics operators, meaning that the study’s data source may not capture the full spectrum of delivery activities while including data only from certain logistics providers. This dual demand structure creates significant internal variation within Commercial & Administrative zones that cannot be adequately captured by the sociodemographic variables employed in this study. The heterogeneous nature of commercial establishments (from small retail shops to large office buildings, from street-level businesses to multi-story commercial complexes) further compounds this complexity, as each establishment type generates distinct delivery patterns influenced by factors such as business size, commercial avenue attractiveness, establishment type (retail, office, service), opening hours and customer accessibility. The absence of variables related to the establishments (e.g., floor area, number of employees, business type classification, commercial turnover) can potentially explain the limited explanatory power of population-based predictors in these zones.
Conversely, the high accuracy achieved in Social Infrastructure & Public Services zones (R2 = 0.533 in multivariate, 0.722 in GWR) can be attributed to the relatively stable and predictable nature of delivery demand in these institutional environments. Unlike commercial establishments, deliveries to public services and social infrastructure are predominantly operational in nature, involving essential supplies such as medical equipment, office consumables, maintenance materials and institutional provisions that exhibit consistent demand patterns throughout the year. These operational deliveries which constitute the majority of freight movements to hospitals, schools, government buildings and other public facilities are typically planned and scheduled based on institutional needs rather than individual consumer behavior, creating more predictable demand patterns that correlate well with workforce presence and facility capacity. Furthermore, the volume of these operational B2B deliveries significantly exceeds any incidental B2C deliveries to employees working in these facilities, ensuring that the institutional demand signal dominates the overall delivery pattern and reduces the noise introduced by individual consumer behavior.
4.5. Methodological Limitations and Data Considerations
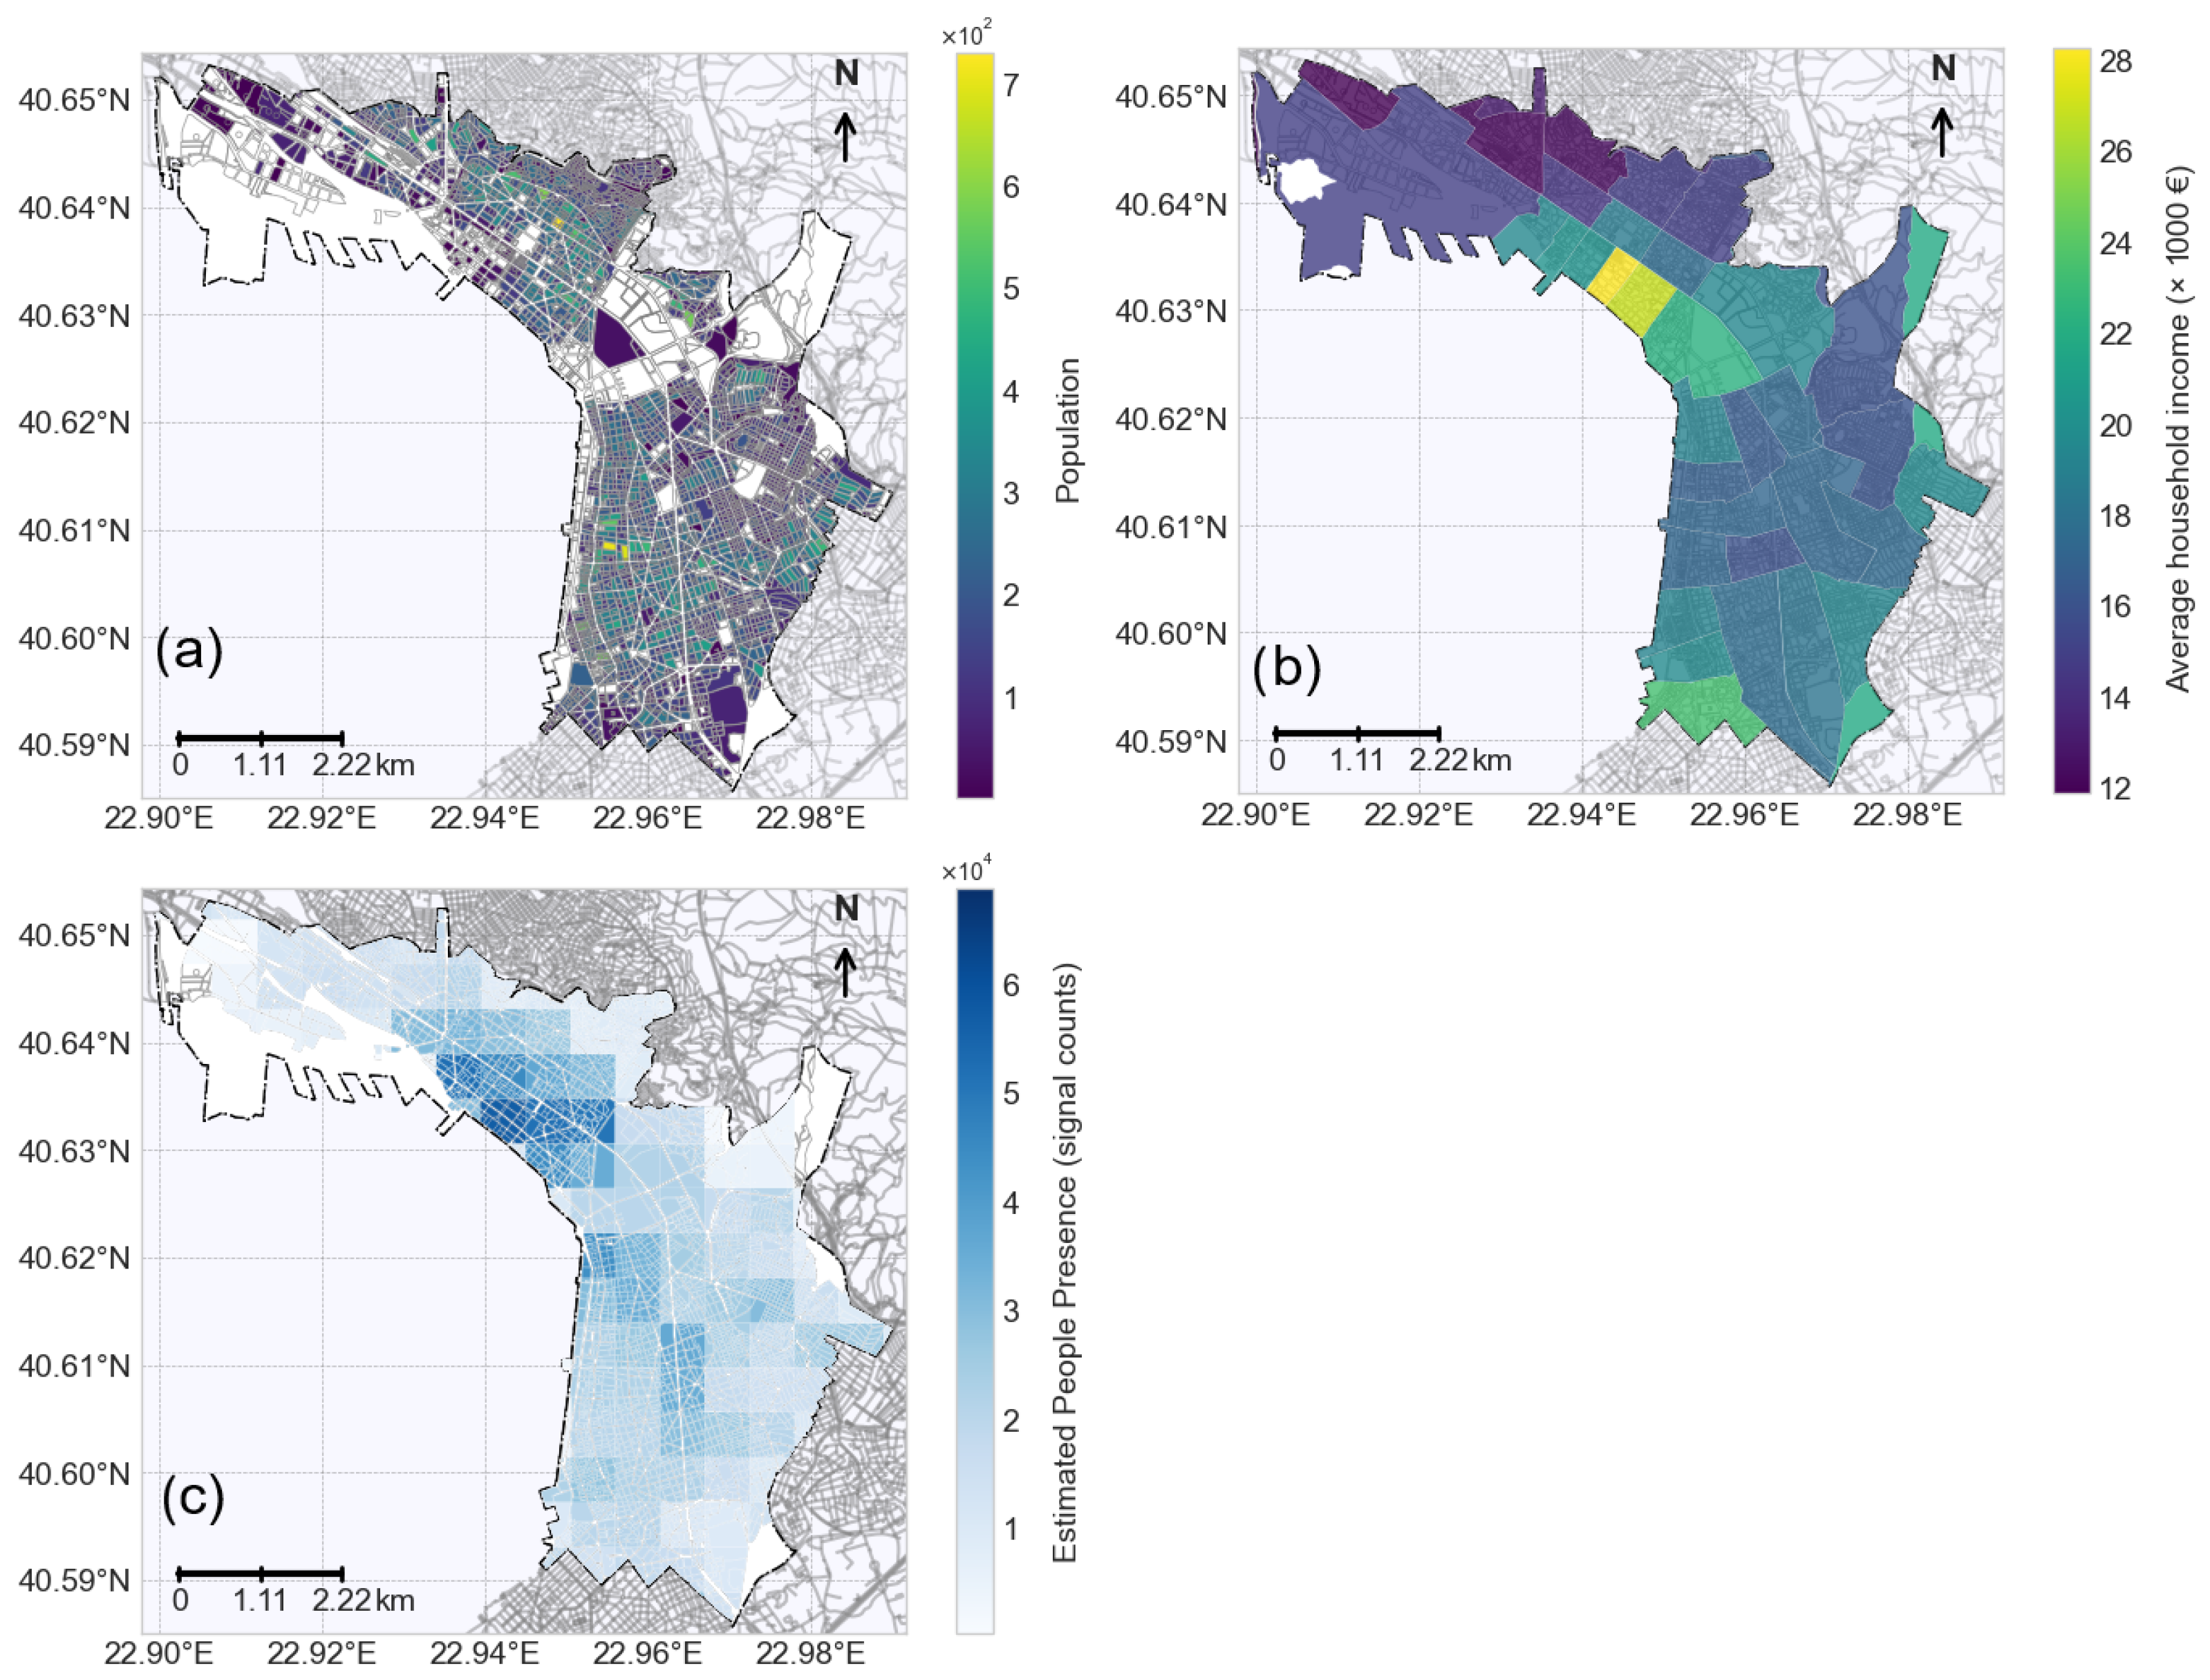
The integration of datasets with varying spatial resolutions and temporal contexts introduces inherent limitations that may affect the analytical validity of the models utilized in this study. To be more specific, household income data that was originally aggregated at coarse statistical zones (significantly larger than individual LULC blocks), underwent area-weighted disaggregation that assumes uniform income distribution within each zone; an assumption that likely obscures the true socioeconomic heterogeneity within city. The observed spatial averaging effect may help explain the consistently low magnitude of income coefficients and the low income elasticity in this study which contrasts with other literature that underscores income as a key driver of delivery patterns.
Furthermore, the temporal misalignment between datasets—specifically population data (2011 census data), income statistics (2012), delivery records (2022–2023), and mobile signals (2024)—introduces potential confounding effects. While this temporal variance is a notable limitation, these seemingly older datasets still offer valuable insights into the fundamental drivers of logistics demand in Thessaloniki, and their continued relevance for this study can be strongly argued. For instance, despite the 2011 timestamp, recent research by the Hellenic Statistical Authority indicates that the population of Thessaloniki has remained remarkably stable during the last decade, experiencing only a modest increase of approximately 1.3% since 2011 [
43]. This demographic consistency is largely attributable to the saturation of available building space within the municipality, which pushes new development beyond its administrative boundaries. This means that the spatial distribution of residents has remained consistent, making the 2011 population data a valid and valuable input for understanding current delivery patterns. Similarly, while the economic landscape and purchasing power have undoubtedly evolved since 2012 due to various economic developments and global events like COVID-19, it is crucial to consider that the distribution of socioeconomic conditions across the city’s zones has likely remained relatively consistent. Even if absolute income levels have shifted, the relative disparities and the spatial patterns of income distribution observed in 2012 are likely to mirror current conditions, thus they still provide a meaningful representation for spatial analysis. Crucially, land uses in urban environments do not undergo significant short-term changes meaning that such data remains relevant and accurate for the study’s timeframe. This consistency also means that workforce distribution which is intrinsically linked to established land use patterns, can be considered valid and aligned with the parcels data from 2022. These factors collectively strengthen the argument for the continued utility of these foundational datasets despite their older timestamps. Reliance on data from a single courier company, even Greece’s courier company, inherently introduces potential biases related to market fragmentation, spatial coverage gaps and service-type skew. However, given that this company holds more than 30% market share [
45], the dataset can largely represent the real distribution of parcels in Thessaloniki. While this data was meticulously rescaled to extrapolate city-wide delivery patterns, its singular origin might influence the observed performance of commercial land uses. This limitation could be particularly pronounced for commercial establishments and other business-oriented land uses, as commercial entities often have pre-existing agreements with specific couriers, meaning this dataset might not fully capture delivery volumes handled by competing services for these land-use categories; this could partly explain the comparatively lower performance of commercial land uses observed in this study.
Finally, while the point-based interpolation applied to population data and the 400 m grid-based mobile signal processing are methodologically sound, they may not fully capture the fine-grained spatial variability that characterizes urban delivery demand and potentially contributes to the unexplained variance of the models. These limitations suggest that future research would benefit from higher-resolution income data (ideally at the census block level), temporally synchronized datasets, demand data from more actors and finer-scale mobile signal data to enhance the precision of spatial harmonization and strengthen the predictive capacity of sociodemographic variables in urban freight modeling.
4.6. Generalizability and Policy Implications
A valuable case study is provided by Thessaloniki as a medium-sized European port city with a typical Mediterranean urban form with common planning challenges for last-mile logistics in the region are reflected by its compact and mixed-use fabric. Its strategic importance and relevance are further underscored by its inclusion in the Trans-European Transport Network (TEN-T) coupled with its role as a significant hub for Greek e-commerce, as evidenced by its early adoption in Northern Greece [
43] and a substantial percentage of national logistics companies located within its bounds. While a robust foundation for cities of similar scale and urban structure is offered by these insights, careful consideration of the generalizability of our findings is required. For instance, the distinct complexities of megacities which often feature more extensive and multi-layered logistics networks, diverse consumer behaviors and multiple sub-centers of activity, may not be fully captured by this study. Similarly, limitations may be exhibited when they are applied to polycentric urban structures or satellite city configurations, where demand is distributed across several distinct urban nodes rather than being concentrated in a single core and spatial delivery patterns and operational challenges are thus fundamentally altered.
The findings presented in this study offer clear, actionable insights for urban planners which aim to optimize last-mile logistics policy under resource constraints. Given the identified localized variations in delivery demand, planners are encouraged to apply micro-zoning actions rather than city-wide regulations; for instance, areas identified as persistent delivery hotspots could be targeted for dedicated loading zones or off-hour delivery incentives which at one side require infrastructural investment but on the other side they significantly contribute to congestion and emissions. Additionally, recognizing seasonal fluctuations, temporary adjustments in curb management policies (e.g., flexible loading bay allocations during peak shopping periods) could efficiently balance commercial vitality and urban livability without substantial capital expenditure. Leveraging publicly available socio-demographic datasets, planners can recalibrate these spatial interventions to ensure adaptive management of logistics infrastructure tailored to dynamic local contexts.
5. Conclusions
This research introduces and validates a transferable, privacy-preserving framework designed to predict last-mile delivery demand at a granular scale. By uniquely integrating confidential courier deliveries with publicly accessible geospatial data and workforce distribution, this study demonstrates that robust predictive models can be initially trained using embargoed data and subsequently deployed using only readily available inputs. This novel approach effectively overcomes a persistent challenge in evidence-based freight planning which traditionally relies on proprietary operational information that logistics firms are often hesitant or unable to share due to confidentiality concerns and advances the practical applicability of urban logistics research. The analysis yields three outcomes:
Fewer than 5% of Thessaloniki’s blocks account for more than 10% of all parcels, yet these hotspots form a fragmented archipelago rather than concentric zones.
Population alone captures roughly 1/3 of the variance with an average elasticity of 2.5–3 parcels per resident per year while adding workforce presence and income increases explanatory power to 39% and GWR significantly elevates above 70% in residential and institutional zones, boosting overall accuracy to 54%. The persistent under-performance in commercial corridors () highlights the limitations of purely sociodemographic models in these areas.
Workforce and income elasticities demonstrate substantial heterogeneity, with workforce presence exerting strongest influence in residential () and institutional areas (). GWR analysis reveals pronounced spatial non-stationarity with coefficient variations exceeding 50% of mean values.
The study highlights the value of prioritizing data-sharing partnerships and more detailed data collection efforts in urban districts, where current predictive models underperform, since these areas are likely to yield the greatest marginal improvement in understanding and forecasting last-mile demand through additional variables. Furthermore, this research demonstrates significant generalization potential and added value by proving that even with limited, (mostly) publicly available data and relatively simple regression models, there is a high potential to predict last-mile demand. This model is designed to be easily transferable to other urban contexts since it can either be recalibrated by fitting it to local data in a new city or in cases of cities with a similar logistics landscape (in terms of demand characteristics, urban form and e-commerce penetration), the established models could be transferred more directly being a cost-effective and readily deployable tool for urban freight planning. International expansion opportunities are substantial with priority regions that include European cities for immediate validation, emerging markets with growing e-commerce sectors and megacities in developing economies that could test adaptability to different urban densities and logistics systems. Future international collaboration should focus on establishing standardized data collection protocols while developing local calibration methods that enable comparative analysis across different stages of logistics infrastructure development.
Looking forward, the advancement of technologies, which can ensure privacy, such as federated learning, secure multi-party computation and differential privacy could significantly improve data-sharing practices in urban logistics. These technologies would allow logistics companies to collaboratively train models on their proprietary operational data without directly exposing sensitive information; something which could lead to the deployment of robust models with collective intelligence for urban freight planning.
While this study provides significant insights and unveils the potential of using simple urban data into logistics demand there are certain limitations that pave the way for future research. The current cross-sectional analysis does not fully capture intra-day and detailed seasonal variations in delivery demand, aspects that need to be consider in order to achieve operational implications for dynamic routing and resource allocation. Operational challenges in capturing these variations include the sheer volume and granularity of real-time delivery data, the need for robust data aggregation methods (that preserve spatial and temporal detail without compromising privacy) and the computational intensity of analyzing such large and dynamic datasets. Future studies could address these challenges by extending the framework to incorporate time-stamped delivery data (e.g., hourly or even sub-hourly delivery events) and high-frequency, higher spatial resolution mobile phone signal traces to better reflect fluctuating daytime populations to enable comprehensive spatio-temporal forecasting models capable of predicting spikes and dips in demand. Secondly, the socioeconomic context of high and low R2 regions in the GWR model could be further developed with future research to explore how factors such as building morphology (e.g., building type, number of floors), age structure of the population, e-commerce penetration rates within specific demographics or tourism seasonality contribute to the observed spatial heterogeneity. Finally, while initial model performance is strong (particularly for residential and institutional areas), the persistent under-performance in commercial cores suggests the need for addressing the explanatory role of additional urban factors such as street accessibility, Points of Interest (POI) density, commercial hierarchy and significantly the vertical dimension of the built environment (e.g., building heights, number of floors and population/employee density per floor). Upon this, the exploration of non-parametric models (e.g., random forest, XGBoost) could also capture potentially nonlinear relationships beyond GWR in these complex commercial environments. Lastly, replicating this methodological approach in diverse urban settings with varying morphologies, regulatory environments and levels of e-commerce maturity will be crucial for testing the generalizability of these findings and for building a robust comparative evidence base to support sustainable last-mile logistics strategies worldwide.


