1. Introduction
Natural gas remains one of the most commonly used energy sources for household heating today, offering efficiency, reliability, and widespread availability. It is assumed that all natural gas heating options should provide relatively similar occupant comfort [
1,
2], with some specific variations (e.g., control of the temperature of water in the system [
3]). There are two primary options for utilizing natural gas for residential heating.
Local heating through direct utilization of gas in dwellings—G: Natural gas is delivered through a pipeline network directly to individual dwellings, each equipped with an independent gas boiler. This system allows households to have full control over their heating and adjust temperature levels according to personal preferences. It is commonly used in single-family homes and low-rise apartment buildings, where individual gas installations are feasible and safe. Gas is typically provided to the final consumers by a private company.
District heating through indirect utilization of gas in a heating plant—DH: Natural gas is delivered to a centralized heating facility, which then distributes heat to residential buildings through a district heating network. This option is particularly effective in densely populated urban areas with high-rise buildings, where installing individual gas connections in each dwelling would pose logistical and safety challenges. However, this system does not provide households with full control over their heating if payments are based on dwelling size rather than on actual heat consumption [
4]. District heating systems in Serbia are typically owned and managed by the local government.
A hybrid option between these two approaches is possible, with centralized heating within a single building or a few buildings using a central boiler, operating as a small district heating system owned or managed by either the local government or the building owners. However, for the final users, with respect to comfort, this option is a type of district heating.
In tall buildings, the risks associated with gas leaks and ventilation issues often make piped gas installations less practical. District heating plants mitigate these risks by centralizing gas combustion in a controlled environment. However, in all other cases, financial considerations play a crucial role in decision-making. The cost analysis compares installation expenses for the two heating systems under the same heat load, and the more cost-effective option is selected based on the comparison [
5,
6]:
Local heating (G) with directly supplied piped gas in dwellings—includes costs for pipelines, gas meters, boilers, etc.
District heating (DH) from a centralized plant (natural gas or alternative fuel)—includes the cost of insulated pipes for hot water, pumps, investments in the heating plant, etc.
Additionally, differences between the two examined systems—such as energy efficiency, maintenance costs, and fuel price fluctuations—must also be considered.
Heating load refers to the amount of power required by a properly sized heater to maintain a comfortable indoor temperature on the coldest days of the year. This load depends on urban density (i.e., the number of buildings within a given area) and building height [
7,
8,
9,
10,
11,
12,
13,
14,
15,
16]. For buildings of identical size, it primarily depends on the thermal insulation of dwellings, and is given as the basic heat load of a dwelling in W/m
2. Based on this, the heat load of the whole settlement can be calculated and is typically given in this study in MW/km
2.
For the purpose of this study, the typology of buildings and topology of settlements (spatial distribution of urban buildings) suitable for natural gas heating in Serbia and Czechia have been examined. Both Serbia and the Czech Republic have well-established natural gas networks that support both direct local heating with piped gas (G) and indirect district heating systems (DH). Typical housing configurations in these two countries have been analyzed to determine the most suitable heating approach for different urban settings.
This study examines examples of typical buildings in the urban environments of both observed countries, with a particular focus on Belgrade and Niš in Serbia and Ostrava in the Czech Republic. Compared to Niš, which has around 250,000 inhabitants and a population density of approximately 975 inhabitants/km
2, and Ostrava, with around 280,000 inhabitants and a density of about 1300 inhabitants/km
2, Belgrade is significantly larger [
17], with 1.2 million inhabitants, and more densely populated, with around 3000 inhabitants/km
2. Belgrade is the capital of Serbia, and Belgrade is the only town in Europe with more than 500,000 inhabitants with public transport that is free of charge for all.
This article is structured as follows:
Introduction.
Brief Overview of the Energy Sectors in Serbia and Czechia—focuses on natural gas and recent developments with regard to environmental pollution and natural gas prices for households in both countries.
Methodology for Selecting an Appropriate Natural Gas Heating System—describes the criteria for choosing between direct heating and district heating based on urban parameters.
Results: Building Typologies and Urban Topologies—identifies the types of buildings and their position within the settlement that are best suited for each of the two examined heating options, with a short analysis of gas and district heating, focusing on Belgrade and Niš in Serbia and Ostrava in Czechia.
Conclusions.
It also includes one opinion from an inhabitant of each observed town—Belgrade, Niš, and Ostrava—regarding their personal experiences and overall impressions of natural gas heating in their communities. These opinions are provided in
Appendix A. All three interviewees were chosen from those who are familiar with energy trends worldwide and domestically.
All data and analyses for Serbia exclude the territory of the Autonomous Province of Kosovo and Metohija, which remains temporarily under United Nations administration under Security Council Resolution 1244/1999, pending its future reintegration into the Serbian energy system [
18,
19,
20]. The terms “Czechia” and “the Czech Republic” are used interchangeably throughout this text.
2. Brief Overview of the Energy Sectors in Serbia and Czechia
The energy landscapes in both Serbia and the Czech Republic have undergone changes in recent years, driven by factors such as energy security concerns mostly caused by market fluctuations due to the COVID-19 Pandemic [
21,
22], the Russia–Ukraine war, policies aimed at reducing carbon emissions, concentration levels of fine particulate matter, etc. The role of natural gas in residential heating is being reevaluated in this study in light of these changes, with increasing interest in energy diversification and efficiency improvements. Furthermore, the integration of renewable energy sources and advancements in heating technologies are influencing the long-term viability of natural gas-based systems.
The energy sector of Czechia, in terms of the total primary energy supply, is around 2.66 times larger than that in Serbia. However, in terms of percentages, the share of natural gas is almost identical and accounts for slightly below 15% (resulting in around 2.7 times higher consumption of natural gas in the Czech Republic compared to Serbia). Both can be seen in
Figure 1 (where the donut diagram for the Czech Republic should be 2.66 times larger compared to the equivalent diagram for Serbia).
Further details about the energy sectors of Serbia and Czechia are compared in
Table 1.
Natural gas from the total primary supply is not only used for direct residential use (G; cooking and heating in households) and indirectly through district heating systems (DH) but also for industry, as fuel for vehicles, production of electricity, etc. District heating systems typically use natural gas, but not always (e.g., 78.1% of all district heating systems in Serbia use natural gas, 13.3% coal, 6.4% liquid fuel, and 2.2% various types of fuel based on wood, while district heating in Ostrava uses coal [
28]).
Table 1.
Comparison of the energy sectors * in Serbia and Czechia: Focus on natural gas heating.
Table 1.
Comparison of the energy sectors * in Serbia and Czechia: Focus on natural gas heating.
| | Serbia | Czechia |
|---|
| Population | 6.6 million | 10.5 million |
| Total dwellings | 3,613,352 | 4,480,139 |
| -Dwellings with district heating | 718,467 | 1,497,007 |
| -Dwellings with piped gas | 404,405 | 3,075,471 |
| Total primary energy supply | Czechia/Serbia = 2.65 |
| Total primary natural gas supply | Czechia/Serbia = 2.74 |
| Total final energy consumption in residential sector | 143,456 TJ | 286,792 TJ |
| Percentage of residential sector in total energy consumption | 34.1% | 25.9% |
| Total primary energy supply per capita | 100.98 GJ (28.05 MWh) | 169.31 GJ (47.03 MWh) |
| Total final energy consumption in residential sector per capita | 21.58 GJ (5.99 MWh) | 27.25 GJ (7.57 MWh) |
| Change in natural gas supply 2000–2023 | +51% | −23% |
| Domestic natural gas production | 10,931 TJ | 5576 TJ |
| Share of domestic gas production in 2022 | 11.3% | 2.3% |
| Change in domestic gas production 2000–2023 | −58% | −21% |
| Share of direct residential use of natural gas (of total gas) in 2022 | 19.9% | 38.3% |
The Czech Republic has a longer tradition of gas use than Serbia. Only the part of Serbia located north of the Sava and Danube rivers has a similar tradition to that of the Czech Republic (before 1918, when this part of Serbia was liberated and independent Czechoslovakia was established, both territories were part of the Austro-Hungarian Empire), which is rooted in the use of city (or coal) gas from the 19th century [
32,
33,
34]. Natural gas consists primarily of methane, whereas the obsolete city gas, which was mainly produced from coal, consisted primarily of carbon monoxide and is now abandoned. In the future, gas for heating and cooking will be predominantly hydrogen, which can be produced, among other sources, from communal waste [
35]. A mixture of natural gas and hydrogen is also envisaged for use [
36].
Residential energy consumption is largely driven by space heating and, to a lesser extent, by appliances. It depends on various factors, including the type of dwelling (multi-family apartment residential buildings vs. single-family houses), climate zones, location (rural vs. urban), etc. These factors explain differences in household energy consumption at the national level. For example, the Czech Republic is located farther north in Europe than Serbia and therefore has a colder climate.
Inter alia, as a European Union member state, Czechia received approval from the European Commission in June 2023 for a Czech program worth approximately EUR 718 million to support companies affected by rising heating costs due to the Russia–Ukraine war [
37]. Additionally, in July 2023, an additional EUR 5 billion was approved to compensate major energy producers in the Czech Republic for high energy prices [
38], reduce electricity demand, support decarbonization, and increase the use of renewable energy sources. Serbia, as a European Union candidate country, has also received support from the European Commission, including financing for an interconnector with Bulgaria [
39].
More details about the energy sectors of Serbia and the Czech Republic will be provided, with a focus on recent changes, environmental protection, and natural gas prices for households.
2.1. Serbia
2.1.1. Gas—Serbia
Serbia is heavily reliant on natural gas imported from Russia, importing the majority of its supply under a long-term contract with Russian Gazprom. Domestic production is limited. Gas arrives from Russia through the TurkStream pipeline, with an additional amount from Azerbaijan through the European Union-financed interconnector with Bulgaria [
40,
41]. Serbia does not follow Western sanctions imposed against energy supplied from Russia, ensuring stable gas deliveries. Serbia is also not on the Russian list of unfriendly countries, and payments in RUB are not mandatory. Previously, before the Russia–Ukraine war, imported natural gas from Russia was priced at USD 270 per 1000 cubic meters. Under a new three-year contract, the price is linked to oil prices, ranging from USD 310 to USD 408 per 1000 cubic meters. Russia provides around 2.2 billion cubic meters annually, with Serbia purchasing an additional 0.8 billion on the free market. Rising prices and economic conditions have impacted consumption. To reduce dependency on Russian gas and to avoid problems caused by the overall situation caused by the war, Serbia signed an agreement with Azerbaijan in 2023 to purchase 400 million cubic meters of gas annually starting in 2024.
Domestically, Serbia’s Energy Agency regulates prices, with household gas priced at USD 0.0115/MJ ≈ USD 0.0415/kWh (excluding tax) as of August 2023. Between August 2022 and May 2024, gas prices for households and industry rose by approximately 64%, with multiple increases of around 10% at various intervals.
2.1.2. Oil—Serbia
Serbia, a landlocked country, historically depended on Russian crude oil, which was primarily supplied from the Adriatic coast through the JANAF pipeline (ex. Yugoslav pipeline) through Croatia [
42]. Until Western countries imposed sanctions on Russian oil, Serbia’s sole refinery, operated by the Serbian national company NIS, majority-owned by Gazprom Neft, sourced most of its crude from Russia. Recently, Serbia was forced to diversify its supply, increasingly importing oil from Iraq and other non-Russian sources. However, the country still relies on JANAF for transport, making it vulnerable to geopolitical shifts, such as recently introduced US sanctions against Russian partial ownership of NIS [
43]. To enhance energy security, Serbia is exploring alternative supply routes, including potential connections with Hungary’s pipeline network (the Družba pipeline [
44]).
Despite diversification efforts, Russian influence in Serbia’s oil sector remains strong due to Gazprom’s stake in NIS and long-standing ties between the two nations [
45,
46].
In response to the global energy crisis, Serbia has imposed legal restrictions on vehicle fuel prices (the maximum price is capped and is subject to change each Friday). The fuel price in Serbia is higher compared with the neighboring countries.
2.1.3. Coal—Serbia
In Serbia, coal remains the dominant energy source, with coal-fired power plants generating around 70% of the country’s electricity [
47]. The country relies on domestic lignite reserves, primarily extracted from the Kolubara and Kostolac basins, making Serbia largely self-sufficient in coal supply. Due to energy security concerns and increasing electricity demand, Serbia has continued investing in coal-based energy infrastructure, despite environmental concerns. While some discussions on transitioning to renewable energy exist, coal remains central to Serbia’s energy strategy. Recent disruptions in domestic coal production in winter 2021/2022, caused by bad management in mining, highlighted the sector’s vulnerabilities, prompting increased efforts to modernize mining operations.
The large thermal power plant, “Nikola Tesla”, located near Belgrade and fueled by lignite, is a source of pollution. Also, deployment of a heat pipeline from the Nikola Tesla thermal power plant to Belgrade is envisaged [
48].
2.1.4. Nuclear—Serbia
Serbia does not have nuclear power plants, relying primarily on coal, hydropower, and natural gas for electricity generation. However, the country has shown renewed interest in nuclear energy, with discussions about potential cooperation with France and Hungary for the development of nuclear capacities, especially to explore small modular reactors (SMRs) as a possible future energy source. Additionally, Serbia has some historical ties to nuclear research, having once operated a research reactor in Vinča. The reactor was decommissioned in the 1960s, while a full embargo was imposed in the 1980s following the Chernobyl accident in the USSR. While no definitive plans exist, the ongoing energy crisis and regional developments have sparked debates about nuclear energy as a long-term solution for Serbia’s energy security and diversification [
49].
2.1.5. Electricity—Serbia
The average price of electric energy for households was USD 0.0286/MJ ≈ USD 0.103/kWh in December 2022, including the cost of power, distribution, and taxes. The dynamics of electricity prices for households are similar to those for natural gas, at 8% in January 2023, an additional 8% in May 2023, another 8% in November 2023, and finally 8% in May 2024. It is mainly produced from coal [
50]. The price of electricity is affordable, but increased consumption is discouraged due to significantly higher rates beyond a certain usage limit. However, electricity remains considerably more expensive than natural gas in any case.
2.2. Czechia
2.2.1. Gas—Czechia
The prices of natural gas and electricity for households, public institutions, and small companies have been capped at USD 0.0166/MJ ≈ 6 CZK/kWh for electricity and USD 0.0083/MJ ≈ 3 CZK/kWh for gas. This cap applies to 80% of pre-Russia–Ukraine war consumption to encourage energy savings (CZK 1 ≈ EUR 0.04). Measures to promote savings include recommendations to reduce temperatures in public offices by 1.5–2 °C.
Additionally, there is a shift from Russian gas to liquefied natural gas (LNG), with imports accounting for approximately one-third of the Czech Republic’s annual gas demand. This strategic move aims to enhance the country’s gas supply options by introducing diversification [
51,
52]. Czechia does not have domestic production of natural gas. Due to the substantial increase in gas prices caused by the Russia–Ukraine war, gas consumption in the Czech Republic has seen an annual decrease of around 15% compared to the pre-war situation. This reduction has been substantial, moving from a 97% dependence on Russian gas to a mere 3–4% [
53]. Currently, all imported amounts of natural gas come through Germany, with discussions underway regarding the potential Czech–Polish gas pipeline known as Stork II. Notably, gas supplies are no longer routed through Slovakia, which was previously the sole pathway for Russian gas imports through pipelines.
In order to decrease dependence on Russian gas, a focus on boiler subsidy systems will move from gas to heat pumps, pellets, and solar energy. The authorities will only reimburse gas boilers if they were installed in households between January 2021 and the end of April 2022.
2.2.2. Oil—Czechia
Linked to the Družba pipeline, the Czech Republic is a landlocked nation that historically relied on this pipeline for the import of crude oil from Russia. Up until recently, the country’s refineries exclusively sourced their crude oil from Russia, Azerbaijan, and Kazakhstan. In an effort to safeguard the Czech Republic from potential severe disruptions, the European Union granted it a special exception to the prohibition on importing Russian oil through this pipeline. Remarkably, even now, about half of the Czech Republic’s oil consumption is met through this pipeline. An alternative solution for oil procurement is envisioned in the extension of the Transalpine Pipeline (TAL) to the Czech Republic. The TAL pipeline [
54], spanning 750 km and originally established in 1967, connects Italy, Austria, and Germany.
Car manufacturers like Škoda are experiencing significant setbacks due to the abrupt halt of business activities in Russia and the shortage of crucial components from Ukrainian suppliers [
55]. Gasoline and diesel are more affordable in all the neighboring nations surrounding the Czech Republic. A longstanding tradition among Czech residents living near the national border is to opt for purchasing fuels, groceries, and consumer products, particularly in Poland. This has gained further popularity, particularly since the onset of the Russia–Ukraine conflict and the subsequent rise in prices [
56].
2.2.3. Coal—Czechia
In the Czech Republic, coal-fired power plants are responsible for generating nearly half of the country’s total energy [
57,
58,
59]. Interestingly, the notion of revitalizing certain coal power plants is gaining traction not only within the Czech Republic but also throughout the European Union, following the situation caused by the Russia–Ukraine war. In an effort to curb reliance on Russian coal, the European Union enacted a ban on coal imports from Russia starting from August 2022. This ban has prompted the need to find alternatives for the substantial 49 million tons of Russian coal that was imported in 2020, valued at approximately EUR 8 billion. Consequently, to fulfil this significant demand, the Czech Republic has expanded its coal mining activities in the Ostrava region (where mining activities had been significant [
60], but recently practically ceased). Caused by high energy prices, Czech households increased their use of lignite and brown coal by 35%, the cheapest, most unhealthy, and most energy-inefficient form of solid fuel [
61]. Although it planned to stop the exploitation of coal in 2023, these plans have been postponed due to the ongoing situation related to the Russia–Ukraine war. The deadline for the replacement of old boilers on solid fuels for heating in private homes was also postponed.
District heating systems in Ostrava rely on coal.
2.2.4. Nuclear—Czechia
Following the situation caused by the Russia–Ukraine war, nuclear fuel for Soviet-built reactors in the Dukovany nuclear power plant will be provided by the United States and not by the Russian Federation [
62]. The Czech government excluded Russia and China from the tender to build an extension of the Dukovany plant. Also, United States and French technology will be used for nuclear fuel assemblies in the Temelín nuclear power plant. The ongoing Russia–Ukraine war has revived some ideas, such as constructing a 40 km long pipeline for hot water for heating in Brno from the Dukovany nuclear power plant, which was planned for the 2010s but was not realized, etc.
2.2.5. Electricity—Czechia
Some problems with the prices of electric energy began even before the Russia–Ukraine war (e.g., Lumius, an energy contractor, declared bankruptcy in January 2022), and large consumers of electricity had to reduce operations significantly (e.g., IT4Innovations, a national supercomputing center, used to run below full capacity during a certain period) [
63].
2.3. Environmental Pollution
Natural gas is widely used for heating because it is cost-effective, efficient, and readily available. It provides consistent and reliable heat, making it a practical choice for homes and businesses. Compared to electricity or oil, natural gas heating systems tend to have lower operating costs and higher energy efficiency. Additionally, natural gas burns cleaner than coal or oil [
64], producing fewer emissions and contributing less to air pollution [
65,
66]. Its convenience, with direct pipeline delivery, also eliminates the need for fuel storage.
One of the reasons for the shift toward natural gas-oriented heating was that it does not contain particulate matter (mostly PM2.5), long-term exposure to which causes the most serious health effects [
67,
68,
69]. The concentration of PM2.5 increases significantly during winter months if solid fuels, such as coal, are used for heating. The trend of PM2.5 concentrations in the towns observed in this study is presented in
Table 2.
From
Table 2, it can be seen that Ostrava has managed to improve air quality, which was previously poor [
72,
73], while Niš still experiences similar problems to those Ostrava faced until a few years ago. Belgrade has a similar problem, likely caused by individual heating with solid fuels, which is still common, as well as the presence of large power plants fueled by low-quality coal in the wider territory of the city.
However, in general, if the model in this study is set so that both evaluated gas heating options consume approximately the same amount of gas to produce the same amount of heat, then they should contribute equally to environmental pollution [
74,
75,
76,
77]. The district heating option features centralized combustion, where emissions are released through a relatively tall chimney, dispersing pollutants higher in the atmosphere and over a larger area. In contrast, the individual heating option involves local gas combustion, directly impacting the surrounding community with emissions. Thus, environmental protection does not play a crucial role in the selection between the two options. Additionally, a future switch to non-carbon alternative fuels [
78,
79,
80], such as hydrogen [
81], is feasible for both options with the necessary upgrades to boilers and equipment.
Pollution in Belgrade arrives most likely through individual heating of houses and from large power plants in the wider Belgrade region in Obrenovac fueled by lignite. Niš also has a problem with individual heating (
Figure 2). Ostrava still uses coal for district heating.
2.4. Prices of Natural Gas
Natural gas prices for households [
82,
83,
84,
85,
86,
87] are generally higher in Czechia than in Serbia, although salaries in Czechia are also higher. However, following the outbreak of the war between Russia and Ukraine, Serbia managed to keep the price of natural gas stable, while the price in the Czech Republic tripled. Such a high price of natural gas in the Czech Republic nearly matches the price of electricity in Serbia.
From 2018 to 2024, average household natural gas prices, including VAT, showed a significant contrast between Serbia and Czechia. In Serbia, prices remained relatively low and stable, ranging from approximately EUR 0.034/kWh (USD 0.0094/MJ) in 2018 to EUR 0.043/kWh (EUR 0.0119/MJ) in 2024, with only modest increases observed after 2022. This pricing stability reflects the country’s regulated energy market and long-term supply arrangements. In contrast, Czechia experienced a higher and more volatile pricing trajectory. Between 2018 and 2021, household gas prices averaged around EUR 0.110/kWh (EUR 0.0305/MJ) [
88] but surged sharply to approximately EUR 0.275/kWh (EUR 0.0763/MJ) in 2022 due to the energy crisis. Although prices began to stabilize in subsequent years, they remained elevated at around EUR 0.230/kWh (EUR 0.0638/MJ) in 2023 and 2024. These differences highlight the influence of national energy policies, market liberalization, and geopolitical factors on end-user gas pricing and are critical in assessing the economic viability of heating options in different regional contexts.
Trends in natural gas prices are similar to those of electricity prices.
3. Methodology for Selecting an Appropriate Natural Gas Heating System
If safety and environmental issues are solved, then economic evaluation plays a crucial role in choosing between two competing natural gas heating systems [
89]: local heating with piped gas (G) vs. district heating (DH). Given the diversity of settlements in terms of urban density, i.e., topology of a settlement (the spatial disposal of buildings in a certain area) and size and type of buildings, i.e., typology, a model has been developed to account for these variations. The model identifies smaller parts of a settlement with similar characteristics and represents them using predefined theoretical urban areas. For each theoretical urban area, the costs of both systems were assessed and compared. The results are used to create a matrix that indicates the preferred heating option—local (G), district (DH), or a hybrid solution—based on a cost analysis. This matrix can serve as a valuable tool for making initial decisions about heating system selection.
This methodological approach allows for a systematic evaluation of heating options across diverse urban configurations by reducing real-world complexity into a manageable set of representative urban forms. The following sections detail the structure of this model: first, by introducing the predefined theoretical urban areas used to classify settlement segments based on typological and topological characteristics; and second, by presenting the cost analysis comparing local and district heating systems within each of these defined contexts.
3.1. Predefined Theoretical Urban Areas
Which natural gas heating system—piped gas with a boiler [
90] installed in each dwelling (G) or district heating (DH)—is optimal for a specific urban area? To provide an adequate answer, a model is established [
5,
6,
91] to systematically evaluate different concentrations of heat demand within an area. The heat demand for one settlement is the sum of the heat demands of buildings, which depend on factors such as the size and characteristics of buildings, as well as the number of buildings. However, this study does not deal directly with heat demands but rather with heat load. Heat load is the power used by a heater of sufficient size to keep the temperature comfortable on the coldest days of the year and basically depends on the thermal insulation of a dwelling, as given in
Table 3. It is expressed in this study in W/m
2, while for a settlement, it is given in MW/km
2 (see step 3 of
Section 3.1.1.).
For the purpose of analysis, settlements should be preselected based on their distance from a heating plant (which may not necessarily be fueled by gas) and their proximity to natural gas supply nodes, which serve as sources for a future distribution network. If both options are available, the settlement is suitable for further evaluation. These settlements vary in terms of inhabitant density, building size and number, building type, construction quality, insulation [
93,
94], and distance between buildings. A detailed cost analysis of both systems for every individual settlement is not a viable option. Instead, a universal and simple model should be developed to facilitate selection between the two options.
To achieve this, the concept of predefined theoretical urban areas is introduced as a means of modeling real settlements with different urban characteristics. These predefined theoretical urban areas serve as representative models of actual settlements and form the basis for further analysis.
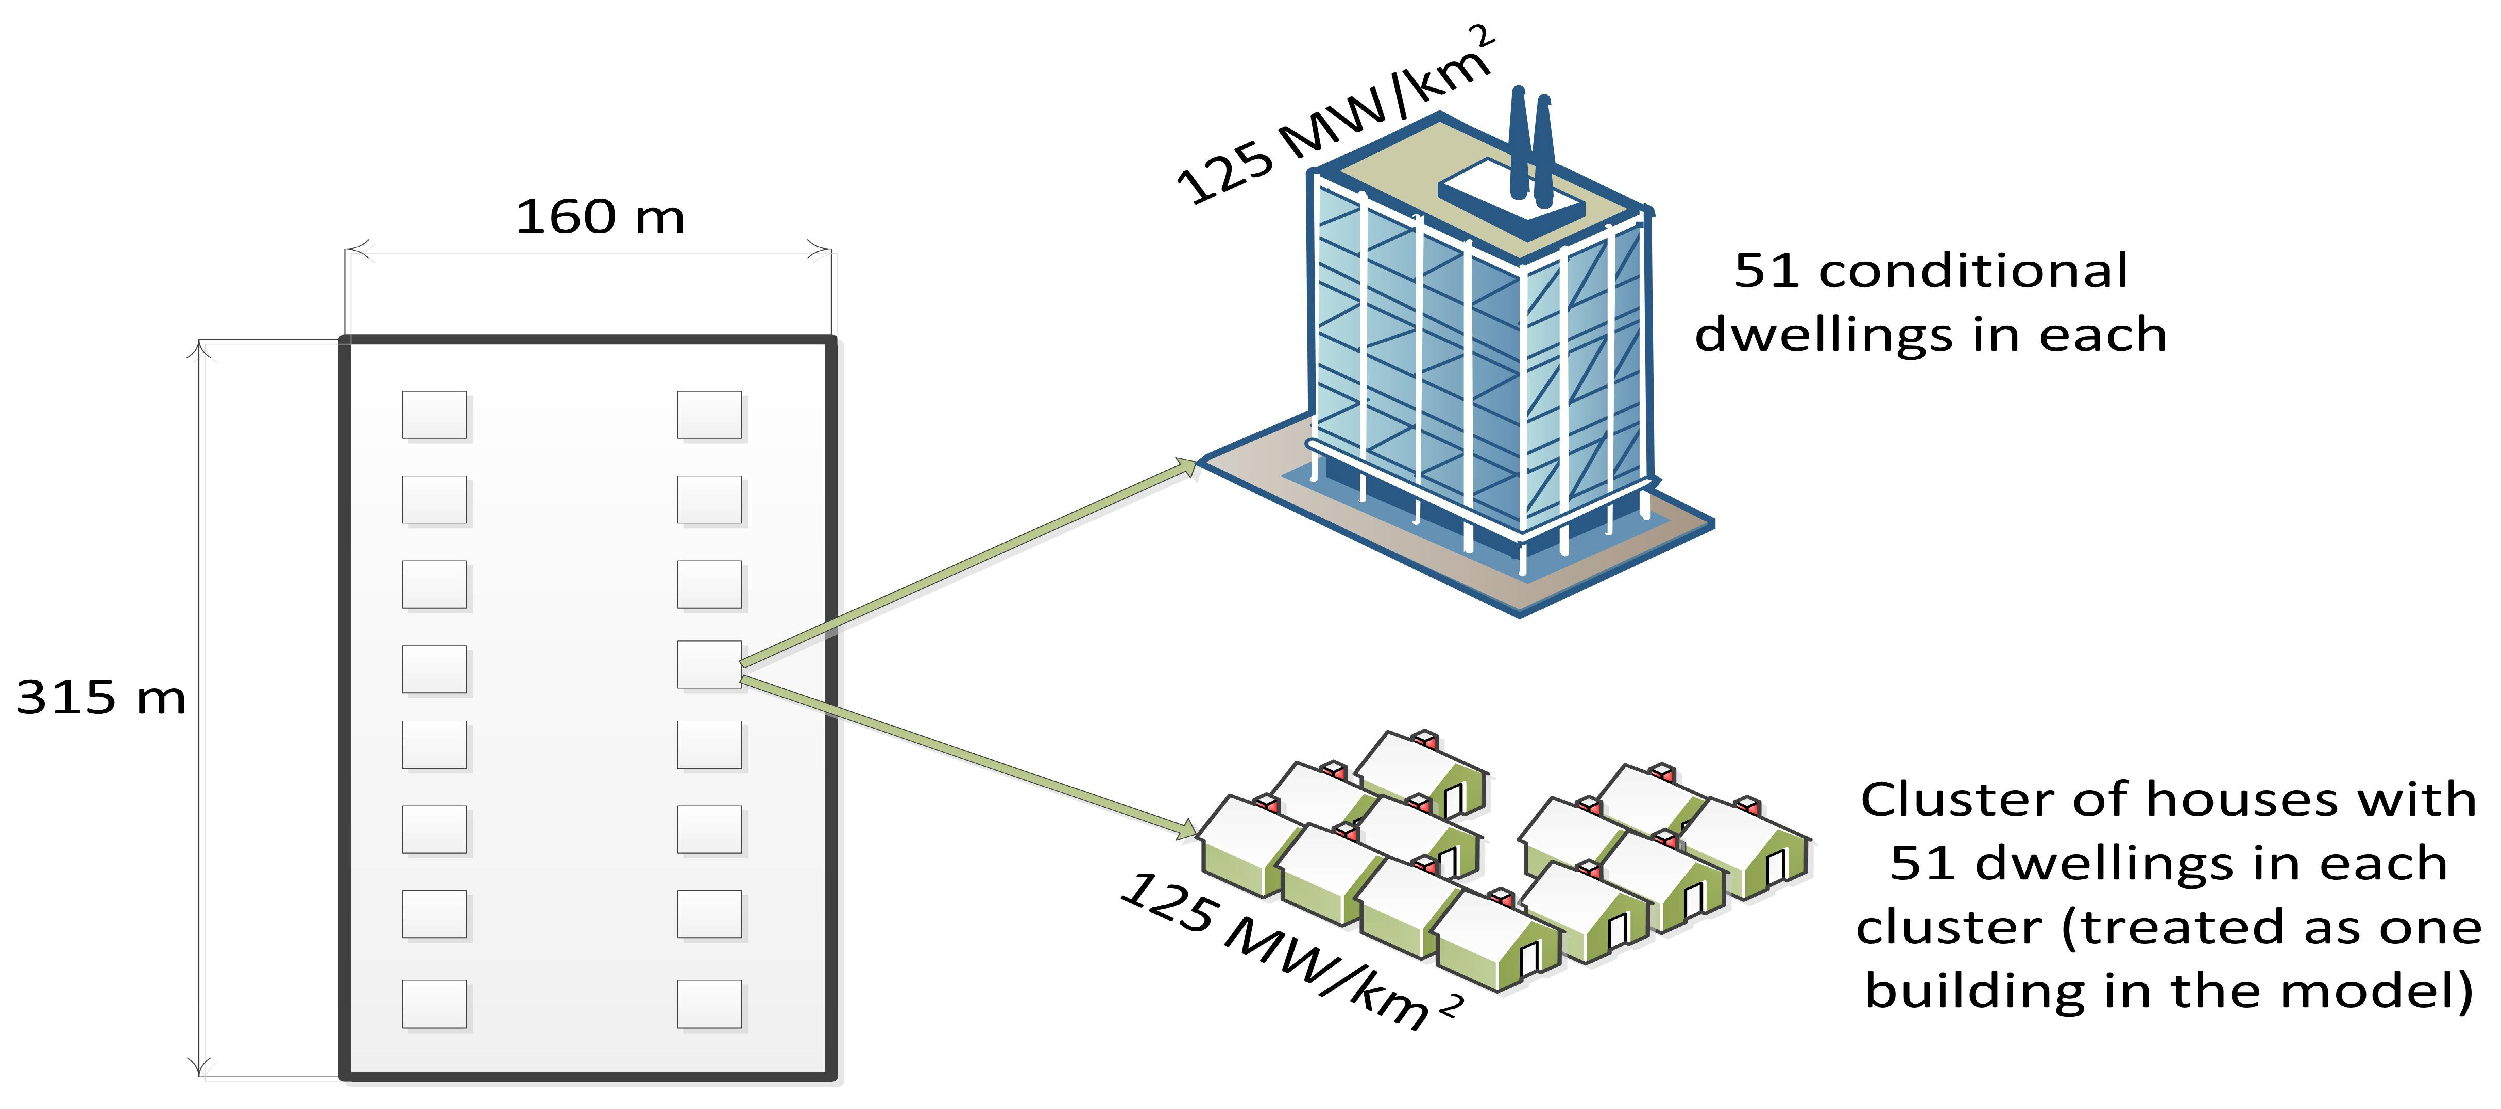
The study defines a basic urban area of 50,000 m
2 (5 hectares ≈ 160 m × 315 m)—
Figure 3:
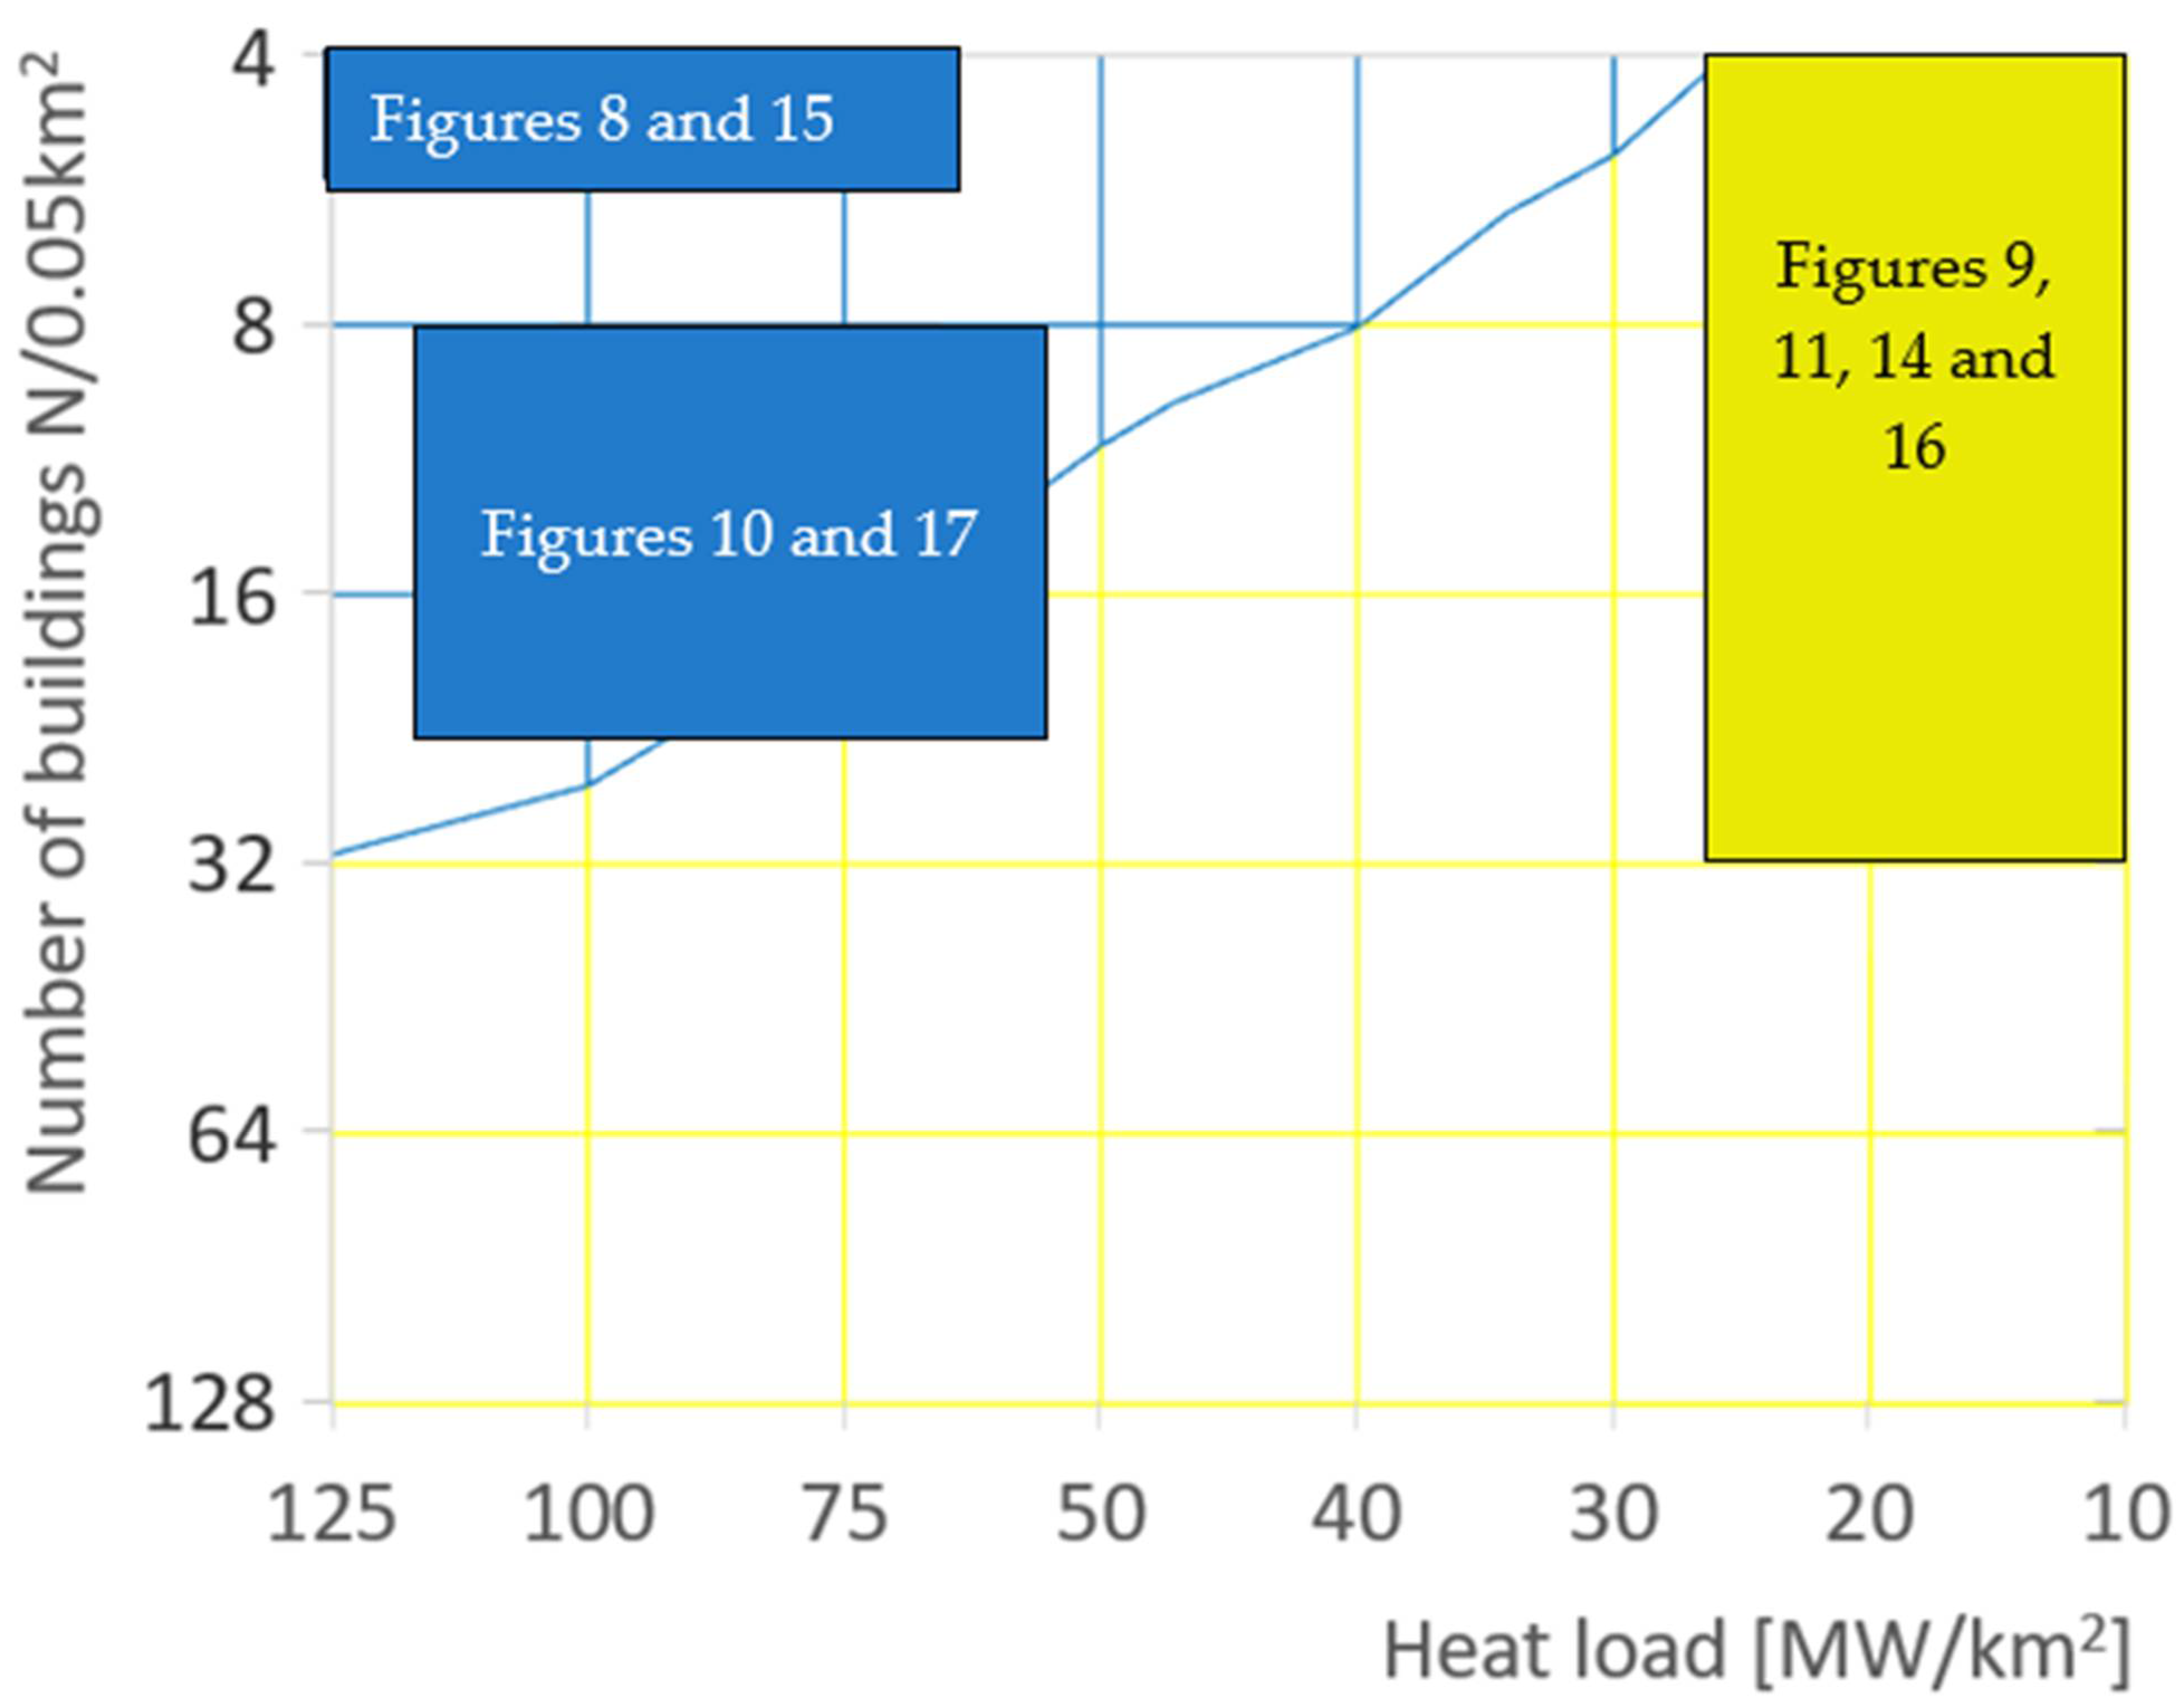
Urban topology. Each predefined urban area is assigned a specific number of buildings: 4, 8, 16, 32, 64, or 128, where lower values represent sparsely built-up areas, while higher values correspond to densely built-up areas.
Building typology. Building sizes are determined based on heat load requirements, and the selected heat loads for this study are 10, 20, 30, 40, 50, 75, 100, and 125 MW/km2, increasing from smaller to larger buildings. Buildings within a single theoretical urban area must be of uniform size—mixed building sizes are not allowed.
Figure 3 gives the following examples (mixing of different buildings on one predefined urban area is not allowed):
A predefined theoretical urban area with four buildings, where each is a small house, and the total heat load of 10 MW/km2 is shared among them.
A predefined theoretical urban area with 16 buildings, where each is a small house, and the total heat load of 10 MW/km2 is shared among them.
A larger urban area can be created by combining multiple nominal urban areas, each with different numbers and sizes of buildings.
Within the model, six different predefined theoretical urban areas exist, 4, 8, 16, 32, 64, or 128, with eight possible heat loads, 10, 20, 30, 40, 50, 75, 100, or 125 MW/km
2—which gives a total of 48 combinations for each quality of thermal insulation (in the example from
Section 3.1.1., for bad insulation, the corresponding heat load is 119 W/m
2). Based on the assumed basic heat load, the number of theoretical dwellings is assigned to the model, as given in
Table 4.
The theoretical dwellings in this study are sized at 60 m
2. The total heat loads of predefined theoretical urban areas correspond to a certain number of theoretical dwellings of 60 m
2, as given in
Table 4, and they are shared among all buildings in that area. For example, if one building contains one dwelling of 120 m
2, for the purpose of this study it has two theoretical dwellings (with a heat load of 119 W/m
2, the total heat load of such a dwelling is 14.2 kW; with a heat load of 64 W/m
2, the total heat load of such a dwelling is 7.68 kW, etc.).
The number of theoretical dwellings per building for a building heat load of 64 W/m
2 is given in
Table 5. This matrix will be used for the identification of typical buildings in Serbia and Czechia in
Section 4.
3.1.1. An Illustrative Example for the Use of Theoretical Urban Areas
To use the predefined theoretical urban areas with the proposed methodology, an illustrative example is given in
Figure 4.
Step 1: Identifying similar buildings in a settlement. The first step involves identifying a section of the settlement with approximately similar buildings. For example, if 42 similar buildings are spread across 123 ha, the average number of buildings per urban area is calculated as 123:42 = 50:x→x = 17.07. Since the theoretical urban area should contain a predefined number of buildings, an area with 16 buildings is considered suitable.
Step 2: Defining building size. Building size is another critical factor. It is defined by the number of theoretical dwellings that can fit into one building. In this model, a theoretical dwelling is assumed to be 60 m2. For instance, if a real building contains 16 dwellings of 40 m2, 18 of 80 m2, and 10 of 100 m2, then the total area of all dwellings is (16 × 40) + (18 × 80) + (10 × 100) = 3080 m2 per building. Dividing this by the size of a theoretical dwelling gives 3080 m2/60 m2 = 51.3 theoretical dwellings.
Step 3: Calculating heat load. In our example, the theoretical urban area contains 16 buildings, each with 51 theoretical dwellings, leading to a total of 16 × 51 = 816 theoretical dwellings. If the heat load is assumed to be 119 W/m
2 (very bad insulation [
93]), then it is 816 × 60 m
2 × 119 W/m
2 = 5.8 MW for the entire predefined theoretical urban area of 50,000 m
2 (i.e., the heat load is around 116.5 MW/km
2).
Step 4: Interpreting the results. Since the highest heat load in the model is 125 MW/km2, this example suggests 16 large buildings, each with 51 theoretical dwellings, on the predefined theoretical urban area of 50,000 m2 (5 ha).
3.2. Cost Analysis—Evaluating Two Systems in Predefined Urban Areas
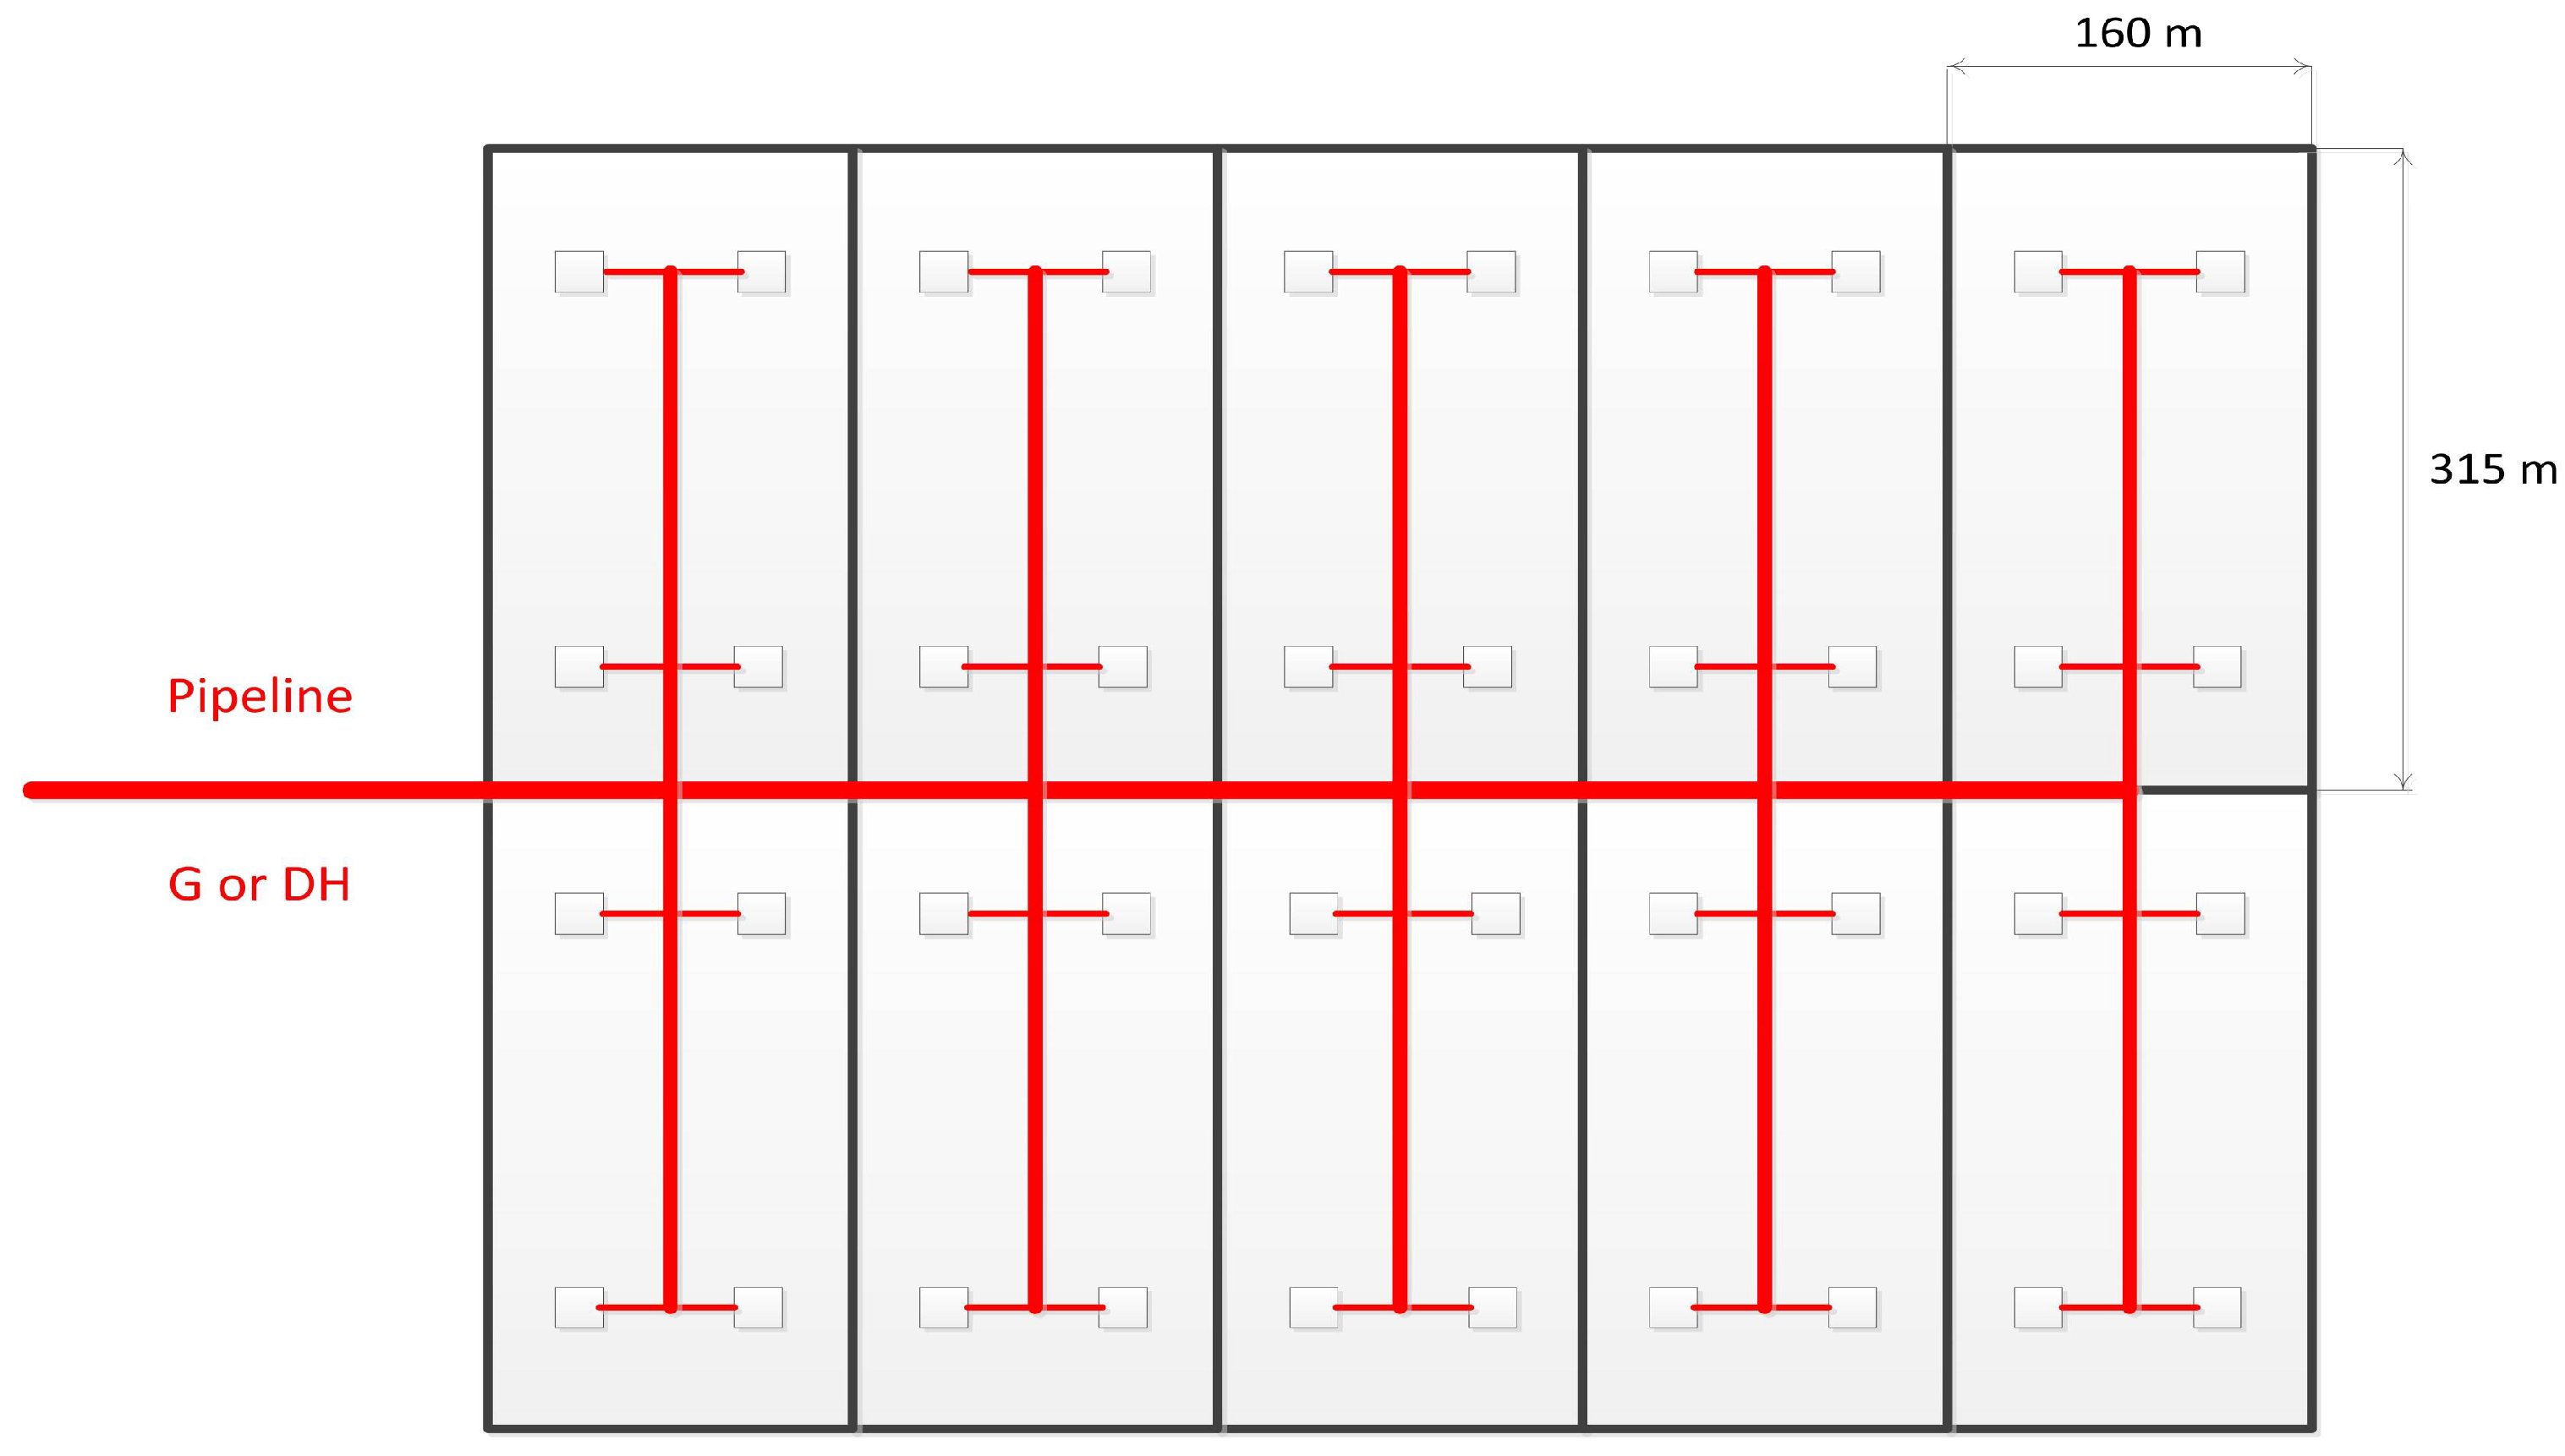
For cost comparison, a tenfold larger area is analyzed by combining 10 identical predefined theoretical urban areas, totaling 500,000 m
2 (50 hectares), as illustrated in
Figure 5.
Figure 5 represents a topology where each five-hectare unit contains four buildings, resulting in 40 buildings across 50 ha. The red line in
Figure 5 indicates the pipeline, one of several infrastructure components subject to cost calculation and comparison. Costs vary not only by building topology and heat load but also between the two systems due to differences in required infrastructure. Ultimately, the more cost-effective option prevails. This approach ensures a comprehensive cost comparison of district heating and gas distribution networks across different urban topologies and heat load scenarios.
Aside from the illustrative example from
Figure 5, the same methodology applies to all other topologies, considering 8, 16, 32, 64, or 128 buildings for a given heat load, which depends on the thermal insulation of dwellings. The number of theoretical dwellings is determined based on heat loads, representing different insulation levels (e.g., 119 W/m
2, 95 W/m
2, and 64 W/m
2, as outlined in
Table 4, or any other estimated values). The analysis includes eight different heat loads: 10, 20, 30, 40, 50, 75, 100, and 125 MW/km
2.
For a single insulation level, this results in 48 combinations (6 × 8), all requiring cost evaluation for both piped gas distribution and district heating systems. For each heat load, an appropriate pipeline diameter is assigned for both systems. While the total pipeline length remains constant within a given topology, increasing heat loads (from 10 to 125 MW/km
2) require larger pipe diameters (detailed lengths for each diameter for every 48 combinations needs to be assessed, as was carried out in [
5], and one example is given in
Table 6, the lengths of pipes for a theoretical urban segment of 50 ha), leading to higher costs. Other costs for both systems per dwelling must be also evaluated, specifically for G for direct use of piped gas in dwellings and DH for district heating systems (with a discount rate of 10% in the calculation for a period of 25 and replacement of some elements of the systems), as can be seen in
Table 7. Estimation of the real prices of components in
Table 6 is not an easy task, and only the differences between the two systems are important. Although the technical parameters and related costs are not easy to evaluate, the tool from [
5] was used for a quick overview of the ongoing situation, for which purpose it was developed in the first place.
Table 6.
Lengths of pipes in meters—structure per diameter (DH=2×G because of the return of water to the heat plant); example (one of the total 48 cases).
Table 6.
Lengths of pipes in meters—structure per diameter (DH=2×G because of the return of water to the heat plant); example (one of the total 48 cases).
| G | Heat Load (MW/km2) |
|---|
| Number of Buildings on 5 ha | Diameter of Gas Pipes | 10 | 20 | 30 | 40 | 50 | 75 | 100 | 125 |
|---|
| 16 | 25 | 6400 | 6400 | 6794 | 6794 | 6873 | 7188 | 7739 | 9314 |
| 32 | 394 | 394 | 315 | 709 | 945 | 1103 | 1575 | 39 |
| 40 | 315 | 394 | 473 | 788 | 1103 | 1063 | 39 | 160 |
| 50 | 473 | 788 | 866 | 1063 | 433 | | 160 | 160 |
| 63 | 788 | 1024 | 906 | | | 160 | | 320 |
| 75 | 945 | 354 | | 160 | 160 | 160 | 320 | 80 |
| 90 | 39 | | 160 | | 160 | | 160 | |
| 110 | 160 | 160 | | 160 | 160 | 320 | 80 | |
| 125 | | | 160 | 160 | 160 | 80 | | |
| 140 | | 160 | | 160 | 80 | | | |
| 160 | 160 | | 160 | 80 | | | | |
| 180 | | 160 | 240 | | | | | |
| 200 | 160 | 160 | | | | | | |
| 225 | 160 | 80 | | | | | | |
| 250 | 80 | | | | | | | |
| | Σ | 20,146 | 20,146 | 20,146 | 20,146 | 20,146 | 20,146 | 20,146 | 20,146 |
| DH | Heat load (MW/km2) |
| Number of buildings on 5 ha | Diameter of District Heating Pipes | 10 | 20 | 30 | 40 | 50 | 75 | 100 | 125 |
| 16 | 20 | | | | | | | | 12,800 |
| 25 | | | | | | 12,800 | 12,800 | 788 |
| 32 | | | 12,800 | 12,800 | 12,800 | 788 | 788 | 1575 |
| 40 | 12,800 | 12,800 | 788 | 788 | 788 | 788 | 1575 | 3150 |
| 50 | | 788 | | 788 | 788 | 788 | 1575 | 394 |
| 65 | 788 | | 788 | 788 | 1575 | 2363 | 1969 | 320 |
| 80 | 1575 | 1575 | 2363 | 3150 | 2756 | 1181 | 320 | 320 |
| 100 | 2363 | 3150 | 1969 | 394 | 320 | 320 | 320 | 640 |
| 125 | 1181 | 394 | | 320 | | 320 | 320 | 160 |
| 150 | | 320 | 320 | 320 | 320 | 320 | 480 | |
| 200 | 320 | 320 | 640 | 640 | 800 | 480 | | |
| 250 | 320 | 320 | 320 | 160 | | | | |
| 300 | 320 | 320 | 160 | | | | | |
| 350 | 320 | 160 | | | | | | |
| 400 | 160 | | | | | | | |
| 450 | | | | | | | | |
| 500 | | | | | | | | |
| | Σ | 20,146 | 20,146 | 20,146 | 20,146 | 20,146 | 20,146 | 20,146 | 20,146 |
Table 7.
Investments in DH/G systems; G for direct use of piped gas in dwellings, DH for district heating systems *.
Table 7.
Investments in DH/G systems; G for direct use of piped gas in dwellings, DH for district heating systems *.
| G | | DH | |
|---|
| Gas distribution network | Table 8 | District heating network | Table 8 |
| Annual gas consumption * | 1 | Consumption of fuel equivalent to gas consumption | 1.1 |
| Investment in gas boiler with measurements | 5 | Annual electric energy consumption for pumps | 2.5 |
| Annual electric energy consumption for gas boiler | 1 | Cost of natural gas (or alternative fuel) | 1 |
| Natural gas price | 1 | Heat exchanger | Table 9 |
| Pressure reduction station | Table 9 | | |
Table 8.
Relative costs for network conduits with installation of DH/G; G for direct use of piped gas in dwellings, DH for district heating systems.
Table 8.
Relative costs for network conduits with installation of DH/G; G for direct use of piped gas in dwellings, DH for district heating systems.
| Nominal Diameter of Gas Pipes in mm—G | Relative Cost * | Nominal Diameters of Insulated District Heating Pipes in mm—DH | Relative Cost * |
|---|
| 25 | 1 | 20 | 4.9 |
| 32 | 1.4 | 25 | 5.3 |
| 40 | 1.6 | 32 | 6.0 |
| 50 | 1.7 | 40 | 6.4 |
| 63 | 2.4 | 50 | 6.9 |
| 75 | 2.5 | 65 | 7.2 |
| 90 | 3.3 | 80 | 9.1 |
| 110 | 3.7 | 100 | 11.5 |
| 125 | 4.6 | 125 | 14.6 |
| 140 | 4.9 | 150 | 15.3 |
| 160 | 5.9 | 200 | 19.5 |
| 180 | 6.4 | 250 | 27.7 |
| 200 | 6.9 | 300 | 31.4 |
| 225 | 7.7 | 350 | 36.4 |
| 250 | 8.6 | 400 | 38.6 |
| | | 450 | 39.8 |
| | | 500 | 46.9 |
Table 9.
Investments for heat exchangers per dwelling in D systems (each building is equipped with a heat exchanger), and for a gas regulation station per dwelling in G systems, both in EUR.
Table 9.
Investments for heat exchangers per dwelling in D systems (each building is equipped with a heat exchanger), and for a gas regulation station per dwelling in G systems, both in EUR.
| | Heat Load in MW/0.5 km2 (Fixed Load per Dwelling = 8.64 kW/Dwelling) |
|---|
| 62.5 | 50 | 37.5 | 25 | 20 | 15 | 10 | 5 |
|---|
| N = 4 (D) | 105 | 124 | 161 | 221 | 268 | 334 | 449 | 498 |
| N = 4 (G) | 12 | 13 | 14 | 17 | 21 | 27 | 37 | 52 |
| N = 8 (D) | 188 | 221 | 276 | 359 | 415 | 507 | 498 | 691 |
| N = 8 (G) | 12 | 13 | 14 | 17 | 21 | 27 | 37 | 52 |
| N = 16 (D) | 321 | 359 | 442 | 498 | 553 | 664 | 691 | 1106 |
| N = 16 (G) | 12 | 13 | 14 | 17 | 21 | 27 | 37 | 52 |
| N = 32 (D) | 487 | 498 | 531 | 664 | 760 | 922 | 1106 | 1659 |
| N = 32 (G) | 12 | 13 | 14 | 17 | 21 | 27 | 37 | 52 |
| N = 64 (D) | 637 | 664 | 737 | 885 | 1244 | 1106 | 1659 | 3000 |
| N = 64 (G) | 12 | 13 | 14 | 17 | 21 | 27 | 37 | 52 |
| N = 128 (D) | 885 | 885 | 1180 | 1327 | 1659 | 2212 | 3000 | 3000 |
| N = 128 (G) | 12 | 13 | 14 | 17 | 21 | 27 | 37 | 52 |
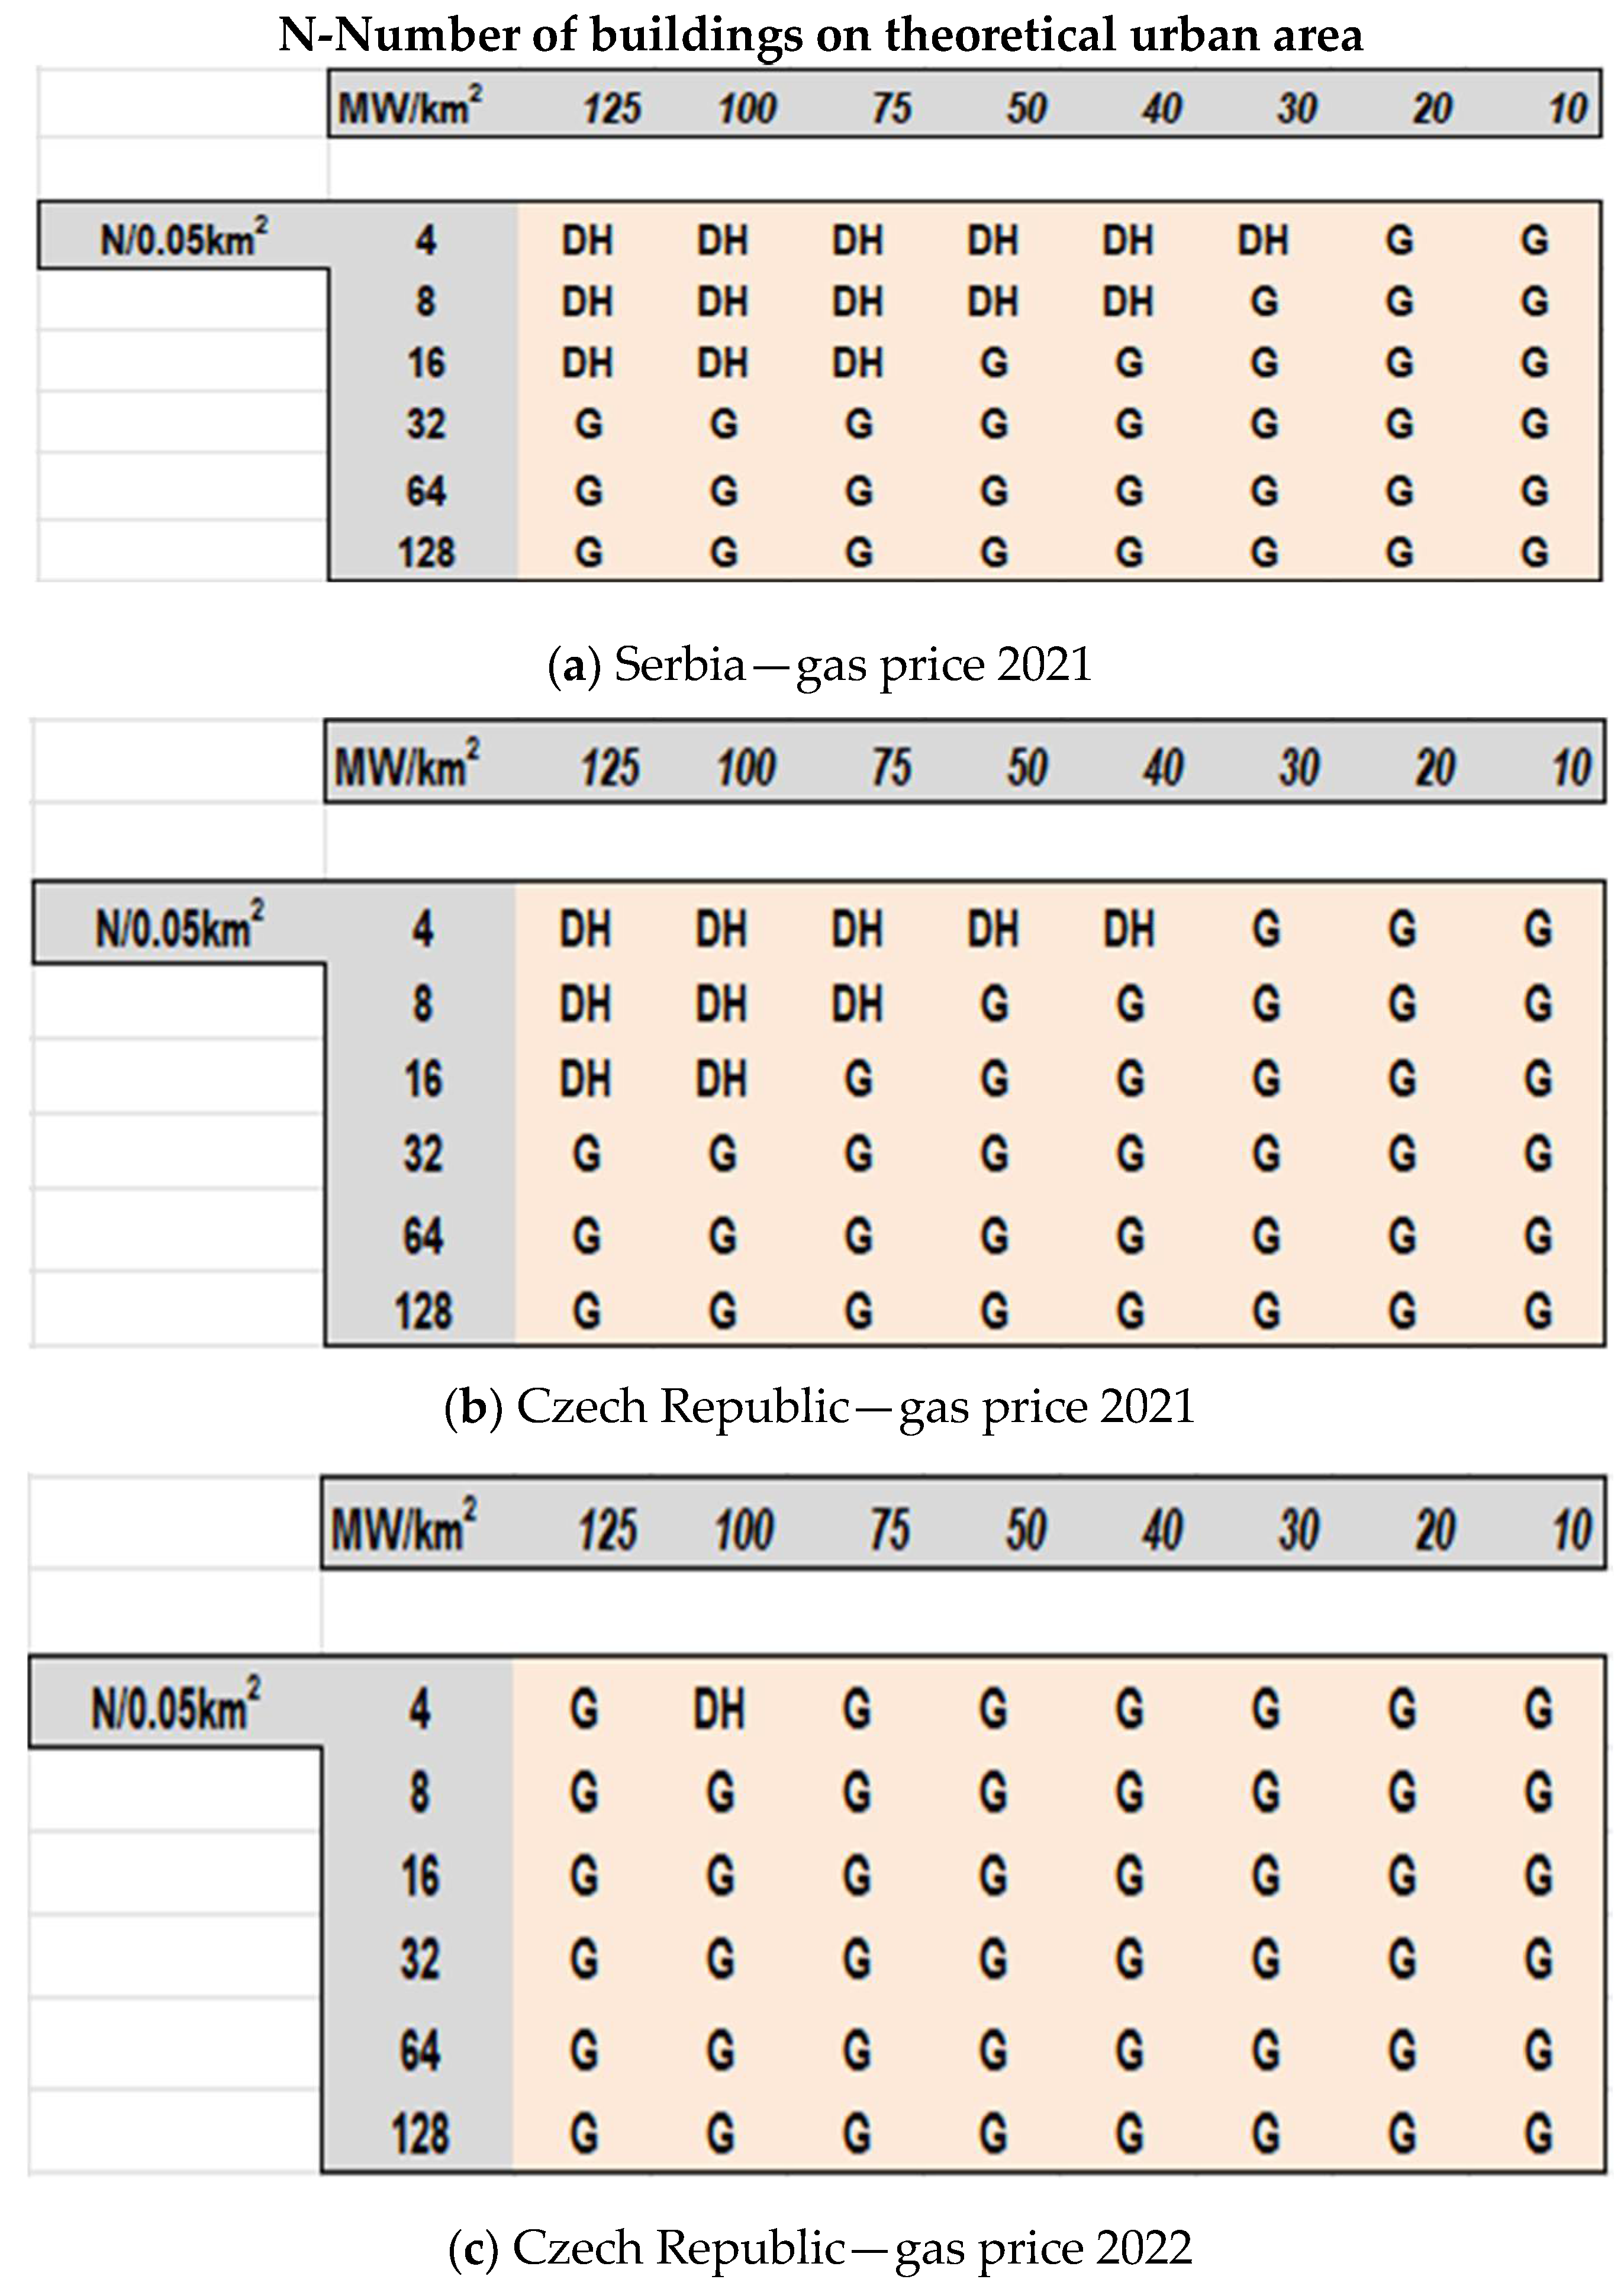
Based on the typologies of buildings and topologies of settlements, the results for heating options based on investments in both systems are shown in
Figure 6.
However, the methodology was developed not only based on investments in both systems but also on potential disparities in gas consumption and the price difference between natural gas and coal, which can produce the same amount of heat when used for district heating, as seen in Ostrava. Without delving into excessive detail, but following the methodology of [
5] and updating it with gas prices for households in Serbia and Czechia, and assuming that district heating systems consume 10% more gas, it can be concluded that, with 2022 prices in Czechia (and even more so with current prices), only the direct use of piped gas for heating is cheaper for all urban options. However, district heating remains affordable because, as in Ostrava, it is not fueled by gas but by coal. This suggests that higher consumption in one system compared to another or a disparity in prices can easily offset the investment costs of a system that initially appears more affordable when considering only the investment criterion. The assumption is that a heating plant is available without new investment.
The situation for the prices of gas in Serbia and Czechia is shown in
Figure 7.
Differences in gas consumption occur due to the various efficiencies of domestic gas boilers (conventional vs. condensing), the higher efficiency of domestic gas boilers compared with district heating facilities, losses in the distribution system of district heating (various types, quality, and actual condition of insulation for pipes), etc. [
95,
96,
97,
98].
4. Results: Urban Topologies and Building Typologies—Evaluation of Heating for the Selected Towns of Belgrade and Niš (Serbia) and Ostrava (Czechia)
Buildings in urban areas of the selected towns of Belgrade and Niš (Serbia) and Ostrava (Czechia) have district heating systems and gas distribution networks. Short notes about these systems in these towns are given, and the typologies of suitable buildings are examined.
The climate in Serbia is warmer than in Czechia.
To contextualize the analysis, this study focuses on three urban areas—Belgrade and Niš in Serbia and Ostrava in Czechia—where both district heating systems and natural gas distribution networks are present. A brief overview of the heating infrastructure in each city is provided to highlight local conditions and system characteristics. Following this, the typologies of buildings suitable for either heating option are examined, taking into account differences in climate, with Serbia generally experiencing milder winters than Czechia. These elements form the basis for the comparative assessment that follows, culminating in a discussion on selecting the most appropriate heating solution for each urban context.
4.1. District Heating and Gas Distribution in the Selected Towns
The widespread use of district heating in former socialist countries like Serbia and Czechia stems from mass housing development projects carried out between the 1960s and 1980s. These projects, driven by rapid industrial expansion, urbanization, and modernization, led to the extensive development of district heating networks as part of urban infrastructure.
In all three towns, large heating plants serve as the primary heat source for district heating systems. In Ostrava, piped gas is typically installed only for cooking, while heating and hot water are supplied by a cogeneration power plant fueled by coal, making it an outlier in this study.
In Serbia, dwellings with piped gas are usually not connected to district heating; instead, gas is used almost exclusively for heating and only rarely for cooking. In contrast, in the Czech Republic, it is more common for such dwellings to have both district heating and piped gas, primarily for cooking.
Older apartment buildings in Serbia—especially those from the socialist era—rely on district heating, as do many new buildings. However, newer residential developments increasingly incorporate individual gas boilers where infrastructure allows. The affordability of natural gas has fluctuated over the years. In the early 2000s, natural gas in Serbia was relatively cheap, but its cost has since risen. On the contrary, today, only firewood remains marginally more affordable as a heating source compared to natural gas.
Buildings in Ostrava have better thermal insulation compared to Belgrade and Niš.
4.1.1. Belgrade—Heating
The district heating system of Belgrade is the largest in Serbia and one of the largest in Europe, with a total network length of 1600 km in a double-pipe system, equivalent to 800 km of trace. However, much of the network suffers from outdated and inefficient insulation [
99,
100,
101]. The system has a total capacity exceeding 2.8 GW, including 55 MW for sanitary hot water, though many households still rely on electricity for hot water production. This accounts for almost half of Serbia’s total district heating capacity, as the country’s 59 towns collectively produce around 6700 MW.
District heating in Belgrade serves approximately 50% of households, totaling over 300,000 connections, compared to 28,000 households in Niš. The system operates through 32 heat sources, comprising 15 large heating plants and 17 boiler houses, strategically distributed across the city’s districts. Despite its scale, it depends almost entirely on imported natural gas (89%), with low integration of renewables and waste heat, although a waste treatment plant with a 103 MW capacity was installed in Vinča in 2024, near the city’s garbage dump, further diversifying the energy mix. However, plans for use of waste heat from the Nikola Tesla lignite thermal power plant in Obrenovac, a wider territory of Belgrade, have been in place since the 1980s but have not yet been realized (expansion efforts aim to add 29 km of pipeline to contribute an additional 60 MW, which could reduce gas dependency by about 30%). Obrenovac, a large suburban settlement of Belgrade, already receives heat directly from the Nikola Tesla thermal power plant. As a result, one-third of all residential buildings in Obrenovac, regardless of structure or typology, are connected to district heating.
Ownership and governance of the system are centralized, with all district heating infrastructure managed by a single city-owned company, except in Obrenovac, which operates under special conditions, as previously mentioned. Additionally, the municipalities of Grocka and Lazarevac run their own district heating companies.
Heating prices across the city are regulated by the town authority. Billing for residential heating is not consumption-based but calculated per square meter, making energy efficiency a concern.
Many buildings suffer from poor thermal insulation, increasing heat demand. District heating accounts for about 30% of total household energy consumption in the city, whereas direct natural gas use remains below 4%, even though most district heating plants rely on gas.
Despite challenges, Belgrade’s district heating network remains a critical component of the city’s infrastructure, shaping its energy landscape and urban development.
4.1.2. Niš—Heating
The District Heating Company of Niš, a public enterprise, produces and distributes heat to consumers connected to the district heating network [
102]. The total installed capacity of the company’s facilities is 236.8 MW. Natural gas is the primary fuel used, accounting for 91 percent, with the remainder supplied by heavy oil.
The types of residential buildings and private houses are more or less the same as those in Belgrade.
4.1.3. Ostrava—Heating
The Třebovice power plant is the main supplier of the district heating system in Ostrava. Operating as a combined heat and power plant, it efficiently produces both electricity and thermal energy, primarily using coal as its fuel source. Efforts are ongoing to diversify its energy mix and reduce environmental impact. The Třebovice power plant has a capacity of approximately 177 MW for its combined heat and power operations. Plans to switch to natural gas or even for closure exist, as do plans to reduce emissions of carbon [
103].
4.2. Types of Buildings Suitable for District Heating and Gas Distribution in the Selected Towns
Typical types of residential buildings are [
104] (international projects TABULA and EPI-SCOPE for 20 European countries [
105,
106,
107], including Serbia [
108] and Czechia [
109]): (1) single-family house, (2) terraced house, (3) multi-family house, and (4) apartment block. However, as can be seen in
Table 10, some other variations were used in this study for the evaluation of options: yellow (G), system with piped gas, vs. blue (DH), district heating system. Type (2) is not considered separately.
4.2.1. Belgrade and Niš—Buildings
More about the history of housing in Belgrade can be found in references [
110,
111,
112,
113,
114]. At the national level in Serbia, 76% of energy consumption is attributed to single-family houses, while 24% goes to multi-family houses [
110]. Construction details affecting heating efficiency, particularly for single-family houses based on their construction period, are provided in [
110]. The thermal performance of residential buildings in Belgrade is discussed in [
111], and typical heating systems in Serbian houses are detailed in [
112].
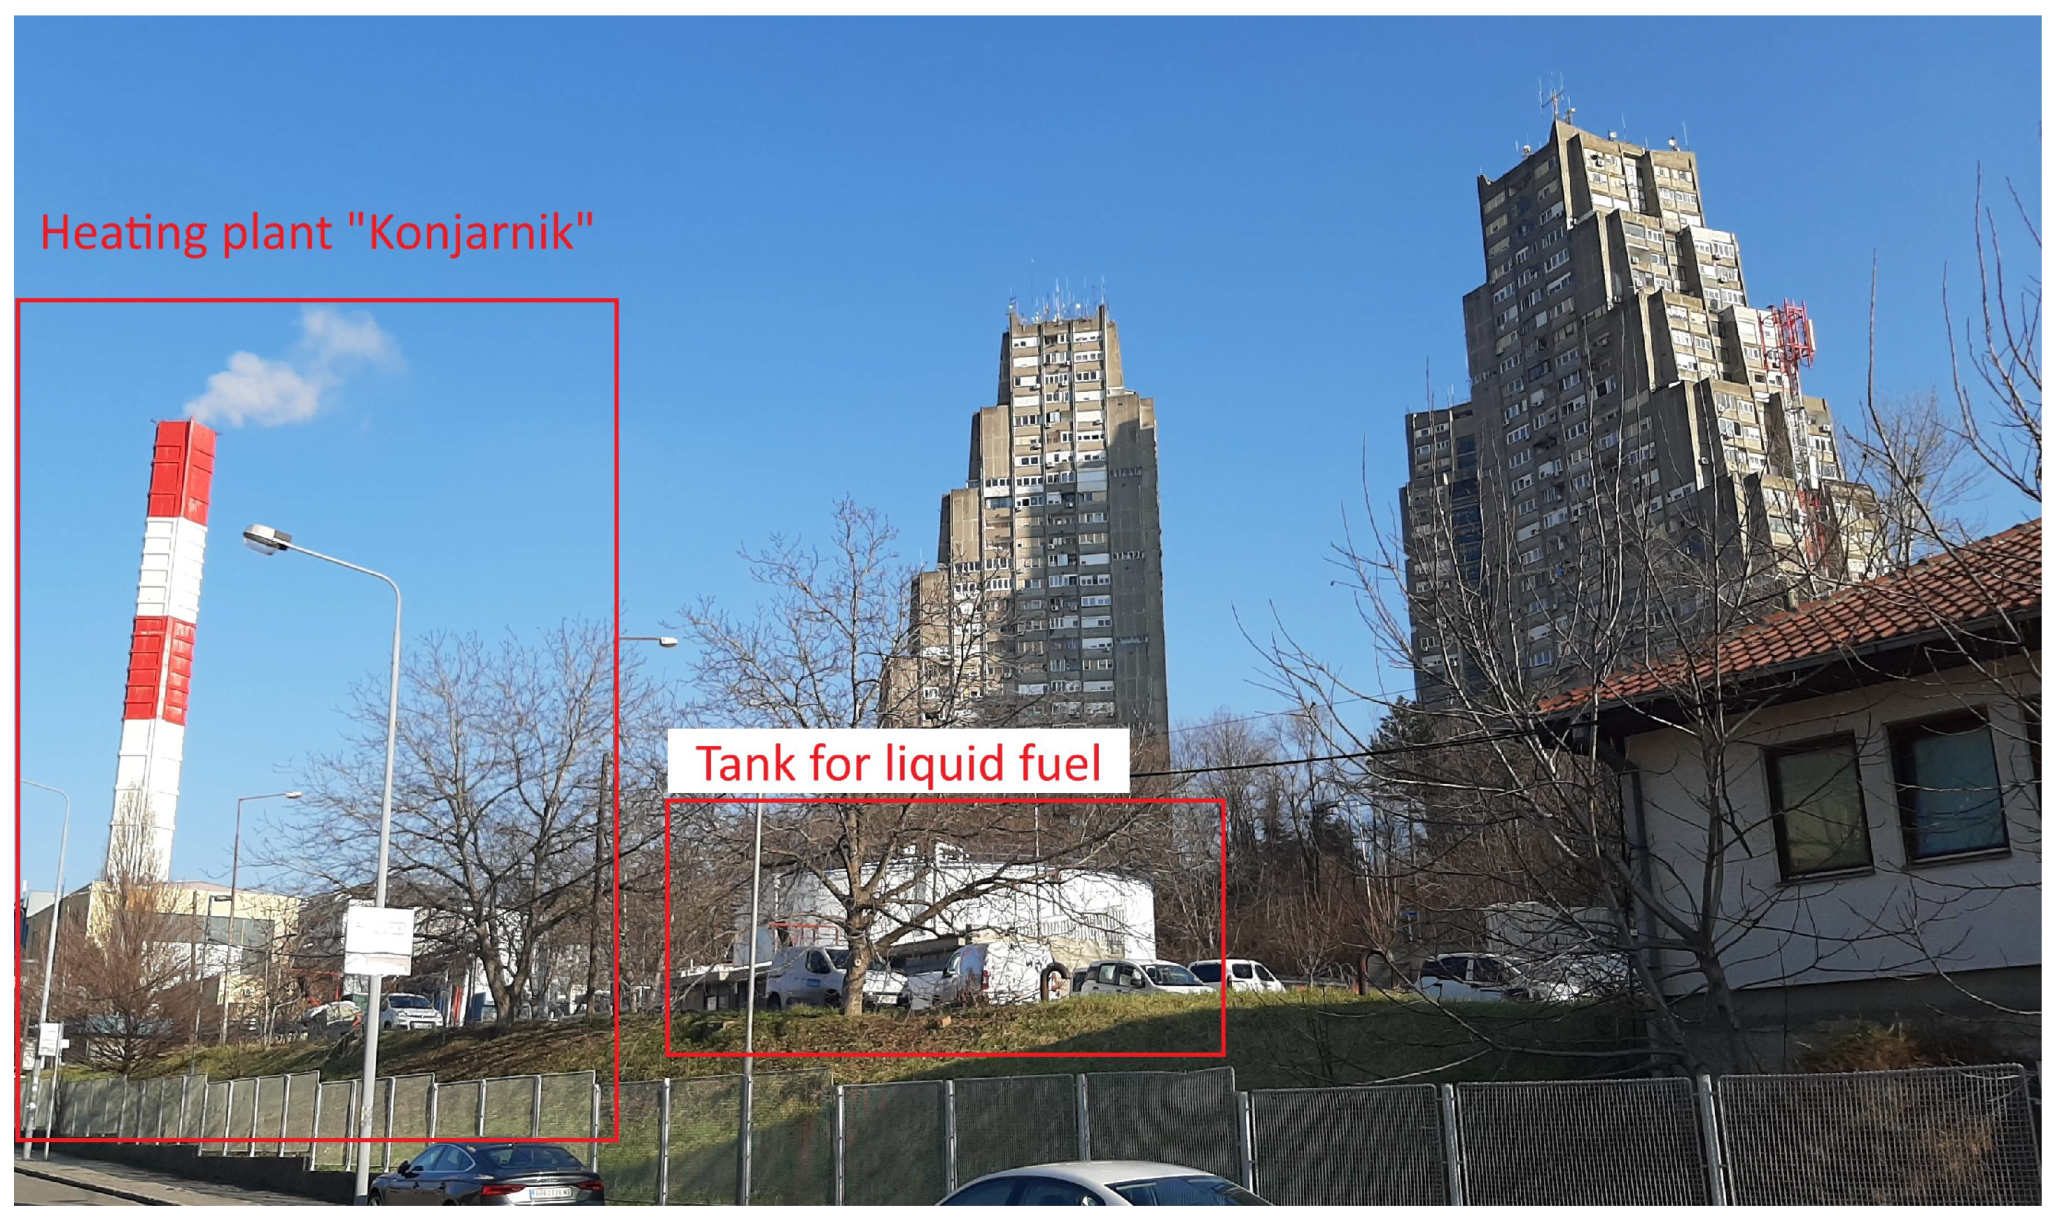
Parts of Belgrade are completely suitable for district heating. For example, New Belgrade, constructed in the second half of the twentieth century, consists solely of mass housing blocks suitable for district heating [
113,
114]. An example of an area with large buildings is the Eastern City Gate, officially “Rudo”, which is proximal to a large heating plant, “Konjarnik”, which is fueled by natural gas, with liquid fuel as an auxiliary (
Figure 8).
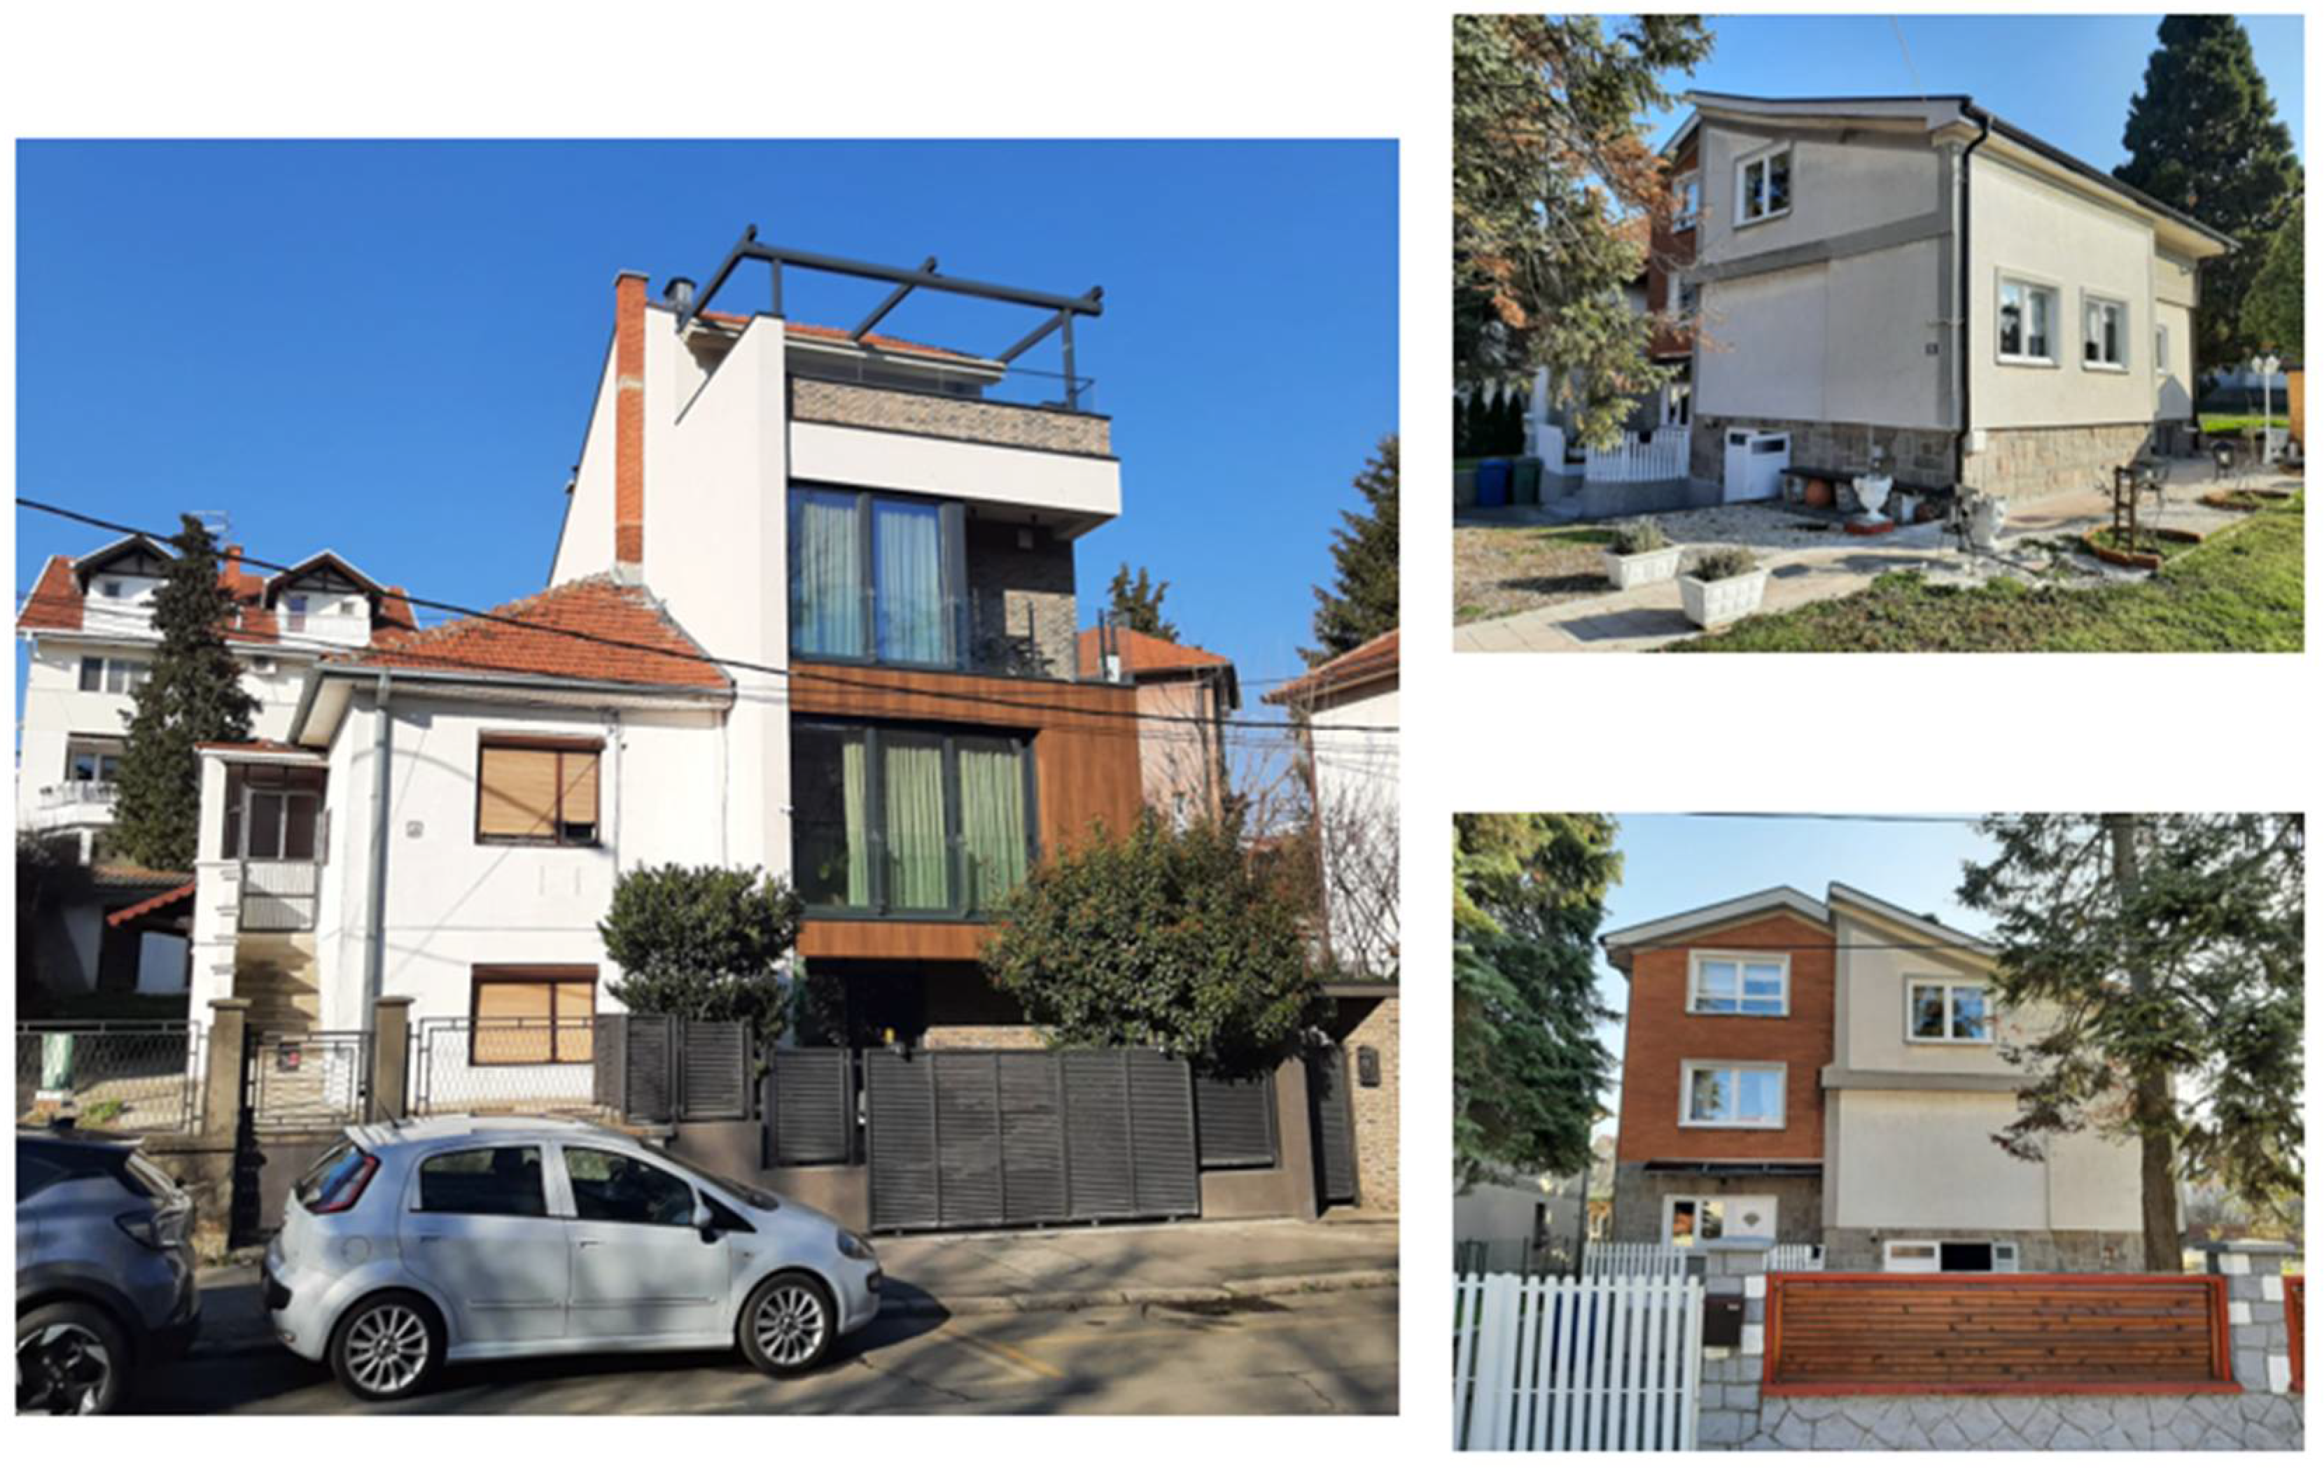
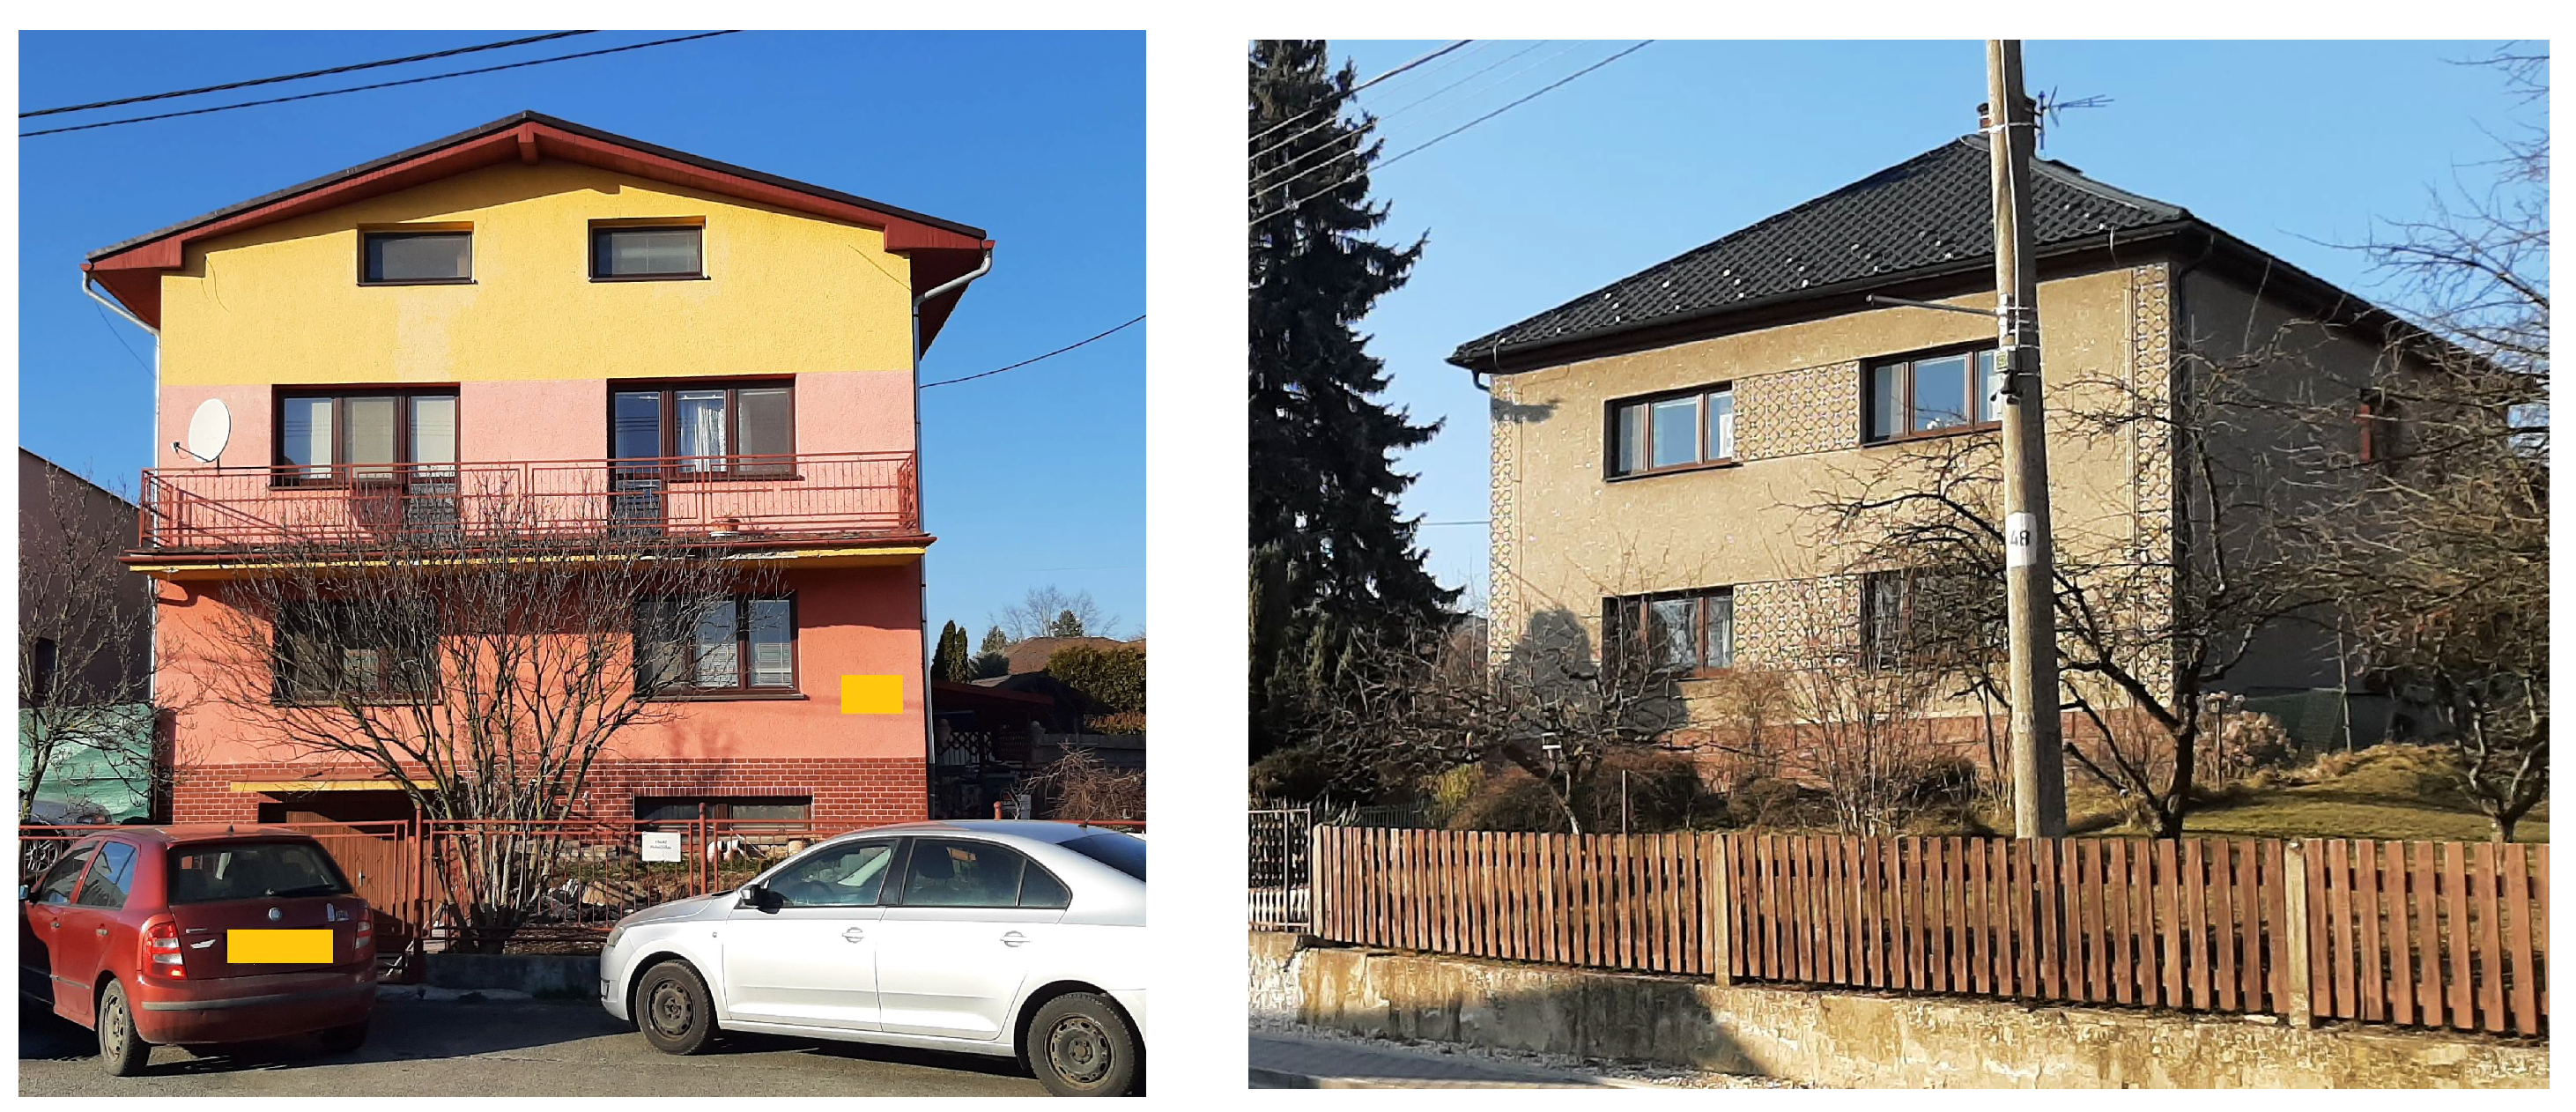
Typical family houses in Belgrade are shown in
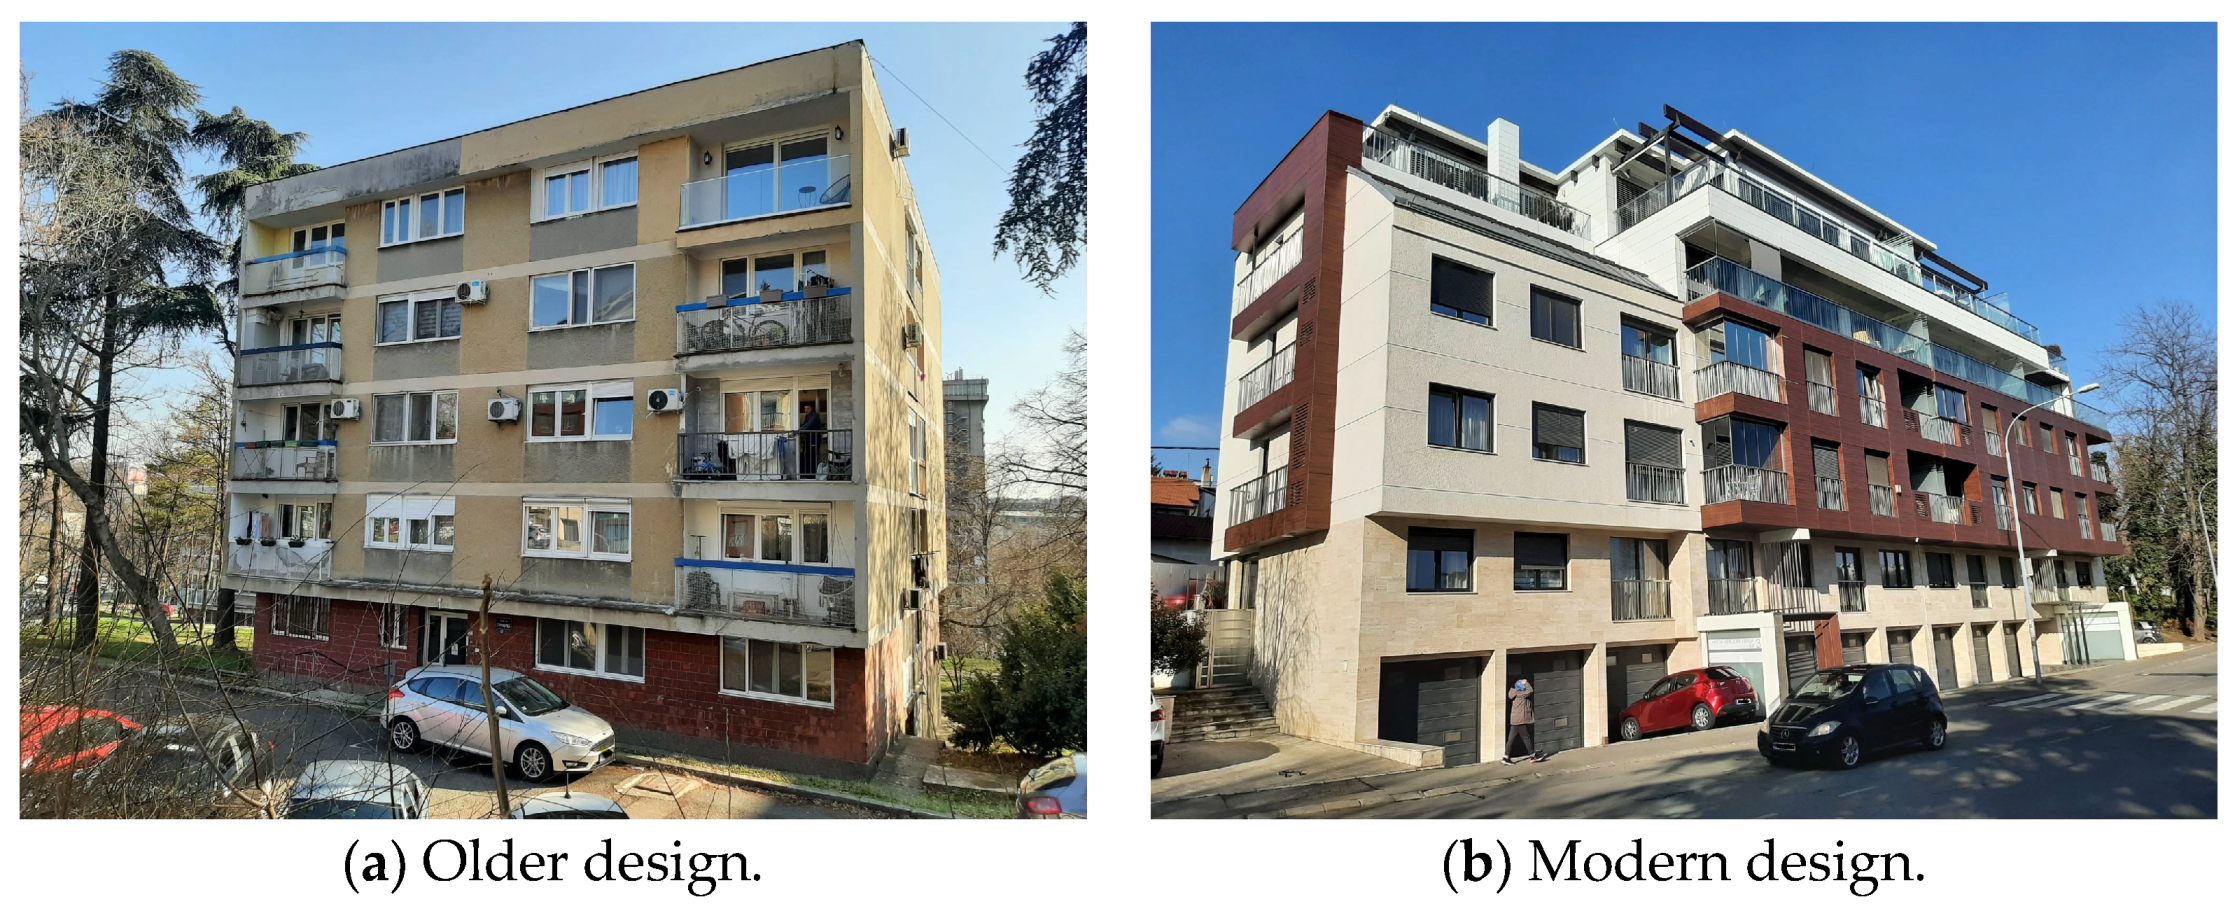
Figure 9, and multi-family residential apartment buildings are shown in
Figure 10.
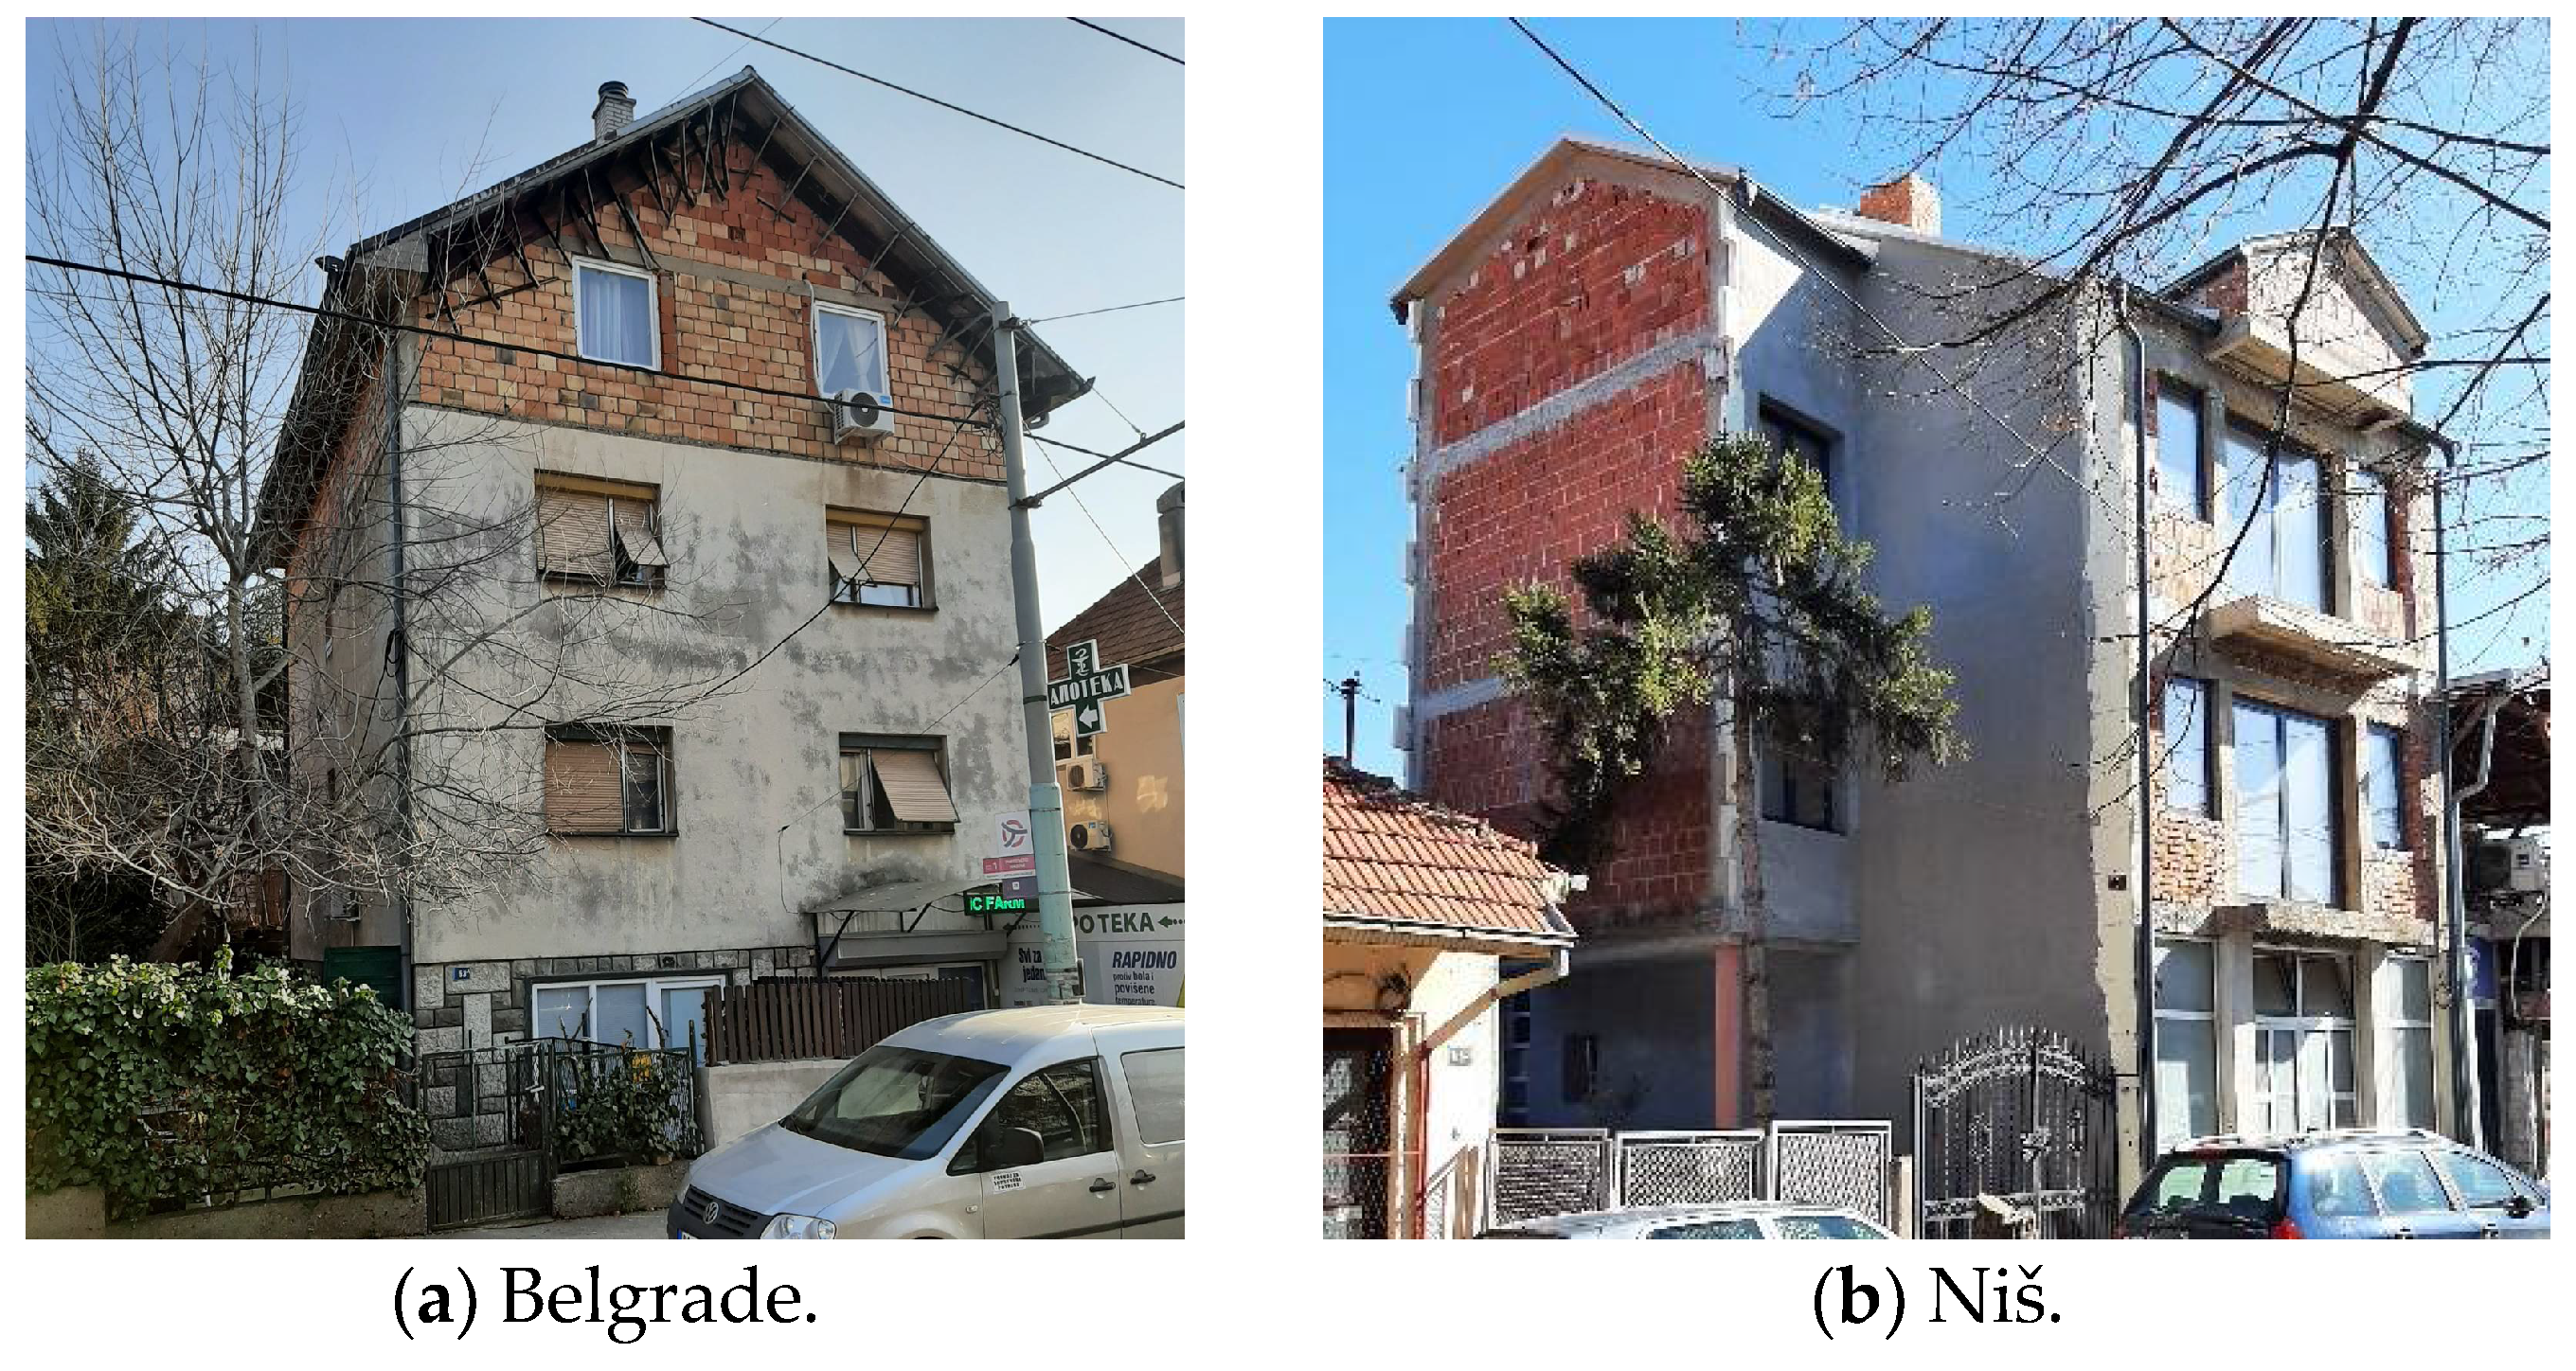
A specific problem in Serbia is that many family houses are used for many years despite being unfinished (
Figure 11). Also, in some cases, problematic renovations are not uncommon—the collapse of the canopy at Novi Sad train station brought attention to this problem [
115].
A similar architectural style typical of Belgrade can also be found in Niš (
Figure 12).
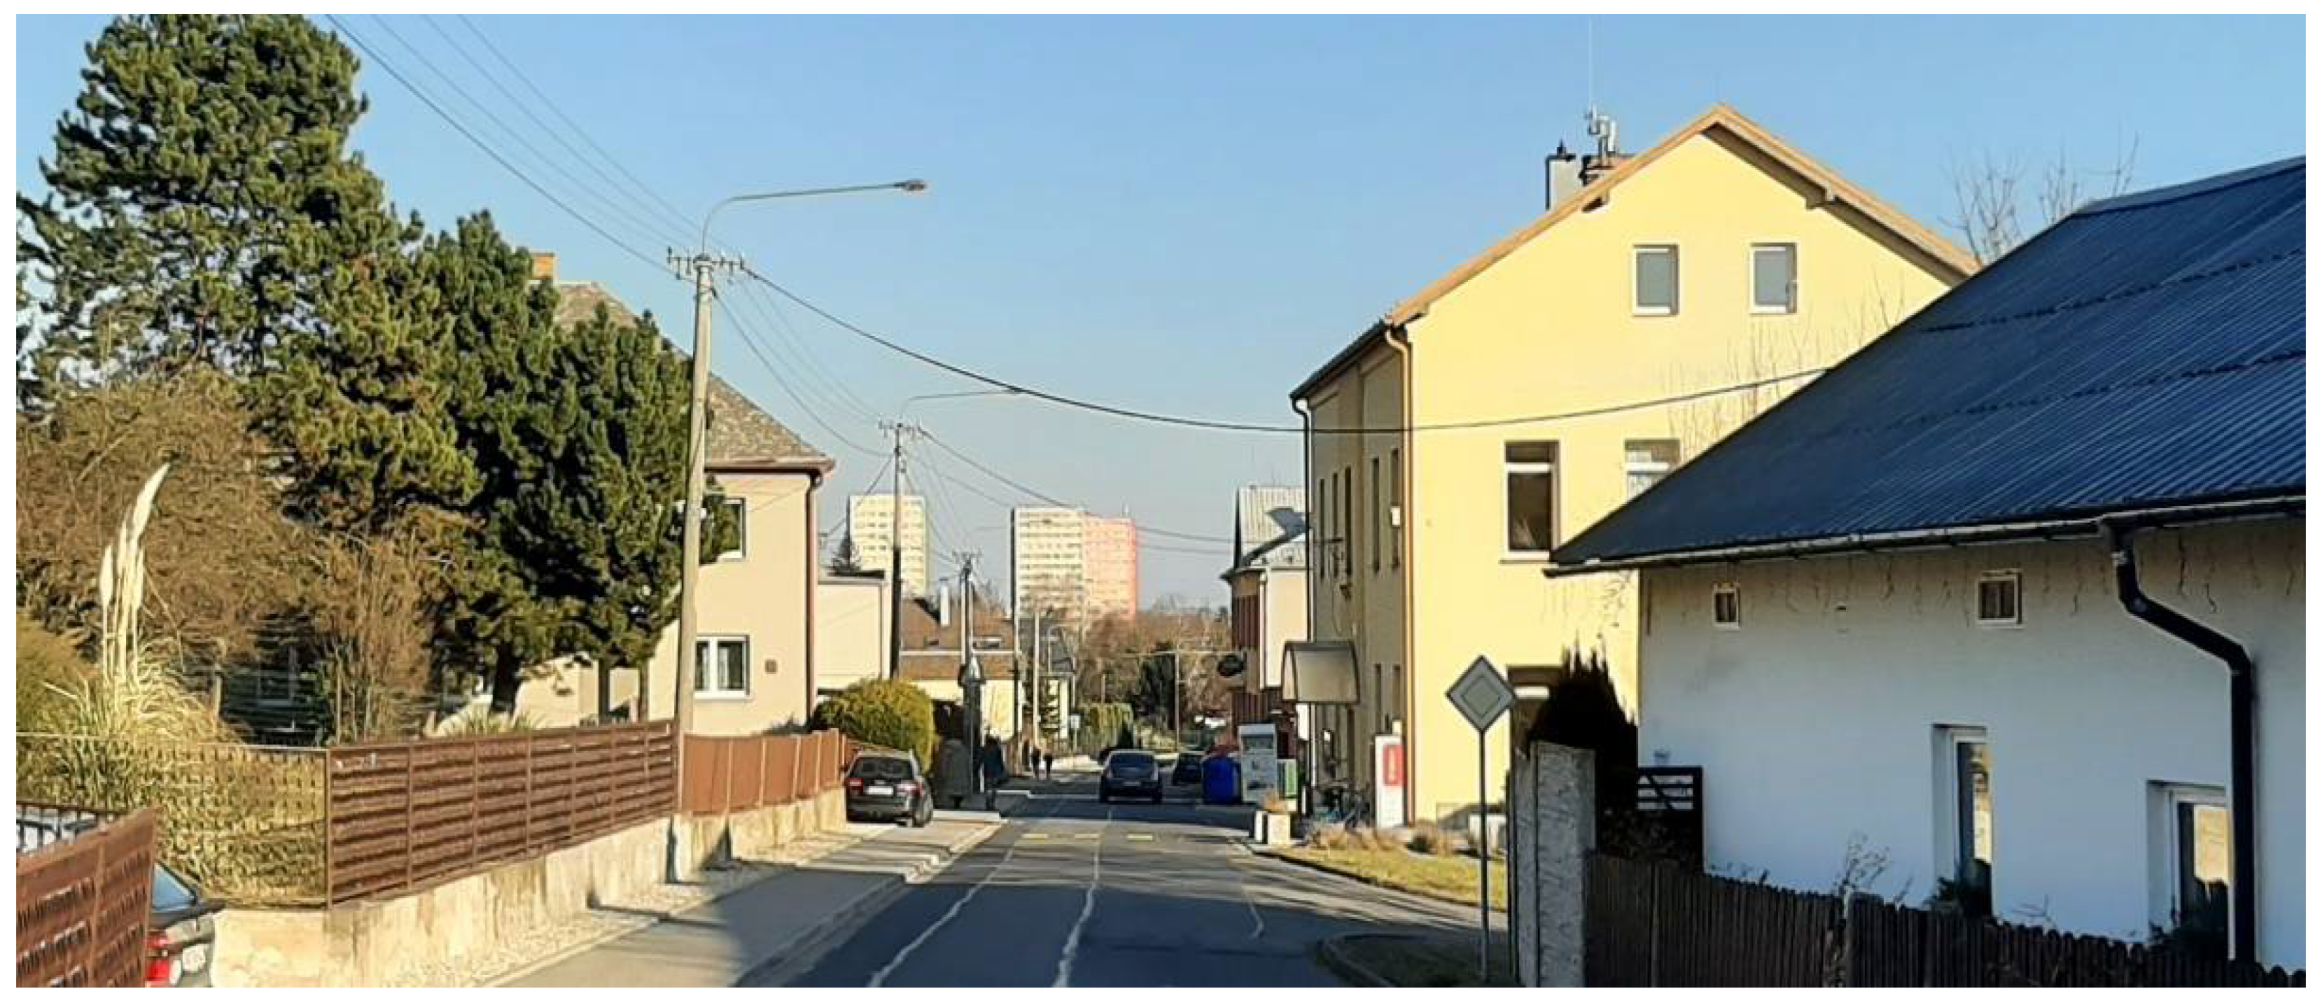
4.2.2. Ostrava—Buildings
Ostrava is a town with a strong historical background in heavy industry [
116,
117]. Although mining activity ceased in 1994, along with supplementary facilities such as coke production, many empty industrial buildings, including mineshaft lifts and large pipes above the streets, can still be seen downtown. To accommodate workers and their families, residential districts like the typical Ostrava–Poruba have been developed over the decades. All photographs illustrating the urban landscape of Ostrava shown in this article—
Figure 13,
Figure 14,
Figure 15,
Figure 16 and
Figure 17—are from this area, including Pustkovec.
An estimated 16% of households are under energy poverty (absence of opportunity to acquire energy, i.e., modern types of energy [
118]) in the Czech Republic, and the same can also be assumed for Ostrava, and the most vulnerable are households in single-family houses [
119]. Most energy losses occur due to heat escaping from heated rooms through the building envelope and the high infiltration of cold air through major leaks and openings (poor thermal insulation and old windows). Another significant issue is the inefficiency of heating sources, which results in substantial heat losses.
Around 43.7% of households reside in single-family houses, and 55% in apartment buildings, while the remaining households are unknown or not defined (at the national level of Czechia) [
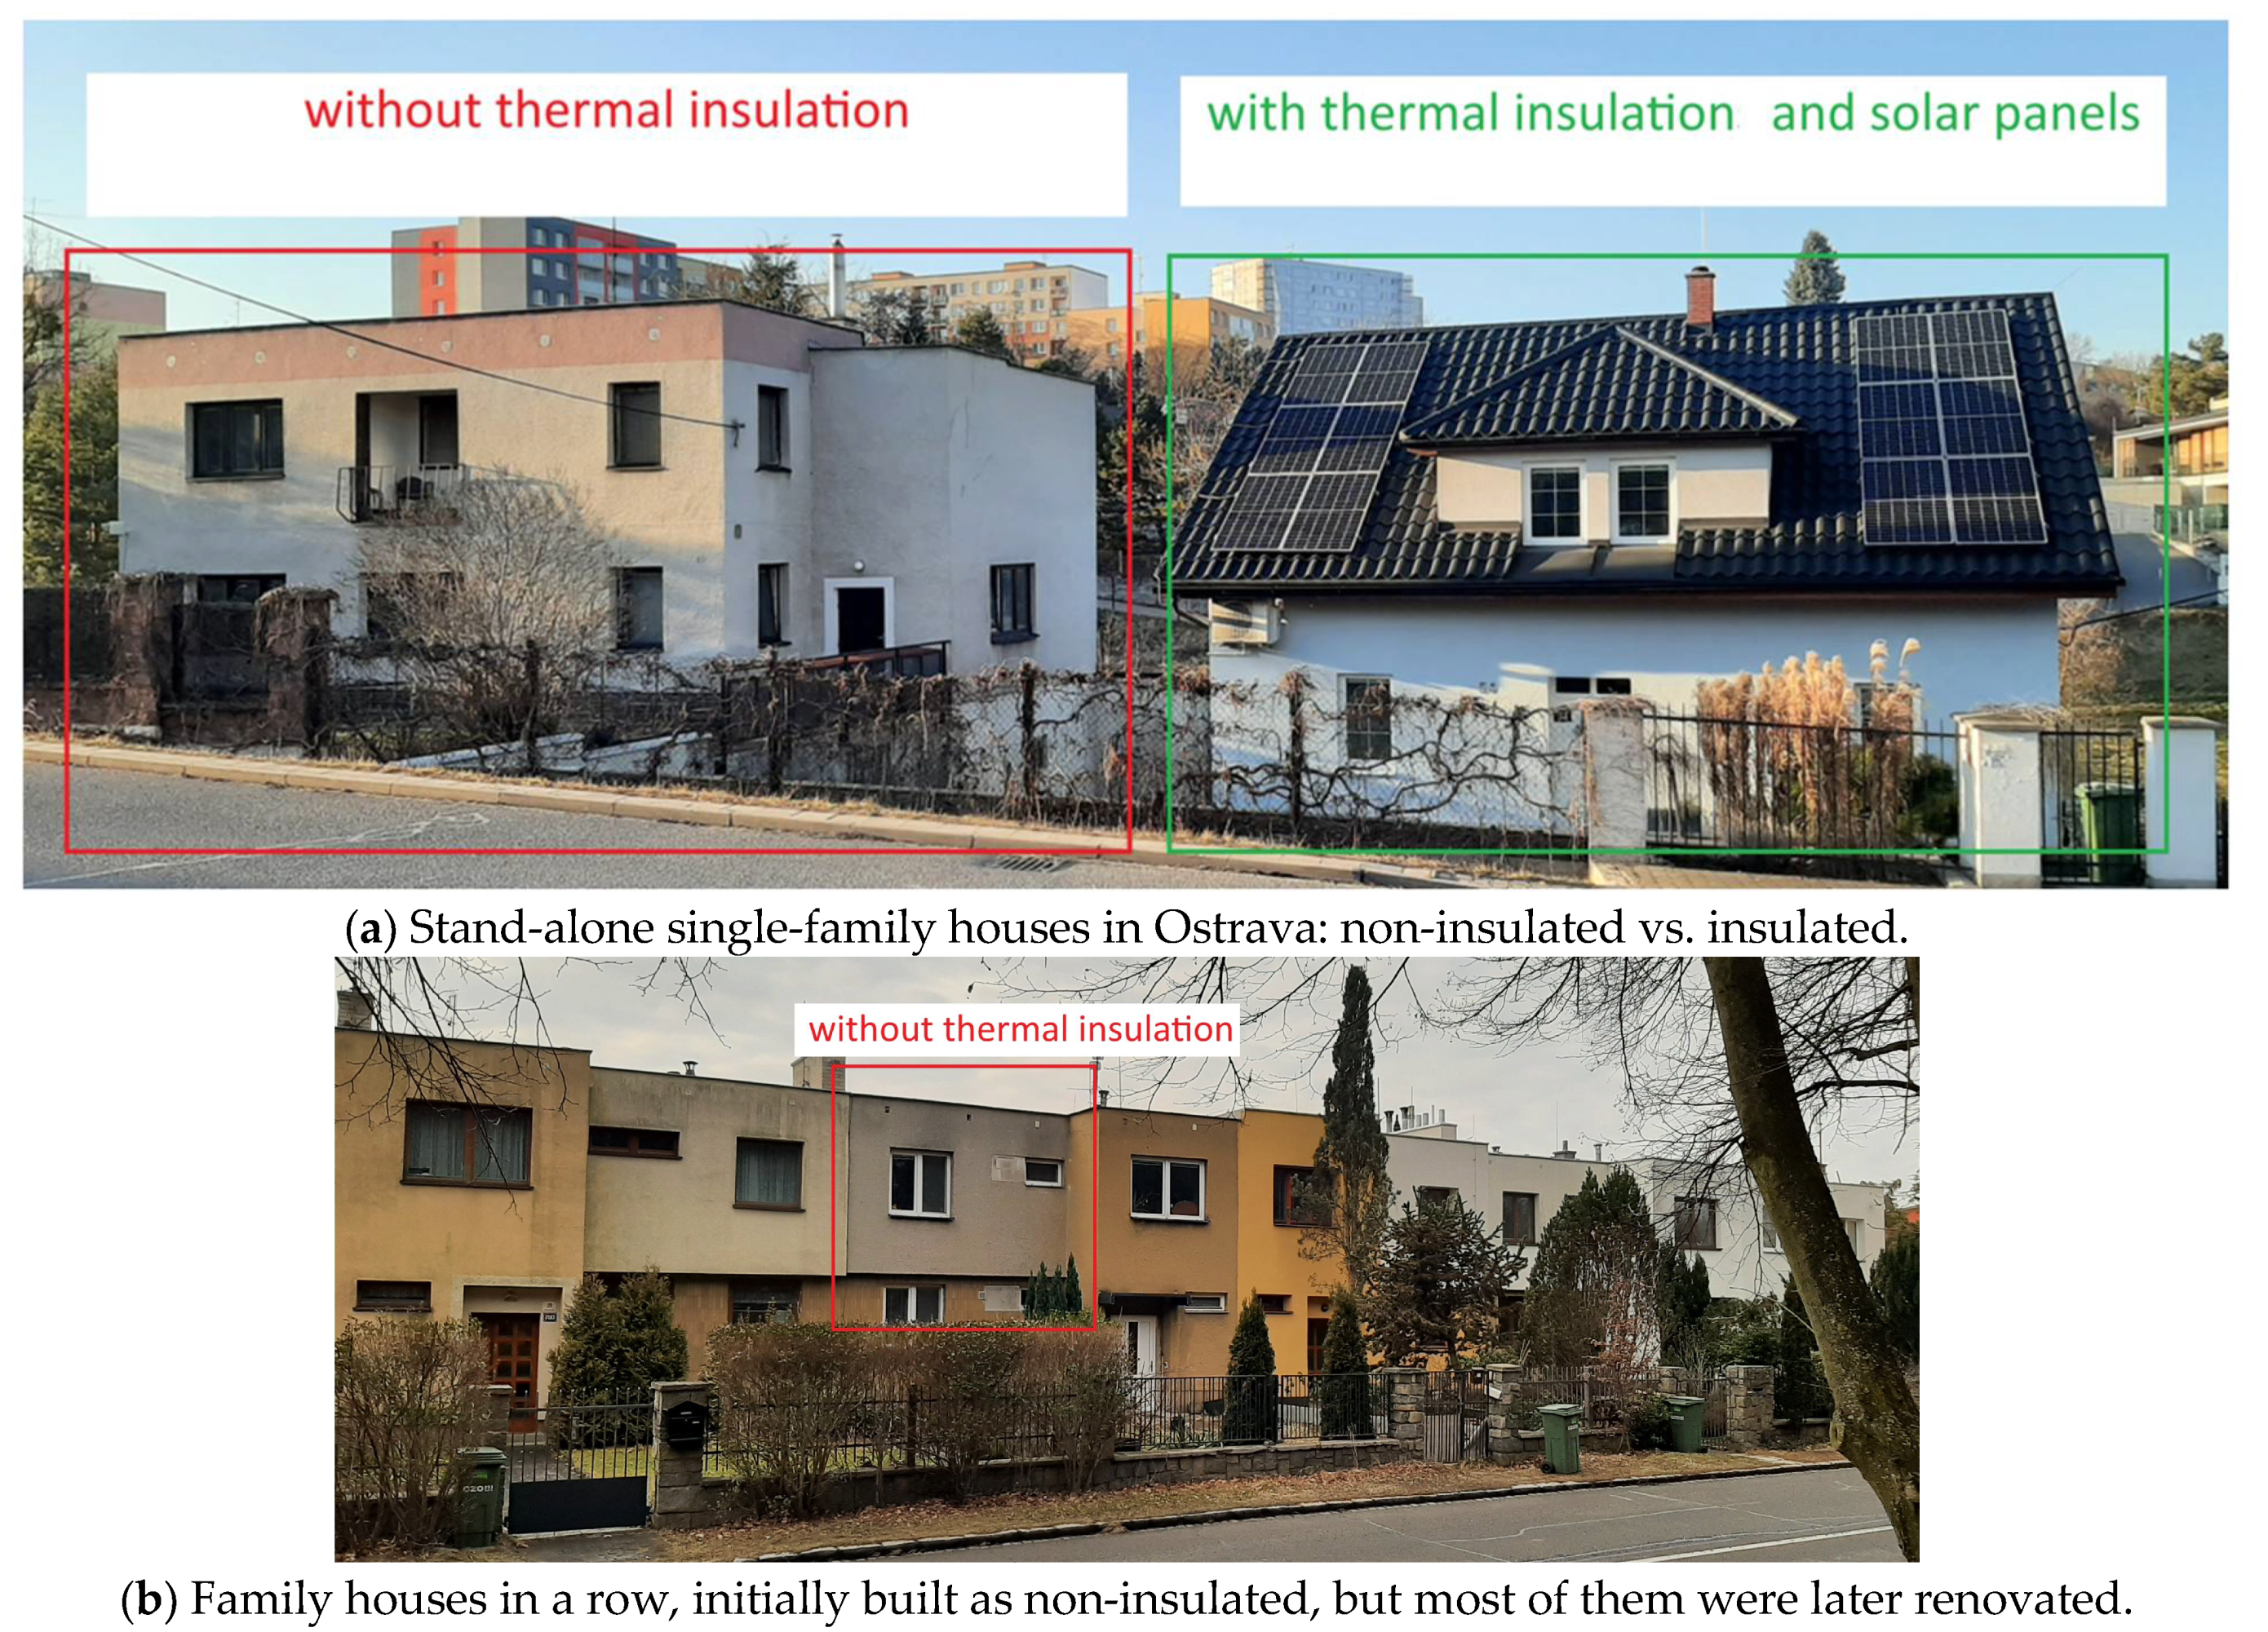
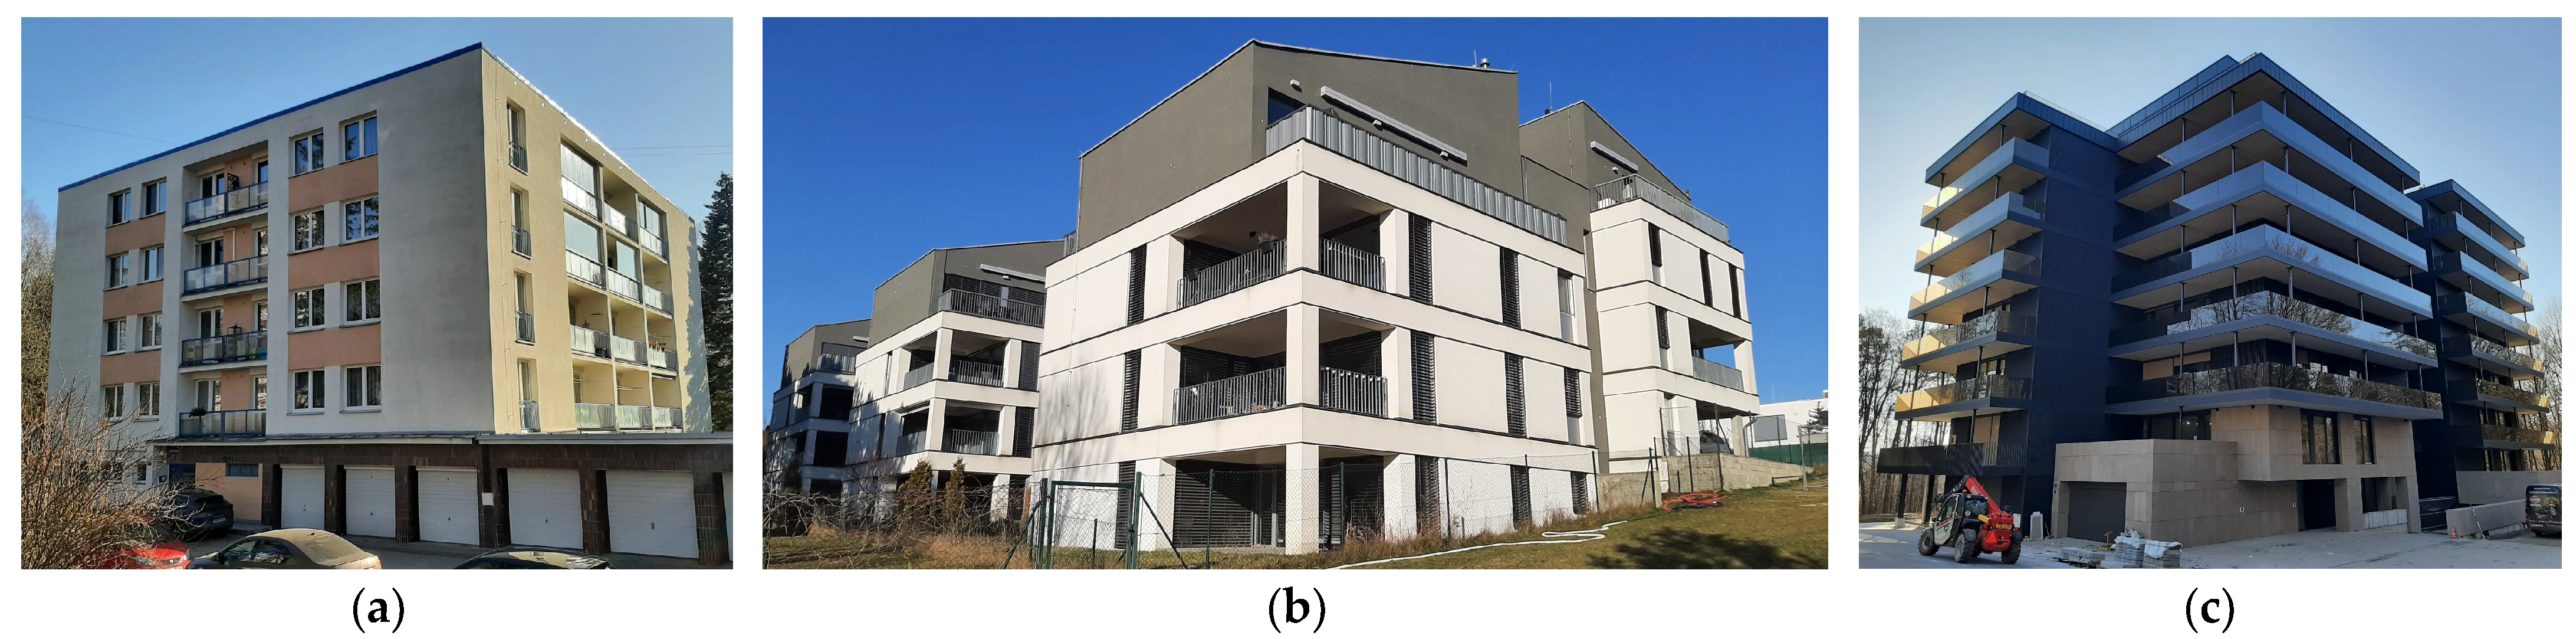
119]. Typical housing options for Ostrava are shown in
Figure 13,
Figure 14,
Figure 15,
Figure 16 and
Figure 17.
4.3. Selecting Options for Heating—Discussion
A significant portion of the energy used in buildings is allocated to heating, positioning this sector as a crucial player in the overall transformation of the energy system. To determine which of the two available systems, gas piped (G) vs. district heating (DH), the following methodology from this article is suitable for some of the buildings from
Figure 8,
Figure 9,
Figure 10,
Figure 11,
Figure 12,
Figure 13,
Figure 14,
Figure 15,
Figure 16 and
Figure 17, as shown in the diagram in
Figure 18. For this brief evaluation, only estimation is possible because the actual size and the type of thermal insulation are unknown, and in particular, the size of the settlement, i.e., urban density, cannot be easily determined.
5. Conclusions
This study introduces a novel methodological approach for optimizing the use of natural gas in urban residential heating, offering a systematic comparison between local (individual) and district heating systems. The methodology is grounded in an integrated assessment of safety, environmental impact, and urban parameters such as building typology and spatial configuration. Applied to representative housing types in Serbian and Czech cities, the model effectively links urban form with energy system selection, demonstrating its potential to guide infrastructure planning and support energy policy decisions.
The simplicity and flexibility of the model—requiring minimal yet widely available input data—make it suitable for urban-scale implementation. The approach has proven effective in identifying viable strategies for urban energy transitions and providing robust information for decision-making. The results highlight that while natural gas remains a dominant heating source, the optimal deployment method—direct piping (G) versus district heating (DH)—depends heavily on urban design, economic considerations, and evolving energy policies. Importantly, the model’s reliance only on investment costs and gas prices ensures broad applicability across different urban contexts. Its practical relevance lies in enabling more efficient and cost-effective infrastructure planning, with expected economic benefits including reduced capital and operational expenditures, improved safety, and enhanced sustainability, particularly in post-socialist regions.
To further refine and expand the applicability of this framework, future research should explore dynamic modeling of energy performance under varying urban morphologies, integrate renewable energy sources into hybrid heating systems, and consider socioeconomic dimensions such as income levels, policy incentives, and user behavior. Validating the model in additional urban contexts beyond Serbia and Czechia will also be crucial for developing generalized, adaptable guidelines for sustainable heating system design in transitional cities.
Author Contributions
Conceptualization, D.B.; methodology, D.B.; software, D.B.; validation, D.B.; formal analysis, D.B.; investigation, D.B.; resources, D.B. and D.T.N.; data curation, D.B.; writing—original draft preparation, D.B.; writing—review and editing, D.B.; visualization, D.B.; supervision, D.B. and Z.S.; project administration, D.B. and Z.S.; funding acquisition, D.B., Z.S., and D.T.N. All authors have read and agreed to the published version of the manuscript.
Funding
This work has been supported by the Ministry of Science, Technological Development, and In-novations of the Republic of Serbia grant number: 451-03-136/2025-03/200102. Dejan Brkić also received support from the European Union under the project “Increasing the resilience of power grids in the context of decarbonisation, decentralisation and sustainable socioeconomic devel-opment”, CZ.02.01.01/00/23_021/0008759, through the Operational Programme Johannes Amos Comenius
Data Availability Statement
Further inquiries can be directed to the corresponding author.
Acknowledgments
Thanks go to the three interviewees, whose opinions are interpreted in Appendix A and were used to check the consistency and accuracy of the situation with heating in the three towns observed in this study.
Conflicts of Interest
The authors declare no conflicts of interest.
Appendix A
Personal experiences and overall impressions of the interviewees about natural gas heating in their local communities.
Questions:
Is heating in residential buildings typically provided by individual gas boilers installed in each dwelling or by centralized district heating systems?
Do heating plants generally serve large areas of a city, or are they smaller and designed for smaller clusters of buildings?
Is natural gas in your town commonly used as a fuel source for heating plants?
Do you know of any cases where a separate piped gas supply for cooking has been installed in buildings connected to district heating?
Who is responsible for owning and managing heating plants and gas supply networks for households? Are consumers able to freely choose their heat and natural gas suppliers on the market?
How is heat consumption typically billed—based on actual usage or the size of the dwelling? In your opinion, is heating affordable? Is the cost of natural gas high, whether it is used for heating or just for cooking?
Is thermal insulation in residential buildings generally of high quality?
Both heating options, piped gas and district heating systems, exist. While there are large heating plants, smaller ones also exist, but they are planned to be canceled and connected to larger plants. Natural gas is commonly used, with almost all heating plants running on it. Separate piped gas systems alongside district heating from plants do not exist within a single flat. Cooking on gas is common, but it typically involves propane–butane from canisters. District heating is provided by the municipality or town, which also owns the system. The natural gas distribution network is managed by private companies licensed by the municipality or town, and consumers cannot switch to different suppliers. Heat consumption from district heating is billed based on the size of the flat, not actual consumption. District heating is popular but relatively expensive, with the main advantage being a fixed bill, which discourages savings. Natural gas prices are affordable, and only individual heating with wood is slightly cheaper. Thermal insulation is typically of lower quality.
The heating situation in Niš is similar to that in Belgrade. The interviewee mentioned cases in Niš where consumers have disconnected their flats from district heating due to high costs, reporting the main reason as poor heating with many problems.
Household heating is primarily provided through a centralized district heating system supplied by a large power plant in Ostrava that is in private ownership and also generates heat. This power plant is fueled by coal. Although most dwellings are connected to the district heating system, piped gas is commonly used for cooking. In the past, up until the 1970s, the distribution network supplied city gas (composed mainly of carbon monoxide). This was later replaced with natural gas, requiring modifications or replacements of domestic appliances. Gas and electricity providers can be freely chosen in the market, while the district heating contract is provided by a private company that is the owner of the heating plant in Ostrava. Heat consumption through the district heating system is paid by consumption (with a certain fixed amount that is required to be paid). The prices for heating and natural gas are high, and some consumers struggle to pay their bills. Thermal insulation of most buildings is good, and practically all residential sectors have increased energy efficiency compared with the socialist period. There are examples where some buildings cut contracts for district heating and switched to heat pumps instead, maintaining the same occupant comfort but reducing the monthly bills (although initial investments were high).
References
- Arowoiya, V.A.; Onososen, A.O.; Moehler, R.C.; Fang, Y. Influence of Thermal Comfort on Energy Consumption for Building Occupants: The Current State of the Art. Buildings 2024, 14, 1310. [Google Scholar] [CrossRef]
- Ferrari, S.; Zoghi, M.; Cardelli, R.; Dall’O, G. A Monitoring Campaign Introducing the Indoor Driving Temperature to Assess the Building Envelope Performance. Appl. Energy 2025, 377, 124650. [Google Scholar] [CrossRef]
- Østergaard, D.S.; Tunzi, M.; Svendsen, S. What does a well-functioning heating system look like? Investigation of ten Danish buildings that utilize district heating efficiently. Energy 2021, 227, 120250. [Google Scholar] [CrossRef]
- Luo, A.; Li, C.; Xia, J.; Cheng, P. Thermal Characteristics and User Regulation of Household Heat Metering for Residential District Heating Systems in Northern China. Energies 2024, 17, 579. [Google Scholar] [CrossRef]
- Brkić, D.; Tanasković, T.I. Systematic approach to natural gas usage for domestic heating in urban areas. Energy 2008, 33, 1738–1753. [Google Scholar] [CrossRef]
- Brkić, D. Natural gas heating in Serbian settlements according to urbanity parameters. Facta Univ. Ser. Archit. Civ. Eng. 2008, 6, 139–153. [Google Scholar] [CrossRef]
- Stanojević, G.; Malinović-Milićević, S.; Brđanin, E.; Milanović, M.; Radovanović, M.M.; Popović, T. Impact of Domestic Heating on Air Pollution—Extreme Pollution Events in Serbia. Sustainability 2024, 16, 7920. [Google Scholar] [CrossRef]
- Daugavietis, J.E.; Soloha, R.; Dace, E.; Ziemele, J. A Comparison of Multi-Criteria Decision Analysis Methods for Sustainability Assessment of District Heating Systems. Energies 2022, 15, 2411. [Google Scholar] [CrossRef]
- Verwiebe, P.A.; Seim, S.; Burges, S.; Schulz, L.; Müller-Kirchenbauer, J. Modeling Energy Demand—A Systematic Literature Review. Energies 2021, 14, 7859. [Google Scholar] [CrossRef]
- Cholewa, T.; Balaras, C.A.; Nižetić, S.; Siuta-Olcha, A. On calculated and actual energy savings from thermal building renovations–Long term field evaluation of multifamily buildings. Energy Build. 2020, 223, 110145. [Google Scholar] [CrossRef]
- Ignjatović, D.; Bojana, Z.; Ćuković Ignjatović, N.; Đukanović, L.; Radivojević, A.; Rajčić, A. Methodology for Residential Building Stock Refurbishment Planning—Development of Local Building Typologies. Sustainability 2021, 13, 4262. [Google Scholar] [CrossRef]
- Anđelković, A.S.; Kljajić, M.; Macura, D.; Munćan, V.; Mujan, I.; Tomić, M.; Vlaović, Ž.; Stepanov, B. Building Energy Performance Certificate—A Relevant Indicator of Actual Energy Consumption and Savings? Energies 2021, 14, 3455. [Google Scholar] [CrossRef]
- Đukanović, L.; Ignjatović, D.; Ćuković Ignjatović, N.; Rajčić, A.; Lukić, N.; Zeković, B. Energy Refurbishment of Serbian School Building Stock—A Typology Tool Methodology Development. Sustainability 2022, 14, 4074. [Google Scholar] [CrossRef]
- Hansen, A.R.; Leiria, D.; Johra, H.; Marszal-Pomianowska, A. Who Produces the Peaks? Household Variation in Peak Energy Demand for Space Heating and Domestic Hot Water. Energies 2022, 15, 9505. [Google Scholar] [CrossRef]
- Golić, K.; Kosić, T.; Kosorić, V. AHP-Based Model for Energy-Sustainable Renovation of Building Envelopes: A Case Study. Sustainability 2023, 15, 8384. [Google Scholar] [CrossRef]
- Djordjević, L.; Pekez, J.; Novaković, B.; Bakator, M.; Djurdjev, M.; Ćoćkalo, D.; Jovanović, S. Increasing Energy Efficiency of Buildings in Serbia—A Case of an Urban Neighborhood. Sustainability 2023, 15, 6300. [Google Scholar] [CrossRef]
- Dragutinovic, A.; Pottgiesser, U.; Quist, W. Self-Management of Housing and Urban Commons: New Belgrade and Reflections on Commons Today. Urban Plan. 2022, 7, 267–279. [Google Scholar] [CrossRef]
- Jovanović, S.M. The Relationship Between Serbia and Russia in the Post-Yugoslav Era: Political, Economic and Security Dimensions. Stud. Srod. Bałkanistyczne 2023, 32, 227–246. [Google Scholar] [CrossRef]
- Brkić, D. Serbian Energy Sector in a Gap Between East and West. Energy Explor. Exploit. 2024, 42, 330–340. [Google Scholar] [CrossRef]
- Brkić, D. Serbian energy sector in the global political landscape amid the Russia-Ukraine war: A focus on perspectives of integration into the European Union. Discov. Energy 2024, 4, 29. [Google Scholar] [CrossRef]
- Ghanem, S.; Fandi, G.; Krepl, V.; Husein, T.; Rzek, O.; Muller, Z.; Kyncl, J.; Tlustý, J.; Smutka, L. The Impact of COVID-19 on Electricity Prices in Italy, the Czech Republic, and China. Appl. Sci. 2021, 11, 8793. [Google Scholar] [CrossRef]
- Stanković, Z.Z.; Rajic, M.N.; Božić, Z.; Milosavljević, P.; Păcurar, A.; Borzan, C.; Păcurar, R.; Sabău, E. The Volatility Dynamics of Prices in the European Power Markets during the COVID-19 Pandemic Period. Sustainability 2024, 16, 2426. [Google Scholar] [CrossRef]
- Eurostat: Energy Consumption in Households. Available online: https://ec.europa.eu/eurostat/statistics-explained/index.php?title=Energy_consumption_in_households#Explore_further (accessed on 23 January 2025).
- IEA: Energy System of Serbia. Available online: https://www.iea.org/countries/serbia (accessed on 23 January 2025).
- IEA: Energy System of Czechia. Available online: https://www.iea.org/countries/czechia (accessed on 23 January 2025).
- Statistical Office of the Republic of Serbia: Installations in Dwellings. Available online: https://data.stat.gov.rs/Home/Result/3104040105 (accessed on 23 January 2025).
- Czech Statistical Office: Dwellings. Available online: https://vdb.czso.cz/vdbvo2/faces/en/index.jsf?page=statistiky&katalog=33655 (accessed on 23 January 2025).
- Osička, J.; Kemmerzell, J.; Zoll, M.; Lehotský, L.; Černoch, F.; Knodt, M. What’s Next for the European Coal Heartland? Exploring the Future of Coal as Presented in German, Polish and Czech press. Energy Res. Soc. Sci. 2020, 61, 101316. [Google Scholar] [CrossRef]
- Oil & Gas Laws and Regulations in Serbia. 2024. Available online: https://ceelegalmatters.com/oil-gas-2024/oil-gas-serbia-2024 (accessed on 17 February 2025).
- Oil & Gas Laws and Regulations in the Czech Republic. 2024. Available online: https://ceelegalmatters.com/oil-gas-2024/oil-gas-czech-republic-2024 (accessed on 17 February 2025).
- Yearly Report on the Operation of the Czech Gas System for 2023. Available online: https://eru.gov.cz/en/yearly-report-operation-czech-gas-system-2023 (accessed on 17 February 2025).
- Odell, W.W. Facts Relating to the Production and Substitution of Manufactured Gas for Natural Gas (No. 301). Department of Commerce, Bureau of Mines. 1929. Available online: https://books.google.com/books?hl=en&lr=&id=st4RRgrGA3sC&oi=fnd&pg=PA1&ots=A0gdw9fRsE&sig=0jy_T3hokBlDwzEA9BtdO_ye5AY (accessed on 24 January 2025).
- Mead, J. The 1970s Energy Crises and the Threat to Czechoslovak Consumer Socialism. J. Contemp. Hist. 2025, 60, 296–317. [Google Scholar] [CrossRef]
- Lapčík, V.; Lapčík, M.; Lapčík Jr, V. Current Aspects of Decarbonisation in the Czech Republic and Possibilities of Replacement of Coal Energy Sources by Renewable Sources of Electric Energy. Inżynieria Miner. 2022, 1, 87–96. [Google Scholar] [CrossRef]
- Chojnacki, J.; Kielar, J.; Najser, J.; Frantík, J.; Najser, T.; Mikeska, M.; Gaze, B.; Knutel, B. Straw pyrolysis for use in electricity storage installations. Heliyon 2024, 10, e30058. [Google Scholar] [CrossRef]
- Kyrimis, S.; Dimas, P.; Stamopoulos, D.; Tsakanikas, A. Socio-Economic Impact Assessment of Hydrogen Injection in the Natural Gas Network. Energies 2025, 18, 725. [Google Scholar] [CrossRef]
- State Aid: Commission Approves €718 Million Czech Scheme to Support Companies in the Heat Sector in the Context of Russia’s War Against Ukraine. Available online: https://ec.europa.eu/commission/presscorner/detail/en/ip_23_3325 (accessed on 5 February 2025).
- State Aid: Commission Approves €5 Billion Czech Scheme to Support Energy Producers in the Context of Russia’s War Against Ukraine. Available online: https://ec.europa.eu/commission/presscorner/detail/en/ip_23_3996 (accessed on 5 February 2025).
- Parpulova, N.; Zinoviev, V. Natural Gas and the Dynamics of the Energy Market—Eastern Europe. Econ. Stud. 2024, 33, 179–200. [Google Scholar]
- Božić, F.; Karasalihović Sedlar, D.; Smajla, I.; Ivančić, I. Analysis of Changes in Natural Gas Physical Flows for Europe via Ukraine in 2020. Energies 2021, 14, 5175. [Google Scholar] [CrossRef]
- Islamov, D.R.; Akhmetkarimov, B.G.; Grishin, Y.Y.; Vagapova, F.G. The Russia and Turkey Factors in Hungary-Serbia Tandem’s Policies. Russ. Glob. Aff. 2024, 22, 130–150. [Google Scholar] [CrossRef]
- Sekulić, G. JANAF-strategic oil pipeline for security of supply of South-Eastern and Central Europe. Nafta 2014, 65, 151–154. [Google Scholar]
- Szpala, M. US Sanctions Targeting Russian Energy Assets in Serbia. Available online: https://www.osw.waw.pl/en/publikacje/analyses/2025-01-15/us-sanctions-targeting-russian-energy-assets-serbia (accessed on 17 February 2025).
- Żuk, P.; Buzogány, A.; Mišík, M.; Osička, J.; Szulecki, K. Semi-Peripheries in the World-System? The Visegrad Group Countries in the Geopolitical Order of Energy and Raw Materials after the War in Ukraine. Resour. Policy 2023, 85, 104046. [Google Scholar] [CrossRef]
- Stanojević, N. The economic effects of Serbian neutrality in the Ukrainian crisis: Risks and benefits. Ekon. Signali Posl. Mag. 2024, 19, 19–39. [Google Scholar] [CrossRef]
- Stanojević, N. Serbia’s multi-vector foreign policy: The effects on trade with the European Union and Russia. Post-Communist Econ. 2025, 37, 51–74. [Google Scholar] [CrossRef]
- Tranoulidis, A.; Sotiropoulou, R.E.P.; Bithas, K.; Tagaris, E. Decarbonization and Transition to the Post-Lignite Era: Analysis for a Sustainable Transition in the Region of Western Macedonia. Sustainability 2022, 14, 10173. [Google Scholar] [CrossRef]
- Marijuan, A.G.; Garay, R.; Lumbreras, M.; Vladic, L.; Savić, R. District Heating De-Carbonisation in Belgrade. Multi-Year transition plan. IOP Conf. Ser. Earth Environ. Sci. 2020, 588, 052034. [Google Scholar] [CrossRef]
- Miljković, M. Yugoslavia: The Creation of a Nuclear Policy in the 1960s. In Neutral Europe and the Creation of the Nonproliferation Regime; Routledge: London, UK, 2023; pp. 185–204. [Google Scholar] [CrossRef]
- Podbregar, I.; Filipović, S.; Radovanović, M.; Mirković Isaeva, O.; Šprajc, P. Electricity Prices and Consumer Behavior, Case Study Serbia—Randomized Control Trials Method. Energies 2021, 14, 591. [Google Scholar] [CrossRef]
- Hou, P. ‘’We will burn anything we can’’: Czech presidency and EU nuclear Renaissance. J. Contemp. Eur. Stud. 2024, 32, 203–214. [Google Scholar] [CrossRef]
- Hebda, W. Gas from the South, Not from Russia: The Possibility of Distributing Natural Gas from the Eastern Mediterranean to Poland and Central Europe. Energies 2024, 17, 1469. [Google Scholar] [CrossRef]
- Di Bella, G.; Flanagan, M.; Foda, K.; Maslova, S.; Pienkowski, A.; Stuermer, M.; Toscani, F. Natural gas in Europe: The potential impact of disruptions to supply. Energy Econ. 2024, 138, 107777. [Google Scholar] [CrossRef]
- Hebda, W. The North-South Gas Corridor in the Context of Poland’s Gas Transmission System—A Perfect Opportunity to Diversify Gas Resources. Energies 2021, 14, 7188. [Google Scholar] [CrossRef]
- Boston, W. Ukraine war plunges auto makers into new supply-chain crisis. Wall Str. J. 2022. Available online: https://rennlist.com/forums/attachments/718-gts-4-0-gt4-gt4rs-spyder-25th-anniversary/1327778d1646319806-718-gt4rs-ukraine-war-plunges-auto-makers-into-new-supply-chain-crisis-wsj.pdf (accessed on 23 January 2025).
- Krzikallová, K.; Krajňák, M.; Mandak, M.; Mlčochová, T. Gasoline and Diesel Tax Burden: The Case of the Czech and Poland Republics. In Proceedings of the 26th International Scientific Conference. Transport Means 2022, Kaunas, Lithuania, 5–7 October 2022; Available online: https://www.researchgate.net/profile/Katerina-Krzikallova/publication/365979040_Gasoline_and_Diesel_Tax_Burden_The_Case_of_the_Czech_and_Poland_Republics/links/638b1e3e7d9b40514e1000ff/Gasoline-and-Diesel-Tax-Burden-The-Case-of-the-Czech-and-Poland-Republics.pdf (accessed on 23 January 2025).
- Zimmermannova, J.; Smilnak, R.; Perunova, M.; Ameir, O. Coal or Biomass? Case Study of Consumption Behaviour of Households in the Czech Republic. Energies 2023, 16, 192. [Google Scholar] [CrossRef]
- Shriver, T.E.; Adams, A.E.; Longest, L. ‘’Cursed by Coal’’: Climate Change and the Battle over Mining Limits in the Czech Republic. Soc. Nat. Resour. 2022, 35, 111–128. [Google Scholar] [CrossRef]
- Durcansky, P.; Zvada, B.; Nosek, R.; Najser, J.; Najser, T. Evolution of Green Energy Production in Czech Republic. Appl. Sci. 2023, 13, 2185. [Google Scholar] [CrossRef]
- Ditl, P.; Šulc, R. Calculations of CO2 emission and combustion efficiency for various fuels. Energy 2024, 290, 130044. [Google Scholar] [CrossRef]
- Obradović, S.; Gričar, S.; Bojnec, Š.; Lojanica, N. Energy, Urbanisation and Carbon Footprint: Evidence from Western Balkan Countries. Urban Sci. 2025, 9, 119. [Google Scholar] [CrossRef]
- Jurda, M.; Němec, M. Remediation of the uranium industry in the Czech Republic: Regulation aspects and main technologies. J. Radiol. Prot. 2022, 42, 010504. [Google Scholar] [CrossRef]
- Kwan, J. Europe’s energy crisis hits science hard. Science 2022, 377, 1244–1245. [Google Scholar] [CrossRef]
- Sotnyk, I.; Sotnyk, M.; Kurbatova, T.; Prokopenko, O.V.; Telizhenko, O. Shaping cost-optimal and environmentally friendly strategies for household heating systems: Case of Ukraine. Energy Policy J. 2024, 27, 161–192. [Google Scholar] [CrossRef]
- Li, T.; Li, R.; Long, J.; Du, W.; Qian, F.; Mahalec, V. Reducing carbon footprint in cities: Natural gas-based energy generation with zero CO2 emission. Energy 2024, 299, 131371. [Google Scholar] [CrossRef]
- Pavesi, R.; Orsi, L.; Zanderighi, L. Enhancing Circularity in Urban Waste Management: A Case Study on Biochar from Urban Pruning. Environments 2025, 12, 5. [Google Scholar] [CrossRef]
- Javorac, J.; Živanović, D.; Ilić, M.; Milenković, A.; Vujičić, E.; Kovačević, D.; Zvekić-Svorcan, J.; Mikić, D.; Stojkov, S.; Bačevac Eminović, J.; et al. Air Pollution and COPD: Unveiling Hidden Risks of Mortality, Mechanical Ventilation, and Prolonged Hospitalization. Atmosphere 2025, 16, 36. [Google Scholar] [CrossRef]
- Volná, V.; Seibert, R.; Hladký, D.; Krejčí, B. Identification of Causes of Air Pollution in a Specific Industrial Part of the Czech City of Ostrava in Central Europe. Atmosphere 2024, 15, 177. [Google Scholar] [CrossRef]
- Křůmal, K.; Mikuška, P.; Horák, J.; Hopan, F.; Kuboňová, L. Influence of boiler output and type on gaseous and particulate emissions from the combustion of coal for residential heating. Chemosphere 2021, 278, 130402. [Google Scholar] [CrossRef]
- IQAir: World’s Most Polluted Cities. Available online: https://www.iqair.com/world-most-polluted-cities (accessed on 5 February 2025).
- European City Air Quality Viewer. Available online: https://www.eea.europa.eu/en/topics/in-depth/air-pollution/european-city-air-quality-viewer (accessed on 5 February 2025).
- Seibert, R.; Kotlík, B.; Kazmarová, H.; Dombek, V.; Volná, V.; Hladký, D.; Krejčí, B. Regional and Seasonal Drivers of Metals and PAHs Concentrations in Road Dust and Their Health Implications in the Czech Republic. Heliyon 2024, 10, e40725. [Google Scholar] [CrossRef]
- Martinková, E.; Kochergina, Y.V.E.; Šebek, O.; Seibert, R.; Chrastný, V.; Novák, M.; Štěpánová, M.; Čuřík, J.; Pacherová, P.; Přechová, E.; et al. Winter-Time Pollution in Central European Cities Shifts the 208Pb/207Pb Isotope Ratio of Atmospheric PM2. 5 to Higher Values: Implications for Lead Source Apportionment. Atmos. Environ. 2023, 310, 119941. [Google Scholar] [CrossRef]
- Volná, V.; Blažek, Z. Contribution to the study of possible transport of PM10 aerosols in the eastern part of the Czech Republic. Heliyon 2024, 10, e36850. [Google Scholar] [CrossRef]
- Brkić, D. European Efficiency Schemes for Domestic Gas Boilers: Estimation of Savings in Heating of Settlements. Algorithms 2025, 18, 416. [Google Scholar] [CrossRef]
- Mukhtar, M.; Ameyaw, B.; Yimen, N.; Zhang, Q.; Bamisile, O.; Adun, H.; Dagbasi, M. Building Retrofit and Energy Conservation/Efficiency Review: A Techno-Environ-Economic Assessment of Heat Pump System Retrofit in Housing Stock. Sustainability 2021, 13, 983. [Google Scholar] [CrossRef]
- Jeandaux, C.; Videau, J.-B.; Prieur-Vernat, A. Life Cycle Assessment of District Heating Systems in Europe: Case Study and Recommendations. Sustainability 2021, 13, 11256. [Google Scholar] [CrossRef]
- Foteinaki, K.; Li, R.; Péan, T.; Rode, C.; Salom, J. Evaluation of energy flexibility of low-energy residential buildings connected to district heating. Energy Build. 2020, 213, 109804. [Google Scholar] [CrossRef]
- Stolarski, M.J.; Warmiński, K.; Krzyżaniak, M.; Olba–Zięty, E.; Stachowicz, P. Energy consumption and heating costs for a detached house over a 12-year period–Renewable fuels versus fossil fuels. Energy 2020, 204, 117952. [Google Scholar] [CrossRef]
- Kalmár, F.; Bodó, B.; Li, B.; Kalmár, T. Decarbonization Potential of Energy Used in Detached Houses—Case Study. Buildings 2024, 14, 1824. [Google Scholar] [CrossRef]
- Sorgulu, F.; Ozturk, M.; Javani, N.; Dincer, I. Experimental investigation for combustion performance of hydrogen and natural gas fuel blends. Int. J. Hydrog. Energy 2023, 48, 34476–34485. [Google Scholar] [CrossRef]
- Stajić, L.; Đorđević, B.; Ilić, S.; Brkić, D. The volatility of natural gas prices-Structural shocks and influencing factors. Revista Int. Métodos Numéricos Cálculo Diseño Ing. 2021, 37, 48. [Google Scholar] [CrossRef]
- Stajić, L.; Praksová, R.; Brkić, D.; Praks, P. Estimation of global natural gas spot prices using big data and symbolic regression. Resour. Policy 2024, 95, 105144. [Google Scholar] [CrossRef]
- Horobeţ, A.; Dalu, M.A.; Negreanu, C. Evaluating the Impact of Energy Price Shocks on Emerging Countries from the Non-Euro Area: A Macroeconomic Analysis. Stud. Bus. Econ. 2024, 19, 334–349. [Google Scholar] [CrossRef]
- Komorowska, A.; Surma, T. Comparative analysis of district heating markets: Examining recent prices, regulatory frameworks, and pricing control mechanisms in Poland and selected neighbouring countries. Energy Policy J. 2024, 27, 95–118. [Google Scholar] [CrossRef]
- Iliyasu, J.; Mamman, S.O.; Abubakar, A.B.; Sanusi, A.R. Effects of adverse geopolitical risk on price bubbles contagion from European natural gas prices to international energy prices. J. Econ. Stud. 2025, 52, 605–619. [Google Scholar] [CrossRef]
- Chyong, C.K.; Henderson, J. Quantifying the economic value of Russian gas in Europe in the aftermath of the 2022 war in Ukraine. Energy 2024, 292, 130604. [Google Scholar] [CrossRef]
- Gomółka, K.; Kasprzak, P. Household Ability of Expenditures on Electricity and Energy Resources in the Countries That Joined the EU after 2004. Energies 2022, 15, 3052. [Google Scholar] [CrossRef]
- Jodeiri, A.M.; Goldsworthy, M.J.; Buffa, S.; Cozzini, M. Role of Sustainable Heat Sources in Transition Towards Fourth Generation District Heating—A Review. Renew. Sustain. Energy Rev. 2022, 158, 112156. [Google Scholar] [CrossRef]
- Boiler Efficiency Ratings. Available online: https://www.homeheatingguide.co.uk/efficiency-tables (accessed on 11 February 2025).
- Brkić, D. Efficiency of Distribution and Use of Natural Gas in Households. Ph.D. Thesis, University of Belgrade, Belgrade, Serbia, 2010. Available online: https://nardus.mpn.gov.rs/handle/123456789/2654 (accessed on 10 February 2025). (In Serbian).
- Heat Load and Heat Demand of Buildings. Available online: https://www.npro.energy/main/en/load-profiles/heat-load-and-demand (accessed on 11 February 2025).
- Wang, H.; Wei, J.; Guo, C.; Yang, L.; Wang, Z. Numerical Investigation of the Effects of Different Influencing Factors on Thermal Performance of Naturally Ventilated Roof. Energy 2024, 289, 130039. [Google Scholar] [CrossRef]
- Ignjatović, M.G.; Blagojević, B.D.; Blagojević, M.B.; Temeljkovski-Novaković, D.D. HVAC system influence during refurbishment on reaching nearly zero energy residential building in Serbia. Rev. Romana Ing. Civila 2020, 11, 360–374. [Google Scholar]
- Terhan, M. Waste Heat and Mass Recovery from Boiler Exhaust Gases in a New Generation District Heating System: Energy and Exergy Analysis. Arab. J. Sci. Eng. 2024, 49, 10613–10630. [Google Scholar] [CrossRef]
- Yang, H.; Lin, X.; Pan, H.; Geng, S.; Chen, Z.; Liu, Y. Energy saving analysis and thermal performance evaluation of a hydrogen-enriched natural gas-fired condensing boiler. Int. J. Hydrogen Energy 2023, 48, 19279–19296. [Google Scholar] [CrossRef]
- Malcher, X.; Gonzalez-Salazar, M. Strategies for decarbonizing European district heating: Evaluation of their effectiveness in Sweden, France, Germany, and Poland. Energy 2024, 306, 132457. [Google Scholar] [CrossRef]
- Javanshir, N.; Syri, S.; Hiltunen, P. The risks of electrified district heating in Finland’s cold climate. Renew. Sustain. Energy Rev. 2024, 202, 114652. [Google Scholar] [CrossRef]
- Savickas, R. Rapid Assessment of District Heating System in Belgrade. Report, 2018. Available online: https://orbit.dtu.dk/files/246853306/2018_BELGRADE_BELGRADE_Rapid_Assessment_final_2018_09_06_RS.pdf (accessed on 17 February 2025).
- Johnson, C. District heating in Belgrade: The politics of provision. In Infrastructures in Practice; Routledge: London, UK, 2018; pp. 102–114. [Google Scholar] [CrossRef]
- Rušeljuk, P.; Volkova, A.; Lukić, N.; Lepiksaar, K.; Nikolić, N.; Nešović, A.; Siirde, A. Factors affecting the improvement of district heating. Case studies of Estonia and Serbia. Environ. Clim. Technol. 2020, 24, 521–533. [Google Scholar] [CrossRef]
- Covenant of Mayors Committed to Urban Sustainable Energy: Sustainable Energy Action Plan for the City of Niš. Available online: http://mycovenant.eumayors.eu/docs/seap/19915_1418977253.pdf (accessed on 19 February 2025). (In Serbian).
- Železná, J.; Felicioni, L.; Trubina, N.; Vlasatá, B.; Růžička, J.; Veselka, J. Whole Life Carbon Assessment of Buildings: The Process to Define Czech National Benchmarks. Buildings 2024, 14, 1936. [Google Scholar] [CrossRef]
- Vimmr, T.; Loga, T.; Diefenbach, N.; Stein, B.; Bachová, L. Tabula—Residential Building Typologies in 12 European Countries—Good Practice Example from the Czech Republic. Central Europe Towards Sustainable Building 2013. Available online: http://cesb.cz/cesb13/proceedings/5_tools/CESB13_1200.pdf (accessed on 12 February 2025).
- Dabrock, K.; Ulken, J.; Pflugradt, N.; Weinand, J.M.; Stolten, D. Generating a nationwide residential building types dataset using machine learning. Build. Environ. 2025, 274, 112782. [Google Scholar] [CrossRef]
- Rogulj, I.; Peretto, M.; Oikonomou, V.; Ebrahimigharehbaghi, S.; Tourkolias, C. Decarbonisation Policies in the Residential Sector and Energy Poverty: Mitigation Strategies and Impacts in Central and Southern Eastern Europe. Energies 2023, 16, 5443. [Google Scholar] [CrossRef]
- Cecconi, M.; Cumo, F.; Pennacchia, E.; Romeo, C.; Zylka, C. BEST—Building Energy-Saving Tool for Sustainable Residential Buildings. Appl. Sci. 2025, 15, 6817. [Google Scholar] [CrossRef]
- TABULA Project: National Building Typologies—RS Serbia—Country Page. Available online: https://episcope.eu/building-typology/country/rs.html (accessed on 10 July 2025).
- TABULA Project: National Building Typologies—CZ Czech Republic—Country Page. Available online: https://episcope.eu/building-typology/country/cz.html (accessed on 12 February 2025).
- Kosanović, S.; Miletić, M.; Marković, L. Energy Refurbishment of Family Houses in Serbia in Line with the Principles of Circular Economy. Sustainability 2021, 13, 5463. [Google Scholar] [CrossRef]
- Vučićević, B.S.; Mrđa, D.B.; Turanjanin, V.M.; Škobalj, P.D.; Mladenović, M.R. Indoor temperatures affected by phase-change materials. Therm. Sci. 2023, 27, 4513–4523. [Google Scholar] [CrossRef]
- Petrović, B.; Zhang, X.; Eriksson, O.; Wallhagen, M. Life Cycle Cost Analysis of a Single-Family House in Sweden. Buildings 2021, 11, 215. [Google Scholar] [CrossRef]
- Dragutinovic, A.; Quist, W.; Pottgiesser, U. Spatiality of the urban commons: Typo-morphology of the open common spaces in New Belgrade mass housing blocks. Front. Archit. Res. 2023, 12, 444–457. [Google Scholar] [CrossRef]
- Ćorović, D.; Milinković, M.; Vasiljević, N.; Tilinger, D.; Mitrović, S.; Vuksanović-Macura, Z. Investigating Spatial Criteria for the Urban Landscape Assessment of Mass Housing Heritage: The Case of the Central Zone of New Belgrade. Land 2024, 13, 906. [Google Scholar] [CrossRef]
- Stojiljković, Z. Blockades and strikes in Serbia. SEER J. Labour Soc. Aff. East. Eur. 2025, 27, 283–284. [Google Scholar] [CrossRef]
- Ženka, J.; Krtička, L.; Paszová, L.; Pundová, T.; Rudincová, K.; Šťastná, S.; Svetlíková, V.; Matula, J. Micro-Geographies of Information and Communication Technology Firms in a Shrinking Medium-Sized Industrial City of Ostrava (Czechia). Land 2021, 10, 695. [Google Scholar] [CrossRef]
- Jarzebski, M.P.; Elmqvist, T.; Gasparatos, A.; Fukushi, K.; Eckersten, S.; Haase, D.; Goodness, J.; Khoshkar, S.; Saito, O.; Takeuchi, K.; et al. Ageing and population shrinking: Implications for sustainability in the urban century. Npj Urban Sustain. 2021, 1, 17. [Google Scholar] [CrossRef]
- Siksnelyte-Butkiene, I.; Streimikiene, D.; Lekavicius, V.; Balezentis, T. Energy poverty indicators: A systematic literature review and comprehensive analysis of integrity. Sustain. Cities Soc. 2021, 67, 102756. [Google Scholar] [CrossRef]
- Koďousková, H.; Lehotský, L. Energy poverty in the Czech Republic: Individual responsibility or structural issue? Energy Res. Soc. Sci. 2021, 72, 101877. [Google Scholar] [CrossRef]
Figure 1.
Total primary energy supply (bcm is billion cubic meters): (a) Serbia; (b) Czechia.
Figure 1.
Total primary energy supply (bcm is billion cubic meters): (a) Serbia; (b) Czechia.
Figure 2.
Smoke from the Rectorate of the University of Niš, Niš, Serbia (before it recently switched to natural gas).
Figure 2.
Smoke from the Rectorate of the University of Niš, Niš, Serbia (before it recently switched to natural gas).
Figure 3.
Predefined theoretical urban area with associated building types.
Figure 3.
Predefined theoretical urban area with associated building types.
Figure 4.
Example predefined urban area—16 buildings with a total of 51 theoretical dwellings altogether (two of many options for building typology), where the assigned peak heat load is 125 MW/km2 (in reality, it is around 116.5 MW/km2).
Figure 4.
Example predefined urban area—16 buildings with a total of 51 theoretical dwellings altogether (two of many options for building typology), where the assigned peak heat load is 125 MW/km2 (in reality, it is around 116.5 MW/km2).
Figure 5.
Predefined theoretical urban area, where the red line denotes the pipe network; tenfold larger for pipeline evaluation.
Figure 5.
Predefined theoretical urban area, where the red line denotes the pipe network; tenfold larger for pipeline evaluation.
Figure 6.
Adopted heating options based on investment costs: G (yellow), system with piped gas, vs. DH (blue), district heating system.
Figure 6.
Adopted heating options based on investment costs: G (yellow), system with piped gas, vs. DH (blue), district heating system.
Figure 7.
Adopted heating options for the prices of gas with the assumption that DH consumes 10% more gas for the same heat delivered (or that the alternate fuel for DH is 10% more expensive for the same heat delivered); G, system with piped gas, vs. DH, district heating system. (a) Serbia—gas price 2021, (b) Czech Republic—gas price 2021, and (c) Czech Republic—gas price 2022.
Figure 8.
Eastern City Gate, officially “Rudo”, with Konjarnik heating plant.
Figure 8.
Eastern City Gate, officially “Rudo”, with Konjarnik heating plant.
Figure 9.
Typical family houses in Belgrade.
Figure 9.
Typical family houses in Belgrade.
Figure 10.
Multi-family residential apartment buildings in Belgrade—apartment blocks.
Figure 10.
Multi-family residential apartment buildings in Belgrade—apartment blocks.
Figure 11.
Unfinished family houses.
Figure 11.
Unfinished family houses.
Figure 12.
Buildings in Niš. (a) Older single-family house. (b) Multi-family residential apartment buildings—older style. (c) Multi-family residential apartment buildings—modern.
Figure 12.
Buildings in Niš. (a) Older single-family house. (b) Multi-family residential apartment buildings—older style. (c) Multi-family residential apartment buildings—modern.
Figure 13.
Urban landscape of Ostrava, with clearly defined zones with family houses and multi-family residential buildings.
Figure 13.
Urban landscape of Ostrava, with clearly defined zones with family houses and multi-family residential buildings.
Figure 14.
Typical family houses in Ostrava.
Figure 14.
Typical family houses in Ostrava.
Figure 15.
Typical multi-family apartment residential buildings in Ostrava—apartment blocks.
Figure 15.
Typical multi-family apartment residential buildings in Ostrava—apartment blocks.
Figure 16.
Thermal insulation of urban houses in Ostrava.
Figure 16.
Thermal insulation of urban houses in Ostrava.
Figure 17.
Multi-family residential apartment buildings in Ostrava—apartment blocks. (a) Older design, but renovated. (b) Modern design. (b) Modern design.
Figure 17.
Multi-family residential apartment buildings in Ostrava—apartment blocks. (a) Older design, but renovated. (b) Modern design. (b) Modern design.
Figure 18.
Typologies and topologies of buildings suitable for different heating options: district heating DH (blue) and system with piped gas G (yellow) in Ostrava (Czechia) and Belgrade and Niš (Serbia).
Figure 18.
Typologies and topologies of buildings suitable for different heating options: district heating DH (blue) and system with piped gas G (yellow) in Ostrava (Czechia) and Belgrade and Niš (Serbia).
Table 2.
PM25 (μg/m
3) in Belgrade, Niš and Ostrava [
70].
Table 2.
PM25 (μg/m
3) in Belgrade, Niš and Ostrava [
70].
| Mean Concentration * | Belgrade | Niš | Ostrava |
|---|
| 2023 | 18.8 | 26.7 | 14.6 |
| \Jan 2023 | \31.3 | \46.7 | \18.1 |
| \Feb 2023 | \32.5 | \56.7 | \22.9 |
| \Mar 2023 | \19.4 | \29.8 | \17.5 |
| \Apr 2023 | \16.9 | \22.7 | \17.5 |
| \May 2023 | \12.5 | \13.5 | \12.8 |
| \Jun 2023 | \12.5 | \12.8 | \10.9 |
| \Jul 2023 | \12.4 | \12.6 | \8.6 |
| \Aug 2023 | \14.0 | \12.8 | \9.7 |
| \Sep 2023 | \13.3 | \12.8 | \12.2 |
| \Oct 2023 | \13.9 | \14.6 | \11.8 |
| \Nov 2023 | \14.5 | \27.4 | \10.9 |
| \Dec 2023 | \33.2 | \59.4 | \22.8 |
| 2022 | 22.1 | 31.9 | 18.7 |
| 2021 | 23.4 | 29.0 | 19.6 |
| 2020 | 24.3 | 32.0 | 16.8 |
| 2019 | 23.3 | 32.4 | 20.9 |
| 2018 | 23.9 | - | 30.1 |
| 2017 | 24.5 | - | 27.8 |
Table 3.
Typical heat load for buildings (in W/m
2) in Berlin, Germany * [
92].
Table 3.
Typical heat load for buildings (in W/m
2) in Berlin, Germany * [
92].
| Year of Construction | Single-Family Houses | Multi-Family Houses | Apartment Blocks |
|---|
| Before 1918 | 119 | 90 | 80 |
| 1919–1948 | 97 | 102 | 86 |
| 1949–1957 | 117 | 117 | 96 |
| 1958–1968 | 104 | 93 | 96 |
| 1969–1978 | 96 | 77 | 78 |
| 1979–1983 | 84 | 69 | 64 |
| 1984–1994 | 71 | 64 | 46 |
| 1995–2001 | 53 | 54 | 41 |
| after 2002 | 45 | 43 | 36 |
| 2 KfW 85 | 38 | 37 | 32 |
| KfW 70 | 32 | 30 | 25 |
| KfW 55 | 29 | 27 | 22 |
| KfW 40 | 22 | 19 | 15 |
| Passive house | 15 | 12 | 9 |
Table 4.
Number of theoretical dwellings per theoretical urban area of 50,000 m2 (5 ha).
Table 4.
Number of theoretical dwellings per theoretical urban area of 50,000 m2 (5 ha).
Total Heat Load of Basic Theoretical
Urban Area (MW/km2) | Heat Load for Buildings (W/m2) |
|---|
| 119 | 95 | 64 |
|---|
| 10 | 70.0 * | 87.7 | 130.2 |
| 20 | 140.1 | 175.4 | 260.4 |
| 30 | 210.1 | 263.2 | 390.6 |
| 40 | 280.1 | 350.9 | 520.8 |
| 50 | 350.1 | 438.6 | 651.0 |
| 75 | 525.2 | 657.9 | 976.6 |
| 100 | 700.3 | 877.2 | 1302.1 |
| 125 | 875.4 | 1096.5 | 1627.6 |
Table 5.
Number of theoretical dwellings per building *.
Table 5.
Number of theoretical dwellings per building *.
Heat Load for Buildings **
= 64 W/m2 | Number of Theoretical Dwellings on 5 ha |
|---|
| | 130.2 | 260.4 | 390.6 | 520.8 | 651.0 | 976.6 | 1302.1 | 1627.6 |
|---|
| Number of buildings on 5 hectares | 4 | 33.55 | 65.10 | 97.65 | 130.2 | 162.75 | 244.15 | 325.52 | 406.9 |
| 8 | 16.27 | 32.55 | 48.82 | 65.10 | 81.37 | 122.07 | 162.76 | 203.45 |
| 16 | 8.13 | 16.27 | 24.41 | 32.55 | 40.68 | 61.03 | 81.38 | 101.72 |
| 32 | 4.06 | 8.13 | 12.20 | 16.27 | 20.34 | 30.51 | 40.69 | 50.86 |
| 64 | 2.03 | 4.06 | 6.1 | 8.13 | 10.17 | 15.25 | 20.34 | 25.43 |
| 128 | 1.01 | 2.03 | 3.05 | 4.06 | 5.08 | 7.62 | 10.17 | 12.71 |
Table 10.
Evaluation of options. Yellow (G), system with piped gas, vs. blue (DH), district heating system; Grey (both, G and DH suitable).
Table 10.
Evaluation of options. Yellow (G), system with piped gas, vs. blue (DH), district heating system; Grey (both, G and DH suitable).
| | Number of Theoretical Dwellings in One Building to be Heated * |
|---|
| Number of buildings on 5 hectares | 4 | 34 (17) | 65 (32) | 98 (49) | 130 (65) | 163 (81) | 244 (122) | 326 (163) | 407 (203) |
| 8 | 16 (8) | 33 (16) | 49 (25) | 65 (32) | 81 (40) | 122 (61) | 163 (81) | 203 (101) |
| 16 | 8 (4) | 16 (8) | 24 (12) | 33 (16) | 41 (20) | 61 (30) | 81 (40) | 102 (51) |
| 32 | 4 (2) | 8 (4) | 12 (6) | 16 (8) | 20 (10) | 31 (15) | 41 (20) | 51 (25) |
| 64 | 2 (1) | 4 (2) | 6 (3) | 8 (4) | 10 (5) | 15 (7) | 20 (10) | 25 (12) |
| 128 | 1 (0-1) | 2 (1) | 3 (1) | 4 (2) | 5 (2) | 8 (4) | 10 (5) | 13 (6) |
| Disclaimer/Publisher’s Note: The statements, opinions and data contained in all publications are solely those of the individual author(s) and contributor(s) and not of MDPI and/or the editor(s). MDPI and/or the editor(s) disclaim responsibility for any injury to people or property resulting from any ideas, methods, instructions or products referred to in the content. |
© 2025 by the authors. Licensee MDPI, Basel, Switzerland. This article is an open access article distributed under the terms and conditions of the Creative Commons Attribution (CC BY) license (https://creativecommons.org/licenses/by/4.0/).


