Article

Evaluating Urban Mobility Resilience in Petrópolis Through a Multicriteria Approach

by
Alexandre Simas de Medeiros
1,
Marcelino Aurélio Vieira da Silva
1,
Marcus Hugo Sant’Anna Cardoso
2,
Tálita Floriano Santos
3,
Catalina Toro
4,5,
Gonzalo Rojas
4,5 and
Vicente Aprigliano
5,*
1
Program of Transportation Engineering, COPPE Federal University of Rio de Janeiro (UFRJ), Rio de Janeiro 21941-914, Brazil
2
Department of Transport, Chemical and Mining Engineering, Faculty of Engineering, Federal University of Mato Grosso (UFMT), Cuiabá 78060-900, Brazil
3
Center for Sustainable Development, University of Brasília (UnB), Brasília 70910-900, Brazil
4
Instituto de Geografía, Pontificia Universidad Católica de Chile (PUC-Chile), Santiago 7820436, Chile
5
Escuela de Ingeniería de Construcción y Transporte, Pontificia Universidad Católica de Valparaíso (PUCV), Valparaíso 2362807, Chile
*
Author to whom correspondence should be addressed.
Urban Sci. 2025, 9(7), 269; https://doi.org/10.3390/urbansci9070269
Submission received: 13 May 2025 / Revised: 3 July 2025 / Accepted: 8 July 2025 / Published: 11 July 2025
(This article belongs to the Special Issue Sustainable Urbanization, Regional Planning and Development)

Abstract

Urban mobility resilience plays a central role in sustainable urban planning discussions, especially considering the challenges of extreme events, climate change, and the increasing scarcity of fossil fuels. This study evaluates urban mobility resilience in Petrópolis (RJ), incorporating socio-spatial heterogeneity and energy vulnerability. This research fills methodological gaps in the literature by proposing a composite resilience index that integrates technical, socioeconomic, and fossil fuel dependency variables within a robust multicriteria framework. We selected eleven variables relevant to urban mobility and organized them into inference blocks. We normalized the variables using Gaussian functions, respecting their maximization or minimization characteristics. We applied the Analytic Hierarchy Process (AHP) to assign weights to the criteria and then aggregated and ranked the results using multicriteria analysis. The final index represents the adaptive capacity of urban territories facing the energy crisis, and we applied it spatially to the neighborhoods of Petrópolis. The analysis identified a significant concentration of neighborhoods with low resilience, particularly in quadrants, combining deficiencies in public transportation, high dependence on fossil fuels, and socioeconomic constraints. Factors such as limited pedestrian access, insufficient motorized public transport coverage, and a high proportion of elderly residents emerged as significant constraints on urban resilience. Intervention strategies that promote active mobility, improve accessibility, and diversify transportation modes proved essential for strengthening local resilience. The results emphasize the urgent need for public policies to reduce energy vulnerability, foster active mobility, and promote equity in access to transportation infrastructure.

1. Introduction

Urban mobility, an essential component of contemporary urban systems, faces increasing challenges due to disruptive events such as natural disasters, economic crises, infrastructure failures, pandemics, and ongoing concerns over the potential scarcity of specific energy resources. In this context, it becomes crucial to consider the relationship between mobility and the energy crisis, particularly given the current global scenario.
Globally, the world has been experiencing the effects of climate change as greenhouse gas emissions continue to rise [1]. Approximately 87% of global carbon dioxide (CO2) emissions result from the combustion of fossil fuels for energy production and material processing. In 2023, global energy-related greenhouse gas emissions exceeded, for the first time, 40 gigatons [2]. Fossil fuels account for 81% of global primary energy consumption, with oil, natural gas, and coal contributing 38%, 24%, and 29%, respectively [2,3].
Despite the already high levels, global energy consumption and fossil fuel dependency continue to increase annually, generating global uncertainties and environmental impacts [4]. Beyond environmental concerns, these figures highlight the strong dependence of the worldwide energy matrix on fossil fuels, whose future scarcity poses systemic risks to the continuity of essential urban services such as transportation.
The transport sector is among the main contributors to emissions, accounting for approximately 20% of the annual total, including non-CO2 gases [5]. In addition to the environmental impacts associated with fossil fuel combustion, concerns are mounting over the potential depletion of these resources, underscoring the urgent need for energy transition. According to reference [6], as oil is a finite resource, it is inevitable that global production will reach a peak followed by a decline. The only uncertainty lies in when this will occur and how rapidly the reduction will proceed. This situation is particularly critical for transportation, where fossil fuels remain fundamental, especially in developing countries [7,8,9]. In this context, assessing mobility resilience becomes essential to ensure the continuity of urban functions, particularly in territories marked by socio-spatial inequalities.
To better address the topic, urban mobility resilience is defined as the ability of a transportation system to maintain its functionality, adapt to disturbances, and recover after adverse events while ensuring accessibility, equity, and sustainability. According to reference [10], resilience encompasses three fundamental dimensions: persistence (resistance to shocks and recovery to functional state), adaptability (absorbing impacts without compromising system sustainability), and transformability (the capacity to reconfigure subsystems to address structural changes). This definition aligns with the conceptual approach proposed in [11] which highlights urban resilience as a multidimensional property related to the robustness, adaptive capacity, and integrative nature of urban systems when facing uncertainties and extreme events.
Urban resilience has become a key concept for understanding cities’ ability to withstand external shocks—such as extreme weather events, energy crises, and social imbalances. This notion has been increasingly incorporated into public policies and urban planning in recent years, emphasizing the importance of local governance and integration across essential sectors [12,13]. The recent literature on urban mobility resilience has primarily focused on extreme climate events. For example, the work by [14] used agent-based modeling for rail systems, while study [15] applied complex network analysis to metropolitan mobility patterns. However, these approaches often overlook a critical factor for urban system sustainability: the progressive scarcity of fossil fuels and its differentiated impacts on mobility.
In this context, Petrópolis emerges as a representative territory for this type of analysis. With a fragmented urban structure, steep topography, and recurring history of extreme events, the municipality presents vulnerabilities that compromise equitable access to mobility and require territorial assessment strategies sensitive to its physical and social reality. Moreover, in 2023, the transportation sector was responsible for 71.4% of the emissions associated with oil consumption in the city [16], highlighting its high dependence on this energy resource and the urgent need for adaptation, considering potential future shortages.
Thus, this article analyzes urban mobility resilience in Petrópolis, located in the mountainous region of the State of Rio de Janeiro, by considering its exposure to energy risks, particularly the potential scarcity of fossil fuels. The methodological approach develops a composite indicator integrating technical, socioeconomic, and energy-related variables structured through multicriteria methods. This study fills theoretical and methodological gaps in the recent literature, particularly by explicitly incorporating the energy dimension into resilient mobility assessment models.
Accordingly, this study advances the field by developing a composite resilience indica tor that integrates four fundamental dimensions: (1) active transportation, (2) accessibility, (3) social vulnerability, and (4) energy risk. The methodology combines Gaussian normalization to standardize heterogeneous variables with multicriteria methods (AHP) for indicator weighting, overcoming the limitations of conventional approaches. As its central innovation, the model incorporates proxies of fossil fuel dependency—such as bus travel time and coverage of motorized modes—enabling the evaluation of systemic vulnerability to energy scarcity scenarios.
Based on this framework, the methodological structure follows three main stages: selecting 11 key variables grouped into inference blocks, statistically normalizing the data to ensure dimensional comparability, and constructing a synthetic index (IB-11) through weighted aggregation. This approach addresses three challenges identified in the literature: fragmentation of sectoral analyses, absence of explicit energy indicators, and the need for tools adaptable to complex urban contexts, such as Petrópolis with its rugged topography and socio-spatial inequalities.
Despite achieving methodological advances and analytical robustness, this study acknowledges some limitations. The first concerns the reliance on secondary and self-reported data, particularly for variables such as access to motorized modes and predisposition to cycling, which field surveys collected. Since respondents provided these perceptions, individual biases and varying interpretations of terms may affect the precision of the estimates.
Another limitation concerns the availability of disaggregated data. In some dimensions, such as socioeconomic factors, accessing detailed information at the census tractor household level was impossible, requiring neighborhood-level averages. While valid, this approach tends to smooth internal variations and may obscure intra-neighborhood inequalities relevant to the analysis of urban resilience. Moreover, this study did not conduct temporal or evolutionary analyses of urban resilience, which limits the understanding of its dynamics over time and the effects of past or future interventions. Incorporating this temporal dimension constitutes an essential agenda for future research.
Applying the model to a single municipality restricts the direct generalization of results to other cities with different contexts. Although the methodology is replicable, the findings reflect a specific reality marked by steep topography, socio-spatial fragmentation, and a history of extreme events, requiring caution when extrapolating the results.
This article presents its content across five sections. The introduction presents the problem’s context, justifies the choice of Petrópolis as a case study, and states the research objective. The following literature review discusses the main concepts and approaches related to urban resilience and the energy crisis. The methodology section details the construction of the composite indicator based on thematically grouped variables and multicriteria weighting. The following section presents and discusses the results, focusing on the spatial resilience patterns observed in the municipality. Finally, the conclusion synthesizes the main findings and proposes recommendations for public policies and future research.

2. Literature Review

The energy vulnerability of urban systems, particularly in the transport sector, underscores the need to develop methodological approaches that integrate resilience, mobility, and sustainability. Although various techniques have addressed fragmented aspects of this issue, there remains a gap in the use of integrative models that combine socioeconomic, technical, and spatial data for diagnosis and decision-making.
In this context, the growing concern over fossil fuel scarcity and the need to transition toward sustainable mobility systems has driven research on urban resilience. This review highlights recent studies’ main contributions and methodological tools addressing strategies for adapting urban mobility to energy restriction scenarios.
As an example of applying advanced technologies for energy management, the authors of [17] proposed a multi-output deep learning model to forecast energy demand and electric vehicle (EV) charging port availability. The approach combined open data, advanced feature engineering, and machine learning techniques, demonstrating higher accuracy than traditional models. The central contribution lies in the model’s ability to improve charging infrastructure management, essential for reducing fossil fuel dependence.
Complementing this technological perspective with a focus on active mobility, study [18] applied machine learning to assess the resilience of bike-sharing systems during heatwaves, highlighting the influence of the built environment. The model achieved an explanatory power of up to 73.5%, indicating that accessibility to public transport and functional diversity enhance system robustness. These findings reinforced the strategic role of active mobility in building more resilient urban systems, particularly due to its low energy dependency, spatial flexibility, and capacity for integration with other sustainable transportation modes.
Regarding urban energy infrastructure, reference [19] reviewed strategies for sustainable cities, focusing on interactions between buildings, transportation, and electric grids. The study proposed a conceptual framework to integrate charging stations and hydrogen as critical nodes in resilient urban systems. By recognizing hydrogen as a structuring element of these networks, the authors highlighted its potential to strengthen urban energy autonomy, diversify supply sources, and ensure functional continuity under energy stress scenarios.
From a conceptual perspective, work by [20] introduced the concept of Resilience as a Service (RaaS) applied to transport networks and employed a conceptual and analytical approach to characterize resilience along three dimensions: robustness, adaptability, and recovery capacity. The methodology involved reviewing definitions of resilience applied to transport, constructing a taxonomy of failures and risks, and proposing distributed architecture with intelligent agents. Although the multicriteria analysis was not used, the authors proposed a theoretical framework based on functional resilience attributes to manage networks dynamically under failure conditions. This approach provided valuable insights for designing more intelligent and responsive transport systems capable of maintaining functionality even under severe operational constraints.
Recent research in urban energy vulnerability assessment has advanced through the integration of Geographic Information Systems (GIS) and multicriteria frameworks, enabling detailed spatial analysis of vulnerability across cities. One robust approach involves constructing composite indices from multiple indicators—such as accessibility, energy dependency, scarcity exposure, and response capacity—each normalized and empirically weighted to reflect local conditions. This method allows for the spatial classification of vulnerable areas, supporting targeted interventions and policy development. Similar frameworks have been applied to assess heat vulnerability in urban environments, using entropy-based weighting and neural network models to synthesize diverse indicators and reveal spatial disparities in risk, as demonstrated in studies of cities like Tianjin and Hangzhou [21,22]. Other research has emphasized the importance of including energy resilience and social vulnerability dimensions, particularly in the context of disaster shocks and energy crises, to provide a more comprehensive understanding of urban vulnerability patterns [23,24]. Multi-criteria decision analysis and the integration of geospatial big data are common methodological features, enhancing the precision and applicability of these assessments for urban planning and disaster management [22,25]. Overall, these frameworks offer actionable insights for policymakers aiming to enhance urban resilience and sustainability in the face of climate change and energy challenges [21,22,23].
Study [10] applied System Dynamics Modeling to investigate urban mobility resilience during the COVID-19 pandemic. The model was built using expert interviews and participatory validation, allowing for the simulation of public policy scenarios, behavioral changes, and infrastructure availability. Although the primary focus was pandemic shocks, the model provided methodological insights directly applicable to energy crises by capturing nonlinear interactions and feedback loops among urban subsystems (mobility, governance, and social behavior).
A conceptual proposal focused on the Brazilian context appears in [26], where the authors proposed a method to assess urban mobility resilience considering fossil fuel de pendency, with an application in Rio de Janeiro. The main contribution was the formulation of an index considering three resilience dimensions: persistence (the ability to maintain current mobility patterns), adaptability (responses to a hypothetical 100% increase in fossil fuel prices), and transformability (the presence of electric mobility projects over the past 20 years). The study identified that more than 50% of Rio’s districts exhibited low or low-to-medium resilience, mainly concentrated in peripheral areas characterized by low income and limited accessibility to metro stations or sustainable alternatives.
The methodology integrated socioeconomic, spatial, and infrastructure data, using sources such as IBGE, Prefecture do Rio, and MobiRio [27,28,29]. The tool considered the impact of transportation costs on various household expenditures (housing, leisure, and savings), classifying districts according to the vulnerability of these budget shifts. The results revealed significant spatial inequalities and highlighted the urgency of public policies that combine urban planning, sustainable transportation, and socioeconomic equity [26].
Consolidating the advances and limitations of the literature, study [11] conducted a systematic and critical review of community resilience assessment tools, highlighting multicriteria methodologies such as AHP, MCA (Multicriteria Analysis), and integrated indicator-based analyses. The author identified recurrent limitations in the reviewed tools, including the lack of empirical validation, absence of sensitivity analysis, and limited integration of social, environmental, and governance dimensions. This critique underscored the need to develop new composite indicators for specific contexts, such as urban mobility under energy scarcity.
Despite the conceptual and methodological progress observed in the recent literature, a significant gap remains in developing integrated models that articulate multiple dimensions—energy, socioeconomic, spatial, and functional—for assessing urban mobility resilience. Most studies focus on specific aspects of vulnerability or adopt sectoral approaches, limiting systemic diagnosis capabilities in complex urban contexts. Given the intensification of risks associated with fossil fuel scarcity, there is an urgent need to propose methodologies that not only capture the multifactorial nature of the problem but also support territorially grounded decision-making, considering intra-urban inequalities, challenging topographies, and differentiated levels of access to transportation modes. This gap constitutes the starting point for the present study, which seeks to advance the formulation of a composite indicator of urban mobility resilience grounded in energy, social, and infrastructure criteria.

3. Methodologies

This study developed a method to assess urban mobility resilience in Petrópolis by integrating technical and socioeconomic variables into a composite indicator. Between March and August 2023, the research team conducted 2846 interviews with public bus transportation users at the city’s bus terminals between 6:00 a.m. and 10:00 p.m. on both weekdays and weekends to collect data on mobility patterns and the socioeconomic characteristics of the local population.
The researchers designed the methodology to evaluate urban mobility resilience in Petrópolis through a composite indicator. They selected variables based on theoretical relevance, data availability, and consistency with the urban context under analysis while considering contemporary threats such as fossil fuel scarcity. The research team grouped the variables into inference blocks (IBs), normalized them according to their nature (maximization or minimization), and hierarchically aggregated them into the final indicator (IB-11). They applied multicriteria techniques, including AHP weights for pairwise comparison of variables and blocks, and conducted a comparative analysis with a non-weighted model to assess the model’s sensitivity. Additionally, they performed statistical and spatial analyses to identify the main factors that compromise urban resilience and to guide more effective intervention strategies.

3.1. Variables Used

This section presents the variables used for assessing urban mobility resilience in the municipality of Petrópolis. The criteria that justify the selection of these variables, as well as the methods employed for their collection and systematization, are also discussed.
As highlighted in [30], pedestrian accessibility to public transport terminals is a crucial basis for evaluating the adequacy of urban infrastructure. Moreover, the distance people are willing to walk to access public transportation varies considerably, influenced by factors such as urban density, infrastructure, and individual needs [31]. In this regard, as suggested by reference [32], long walking times to terminals reduce the system’s ability to absorb shocks and maintain service continuity. Adequate pedestrian infrastructure contributes to developing more balanced and resilient mobility systems [33]. For this reason, [34] argue that promoting walkability is a central strategy for mitigating vulnerabilities and increasing the adaptive capacity of territories.
Shorter bicycle travel times can enhance modal competitiveness over motorized transportation [35]. Bicycles naturally extend public transit when access times remain competitive [36]. Expanding cycling infrastructure around public transport terminals reduces automobile dependency and increases system efficiency [37]. Resilient cities should consider educational and cultural policies to encourage bicycle adoption [38], and even the expectation of improving cycling infrastructure positively influences the intention to use bicycles [39]. The predisposition to cycling increases in areas offering predictability and support for daily commuting [40].
Therefore, understanding how easily public transport users access infrastructure via active modes is relevant in studies evaluating urban mobility resilience. For this reason, during the interviews with public transport users, information was collected on travel times to terminals, specifically for those using active transportation modes.
In this context, excessive slopes significantly reduce pedestrian and cycling accessibility, limiting sustainable mobility [41]. Topography and urban layout directly influence the experience and feasibility of walking [42]. Walking requires greater physical effort in cities with steep terrain, demanding appropriate infrastructure to promote active mobility [42]. Topography and the type of urban infrastructure along the route also influence cycling trip duration [43,44]. Slopes above 5% represent significant barriers for cyclists, reducing their ability to adhere to the system [45]. The terrain slope is as determinant as traffic in shaping cyclists’ perception of comfort and safety [46].
This irregular terrain analysis, therefore, becomes fundamentally important since physical barriers and forced detours increase effort and travel time, discouraging the use of active modes such as cycling [47]. To incorporate topography into the analysis of urban mobility resilience in the study area, a Geographic Information System (GIS)-based approach was employed. A Digital Elevation Model (DEM) with a spatial resolution appropriate for the urban scale was processed using QGIS software (version 3.28.7). First, all data were reprojected to the SIRGAS 2000/UTM Zone 23S (EPSG:31983) reference system and the DEM was clipped to the municipal area. The Slope tool was then applied to generate a raster layer representing the terrain slope in degrees. Based on this raster, the average slope for each neighborhood was calculated using the Zonal Statistics tool, providing a spatial indicator of slope-conditioned accessibility. Additionally, slopes along the road network were computed using the Road Slope Calculator tool, enabling the quantification of route gradients, which is particularly relevant for assessing cycling feasibility along daily commuting paths.
Another highly relevant element for this research concerning urban mobility resilience assessment is the use of the public transportation system within the study area. The frequency and distribution of public transport access points are determinants for ensuring spatial justice in urban mobility [48]. Increasing access strengthens transportation as an interdependent and resilient system [49]. However, dependency on other motorized modes, especially private automobiles, remains significant in many cities, including Petrópolis. In this context, private vehicle-based access compromises equity and adaptability in urban mobility [50,51].
Alternative modes to motorized transport are strategic for maintaining urban mobility during energy shocks [51]. For these reasons, a central part of the public transport user survey focused on identifying the modes used to access terminals. Specifically, the number of users who accessed the system by bus and those who used other motorized modes was quantified. This distinction reveals the degree of fossil fuel dependency, which is crucial in assessing urban mobility resilience under energy crisis scenarios.
Time is a highly relevant factor in assessing urban mobility resilience. Terminal access time is one of the first indicators affected by system disruptions [52]. The promptness with which users access public transport determines system resilience during crises [53]. Minimizing bus access time is essential for ensuring resilient and sustainable routes [54]. Perceived access time to urban activities is a key determinant in choosing sustainable and conventional modes. Ultimately, the efficiency of urban mobility directly depends on how quickly users can access major transport terminals [55]. Based on these studies and the importance of access time as a resilience indicator, the questionnaire applied to public transport users included specific questions about travel time to terminals, particularly for those accessing them by bus.
In transportation studies, regional attractiveness constitutes a key element for understanding travel flows, as it indicates areas with higher concentrations of activities and, consequently, more frequent urban travel destinations. Beautiful areas tend to concentrate on essential urban functions such as commercial centers, educational institutions, healthcare facilities, and public amenities—making them convergence points within the mobility system.
However, due to the absence of open-access databases containing detailed information on the spatial distribution of these opportunities for the city under study, population distribution was adopted as a proxy for urban attractiveness. Population distribution directly influences mobility patterns and may signal the location of access opportunities [56]. Without direct data on employment and economic activities, population density offers a valid estimate of the potential demand for services and transportation [57]. The concentration of residents within accessible areas is a reliable indicator of local attractiveness [57]. Finally, to assess resilience as proposed in this study, it is also necessary to examine other socioeconomic factors, such as the age group and income levels of public transport users. Socioeconomic vulnerability is intrinsically related to the resilience of urban commuting, as socially disadvantaged groups tend to have lower response and adaptation capacity when facing disruptive events [58].
In this sense, mobility solutions that reflect the population’s functional and social diversity enhance a city’s resilience [59] and promote territorial equity in providing modal alternatives [60]. Age has a significant influence on mobility resilience. Resilient systems must ensure safe accessibility for all age groups, especially in crisis scenarios where elderly populations face greater barriers to safe and autonomous mobility [61,62]. Thus, resilient transport networks must be adapted to accommodate older users’ physical and cognitive limitations, ensuring their inclusion in transportation systems during regular and emergencies [63].
Similarly, income plays a decisive role in mobility patterns. Resilience investments based solely on efficiency or demand criteria may exacerbate existing inequalities by prioritizing areas with higher population densities to the detriment of economically vulnerable regions [63]. Low-income populations are disproportionately affected by transportation system failures during extreme events due to their limited adaptive capacity [64]. Moreover, income influences travel distance and time, the mode of transport used, and the level of comfort and safety experienced throughout the trip [65]. Income simultaneously determines the purchasing power to afford transportation and the degree of exposure to risks and mobility deprivation [66]. In this context, the inclusion of socioeconomic variables in resilience analysis not only enhances the methodological robustness of this study but also reinforces the need for public policies committed to spatial justice and universal access to urban mobility in adverse contexts.
Based on the considerations outlined above, this study selected eleven variables according to technical criteria, data availability, and their relevance for assessing urban mobility resilience considering contemporary threats such as fossil fuel scarcity. The researchers organized these variables into groups according to their optimization nature:
Minimization criteria (the lower, the better):
  • Walking time to the bus terminal;
  • Bicycle travel time to the bus terminal;
  • Terrain slope;
  • Percentage of elderly population;
  • Elderly percentage (IBGE);
  • Bus access time to the bus terminal.
Maximization criteria (the higher, the better):
  • Pedestrian access to bus terminals;
  • Predisposition to cycling;
  • Bus access to bus terminals;
  • Access by other motorized modes to bus terminals;
  • Declared monthly income;
  • Local average income based on census data (IBGE);
  • Population residing within a five-minute walking radius.
The variables used in constructing the resilience indicator are as follows: Table 1 was created based on their theoretical relevance, data availability, and ability to represent distinct dimensions of urban mobility and socioeconomic conditions. The following table describes the variables and their respective data sources.
Figure 1 presents the conceptual and methodological framework of the composite indicator named IB-11–Urban Mobility Resilience under Fossil Fuel Scarcity, proposed to assess the adaptive capacity of urban territories in energy crisis scenarios, with a particular focus on mobility.
The diagram is structured hierarchically, organizing the indicators into inference blocks (IBs) aggregated into the final index. This hierarchy follows a functional logic integrating accessibility, mobility, socioeconomic conditions, and energy dependency Active Accessibility Blocks.
The first three blocks group indicators related to non-motorized travel ease. The calculation of IB-1 (Pedestrian Access Ease) and IB-2 (Bicycle Access Ease) relies on variables such as access time to the terminal and local topography, which directly affect the feasibility of these modes. The aggregation of these two blocks forms IB-3 (Active Transport Accessibility), which synthesizes active accessibility conditions within the territory. Additionally, IB-4 (Active Transport Mobility) incorporates variables such as pedestrian access and predisposition to cycling, capturing the potential use of active modes in daily mobility.
Public Transport and Motorized Modes Block
IB-6 (Mobility Indicator) encompasses aspects of collective transportation mobility, such as bus travel time and the number of motorized accesses. This block is directly influenced by IB-7 (Fossil Fuel Dependency), reflecting energy vulnerability associated with the intensive use of fossil fuel-dependent modes.
Social Block
IB-8 (Social Mobility Constraints) aggregates socio-spatial variables such as population density within a walkable five-minute radius, percentage of elderly population, and average monthly income. This block captures the social barriers that limit the population’s ability to move around.
Socioeconomic Factor
IB-10 represents an aggregated measure of economic and demographic factors that transversally affect urban mobility. Intermediate Aggregations IB-5 (Active Transport Factor) synthesizes IB-3 and IB-4, reflecting the territory’s readiness for active transportation modes. Subsequently, IB-5, IB-6, and IB-7 are grouped into IB-9 (Transport Indicator), which represents the functional dimension of urban mobility, considering different transportation modes and energy dependency. Finally, IB-9 and IB-10 are combined to form IB-11, which expresses Urban Mobility Resilience under energy constraint scenarios.

3.2. Parameterization and Normalization

For the normalization stage, the researchers adopted a Gaussian membership function, which assigns continuous values between 0 and 1, offering greater sensitivity to differences in intermediate ranges and compressing extreme values. This approach is particularly suitable for urban resilience studies, in which territorial performance is not absolute (binary) but distributed along a gradient of vulnerability. The choice of the Gaussian function also prevents outliers from exerting a disproportionate influence on the results, as can occur with simple linear normalization methods. Moreover, this technique is compatible with the gradual inferential reasoning that characterizes the inference block model adopted, contributing to the stability and coherence of the composite indicators. The distinction between maximization and minimization variables was considered in the formulation of the function, respecting the expected optimization direction of each criterion. Combining Gaussian normalization and AHP-based weighting resulted in a flexible, interpretable, and methodologically robust model for Petrópolis’s urban and topographic context.
The normalization stage is fundamental in constructing composite indicators, especially when input variables present different scales and directions of impact on the phenomenon under analysis. According to the OECD guidelines [68], normalization aims to aggregate variables coherently, ensuring that their values are comparable on a standard scale. Among the most widely used methods are min-max normalization, z-score standardization, and transformations based on rankings or distances from an ideal situation [69].
In this study, the researchers adopted a normalization function based on the Gaussian distribution, using the variable’s minimum value as a reference and adjusting it by the standard deviation. This approach normalizes the data, smooths the influence of extreme values, and preserves the dispersion structure. The team developed this methodological adaptation for this project to ensure directional consistency with each variable’s maximization and minimization criteria. Equation (1) applies to maximization criteria.
x = 1 e x x m i n 2 2 σ 2 .
For minimization criteria, Equation (2) was adopted.
x = e x x m i n 2 2 σ 2 .
This type of normalization ensures that all variables are transformed onto a standard scale (0 to 1), promoting equity in the composition of the final indicator. The involved variables present different natures in constructing a composite indicator such as IB-11–Urban Resilience. Some variables, when increasing, represent improvements in urban conditions, while others, when growing, indicate worsening vulnerability. Therefore, it is necessary to apply maximization and minimization criteria to standardize the interpretation of these variables.
The normalization of variables followed previously defined rules according to the nature of each attribute involved in calculating the inference blocks. Variables were classified as max when higher values indicate better territorial performance in urban resilience and min when lower values are more desirable. Normalization was applied so that all variables, regardless of their original nature, resulted in values between 0 and 1 with a consistent interpretative meaning: the closer to 1, the greater the positive contribution to resilience. For example, the model treated variables such as Pedestrian Access, Predisposition to Cycling, and Average Monthly Income as maximization criteria. In contrast, it treated variables such as Walking Time to the Terminal, Slope, Percentage of Elderly Population, and Bus Access Time to the Terminal as minimization criteria. This methodological distinction allowed for the correct structuring of the inference blocks (IB-1 to IB-10) and ensured consistency in the subsequent aggregation to calculate the Urban Resilience Index (IB-11), maintaining technical rigor and alignment with the objectives of the multicriteria analysis.
Defining these criteria is essential to prevent variables with opposite effects from canceling each other out in the composition of the indicator. Through this standardization, all variables “point in the same direction”: normalized values closer to 1 always represent higher resilience, while values closer to 0 represent greater vulnerability.
The normalization stage applies these criteria in practice. The researchers transform the variables using adjusted Gaussian functions according to their nature: for maximization variables, they convert higher values into values closer to 1; for minimization variables, they assign higher weights to lower values after the transformation. The adopted normalization method ensures fairness and consistency in aggregating data with different scales and meanings, resulting in a final indicator that accurately and comparably represents the urban reality under analysis.

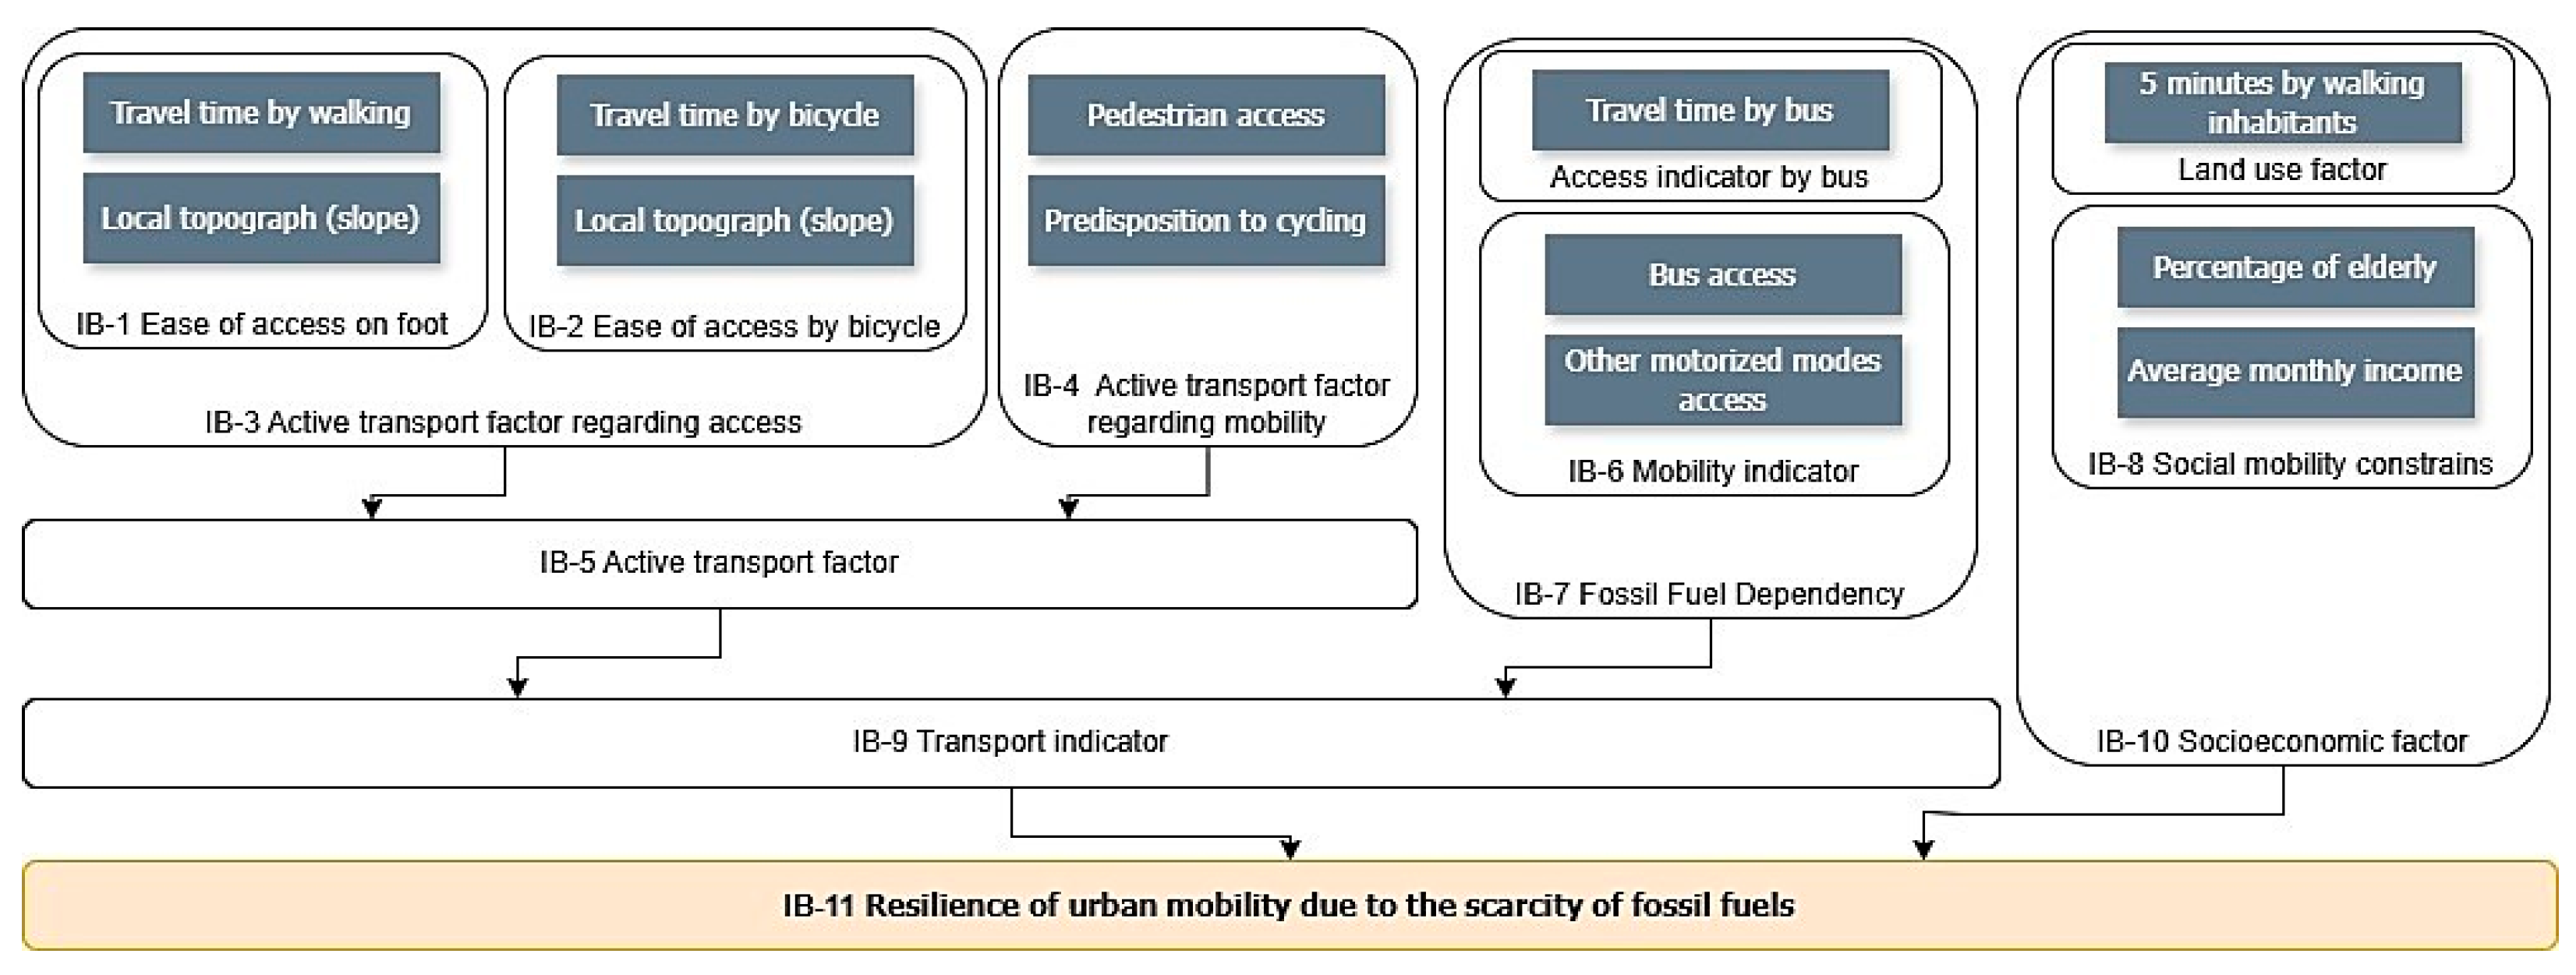
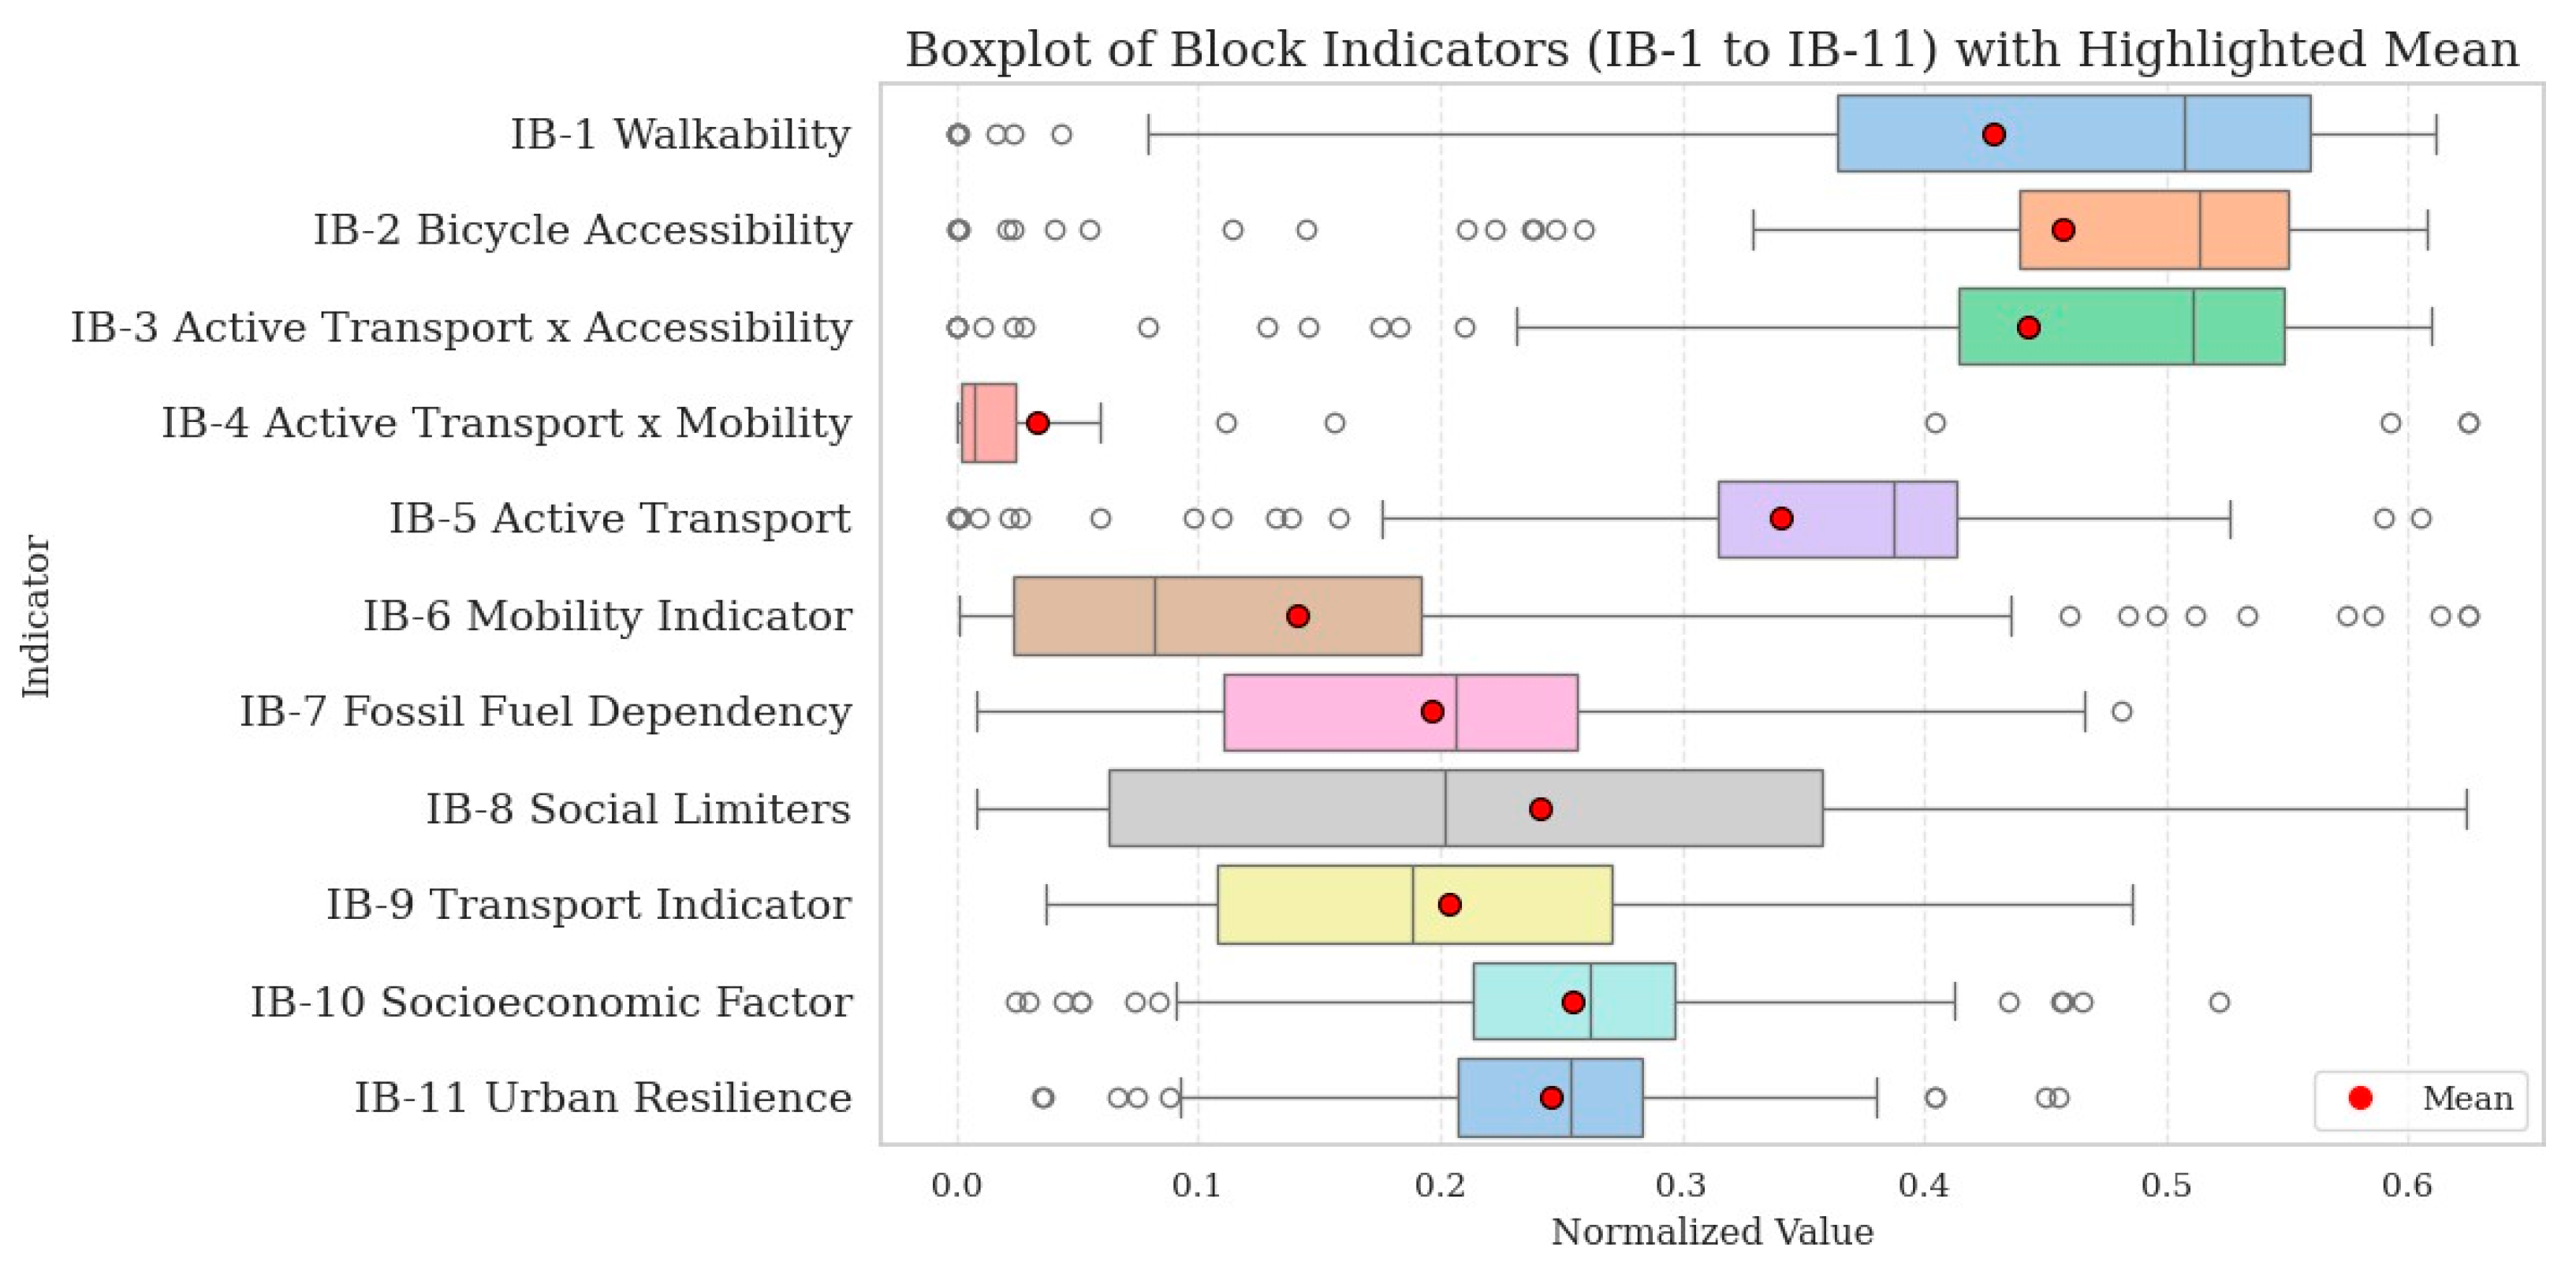
3.3. Formation of Inference Blocks

According to their conceptual affinity, the normalized variables were organized into inference groups called inference Blocks (IB-1 to IB-10) to structure the evaluation of urban mobility resilience coherently and integrated. This approach organizes dimensions related to active transportation, accessibility, motorized mobility, and socioeconomic factors, facilitating data interpretation and supporting public policy formulation. The following section presents the composition of each block:
  • IB-1: Pedestrian Access Ease = average of [Walking Time to Terminal, Slope]
  • IB-2: Bicycle Access Ease = average of [Bicycle Travel Time to Terminal, Slope]
  • IB-3: Active Transport × Accessibility = average of [IB-1, IB-2]
  • IB-4: Active Transport Mobility = average of [Pedestrian Access, Predisposition to Cycling]
  • IB-5: Active Transport Factor = average of [IB-3, IB-4]
  • IB-6: Mobility Indicator = average of [Bus Access, Access by Other Motorized Modes]
  • IB-7: Fossil Fuel Dependency = average of [Bus Access Time to Terminal, IB-6]
  • IB-8: Social Mobility Constraints = average of [Percentage of Elderly Population, Average Monthly Income]
  • IB-9: Transport Indicator = average of [IB-5, IB-6, IB-7]
  • IB-10: Socioeconomic Factor = average of [IB-8, Population Residing Within a 5-Minute Walking Radius]
The Urban Resilience Indicator (IB-11) was calculated as the average of the Transport Indicator and the Socioeconomic Factor, as expressed in Equation (3).
I B ( 11 ) = α . I B 9 + β . I B ( 10 ) 2

3.4. Analysis of Factors Compromising Resilience

Based on the distribution of IB-11 values, the statistical analysis applied quartiles, especially the first quartile (Q1), to identify neighborhoods with lower levels of urban resilience. However, the analysis primarily focused on determining which inference blocks compromised the performance of the IB-11 indicator. To achieve this, the inference blocks were evaluated according to the following statistical rules:
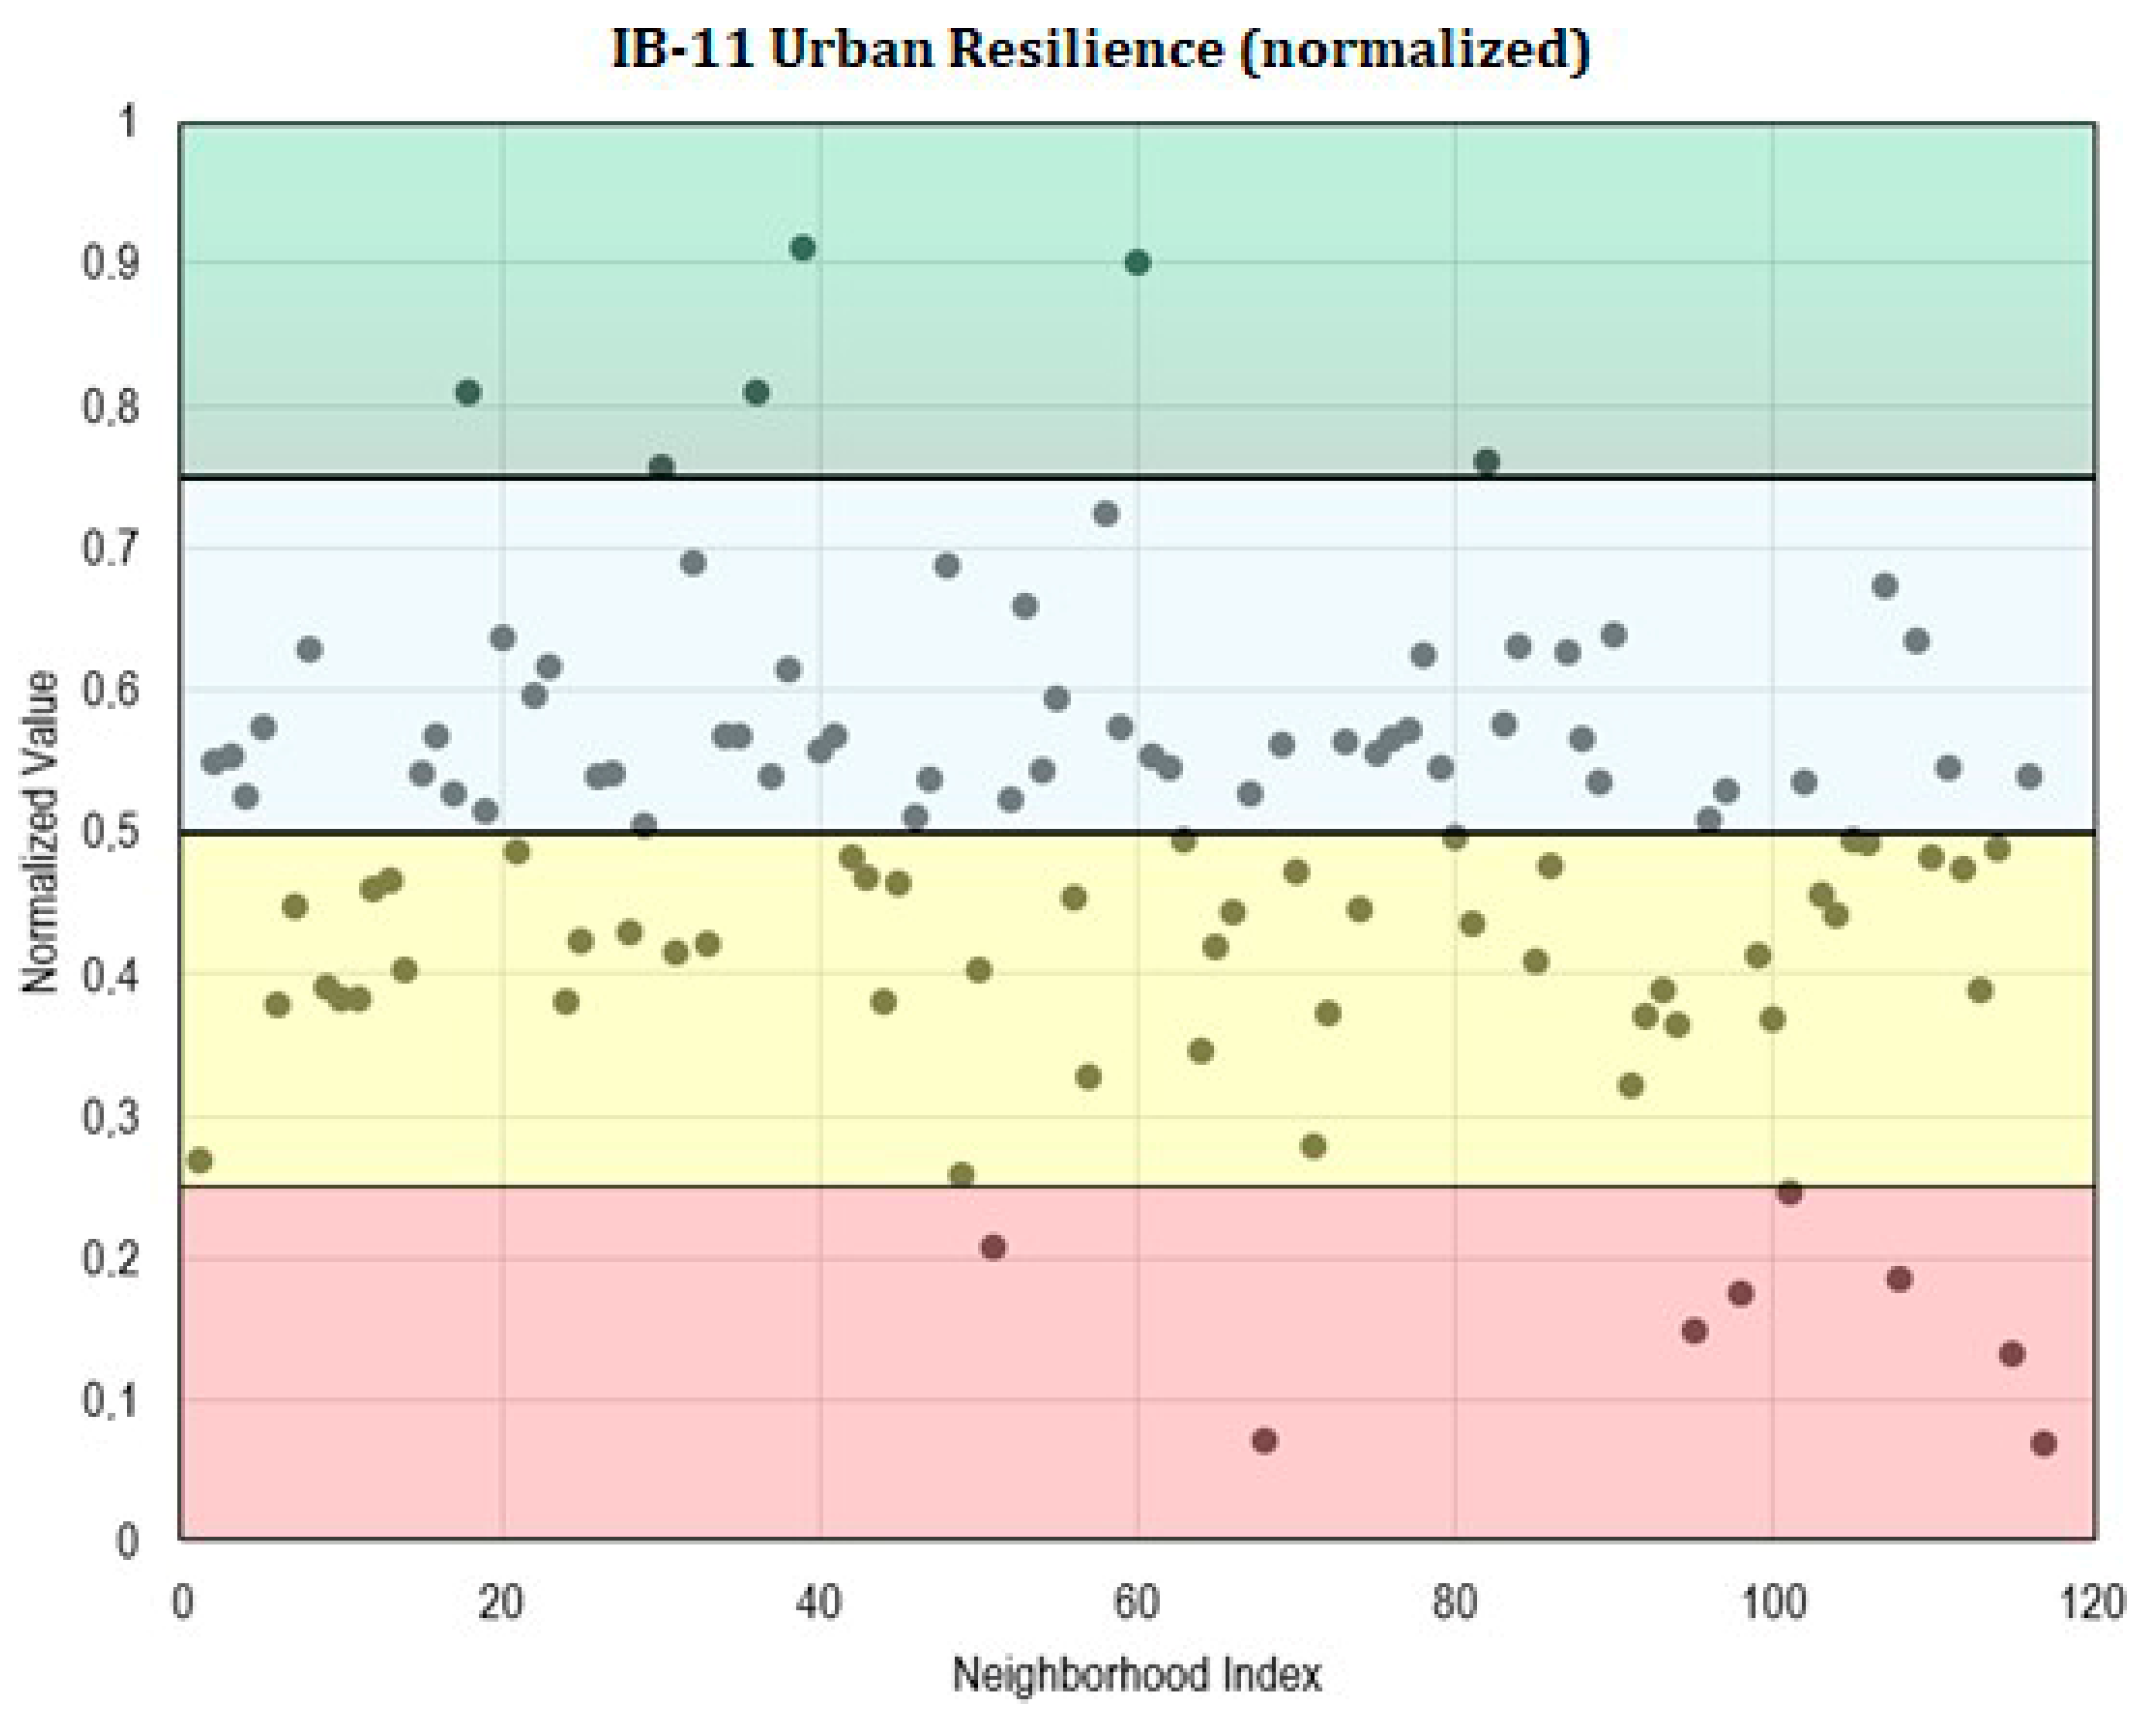
  • For max blocks (where higher values indicate better performance), values below the media represent resilience-compromising factors.
  • For min blocks (where lower values indicate better performance), values above the medians represent resilience-compromising factors.
This approach allowed for identifying each neighborhood with low IB-11 performance of the specific dimensions (such as active mobility, collective transport accessibility, socioeconomic limitations, etc.) that most negatively affected urban resilience. Based on these results, more thematically targeted actions can be designed, optimizing the effectiveness of public interventions.
The analysis examined the inference blocks to identify which aspects most contribute to lower resilience, applying descriptive statistics (mean and media) to each block. The classification rules were as follows:
  • For max blocks, values below the media indicate low resilience.
  • For min blocks, values above the media indicate low resilience.
This classification highlighted which dimensions (active mobility, motorization, social limitations, etc.) negatively impact the resilience of each neighborhood, guiding targeted measures. Furthermore, the analysis assessed the interactions between all inference blocks defined in this study to classify neighborhoods into four strategic quadrants:
  • Quadrant I (high-high): Resilient neighborhoods with good conditions across the analyzed dimensions, considered lower priority for intervention;
  • Quadrant II (low-high): Neighborhoods with weakness in one specific dimension but good conditions in another, indicating high potential for rapid improvements;
  • Quadrant III (low-low): Critical areas requiring integrated interventions due to simultaneous deficiencies across the analyzed dimensions and
  • Quadrant IV (high-low): Neighborhoods with good conditions in one dimension but significant vulnerability in another, requiring specific combined interventions.
The analysis examined all interactions among the defined inference blocks (IB-1 to IB-10) to identify the aspects requiring prioritized improvements to enhance urban resilience. The application of multicriteria analysis methods allows for adjusting territorial intervention strategies according to technical and social criteria, thereby strengthening the response and recovery capacity of the Petrópolis neighborhood.
The classical list of weights, Table 2, used in the Analytic Hierarchy Process (AHP) method, as proposed by Saaty [70], along with their respective interpretations:
Additionally, this study will compare the results obtained by applying AHP-derived weights with those from unweighted normalizations, where all variables influence the resilience indicator equally. This comparison will allow for an analysis of the impacts of differentiated weight assignments on territorial prioritization and intervention strategies, providing a critical perspective on the relative importance of the criteria adopted in assessing urban resilience.
This study also presents the hierarchical structure of the inference blocks and variables that compose the Urban Mobility Resilience Indicator (IB-11). The relative weights for the variables and inference blocks were defined using the Analytic Hierarchy Process (AHP) method through pairwise comparisons of the criteria within each block and between blocks. This approach reflects the assigned importance structure for each indicator component based on technical judgments and theoretical references, capturing the relative importance of each criterion in the context of multicriteria evaluation. The table details the internal components of each block, and the respective weights used in the model composition.
After constructing the pairwise comparison matrix, the analysis divides each matrix element by the sum of its columns. This procedure generates the normalized matrix, in which each column equals 1. Next, for each row, the arithmetic mean of the normalized values is calculated, resulting in the relative weight of each variable.
For the IB-1 block, for example, the variable “walking time to terminal” was considered moderately more important than “slope,” assigning a value of 3 to the first and 1/3 to the second. The “walking time to terminal” column was one plus 1/3, totaling 4/3; the “slope” column was 3 plus 1, totaling 4. Dividing each element of the matrix by the sum of its column yields 0.75 for both entries in the “walking time to terminal” row and 0.25 for both entries in the “slope” row. The average of the “walking time” row values is 0.75, while the average of the “slope” row values is 0.25.
These final values represent the weights assigned to the variables within the block, reflecting their relative importance in the context of the analysis.

4. Results and Discussion

This section presents and interprets the main results obtained from applying the proposed model for evaluating urban resilience in the municipality of Petrópolis. The analysis begins with a statistical verification of the internal consistency among the inference blocks through collinearity analysis, considering the weights defined by the AHP method to ensure informational independence between the groupings used in the composition of the indicator.
Subsequently, the Urban Resilience Indicator (IB-11) territorial results are presented and obtained through normalizing and aggregating technical, socioeconomic, and energy-related variables. The spatial analysis is accompanied by a critical interpretation of the observed patterns, allowing the identification of areas with varying levels of resilience performance and the inference of possible causes associated with urban infrastructure and social conditions, as shown in Table 3.
Additionally, the average performances of the inference blocks are discussed based on their respective optimization rules (maximization or minimization) to highlight the strengths and weaknesses of the analyzed urban system. Finally, a cross-analysis between IB-9 (Transport Indicator) and IB-10 (Socioeconomic Factor) is presented through the quadrant matrix, enabling a strategic interpretation of the distribution of urban vulnerabilities and potentialities according to different weighting criteria. This set of analyses provides support for reflections on public policies aimed at promoting equity and urban resilience.
For the execution of the pairwise comparisons and the determination of the criteria weights, two experts affiliated with the Transportation Engineering Program were consulted. These professionals were selected intentionally, considering their extensive academic and practical experience in the field of transportation, ensuring that the judgments used in the weighting process were well-founded and consistent. The participating experts were Professor Marcelino, who holds a Ph.D. in Transportation Engineering and works in the area of Transportation Planning and Management in the academic sector, with 20 years of professional experience, and Alexandre Simas de Medeiros, a Postdoctoral Researcher in the same program, working in the area of Transportation Planning and Infrastructure, also in the academic sector, with 10 years of professional experience. The pairwise comparisons conducted by the experts resulted in a consistency ratio below 0.1, indicating coherence in the judgments.

4.1. Collinearity Analysis Between Block Pairs (With AHP Weights)

Collinearity analysis is essential to verify whether the blocks considered in the model provide truly distinct information. By identifying high correlations between variables, it is possible to avoid redundancies, ensure the statistical consistency of the composite indicator, and guarantee that each dimension contributes in a balanced way to the analysis. Adopting this hierarchical structure makes the model more robust, interpretable, and conceptually valid.
Based on the hierarchical structure of the blocks and the weights assigned through the AHP method, the analysis examined collinearity between specific pairs of conceptually connected blocks. This step is fundamental in verifying the model’s statistical consistency and identifying possible redundancies or complementarities between inference groupings.
The following section presents the main Pearson correlation results between the blocks:
  • IB-1 × IB-2 (ρ = 0.81): The correlation between the pedestrian and bicycle access blocks is high, indicating that these two aspects share a substantial similarity, especially considering that both use slope as a sub-variable. This collinearity is expected, given the similarity of the transportation modes analyzed.
  • IB-3 × IB-4 (ρ = 0.12): The factors relating active transport to accessibility (IB-3) and mobility (IB-4) show a low correlation, demonstrating that these dimensions represent distinct aspects within active transportation: the former focuses on access potential, while the latter addresses actual use or predisposition.
  • IB-5 × IB-7 (ρ = 0.15): The low correlation between the active transport factor (IB-5) and fossil fuel dependency (IB-7) reinforces that these blocks capture independent dimensions, with the former associated with active modes and the latter with motorized infrastructure dependent on fossil energy.
  • IB-7 × IB-9 (ρ = 0.40): A moderate correlation is observed here, which is expected since IB-9 aggregates both active and motorized components. Fossil fuel dependency partially contributes to the overall transport indicator.
  • IB-8 × IB-10 (ρ = −0.07): The correlation between social mobility constraints (IB-8) and the socioeconomic factor (IB-10) is practically null and negative, indicating that the aspects considered (such as the percentage of elderly population, income, and population within walking distance) are statistically independent. This distinction is important to preserve the plurality of social perspectives within the model.
These results confirm that the model structured the selected blocks conceptually well and avoided excessive overlap, except for the relationship between IB-1 and IB-2. The analysis allows the model to maintain the high collinearity observed in the IB-1 × IB-2 pair as long as it recognizes this condition as a combination of elements strongly associated with physical accessibility.

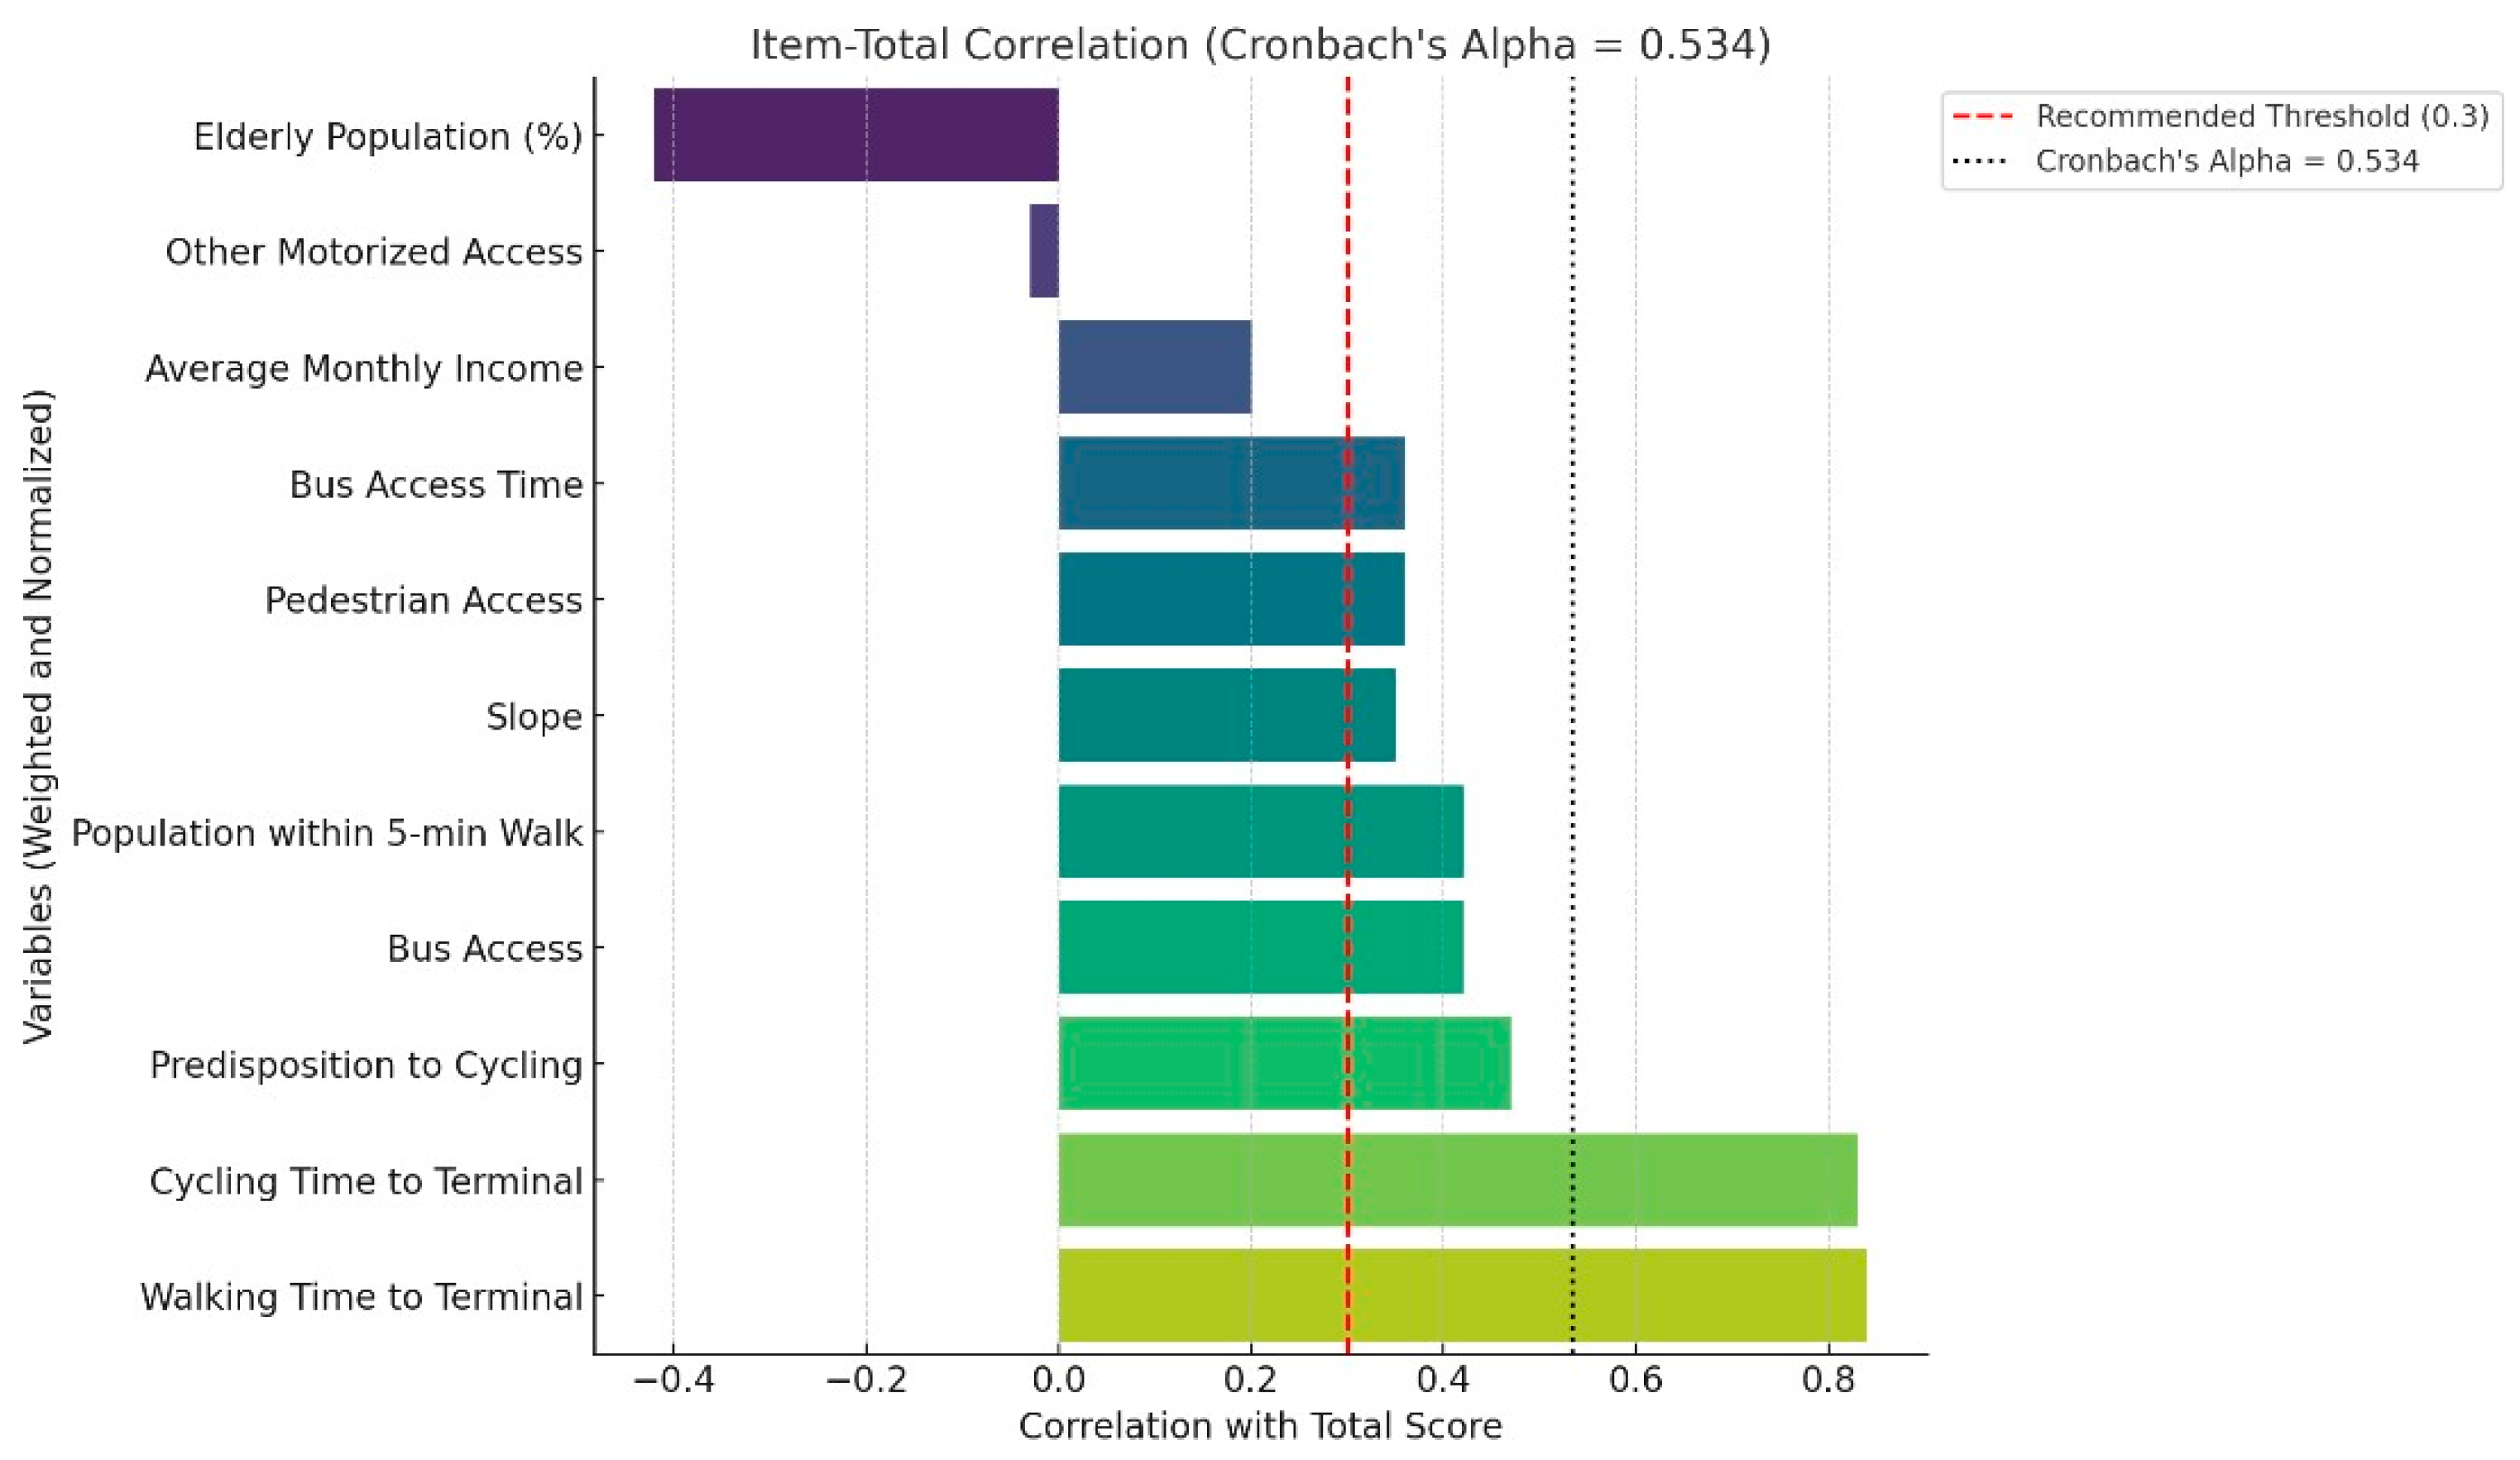
4.2. Cronbach’s Alpha

To verify the internal consistency of the variables that compose the Urban Resilience Index (IB-11), Cronbach’s alpha coefficient was calculated based on the original variables used in the model, previously normalized and weighted according to the weights defined by the Analytic Hierarchy Process (AHP) method. Cronbach’s alpha is widely recognized as a measure of internal reliability, used to assess the degree of correlation among items theoretically expected to represent the same latent construction. In the present study, the calculation was conducted directly on the individual variables to evaluate the overall cohesion of the indicators selected to compose the index. This coefficient evaluates how well a set of variables (or items) measures the same underlying construct or concept.
The global result obtained was α = 0.534, a value below the traditionally recommended threshold but still acceptable in exploratory studies and constructing composite indices composed of conceptually complementary variables. The chart in Figure 2 presents the item-total correlations for each variable against the sum of the remaining items, allowing for an assessment of each indicator’s internal alignment with the overall set. The analysis showed that variables related to active mobility and accessibility—such as walking time to the terminal and cycling time to the terminal—presented the highest levels of correlation, indicating strong coherence with the overall structure of the index. On the other hand, variables such as elderly population (%) and other motorized access exhibited correlations near or below zero, indicating lower inference convergence with the other components. These results are consistent with the methodological approach of constructing a multidimensional urban resilience index, integrating complementary factors that do not necessarily share high statistical redundancy but reflect distinct and relevant aspects of the analyzed urban structure.
On the other hand, variables associated with socioeconomic aspects (elderly population and average income) and motorized access (other modes, bus access, and access time) presented lower correlations, with some negative values, indicating low internal correlation with the overall structure of the index. This dispersion aligns with the purpose of models that capture multiple dimensions of a complex phenomenon, such as urban mobility resilience, and does not compromise the model’s validity. On the contrary, it reinforces the multidimensional and integrative nature of the adopted approach.
To deepen the assessment of the internal structure of the inference groupings, the following section presents the results of the Principal Component Analysis (PCA), aimed at identifying latent axes and verifying the statistical coherence of the adopted inference blocks.

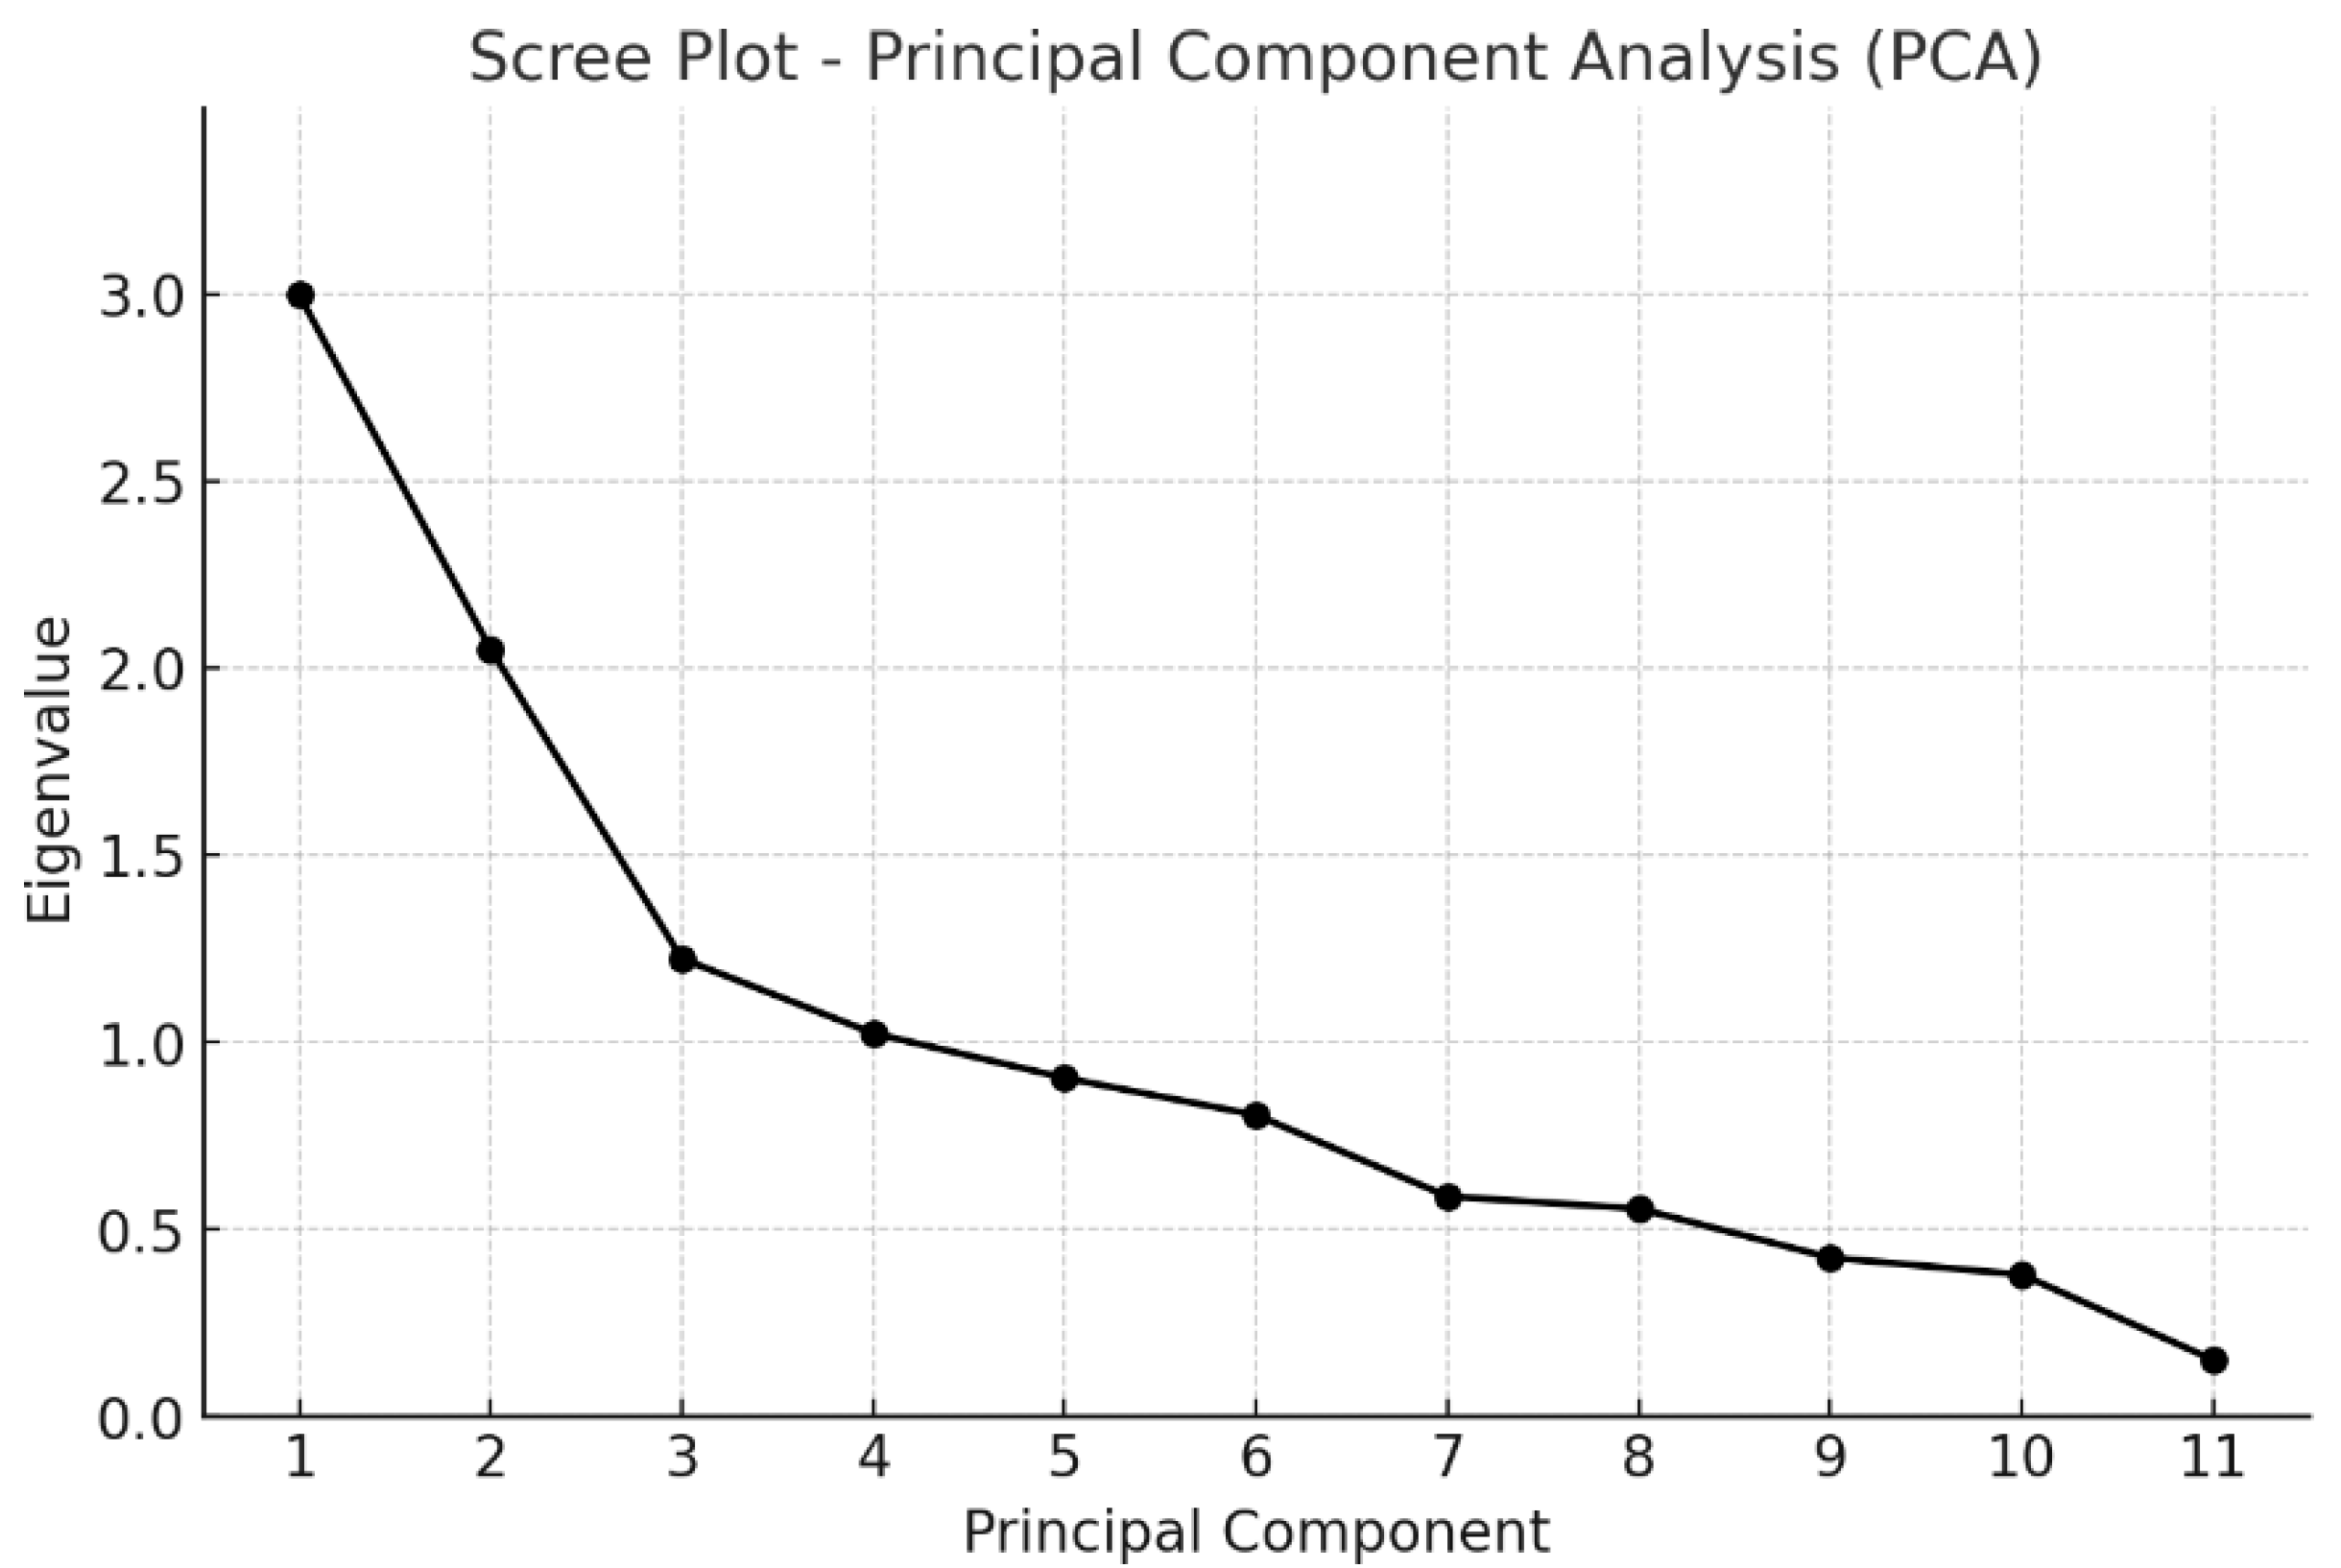
4.3. Principal Component Analysis (PCA–Urban Resilience Blocks)

Since multiple variables with distinct conceptual natures compose the Urban Resilience Index (IB-11), the analysis complemented the internal consistency evaluation with a latent structure assessment. For this purpose, Principal Component Analysis (PCA) was applied directly to the original variables, allowing for the investigation of underlying groupings among the indicators considered. PCA offers the advantage of transforming the original set of correlated variables into a new set of orthogonal components that maximize the explanation of the total data variance. Thus, its application verifies whether the variables share standard dimensions, assesses the inference coherence of the adopted groupings, and reduces model complexity without significant information loss [71,72].
PCA was applied directly to the set of original variables to identify underlying latent structures and to verify the adequacy of the adopted inference groupings. The first two principal components jointly explained 45.5% of the total variance (PC1 = 27.0%; PC2 = 18.5%). The first component concentrates on active mobility and physical accessibility, while the second aggregates variables associated with motorized accessibility and socioeconomic aspects. The analysis presents the factors obtained for the first two components in Table 4.
The Scree Plot (Figure 3) presents the distribution of eigenvalues, highlighting an inflection point after the second component, which confirms the structural concentration in the first two principal axes. The results corroborate the construct’s inference heterogeneity and validate the methodological choice of organizing the variables into inference blocks for the index’s composition.
The combined results of Cronbach’s alpha and Principal Component Analysis (PCA) provide convergent evidence regarding the structural adequacy of the Urban Resilience Index (IB-11), as shown in Table 4. Cronbach’s alpha revealed moderate internal consistency, which is compatible with the multidimensional nature of the model that integrates distinct conceptual dimensions—mobility, accessibility, socioeconomic factors, and energy dependency. PCA identified well-defined latent components aligned with the adopted inference groupings, highlighting the axes of active mobility and physical accessibility (PC1), motorized transport, and socioeconomic factors (PC2).
The complementarity of these two approaches confirms that, although the component variables are not strongly collinear (as expected in a unidimensional construct), they contribute in an integrated and non-redundant manner to the representation of urban resilience in the proposed context. Thus, both results support the model’s conceptual robustness and statistical coherence, validating the use of IB-11 as a territorial diagnostic tool and a basis for public policy formulation.

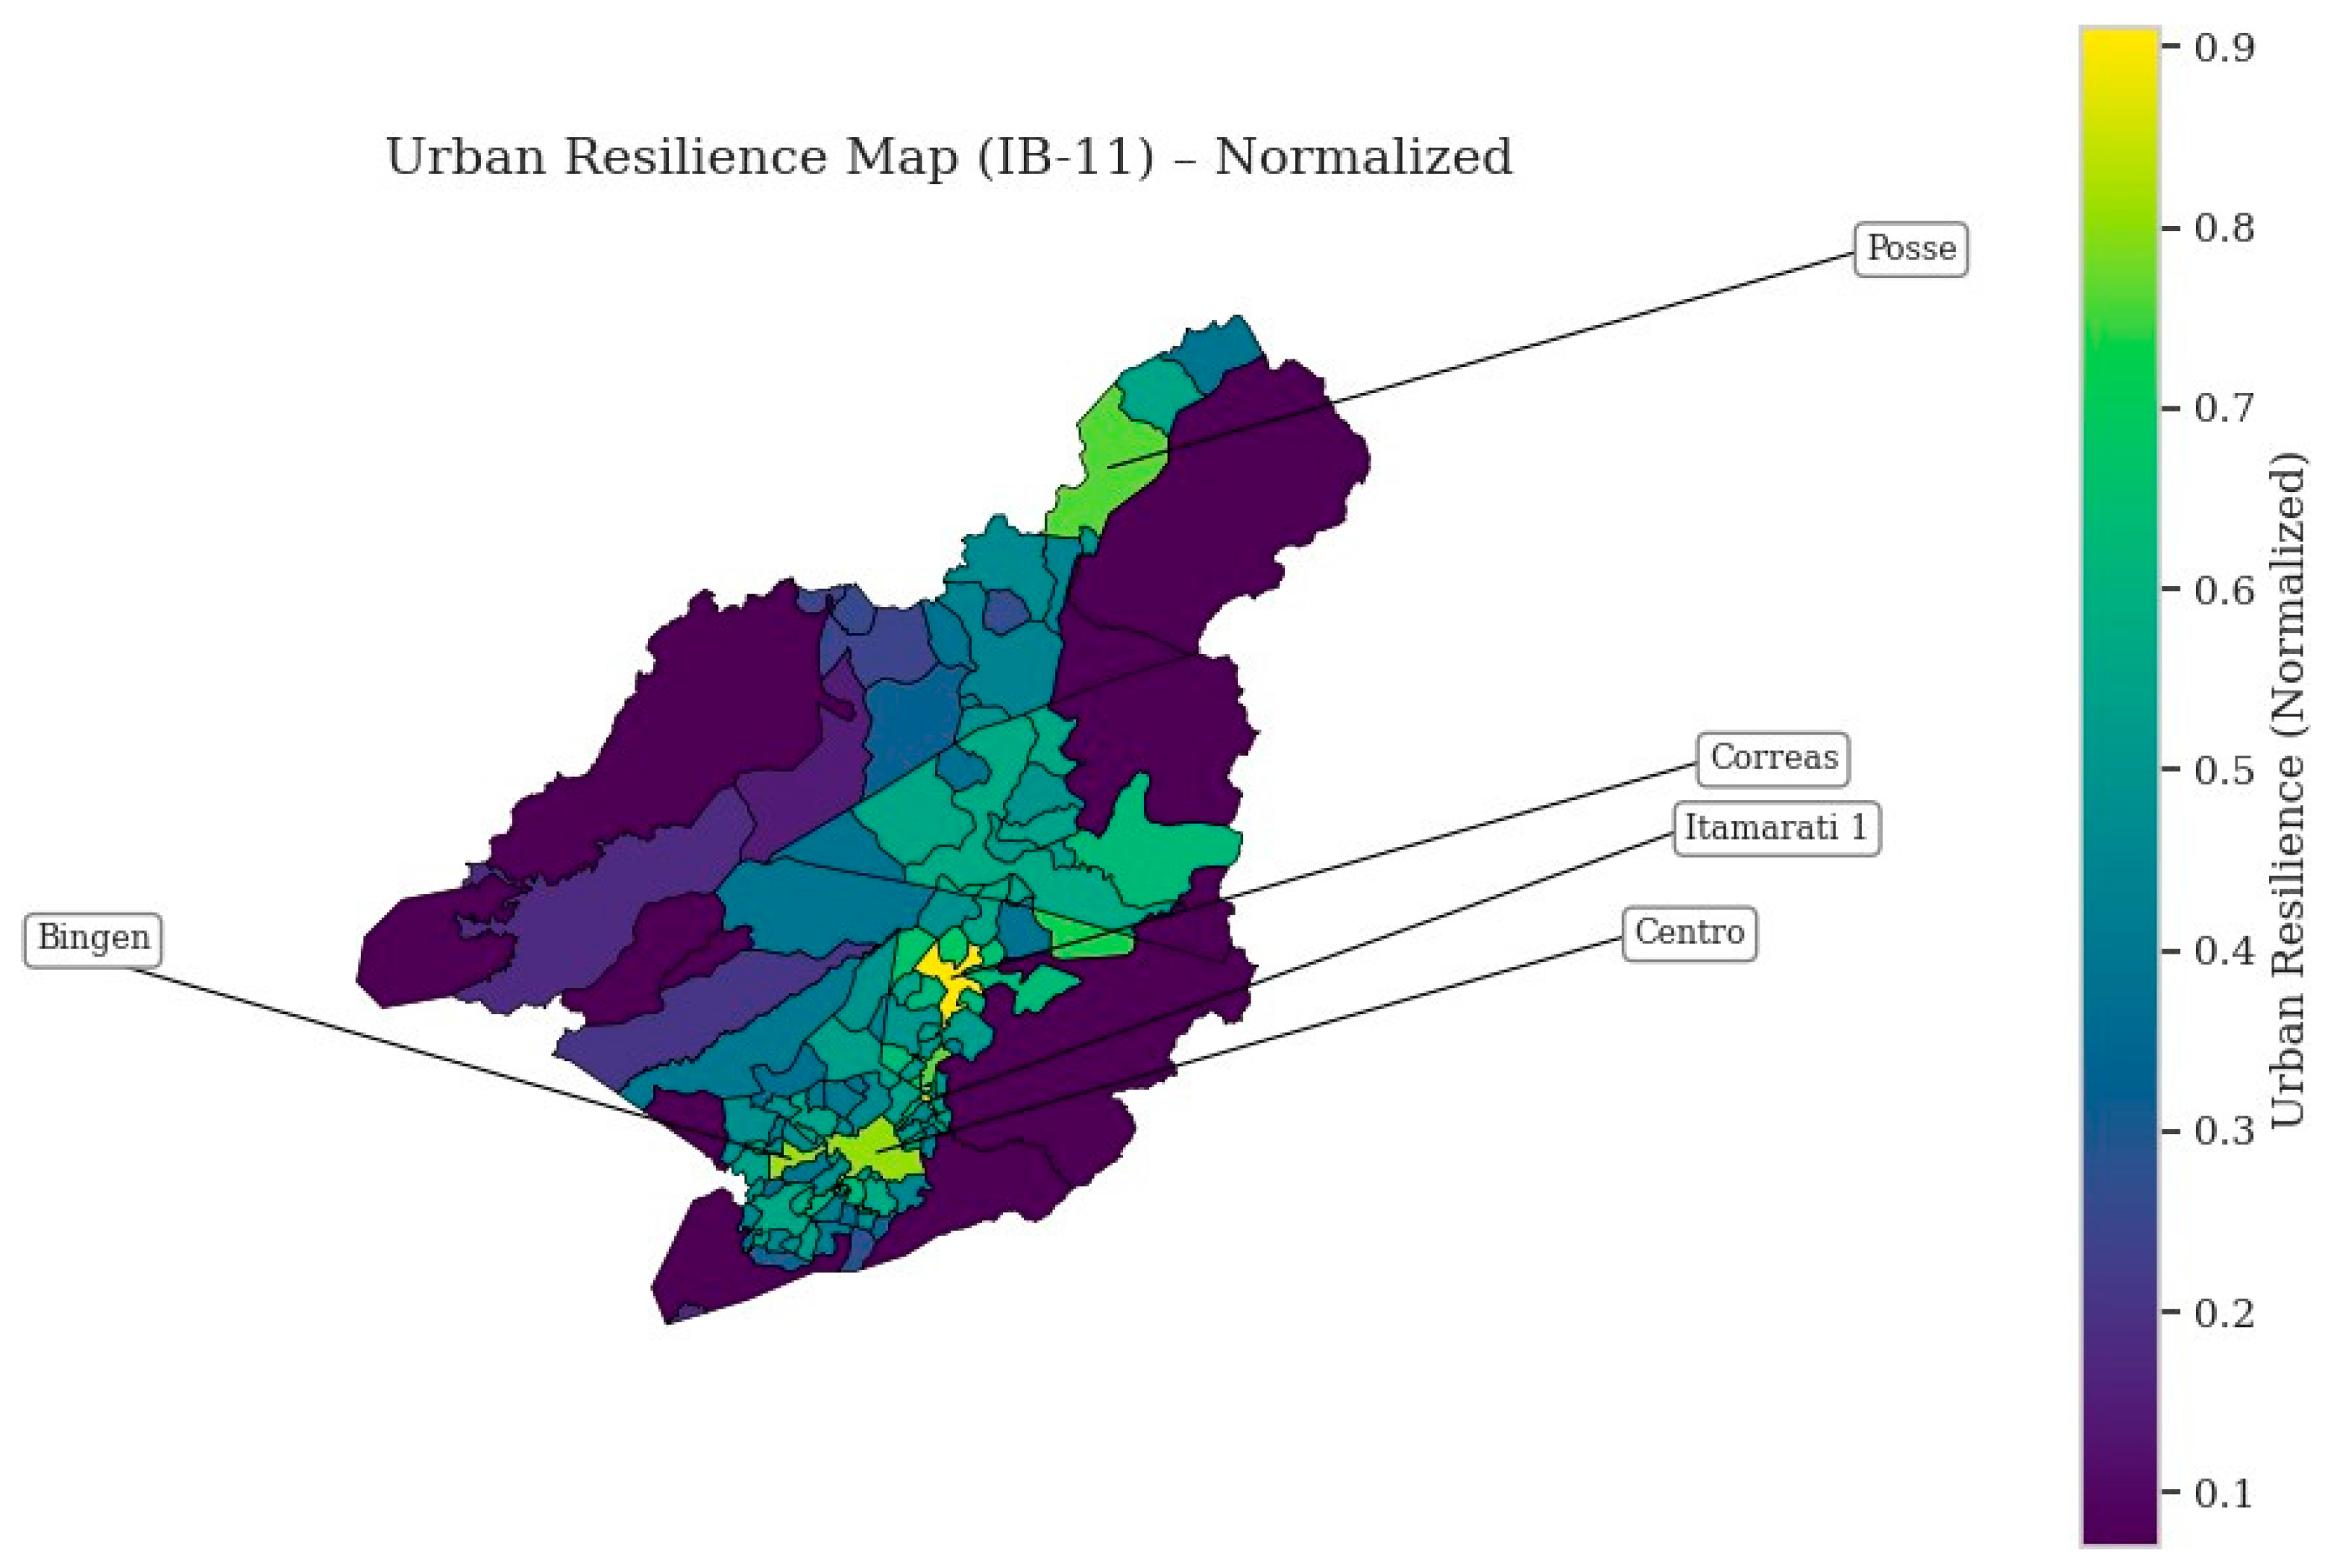
4.4. Urban Resilience Results for the Municipality of Petrópolis

Figure 4 presents the Urban Resilience Map (IB-11) for the municipality of Petrópolis, resulting from the normalization using the Theoretical Maximum method. The map displays the territorial division of the city’s neighborhoods, represented by a graduated color scale ranging from dark purple (lower resilience values) to yellow (higher resilience values).
On the right side of the map, a color bar (color bar) indicates the correspondence between the colors and the normalized values of the urban resilience indicator, ranging from approximately 0.1 (lower resilience) to 0.9 (higher resilience).
The map highlights several strategic neighborhoods with labels:
  • Posse (northern sector);
  • Corrêas (central-eastern sector);
  • Centro (central sector);
  • Itamaraty 1 (central-eastern sector);
  • Bingen (central-western sector).
The southern part of the municipality, particularly near the Quitandinha region, along with specific portions of the central area, concentrates on the areas of higher urban resilience, represented in yellow and green tones. Neighborhoods with intermediate resilience levels (depicted in bluish-green tones) appear sparsely distributed around the central urban core and some isolated sectors in the north. The lowest resilience levels (in purple and dark blue) are concentrated in many of the peripheral zones, especially in the western and southwestern portions of the territory, indicating greater urban fragility.
This pattern highlights that central areas, which are more densely populated and likely better served by urban infrastructure, exhibit higher resilience indices. In comparison, peripheral areas with lower urban density tend to present lower indices.
The statistical analysis of the inference blocks that compose the non-normalized Urban Resilience Index (IB-11), presented in Figure 5, reveals important nuances related to the indicators’ average performance and compliance with the corresponding optimization rules. The analysis considered eleven blocks: seven presented means consistent with their respective optimization rules (maximization or minimization), while four exhibited average performances below the expected threshold. The detailed results of the normalizations applied to the variables and blocks are provided in Appendix A, ensuring methodological transparency and supporting the interpretation of the findings.
The interpretation of the chart shows that the blocks related to active accessibility—IB-1 (Ease of Access on Foot), IB-2 (Ease of Access by Bicycle), and IB-3 (Active Transport Accessibility)—all classified as “max” have means below the median, indicating that these dimensions, on average, negatively affect urban resilience. On the other hand, IB-4 (Active Transport Mobility), also a “max” block, presents a mean above the median, suggesting that this dimension—related to the predisposition to use active modes—represents a relatively positive aspect across neighborhoods. IB-5 (Active Transport) synthesizes the previous blocks and has a mean slightly below the median, reflecting the balance between better-performing and weaker dimensions.
Although IB-4 (Active Transport Mobility) shows a mean above the median, its interpretation requires caution. The chart reveals a highly concentrated distribution at low values, with the mean pulled upward by a few high-performing cases. Since the mean lies outside the interquartile range (Q3), this indicates the presence of outliers that do not represent the general trend of the neighborhoods. Therefore, despite the favorable mean, the low median and strong positive skewness reveal that most territories display limited performance in effective active mobility, possibly reflecting cultural or infrastructural obstacles to adopting these modes of transport.
Another critical aspect is IB-10 (Socioeconomic Factor), whose mean lies below the median. This result demonstrates that social vulnerability remains a significant structural limitation for strengthening urban resilience in Petrópolis, reinforcing the need for integrated public policies that combine physical infrastructure with social interventions. On the other hand, IB-9 (Transport Indicator) shows a mean close to or slightly below the median, suggesting some limitation in access to collective and motorized transport, although with a lesser average impact than the active accessibility factors.
In contrast, the blocks classified as min—IB-7 (Fossil Fuel Dependency) and IB-8 (Social Mobility Constraints)—presented means below the median, which, according to the methodology, indicates that these dimensions do not compromise urban resilience. In other words, the evaluated neighborhoods generally perform well in reducing energy dependence and mitigating social constraints, such as low urban density.
The composite index IB-11 (Urban Resilience) aggregates the other blocks and shows a mean below the median, confirming that urban resilience in Petrópolis neighborhoods remains below the desired level. Statistical analysis highlights active accessibility and socioeconomic vulnerability as the main weaknesses, guiding more targeted public interventions. In this context, blocks IB-1 and IB-2 become strategic investment targets, as they represent key components of urban equity and sustainability and require lower implementation costs than other urban mobility solutions.
The quartile analysis from the boxplot of inference indicators (IB-1 to IB-11) enables a deeper understanding of the distribution of normalized values and territorial inequalities in Petrópolis. In addition to comparing means and medians, the quartile structure reveals asymmetries, value concentration, interquartile range (IQR), and, especially, the presence of outliers—all crucial elements for identifying critical urban resilience patterns.
Block IB-6 (Motorized Mobility Indicator) exhibits a relatively symmetric distribution, with mean and median close to each other, indicating a certain balance in the average performance of neighborhoods concerning access to motorized modes. However, the boxplot shows multiple upper outliers, representing neighborhoods with exceptionally high performance in this indicator. These extreme values suggest that certain areas concentrate significant advantages in infrastructure and accessibility to motorized transport, such as more extensive bus coverage, terminal presence, or well-connected arterial roads. Although not a statistical issue, these outliers reveal a pattern of inequality in mobility provision, favoring a few neighborhoods while others remain at average or lower levels. Thus, even if IB-6 does not indicate generalized vulnerability, the exceptionally high values in a few neighborhoods reinforce the need to redistribute motorized mobility opportunities, especially in areas where active accessibility indicators are also low. This positive skewness may perpetuate territorial inequalities in urban access and essential services if not accompanied by compensatory policies.
Another relevant aspect concerns asymmetric distributions, as observed in IB-4 (Active Transport Mobility). Despite its mean being above the median, the IQR is exceptionally narrow, and the median lies close to the lower box limit (Q1), suggesting that most neighborhoods show a low predisposition to use active transport modes, with the mean elevated by a few isolated high-performing cases. This strongly positive skew indicates that the mean does not reflect the general pattern of the dataset. In this context, the median provides a statistically more robust reference for territorial analysis.
Additionally, blocks such as IB-1 (Ease of Access on Foot), IB-3 (Active Transport Accessibility), and IB-10 (Socioeconomic Factor) show low medians, wide interquartile ranges, and multiple lower outliers, indicating not only low average resilience but also pronounced heterogeneity. These characteristics reinforce deep inequalities among neighborhoods, requiring public policies that combine universal structural actions with specific territorial interventions.
In contrast, blocks IB-7 (Fossil Fuel Dependency) and IB-8 (Social Mobility Constraints) display more homogeneous distributions, with means and medians close to each other and few or no extreme outliers. These blocks suggest greater balance among neighborhoods and satisfactory performance regarding energy dependency and social limitations.
The composite index IB-11 (Urban Resilience) synthesizes these dimensions and exhibits a distribution that confirms that urban resilience remains below the ideal level. Lower outliers in this block demonstrate that some neighborhoods experience pronounced vulnerability, reaffirming the importance of quartile-based analyses to guide fairer, more effective, and territorially sensitive public policies.
Given the results obtained and the territorial characteristics of Petrópolis—marked by rural zones, steep slopes, and significant gradients—one of the most cost-effective strategies for improving urban resilience consists of localized interventions in active mobility within consolidated urban areas, particularly in blocks IB-1 (Ease of Access on Foot) and IB-2 (Ease of Access by Bicycle). Although topography limits the universal use of bicycles and pedestrian accessibility in some regions, significant progress is still possible through targeted and locally adapted actions, such as sidewalk regularization and maintenance in flat areas, installation of handrails and accessible steps on hills, improved signage and public lighting, and the expansion of safe short-distance travel areas in higher-density neighborhoods. In zones with lower physical viability for active mobility, these actions should be integrated with accessible public transport strategies, reducing distances between residences and boarding points. With low cost, rapid implementation, and high social impact potential, these measures help mitigate territorial inequalities and strengthen urban resilience in vulnerable and challenging territories like Petrópolis.
These interventions require light infrastructure and rapid implementation, often based on the requalification of existing road spaces, such as sidewalk leveling and widening, installation of raised crossings, bike lanes marked by paint and markers, signage, lighting, and urban furniture. Such measures, especially within the scope of tactical urbanism, have been widely adopted in medium and large cities, with significant results regarding road safety, public space use, and promotion of active transport [71,72].
Beyond the economic aspect [73,74], active modes offer significant social benefits by providing the most economically accessible transportation options for the population, primarily benefiting children, older adults, people with disabilities, and residents of pe-ripheral areas [74]. Moreover, their adoption reduces greenhouse gas emissions, improves air quality, and promotes public health by encouraging physical activity and combating sedentary lifestyles [74].
Illustrative cases highlight the potential of these policies. In Bogotá, the cycling network exceeded 550 km with relatively low investments, complemented by the Ciclovía Dominical program, which transforms major roads into spaces for leisure and non-motorized mobility. During the COVID-19 pandemic in Paris, the Plan Vélo program implemented emergency bike lanes with simplified physical separation, resulting in a 70% increase in bicycle trips in just two years. Active mobility initiatives not only reshape urban environments but also generate significant public health and economic benefits, as they help reduce mortality risks, lower healthcare costs, and promote physical activity [75]. In Brazil, cities such as São Paulo and Recife have implemented tactical urbanism strategies to improve central urban areas through low-cost interventions aimed at enhancing pedestrian safety, comfort, and overall urban vitality [74,76].
The analysis of data from this study confirms the importance of these blocks. Despite the relatively good performance of the urban resilience indicator (IB-11), blocks IB-1 and IB-2 presented mean values below the median, signaling deficiencies in active accessibility. Prioritizing these elements in local public policies thus represents a cost-effective strategy with high social, environmental, and urban returns. In summary, promoting safe and efficient pedestrian and bicycle access should not be viewed as a complementary policy but as a central axis in building more resilient, healthy, and equitable cities.
A crucial geographic aspect to consider in proposals to promote active mobility in Petrópolis is the steep terrain characteristic of mountainous regions. The city’s topography imposes significant physical barriers to walking and cycling, especially in peripheral neighborhoods and those with higher socioeconomic vulnerability, where road connections often feature steep slopes and sharp gradients. This condition compromises the feasibility of traditional active transport solutions, requiring interventions adapted to urban morphology. In this context, adopting technologies such as pedal-assisted bicycles (e-bikes) emerges as a promising alternative, allowing users to overcome steep gradients with less physical effort, expanding the reach and attractiveness of cycling as a daily mode of transport. For this strategy to be effective, authorities must provide appropriate infrastructure—such as segregated bike lanes, charging points, and public sharing systems—and implement subsidy policies to ensure financial accessibility. Therefore, planners must integrate assistive technology with urban design sensitive to local geography to make active mobility a realistic and equitable option for the entire population of Petrópolis.
Successful cases are observed, for instance, in Lisbon (Portugal) and Lausanne (Switzerland), where using e-bikes was encouraged through public subsidies and adapted infrastructure. In Lisbon, the GIRA program—which integrates conventional and electric bicycles into its sharing system—has seen significant adoption even in hilly areas. Lausanne’s PubliBike system includes e-bikes designed for mountainous sections, facilitating connections between elevated and central neighborhoods. These experiences show that cities with challenging topography can strengthen active mobility by combining technology, infrastructure, and integrated public policies.

4.5. Analysis of Normalized Urban Resilience

Figure 6 presents the spatial distribution of the Urban Resilience Indicator (IB-11), calculated from the hierarchical aggregation of technical, socioeconomic, and energy variables, normalized between 0 and 1. Each Territorial Analysis Unit (TAU) was classified based on its final score in the indicator, allowing for a clear visualization of territorial contrasts regarding coping capacity, adaptation, and recovery in the face of disruptive events.
The lowest range (0.00 to 0.25), highlighted in red, represents approximately 10% of the neighborhoods and points to critical urban vulnerability zones, characterized by structural deficiencies in transportation systems, low coverage of active and motorized modes, and severe socioeconomic restrictions. Public investment and structural interventions should prioritize these areas.
The 0.25 to 0.50 range, comprising approximately 30% of the neighborhoods, includes regions with unsatisfactory performance, usually due to favorable results in only one dimension (transport or social context), without achieving a balance between both.
On the other hand, less than 10% of the neighborhoods reach values above 0.75, a range that represents high resilience. These areas constitute exceptions and concentrate desirable characteristics such as broad accessibility, diversified modal coverage, and lower energy dependency. Strategically, these neighborhoods may serve as models of good urban practices, assisting in formulating replicable public policies.
This uneven distribution reinforces the existence of an urban resilience gradient strongly related to socio-spatial factors. It justifies adopting policies targeted by performance range, emphasizing correcting the asymmetries identified in the most critical ranges, as shown in Figure 6.
The approach presented in Figure 7 employs a quadrant analysis to assess urban resilience, specifically integrating aspects related to transport (IB-9) and socioeconomic conditions (IB-10). This methodology segments neighborhoods into four strategic quadrants, allowing for a clear visualization of existing conditions and priorities for public interventions:
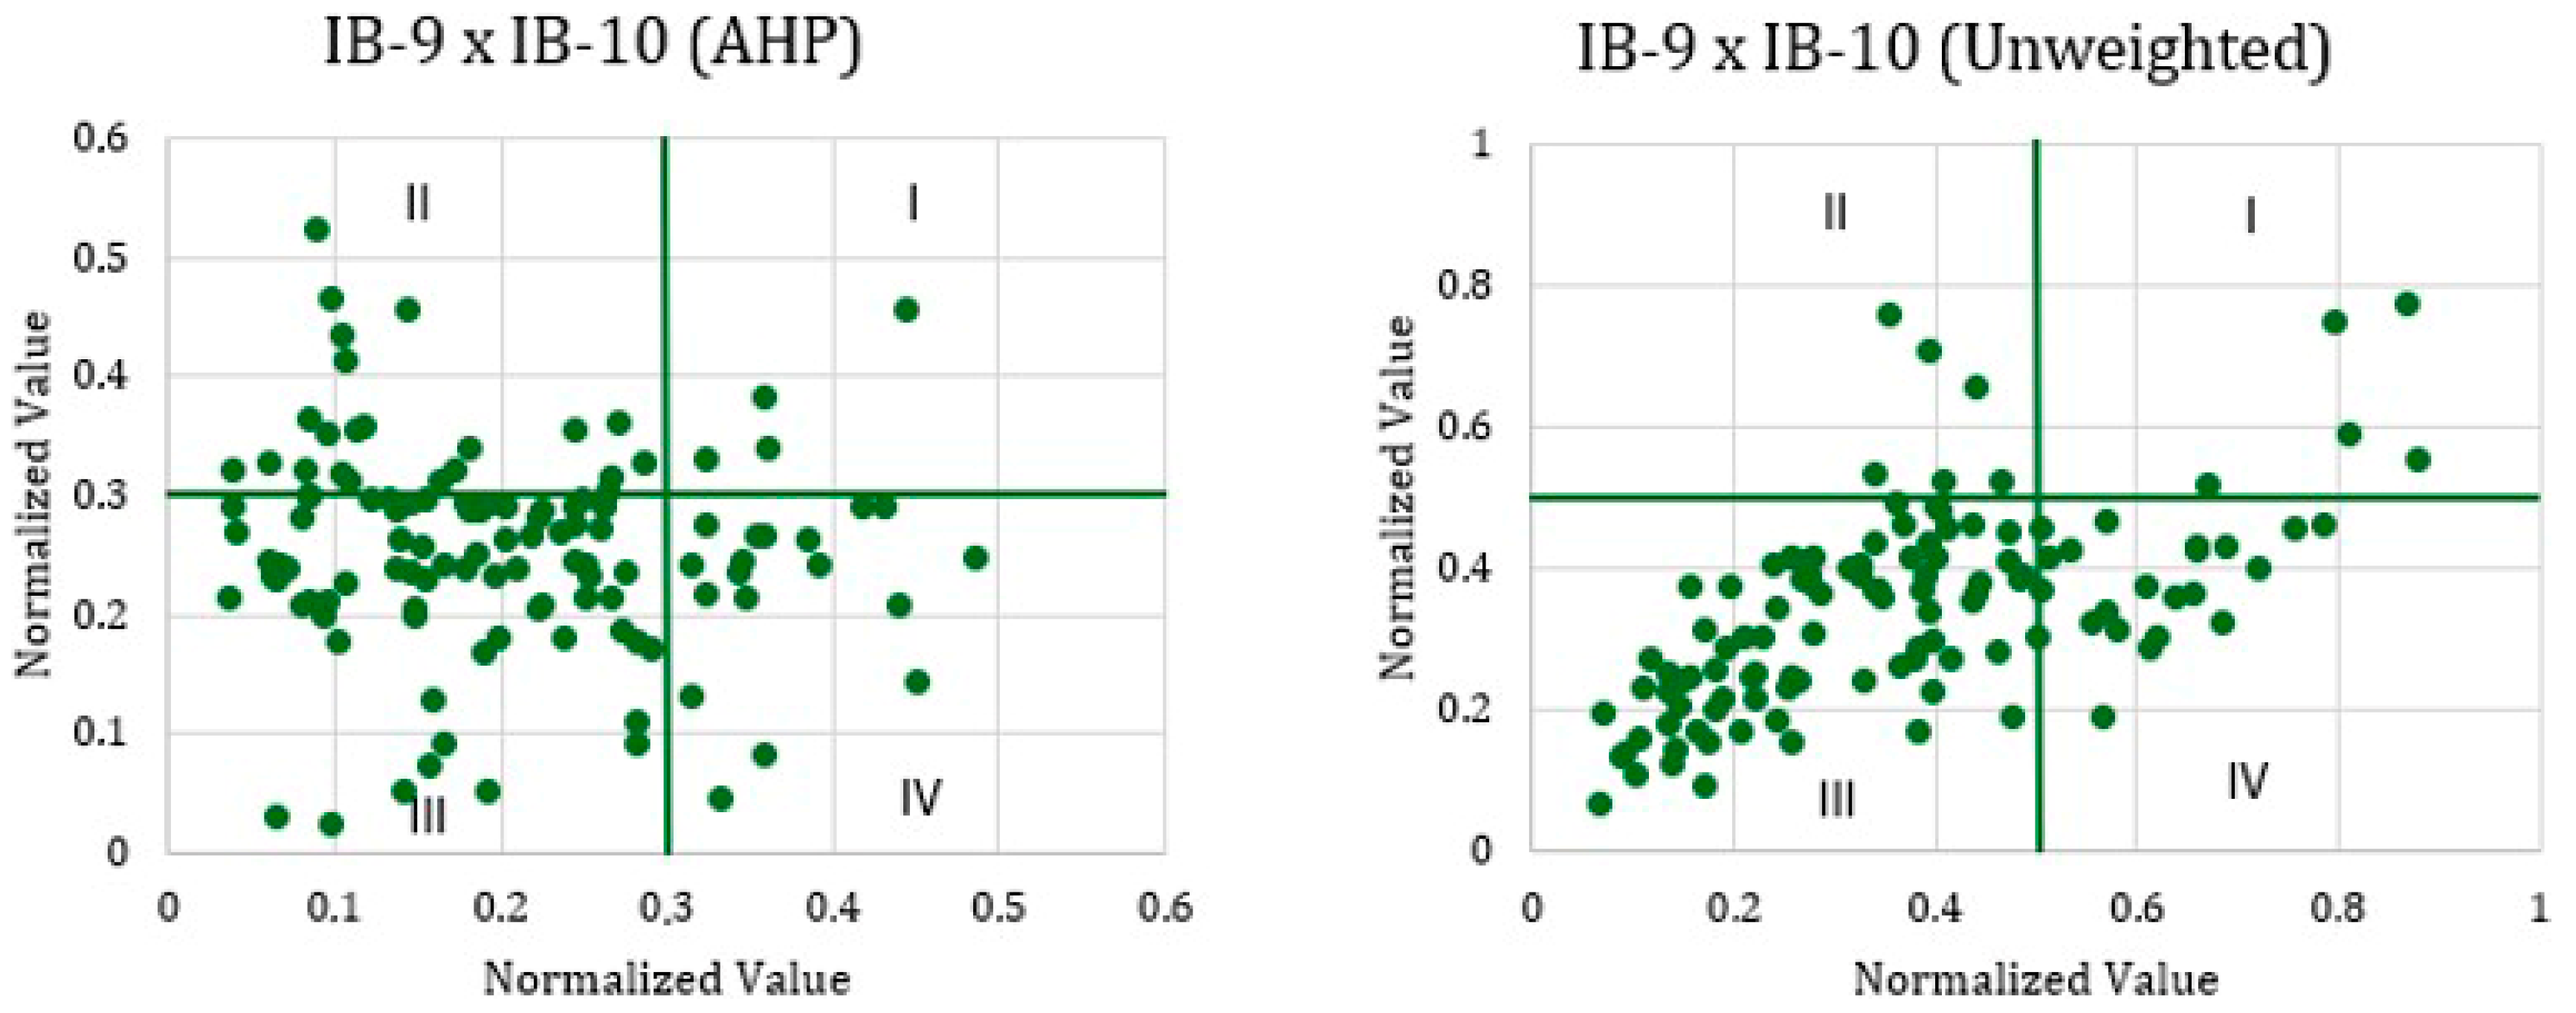
  • Quadrant I (IB-9 ↑, IB-10 ↑): neighborhoods with good transport conditions and favorable socioeconomic indicators. These are considered resilient and of lower priority for intervention.
  • Quadrant II (IB-9 ↓, IB-10 ↑): neighborhoods with transport deficiencies but good social conditions. Mobility interventions could quickly enhance resilience.
  • Quadrant III (IB-9 ↓, IB-10 ↓): neighborhoods with deficiencies in both dimensions. These represent critical areas for integrated public policies.
  • Quadrant IV (IB-9 ↑, IB-10 ↓): neighborhoods with good infrastructure but high levels of social vulnerability, requiring combined social assistance and physical interventions.
The comparison between the weighted and unweighted models reveals significant impacts on the territorial distribution of urban resilience. In the unweighted model, there is an intense concentration of neighborhoods in Quadrant III (low transport infrastructure and low socioeconomic performance), suggesting widespread vulnerability. This configuration shows that assigning equal weights to all criteria classifies most territories as structurally deficient in mobility and social conditions.
However, when applying the AHP method, several neighborhoods shift to Quadrant II (low infrastructure but good socioeconomic conditions). The results show that the weighting favored dimensions considered more susceptible to intervention through public policies—such as urban mobility—and assigned greater weight to variables with higher potential for short-term improvement. Thus, the analysis now considers areas previously classified as critical and potentially transformable if transport infrastructure investments occur.
This shift in configuration reveals that applying customized weights has the potential to highlight neighborhoods with greater improvement feasibility, promoting a more strategic view of resilience. On the other hand, it also shows how the weighting structure can strongly influence territorial diagnoses, underscoring the importance of technically grounding methodological choices to ensure coherence between public policy objectives and model outcomes.

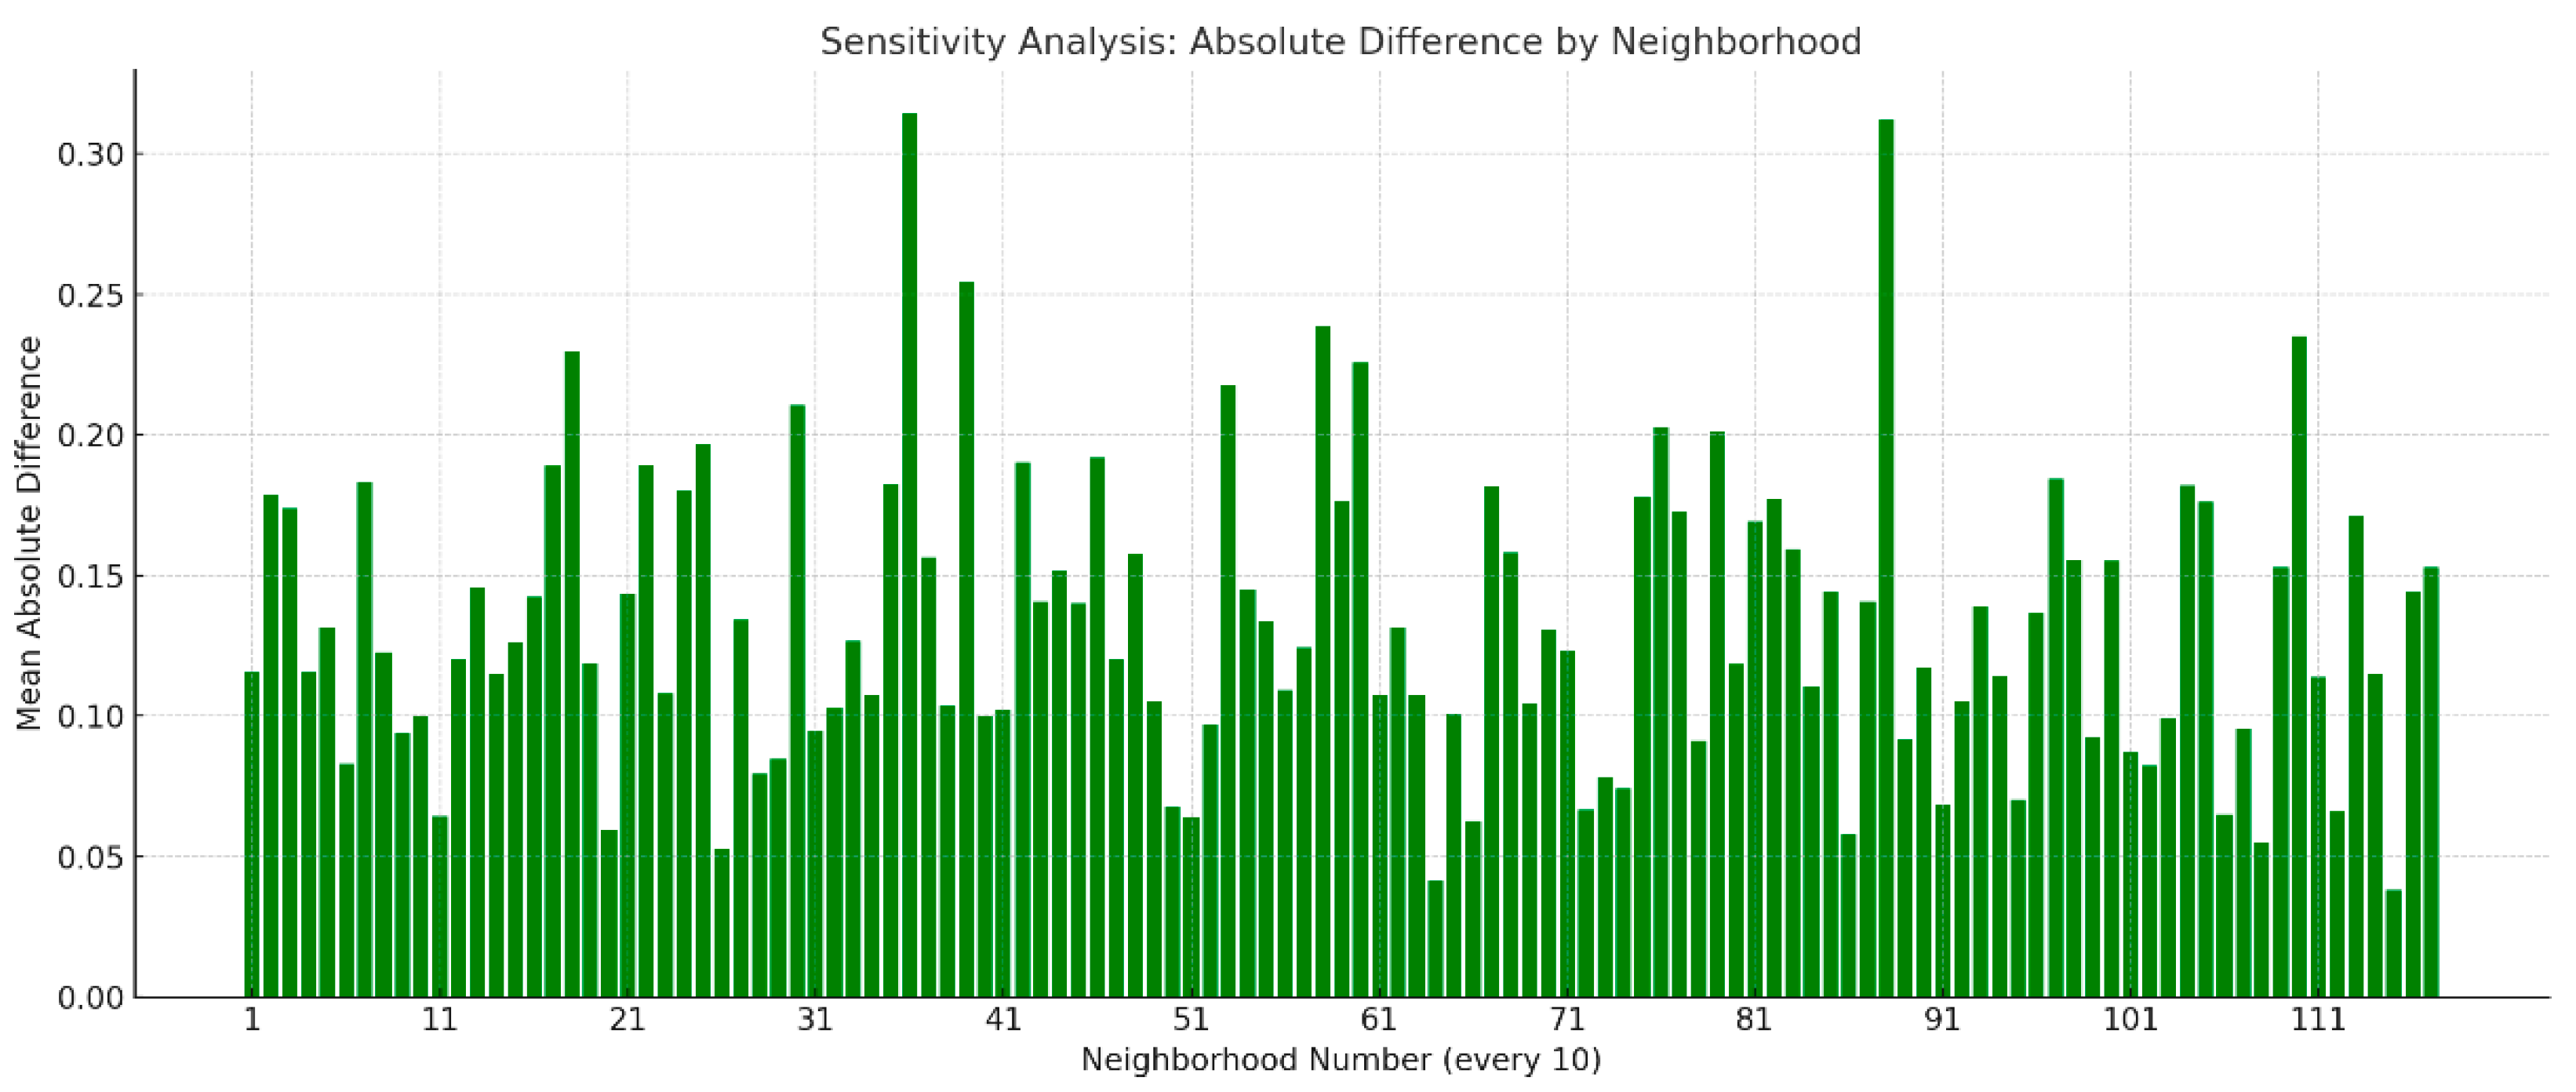
4.6. Sensitivity Analysis

To assess the sensitivity of the Urban Resilience Index to the weighting of inference criteria, the analysis calculated the absolute difference between the values obtained with and without applying the AHP-defined weights. This approach allows for identifying the extent to which the introduction of weights alters the final indicator results for each analyzed neighborhood. Figure 8 displays the magnitude of these differences, making it possible to visualize which locations are more or less impacted by the adopted weighting methodology. The analysis helps verify the proposed model’s robustness and the inference blocks’ relative influence in composing the final index.
The chart shows that most neighborhoods exhibited absolute mean differences between 0.10 and 0.20, with some exceptions reaching values close to 0.30. These results indicate that the differentiated weighting assigned by the AHP method had a moderate influence on the final values of the urban resilience indicator. In particular, neighborhoods with higher differences demonstrate greater sensitivity to the weighting structure, revealing that the weights assigned to the criteria more significantly altered the index composition in these cases.
On the other hand, there is a significant number of neighborhoods with differences below 0.1, suggesting that, for these areas, the application of weights did not substantially change the final indicator value—which may occur when the variables behave consistently and in balance.
This analysis demonstrates that the AHP weighting influences the results of the urban resilience index, especially in neighborhoods with more asymmetric indicator profiles. The choice of weights, therefore, is not neutral and must be grounded in technical and participatory criteria to ensure that the results faithfully reflect the local reality. This moderate sensitivity shows that the model responds appropriately to the hierarchical structure of the inference blocks and more accurately reflects the relative importance of the variables. At the same time, the absence of extreme variations reinforces the internal consistency and the system’s ability to distinguish distinct territorial contexts without introducing distortions. Therefore, the results obtained through AHP multicriteria weighting validate the inference architecture adopted and justify its use over an equal-weights approach, which would tend to dilute structurally relevant aspects of urban mobility resilience.
Additionally, the analysis performed a hierarchical decomposition of the weights applied in the model to better understand each variable’s relative contribution to the composition of the Urban Resilience Index (IB-11). Figure 9 presents the normalized coefficients obtained after the complete processing of the multicriteria aggregation structure, considering the local weights, the successive divisions within the hierarchical blocks, and the final normalization.
The variables associated with active transportation, particularly Pedestrian Access and Predisposition to Cycling, contribute the most individually (approximately 15.5% each), followed by Travel Time by Bus (15%), which relates to public transport. The other variables associated with active transportation, such as Travel time by walking and Travel time by bicycle, showed intermediate contributions (around 8.7% each), while socioeconomic variables and those related to motorized access presented lower relative participation.
This result demonstrates that, although active transportation constitutes a significant portion of the index structure, the current hierarchical architecture assigns relevant participation to public transport, especially the bus system. This configuration shows that the parametrized IB-11 reflects an urban resilience concept that simultaneously acknowledges both the active and collective dimensions of mobility and allows for future weight adjustments if specific public policy strategies require prioritization.
It is important to highlight that the hierarchical structure allows researchers to parametrically adjust the weights assigned to blocks and variables, enabling calibration of the model according to established public policy priorities. Thus, policymakers can revise the relative weights to increase the influence of active transportation if they emphasize it as a strategic axis for promoting urban resilience, thereby better aligning the index composition with sustainable urban planning guidelines and promoting active mobility.

4.7. Discussion

Urban mobility resilience has become a fundamental axis in formulating public policies to foster more inclusive, sustainable, and adaptable cities in the face of social and environmental transformations. In this context, two recent studies—one applied to the municipality of Petrópolis (Brazil) and the other to Amman (Jordan)—offer complementary approaches to assessing such resilience, albeit based on distinct methods and specific socio-spatial contexts.
The study developed for Petrópolis proposes a composite indicator of urban mobility resilience (IB-11) based on eleven variables organized into inference blocks (active accessibility, public transportation, socioeconomic vulnerabilities, and energy dependence). The variables were normalized using Gaussian functions and weighted through the Analytic Hierarchy Process (AHP), allowing the incorporation of value judgments based on the political alterability of each criterion. The statistical validation included the analysis of collinearity between inference blocks, the evaluation of internal consistency via Cronbach’s alpha coefficient, and the application of Principal Component Analysis (PCA), performed directly on the original variables. The PCA revealed that the first two components jointly explained 45.5% of the total data variance, indicating the presence of latent structures aligned with the inference segmentation adopted in the model. Additionally, the analysis applied a territorial reading based on performance quadrants, highlighting critical areas (Q.III) and resilient areas (Q.I). A sensitivity analysis compared the model with and without weighting, revealing a relevant mean difference in the results (approximately 0.10 to 0.20 in absolute terms).
On the other hand, a quantitative approach centered on user behavior regarding the use of ridesharing mobility systems in Amman was employed [68]. The researchers surveyed 270 respondents and used their answers to build a Structural Equation Model (SEM). The model considered latent variables such as public acceptance, reliability, environmental sustainability, and income, with robust statistical results (RMSEA = 0.054; CFI = 0.948). The analysis revealed that ease of use (booking and payment apps) and income are the main factors influencing perceived use, with the latter being the most potent indirect mediator for system adoption (β = 2.518). Reliability also showed a significant direct impact (β = 0.865).
Despite the methodological differences—multivariate territorial analysis in the Petrópolis study and latent construct analysis in the Amman case—both works converge in pointing out that socioeconomic vulnerability and infrastructure quality are crucial determinants of resilience and the adoption of urban mobility systems.
Each article offers relevant and complementary contributions, as summarized in Table 5. The study applied to Petrópolis provides a territorialized and replicable model for assessing urban resilience, which is helpful for public managers in defining priorities and interventions. Meanwhile, the article Albatayneh [77]. contributes to the field by identifying, based on robust statistical modeling, the main determinants of ridesharing adoption behavior, allowing inferences on policies that can enhance the acceptance of sustainable alternatives in contexts of high automobile dependence.
The model applied in Petrópolis demonstrates high replicability because it relies on widely available data and techniques that researchers can implement with intermediate statistical knowledge. Its modular block structure also allows easy adaptations to different urban contexts. In contrast, study [77] contributes to understanding the social acceptance of new mobility technologies; however, their model shows moderate replicability since it requires collecting primary data sensitive to the local culture and applying advanced construct analysis techniques.
The study in reference [78], published in Urban Science, proposes a Walkability Index (Iw) focusing on pedestrian mobility as a structuring element of urban resilience. The researchers applied the methodology through direct observation in seven urban areas, obtaining Iw values ranging from 61.22 to 77.92. The zones with better results were those with high pedestrian density, good connectivity, esthetic quality, and adequate urban furniture, reinforcing the hypothesis that qualified pedestrian environments promote greater urban resilience.
In the study applied in Petrópolis, the urban resilience index (IB-11) aggregated 11 normalized variables through a multicriteria approach with inference grouping. Terrain slope was a direct penalizing variable in blocks IB-1 (pedestrian accessibility) and IB-2 (bicycle access). IB-11 values ranged from 0.05 to 0.89, with neighborhoods below 0.25 identified as areas of low resilience, strongly associated with steep slopes and low modal integration. The comparison between the studies highlights two complementary approaches, as shown in Table 6.
Both models identify pedestrian infrastructure as a determining factor for urban resilience. In Petrópolis, this appears in the low IB-11 scores for neighborhoods with slopes above 10%, where irregular sidewalks and a lack of accessibility drastically reduce the feasibility of active travel. In a Spanish study, even without considering topography, zones with low pedestrian density and little visual attractiveness resulted in Iw scores below 65, classified as low-resilience areas.
The research in reference [78] proposes classifying urban zones into three categories—Iw < 65 (critical), 65–75 (potential), and >75 (consolidated)— and this can be adapted to the Petrópolis context to interpret IB-11 values analogously. Thus, IB-11 values below 0.30 may be considered critical, between 0.30 and 0.60 as zones with improvement potential, and above 0.60 as territories with consolidated resilient mobility.
In an integrated manner, the analyses confirmed that the inference segmentation proposed in the inference blocks presents empirical adherence to the latent structure of the data. The previously defined dimensions—active accessibility, public transport, socioeconomic vulnerabilities, and energy dependence—consistently emerged in the collinearity, internal consistency, and principal component analyses, demonstrating that the established groupings effectively reflect the underlying structural factors of urban mobility resilience in the analyzed context. The model developed thus offers a parameterizable and replicable methodological platform aligned with contemporary agendas of sustainable and equitable urban planning, allowing for the identification of critical areas based on objective, structured, and spatialized criteria—an aspect still underexplored in traditional approaches to urban resilience assessment.

5. Conclusions

The statistical analyses conducted—collinearity between blocks, internal consistency via Cronbach’s alpha, and latent structure through Principal Component Analysis (PCA)—provide robust evidence of the methodological and conceptual adequacy of the Urban Resilience Index (IB-11). Verifying collinearity between blocks confirmed the statistical independence of most inference dimensions, with overlap occurring only punctually and conceptually justifiable. Cronbach’s alpha indicated moderate internal consistency, which is compatible with the multidimensional and integrative nature of the model and does not assume high redundancy among variables. In turn, PCA revealed the presence of well-defined latent axes aligned with mobility, infrastructure, and socioeconomic dimensions, validating the previously established inference aggregation. Thus, the set of analyses supports the statistical and conceptual robustness of the index, ensuring its application as a reliable territorial diagnostic tool and as support for public policy formulation aimed at urban resilience.
The spatialization of the IB-11 indicator revealed substantial territorial inequality in urban mobility resilience in Petrópolis. Central neighborhoods, well connected and with higher population density, concentrated on the highest resilience levels, while peripheral areas and steep terrains presented the lowest indices. This configuration suggests that urban infrastructure and the spatial distribution of services play a decisive role in defining the adaptive capacity of territories and that public policies should prioritize regions with accumulated multiple vulnerabilities.
The statistical analysis through boxplots showed that blocks related to active mobility (IB-1, IB-2, and IB-3) and the socioeconomic factor (IB-10) performed below the median on average, evidencing structural weaknesses in these dimensions. Conversely, blocks such as IB-7 and IB-8 demonstrated greater territorial balance, with averages consistent with minimization objectives. The analysis of asymmetries and outliers reinforces that urban vulnerability is not homogeneous, requiring targeted interventions adapted to each block’s spatial distribution and technical profile.
The cross-analysis between blocks IB-9 (transport) and IB-10 (socioeconomic) allowed for segmenting neighborhoods into four strategic quadrants, facilitating the identification of critical areas and those with greater transformation potential. The comparison between the models with and without AHP weighting revealed that applying differentiated weights shifts vulnerable neighborhoods into more refined priority categories, highlighting the importance of weighting based on political alterability. This methodological resource favors designing more effective public policies sensitive to the local context.
The sensitivity analysis allowed for the evaluation, from different perspectives, of the robustness and responsiveness of the Urban Resilience Index (IB-11) regarding the adopted weighting structure. The comparison between the results with and without AHP weighting revealed an absolute mean variation of 0.10 to 0.20. The analysis shows that applying weights introduces significant but controlled changes, particularly in neighborhoods with greater indicator asymmetry. This modulation confirms that weighting based on technical criteria and political feasibility enhances the discriminative capacity of the index without compromising its informational stability.
Additionally, the hierarchical decomposition of weights revealed the relative contribution of each variable to the final index composition. Although active transportation holds a significant share—with emphasis on Pedestrian access and Predisposition to cycling—the current model also assigns substantial weight to public transportation, especially Travel time by bus, evidencing an integrated interpretation of active and collective modes in urban resilience. This internal structure reinforces the model’s flexibility, allowing, when necessary, the reparameterization of weights according to political and strategic planning priorities without compromising its methodological coherence and discriminative capacity.
The intervention proposals derived from the inference blocks indicate practical and cost-effective pathways for improving urban resilience. Investments in light and accessible infrastructure—such as sidewalks, bike lanes, bus stops, and school routes—should be combined with social policies that expand universal access to mobility, especially in areas with high concentrations of elderly residents and low income. The strategic use of electric bicycles and modal integration are practical tools, particularly given the municipality’s topography limitations.
Therefore, this study fulfilled its objective by analyzing urban mobility resilience in Petrópolis, simultaneously considering its socio-spatial inequalities and exposure to energy risks, particularly in fossil fuel scarcity. Through a robust multicriteria model that integrates technical, socioeconomic, and energy dependence variables organized into inference blocks, it was possible to diagnose the most vulnerable territories and identify the structural elements that compromise the continuity of urban mobility under critical conditions. The results demonstrated that peripheral neighborhoods with low active accessibility and socioeconomic fragility concentrate the lowest resilience levels and are more susceptible to the impacts of the energy crisis. Conversely, central areas with better infrastructure exhibit greater adaptive capacity. The combination of statistical and spatial analyses with techniques such as PCA, collinearity, Cronbach’s alpha, and quadrant matrix enabled a deep reading of the urban mobility system, providing concrete inputs for public policies that prioritize investments in active infrastructure, reduction in motorized dependence, and promotion of territorial equity as foundations for strengthening urban resilience.

Suggestions for Future Research

Given the identified limitations and complexity in assessing urban mobility resilience, several opportunities arise for future research. One promising line of investigation involves applying the methodology developed in this study to other Brazilian cities, especially those with rugged topography or pronounced socio-spatial inequalities. Researchers can replicate the multicriteria approach in different contexts to validate the robustness of the IB-11 model and to identify territorial resilience patterns at regional or national scales.
Another important avenue focuses on incorporating the temporal dimension into the analyses. Longitudinal studies can evaluate the evolution of urban resilience over the years, allowing researchers to identify trends, impacts of public policies, and effects of critical events such as natural disasters or energy crises. Future studies can significantly improve the understanding of territories’ real adaptive capacity by including this temporal perspective.
Researchers should also deepen the energy dimension by including variables related to modal energy supply matrices, actual fossil fuel consumption, and infrastructure for electric vehicles. Integrating data on the energy transition in the transport sector would make the indicator even more sensitive to contemporary challenges and more aligned with urban sustainability guidelines.
Future studies may also explore alternative methodological approaches for assigning weights, such as participatory methods or machine learning techniques, which can enhance the objectivity of the decision-making process or, more broadly, incorporate social preferences. Comparative evaluations between different multicriteria methods also represent a fertile field for technical improvement.
Finally, researchers should consider using data with greater spatial granularity, such as census tracts or city blocks, and integrating indicators related to urban health, environmental quality, and traffic safety. This expansion would provide a more systemic view of resilience, strengthening the indicator’s usefulness for urban planning and public management.

Author Contributions

Conceptualization, A.S.d.M. and M.A.V.d.S.; methodology, A.S.d.M.; software, A.S.d.M. and M.H.S.C.; validation, A.S.d.M., M.A.V.d.S. and M.H.S.C.; formal analysis, A.S.d.M.; investigation, A.S.d.M.; resources, A.S.d.M. and M.A.V.d.S.; data curation, A.S.d.M. and M.H.S.C.; writing—original draft preparation, A.S.d.M.; writing—review and editing, A.S.d.M., M.A.V.d.S., M.H.S.C., T.F.S., C.T., G.R. and V.A.; visualization, A.S.d.M.; supervision, A.S.d.M. and V.A.; project administration, A.S.d.M. and M.A.V.d.S.; funding acquisition, V.A. All authors have read and agreed to the published version of the manuscript.

Funding

This research thanks Agencia Nacional de Investigación y Desarrollo (ANID) Chile, grant number Fondecyt 11230050, for the support.

Data Availability Statement

All data used in this study are publicly available from official sources as cited in the manuscript. No proprietary data were generated.

Conflicts of Interest

The authors declare no conflict of interest.

Appendix A. Results of the Normalization of the Inference Blocks

This appendix presents the database containing the results of the surveys (Table A1), which include the normalized results of the variables grouped into inference blocks (IB-1 to IB-11) that compose the Urban Resilience Index (IB-11). The normalizations were performed according to the nature of each variable, considering maximization or minimization rules as applicable. The aim is to ensure comparability across different dimensions of urban mobility, enabling integrated analysis through multicriteria methods.
The values presented in Table A2 correspond to the calculated indicators for each neighborhood in the municipality, already normalized and structured in columns according to the composition of the inference blocks. These results serve as input for the statistical analyses described in Section 4 and the summarized graphical visualizations. The full disclosure of these data in this appendix aims to ensure methodological transparency and enable the reproducibility of the analyses that were conducted.
Table A1. Raw data of the variables.
NeighborhoodsWalking Time to TerminalCycling Time to TerminalSlopePedestrian AccessPredisposition to CyclingBus AccessOther Motorized AccessElderly Population (%)Elderly Population (IBGE)Monthly IncomeAverage Income (IBGE)Bus Access Time to TerminalThe Population Within a 5 min Walking Radius
ADRIANO TEIXEIRA BASTOS (CHAFARIZ)1814838.549104.226.470.1286740.1286741936.2481187.70337.952187.2
Águas Lindas 2102237.7898112.224120.11625602499.7541062.374251408.2
Águas Lindas 2102237.789817.8424120.12665502499.7541062.374251942.98
Alcobaça14.25457.05145211.60.1450850.1450852259.881124.028.9523811475
Alto da Serra25940.7191353620.1825380.1825382214.791277.01527.714298590
Alto do Pegado1493536.31203.4430.887.20.1286740.1309041936.248921.439742.692311160
Amazonas1611124.7533011.220.42.60.1043140.0797263939.005937.212935.63816297.9
Araras 115.43325.8062589820.12306702392.262974.853934.32991376
Araras 21414443.939202.828.64.20.0962830.1351672392.2621464.75880242.9
Araras 31574547.094403.9630.324.840.1147802392.2621177.47126807
Atílio Marotti862038.77610262.40.1100120.1100122171.505923.392232.51618
Barão do Rio Branco581941.998203.412.680.1788120.1788122424.0052045.254151784
Barra Mansa42433.117124.928106.840.1181420.1181422903.7551115.66634.52734
Balllard742341.915603.613.4160.0972990.09729912726.011017.133353443
Bela Vista 19.16539.000367291.720.19851502216.233930.455316.413792296.6
Bela Vista 222750.53707.829.61.2640.20069102216.233683.364312.53336
Benfica34730.0122578.40.11308103939.0051648.5320.714291722.636
Bingen7.581424.8656122613730.1882580.1882583219.8851979.03824.133332061
Boa Vista301138.554907.452.0560.1602720.1602722242.2041069.892182945
Bonfim121543.8017123810.1115970.1115971855.881172.34122.83784914
Bonsucesso 2621536.19701186.40.1345250.1345252205.1721790.76824.529411063
Bonsucesso 3461625.303709.00831.27.080.13452502205.1721852.34424.529411063
Caititu15637.79141153.83.80.1515150.1515155454.0051076.98962.04759
Calembe1163038.0148014.80878.20.111570.111573289.7191610.50228.57143242
Calembe 3982546.15011.1696328.720.11462102499.7542139.942251375.236
Campo do Serrano561728.023108.92382.89920.1818630.164474909.0051082.295101.72051
Capela13532.0238013.0423.099840.1620560.1620563939.0051659.65327.53832
Carangola 1571641.3036023210.074910.074912281.9732091.60932.56252216
Carangola 2511331.22203.0823.164.77120.1304020.1633692676.505832.678462.04759
Cascatinha10.33733.8249667840.1694090.1694092601.6261347.11415.472976989
Castelanea17.51528.9813421010.1653860.1860472662.0761218.477271677
Castelo São Manuel201136.8604163020.1262690.1262692378.0962102.04923.448285219
Castrioto501433.103402103.0830080.1305060.1305062727.0051041.16317613
Caxambu23936.5836019.2610.1876350.1876353073.2911198.95337.52313
Centenário321329.898010.792373.616410.16205603939.0051422.10527.671435339.2
Centro10.17228.91161757826560.2471880.2471882497.5421306.12827.7938921425
Chácara Flora521622.166902.610.22.40.1037960.1832431666.5052862.41927.714298590
Coronel Veiga501427.17930122.880.1850040.1850043181.5051277.015202454
Correas10.51852731.6532736203130.1515150.1535872512.1731812.3326.277234753
Corrego Grande38831.908304.913635.685.8080.1122450.0981913939.0051836.07145529.2
Dr. Thouzet722133.196305.812.9760.1158640.1158642424.005888.9771504091
Duarte da Silveira511628.492804223.1396920.1516330.1516332961.1411338.1521.285716674
Duchas361230.07740123.599040.2192470.2192472424.0051150.3212.51382
Duques1632641.6801011.60823.1351680.12319403939.0051943.927254293.58
Esperaça201344.33534331.19680.1849610.1172062207.5761129.94112.53336
Espírito Santo882130.2933016.606427.283.663250.0708610.0776264671.255888.521141911
Estrada da Saudade 1251844.0345263110.1201520.1201522281.417983.911128.066675801
Estrada da Saudade 223851.410808.28411.93120.16027202242.204883.19910.831086989
Fagundes2537933.648803.728165.5760.11534602196.7541156.91333.751033.84
Fazenda Inglesa 11254541.860606.4784123.2308620.0793140.0793143181.5051070.12230.416671866
Fazenda Inglesa 21645644.740804.8540810.63.2971940.0804140.1122612856.862979.119236.51492.8
Floresta22536.12240141.183360.111460.111462424.0051849.391141911
Frias491751.4181015.361667.65.440.1354630.100842751.053896.312428.904954277.7
Gentio101533.888316.6739239.8640.1165570.1165573181.5051125.433301673
Gulf441323.386102.125.82.25120.1952230.1703982866.8511487.387202454
Humberto Rovigatti491534.818405.242.117440.1359040.1359041969.5041634.30411.251582
Independência1612826.9839062010.0852040.0852042640.4341224.371405035
Itaipava 28.177340.053611234235130.1341680.1341682533.186931.077328.11489559
Itaipava 3411333.211305.77478417.810.19680.1103660.1531613939.0051033.57128.11489559
Itamarati 16.14621.638251177010.2161730.2161732484.6052340.87818.191181249
Itamarati 210445.242707.9630.521.356160.2161730.143642484.605864.759720.010291249
Jardim Salvador28743.19110263.3489280.1304020.1304022676.5051144.53246.666672615
Laginha39833.759302108.492160.1227720.1227721616.0041048.44944.53030
Lopes Trovão722940.15602.5212.641.680.1037960.0849671666.5051039.737482014
Loteamento Boa Vista982540.960803.72830.6566.3064320.1329390.1086072195.326883.861971.25186
Lusitano451331.568807.614.321.2728320.1876350.1061323073.291775.9549452313
Madame Machado23.332030.782733459.836160.0831630.0831632266.192833.35228.622222453
Malta39912741.470103.82649614.043.3901510.0804140.1143672856.862918.211317.614292027
Manga Larga22.52841.75812235.7440.0855020.0855022424.0051230.10843.33333807
Mauá1452225.12709.681620.83.0222340.131810.1074271212.0041177.47127569
Meio da Serra1104735.342702.42411.8160.0961610.0961615454.0051326.535202839
Moinho Preto862338.846306.5996823.1258140.1264690.126469909.005860.919232.51787
Monica731831.929804.28038427.13127.3718780.1227720.1463051616.0041182.35144.53030
Morin101240.086121310.198490.198492222.0051801.94430.769232252
Mosela151930.6371112393.199450.1848810.1848813136.0551187.06327.307696204
Nogueira 2621528.58450186030.1354630.1354632751.0531550.45225.06782724
Nogueira 3801739.8185011.6435234.248.560.12550402499.7541691.451251702.683
Nossa Senhora da Glória201141.1445163610.0863930.0863932256.5581558.57329.583334086
Oswaldo Cruz401122.246703.20812.363.5897780.1952230.1292862866.851848.839521.666673347
Pedras Brancas952934.452506.623936183.1446940.1305060.1753132727.005993.89917613
Pedro do Rio1313137.228504415.8692860.1286740.1286741936.2481085.40826.219513777
Posse9.667440.6471128996.5434570.1052480.1052481768.8691069.38740.597946822
Praça Catulo411216.294802.0246.562.4241960.1952230.2271882866.851916.5748271677
Praça Pasteur431227.791501.94885.3122.0150790.1952230.1999152866.8511983.857123319.2
Quarteirão Brasileiro631739.1323011730.1045440.1045442196.7551868.58727.81255414
Quarteirão Ingelheim571732.23109.98413.065270.1818630.181863909.0051265.8881132051
Quissamã8.6624.372857251.0760320.1849610.1849612525.0051851.92918.442806
Quitandinha131627.81671226360.1628320.1628322778.9481390.40329.698418997
Retiro 1701552.123205402.49920.1114150.1114152058.8512002.69632.56413662
Retiro 2441135.149205.55233.6322.751680.1602720.1193842242.2041641.93362.04759
Retiro das Pedras1754336.728403.233645.4239440.0698920.0698921212.0041126.64571.25186
Ribeirão Grande791842.20303.1923219.73125.5933070.1329390.1400192195.326820.857743.33333807
Rio Bonito902134.545605.2083226.4121490.1122450.1122453939.0051177.47137.5882
Rio de Janeiro902229.8642016.68928143.7478180.0708610.0708614671.255950.733876.538461510
Rocinha3138645.741902.7987218.3845.160250.0966020.0661762392.2621283.34857204.6
Roseiral36828.561913213.2587140.1450680.1450683553.3691082.89925.428572585
Samabaia201136.3093110372.7450160.1359040.1298482679.1631115.44416.277783481
Santa Rosa32813327.1445012.0979213.243.151480.11526603939.0051173.525561510.5
São Sebastião1362633.6133031020.1476870.1476872561.732870.847632.75857
Sargento Boening672330.27730232.0180950.1037960.1037962929.0051301.44204268
Secretário2086135.745802265.3012750.1165520.1165522424.0051114.7942.692311450
Simeria52637.316415.2963281.9996470.1576370.1576371986.338975.7402503064
Taquara102226.6866110.9171833.031410.131810.131811212.0041346.80930569
Taquaril 4871948.633404.913641.4566.6905490.11814202903.7551529.76734.52734
Taquaril 5711750.777405.2083243.57126.5886580.11814202903.7551187.70334.52734
Vale das Carangolas 1943342.755603.81641.9922.814080.074910.083862281.9731187.70351.666671686
Vale das Carangolas 2702437.0414010.477.565.440.1360960.1236232392.262974.853951.666671686
Vale das Videiras47116544.181801123.8556910.0835730.0835732095.7541854.18353.33333347
Vale do Cuiabá6.6673641.3201367160.1174020.1174022639.8921029.35930.214291678
Valparaíso411220.783103132.6320510.1952230.1952232866.8511160.64823.846156029
Vicenzo Rivetti511336.355604.059233.5650560.1281140.1281142828.0032023.93251.666671686
Vila Felipe592036.316602.908812.5681.9828190.1037960.1543321666.505970.2847482014
Vila Militar571726.21470133.052620.1918140.1918141919.0051076.98921.666673347
Vila Rica901944.3433055120.1329390.1329392195.3262308.10323.117651858
Vila São Luiz44323944.134201.828812.1146980.16892602424.005890.7018351677
Vinte e Quatro de Maio15833.78151112.9678550.1211140.1211143939.005915.0804102766
Vista Alegre37312445.523703.79179573.594780.0804140.0804142856.862947.487319.571432027
Table A2. Normalized data with AHP method weights.
NeighborhoodsIB-1 Pedestrian AccessibilityIB-2 Bicycle AccessibilityIB-3 Active Transport × AccessibilityIB-4 Active Transport × MobilityIB-5 Active TransportIB-6 Mobility IndicatorIB-7 Fossil Fuel DependencyIB-8 Social LimitersIB-10 Socioeconomic FactorIB-9 Transport IndicatorIB-11 Urban ResilienceIB-11 Urban Resilience (Normalized)
ADRIANO TEIXEIRA BASTOS (CHAFARIZ)0.079078016920.21104189630.14505995660.003865435640.10976132640.15594539140.14236351060.19168268560.16015279230.12945788870.13457472910.2691494582
Águas Lindas 20.56247908330.46820397460.5153415290.034629384850.39516349290.14504559280.23753448850.30579126840.17914420340.29322676680.27420920350.5484184069
Águas Lindas 20.56247908330.46820397460.5153415290.016533053190.390639410.14504559280.23753448850.22301719350.2041100360.29096472530.27648604860.5529720972
Alcobaça0.55878868620.5614538280.56012125710.017353251230.42442925570.065115859210.23753448850.11019910320.1377571660.28787721470.26285220260.5257044052
Alto da Serra0.54748677190.55021871450.54885274320.012386011740.41473606030.17708671220.23753448850.034336874630.16272299850.31102333030.2863016650.57260333
Alto do Pegado0.15165716660.34095347150.24630531910.0022773634840.18529833020.18998185680.28255792960.19168268560.084118039250.21078411170.18966887740.3793377548
Amazonas0.15313820840.57580718660.36447269750.029827954190.28081151170.069950108140.23022676830.43513697380.2658495380.21544997490.22385158210.4477031642
Araras 10.58698389890.388717950.48785092450.034193424070.37443654940.53314763140.13483630850.24689162190.1128470950.35421425970.31397835330.6279567066
Araras 20.17249124230.24759212940.21004168580.0012498385030.1578437240.14603847540.11422821940.47592023590.45196468060.14398853570.19532815910.3906563181
Araras 30.12871252340.2379153940.18331395870.0033224897310.13831609150.16720049790.3550312770.31536176330.14840008410.19971598940.1911616280.3823232561
Atílio Marotti0.36910348220.48463144430.42686746320.00038844968590.32024770980.011918414610.073091919740.35059366040.23802021570.18137643850.19081895620.3816379123
Barão do Rio Branco0.46832230910.49194133430.48013182170.0022046298780.36065002370.010799822740.24003306730.043057947330.16473861290.24303323440.2299815210.4599630419
Barra Mansa0.56820219760.45474929510.51147574640.0086089280940.38575904180.069693123250.10816102770.30014156010.21060902990.23734305860.2328864960.4657729921
Bataillard0.41332520360.45836646390.43584583380.0025793773590.32752921970.020282554720.24107632410.49798800120.064711962940.22910432950.2017001220.4034002441
Bela Vista 10.56235427510.56094589590.56165008550.037933535370.4307209480.12005827860.12207647120.028930558540.2457006940.27589416150.27086091040.5417218209
Bela Vista 20.55113617510.5559960310.55356610310.015653367450.41908791920.122717630.093815436740.028579795020.38527570740.26367722630.28394769310.5678953862
Benfica0.5442094320.56871291880.55646117540.0088105950210.41954853030.066968349350.28855491410.35740306390.084876964580.2986550810.2630182690.526036538
Bingen0.59561649110.55960706620.57761177860.15604399340.47221983230.57504781320.306334180.056511460940.14463257130.45645541450.40447454650.808949093
Boa Vista0.5399884180.54263339030.54131090410.014085577130.40950457240.0072074833260.2334777140.062506729120.21890917190.26492358550.25725298280.5145059655
Bonfim0.56033993080.52005495950.54019744520.0011090530170.40542534710.18949489670.45989980980.32698932870.085697950280.36506135020.31849147140.6369829429
Bonsucesso 20.45725034680.522141220.489695783400.36727183760.10042125320.22267656450.16209739990.13920039140.26441037320.24353786920.4870757385
Bonsucesso 30.53478173240.54491105280.53984639260.020597127140.41003407630.19196587790.27791911550.16209739990.17314250960.32248828650.29759234550.595184691
Caititu0.55948061550.55957960850.5595301120.00072060333080.41982773480.34442464830.21923188250.12054347780.09492716840.35082800010.30816933150.6163386629
Calembe0.25634528330.39168336650.32401432490.043461289570.25387606610.066626721330.26500419480.36408999140.09492716840.20984576210.19068883250.381377665
Calembe 30.32238612820.43977326620.38107969720.029701574030.29323516640.20227687590.17486335470.31986159570.066293329610.24090264090.21179526870.4235905374
Campo do Serrano0.49390185890.52609305410.50999745650.020229341650.38755542780.20295041890.16767347820.0078506300190.18210320750.28643368820.2690417970.5380835941
Capela0.56734215690.56785441130.56759828410.037185168270.43499500510.01619922190.266150130.090603934240.18485469180.28808484050.27087637480.5417527495
Carangola 10.47156985990.51377285240.49267135620.00038844968590.36960062960.14091491650.10147544450.58663011550.060832007760.2453979050.214630770.4292615399
Carangola 20.49889923760.54118482140.52004202950.0016632998440.39044734710.11554087780.15162221690.20175194680.20214175950.26201444720.25203367020.5040673404
Cascatinha0.56572358850.56063489170.56317924010.034388811380.43098163290.49592625740.17217449110.057462166840.35922050140.38251600360.37863264340.7572652868
Castelanea0.57209099150.53596469840.5540278450.011807985070.418472880.01350722860.060421469430.064976261820.10689756410.22771861450.20757774540.4151554908
Castelo São Manuel0.55524450310.54343399280.5493392480.0097409208970.41443966620.12952038290.48139029470.22228506290.27068872360.35994750250.3450680640.6901361281
Castrioto0.49801296890.53176098480.51488697690.00038844968590.38626234510.029317257910.15457586220.20235185560.070532174150.23910445260.21100345380.4220069075
Caxambu0.55176989360.55173718870.55175354120.054575009950.42745890840.0042039788360.24288327070.054161398250.32303488210.27550126660.28342512030.5668502405
Centenário0.54844796180.54475740950.54660268560.028123480920.41698288450.204283530.23985718180.090603934240.10453798080.31952662020.2836880140.567376028
Centro0.57740651830.57875415230.57808033530.6250.58981025150.61335575930.069239689870.035319188770.098416800020.4655539880.40435221880.8087044376
Chácara Flora0.53317656580.56014340670.54665998630.00098961593750.41024239370.021820981670.24419280430.39099516450.2605062450.27162464330.26977120630.5395424127
Coronel Veiga0.5152265670.54897458280.532100574900.39907543120.013384508220.44767872760.057274080970.26765959440.31480352450.30694463140.6138892628
Correas0.56949109550.56448802350.56698955950.40403001580.52624967360.62499338050.1525939030.093834433170.44417868290.45752165770.45529738380.9105947675
Corrego Grande0.5309305490.56109909710.5460148230.0056920699840.41093413480.21969378290.2120119740.36475017310.10800851480.31339350660.27915582850.558311657
Dr. Thouzet0.42590445870.48107838530.4534914220.0083627975680.34220926590.014426859080.4665431630.30695451320.24379382420.29134713850.2834200010.566840002
Duarte da Silveira0.50716028870.53120634770.51918331820.003410381480.3902400840.086276949060.14057572250.1046458450.18455220560.25183320990.24061746650.481234933
Duchas0.53988095960.54944787620.544664417900.40849831340.022977384270.023713190290.033462280480.32290995560.21592180030.23375672580.4675134516
Duques0.11464155240.43049325940.27256740590.031512302450.21230363010.016664187530.23873875580.27312993760.29134794890.17000255090.19023082870.3804616574
Esperaça0.55358022350.53177848430.54267935390.012958908320.41024924250.00083724751160.25646405720.032837830930.041924528630.26944994740.23152146010.4630429202
Espírito Santo0.37251991540.4874115790.42996574720.048809918010.33467678990.12898676230.17334378580.62423329520.3151464280.2429210320.25496100550.509922011
Estrada da Saudade 10.54717806910.49941118650.52329462780.011897196750.39544527010.13312698990.24539398880.26678554310.14676158920.29235287970.26808281160.5361656231
Estrada da Saudade 20.54985157250.55315559890.55150358570.017586281710.41802425970.21801323260.30442614210.062506729120.36168048680.33962197350.34329912770.6865982554
Fagundes0.016200792790.040509854240.028355323520.0028336124080.021974895740.083926302940.20522888420.30455595560.35934059030.083276244650.12929617110.2585923421
Fazenda Inglesa 10.22385309450.23814282750.2309979610.010665878530.17591494040.037826703730.3575871960.5968593990.27321100470.18681094510.20121383510.4024276701
Fazenda Inglesa 20.11216416790.1448479990.12850608350.0055280876140.097761584490.0340059650.1346716820.58629224770.16527290110.0910502040.10342312760.2068462552
Floresta0.55337864660.56239428210.557886464400.41841484830.0016581448650.13780686930.34538688680.34569990360.24407367770.26101476950.522029539
Frias0.49512111450.50657643180.50084877310.045225217140.38694288410.4597664560.090499597110.17207694140.32292152780.33103795530.32968494690.6593698937
Gentio0.56578081580.52450658030.54514369810.01208637440.41187936710.062856815680.24076183340.3189677440.22225728260.28184434580.27191118240.5438223648
Gulf0.54939871140.57253948610.56096909870.00048688546590.42084854540.010117841040.36141289660.047509763890.26392605050.30330695710.296742160.59348432
Humberto Rovigatti0.49854760530.5233796090.51096360720.0065091438480.38484999130.0065485041040.15376835330.14681051620.19734034330.232504210.22664239340.4532847869
Independência0.14279100450.4344315570.28861128080.0090203175660.218713540.057749110460.21037864040.55856187880.10312635620.17638870770.16417587370.3283517474
Itaipava 20.56241091510.054377188050.30839405160.62492959360.38752793710.62499604670.25115423190.17396557860.10708824620.41280153820.36183913240.7236782649
Itaipava 30.52156411220.53724871490.52940641360.0082812453510.39912512150.10796562670.081668479340.38137554270.48566432370.24697108730.28676124980.5735224996
Itamarati 10.61142474660.60741381120.60941927890.59228247010.60513507670.42770612960.45075108840.035320518870.089552366550.52218184280.45006250910.9001250183
Itamarati 20.56127761040.56150586750.5613917390.016291994780.42511680290.12996079140.19223587830.035320518870.19325734860.29310756890.27646253720.5529250743
Jardim Salvador0.54258854510.55613027670.54935941090.00038844968590.41211667060.023569841450.43169386310.20175194680.037781683410.31987426150.27284942870.5456988574
Laginha0.52544939350.55788673340.54166806350.00038844968590.406348160.074570644280.2702247570.22643897590.037781683410.28937293030.24743266950.4948653389
Lopes Trovão0.42083526050.40116023680.41099774870.00089382181670.3084717670.024323337880.036985789850.39099516450.18956510350.16956316540.17289748850.345794977
Loteamento Boa Vista0.32271628150.44010341950.38140985050.0028336124080.2867657910.18355759210.069840959520.17147669790.2261025520.20673253340.20996151550.419923031
Lusitano0.5146506070.54038029060.52751544880.014864045190.39935259790.029475943140.033526952590.054161398250.25043503350.21542702290.22126285820.4425257165
Madame Machado0.55999474390.49434600540.52717037460.0079916688290.39737569820.31002444240.09225619130.55819172970.085738348960.29925800750.26366428040.5273285609
Malta0.0003233419850.00068380648440.00050357423470.0030367827980.0011368763760.047910045550.045466802650.58629224770.098416800020.023912650240.036332492010.07266498401
Manga Larga0.55075879160.41091968590.48083923880.0032653288670.36144576130.049404995440.28894047920.5508685090.35840986830.26530924930.28082912250.561658245
Mauá0.19303156560.49925340650.3461424860.023433535340.26546524840.077449116540.24545528310.15420307260.34877324550.21345872410.23601565480.4720313096
Meio da Serra0.28001531190.22208683430.25105107310.00078517328450.18848459820.0027355154260.061837570940.50707968520.28249198570.11038557070.13907571010.2781514201
Moinho Preto0.36908056020.45897001490.41402528760.011098252610.31329352880.016540776890.18654680620.18900206480.079809980390.20741866020.18614629330.3722925865
Monica0.42461723160.50721850490.46591786830.0040555552410.350452290.16263516710.20668747760.22643897590.35530467290.26755680620.28218437560.5643687511
Morin0.56174557940.53744006330.54959282130.0011090530170.41247187930.023788209070.11047220880.029111961430.13783135890.23980104410.22280269760.4456053952
Mosela0.56919346270.5026735140.53593348840.033826878730.41040683590.21514476950.11387322090.056539767220.2261025520.28745791560.27722997650.5544599529
Nogueira 20.4724744690.53736534220.50491990560.052187362010.39173676970.37931887470.12789659370.17207694140.082466235090.32267225190.28262990890.5652598179
Nogueira 30.39147948770.50715343970.44931646370.031657794280.34490179630.21989011420.2527475540.23147365250.26128888470.29061031520.28572243280.5714448655
Nossa Senhora da Glória0.55383595350.54202544320.54793069840.0097409208970.4133832540.1730238940.35409169010.54082726480.18108426020.3384705230.3122342330.624468466
Oswaldo Cruz0.56470605090.58800294680.57635449880.001871123710.43273365510.044046208220.27495674910.047509763890.15499321770.29611756690.27259213790.5451842757
Pedras Brancas0.33766559230.40449525320.37108042270.011185423050.28110667280.063346525210.21232772930.20235185560.43961251410.20947190.24783634040.4956726808
Pedro do Rio0.20512689140.38183809730.29348249440.003410381480.22096446610.26427565040.21463552560.19168268560.1547128130.23021002710.21762464150.435249283
Posse0.56177672530.56186758010.56182215270.11126598140.44918310990.58556168160.25687181550.3809357930.10453798080.43519992920.38007858240.7601571648
Praça Catulo0.57851320360.59942000560.58896660460.00040725740960.44182676780.013159287250.28668124640.047509763890.24988645980.29587351730.28820747480.5764149497
Praça Pasteur0.53152203420.55734726330.54443464870.00034979941270.40841343640.0073116899070.34247672660.047509763890.43096704310.29165382230.31487733620.6297546724
Quarteirão Brasileiro0.45247566510.50733222520.479903945200.35992795890.056326637230.15440189160.39996151330.061798925180.23264611160.20416588570.4083317713
Quarteirão Ingelheim0.47854486490.51386417580.49620452040.024713240760.37833170050.015578544680.24993789370.0078506300190.15315593020.25554495980.23847670860.4769534172
Quissamã0.5977342360.59431047250.59602235430.030305882230.45459323620.089309452360.16900468840.04226203940.41713469690.29187515330.31275591920.6255118385
Quitandinha0.57996373360.53378553120.55687463240.059222930110.43246170680.43586597420.0077892788460.072416709280.060832007760.32714466670.28275034640.5655006929
Retiro 10.42748895690.5199524860.47372072140.005933715840.356773970.21488918660.2608641790.33469515670.12096798140.29732532640.2679265570.535853114
Retiro 20.51164482460.54477682820.52821082640.0075742941710.39805169330.16549724190.34278601310.062506729120.28542447060.32609666040.31931660640.6386332128
Retiro das Pedras0.090944284790.25906937550.17500683020.0019140885190.13173364480.047245267460.20914920920.56436394650.31542349280.12996544150.16088129870.3217625973
Ribeirão Grande0.39485106680.49953172680.44719139680.0018450374920.3358548070.10357501930.085399651470.17147669790.037274955250.21517107120.18551578860.3710315773
Rio Bonito0.35670075930.47923562360.41796819140.0065335591920.31510953340.053942200970.024100028960.36475017310.28218197320.17706532420.19458826960.3891765391
Rio de Janeiro0.36613021770.48011189330.42312105550.049029522520.32959817230.052689521410.088922582860.62423329520.092796080170.20020211220.18229752670.3645950533
Rocinha0.0014126991530.021122005270.011267352210.0012480794480.0087625340220.09173674810.094108800940.47336728850.19120824910.050842654270.074241598920.1484831978
Roseiral0.54484910650.57064977660.55774944160.0022599762590.41887707530.081765421640.026502391020.13828110430.34263080270.23650549080.25419658030.5083931606
Samabaia0.55560797760.54379746730.54970272250.025501571470.41865243470.19280184370.051901337220.16770484650.23669006680.27050201260.26486556120.5297311224
Santa Rosa0.023839599660.023276478530.023558039090.033500151060.026043567080.041438953060.20222531970.33838850390.15608532540.073937851720.087631835590.1752636712
São Sebastião0.19258150970.43516610760.31387380870.0015393729280.23579019970.017570046860.32566936360.10865572420.22221730040.20370495250.20679096090.4135819218
Sargento Boening0.44999305910.47007760560.46003533230.00038844968590.34512361170.0048808330910.027752714770.42644667640.19972998950.18072019280.18388912590.3677782518
Secretário0.04340792840.11384874540.078628336890.00038844968590.059068365090.14066938160.10943913740.30107682820.28137842980.092061312290.12362047580.2472409516
Simeria0.56395084710.431711630.49783123860.0075146946910.37525210260.012270279610.20776013640.060693293680.3906850990.24263365530.2673138310.5346276619
Taquara0.58629098260.49201587390.53915342830.029368832830.41170727940.015813774060.11018007090.15420307260.17850706470.23735210090.22754263340.4550852668
Taquaril 40.36443546620.49171681240.42807613930.0056920699840.3224801220.27369554740.022634900550.30014156010.14519637450.2353226730.2202986190.440597238
Taquaril 50.42392298830.50657727140.46525012990.0065335591920.35057098720.29079612670.13024683250.30014156010.079809980390.28054623340.24708350.494167
Vale das Carangolas 10.33782106060.35981392360.34881749210.0030148228380.26236682480.23516728550.22407768330.58663011550.2457006940.24599465460.24594565140.4918913027
Vale das Carangolas 20.42912573870.4506850790.43990540890.026472655820.33654722060.51150168120.23262797290.158590690.2457006940.35430602390.33620151540.6724030307
Vale das Videiras0.000087361778290.000089153490230.0000882576342600.00006619322570.046430484370.13075620610.55096738080.33178236960.044329769230.092248117720.1844962354
Vale do Cuiabá0.56256034030.32875607830.44565820930.015472613470.33811181040.48406851010.2689234040.29991929690.11776265690.35730388370.31737236120.6347447224
Valparaíso0.5687190020.5896258040.5791724030.0015393729280.43476414550.034033209620.033637712530.047509763890.27596444050.23429980330.24124529830.4824905966
Vicenzo Rivetti0.49148781310.53377339690.5126306050.0035423804450.38535854880.023012410170.36259788780.22116976240.18805063740.28908184890.2722399460.5444798919
Vila Felipe0.46698824350.48586616910.47642720630.0014037358910.35767133870.026068704350.19181104410.39099516450.25394400180.23330560650.2367460270.4734920539
Vila Militar0.4984381920.53375750290.516097847500.38707338560.016088721490.024678768440.02140667270.14905219310.20372856530.1946140140.3892280281
Vila Rica0.35304910960.49178820680.42241865820.005933715840.31829742260.30090468060.034399635820.17147669790.25043503350.24297479040.24421841290.4884368259
Vila São Luiz0.000091720488350.000088725129070.000090222808710.00026709007960.00013443962640.0050077916190.20065678230.053079093760.14166126740.051483363280.06651601990.1330320398
Vinte e Quatro de Maio0.5629297880.55785576380.56039277590.00072060333080.42047473280.01432295140.33131933260.28956099170.13260445230.29664793740.26930188840.5386037768
Vista Alegre0.00015108410850.00059696542810.00037402476830.0029644618720.0010216340440.028793305550.086178055190.58629224770.064583590110.029253657210.035143157020.07028631404
The statistical analysis of the inference blocks composing the Urban Resilience Index reveals distinct distribution patterns among the indicators, emphasizing blocks that exhibit behaviors outside the expected standard. The most evident case is IB-4 (Active Transport × Mobility), which shows extremely high skewness (5.06) and elevated kurtosis (25.54), configuring a distribution highly concentrated in low values, with few neighborhoods registering high performance. This pattern indicates significant inequality in access to active mobility related to usage, exposing the system’s fragility in ensuring this right broadly. Although less extreme, similar situations occur in IB-2 (Bicycle Accessibility) and IB-3 (Active Transport × Accessibility), both presenting strong negative skewness, indicating a concentration of good performances with isolated exceptions of neighborhoods in critical condition, as shown in Table A3.
On the other hand, blocks such as IB-6 (Mobility Indicator) and IB-7 (Fossil Fuel Dependency) display more moderate skewness, with a tendency toward concentration of median values and few outliers. Meanwhile, IB-8 (Social Limiters) and IB-10 (Socioeconomic Factor) present platykurtic and slightly skewed distributions, suggesting a more balanced dispersion among neighborhoods, with continuous variation in social conditions. The final indicator, IB-11 (Urban Resilience, normalized), shows a relatively symmetrical distribution, with mean values close to the median, indicating a moderate urban performance with a slight negative bias. These findings reinforce that, although the municipality shows progress in some areas, there are still pronounced inequalities in specific aspects of active mobility, requiring targeted interventions adapted to the local reality.
Table A3. Statistical data of the normalized variables.
StatisticBI-1BI-2BI-3BI-4BI-5BI-6BI-7BI-8BI-10BI-9BI-11
Mean0.4290.4570.4430.0330.3410.1410.1960.2410.2040.2550.246
Standard Error0.0160.0140.0140.0100.0110.0150.0100.0170.0100.0080.007
Median0.5070.5140.5110.0080.3870.0820.2070.2020.1880.2620.254
Mode0.5620.4680.5150.000N/A0.1450.2380.0480.246N/AN/A
Standard Deviation0.1750.1530.1560.1040.1230.1590.1100.1790.1070.0890.075
Sample Variance0.0310.0230.0240.0110.0150.0250.0120.0320.0110.0080.006
Kurtosis0.3262.7261.72625.5411.6351.933−0.130−0.725−0.4301.1321.233
Skewness−1.249−1.895−1.6065.062−1.3441.6120.4080.5930.531−0.170−0.241
Range0.6110.6070.6090.6250.6050.6240.4740.6160.4480.4980.420
Minimum0.0000.0000.0000.0000.0000.0010.0080.0080.0370.0240.035
Maximum0.6110.6070.6090.6250.6050.6250.4810.6240.4860.5220.455
Sum50.19053.48251.8363.89339.85016.52122.95628.19523.82229.79428.799
Count117117117117117117117117117117117
Confidence Level (95%)0.0320.0280.0290.0190.0220.0290.0200.0330.0200.0160.014
N/A = Not Applicable.

References

  1. Filonchyk, M.; Peterson, M.; Zhang, L.; Hurynovich, V.; He, Y. Greenhouse gases emissions and global climate change: Examining the influence of CO2, CH4, and N2O. Sci. Total Environ. 2024, 935, 173359. [Google Scholar] [CrossRef]
  2. Energy Institute. Statistical Review of World Energy 2024; Energy Institute: London, UK, 2024; Available online: https://www.energyinst.org/statistical-review (accessed on 12 May 2025).
  3. Johnsson, F.; Kjärstad, J.; Rootzén, J. The threat to climate change mitigation posed by the abundance of fossil fuels. Clim. Policy 2018, 19, 258–274. [Google Scholar] [CrossRef]
  4. Holechek, J.; Geli, H.; Sawalhah, M.; Valdez, R. A global assessment: Can renewable energy replace fossil fuels by 2050? Sustainability 2022, 14, 4792. [Google Scholar] [CrossRef]
  5. Kartal, M. The Role of Consumption of Energy, Fossil Sources, Nuclear Energy, and Renewable Energy on Environmental Degradation in Top-Five Carbon Producing Countries. Renew. Energy 2021, 184, 871–880. [Google Scholar] [CrossRef]
  6. Sullivan, J.L.; Novak, D.C.; Aultman-Hall, L.; Scott, D.M. Identifying Critical Road Segments and Measuring System-Wide Robustness in Transportation Networks with Isolating Links: A Link-Based Capacity-Reduction Approach. Transp. Res. Part A Policy Pract. 2010, 44, 323–336. [Google Scholar] [CrossRef]
  7. Fernandes, V.A.; Rothfuss, R.; Hochschild, V.; Vieira da Silva, M.A.; Ribeiro da Silva, W.; Steiniger, S.; Floriano dos Santos, T. Urban Resilience in The Face of Fossil Fuel Dependency: The Case of Rio de Janeiro’s Urban Mobility. Urbe Rev. Bras. Gest. Urbana 2018, 10, 431–443. [Google Scholar] [CrossRef]
  8. Lindbergh, S.; He, Y.; Radke, J. Beyond Carbon: Unveiling Vulnerabilities of the Transportation Fuel System for Climate Resilience. Energy Res. Soc. Sci. 2024, 114, 103585. [Google Scholar] [CrossRef]
  9. Schwanen, T. Rethinking Resilience As Capacity to Endure: Automobility and the City. City 2016, 20, 152–160. [Google Scholar] [CrossRef]
  10. Mayer, A. Fossil Fuel Dependence and Energy Insecurity. Energy Sustain. Soc. 2022, 12, 27. [Google Scholar] [CrossRef]
  11. Sharifi, A. A Critical Review of Selected Tools for Assessing Community Resilience. Ecol. Indic. 2016, 69, 629–647. [Google Scholar] [CrossRef]
  12. Sotto, D.; Ribeiro, D.G.; Abiko, A.K.; Sampaio, C.A.C.; Navias, C.A.; Marins, K.R.C.; Sobral, M.C.M.; Philippi, A., Jr.; Buckeridge, M.S. Sustentabilidade Urbana: Dimensões Conceituais E Instrumentos Legais De Implementação. Estud. Av. 2019, 33, 61–88. [Google Scholar] [CrossRef]
  13. Lara, J. Contradicciones Y Paradojas Del Modelo De Gestión Urbana En El Área Metropolitana De Guadalajara, Jalisco, México. Cid. Comunid. Territ. 2020, 22, 47–69. [Google Scholar] [CrossRef]
  14. Martello, M.V.; Whittle, A.J.; Keenan, J.M.; Salvucci, F.P. Evaluation of Climate Change Resilience for Boston’s Rail Rapid Transit Network. Transp. Res. Part D Transp. Environ. 2021, 97, 102908. [Google Scholar] [CrossRef]
  15. Zhang, J.; Zhang, Z.; Song, D.; Huang, Z.; Lu, L. A study on a framework for identifying critical roads in urban road traffic networks based on the resilience perspective against the background of sustainable development. Appl. Sci. 2025, 15, 3581. [Google Scholar] [CrossRef]
  16. SEEG. Sistema de Estimativas de Emissões de Gases de Efeito Estufa. 2023. Available online: https://seeg.eco.br (accessed on 12 May 2025).
  17. Makaremi, S. A Multi-output Deep Learning Model for Energy Demand and Port Availability Forecasting in EV Charging Infrastructure. Energy 2025, 317, 134582. [Google Scholar] [CrossRef]
  18. Chen, Z.; Qiao, R.; Li, S.; Zhou, S.; Zhang, X.; Wu, Z.; Wu, T. Heat and Mobility: Machine Learning Perspectives on Bike-Sharing Resilience in Shanghai. Transp. Res. Part D Transp. Environ. 2025, 142, 104692. [Google Scholar] [CrossRef]
  19. Dan, Z.; Zhou, B.; Zhou, Y. Optimal Infrastructures and Integrative Energy Networks for Sustainable and Energy-Resilient City Renaissance. Appl. Energy 2025, 387, 125612. [Google Scholar] [CrossRef]
  20. Amghar, R.; Jaber, S.; Ameli, M. Resilience as a Service for Transportation Networks: Definition and Basic Concepts. Transp. Res. Rec. J. Transp. Res. Board 2023, 2678. [Google Scholar] [CrossRef]
  21. Guo, F.; Zheng, R.; Zhao, J.; Zhang, H.; Dong, J. Framework of Street Grid-Based Urban Heat Vulnerability Assessment: Integrating Entropy Weight Method and BPNN Model. Urban Clim. 2024, 50, 102067. [Google Scholar] [CrossRef]
  22. Sun, Y.; Li, Y.; Gao, C.; Wu, Y. Mapping Urban Socio-Economic Vulnerability Related to Heat Risk: A Grid-Based Assessment Framework by Combining Geo-Spatial Big Data. Urban Clim. 2022, 42, 101169. [Google Scholar] [CrossRef]
  23. Song, W.; Li, Y.; Cheng, J.; Chen, R.; Wu, J.; Jia, N. Enhancing Social Vulnerability Assessment With Energy Resilience: A Comprehensive Study of the Netherlands. Sustain. Cities Soc. 2024, 102, 105251. [Google Scholar] [CrossRef]
  24. Ahmad, L.; Bhat, M.; Singh, V. Assessment of Energy Vulnerability in Urban Crowded Space of Indian Himalaya. Environ. Sci. Pollut. Res. 2021, 28, 68657–68669. [Google Scholar] [CrossRef] [PubMed]
  25. Diaz-Sarachaga, J.; Jato-Espino, D. Analysis of Vulnerability Assessment Frameworks and Methodologies in Urban Areas. Nat. Hazards 2019, 100, 437–457. [Google Scholar] [CrossRef]
  26. Fernandes, V.M.; Ribeiro, H.M.; Pereira, R.H.M. Assessing Urban Mobility Resilience to Fossil Fuel Dependency: A Case Study in Rio de Janeiro. Transp. Policy 2018, 63, 29–39. [Google Scholar]
  27. Brazilian Institute of Geography and Statistics. 2010 Population Census: Universe Results. IBGE: Rio de Janeiro, Brazil, 2010. Available online: https://www.ibge.gov.br/en/statistics/social/labor/18391-2010-population-census.html?=&t=o-que-e (accessed on 12 May 2025).
  28. City Hall of Rio de Janeiro. Master Plan for Sustainable Urban Development of Rio de Janeiro. City Hall of Rio de Janeiro: Rio de Janeiro, Brazil, 2014. Available online: https://planodiretor-pcrj.hub.arcgis.com (accessed on 12 May 2025).
  29. City Hall of Rio de Janeiro. Urban Mobility Plans of Rio de Janeiro. City Hall of Rio de Janeiro: Rio de Janeiro, Brazil, 2014. Available online: https://latinno.net/en/case/3270/ (accessed on 12 May 2025).
  30. Sun, C.; Chen, X.; Zhang, H.M.; Huang, Z. An Evaluation Method of Urban Public Transport Facilities Resource Supply Based on Accessibility. J. Adv. Transp. 2018, 3754205. [Google Scholar] [CrossRef]
  31. van Soest, D.; Tight, M.R.; Rogers, C.D.F. Exploring the Distances People Walk to Access Public Transport. Transp. Rev. 2020, 40, 160–182.s. [Google Scholar] [CrossRef]
  32. Liu, X.; Chen, J.; Du, B.; Yan, X.; Peng, Q.; Shen, J. Resilience Assessment of Urban Rail Transit Stations Considering Disturbance and Time-Varying Passenger Flow. Comput.-Aided Civ. Infrastruct. Eng. 2025, 40, 1627–1651. [Google Scholar] [CrossRef]
  33. Jardim, B.; de Castro Neto, M.; Barriguinha, A. A Street-Point Method to Measure the Spatiotemporal Relationship between Walkability and Pedestrian Flow. Comput. Environ. Urban Syst. 2023, 104, 101993. [Google Scholar] [CrossRef]
  34. Giuffrida, N.; Mölter, A.; Pilla, F.; Carroll, P.; Ottomanelli, M. On the Equity of the X-Minute City from the Perspective of Walkability. Transp. Eng. 2024, 16, 100244. [Google Scholar] [CrossRef]
  35. Zhou, H.; Dorsman, J.L.; Mandjes, M.; Snelder, M. Sustainable Mobility Strategies and Their Impact: A Case Study Using a Multimodal Activity Based Model. Case Stud. Transp. Policy 2023, 11, 100945. [Google Scholar] [CrossRef]
  36. Martens, K. The bicycle as a feedering mode: Experiences from three European countries. Transp. Res. Part D Transp. Environ. 2004, 9, 281–294. [Google Scholar] [CrossRef]
  37. Hochmair, H.H. Assessment of Bicycle Service Areas around Transit Stations. Int. J. Sustain. Transp. 2015, 9, 15–29. [Google Scholar] [CrossRef]
  38. Cordovil, R.; Mercê, C.; Branco, M.; Lopes, F.; Catela, D.; Hasanen, E.; Laukkanen, A.; Tortella, P.; Fumagalli, G.; Sá, C.; et al. Learning to Cycle: A Cross-Cultural and Cross-Generational Comparison. Front. Public Health 2022, 10. [Google Scholar] [CrossRef] [PubMed]
  39. Delclòs-Alió, X.; den Hoed, W. Perceptions of Potential Cycling Infrastructure in a Low-Cycling Context: Evidence from a Medium-Sized Urban Area. Int. J. Sustain. Transp. 2024, 999–1011. [Google Scholar] [CrossRef]
  40. Gutiérrez, M.; Hurtubia, R.; de Ortúzar, J.D. The Role of Habit and the Built Environment in the Willingness to Commute by Bicycle. Travel Behav. Soc. 2020, 20, 62–73. [Google Scholar] [CrossRef]
  41. Hayauchi, G.; Ariyoshi, R.; Morikawa, T.; Nakamura, F. Assessment of the Improvement of Public Transport in Hillside Cities Considering the Impact of Topography on Walking Choices. Sustainability 2023, 15, 9571. [Google Scholar] [CrossRef]
  42. Wibowo, S.; Olszewski, P. Modeling Walking Accessibility to Public Transport Terminals: Case Study of Singapore Mass Rapid Transit. J. East. Asia Soc. Transp. Stud. 2005, 6, 147–160. [Google Scholar]
  43. Nogueira, A.; Santos, B.; Gonçalves, J.; Kempa, J.; Chmielewski, J. Transportation Network Spatial Analysis to Measure Pedestrian Suitability. The Case Hilly Cities. IOP Conf. Ser. Mater. Sci. Eng. 2021, 1203, 22107. [Google Scholar] [CrossRef]
  44. Mcbain, H.; Caulfield, B. Examining the role of the built environment on cycle commuting: A study of Dublin. Transp. Res. Part D Transp. Environ. 2018, 65, 282–290. [Google Scholar]
  45. Sousa, L.C.; Silva, C.A.; Sanches, S.P. Evaluation of bicycle infrastructure in hilly urban areas: A case study in Lisbon. Transp. Res. Part A Policy Pract. 2018, 114, 137–150. [Google Scholar]
  46. Matias, F.; Neto, A.; Tavares, J.P. Cycling uphill: How slope and design affect bicycle users’ comfort. Transp. Policy 2020, 92, 108–115. [Google Scholar]
  47. Furth, P.G.; Mekuria, M.C.; Nixon, H. Level of Traffic Stress: Conceptual Basis for Cycling Infrastructure Design. Transp. Res. Rec. 2023, 2677, 635–648. [Google Scholar]
  48. Jung, H.Y.; Jung, J. Influence of pedestrian environment and topography on route choice. Int. J. Sustain. Transp. 2023, 17, 457–470. [Google Scholar]
  49. Aravind, D.; Kiran, K.; Rao, P. Public Transport Accessibility and Spatial Equity in Metropolitan India. Transp. Res. Procedia 2024, 78, 235–243. [Google Scholar]
  50. Jin, J.G.; Teo, K.M.; Odoni, A.R. Optimizing bus bridging services in response to disruptions of urban transit rail networks. Transp. Sci. 2016, 50, 790–804. [Google Scholar] [CrossRef]
  51. Wang, N.; Wu, M.; Yuen, K.F. A Novel Method to Assess Urban Multimodal Transportation System Resilience Considering Passenger Demand and Infrastructure Supply. Reliab. Eng. Syst. Saf. 2023, 238, 109478. [Google Scholar] [CrossRef]
  52. Fernandes, A.D.; Oliveira, A.V.; Lima, S.D. Public Transport Vulnerability to Energy Crises in Brazil. Energy Policy 2019, 132, 991–1003. [Google Scholar]
  53. Liu, L.; Zhang, X.; Yu, H. How travel time to transit affects perceived resilience: A multi-city analysis. Transp. Policy 2024, 138, 103642. [Google Scholar]
  54. Wang, N.; Wu, M.; Yuen, K.F. How digitalization and supply chain resilience shape green logistics performance: An empirical study in China. Transp. Res. Part D Transp. Environ. 2023, 121, 103760. [Google Scholar]
  55. Sriprateep, K. Multi-Objective Optimization of Resilient, Sustainable, and Safe Urban Bus Routes for Tourism Promotion Using a Hybrid Reinforcement Learning Algorithm. Mathematics 2024, 12, 2283. [Google Scholar] [CrossRef]
  56. Wu, S.S.; Zhuang, Y.; Chen, J.; Wang, W.; Bai, Y.; Lo, S.M. Rethinking bus-to-metro accessibility in new town development: Case studies in Shanghai. Cities 2019, 94, 211–224. [Google Scholar] [CrossRef]
  57. Chuang, I.T.; Beattie, L.; Feng, L. Analysing the Relationship between Proximity to Transit Stations and Local Living Patterns: A Study of Human Mobility within a 15 Min Walking Distance through Mobile Location Data. Urban Sci. 2023, 7, 105. [Google Scholar] [CrossRef]
  58. Mageto, J.; Twinomurinzi, H.; Luke, R.; Mhlongo, S.; Bwalya, K.; Bvuma, S. Building resilience into smart mobility for urban cities: An emerging economy perspective. Int. J. Prod. Res. 2024, 62, 5556–5573. [Google Scholar] [CrossRef]
  59. Pereira, R.H.M.; Banister, D.; Schwanen, T.; Wessel, N. Distributional effects of transport policies on inequalities in access to opportunities in Rio de Janeiro. J. Transp. Land Use 2019, 12, 741–764. [Google Scholar] [CrossRef]
  60. Bokhari, A.; Sharifi, F. Simultaneous Inequity of Elderly Residents in Melbourne Metropolitan. Sustainability 2023, 15, 2189. [Google Scholar] [CrossRef]
  61. Cui, J.; Loo, B.P.Y.; Lin, D. Travel Behaviour and Mobility Needs of Older Adults in an Ageing and Car-Dependent Society. Int. J. Urban Sci. 2017, 21, 109–128. [Google Scholar] [CrossRef]
  62. Liu, Y.; Wang, X.; Song, C.; Chen, J.; Shu, H.; Wu, M.; Guo, S.; Huang, Q.; Pei, T. Quantifying human mobility resilience to the COVID-19 pandemic: A case study of Beijing, China. Sustain. Cities Soc. 2023, 89, 104314. [Google Scholar] [CrossRef]
  63. Zhang, T.; Niu, C.; Nair, D.J.; Dixit, V.; Waller, S.T. Equity Analysis and Improvement in Transportation Resilience Optimisation at the Pre-Event Stage. Transp. Res. D Transp. Environ. 2023, 122, 103892. [Google Scholar] [CrossRef]
  64. Cinderby, S.; Haq, G.; Opiyo, R.; Muhoza, C.; Ngabirano, A.; Wasike, Y.; Mwamba, D.; Cambridge, H. Inclusive climate resilient transport challenges in Africa. Cities 2024, 146, 104740. [Google Scholar] [CrossRef]
  65. Shi, K.; Yang, Y.; De Vos, J.; Zhang, X.; Witlox, F. Income and commute satisfaction: On the mediating roles of transport poverty and health conditions. Travel Behav. Soc. 2022, 29, 297–307. [Google Scholar] [CrossRef]
  66. Aivinhenyo, I.; Zuidgeest, M. Transport equity in low-income societies: Affordability impact on destination accessibility measures. Meas. Transp. Equity 2019, 111–128. [Google Scholar] [CrossRef]
  67. Instituto Brasileiro de Geografia e Estatística. Statistical yearbook of Brazil 2023. Instituto Brasileiro de Geografia e Estatística: Rio de Janeiro, Brazil, 2023. Available online: https://anuario.ibge.gov.br/2023.html (accessed on 12 May 2025).
  68. Organisation for Economic Co-Operation and Development. Handbook on Constructing Composite Indicators: Methodology and User Guide; OECD Publishing: Paris, France, 2008. [Google Scholar] [CrossRef]
  69. Saisana, M.; Tarantola, S. State-of-the-Art Report on Current Methodologies and Practices for Composite Indicator Development (EUR 20408 EN). Eu-ropean Commission, Joint Research Centre: Ispra, Italy, 2002. Available online: https://composite-indicators.jrc.ec.europa.eu/uploads/SAISANA%20TARANTOLA%202002%20State-of-the-art%20Report.pdf (accessed on 12 May 2025).
  70. Saaty, T.L. The Analytic Hierarchy Process: Planning, Priority Setting, Resource Allocation, 2nd ed.; RWS Publications: Pittsburgh, PA, USA, 1990. [Google Scholar]
  71. Jolliffe, I.T. Principal Component Analysis, 2nd ed.; Springer: New York, NY, USA, 2002. [Google Scholar] [CrossRef]
  72. Abdi, H.; Williams, L.J. Principal component analysis. Wiley Interdiscip. Rev. Comput. Stat. 2010, 2, 433–459. [Google Scholar] [CrossRef]
  73. Liu, C.; Tapani, A.; Kristoffersson, I.; Rydergren, C.; Jonsson, D. Appraisal of cycling infrastructure investments using a transport model with focus on cycling. Case Stud. Transp. Policy 2021, 9, 125–136. [Google Scholar] [CrossRef]
  74. Meng, L. Political economy and cycling infrastructure investment. Transp. Res. Interdiscip. Perspect. 2022, 14, 100618. [Google Scholar] [CrossRef]
  75. World Health Organization. Health Economic Assessment Tool (HEAT) for Walking and for Cycling; World Health Organization Regional Office for Europe: Copenhagen, Denmark, 2018; Available online: https://www.who.int/europe/tools-and-toolkits/health-economic-assessment-tool-for-walking-and-cycling (accessed on 12 May 2025).
  76. Prefeitura do Município de São Paulo. Plano de Mobilidade Urbana de São Paulo (PlanMob/SP) [Urban mobility plan of São Paulo]. Prefeitura do Município de São Paulo: São Paulo, Brazil, 2016. Available online: https://www.prefeitura.sp.gov.br/cidade/secretarias/upload/chamadas/planmobsp_v072__1455546429.pdf (accessed on 12 May 2025).
  77. Albatayneh, A.; Alzyadat, A.; Assaf, M.; Al Nsour, A.; Jaradat, M. Modelling the influence of key user perceptions on shared mobility acceptance in Jordan using SEM. Urban Sci. 2024, 8, 56. [Google Scholar] [CrossRef]
  78. Ros-McDonnell, L.; Marquet, O.; Miralles-Guasch, C. Measuring urban resilience through walkability: An index applied in seven Mediterranean cities. Urban Sci. 2024, 8, 9. [Google Scholar]
Figure 1. Flowchart of urban mobility resilience under fossil fuel scarcity. The colored boxes indicate different inference blocks (IBs), while arrows show functional relationships among indicators.
Urbansci 09 00269 g001
Figure 2. Internal consistency assessment of the model variables.
Urbansci 09 00269 g002
Figure 3. Scree plot of principal component analysis (PCA) applied to the original variables of the urban resilience index.
Urbansci 09 00269 g003
Figure 4. Urban resilience map of the municipality of Petrópolis.
Urbansci 09 00269 g004
Figure 5. Boxplot of maximized and minimized blocks with means highlighted.
Urbansci 09 00269 g005
Figure 6. The map displays the normalized IB-11 values using a continuous color gradient (0 to 1). The classification represents relative performance gradients among neighborhoods and does not imply any normative threshold or absolute resilience categorization.
Urbansci 09 00269 g006
Figure 7. Comparison of the IB-11 indicator with and without weighting (AHP vs. Equal Weights).
Urbansci 09 00269 g007
Figure 8. Absolute difference between the values of the inference blocks.
Urbansci 09 00269 g008
Figure 9. Relative contribution of the variables to the composition of the urban resilience index (IB- 11), considering the hierarchical weights and the normalization of the coefficients after multicriteria aggregation.
Urbansci 09 00269 g009
Table 1. Data sources for each variable.
VariableData Source
Walking time to the terminalGoogle Maps
Bicycle travel time to the terminalGoogle Maps
Terrain slope (topography) Obtained via GIS environment
Pedestrian accessField Survey Responses
Predisposition to cyclingField Survey Responses
Bus access time to the terminalGoogle Maps and Moovit
Bus accessField Survey Responses
Access by other motorized modesField Survey Responses
Population residing within a 5 min walking radius1 IBGE [67] and geospatial maps
Percentage of elderly population1 IBGE [67]
Average monthly income1 IBGE [67]
Note 1: IBGE refers to the Brazilian Institute of Geography and Statistics.
Table 2. Values and justification of the weights used in the AHP method.
Assigned ValueJudgment Interpretation
1Variables equally important
3Moderate importance of one variable over another
5Strong importance of one variable over another
7Very strong (or demonstrated) importance
9Absolute (extreme) importance
2, 4, 6, 8Intermediate values used for intermediate judgments
Table 3. Weights assigned to variables and blocks.
BlockComponents/Sub-VariablesImportance (α-β)
IB-1 Pedestrian Access EaseWalking Time to Terminal0.75
Slope0.25
IB-2 Bicycle Access EaseBicycle Travel Time to Terminal0.75
Slope0.25
IB-3 Active Transport × AccessibilityIB-1 Pedestrian Access Ease0.5
IB-2 Bicycle Access Ease0.5
IB-4 Active Transport × MobilityPedestrian Access0.75
Predisposition to Cycling0.25
IB-5 Active Transport FactorIB-3 Active Transport × Accessibility0.75
IB-4 Active Transport × Mobility0.25
IB-6 Mobility IndicatorBus Access0.75
Access by Other Motorized Modes0.25
IB-7 Fossil Fuel DependencyIB-6 Mobility Indicator0.5
Bus Access Time to Terminal0.5
IB-8 Social Mobility ConstraintsPercentage of Elderly Population0.75
Average Monthly Income0.25
IB-10 Socioeconomic FactorIB-8 Social Mobility Constraints0.5
Population Residing (5 min walking radius)0.5
IB-9 Transport IndicatorIB-5 Active Transport Factor0.5
IB-6 Mobility Indicator0.25
IB-7 Fossil Fuel Dependency0.25
IB-11 Urban ResilienceIB-9 Transport Indicator0.833
IB-10 Socioeconomic Factor0.167
Table 4. Factor loadings of the first two principal components obtained from the PCA applied to the original variables of the urban resilience index.
VariableCP1CP2
Walking Time to Terminal0.449−0.147
Bicycle Travel Time to Terminal0.420−0.267
Slope0.250−0.093
Pedestrian Access0.2640.462
Predisposition to Cycling0.2890.444
Bus Access0.2820.477
Access by Other Motorized Modes−0.1090.431
Percentage of Elderly Population−0.3900.134
Average Monthly Income0.0710.042
Bus Access Time to Terminal0.279−0.211
Population Residing Within a 5-Minute Walking Radius0.281−0.101
Table 5. Comparative data between the studies of [77] Albatayneh et al. and the present research.
AspectPetrópolis (IB-11)[77]
Type of Data Main TechniquePublic secondary and georeferenced data AHP + PCA + Gaussian normalization + spatial analysisPrimary data via a survey on ridesharing usage perception
SEM (Structural Equation Modeling) with latent constructs
Technical Requirements Dependence on Local Context Spreadsheets and standard statistical software (Python 3.10.12 (Colab)), Excel Microsoft 365 (version 2405), R 4.3.3)
Low: the model can be adapted to other cities with public data
Advanced knowledge in SEM, using AMOS or SmartPLS
High: depends on social perception, habits, and local acceptability
Methodological Transparency ReplicabilityHigh: formulas, weights, and conceptual structure detailed in the text
High—easily applicable in other cities with minimal adjustments
High: well-structured SEM, but requires survey replication
Moderate—requires redesign of the survey and statistical validation of the model for each location
Table 6. Comparative data between the studies of [78] and the present research.
CriterionPetrópolis (IB-11)[78]
The type of mobility analyzedActive (walking and cycling), motorized, and energy-relatedExclusive focus on pedestrian mobility
Data collection methodSecondary and geospatial dataDirect in situ observation
Index range0 to 1 (IB-11)61.22 to 77.92 (Iw)
Slope treatment Critical results Statistical model applied Methodological transparencyDirect penalization in IB-1 and IB-2 blocks
IB-11 < 0.25 in areas with steep slopes and low income
PCA, collinearity analysis, quadrant, and sensitivity analysis
High—complete detailing of formulas, weights, groupings, and hierarchies
Slope not explicitly evaluated as a variable
Iw < 65 in zones with low pedestrian flow
No statistical model was applied
Low—absence of description of the Iw calculation formulas and internal index structure
Spatial application Replicability potential100% of the municipality’s neighborhoods
High—use of open data and normalized indices
7 specific urban zones in compact cities
Medium—requires field observation
Disclaimer/Publisher’s Note: The statements, opinions and data contained in all publications are solely those of the individual author(s) and contributor(s) and not of MDPI and/or the editor(s). MDPI and/or the editor(s) disclaim responsibility for any injury to people or property resulting from any ideas, methods, instructions or products referred to in the content.

