
The Concentrated City: Effects of AI-Generated Travel Advice on the Spatial Distribution of Tourists


Abstract
1. Introduction
2. Literature Review
2.1. Spatial Distribution and the Influence of Search Engines on Visitor Behavior
2.2. Tourism and the Emerging Role of ChatGPT
2.3. Strong and Weak Points of ChatGPT as a Travel Itinerary Planner
3. Methodology
3.1. Case Study
3.2. Extraction of Data from Instagram
3.3. Extraction of Data from ChatGPT
3.4. Data Processing
4. Findings
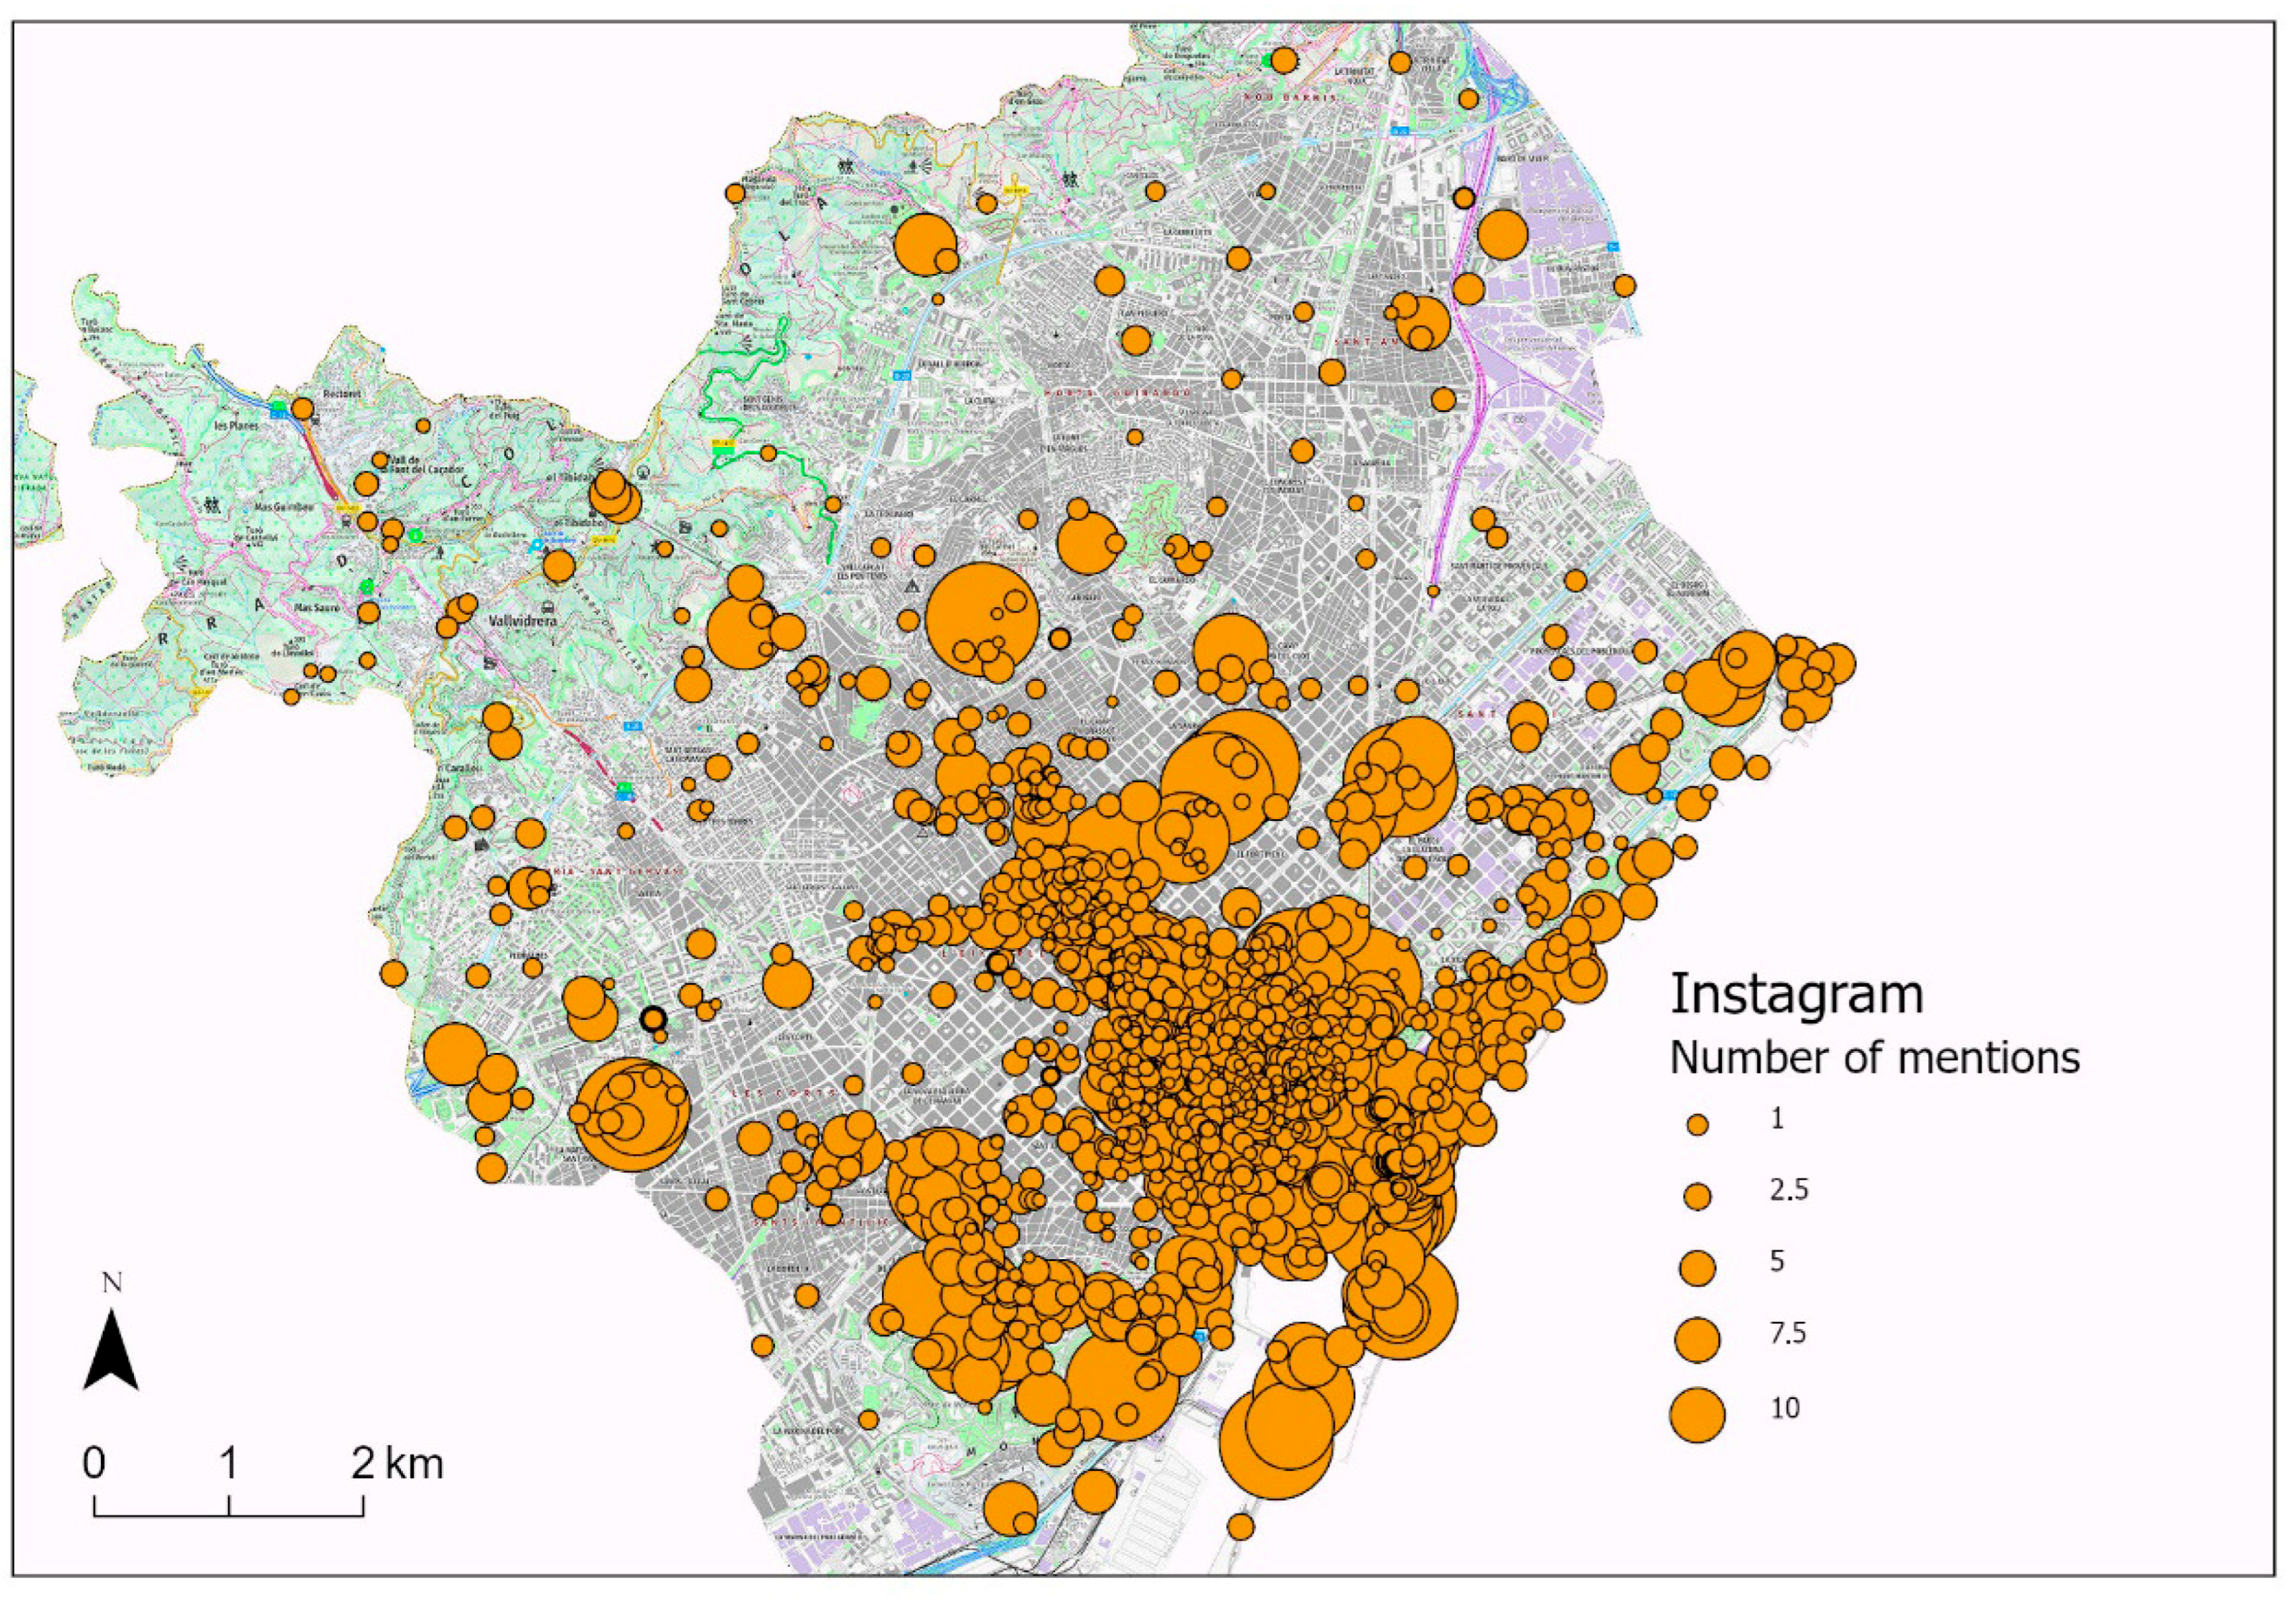
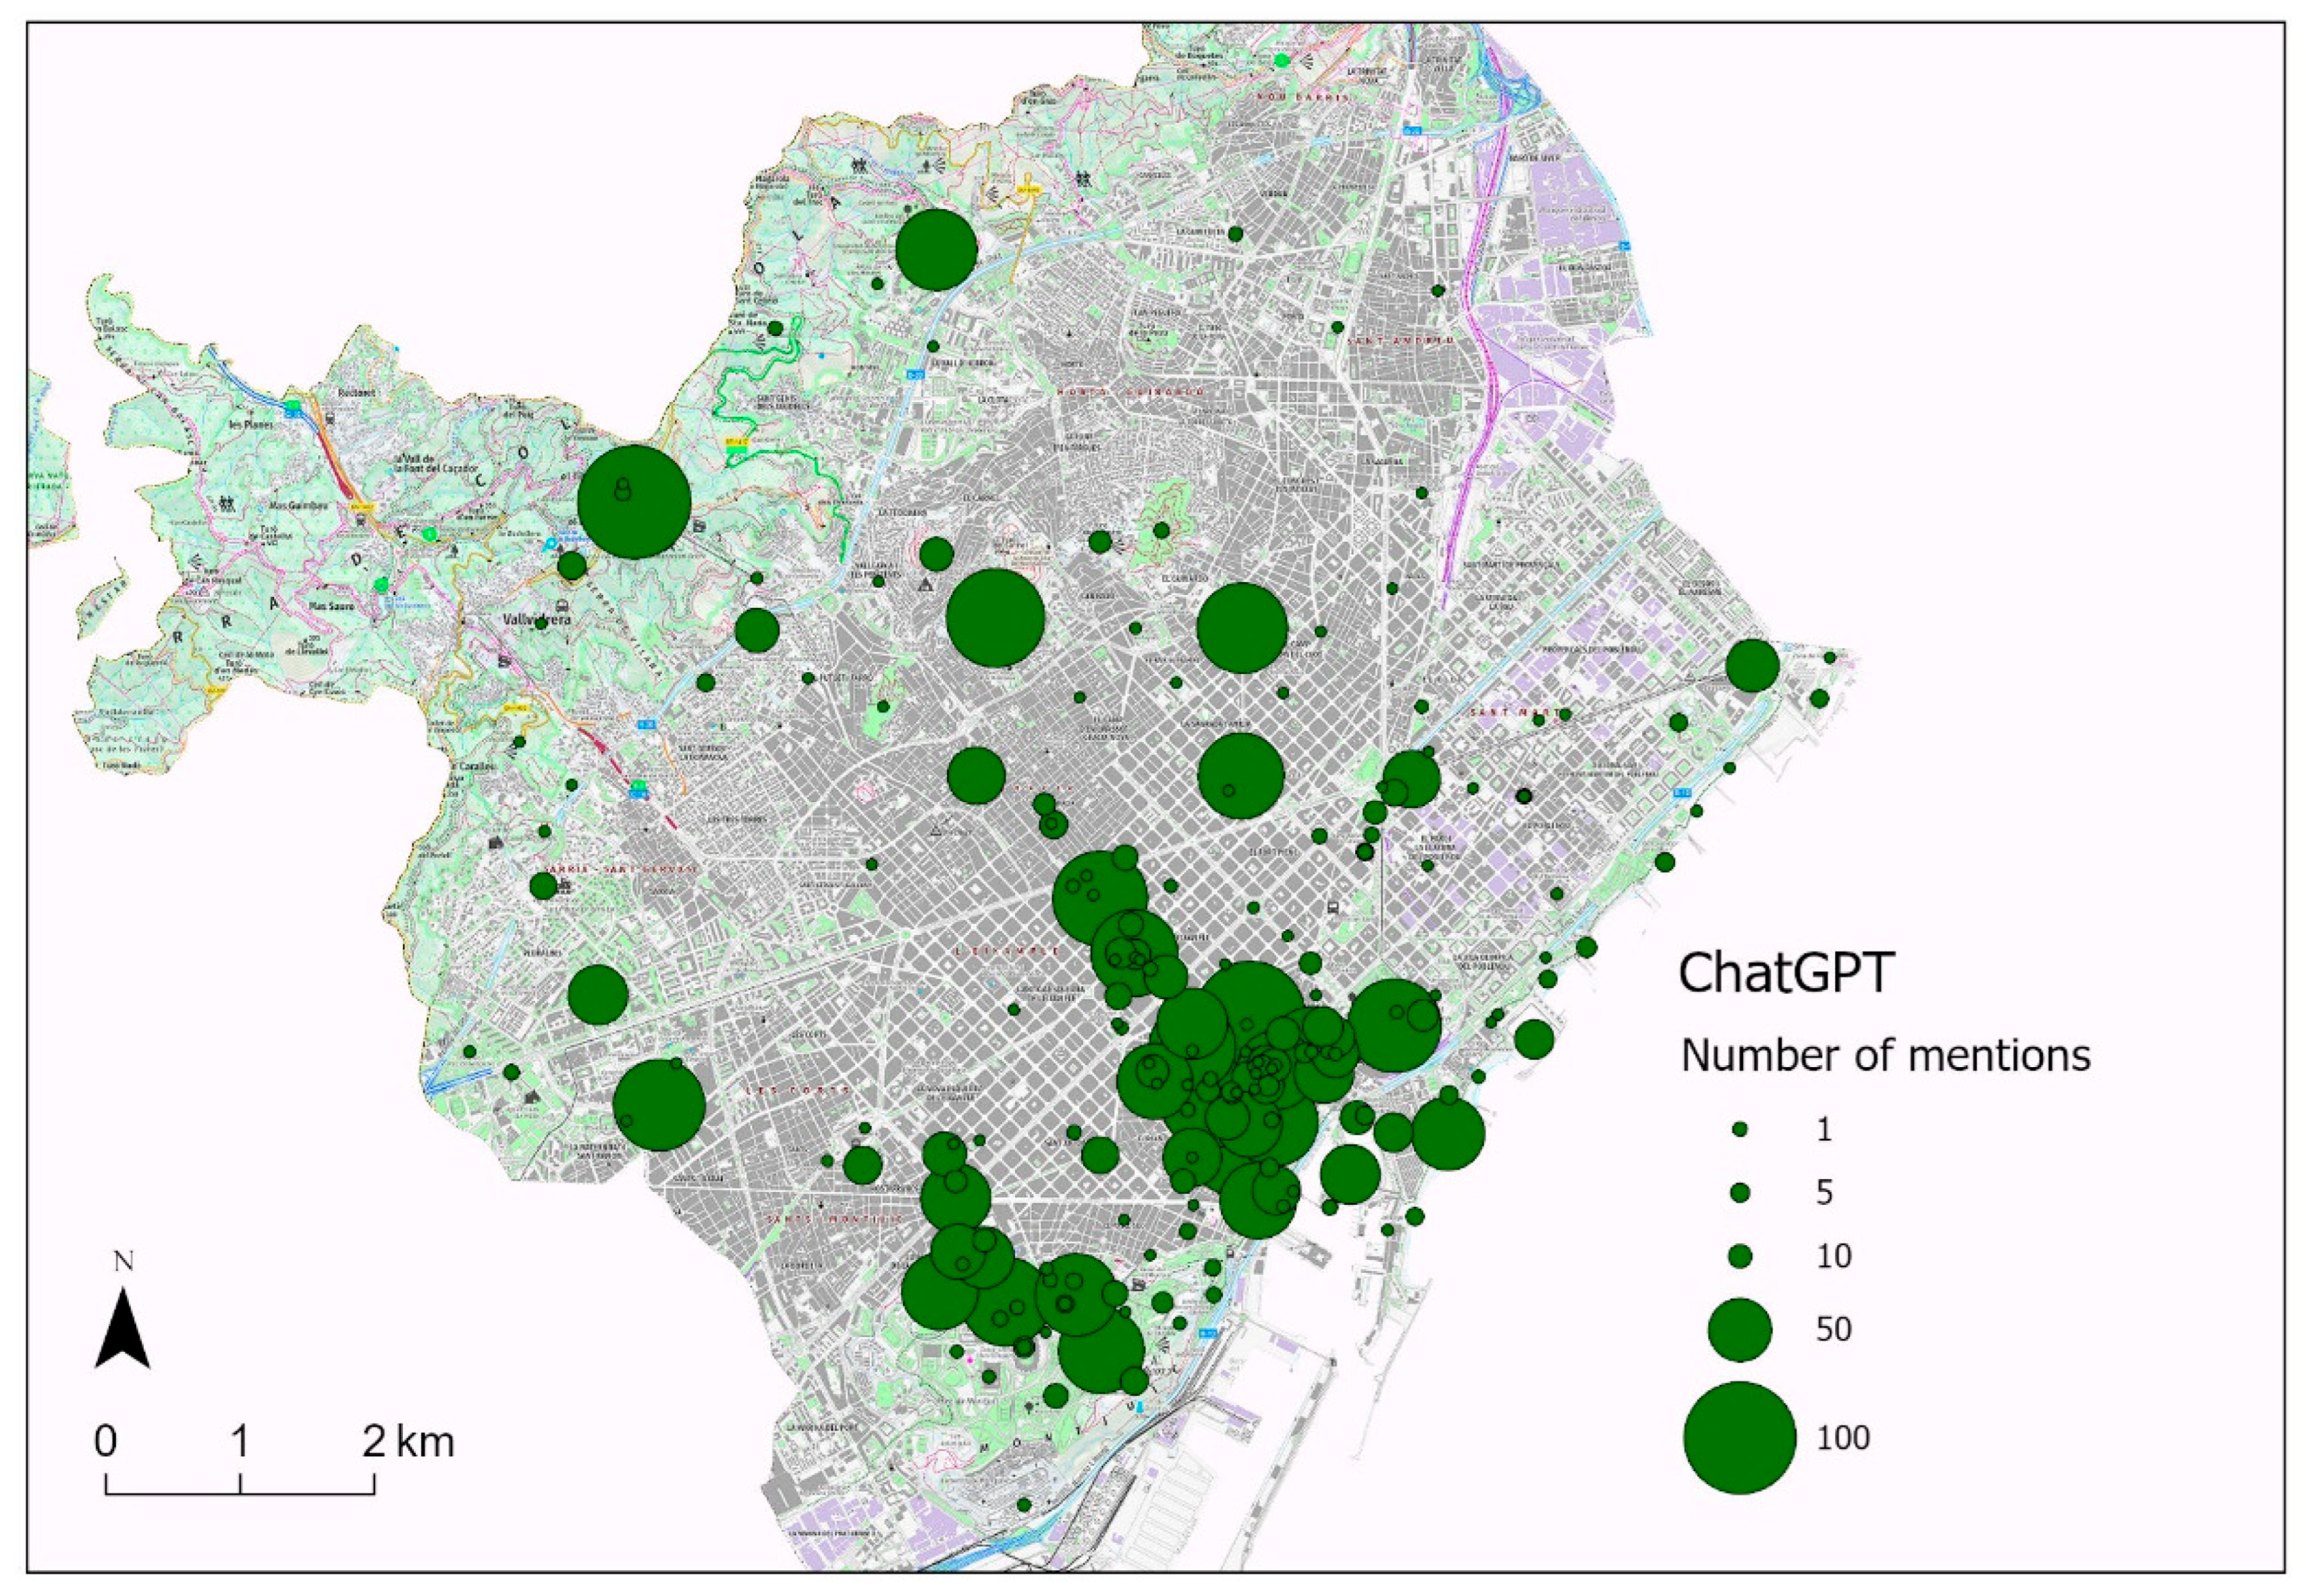
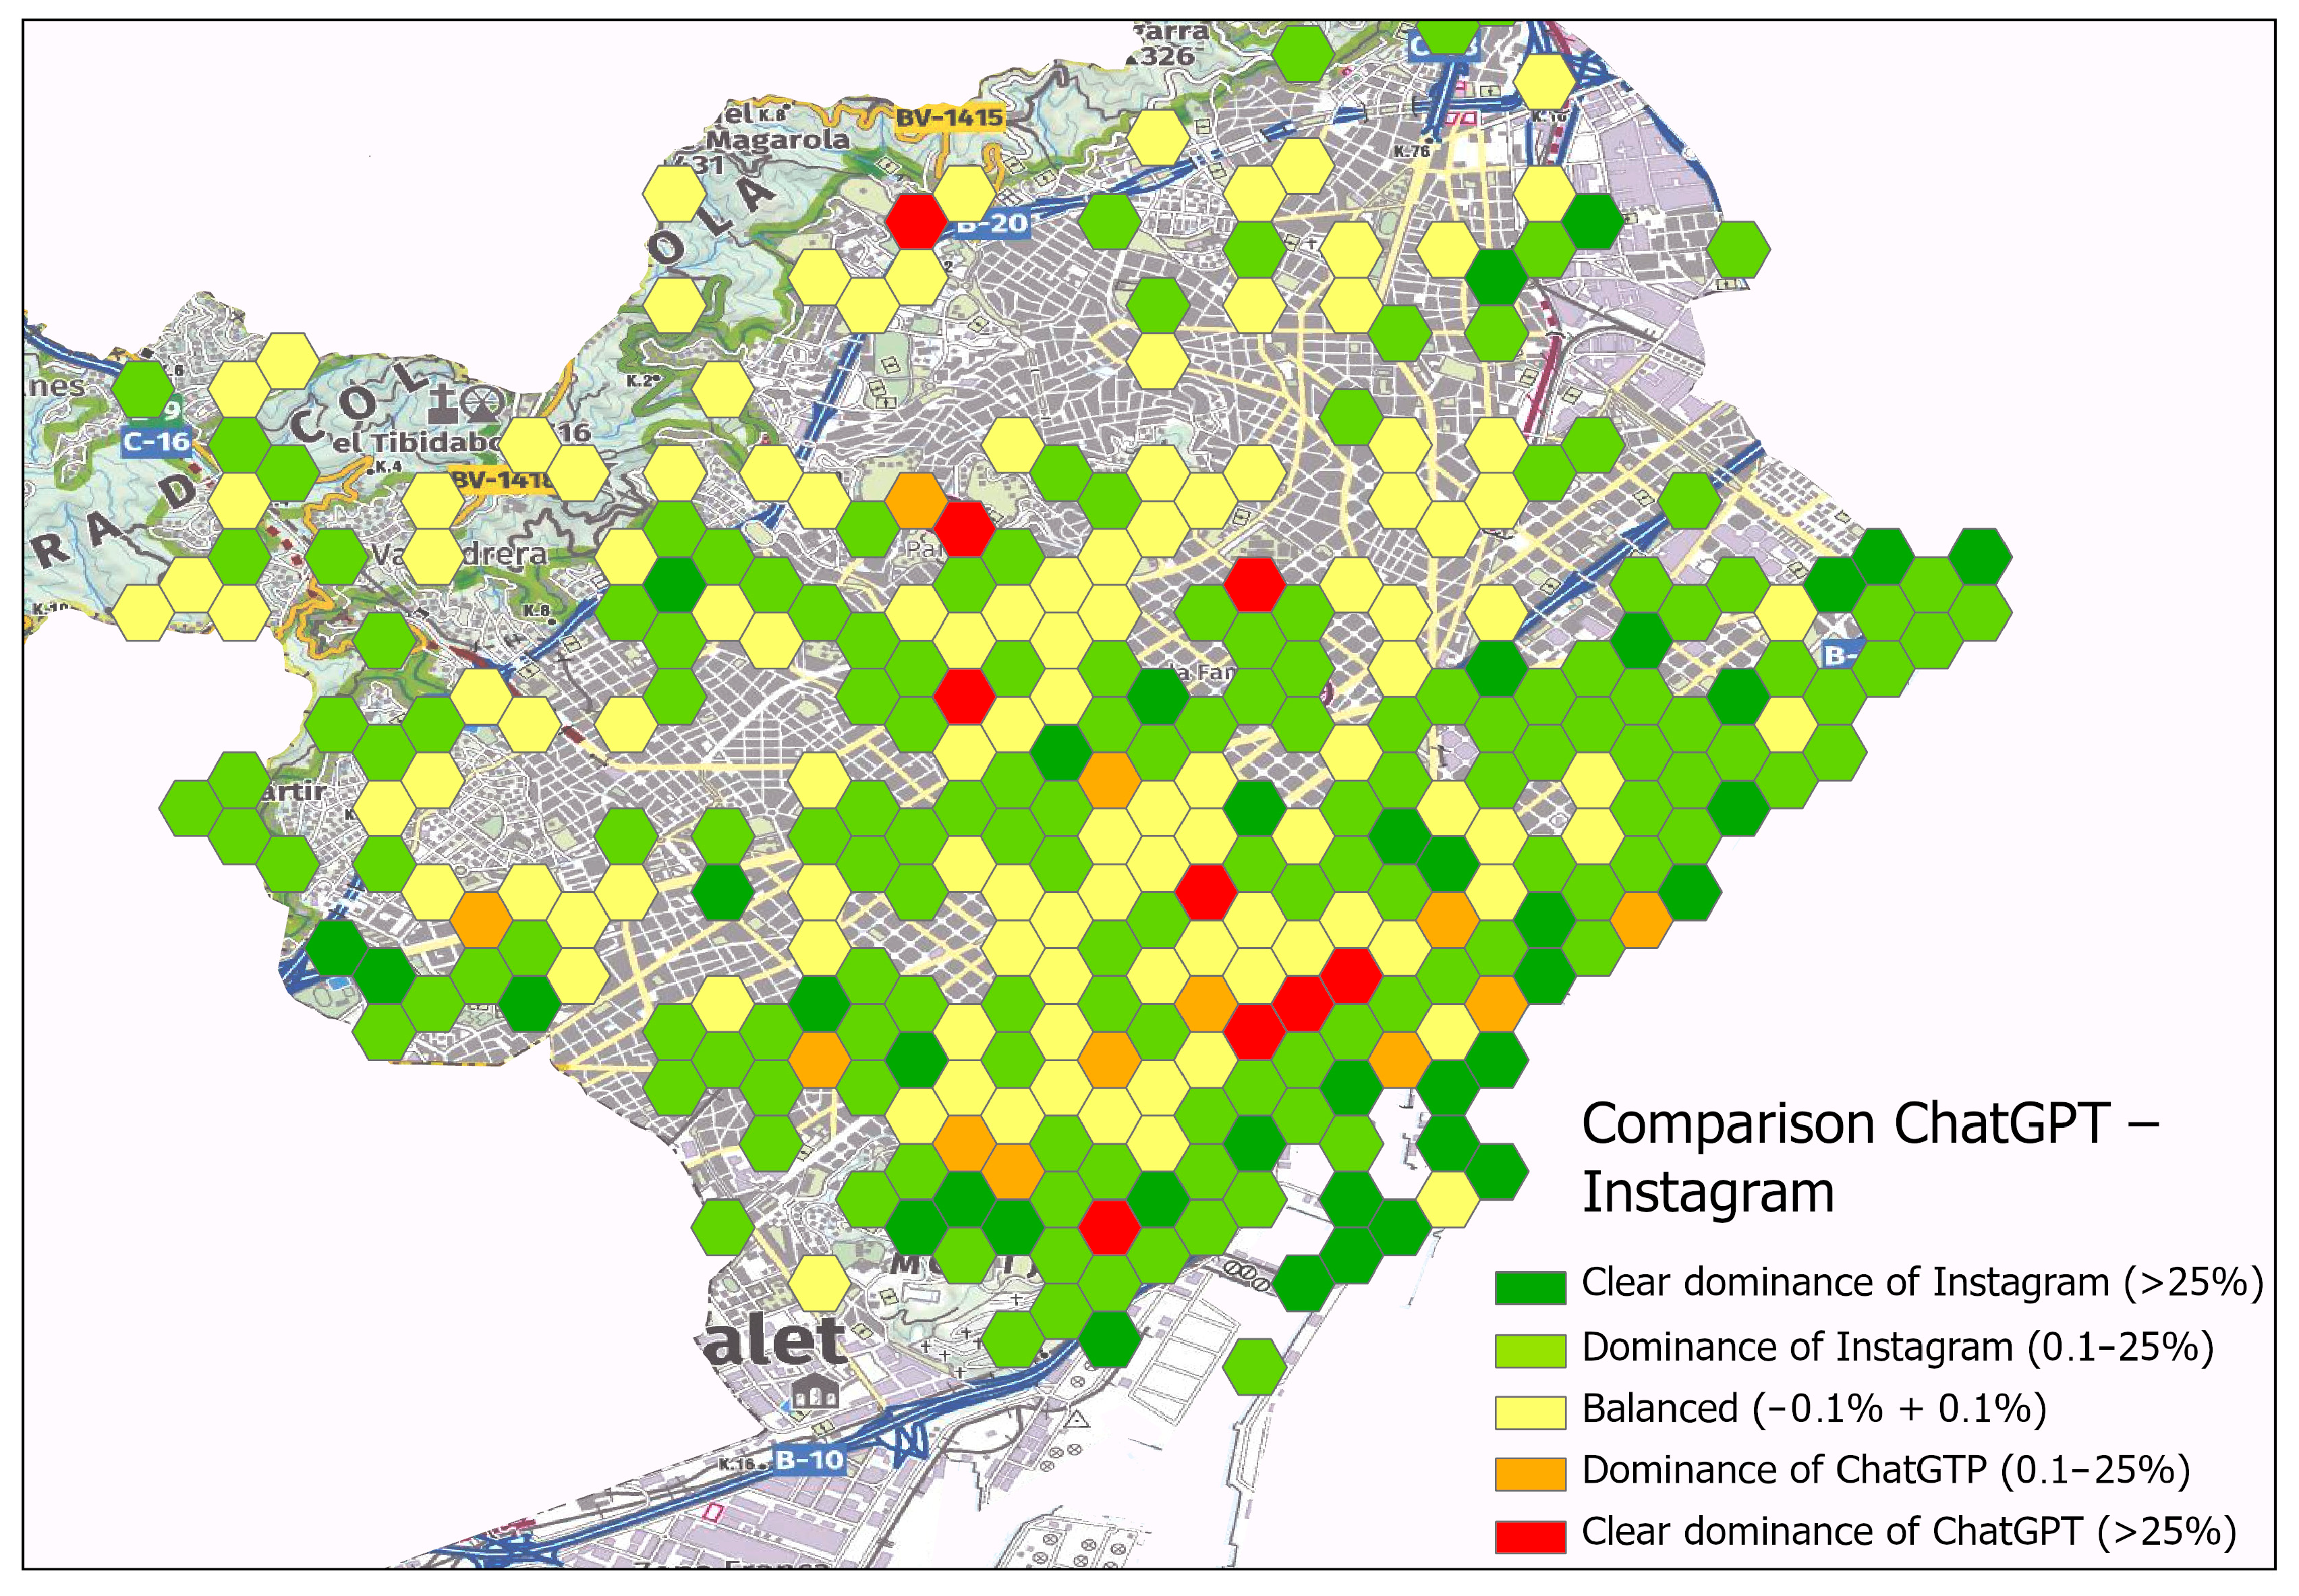
4.1. Image Location
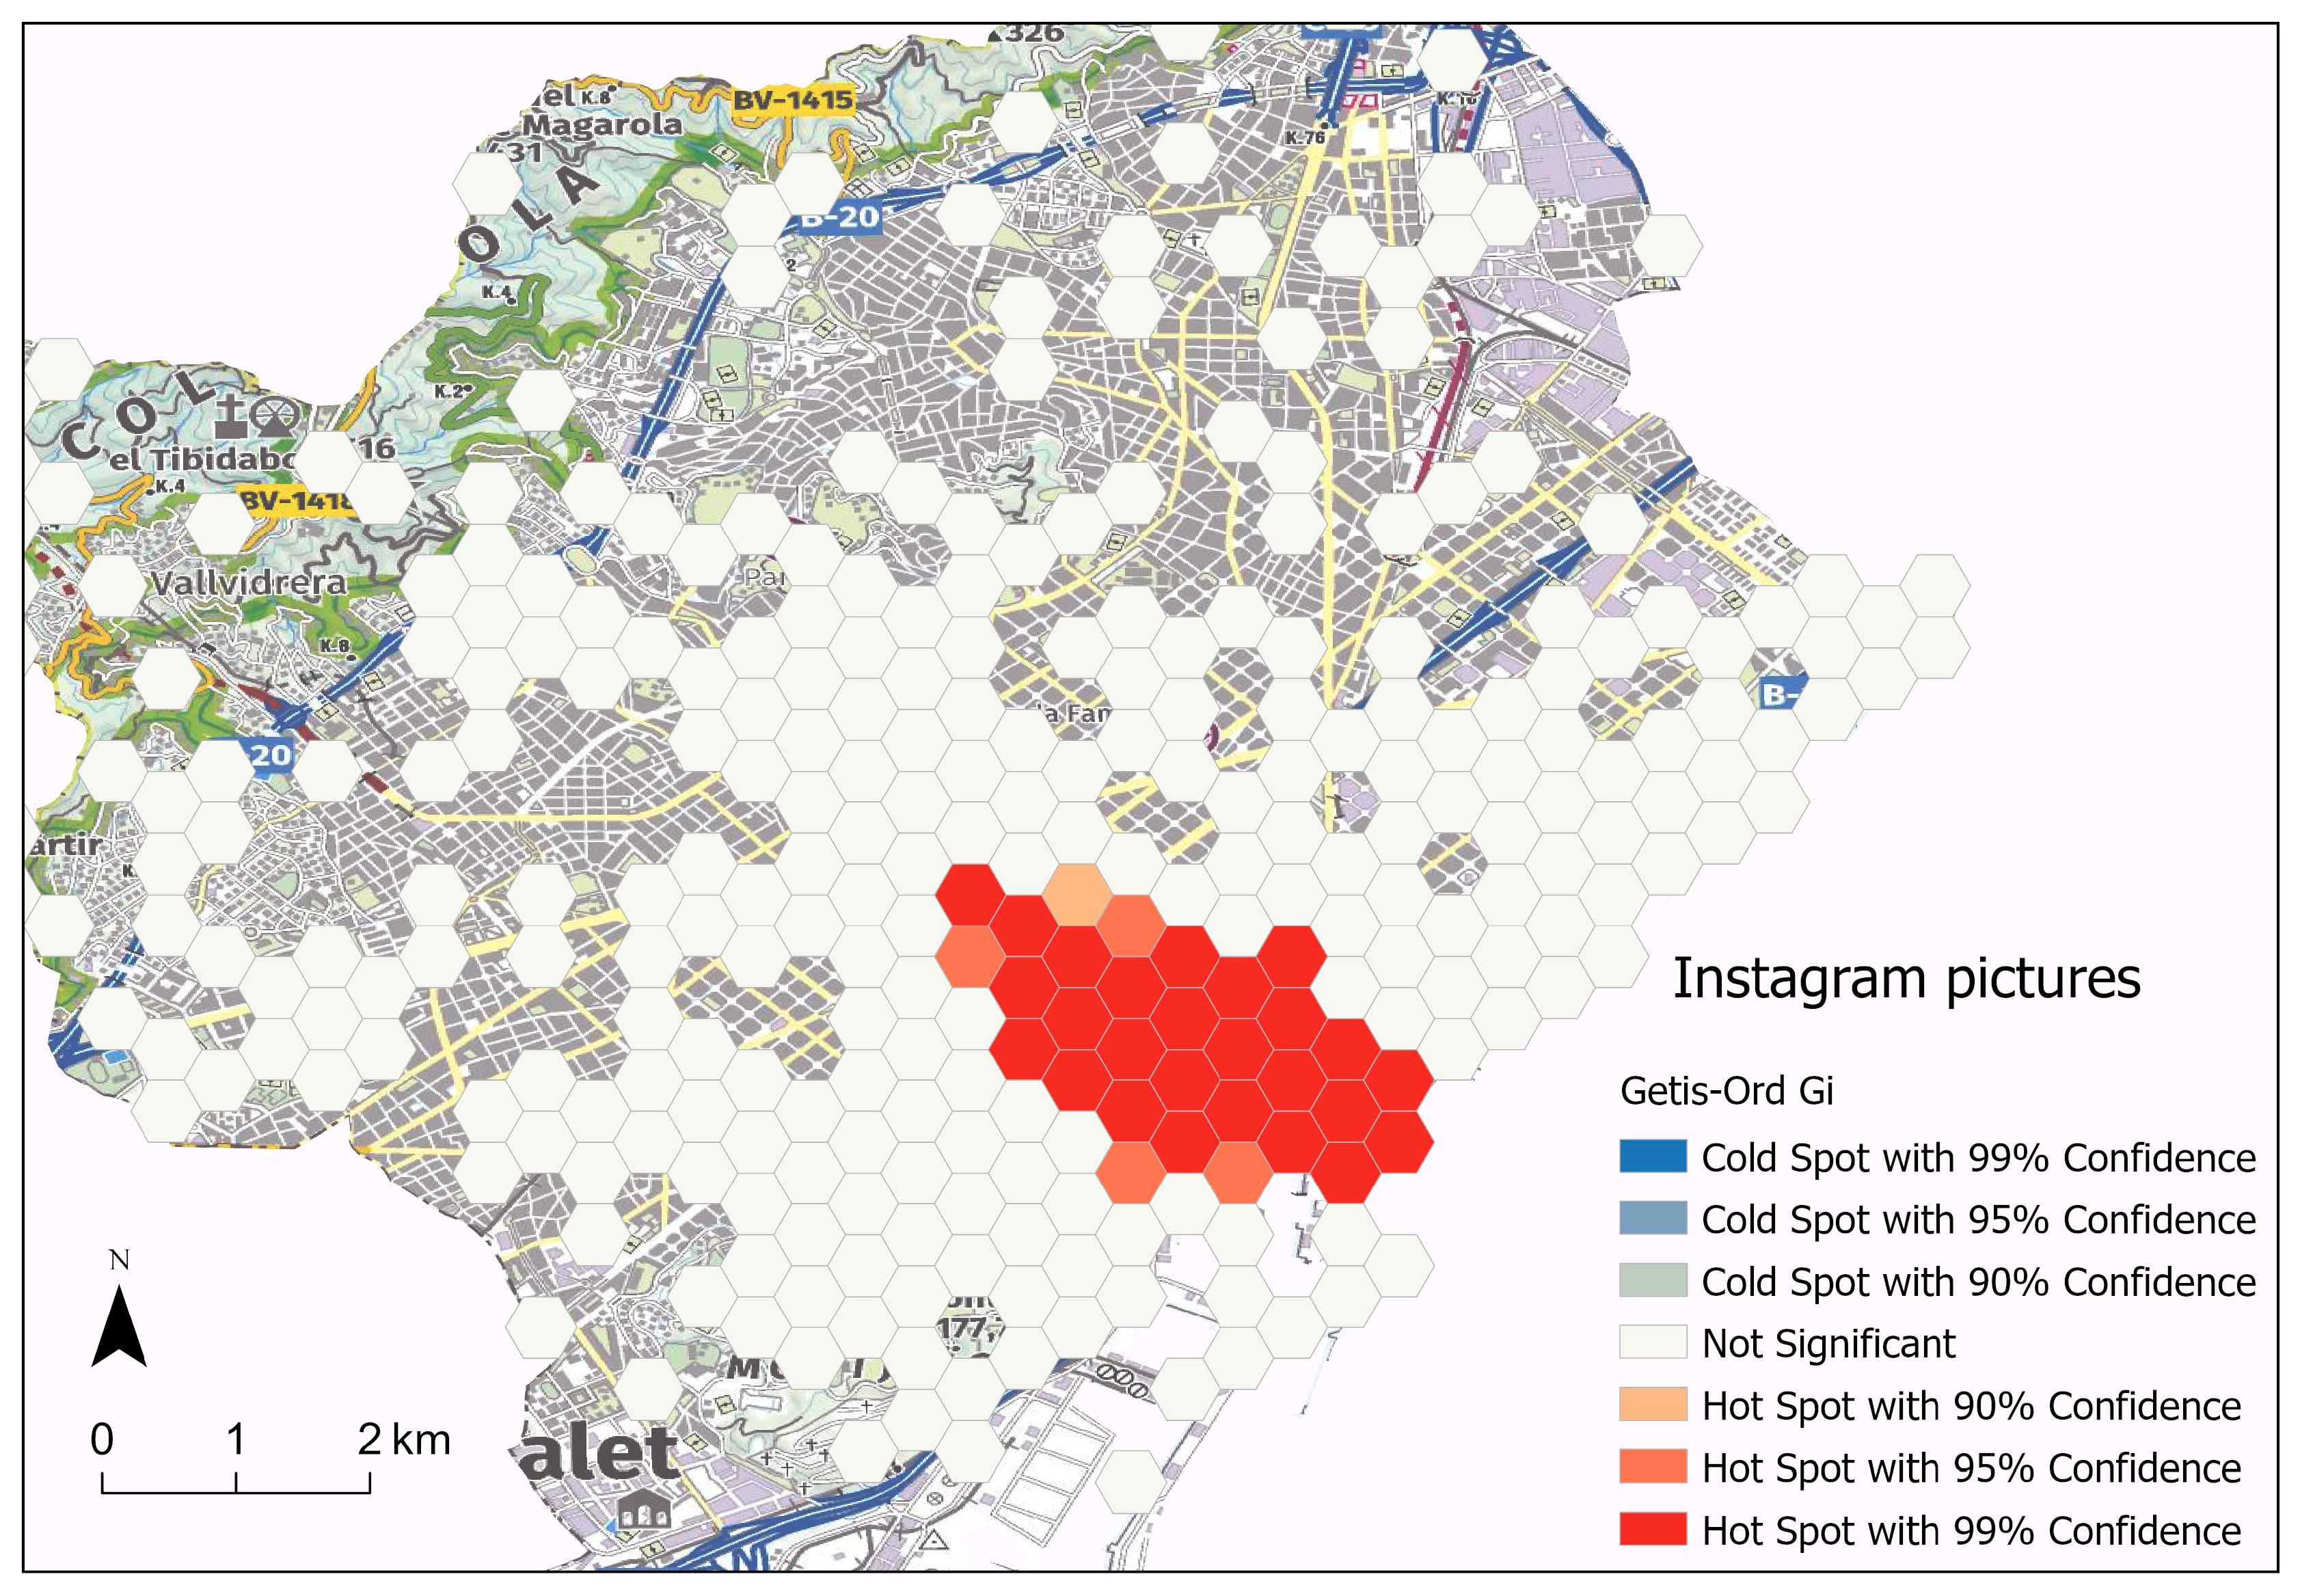
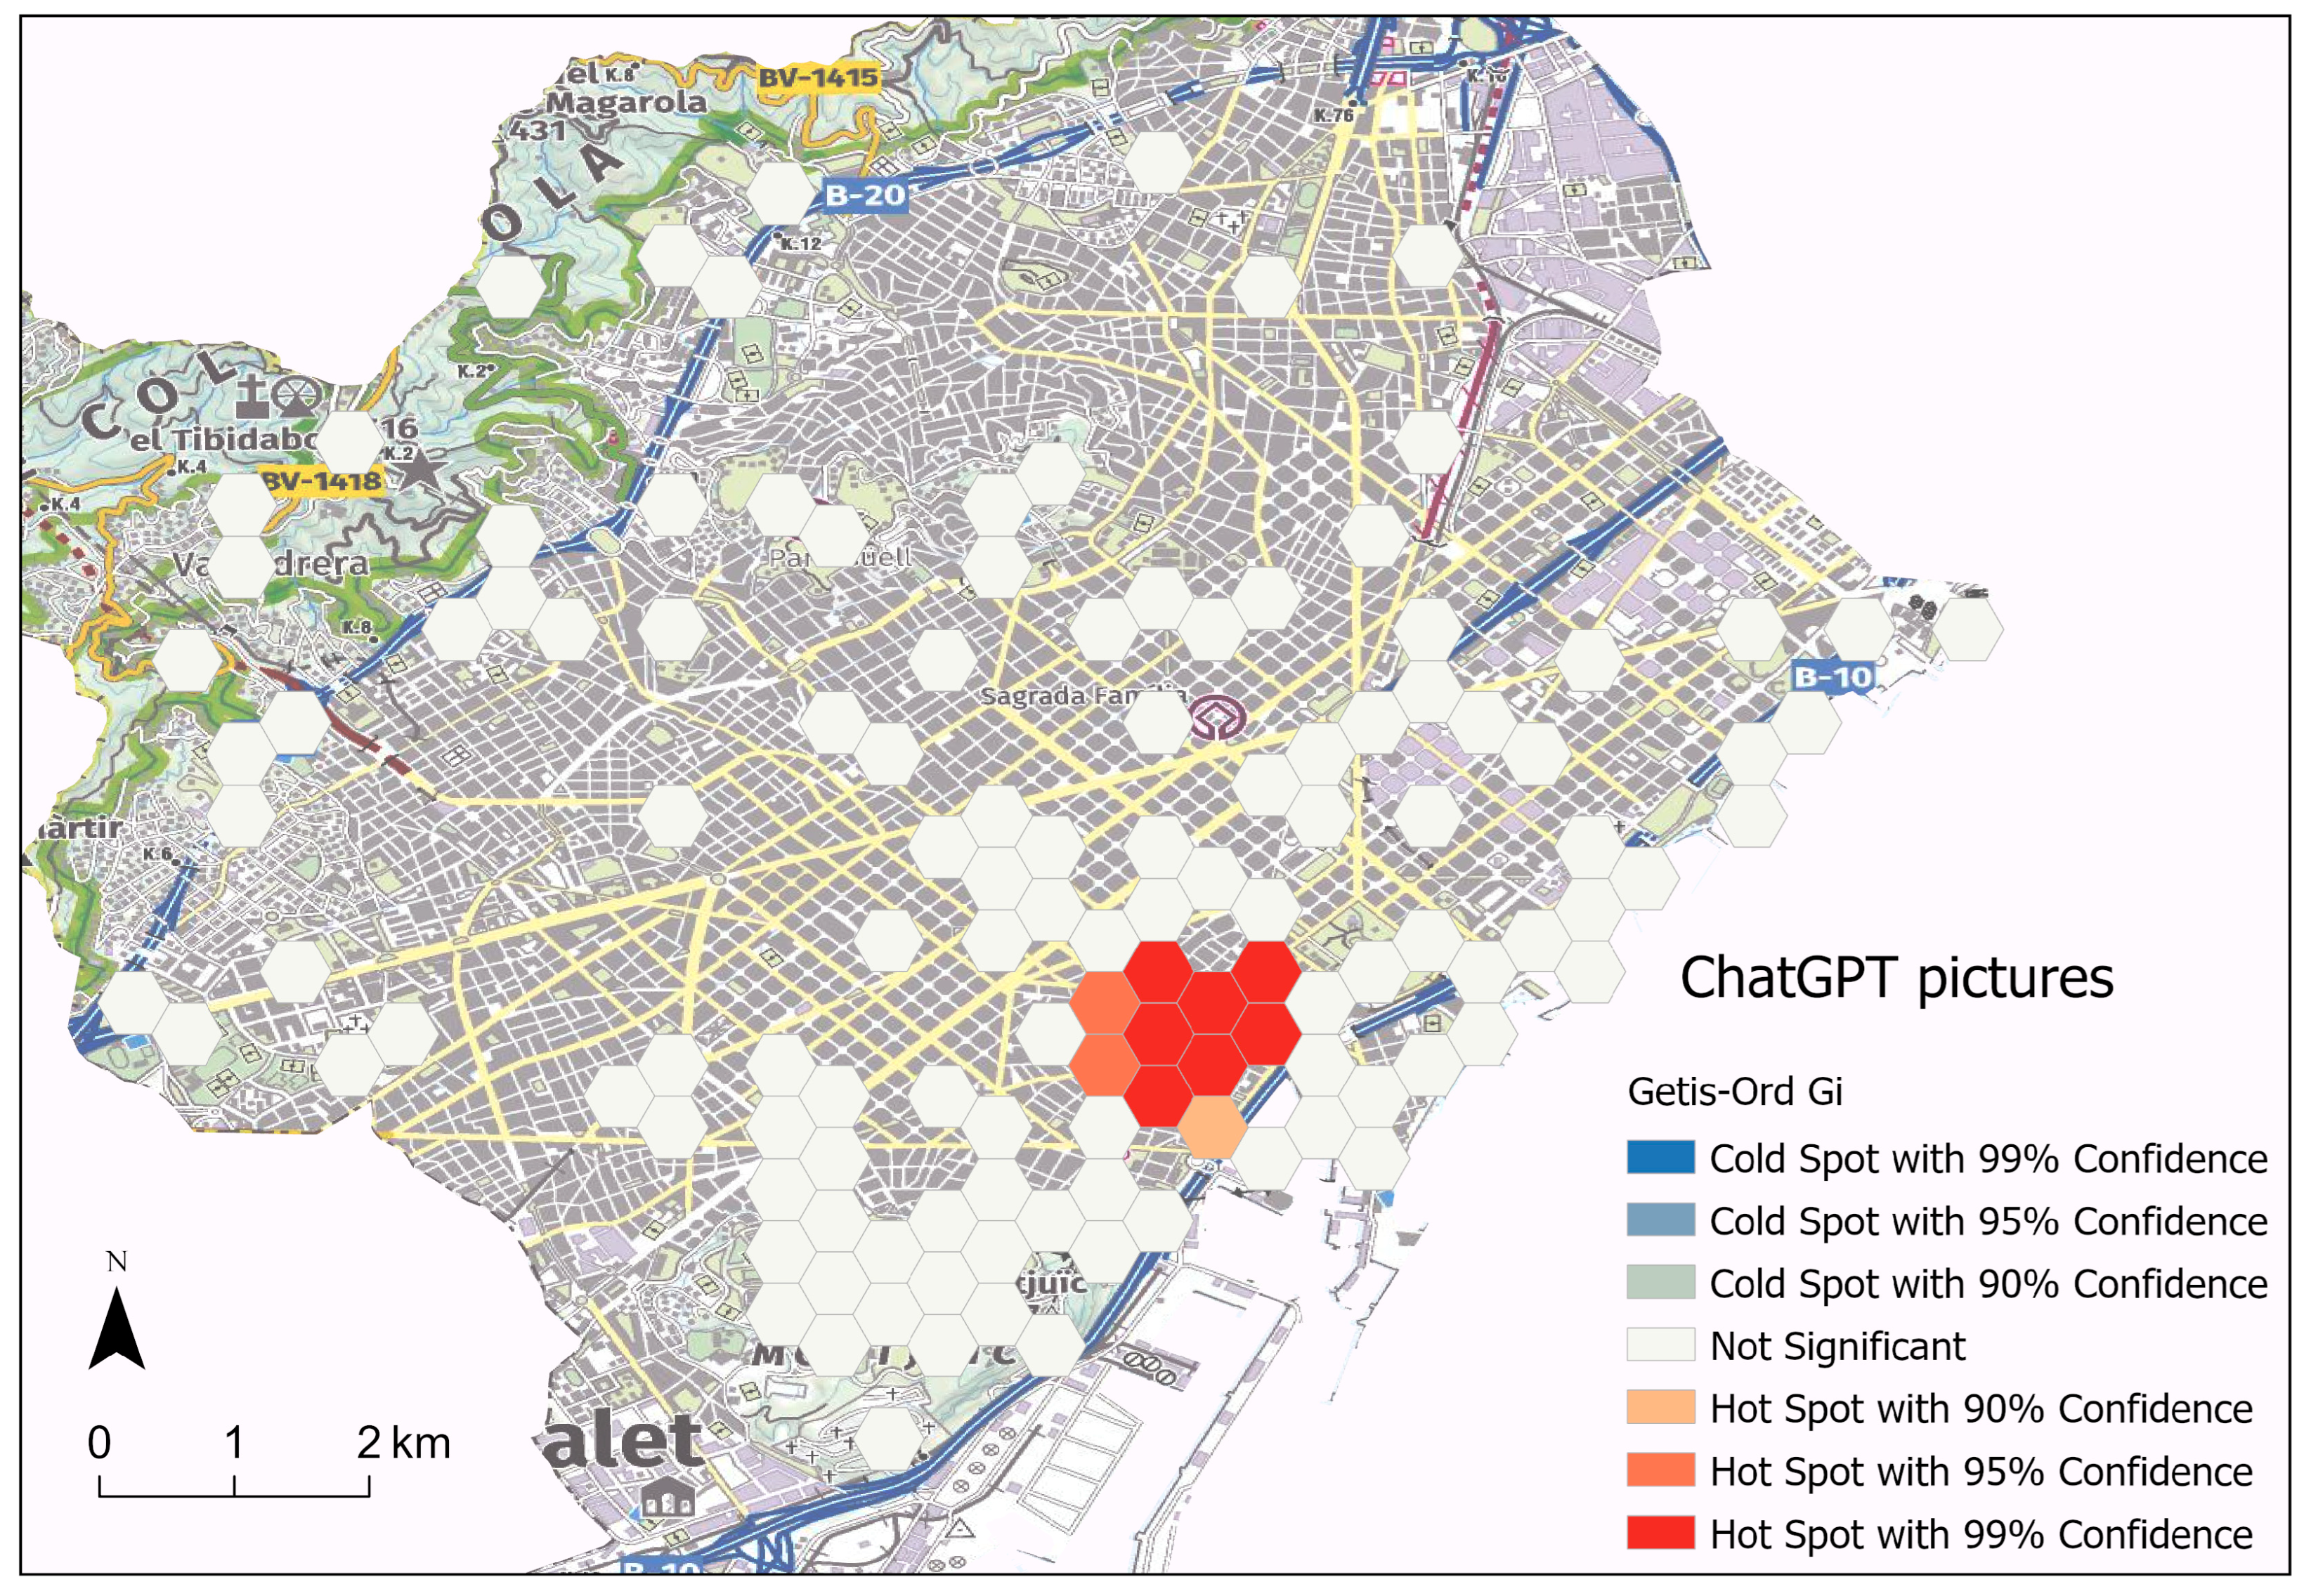
4.2. Clusters on the Getis-Ord Gi*
5. Discussion
6. Conclusions
Limitations
Funding
Data Availability Statement
Conflicts of Interest
References
- Phocuswire. More than One-Third of Leisure Travelers Have Used GenAI Tolos, Report Says. 2023. Available online: https://www.phocuswire.com/oliver-wyman-data-genai-travelers-attitude (accessed on 14 April 2024).
- Tosyali, H.; Tosyali, F.; Coban-Tosyali, E. Role of tourist-chatbot interaction on visit intention in tourism: The mediating role of destination image. Curr. Issues Tour. 2025, 28, 511–526. [Google Scholar] [CrossRef]
- Solomovich, L.; Abraham, V. Exploring the influence of ChatGPT on tourism behavior using the technology acceptance model. Tour. Rev. 2024; ahead-of-print. [Google Scholar] [CrossRef]
- Urry, J. The Tourist Gaze; Sage: London, UK, 1990. [Google Scholar]
- Masip, L.; Camprubí, R.; Coromina, L. El rol del turista como emisor y perceptor de imagen turística en Instagram. Rev. Investig. Tur. 2018, 17, 111–132. [Google Scholar]
- Demir, M.; Demir, Ş.Ş. Is ChatGPT the right technology for service individualization and value co-creation? evidence from the travel industry. J. Travel Tour. Mark. 2023, 40, 383–398. [Google Scholar] [CrossRef]
- Baloglu, S.; McCleary, K.W. A model of destination image formation. Ann. Tour. Res. 1999, 26, 868–897. [Google Scholar] [CrossRef]
- Yoon, Y.; Usal, M. An examination of the effects of motivation and satisfaction on destination loyalty: A structural model. Tour. Manag. 2005, 26, 45–56. [Google Scholar] [CrossRef]
- Hottola, P. Perceptions of the United States and the americans. The collage approach. Finisterra 2012, 47, 93. [Google Scholar]
- Stylianou-Lambert, T. Tourists with cameras: Reproducing or Producing? Ann. Tour. Res. 2012, 39, 1817–1838. [Google Scholar] [CrossRef]
- Galí Espelt, N.; Donaire, J.A. First-time versus repeat visitors’ behavior patterns: A GPS analysis. Boletín Asoc. Española Geogr. 2018, 78, 49–65. [Google Scholar] [CrossRef]
- Hochman, N.; Manovich, L. Zooming into an Instagram City: Reading the local through social media. First Monday 2013, 18, 7. [Google Scholar] [CrossRef]
- Matlovičová, K. The Triadic Nexus: Understanding the Interplay and Semantic Boundaries Between Place Identity, Place Image, and Place Reputation. Folia Geogr. 2024, 66, 69–102. [Google Scholar]
- Chen, Y.C.; Shang, R.A.; Li, M.J. The effects of perceived relevance of travel blogs’ content on the behavioral intention to visit a tourist destination. Comput. Hum. Behav. 2014, 30, 787–799. [Google Scholar] [CrossRef]
- Kim, J.H.; Kim, J.; Kim, S.; Hailu, T.B. Effects of AI ChatGPT on travelers’ travel decision-making. Tour. Rev. 2024, 79, 1038–1057. [Google Scholar] [CrossRef]
- Paül i Agustí, D.; dos Santos Costa, M. Una ciudad fotografiada: Comparando imagen cotidiana e imagen turística en Fortaleza (Brasil) a partir de Instagram. Bol. Asoc. Geogr. Esp. 2023, 96, 1–35. [Google Scholar] [CrossRef]
- Gao, S.; Hu, Y.; Li, W. (Eds.) Handbook of Geospatial Artificial Intelligence; CRC Press: Abigdon, VA, USA, 2023. [Google Scholar]
- Gartner, W.; Hunt, J.D. A method to collect detailed tourist flow information. Ann. Tour. Res. 1988, 15, 159–172. [Google Scholar] [CrossRef]
- Donaire, J.A.; Gali, N.; Royo-Vela, M. El uso de GPS para el análisis del comportamiento espacio-temporal de los turistas. Pre-test en el Valle de Boí. Cuad. Tur. 2015, 35, 117–131. [Google Scholar] [CrossRef]
- Prats, L.; Marin, J. Blogtrip Incostabrava or the use of bloggers as destination image ambassadors. Int. J. Manag. Cases 2014, 14, 297–307. [Google Scholar] [CrossRef]
- Paulino, I.; Domènech, A.; Bassols, N. Do visitors visit what the tours industry supplies? Sightseeing tours versus first-timers’ photos. Tour. Plan. Dev. 2022, 24, 416–437. [Google Scholar] [CrossRef]
- Swarbrooke, J. Development and Management of Visitor Attractions; Butterworth-Heinemann: Oxford, UK, 2002. [Google Scholar]
- Lew, A.; McKercher, B. Modeling Tourist Movements: A Local Destination Analysis. Ann. Tour. Res. 2006, 33, 403–423. [Google Scholar] [CrossRef]
- Paül i Agustí, D. Characterizing the location of tourist images in cities. Differences in user-generated images (Instagram), official tourist brochures and travel guides. Ann. Tour. Res. 2018, 73, 103–115. [Google Scholar] [CrossRef]
- Mahajan, P.; Gupta, B.; Pedapalli, S.C. How Does Social Media Influence Tourist Behavior? A Conceptual Framework for Exploration. Int. J. Tour. Hosp. Rev. 2024, 1, 1–8. [Google Scholar] [CrossRef]
- Kozinets, R.V.; Gretzel, U.; Gambetti, R. Influencers and Creators: Business, Culture and Practice; Sage: New York, NY, USA, 2023. [Google Scholar]
- DeFrank, R.S.; Konopaske, R.; Ivancevich, J.M. Executive travel stress: Perils of the road warrior. Acad. Manag. Perspect. 2000, 14, 58–71. [Google Scholar] [CrossRef]
- Williams, N.; Ivanov, S.; Buhalis, D. Algorithmic ghost in the research shell: Large Language models and academic knowledge creation in management research. arXiv 2023, arXiv:2303.07304. [Google Scholar]
- Pillai, R.; Sivathanu, B. Adoption of AI-based chatbots for hospitality and tourism. Int. J. Contemp. Hosp. Manag. 2020, 32, 3199–3226. [Google Scholar] [CrossRef]
- Christensen, J.; Hansen, J.M.; Wilson, P. Understanding the role and impact of Generative Artificial Intelligence (AI) hallucination within consumers’ tourism decisionmaking processes. Curr. Issues Tour. 2025, 28, 545–560. [Google Scholar] [CrossRef]
- Hill-Yardin, E.L.; Hutchinson, M.R.; Laycock, R.; Spencer, S.J. A Chat (GPT) about the future of scientific publishing. Brain Behav. Immun. 2023, 110, 152–154. [Google Scholar] [CrossRef]
- Shin, H.; Kang, J. Bridging the gap of bibliometric analysis: The evolution, current state, and future directions of tourism research using ChatGPT. J. Hosp. Tour. Manag. 2023, 57, 40–47. [Google Scholar] [CrossRef]
- Krügel, S.; Ostermaier, A.; Uhl, M. The moral authority of ChatGPT. arXiv 2023, arXiv:2301.07098. [Google Scholar]
- Dwivedi, Y.K.; Kshetri, N.; Hughes, L.; Slade, E.L.; Jeyaraj, A.; Kar, A.K.; Raghavan, V.; Ahuja, M.; Albanna, H.; Ahmad Albashrawi, M.; et al. “So what if ChatGPT wrote it?” Multidisciplinary perspectives on opportunities, challenges and implications of generative conversational AI for research, practice and policy. Int. J. Inf. Manag. 2023, 71, 102642. [Google Scholar] [CrossRef]
- Carvalho, I.; Ivanov, S. ChatGPT for tourism: Applications, benefits and risks. Tour. Rev. 2024, 79, 290–303. [Google Scholar] [CrossRef]
- Sorrells, M. What Will ChatGPT Mean for the Travel Industry? Travel Weekly. 2023. Available online: https://www.phocuswire.com/what-will-chatgpt-mean-for-the-travel-industry (accessed on 14 April 2024).
- Tussyadiah, I.P.; Zach, F.J.; Wang, J. Do travelers trust intelligent service robots? Ann. Tour. Res. 2020, 81, 102886. [Google Scholar] [CrossRef]
- Li, Y.; Lee, S.O. Navigating the generative AI travel landscape: The influence of ChatGPT on the evolution from new users to loyal adopters. Int. J. Contemp. Hosp. Manag. 2024, 37, 1421–1447. [Google Scholar] [CrossRef]
- Kim, J.H.; Kim, J.; Park, J.; Kim, C.; Jhang, J.; King, B. When ChatGPT gives incorrect answers: The impact of inaccurate information by generative AI on tourism decision-making. J. Travel Res. 2023, 64, 00472875231212996. [Google Scholar] [CrossRef]
- Rather, R.A. AI-powered ChatGPT in the hospitality and tourism industry: Benefits, challenges, theoretical framework, propositions and future research directions. Tour. Recreat. Res. 2025, 50, 652–662. [Google Scholar] [CrossRef]
- Mura, L.; Stehlíková, B. Artificial Intelligence and Tourism in the EU: A Data-Driven Analysis of Adoption and Economic Contribution. Folia Geogr. 2025, 67, 70–99. [Google Scholar]
- Bulchand-Gidumal, J. Impact of artificial intelligence in travel, tourism, and hospitality. In Handbook of e-Tourism; Xiang, Z., Fuchs, M., Gretzel, U., Höpken, W., Eds.; Springer International Publishing: Cham, Germany, 2022; pp. 1943–1962. [Google Scholar]
- Wong, I.A.; Lian, Q.L.; Sun, D. Autonomous travel decision-making: An early glimpse into ChatGPT and generative AI. J. Hosp. Tour. Manag. 2023, 56, 253–263. [Google Scholar] [CrossRef]
- Ali, F.; Yasar, B.; Ali, L.; Dogan, S. Antecedents and consequences of travelers’ trust towards personalized travel recommendations offered by ChatGPT. Int. J. Hosp. Manag. 2023, 114, 103588. [Google Scholar] [CrossRef]
- Mich, L.; Garigliano, R. ChatGPT for e-Tourism: A technological perspective. Inf. Technol. Tour. 2023, 25, 1–12. [Google Scholar] [CrossRef]
- Zhuo, T.Y.; Huang, Y.; Chen, C.; Xing, Z. Exploring AI ethics of ChatGPT: A diagnostic analysis. arXiv 2023, arXiv:2301.12867. [Google Scholar]
- Wang, H.; Yan, J. Effects of social media tourism information quality on destination travel intention: Mediation effect of self-congruity and trust. Front. Psychol. 2022, 13, 1049149. [Google Scholar] [CrossRef]
- Observatori del Turisme a Barcelona. Xifres Clau de L’activitat Turística a la Destinació Barcelona; Observatori del Turisme a Barcelona: Barcelona, Spain, 2024. [Google Scholar]
- Paül i Agustí, D. Instagram public and private images as an element for the spatial monitoring of tourist behaviour in cities. Int. J. Tour. Cities 2024, 10, 1082–1097. [Google Scholar] [CrossRef]
- Toivonen, T.; Heikinheimo, V.; Fink, C.; Hausmann, A.; Hiippala, T.; Järv, O.; Tenkanen, H.; Di Minin, E. Social media data for conservation science: A methodological overview. Biol. Conserv. 2019, 233, 298–315. [Google Scholar] [CrossRef]
- Pritchard, A.; Morgan, N. Evaluating vacation destination brochure images: The case of local authorities in Wales. J. Vacat. Mark. 1995, 2, 23–38. [Google Scholar] [CrossRef]
- Barcelona Turisme. Tres Dies a Barcelona. 2024. Available online: https://www.barcelonaturisme.com/wv3/ca/page/82/tres-dies-a-barcelona.html (accessed on 25 March 2024).
- Yun, L.; Fan, H.; Li, X. Reliable facility location design with round-trip transportation under imperfect information part II: A continuous model. Transp. Res. Part B Methodol. 2019, 124, 44–59. [Google Scholar] [CrossRef]
- García-Palomares, J.C.; Gutiérrez, J.; Mínguez, C. Identification of tourist hot spots based on social networks: A comparative analysis of European metropolises using photo-sharing services and GIS. Appl. Geogr. 2015, 63, 408–417. [Google Scholar] [CrossRef]
- Haklay, M. Comparing map calculus and map algebra in dynamic GIS. In Dynamic & Mobile GIS: Investigating Change in Space and Time; Drummond, J., Billen, R., Forrest, D., João, E., Eds.; Taylor & Francis: London, UK, 2007; pp. 89–104. [Google Scholar]
- Su, S.; Chen, W.; Hu, Y.; Cai, Z. Characterizing geographical preferences of international tourists and the local influential factors in China using geo-tagged photos on social media. Appl. Geogr. 2016, 73, 26–37. [Google Scholar] [CrossRef]
- Paül i Agustí, D. The clustering of city images on Instagram: Mapping gender in tourist behaviour based on Instagram. J. Outdoor Recreat. Tour. 2021, 35, 100381. [Google Scholar] [CrossRef]
- Souza, E.A.D.; Boigny, R.N.; Oliveira, H.X.; Oliveira, M.L.W.D.R.D.; Heukelbach, J.; Alencar, C.H.; Martins-Melo, F.R.; Ramos, A.N. Tendências e padrões espaço-temporais da mortalidade relacionada à hanseníase no Estado da Bahia, Nordeste do Brasil, 1999–2014. Cad. Saúde Coletiva 2018, 26, 191–202. [Google Scholar] [CrossRef]
- Caldas de Castro, M.; Singer, B.H. Controlling the false discovery rate: A new application to account for multiple and dependent tests in local statistics of spatial association. Geogr. Anal. 2006, 38, 180–208. [Google Scholar] [CrossRef]
- Pan, B.; Li, X.R. The long tail of destination image and online marketing. Ann. Tour. Res. 2011, 38, 132–152. [Google Scholar] [CrossRef]
- Gursoy, D.; Li, Y.; Song, H. ChatGPT and the Hospitality and Tourism Industry: An Overview of Current Trends and Future Research Directions. J. Hosp. Mark. Manag. 2023, 32, 579–592. [Google Scholar] [CrossRef]
- Schmücker, D.; Reif, J.; Horster, E.; Engelhardt, D.; Höftmann, N.; Naschert, L.; Radlmayr, C. The INPReS intervention escalation framework for avoiding overcrowding in tourism destinations. Tour. Hosp. 2023, 4, 282–292. [Google Scholar] [CrossRef]
- Fontanari, M.; Traskevich, A. Smart-Solutions for Handling Overtourism and Developing Destination Resilience for the Post-COVID-19 Era. Tour. Plan. Dev. 2022, 20, 86–107. [Google Scholar] [CrossRef]
- Bethune, E.; Buhalis, D.; Miles, L. Real time response (RTR): Conceptualizing a smart systems approach to destination resilience. J. Destin. Mark. Manag. 2022, 23, 100687. [Google Scholar] [CrossRef]
- Mitas, O.; Verhoeven, M.; Verstraten, K.; de Graaf, L.; Badal, R.; Mitasova, H.; Klijs, J. Experience Overijssel–Optimal Tourist Experience and Density in Overijssel Via Social Interaction in the Conversational Recommender System, Travel with Zoey. 2022. Available online: https://www.celth.nl/uploads/2024/6/reduce-crowding-at_43516.pdf (accessed on 25 March 2024).
- Sigala, M.; Ooi, K.B.; Tan, G.W.H.; Aw, E.C.X.; Buhalis, D.; Cham, T.H.; Chen, M.M.; Dwivedi, Y.K.; Gretzel, U.; Inversini, A.; et al. Understanding the impact of ChatGPT on tourism and hospitality: Trends, prospects and research agenda. J. Hosp. Tour. Manag. 2024, 60, 384–390. [Google Scholar] [CrossRef]
- Almeida-García, F.; Domínguez-Azcue, J.; Mercadé-Melé, P.; Pérez-Tapia, G. Can a destination really change its image? The roles of information sources, motivations, and visits. Tour. Manag. Perspect. 2020, 34, 100662. [Google Scholar] [CrossRef]
- Matlovič, R.; Matlovičová, K. The Metamodern Shift in Geographical Thought: Oscillatory Ontology and Epistemology, Post-disciplinary and Post-paradigmatic Perspectives. Folia Geogr. 2025, 67, 22–69. [Google Scholar]
- Feldman, S.M. The problem of critique: Triangulating Habermas, Derrida, and Gadamer within metamodernism. Contemp. Polit. Theory 2005, 4, 296–320. [Google Scholar] [CrossRef]
- Grundner, L.; Neuhofer, B. The bright and dark sides of artificial intelligence: A futures perspective on tourist destination experiences. J. Destin. Mark. Manag. 2021, 19, 100511. [Google Scholar] [CrossRef]

| Theme | Key Findings | Theoretical Implications | Practical Implications |
|---|---|---|---|
| Tourism Impact | Tourists may develop a narrow understanding of cities, focused primarily on central areas and long-established attractions. | Tourists tend to explore only a narrow segment of the urban environment they visit. Difficulty in introducing new tourism products to the market. | Social media has transformed tourists from passive consumers into active contributors to destination narratives [4]. However, with ChatGPT, this participatory role may diminish, reverting tourists to a more passive stance. |
| Spatial Implications | Reinforces dominant tourist circuits, potentially increasing overcrowding in popular areas and marginalizing lesser-known neighborhoods. | Urban planners and tourism managers may need to intervene to redistribute tourist flows and promote underrepresented areas. | Consistent with the observations of authors such as [3,6], LLMs may influence how short-term visitors perceive and interpret urban space |
| Cultural Consequences | Risks eroding local diversity and weakening the social and cultural identity of urban spaces. | Raises concerns about cultural homogenization and the loss of intangible heritage in tourism discourse. | As some authors have pointed out [67], ChatGPT favors dominant narratives, marginalizing alternative voices. |
| Tourist Experience | Reduces tourists’ role as co-creators of meaning and place; may lead to isolation and anxiety due to lack of human interaction. | Suggests a need to design hybrid experiences that balance AI guidance with opportunities for social interaction and discovery. | The lack of nuance in AI-generated recommendations can impact Place reputation [13]. This may hinder tourists’ ability to act as co-creators of new images and representations of the place—a role they actively fulfill on social media platforms [47]. |
| Accuracy Concerns | 1.7% of recommended attractions were non-existent, highlighting risks of misinformation. | Emphasizes the importance of verifying AI-generated content and developing mechanisms for quality control in tourism information systems. | AI-generated content can present convincingly inaccurate information (“hallucinations”), which may erode user trust in the absence of effective verification mechanisms [39,46]. |
Disclaimer/Publisher’s Note: The statements, opinions and data contained in all publications are solely those of the individual author(s) and contributor(s) and not of MDPI and/or the editor(s). MDPI and/or the editor(s) disclaim responsibility for any injury to people or property resulting from any ideas, methods, instructions or products referred to in the content. |
© 2025 by the author. Licensee MDPI, Basel, Switzerland. This article is an open access article distributed under the terms and conditions of the Creative Commons Attribution (CC BY) license (https://creativecommons.org/licenses/by/4.0/).
Share and Cite
Paül i Agustí, D. The Concentrated City: Effects of AI-Generated Travel Advice on the Spatial Distribution of Tourists. Urban Sci. 2025, 9, 268. https://doi.org/10.3390/urbansci9070268
Paül i Agustí D. The Concentrated City: Effects of AI-Generated Travel Advice on the Spatial Distribution of Tourists. Urban Science. 2025; 9(7):268. https://doi.org/10.3390/urbansci9070268
Chicago/Turabian StylePaül i Agustí, Daniel. 2025. "The Concentrated City: Effects of AI-Generated Travel Advice on the Spatial Distribution of Tourists" Urban Science 9, no. 7: 268. https://doi.org/10.3390/urbansci9070268
APA StylePaül i Agustí, D. (2025). The Concentrated City: Effects of AI-Generated Travel Advice on the Spatial Distribution of Tourists. Urban Science, 9(7), 268. https://doi.org/10.3390/urbansci9070268