Article

Beyond Boundaries—Genetic Implications of Urbanisation and Isolation in Eastern Grey Kangaroos (Macropus giganteus)

1
School of Science, Technology and Engineering, University of the Sunshine Coast, Maroochydore, QLD 4556, Australia
2
School of BioSciences, The University of Melbourne, Parkville, VIC 3010, Australia
3
Office of Nature Conservation, ACT Government, Dickson, ACT 2602, Australia
4
Centre for Bioinnovation, University of the Sunshine Coast, Maroochydore, QLD 4556, Australia
*
Author to whom correspondence should be addressed.
Urban Sci. 2025, 9(7), 257; https://doi.org/10.3390/urbansci9070257
Submission received: 5 May 2025 / Revised: 13 June 2025 / Accepted: 30 June 2025 / Published: 3 July 2025

Abstract

Understanding how urbanisation and habitat fragmentation influence wildlife is critical for biodiversity conservation. Fragmentation and population isolation can reduce genetic diversity, yet few studies have assessed these genetic impacts in urbanised environments. Eastern grey kangaroos (Macropus giganteus), widespread across eastern Australia, often inhabit landscapes shaped by urbanisation. Using single nucleotide polymorphism (SNP) data from scat and tissue samples, we compared genetic characteristics of kangaroo populations in urban and non-urban areas across three regions. We assessed the influence of habitat isolation on genetic diversity and relatedness at 18 study sites. Overall, urban populations did not show significantly lower genetic diversity than those in less developed areas (p > 0.05; Urban mean HO = 0.196, Non-urban mean HO = 0.188). However, populations fully isolated by roads, buildings, and fences exhibited reduced genetic diversity and increased inbreeding. Additionally, significant genetic differences were observed among regions. These findings suggest that while urbanisation alone may not always reduce genetic diversity, complete physical isolation poses greater risks to population genetic health. This study highlights how urban landscape features can shape the genetics of large terrestrial mammals and underscores the need for spatially informed urban planning and management strategies that maintain or restore habitat connectivity.

1. Introduction

Anthropogenic land use changes are the dominant driving force behind the current downward trend in global biodiversity [1]. With more than 70% of Earth’s land surface now modified in some way for human use [2], wildlife exposure to anthropogenic influence is widespread. These changes often result in a complex matrix of remnant and modified habitats, which can give rise to novel and varied habitat conditions. In contemporary terrestrial environments, habitat modification is often associated with the urbanisation of landscapes, which is a major contributor to global defaunation [3]. While urbanisation can cause direct reductions in population numbers, the long-term implications on species’ genetic characteristics are varied and often less well understood [4]. Understanding the long-term influences that urbanisation and habitat fragmentation can have on a species is an increasingly important aspect of ecology.
Land use changes can have both short and long-term implications for species, with built infrastructure presenting novel barriers to animal movement, reducing the permeability of landscapes, and increasing isolation of populations. Barriers such as roads can produce direct short-term reductions in population numbers from mortality from vehicle strikes [5,6]. Ecological barriers in urban or urbanising landscapes that restrict animal movements may also present long-term negative impacts on population viability by directly reducing available habitat. Habitat modification and conversion within these fragmented landscapes may also reduce the number of permeable pathways through the landscape, further limiting gene-flow opportunities and reducing genetic diversity [7]. While immediate reductions in population numbers may be the most noticeable ramification of these processes, the long-term effect on species viability may be less evident and the factors that are most influential for genetic connectivity in individual species are not well known.
Fragmentation of habitats can lead to smaller, more segregated populations and result in genetic bottlenecks, founder effects and genetic drift [8]. The loss of diversity, resulting from genetic drift, can reduce adaptive potential and negatively impact the long-term sustainability of small, isolated populations [8,9,10]. Fragmented landscapes can also hinder dispersal opportunities, which can increase the likelihood of inbreeding, potentially leading to a build-up of deleterious alleles and causing numerous health issues [11,12,13]. Determining levels of inter- and intra-population relatedness is a valuable tool to understand population linkage and dispersal dynamics [14] and expose thresholds of population isolation to guide management decisions. However, as these factors are species and landscape specific, there is a lack of data available for many animals and regions. As more species are exposed to land use changes and undergo subsequent isolation, understanding how these changes influence population genetic structure can better inform conservation actions. Yet, the development of appropriate strategies to manage fragmented populations requires a nuanced understanding of the resulting landscape matrix.
The urbanisation of landscapes converts natural environments to areas with impervious hard surfaces, such as buildings and roads (grey spaces), and a mix of remnant and modified vegetation areas (green spaces) [15], including parks, gardens, and golf courses. Although modified green spaces typically contain lower biodiversity than remnant natural vegetation patches [16], green spaces have the potential to provide a beneficial habitat for certain species. For example, green spaces can provide movement corridors for smaller mammals and birds that can aid migration and dispersal [17]. Yet, most mammals lack the capacity for flight and are therefore more likely to have their movements restricted by constructed barriers (e.g., roads, buildings) that often surround urban green spaces. Larger terrestrial, herbivorous mammals, which typically have substantial home ranges, have been reported as the most susceptible to a loss of genetic diversity resulting from fragmentation [4]. Yet, as green spaces can vary dramatically in size, characteristics of surrounding infrastructure, and their connectivity and proximity to other habitat patches, the faunal response of species persisting in these areas is also likely to be variable. The genetic implications for population networks that include urban green spaces should therefore be assessed at a landscape scale, which can provide a better understanding of the effects of fragmentation and isolation in newly modified landscapes [18].
Although larger mammals may be more susceptible to movement restrictions imposed by urbanisation, some species do rely, in varying degrees of dependency, on habitat within these areas. For example, ungulate species are often sighted in urban environments across a range of habitats, including mule deer (Odocoileus hemionus) [19] and white-tailed deer (Odocoileus virginianus) [20] in North America; roe deer (Capreolus capreolus) [21] and wild boar (Sus scrofa) in Europe [22]; and sika deer (Cervus nippon) and wild boar in Asia [23]. Despite this, there is evidence that the anthropogenic infrastructure within those habitats threatens the long-term viability of the populations by negatively influencing population genetics. For example, the barrier effect of a major highway caused a rapid reduction in genetic diversity in a population of bighorn sheep (Ovis canadensis) [24]. Similarly, landscape features within peri-urban regions, such as main roads, housing developments, and heavily cultivated areas restricted wild boar movements and subsequently impacted population genetic structure on an Italian island [22]. Furthermore, fenced roadways were a significant barrier to geneflow of roe deer in Switzerland, whereas rivers imposed moderate restrictions and unfenced railways presented no barrier to geneflow [21]. These results highlight that infrastructure and habitat attributes can produce varied levels of restriction on the movements of larger mammals throughout a landscape and subsequently impact gene flow.
Much of the Australian landscape, particularly along the eastern seaboard, is rapidly urbanising, and urban populations have increased from 58% of the total Australian population in 1911 to 90% in 2021 [25]. Previously rural areas are being modified to provide housing and services to accommodate growing human populations and are now exhibiting peri-urban and/or urban characteristics [26]. Wildlife often utilise these urbanising regions for habitat, including larger species like macropodid marsupials [27], yet our fine-scale understanding of the interaction between urban infrastructure, habitat fragmentation, isolation, and genetic processes are limited for such species. Eastern grey kangaroos (Macropus giganteus) are large-bodied, vagile mammals that show ecological similarities to ungulate species. Generally preferring habitats with a mixture of quality grass and forested areas [28], eastern grey kangaroos occupy home ranges of 8–269 ha [29,30] and dispersal in eastern grey kangaroos is male-biased [31]. Eastern grey kangaroos occur in areas that overlap with the outskirts of multiple urban centres on Australia’s east coast including Brisbane, Sydney, Canberra, and Melbourne, and also in many regional areas [32]. This overlap contains fragmented areas of their natural habitat and isolated populations of eastern grey kangaroos that have persisted within urban green spaces on Australia’s east coast [27,33,34]. Nevertheless, this persistence in the urban environment can lead to management challenges [27]. In some cases, human–wildlife conflict has resulted in short-term reductions in localised population numbers through incidents such as vehicle strikes [6,34], although little is known about impacts on the long-term genetic characteristics and subsequent viability of these urban populations. Their ecological traits and capacity to persist amongst urbanised areas make eastern grey kangaroos a suitable candidate for investigating how the attributes of a complex and expanding urban landscape can impact the genetics of a large terrestrial mammal. Therefore, using single nucleotide polymorphism (SNP) data obtained from scat and tissue samples, this paper aims to
(i)
Compare genetic characteristics of urban and non-urban kangaroo populations across multiple regions on the east coast of Australia;
(ii)
Assess the influence that habitat characteristics and isolation have on the genetics of these populations.

2. Materials and Methods

2.1. Study Sites

The study area encompassed three regions in Australia: Sunshine Coast, Queensland (QLD), Australian Capital Territory (ACT), and South-western Victoria (VIC). Specific site selection was based on the authors’ on-ground knowledge of kangaroo populations in their respective areas and were strategically selected to offer comparable and contrasting habitat conditions and landscape connectivity. In addition, sites were chosen from known resident kangaroo populations that persist in urban, peri-urban, and rural land use areas with differing degrees of perceived isolation in QLD (n = 10), ACT (n = 5) and VIC (n = 3) (Figure 1, Table S1—Supplementary Materials).
The QLD sites were located on the Sunshine Coast, approximately 100 km north of Brisbane, which has a sub-tropical climate with a mean annual rainfall of 1483 mm, and a diverse range of habitats including floodplains, swamps, grasslands, eucalypt forest, and sub-tropical rainforests. This region has undergone rapid human population growth and the expansion of associated infrastructure has fragmented kangaroo habitat in recent decades [35,36]. The ACT is located approximately 100 km inland from the coast with mean annual rainfall of 632 mm [37] and features both densely urbanised areas within the city of Canberra and surrounding peri-urban and rural areas. Extensive natural and modified green space occurs in and around urban Canberra, including a network of 39 nature reserves collectively known as Canberra Nature Park [38]. The ACT supports high densities of kangaroos, in urban, rural, and natural landscapes. VIC sites are located along the coastline of Victoria, with mean annual rainfall ranging from 458 to 837 mm and represent areas of less urban pressures and higher levels of landscape connectivity, with rural and peri-urban habitats on the outskirts of smaller townships.

2.2. Habitat Classification

To assess the influence of habitat features on kangaroo population genetics, natural and anthropogenic features likely to influence kangaroo movements within and surrounding each habitat were examined. To achieve this, we assessed each population at two scales: (i) immediate habitat (i.e., sampling area; where samples were collected), and (ii) surrounding habitat (2 km radius buffer area surrounding the sampling area). Habitat classification was conducted in a two-stage process: Firstly, sites were mapped and both immediate and surrounding habitat characteristics were measured and assessed using aerial imagery and GIS. Following this step, habitat classifications based on digital imagery were ground-truthed with the authors’ intimate knowledge of field sampling sites, previous VHF and GPS tracking outcomes, and kangaroo movements on sites.

2.3. Immediate Habitat Characteristics

We measured habitat area and boundary length and assessed the type of boundaries on the habitat perimeter using Google Earth Pro 7.3.4 (Google LLC 2022, Mountain View, CA, USA) imagery from the year of sample collection (Table S1). Habitat area was defined as a continuous area of available habitat surrounding the sample collection points. We classified habitat type as urban or non-urban (based on human population densities and character of site), and whether the boundary was open, closed, or permeable (i.e., with incomplete barriers or a fence that would likely not block a kangaroo). Any infrastructure that would likely restrict kangaroo movements (i.e., fences, roads, or urban development) on the immediate habitat border was also classified and measured, and the total percentage of the boundary impeded was calculated. We estimated kangaroo population size and density for each site, using published data around the period of sampling [27] and/or on-ground counts performed at the time of sample collection. On ground counts consisted of multiple observers counting the number of kangaroos present across the study site over a period of several hours, with the aid of binoculars.

2.4. Surrounding Habitat Characteristics

We used GIS to assess habitat characteristics of the area surrounding each population (QGIS 3.28, 2022). A 2 km radius buffer was created around a centroid habitat point based on the location of sample collection. For each surrounding habitat buffer area, the following measurements were made: (i) length of primary roads (highways) (© OpenStreetMap’, v0.6); (ii) area of buildings and remnant vegetation cover [39,40,41]; (iii) unrestricted access (i.e., not impeded by infrastructure) to adjacent remnant vegetation areas (i.e., access or no access). Where imagery in QGIS did not match sampling timeframes and land use change had occurred, Google Earth Pro (Google LLC 7.3.4 2022) historic images were compared to QGIS data layers, and measurements manually adjusted. For manual adjustments, new roads and/or developments were measured using Google Earth Pro (Google LLC 7.3.4 2022) measuring tools and subtracted from the QGIS (QGIS 3.28, 2022) calculations to ensure the habitat characteristics measured at each site were representative of the time the samples were collected. Manual adjustments were required for two sites: Serendip and Portland. Site descriptions and characteristics are provided in Supplementary Materials.

2.5. Genetic Sample Collection

We utilised a combination of non-invasive scat samples collected as part of this, and previous studies, combined with tissue samples from live, adult kangaroos in capture-mark-release programs and deceased adult kangaroos collected as part of wildlife rescue operations and animal control and management programs.

2.6. Scat Sampling

Scat collection occurred across multiple time periods at many of the sites. As such, samples were selected from the 12-month period that provided the newest, or largest number of samples for each site. Collections were conducted early morning (up to 2 h after sunrise) and late afternoon (2 h before sunset) to increase the likelihood of kangaroos being active and feeding. Kangaroos were observed defecating and scat locations were mapped using a compass and rangefinder to allow sample collection after kangaroos moved away from the area. Where possible, scats were attributed to individuals with sex, age class (i.e., adult or juvenile), and any unique identifying features. Sex was only used to aid individual recognition and not accounted for in analyses and only adult scats were used in analyses. Additional scats were also collected opportunistically upon inspection of an area recently occupied by the kangaroos. In these instances, scats were only collected if deemed fresh by appearance (i.e., soft and shiny). All scats were collected with fresh gloves and stored in airtight containers, which were placed on ice in the field prior to storage at −20 °C. [35].

2.7. Tissue Sampling

Tissue samples were obtained from several sources. QLD tissue samples provided by Australia Zoo Wildlife Hospital (AZWH) were collected from deceased kangaroos and assigned to a local kangaroo population based on the reported location the kangaroo was found. These samples were only attributed to a population if the recorded location of a kangaroo was in proximity (<1 km) to a chosen site. ACT and VIC tissue samples were collected from live and dead kangaroos as part of ongoing research and management programs. All tissue samples were stored individually in ethanol prior to shipping and processing.

2.8. Genetic Analysis

2.8.1. DNA Extraction

Scat DNA was isolated from intestinal epithelial cells from the surface of each scat by scraping the outside sample layer with a sterilised scalpel blade to remove 0.020–0.025 g of faecal matter [35]. Samples were then processed using QIAamp PowerFecal Pro DNA kits (Qiagen, Venlo, The Netherlands) following the manufactures protocol. An additional 30 min incubation period after the addition of Thiocyanate was included and samples were then homogenised using a QIAGEN Tissuelyser at 25 Hz for 10 min.
For tissue DNA extraction, 0.020–0.025 g of material was cut into small pieces using a sterilised scalpel blade and were processed using DNeasy Blood and Tissue kits (Qiagen) following the manufacturers protocol with an additional 12 h incubation at 60 °C as per Brunton et al. [35].

2.8.2. Reduced-Representation (SNP) Data and Filtering

All DNA samples (scat and tissue) were genotyped by Diversity Arrays Technology (DArT) Pty Ltd. (Canberra, Australia) to generate a raw SNP marker dataset using a proprietary next-generation sequencing platform [42]. We utilised a genetic probe specifically developed from eastern grey kangaroo tissue samples from the study area to target 3117 predefined SNPs and used a single DNA oligo probe per marker [35]. To retain high-quality SNPs, we performed a series of filtering steps on the raw SNP dataset in the R environment (v4.1, R Core Team, 2021). Loci were filtered for missing data (<0.99%), and individuals with >5% missing data were removed. As not all samples were assigned to an individual prior to analysis, duplicates were identified based on relatedness values determined using the R package ‘related’ [43]. Individuals with more than 90% matching genotypes were classified as duplicates and removed [35]. In total, 83 individuals were removed from the quality filtering and duplicate identification process resulting in a genotype dataset of 2542 SNPs available for 234 individuals with 1.27% missing data.

2.9. Statistical Analysis
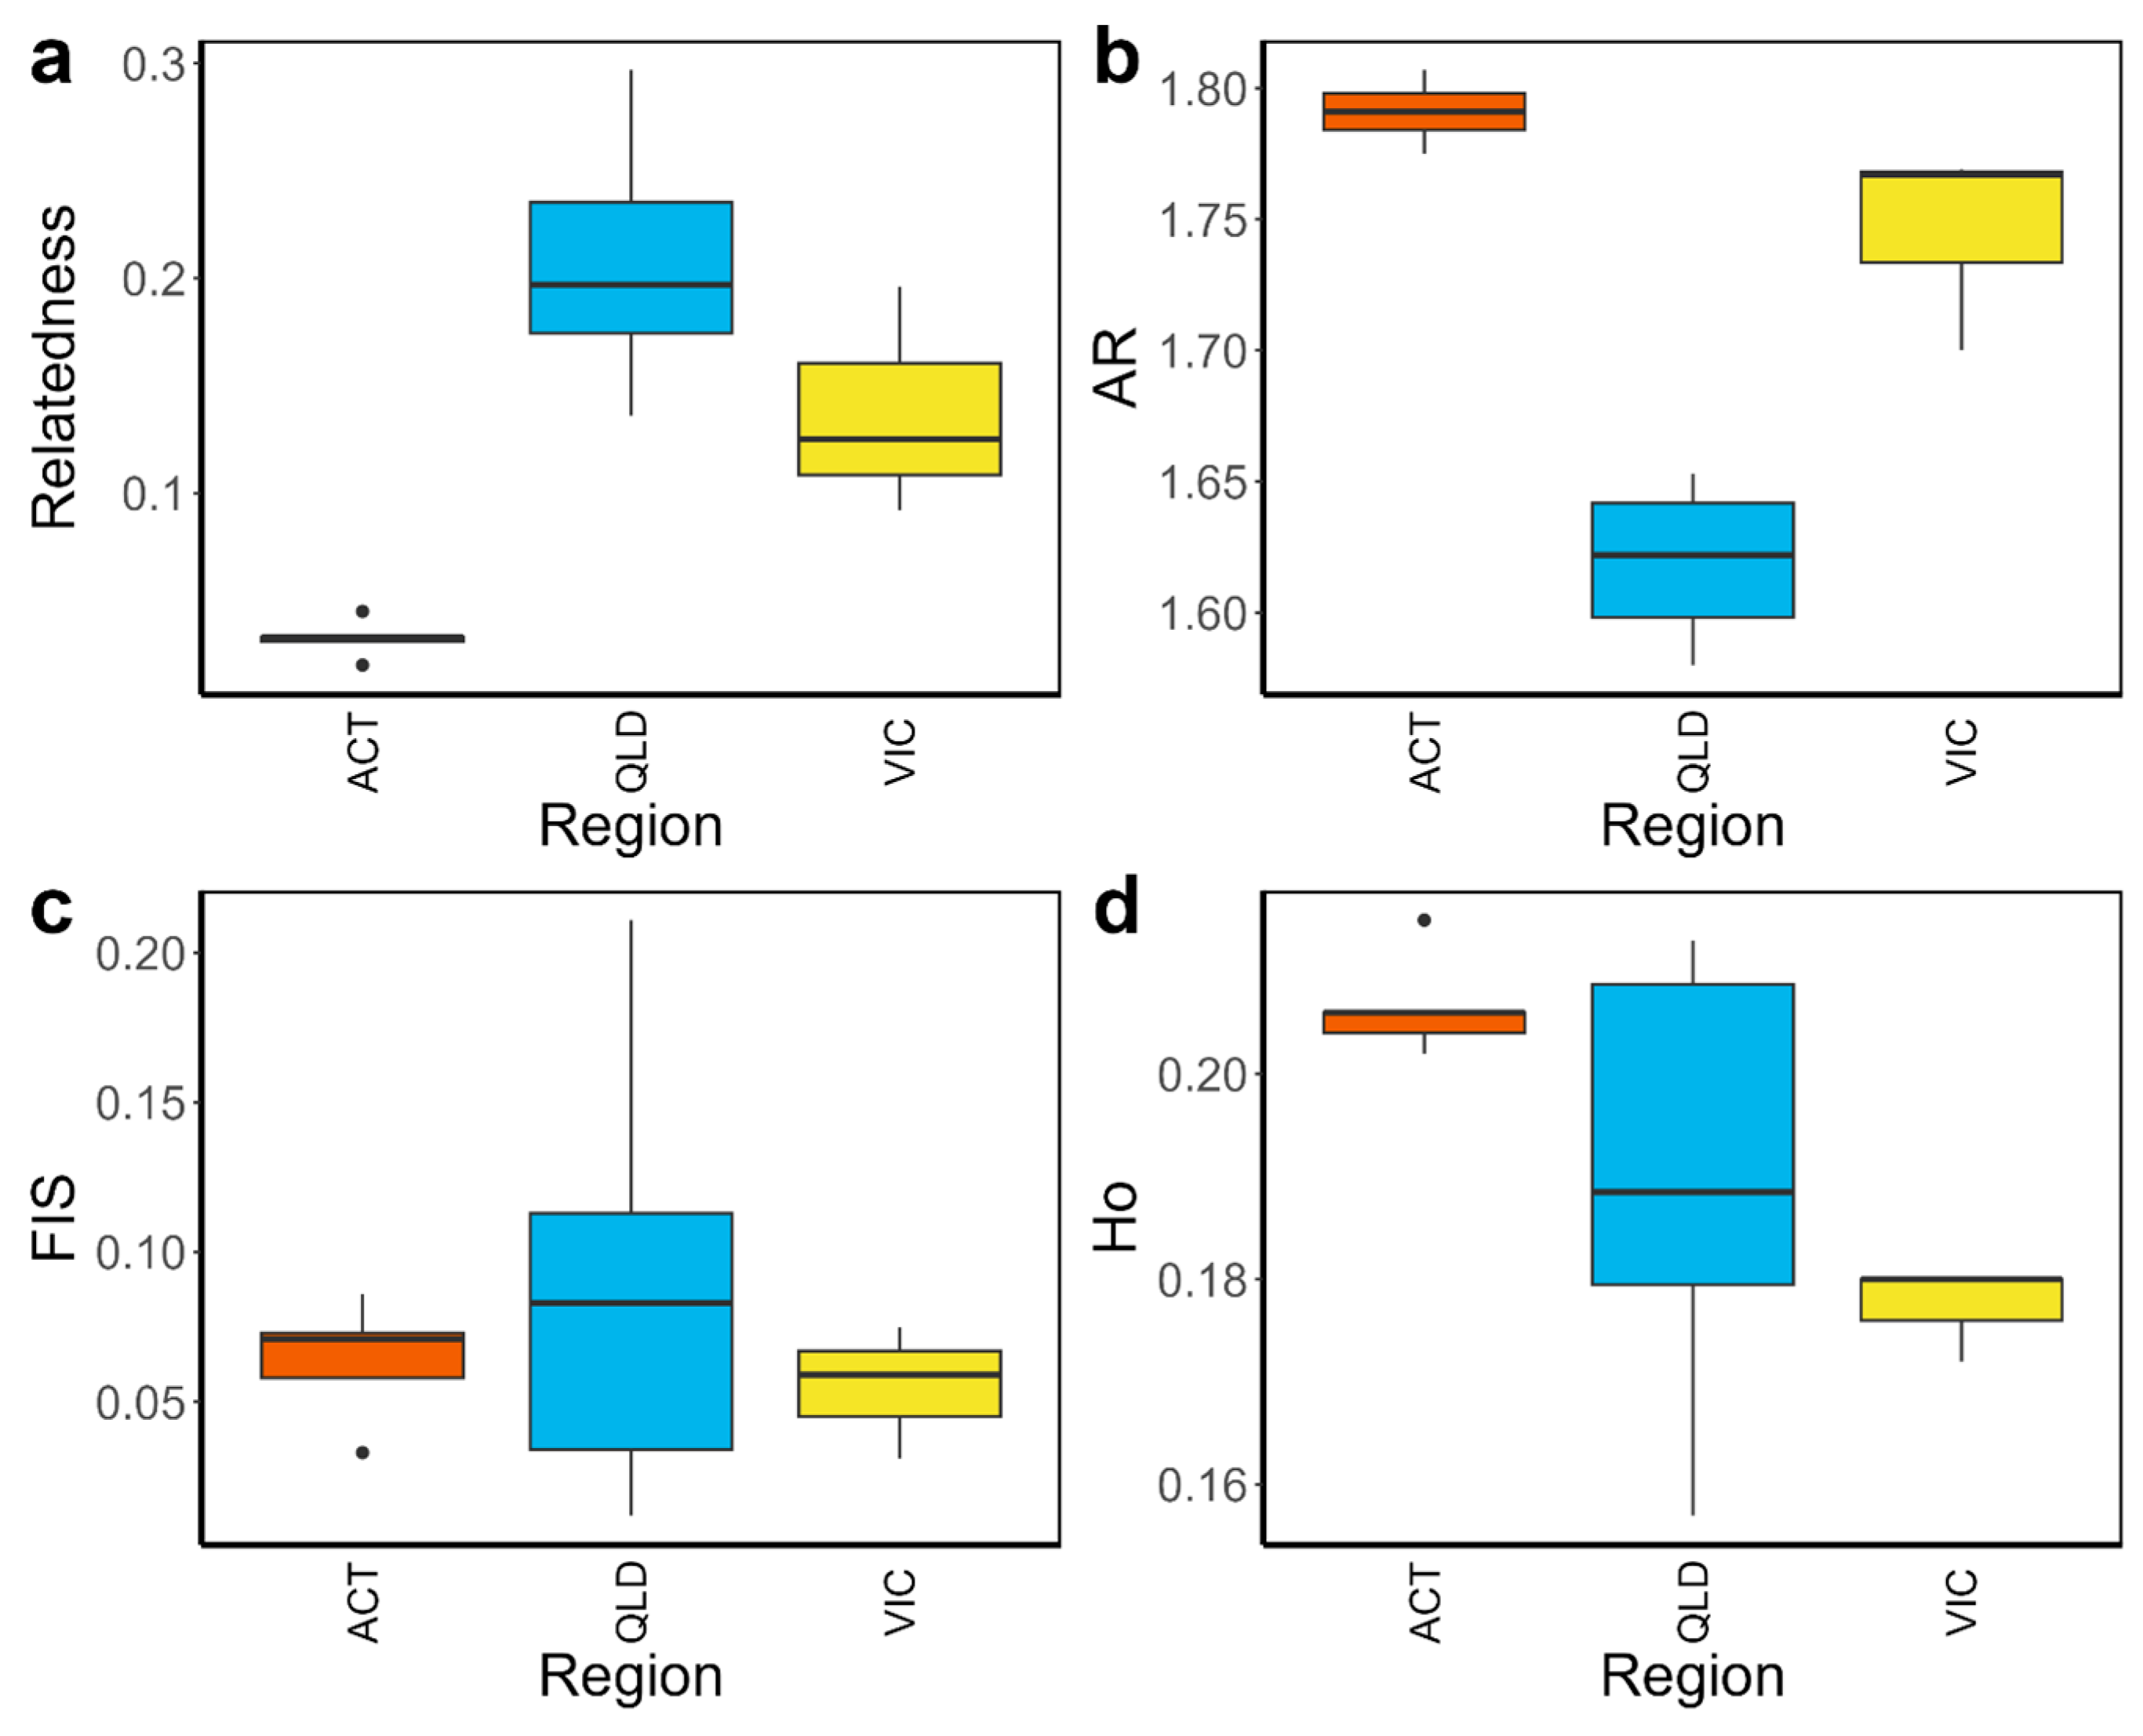
All analyses were performed in the R environment. To calculate genetic parameters, we used dartR [44] and ‘related’ [43] packages. To compare mean genetic parameters (i.e., observed heterozygosity—HO, allelic richness—AR, inbreeding coefficient—FIS, and relatedness coefficient—RC, the average of the dyadic maximum likelihood estimators) between urban and non-urban populations, we conducted Wilcoxin rank tests for each parameter. To evaluate the influence of immediate habitat characteristics on each genetic parameter, we built a series of generalised linear models (GLMs) with a Gamma distribution and log link, using each parameter as a dependent variable and various characteristics of the immediate environment as the explanatory variables. In our on-ground observations and previous research on kangaroo populations in each region, we have observed different densities and populations sizes of kangaroos that may be related to different climates or historical densities; therefore, we included region, population size and population density as factors in our modelling. Prior to running the models, we assessed region, habitat type, boundary, restriction type, restriction percentage, population size, and population density for collinearity using ‘ggpairs’ (GGally Package). Population size, population density, and region were highly correlated (r > 0.9). We used Information Theoretic (IT) modelling (i.e., modelling multiple working hypotheses or multi-model inference [45,46,47] to compare the impact of population size versus density versus region based on AIC. IT model selection is grounded in likelihood theory and allows researchers to draw inferences from competing, biologically meaningful alternative hypotheses [47], as opposed to the frequentist approach (i.e., null hypothesis testing) and other data dredging analysis methods that can lead to biases in parameters, over-fitting, and incorrect significance tests, ultimately causing spurious and misleading results [48,49]. Based on a lower AIC value, we removed population size and population density for all models. Additional multicollinearity checks align with the IT modelling where region always had the lowest VIF scores and as such supports our decision to include region while removing mob size and density. Therefore, our explanatory Gamma models for immediate habitat included boundary type, restriction type, percentage restriction, and region as explanatory variables. Although population size was not included in the final models, it was moderately correlated with each genetic parameter (p < 0.05) (Supplementary Materials—Figure S1).
To assess the influence of surrounding habitat characteristics on genetic parameters (i.e., Ho, AR, FIS, RC) as dependent variables, we built another series of GLMs with a Gamma distribution and log link. Here we assessed area of remnant vegetation, built area, length of highways, access, population size, and region. Like the above models, population size and region were again colinear (r > 0.6), and using the IT modelling approach, we removed population size for all models based on the lower AIC value. As such, our explanatory Gamma models for surrounding habitat included remnant vegetation area, built area, highways, access, and region as the explanatory variables.

3. Results

3.1. Genetic Comparisons of Urban and Non-Urban Kangaroo Populations

There was no significant difference (p > 0.05) in genetic diversity (Ho, AR), inbreeding (FIS) or relatedness (RC) between populations from urban and non-urban habitats. Inbreeding was essentially equal in urban and non-urban populations; however, the FIS for one QLD population (Mount Coolum) was notably higher than the rest of the urban groups (0.211 vs. mean FIS = 0.076, Table 1). Average relatedness in urban populations showed a greater range than the non-urban groups (Urban RC = 0.02–0.242, Non-urban RC = 0.125–0.297, Table 1).

3.2. Influence of Habitat Characteristics

3.2.1. Immediate Habitat

Inbreeding (FIS) was not significantly influenced by any factors, with region being a significant predictor of relatedness (RC) (QLD t = −4.999, VIC t = −4.481) and allelic richness (AR) (QLD t = 8.08, VIC t = 2.069, Figure 2) (Supplementary Materials, Figures S2–S4). The type of boundary, percentage of restriction and region were all significant predictors of observed heterozygosity (Table 2, Figure 2, Figures S5 and S6). Population size also had a significant positive relationship (p < 0.05) with AR (r2 = 0.29) and RC (r2 = 0.46) (Supplementary Materials, Figure S1, Table S2).

3.2.2. Surrounding Habitat

Region and site access were significant predictors of Ho, with significantly lower values in VIC populations and sites with no obvious access to other populations. For AR and RC, region was the only significant predictor, with significantly lower AR and higher RC in QLD and VIC populations. For FIS, access had a significant effect, i.e., populations with surrounding habitat that provided some access to other habitats and populations had lower FIS values (Table 3).

4. Discussion

In this study, we explored the relationship between habitat characteristics, physical barriers, and genetic diversity in eastern grey kangaroo populations, highlighting the nuanced effects of isolation and the importance of maintaining connectivity in fragmented landscapes. We found that physical barriers in both the immediate and surrounding habitat (i.e., within 2 km) were linked to lower genetic diversity and higher inbreeding in eastern grey kangaroo populations. However, the observed effect was not always directly proportional to the amount of isolation for each site. Rather, the effects on inbreeding were mostly detected in sites that were completely isolated by infrastructure (i.e., kangaroo-proof fences or buildings). Observed heterozygosity was lower at these sites and conversely was highest for populations whose immediate habitat had free access to the surrounding habitat without any restriction by infrastructure. These findings suggest that sufficient gene flow can occur in fragmented landscapes provided that some effective connectivity remains.
The genetic implications of isolation observed in our study are consistent with a review of the effects of habitat loss and fragmentation on genetic diversity in mammals, where a decrease in allelic richness and observed heterozygosity was observed in fragmented landscapes [4]. These effects were most pronounced in large, herbivorous, terrestrial, forest-dependent species [4]. Eastern grey kangaroos correspond to this category, being large-bodied grazers that utilise forest and woodlands for shelter but are also capable of using remnant vegetation and human modified habitats in urban areas [28,29,34,50].
While diet, habitat use and body size of eastern grey kangaroos make them more susceptible to the impacts of habitat fragmentation and isolation, their behavioural characteristics may make the species more robust genetically than solitary or territorial species in fragmented habitats. Eastern grey kangaroos are gregarious, living in open groups and exhibiting fission–fusion, i.e., where groups merge and split dynamically in the environment, social organisation [30,51]. Kangaroos live in communities, known as mobs, and mob structure and composition are weakly influenced by kinship, mostly among females [33,52,53]. Males compete strongly for mating privileges [54], but do not occupy exclusive territories and often form all-male groups [30]. Home range sizes vary significantly between habitat and land use types, and eastern grey kangaroos have the capacity to move large distances provided sufficient habitat connectivity is present [27,33,34,55]. Natal dispersal is male-biased in this species, but some adult females have been recorded dispersing up to 17 km [56,57,58]. Our results considered in the context of previous research suggest that the social and dispersal behaviour of eastern grey kangaroos may allow the species to retain genetic diversity in urban and fragmented habitats if (i) population size is large enough, (ii) sufficient appropriate habitat is available, and (iii) some effective habitat connectivity is maintained.
Although the effects of isolation on genetic composition of kangaroos detected in this study may be best explained by the spatial ecology and/or social behaviour, the most significant factor related to genetic diversity parameters in our study was region. There was also a strong relationship between population size and region, with higher population sizes and densities in ACT and VIC than in QLD. For this reason, population size was removed from the statistical analysis since region better explained differences in genetic parameters. Yet, the effect of differences in population size on kangaroo genetic diversity should not be understated. Relatedness and allelic richness were most affected by region showing negative and positive relationships with population size, respectively, notably in ACT and VIC sites, where populations were larger on average. This is in accordance with general genetic theory: as population size increases, allelic richness also increases, while relatedness within a population reduces [8]. These regional differences also highlight the complexity of managing and conserving genetic diversity for species with broad geographical ranges.
Not all effects of region can be explained by differences in population size, and it is not possible to determine whether the effects of region on genetic parameters are due to historical differences between regions or if they also represent recent anthropogenic impacts. This regional influence may also relate to the contrasting history and characteristics, e.g., climatic, habitat type, sources of mortality, of kangaroo populations in the study regions. A study using mtDNA (which is only maternally inherited) of eastern grey kangaroos identified evidence of historical isolation in the SEQ region of QLD [59]. While these findings provided some evidence of a bottleneck, [59] suggested that historically, populations in the region may have remained at lower effective population sizes than their southern counterparts. Additionally, in the SEQ region, eastern grey kangaroos have undergone recent population declines [60], with high rates of vehicle collisions being a primary source of mortality [6]. These historical factors may have a cumulative impact leading to a decreasing trend for genetic diversity in the QLD populations. In a comprehensive analysis of genetic diversity in 108 mammalian species, lower heterozygosity was reported in populations that had experienced demographic effects, i.e., population declines, bottlenecks, reduction in population range, and isolation from conspecifics [61]. It would be worthwhile extending this current work in the same regions where mob size and population density could be assessed to see if these patterns hold on a regional and sub-regional scale within each region, noting that this would require extensive sampling efforts.
Although we found no significant effect of road length in our modelling, road characteristics, e.g., speed, width, roadside vegetation, presence of collision mitigation devices, can have a large influence on their impacts on macropod movements [62] and road characteristics were not captured in this study.
However, the impact of mortality on roads still may have an important, albeit complex and indirect, influence on genetic diversity in fragmented landscapes. Eastern grey kangaroos are frequently involved in wildlife–vehicle collisions in Australia and mitigation is a major part of kangaroo management in the studied regions, with the negative impacts of roads on macropod populations well established [27,34,62,63,64]. In a previous study assessing barriers to gene flow in the Sunshine Coast region of QLD, roads and built infrastructure were found to influence genetic structuring between twelve eastern grey kangaroo populations, some of which are included in this current study [64]. Roads can significantly influence genetic characteristics through negative interactions between wildlife and traffic, which can lead to mortality [62,63,64]. In cases where population sizes are already low, this can result in localised declines [34] and further reduce the effective population size, which can be a more important metric than census population size in terms of genetic sustainability. Therefore, while kangaroo populations may be able to sustain some level of mortality through vehicle collisions without detrimental effects on genetic diversity, the scale of the effect will likely be determined by population size.
It is also important to acknowledge that we do not fully understand the timescale at which barriers and/or isolation could be expected to impact genetic diversity and relatedness [65]. Genetic structure at any point in time will be influenced by both current and past landscape characteristics and historical events [66]. Hence, we are unable to conclude if our study time frame has sufficiently captured the effect of barriers and isolation on genetic characteristics of kangaroos or if it is underestimated. However, our use of high-resolution SNP markers provides a robust method for detecting recent genetic changes. These types of markers have proven effective in identifying genetic shifts within relatively short time frames, such as decades, in previous studies on mammals in the study region [64,67]), supporting the reliability of our findings. Therefore, additional research and continued monitoring is needed to determine if, and when, genetic characteristics are impacted and to monitor for future declines in genetic diversity in those populations where no effect has been detected. As emerging methods such as whole genome sequencing become more accessible, they can be used to verify our findings and conduct further analyses, ensuring comprehensive monitoring of genetic diversity.

5. Conclusions

The findings from this study suggest habitat continuity influences genetic diversity of eastern grey kangaroos, yet our findings indicate that a small amount of connectivity may be sufficient to maintain kangaroo gene flow in fragmented landscapes, that is, a little bit of connectivity goes a long way. This is a significant finding to inform management and land use planning in urban areas where kangaroo populations persist. Eastern grey kangaroo populations in Australia face substantial challenges that could lead to long-term genetic diversity loss. Populations in SEQ are particularly susceptible, due to isolation and smaller population sizes and further habitat fragmentation projected, necessitating focused efforts on enhancing population connectivity and reducing road mortality. Unlike populations in SEQ, kangaroo populations in the urban areas of the ACT have increased in recent times, resulting in the need to reduce kangaroo densities in priority urban nature reserves to prevent the environmental impacts of heavy grazing [38]. For the long-term management of ACT populations in the urban environment, it will be important to maintain adequate connectivity and to monitor genetic diversity, particularly in fenced reserves and the more isolated urban habitat patches, to prevent genetic erosion over time. This is especially so given that there is likely to be a time lag in the impacts of isolation being expressed in the genetic structure of kangaroo populations. The VIC populations have also increased in recent times and two are periodically culled to mitigate impacts on vegetation and animal welfare [68,69]. All three populations have easy access to surrounding habitat, raising no immediate genetic concerns.
Effective management of population sizes is pivotal for maintaining genetic diversity, emphasising its integration into reserve management, connectivity planning, and future reserve design. Regional comparisons demonstrate that effective management of eastern grey kangaroo populations needs to occur at a regional scale appropriate for genetic and population demographics, rather than only at a state and national level. Lower overall diversity of QLD eastern grey kangaroo populations highlights the implications of poor urban planning and rapid sprawl on genetic diversity, serving as a cautionary tale for other regions in Australia. These insights underscore the urgency of adopting proactive conservation strategies and sustainable urban development practices to safeguard biodiversity amidst ongoing environmental changes and habitat fragmentation.

Supplementary Materials

The following supporting information can be downloaded at: https://www.mdpi.com/article/10.3390/urbansci9070257/s1, Figure S1: Linear regression of population size and eastern grey kangaroo genetic characteristics; Figure S2: Inbreeding coefficients; Figure S3: Relatedness coefficients (RC); Figure S4: Allelic richness (AR); Figure S5: Observed heterozygosity (Ho); Figure S6: Linear regression showing the influence of boundary restrictions of study sites; Table S1: Site descriptions, habitat characteristics, and sampling details; Table S2: Genetic diversity, inbreeding and relatedness statistics; Table S3: Linear regression output for Model 1; Table S4: Linear regression output for Model 2; Table S5: Linear regression output for Model 3; Table S6: Linear regression output for Model 4; Table S7: Linear regression output for Model 1(surrounding habitat); Table S8: Linear regression output for Model 2 (surrounding habitat); Table S9: Linear regression output for Model 3 (surrounding habitat); Table S10: Linear regression output for Model 4 (surrounding habitat).

Author Contributions

Conceptualization, E.B., A.L., N.C., G.C. (Graeme Coulson), C.W. and G.C. (Gabriel Conroy); methodology, E.B., A.L., N.C., A.B., G.C. (Graeme Coulson), C.W. and G.C. (Gabriel Conroy); validation, E.B., A.L., G.C. (Graeme Coulson), C.W. and G.C. (Gabriel Conroy), formal analysis, A.L., N.C. and A.B.; investigation, E.B., A.L., N.C., A.B. and G.C. (Gabriel Conroy); resources, E.B., G.C. (Graeme Coulson), C.W. and G.C. (Gabriel Conroy); data curation, E.B., A.L., N.C. and A.B.; writing—original draft preparation, E.B., A.L., N.C. and A.B.; writing—review and editing, E.B., A.L., A.B., G.C. (Graeme Coulson), C.W. and G.C. (Gabriel Conroy); visualisation, A.L. and A.B.; supervision, E.B., A.L. and G.C. (Gabriel Conroy); project administration, E.B.; funding acquisition, E.B. and G.C. (Gabriel Conroy). All authors have read and agreed to the published version of the manuscript.

Funding

Neil Clarke received a UniSC honours scholarship to support this work. ACT samples were collected during research projects funded by the ACT Government. QLD samples were collected during research projects funded by the Sunshine Coast Council and University of the Sunshine Coast collaborative research scheme.

Data Availability Statement

The datasets generated during and/or analysed during the current study are available from the corresponding author on reasonable request.

Acknowledgments

The authors would like to thank and acknowledge the following individuals and organisations who assisted this project. Field work: T. Allen, R. Barnsley, J. Cripps, D. Fletcher, A. Hart, S. Henry, L. Hinds, M. Keighley, K. Koutsellis, N. McLernon, D. Morawiak, C. Nave, T. Portas, M. Snape and M. Wilson. Genotyping: Diversity Arrays Technology. Tissue samples: Australia Zoo Wildlife Hospital. Field site access: ACT Government (Parks and Conservation Service; Suburban Land Agency; Transport Canberra and City Services), Anglesea Golf Club, Barung Landcare, A. Brake, Buderim Pony Club, Crystal Waters Permaculture Village, Gold Creek Country Club, Mount Coolum Golf Course, Noosa Golf Club, Parks Victoria, Portland Aluminium, Twin Waters Golf Course and C. Yule. We acknowledge the traditional custodians of the lands on which we worked and recognise their cultural connection to country. We acknowledge the Gubbi Gubbi/Kabi Kabi and Jinibara people as traditional custodians of the Sunshine Coast, the Ngunnawal people as traditional custodians of the ACT and the Gunditjmara Wadawurrung people as traditional custodians of the VIC sites and recognise any other people or families with connection to these lands.

Conflicts of Interest

The authors declare no conflicts of interest.

References

  1. United Nations Department of Economics and Social Affairs, Population Division. World Urbanization Prospects: The 2018 Revision (ST/ESA/SER.A/420); United Nations Department of Economics and Social Affairs, Population Division: New York, NY, USA, 2019; p. 41. [Google Scholar]
  2. Barnosky, A.D.; Hadly, E.A.; Bascompte, J.; Berlow, E.L.; Brown, J.H.; Fortelius, M.; Getz, W.M.; Harte, J.; Hastings, A.; Marquet, P.A.; et al. Approaching a state shift in Earth’s biosphere. Nature 2012, 486, 52–58. [Google Scholar] [CrossRef]
  3. Young, H.S.; McCauley, D.J.; Galetti, M.; Dirzo, R. Patterns, Causes, and Consequences of Anthropocene Defaunation. Annu. Rev. Ecol. Evol. Syst. 2016, 47, 333–358. [Google Scholar] [CrossRef]
  4. Lino, A.; Fonseca, C.; Rojas, D.; Fischer, E.; Pereira, M.J.R. A meta-analysis of the effects of habitat loss and fragmentation on genetic diversity in mammals. Mamm. Biol. 2019, 94, 69–76. [Google Scholar] [CrossRef]
  5. Ramp, D.; Ben-Ami, D. The effect of road-based fatalities on the viability of a peri-urban swamp wallaby population. J. Wildl. Manag. 2006, 70, 1615–1624. [Google Scholar] [CrossRef]
  6. Taylor-Brown, A.; Booth, R.; Gillett, A.; Mealy, E.; Ogbourne, S.M.; Polkinghorne, A.; Conroy, G.C.; Bhadauria, T. The impact of human activities on Australian wildlife. PLoS ONE 2019, 14, e0206958. [Google Scholar] [CrossRef]
  7. Lowe, W.H.; Allendorf, F.W. What can genetics tell us about population connectivity? Mol. Ecol. 2010, 19, 3038–3051. [Google Scholar] [CrossRef]
  8. Frankham, R. Genetics and extinction. Biol. Conserv. 2005, 126, 131–140. [Google Scholar] [CrossRef]
  9. Lourenço, A.; Álvarez, D.; Wang, I.J.; Velo-Antón, G. Trapped within the city: Integrating demography, time since isolation and population-specific traits to assess the genetic effects of urbanization. Mol. Ecol. 2017, 26, 1498–1514. [Google Scholar] [CrossRef]
  10. Lancaster, M.L.; Cooper, S.J.B.; Carthew, S.M. Genetic consequences of forest fragmentation by agricultural land in an arboreal marsupial. Landsc. Ecol. 2016, 31, 655–667. [Google Scholar] [CrossRef]
  11. Ross-Gillespie, A.; O’RIain, M.J.; Keller, L.F. Viral epizootic reveals inbreeding depression in a habitually inbreeding mammal. Evolution 2007, 61, 2268–2273. [Google Scholar] [CrossRef]
  12. Seymour, A.M.; Montgomery, M.E.; Costello, B.H.; Ihle, S.; Johnsson, G.; John, B.S.; Taggart, D.; Houlden, B.A. High effective inbreeding coefficients correlate with morphological abnormalities in populations of South Australian koalas (Phascolarctos cinereus). Anim. Conserv. 2001, 4, 211–219. [Google Scholar] [CrossRef]
  13. Crnokrak, P.; Roff, D.A. Inbreeding depression in the wild. Heredity 1999, 83, 260–270. [Google Scholar] [CrossRef]
  14. Escoda, L.; González-Esteban, J.; Gómez, A.; Castresana, J. Using relatedness networks to infer contemporary dispersal: Application to the endangered mammal Galemys pyrenaicus. Mol. Ecol. 2017, 26, 3343–3357. [Google Scholar] [CrossRef] [PubMed]
  15. Adams, L.W. Urban wildlife ecology and conservation:A brief history of the discipline. Urban Ecosyst. 2005, 8, 139–156. [Google Scholar] [CrossRef]
  16. Goddard, M.A.; Dougill, A.J.; Benton, T.G. Scaling up from gardens: Biodiversity conservation in urban environments. Trends Ecol. Evol. 2010, 25, 90–98. [Google Scholar] [CrossRef]
  17. Munshi-South, J.; Zolnik, C.P.; Harris, S.E. Population genomics of the Anthropocene: Urbanization is negatively associated with genome-wide variation in white-footed mouse populations. Evol. Appl. 2016, 9, 546–564. [Google Scholar] [CrossRef]
  18. Holyoak, M.; Leibold, M.A.; Holt, R.D. Metacommunities: Spatial Dynamics and Ecological Communities; University of Chicago Press: Chicago, IL, USA, 2005. [Google Scholar]
  19. Fraser, D.L.; Ironside, K.; Wayne, R.K.; Boydston, E.E. Connectivity of mule deer (Odocoileus hemionus) populations in a highly fragmented urban landscape. Landsc. Ecol. 2019, 34, 1097–1115. [Google Scholar] [CrossRef]
  20. Garrott, R.A. Effective management of free-ranging ungulate populations using contraception. Wildl. Soc. Bull. 1995, 23, 445–452. [Google Scholar]
  21. Hepenstrick, D.; Thiel, D.; Holderegger, R.; Gugerli, F. Genetic discontinuities in roe deer (Capreolus capreolus) coincide with fenced transportation infrastructure. Basic Appl. Ecol. 2012, 13, 631–638. [Google Scholar] [CrossRef]
  22. Lecis, R.; Dondina, O.; Orioli, V.; Biosa, D.; Canu, A.; Fabbri, G.; Iacolina, L.; Cossu, A.; Bani, L.; Apollonio, M.; et al. Main roads and land cover shaped the genetic structure of a Mediterranean island wild boar population. Ecol. Evol. 2022, 12, e8804. [Google Scholar] [CrossRef]
  23. Saito, M.; Koike, F.; Mettke-Hofmann, C. Distribution of Wild Mammal Assemblages along an Urban–Rural–Forest Landscape Gradient in Warm-Temperate East Asia. PLoS ONE 2013, 8, e65464. [Google Scholar] [CrossRef]
  24. Epps, C.W.; Palsbøll, P.J.; Wehausen, J.D.; Roderick, G.K.; Ramey, R.R.; McCullough, D.R. Highways block gene flow and cause a rapid decline in genetic diversity of desert bighorn sheep. Ecol. Lett. 2005, 8, 1029–1038. [Google Scholar] [CrossRef]
  25. Australian Bureau of Statistics. Data by Region: South East Queensland. 2025. Available online: https://dbr.abs.gov.au/ (accessed on 31 July 2024).
  26. Lawton, A.; Morrison, N. The loss of peri-urban agricultural land and the state-local tensions in managing its demise: The case of Greater Western Sydney, Australia. Land Use Policy 2022, 120, 106265. [Google Scholar] [CrossRef]
  27. Herbert, C.A.; Snape, M.A.; Wimpenny, C.E.; Coulson, G. Kangaroos in peri-urban areas: A fool’s paradise? Ecol. Manag. Restor. 2021, 22 (Suppl. S1), 167–175. [Google Scholar] [CrossRef]
  28. Hill, G. A Study of habitat preferences in the grey kangaroo. Wildl. Res. 1981, 8, 245–254. [Google Scholar] [CrossRef]
  29. Moore, B.D.; Coulson, G.; Way, S. Habitat selection by adult female eastern grey kangaroos. Wildl. Res. 2002, 29, 439–445. [Google Scholar] [CrossRef]
  30. Jaremovic, R.; Croft, D. Social organization of eastern grey kangaroos in southeastern New South Wales. II. Associations within mixed groups. Mammalia 1991, 55, 543–554. [Google Scholar] [CrossRef]
  31. Coghlan, B.A.; Seddon, J.M.; Best, E.C.; Thomson, V.A.; Goldizen, A.W. Evidence of male-biased dispersal in eastern grey kangaroos (Macropus giganteus). Aust. J. Zool. 2017, 64, 360–369. [Google Scholar] [CrossRef]
  32. Kirsch, J.; Poole, W. Taxonomy and distribution of the grey kangaroos, Macropus giganteus Shaw and Macropus fuliginosus (Desmarest), and their subspecies (Marsupialia: Macropodidae). Aust. J. Zool. 1972, 20, 315–339. [Google Scholar] [CrossRef]
  33. Coulson, G.; Cripps, J.K.; Wilson, M.E. Hopping down the main street: Eastern grey kangaroos at home in an urban matrix. Animals 2014, 4, 272–291. [Google Scholar] [CrossRef]
  34. Brunton, E.A.; Srivastava, S.K.; Burnett, S. Spatial ecology of an urban eastern grey kangaroo (Macropus giganteus) population: Local decline driven by kangaroo–vehicle collisions. Wildl. Res. 2018, 45, 685–695. [Google Scholar] [CrossRef]
  35. Brunton, E.; Brunton, A.; Hohwieler, K.; Ogbourne, S.; Conroy, G. Spatial genetic structure and gene flow of the eastern grey kangaroo (Macropus giganteus), in a rapidly urbanising landscape. Glob. Ecol. Conserv. 2022, 38, e02273. [Google Scholar] [CrossRef]
  36. Queensland Government. State of the Environment Summary Report; Department of Environment and Science: Brisbane, Australia, 2020. [Google Scholar]
  37. Bureau of Meteorology. Monthly Climate Statistics—Canberra City. 2024. Available online: https://www.bom.gov.au/climate/averages/tables/cw_070282.shtml (accessed on 1 August 2024).
  38. Australian Capital Territory Government. Canberra Nature Park Reserve Management Plan; ACT Government: Canberra, Australia, 2021. [Google Scholar]
  39. Victorian Government. Data VIC—Open Data Portal. 2022. Available online: https://www.data.vic.gov.au/ (accessed on 9 March 2023).
  40. Queensland Government. Queensland Spatial Catalogue. 2022. Available online: https://qldspatial.information.qld.gov.au/catalogue/custom/index.page (accessed on 9 March 2023).
  41. Australian Capital Territory Government. Data ACT—Open Data Portal. 2018. Available online: https://www.data.act.gov.au/ (accessed on 9 March 2023).
  42. Kilian, A.; Wenzl, P.; Huttner, E.; Carling, J.; Xia, L.; Blois, H.; Caig, V.; Heller-Uszynska, K.; Jaccoud, D.; Uszynski, G.; et al. Diversity Arrays Technology: A Generic Genome Profiling Technology on Open Platforms. In Data Production and Analysis in Population Genomics: Methods and Protocols; Pompanon, F., Bonin, A., Eds.; Humana Press: Totowa, NJ, USA, 2012; pp. 67–89. [Google Scholar]
  43. Pew, J.; Muir, P.H.; Wang, J.; Frasier, T.R. related: An R package for analysing pairwise relatedness from codominant molecular markers. Mol. Ecol. Resour. 2015, 15, 557–561. [Google Scholar] [CrossRef]
  44. Gruber, B.; Unmack, P.J.; Berry, O.F.; Georges, A. dartr: An r package to facilitate analysis of SNP data generated from reduced representation genome sequencing. Mol. Ecol. Resour. 2018, 18, 691–699. [Google Scholar] [CrossRef] [PubMed]
  45. Hilborn, R.; Mangel, M. The Ecological Detective: Confronting Models with Data (MPB-28); Princeton University Press: Princeton, NJ, USA, 1997; Available online: http://www.jstor.org/stable/j.ctt24hqnx (accessed on 18 March 2023).
  46. Burnham, K.P.; Anderson, D.R. Model Selection and Multimodel Inference; Springer: New York, NY, USA, 2002. [Google Scholar]
  47. Johnson, J.B.; Omland, K.S. Model selection in ecology and evolution. Trends Ecol. Evol. 2004, 19, 101–108. [Google Scholar] [CrossRef]
  48. Anderson, D.R.; Burnham, K.P.; Gould, W.R.; Cheery, S. Concerns about finding effects that are actually spurious. Wildl. Soc. Bull. 2001, 29, 311–316. [Google Scholar]
  49. Johnson, D.H. The insignificance of statistical significance testing. J. Wildl. Manag. 1999, 63, 763. [Google Scholar] [CrossRef]
  50. Taylor, R.J. Foraging in the Eastern Grey Kangaroo and the Wallaroo. J. Anim. Ecol. 1984, 53, 65–74. [Google Scholar] [CrossRef]
  51. Carter, A.J.; Macdonald, S.L.; Thomson, V.A.; Goldizen, A.W. Structured association patterns and their energetic benefits in female eastern grey kangaroos, Macropus giganteus. Animal Behaviour. 2009, 77, 839–846. [Google Scholar] [CrossRef]
  52. Best, E.C.; Dwyer, R.G.; Seddon, J.M.; Goldizen, A.W. Associations are more strongly correlated with space use than kinship in female eastern grey kangaroos. Anim. Behav. 2014, 89, 1–10. [Google Scholar] [CrossRef]
  53. Best, E.C.; Seddon, J.M.; Dwyer, R.G.; Goldizen, A.W. Social preference influences female community structure in a population of wild eastern grey kangaroos. Anim. Behav. 2013, 86, 1031–1040. [Google Scholar] [CrossRef]
  54. Montana, L.; King, W.J.; Coulson, G.; Garant, D.; Festa-Bianchet, M. Large eastern grey kangaroo males are dominant but do not monopolize matings. Behav. Ecol. Sociobiol. 2022, 76, 78. [Google Scholar] [CrossRef]
  55. Henderson, T.; Vernes, K.; Körtner, G.; Rajaratnam, R. Using GPS Technology to Understand Spatial and Temporal Activity of Kangaroos in a Peri-Urban Environment. Animals 2018, 8, 97. [Google Scholar] [CrossRef]
  56. Jarman, P.; Taylor, R. Ranging of Eastern Grey Kangaroos and Wallaroos on a New England Pastoral Property. Wildl. Res. 1983, 10, 33–38. [Google Scholar] [CrossRef]
  57. Neaves, L.E.; Roberts, M.W.; Herbert, C.A.; Eldridge, M.D.B. Limited sex bias in the fine-scale spatial genetic structure of the eastern grey kangaroo and its relationship to habitat. Aust. J. Zool. 2017, 65, 33. [Google Scholar] [CrossRef]
  58. King, W.J.; Garant, D.; Festa-Bianchet, M. Mother–offspring distances reflect sex differences in fine-scale genetic structure of eastern grey kangaroos. Ecol. Evol. 2015, 5, 2084–2094. [Google Scholar] [CrossRef]
  59. Coghlan, B.A.; Goldizen, A.W.; Thomson, V.A.; Seddon, J.M.; Janke, A. Phylogeography of eastern grey kangaroos, Macropus giganteus, suggests a mesic refugium in eastern Australia. PLoS ONE 2015, 10, e0128160. [Google Scholar] [CrossRef] [PubMed]
  60. Brunton, E.A.; Srivastava, S.K.; Schoeman, D.S.; Burnett, S. Quantifying trends and predictors of decline in eastern grey kangaroo (Macropus giganteus) populations in a rapidly urbanising landscape. Pac. Conserv. Biol. 2018, 24, 63–73. [Google Scholar] [CrossRef]
  61. Garner, A.; Rachlow, J.L.; Hicks, J.F. Patterns of Genetic Diversity and Its Loss in Mammalian Populations. Conserv. Biol. 2005, 19, 1215–1221. [Google Scholar] [CrossRef]
  62. Bond, A.R.F.; Jones, D.N. Roads and macropods: Interactions and implications. Aust. Mammal. 2014, 36, 14. [Google Scholar] [CrossRef]
  63. Ramp, D. Roads as drivers of change for macropodids. In Macropods: The Biology of Kangaroos, Wallabies, Rat-Kangaroos; Coulson, G., Eldridge, M., Eds.; CSIRO: Melbourne, Australia, 2010; p. 279. [Google Scholar]
  64. Urbanek, C.; Conroy, G.; Leon, J.X.; Hohwieler, K.; Brunton, E. Roo-tine Obstacles: Uncovering the spatio-genetic barriers for Eastern Grey Kangaroos (Macropus giganteus) in an urbanising landscape. Landsc. Ecol. 2025, 40, 58. [Google Scholar] [CrossRef]
  65. Tilman, D.; May, R.M.; Lehman, C.L.; Nowak, M.A. Habitat destruction and the extinction debt. Nature 1994, 371, 65–66. [Google Scholar] [CrossRef]
  66. Landguth, E.L.; Cushman, S.A.; Schwartz, M.K.; McKelvey, K.S.; Murphy, M.; Luikart, G. Quantifying the lag time to detect barriers in landscape genetics. Mol. Ecol. 2010, 19, 4179–4191. [Google Scholar] [CrossRef] [PubMed]
  67. Hohwieler, K.R.; de Villiers, D.L.; Cristescu, R.H.; Frere, C.H. Genetic erosion detected in a specialist mammal living in a fast-developing environment. Conserv. Sci. Pract. 2022, 4, e12738. [Google Scholar] [CrossRef]
  68. Hufschmid, J.; Beveridge, I.; Coulson, G.; Gould, J. Bone fluoride concentrations of eastern grey kangaroos (Macropus giganteus) resident near an aluminium smelter in south-eastern Australia. Ecotoxicology 2011, 20, 1378–1387. [Google Scholar] [CrossRef]
  69. Coulson, G.; Wilson, M.E. Implementing implants: Delivery efficiency, contraceptive efficacy and population outcomes in two overabundant kangaroo populations. Wildl. Res. 2023, 51, WR22170. [Google Scholar] [CrossRef]
Figure 1. Distribution of eastern grey kangaroo (Macropus giganteus) populations sampled in the study region across eastern Australia (bottom left image). Coloured boxes represent sampling locations across three geographic regions: (Sunshine Coast (QLD)—blue, Australian Capital Territory (ACT)—orange, Victoria (VIC)—yellow).
Urbansci 09 00257 g001
Figure 2. Regional comparisons of genetic parameters of eastern grey kangaroos in Australian Capital Territory (ACT), Queensland (QLD), and Victoria (VIC). RC: relatedness coefficient (a); AR: Allelic richness (b); FIS: inbreeding coefficient (c); HO: Observed heterozygosity(d).
Urbansci 09 00257 g002
Table 1. Genetic diversity, inbreeding, and relatedness coefficients for Macropus giganteus from urban and non-urban habitats in Australian Capital Territory (ACT) (n = 60), Queensland (QLD) (n = 146), and Victoria (VIC) (n = 34).
SiteRegionHabitatHoARFISRC
BuderimQLDurban0.1881.6170.0920.241
Mt Coolum QLDurban0.1571.5800.2110.188
Sippy DownsQLDurban0.2111.6530.0290.189
TewantinQLDurban0.2051.5960.0460.218
Twin WatersQLDurban0.1791.5870.0750.242
Anglesea VICurban0.181.7690.0590.092
Farrer RidgeACTurban0.2151.7910.0330.031
Gold CreekACTurban0.2061.7980.0730.033
South LawsonACTurban0.2041.8070.0860.02
Weston ParkACTurban0.2061.7840.0580.033
North LawsonACTurban0.2021.7750.0710.045
Mean
(Standard Deviation)
0.196
(0.018)
1.705
(0.097)
0.076
(0.049)
0.121
(0.094)
Chevallum QLDNon-urban0.1891.6510.1260.167
LandsboroughQLDNon-urban0.2101.6420.0380.205
NinderryQLDNon-urban0.1731.6270.1710.136
WeybaQLDNon-urban0.2131.6410.0120.172
ConondaleQLDNon-urban0.1811.6050.0910.297
PortlandVICNon-urban0.1721.70.0310.196
SerendipVICNon-urban0.181.7670.0750.125
Mean
(Standard Deviation)
0.188
(0.017)
1.662
(0.055)
0.078
(0.057)
0.185
(0.057)
n: number of individuals sampled; HO: Observed heterozygosity; AR: Allelic richness; FIS: inbreeding coefficient; RC: relatedness coefficient. Means and standard deviations are calculated for each category within each habitat type.
Table 2. Generalised linear model outputs showing significant immediate habitat predictors on genetic diversity and inbreeding estimates (HO, Observed heterozygosity; AR, Allelic richness; FIS, inbreeding; RC, relatedness) for eastern grey kangaroos (i.e., y ~ Boundary type + Restriction type + Percentage restriction + Region, family = Gamma (link = “log”). Note: only coefficients for significant predictors are indicated, * indicates most significant predictor where no predictors are significant (i.e., p < 0.05); full model outputs are provided in the Supplementary Materials (Tables S3–S6).
VariableEstimateStandard Errort Valuep Value
Model 1—RC
Region QLD1.8710.2497.502<0.001
Region VIC1.4340.2425.927<0.001
Model 2—AR
Region QLD0.1160.014−8.110<0.001
Model 3—HO
Boundary—Open0.2670.1152.3120.046
Restriction (%)0.0030.0012.2900.048
Region QLD−0.1960.063−3.1250.012
Region VIC−0.1660.061−2.7310.023
Model 4—FIS
Boundary—Open−1.6530.835−1.9800.0791 *
Table 3. Generalised linear model outputs showing significant surrounding habitat predictors on genetic diversity and inbreeding estimates (Ho, Observed heterozygosity; AR, Allelic richness; FIS, inbreeding; RC, relatedness.) for eastern grey kangaroos (i.e., y ~ Highways + Built area + Remnant vegetation area + Access type + Region, family = Gamma (link = “log”). ACT = Australian Capital Territory, QLD = Queensland, VIC = Victoria. Note: only coefficients for significant predictors are indicated; full model outputs are provided in the Supplementary Materials (Tables S7–S10).
VariableEstimateStandard Errort Valuep Value
Model 1—RC
Region QLD2.2550.3236.981<0.001
Region VIC1.7190.2955.831<0.001
Model 2—AR
Region QLD−0.1180.019−6.178<0.001
Region VIC−0.0440.017−2.527<0.001
Model 3—HO
Access—Yes0.1280.0432.9680.013
Region VIC−0.2020.074−2.7300.020
Model 4—FIS
Access—Yes−0.9250.328−2.8180.017
Disclaimer/Publisher’s Note: The statements, opinions and data contained in all publications are solely those of the individual author(s) and contributor(s) and not of MDPI and/or the editor(s). MDPI and/or the editor(s) disclaim responsibility for any injury to people or property resulting from any ideas, methods, instructions or products referred to in the content.

