Article

Mapping Illegal Dumping Sites in a Low-Resource Region Using GIS and Remote Sensing: The Case of Blantyre City, Malawi

by
Richard Lizwe Steven Mvula
1,2,*,
Yanjanani Miston Banda
3,
Mike Allan Njunju
3,
Harineck Mayamiko Tholo
3,
Chikondi Chisenga
3,
Jabulani Nyengere
3,
John Njalam’mano
4,
Fasil Ejigu Eregno
2 and
Wilfred Kadewa
1
1
Department of Energy, Ndata School of Climate and Earth Sciences, Malawi University of Science and Technology, Limbe P.O. Box 5196, Malawi
2
Department of Building, Energy and Material Technology, Faculty of Engineering Science and Technology, UiT The Arctic University of Norway, Postboks 385, 8514 Narvik, Norway
3
Department of Earth Sciences, Malawi University of Science and Technology, Limbe P.O. Box 5196, Malawi
4
Department of Water Resources, Ndata School of Climate and Earth Sciences, Malawi University of Science and Technology, Limbe P.O. Box 5196, Malawi
*
Author to whom correspondence should be addressed.
Urban Sci. 2025, 9(7), 254; https://doi.org/10.3390/urbansci9070254
Submission received: 9 May 2025 / Revised: 11 June 2025 / Accepted: 26 June 2025 / Published: 2 July 2025

Abstract

Malawi’s Blantyre City faces escalating waste management challenges due to increased urbanization and inadequate waste collection services. This research utilized remote sensing (RS) and geographic information system (GIS) techniques to map potential illegal dump sites (PIDSs). MODIS and Sentinel-5P satellite imagery and GPS locations of dumpsites were used to extract environmental and spatial variables, including land surface temperature (LST), the enhanced vegetation index (EVI), Formaldehyde (HCHO), and distances from highways, rivers, and official dumps. An analytical hierarchical process (AHP) pairwise comparison matrix was used to assign weights for the six-factor variables. Further, fuzzy logic was applied, and weighted overlay analysis was used to generate the PIDS map. The results indicated that 10.27% of the study area has a “very high” probability of illegal dumping, while only 2% exhibited a “very low” probability. Validation with field data showed that the GIS and RS were effective, as about 89% of the illegal dumping sites were identified. Zonal statistics identified rivers as the most significant contributor to PIDS identification. The findings of this study underscore the significance of mapping PIDS in low-resource regions like Blantyre, Malawi, where inadequate waste management and illegal dumping are prevalent. Future studies should consider additional factors and account for seasonal variations.

1. Introduction

Solid waste management poses a significant global challenge that warrants urgent attention. Annually, global waste generation reaches 2 billion tons, with Sub-Saharan Africa contributing 174 million tons, a figure expected to triple by 2050 [1]. In Sub-Saharan African countries like Malawi, waste management presents a considerable challenge because the volume of waste generated exceeds the government’s capacity to manage it effectively [2]. Reference [3] demonstrates that insufficient waste management, characterized by inadequate landfill facilities and low waste collection rates, has resulted in illegal disposal sites. Waste is frequently disposed of in vacant spaces, along roadways, rivers, public and private properties, and other unregulated locations [4].
Multiple factors influence the prevalence of illegal dumpsites, including economic considerations [5], social dynamics [6], and policy and regulation [7]. A combination of factors contributes to the emergence of unlawful disposal sites [8]. Economic factors, including low incomes, may compel individuals to engage in illegal dumping due to the prohibitive costs associated with waste management services [9]. This issue is especially evident in informal settlements, where high population density and inadequate facilities exacerbate the challenge of inadequate sanitation [10], forcing residents to dispose of waste in unauthorized areas. Additionally, according to [11], community practices and public awareness are essential in mitigating unlawful disposal. Individuals who lack awareness of the consequences of illicit dumping are more likely to participate in unauthorized waste dumping without regard for its effects [12]. Reference [13] reports that inadequate policies and regulations facilitate illegal waste dumping by indirectly incentivizing informal city dwellers to engage in unlawful waste disposal, following the minimal repercussions associated with such behavior.
Illegal waste disposal has a profoundly negative impact on human health, wildlife, and ecological systems. Illegal dumpsites have a considerable impact on water [13], air [14], and soil [15]. Waste contaminants infiltrate groundwater sources, leading to water pollution and posing risks to human health [16]. Reference [17] demonstrates that the open burning of waste at illegal dumping sites emits harmful atmospheric pollutants, including greenhouse gases. The emission of gases at disposal sites, including methane, carbon dioxide, and hydrogen sulfide, contributes to environmental pollution [18]. Illegal waste disposal contaminates soil with heavy metals and other pollutants, adversely affecting soil health [19]. The reclamation and rehabilitation of illegal dumpsites entail significant economic costs due to land degradation and the high volume of illegal dumpsites requiring removal [20]. Illegal dumpsites have considerable adverse effects on human health, serving as breeding grounds for rodents and vectors that facilitate the transmission of diseases such as cholera, malaria, leptospirosis, and typhoid fever [21,22]. Illegal dumping harms both wild and domestic animals by polluting their environments, spreading diseases, and damaging their natural habitats [23]. To mitigate the negative impacts of these sites, it is essential to understand their locations and extent.
Mapping dumpsites has been crucial in both developed and developing countries. The status of dumpsites [24], the suitability analysis of dumpsites [25], the correlation between dumpsites and health [26], and frequently disposed items [27] are emphasized in spatial dumpsite mapping research. According to [28], traditional and modern GIS methodologies employed in dump site studies provide critical visualizations to support decision-making. The study in [29], conducted in India, used multi-criteria GIS analysis for mapping dumpsites. Moreover, [30] mapped legal dumpsites in Malaysia, focusing on high-density areas. Similar spatial mapping of legal and illegal dumpsites is also reported in Asia [31], Europe [32], and North America [33]. Developed countries [34] dominate these studies, with a lesser focus on developing countries, such as Malawi. Reference [13] reports that research on spatial dumpsite analysis is focused on identifying potential alternative legal dumpsites. According to [35], mapping dumpsites must also focus on illegal dumpsites in the cities and surrounding townships.
Against this background, the current study aims to conduct a spatial analysis to identify illegal dumpsites in southern Malawi. The main objective is to assess the illegal dumpsites and the factors influencing their siting. This study provides crucial information about illegal dumpsites for sustainable waste management in cities, particularly in the context of the Green City Agenda.

2. Materials and Methods

2.1. Study Area

Blantyre City, situated at 15.7880° S and 35.0133° E in southern Malawi (Figure 1), serves as the commercial capital and has an estimated population of approximately 800,264 people [36]. The city’s temperature ranges from 13.3 °C to 32.3 °C, while precipitation fluctuates between 6 mm and 358 mm. The people reside in various population centers such as townships and villages. According to [14], over 70% of the population resides in informal settlements with limited access to essential services. The region has one designated legal dumpsite, Mzedi, which serves merely 10% of the population. Overpopulation and inadequate infrastructure exacerbate illegal dumping practices in the city [37].

2.2. Data Collection

2.2.1. Vector Data

A dataset of rivers and roads for the study area was obtained from OpenStreetMap using the QuickOSM plugin in QGIS. Major rivers and streams within the study area were selected, and the “Euclidean Distance” tool in ArcMap generated a distance layer from these features. Similarly, distances from highways were computed from the road dataset. In addition, a field survey was conducted to identify the existing locations of the dump sites within the study area. For a waste pile to be classified as an illegal disposal site, it must cover an area of at least 10 square meters, rather than the previously established 1 square meter, as noted by [34]. Additional factors considered include the types of waste present, the distance from nearby households, the estimated age of the dumpsite, and any recorded presence of animals. The location was recorded using a Garmin GPSMAP 64. The data were entered in Google Sheets and imported into ArcMap to generate a shapefile using the “Display XY Data” tool. The methodological framework in Figure 2 outlines the key steps followed in this study.

2.2.2. Satellite Imagery

Remote sensing data were used to identify potential illegal dump sites (PIDSs) by integrating satellite-derived environmental indicators. Land surface temperature (LST) data were obtained from the MOD21A1N MODIS product, while enhanced vegetation index (EVI) data were sourced from the MOD13Q1 MODIS product, as referenced in [38]. Both datasets were averaged for the summer season (November 2023 to April 2024) (Table 1) using Google Earth Engine [39]. Formaldehyde (HCHO) concentrations were derived from Sentinel-5P satellite products, selected for their higher spatial resolution compared to MODIS HCHO products. The image was resampled to a 30 m resolution. HCHO values were also averaged over the same period. To calculate PIDS, LST, EVI, and HCHO, distances from dumps, rivers, and roads were correlated. An overview of the sources of satellite images, resolutions, and temporal parameters is presented in Table 1.

2.3. Data Analysis

2.3.1. Fuzzification of Variables

This study utilized six variables related to PIDS identification, such as LST, EVI, HCHO, distance to legal dumping sites, distance to highways, and distance to rivers for Fuzzy analysis in ArcGIS 10.8. All six variables were transformed into fuzzy layers by applying the linear fuzzy function, which assigns values between 0 and 1 based on the membership degree to a particular class [40]. Places fully in the range of PIDS features received a membership of 1, and places without overlap were assigned a membership of 0 [41]. A linear function requires assigning a minimum and a maximum value to ensure that a positive relationship corresponds to increasing values, thereby increasing the likelihood of PIDSs, and an inverse (negative) relationship implies low values [42]. For the current study, positive linear functions were applied with LST, HCHO, and distance to permitted dumps, while negative linear functions were used for the EVI, road and river distances (Table 2).

2.3.2. Application of Analytical Hierarchy Process (AHP)

This study used an AHP analysis to construct a pairwise comparison matrix (PCM) and a 1 to 9 factor criteria score scale (Table 3). This study questioned five experts, two environmentalists, a hydrogeologist, and two geospatial analysts, using questionnaires to determine the relative importance of variables determining illegal dumping sites. AHP integrates multiple factors and preferences into a final ranking of options to examine judgment consistency [44,49]. In addition, the consistency ratio (CR) assessed PCM experts’ subjectivity. Equation (1) calculated the consistency index (CI). A CR of less than 10% indicated acceptable consistency, and a CR above 10% required revision [50]. The CI assesses experts’ logical inconsistency via pairwise criterion comparisons [51,52]:
C I = ( λ m n ) ( n 1 )
where CI signifies the consistency index, λm denotes the principal eigenvalue of the pairwise comparison matrix, and n represents the matrix’s order. The calculation for CR is presented in Equation (2):
C R = C I R I < 0.1

2.3.3. Weighted Summation (Identification of Likelihood of Occurrence for PIDSs)

Based on the weights obtained from the PCM, an overlay analysis was conducted in ArcGIS 10.8 using the weighted sum tool. This tool was applied to integrate the fuzzified layers and their corresponding weights, generating a raster with nine classes. The output raster was then reclassified into five categories using the equal interval technique. The hierarchy of the classes includes very high (5), high (4), moderate (3), low (2), and very low (1). The equal interval method is the most effective approach for identifying areas with differing probabilities of illegal dumping [45,46]. After classification, the data underwent refinement, leading to the extraction of PIDSs. An intersect tool was employed to select polygons with different assigned classes and validate them against field-surveyed dump sites [47]. The refining and extraction of PIDSs is presented in Table 4.

2.3.4. Validation of PIDS

The data on known locations of illegal dump sites, collected through field surveys within the study area, were overlaid with the PIDS map for validation. Then, using the “intersect” tool in ArcMap, the number of actual illegal dump sites falling within each PIDS class was quantified.

2.3.5. Zonal Statistics for the Six Variables

The contribution of each criterion to each PIDS class was computed using zonal statistics. Zonal statistics are essential in explaining the relative relevance of each variable in an analysis. Zonal statistics were conducted on the six variables employed in this study. The highest mean values mainly influenced the mapped PIDS results [48].

3. Results

3.1. Standardizing Variables (Interpolation and Fuzzification)

Figure 3 presents the raster layers from Euclidean distance calculations for the three vector datasets (rivers, highways, and Mzedi dump site). The results of the interpolated indices are exhibited in Figure 4. The results for the fuzzification of all six layers, prepared for integration, are displayed in Figure 5.

3.2. Weights from the Analytical Hierarchy Process (AHP)

The pairwise comparison matrix consistency ratio obtained a value of 9%, thus being within the acceptable range [48,50]. The results of the pairwise comparison matrix are displayed in Table 5. Among the factor criteria of interest, proximity to an authorized dump site was found to make a more significant contribution to identifying PIDS (Table 5), with LST making the least significant contribution.

3.3. Mapping PIDS Likelihood

Figure 6 presents the spatial distribution of illegal dumping likelihood across Blantyre City. Areas highlighted in brown represent regions with “very high” risk (10.27% of study area), orange indicates “high” probability (23.78%), yellow shows “moderate” potential (40%), light yellow marks “low” risk, and cream color signifies a “very low” possibility (2%). Figure 7 presents these areas in square kilometers. The very high class is in the eastern and northwestern parts of the study area. They encompass six residential centers and 39.80 km of river network. On one hand, high-probability results are observed, with approximately 46% (17 out of 37) of population points located near rivers. This zone is also located in the north and eastern parts of the city. The presence of rivers and highways in the very high and high zones explains the likelihood of PIDSs being present. The results indicate that approximately 70.2 km of river network and 11 population centers fall within the “moderate” class. The region has a denser road network (25 km). In contrast, the “low” class contains only three population locations and approximately 23 km of river network, while the very low class has no population centers or rivers.

3.4. PIDS Validation

Out of the 333 points representing actual illegal dump sites (IDSs) in Blantyre City collected in the field, 37 points are in “very high” PIDS classes, 105 points intersect with the “high” PIDS class, and 156 points fall within the “moderate” class. Moreover, 35 of them intersect with the “low” PIDS class. Yet, none of the points intersect with the “very low” PIDS class, as shown on the map in Figure 8 and summarized in Table 6. The cumulative percentage of points falling within the identified PIDSs (the “very high,” “high,” and “moderate” classes) is 89.49%.

3.5. Significance of Six Variable Contributions to PIDS Mapping

The changes in fuzzy membership grades for each criterion in the respective PIDS classes are represented in a bar graph in Figure 9. Proximity to rivers has the highest membership grades, ranging from 0.92 in the “very high” class to 0.76 in the “low” class. Proximity to highways is the second factor with the highest contribution across all classes, ranging from the “very high” class (0.85) to the “very low” class (0.39). Proximity to a legal dump site and HCHO have similar high membership grades in the “very high” (0.78 and 0.72, respectively) and the “high” class. Still, their grades show a fluctuating pattern in the “moderate”, the “low,” and the “very low” classes (Figure 9). Conversely, LST and the EVI are the least effective factors in the study area, with membership grades ranging from 0.62 to 0.12 and from 0.60 to 0.33, respectively, ranging from the “very high” to the “very low” class.

4. Discussion

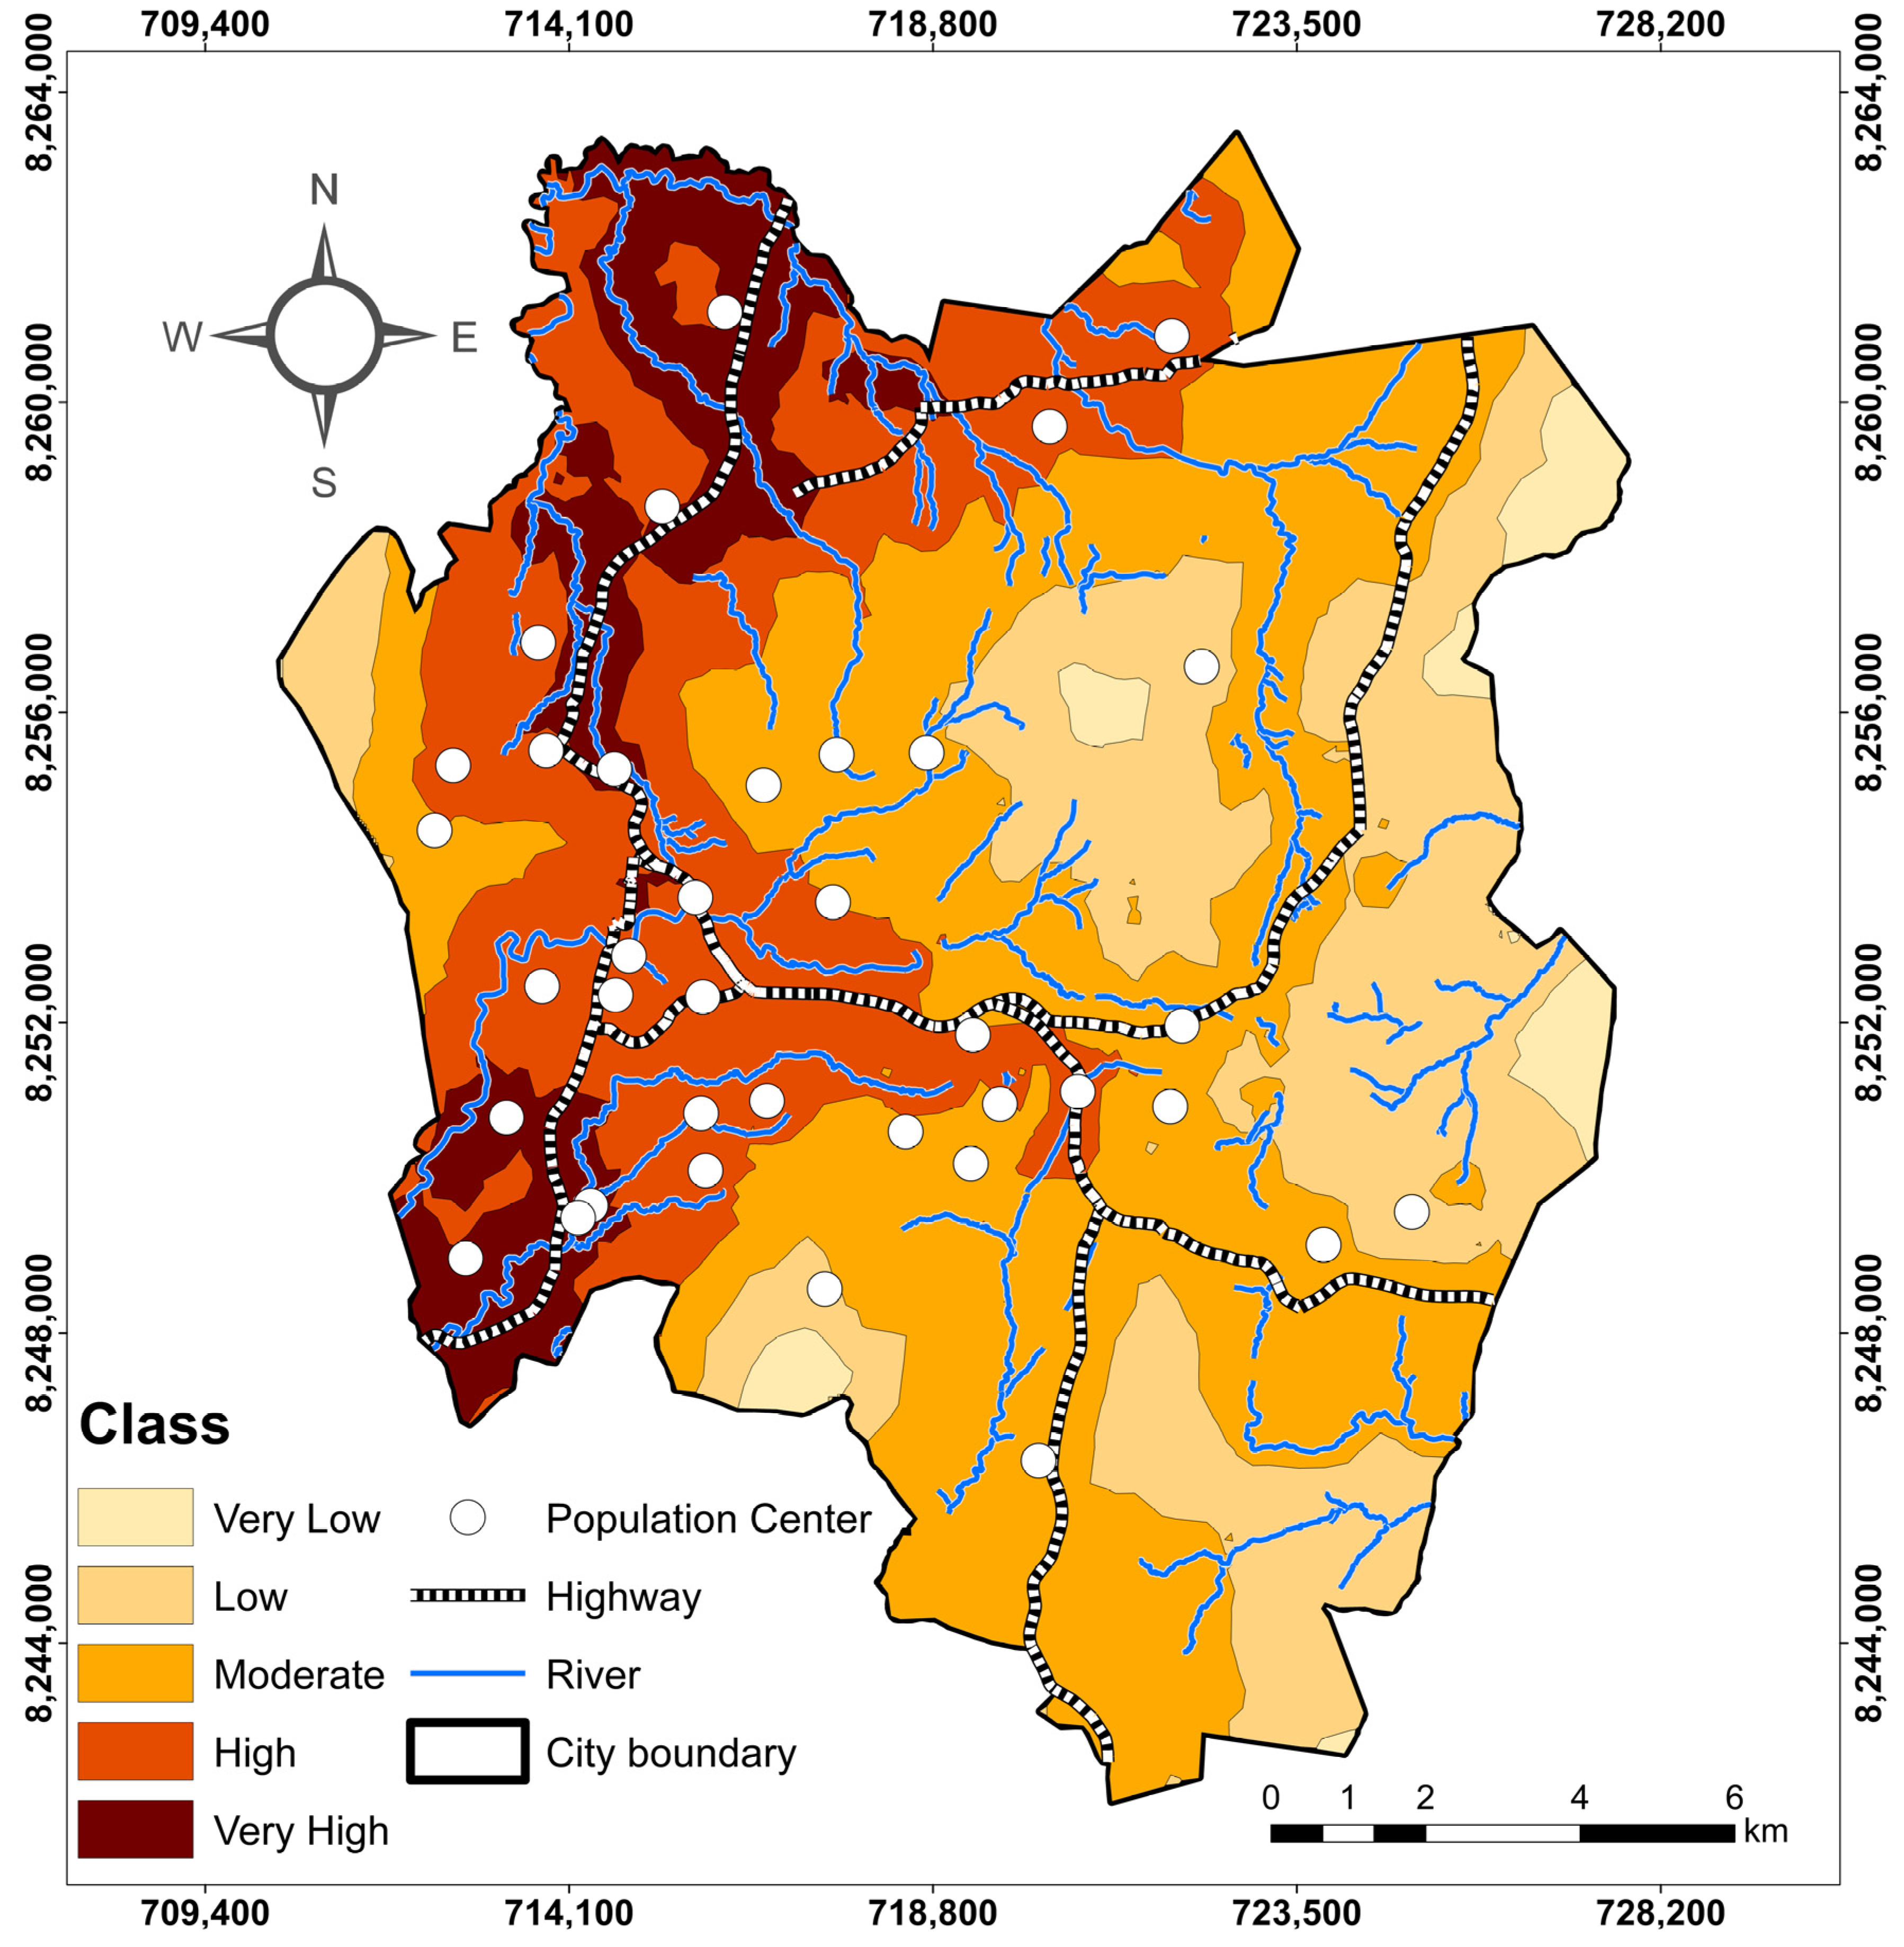
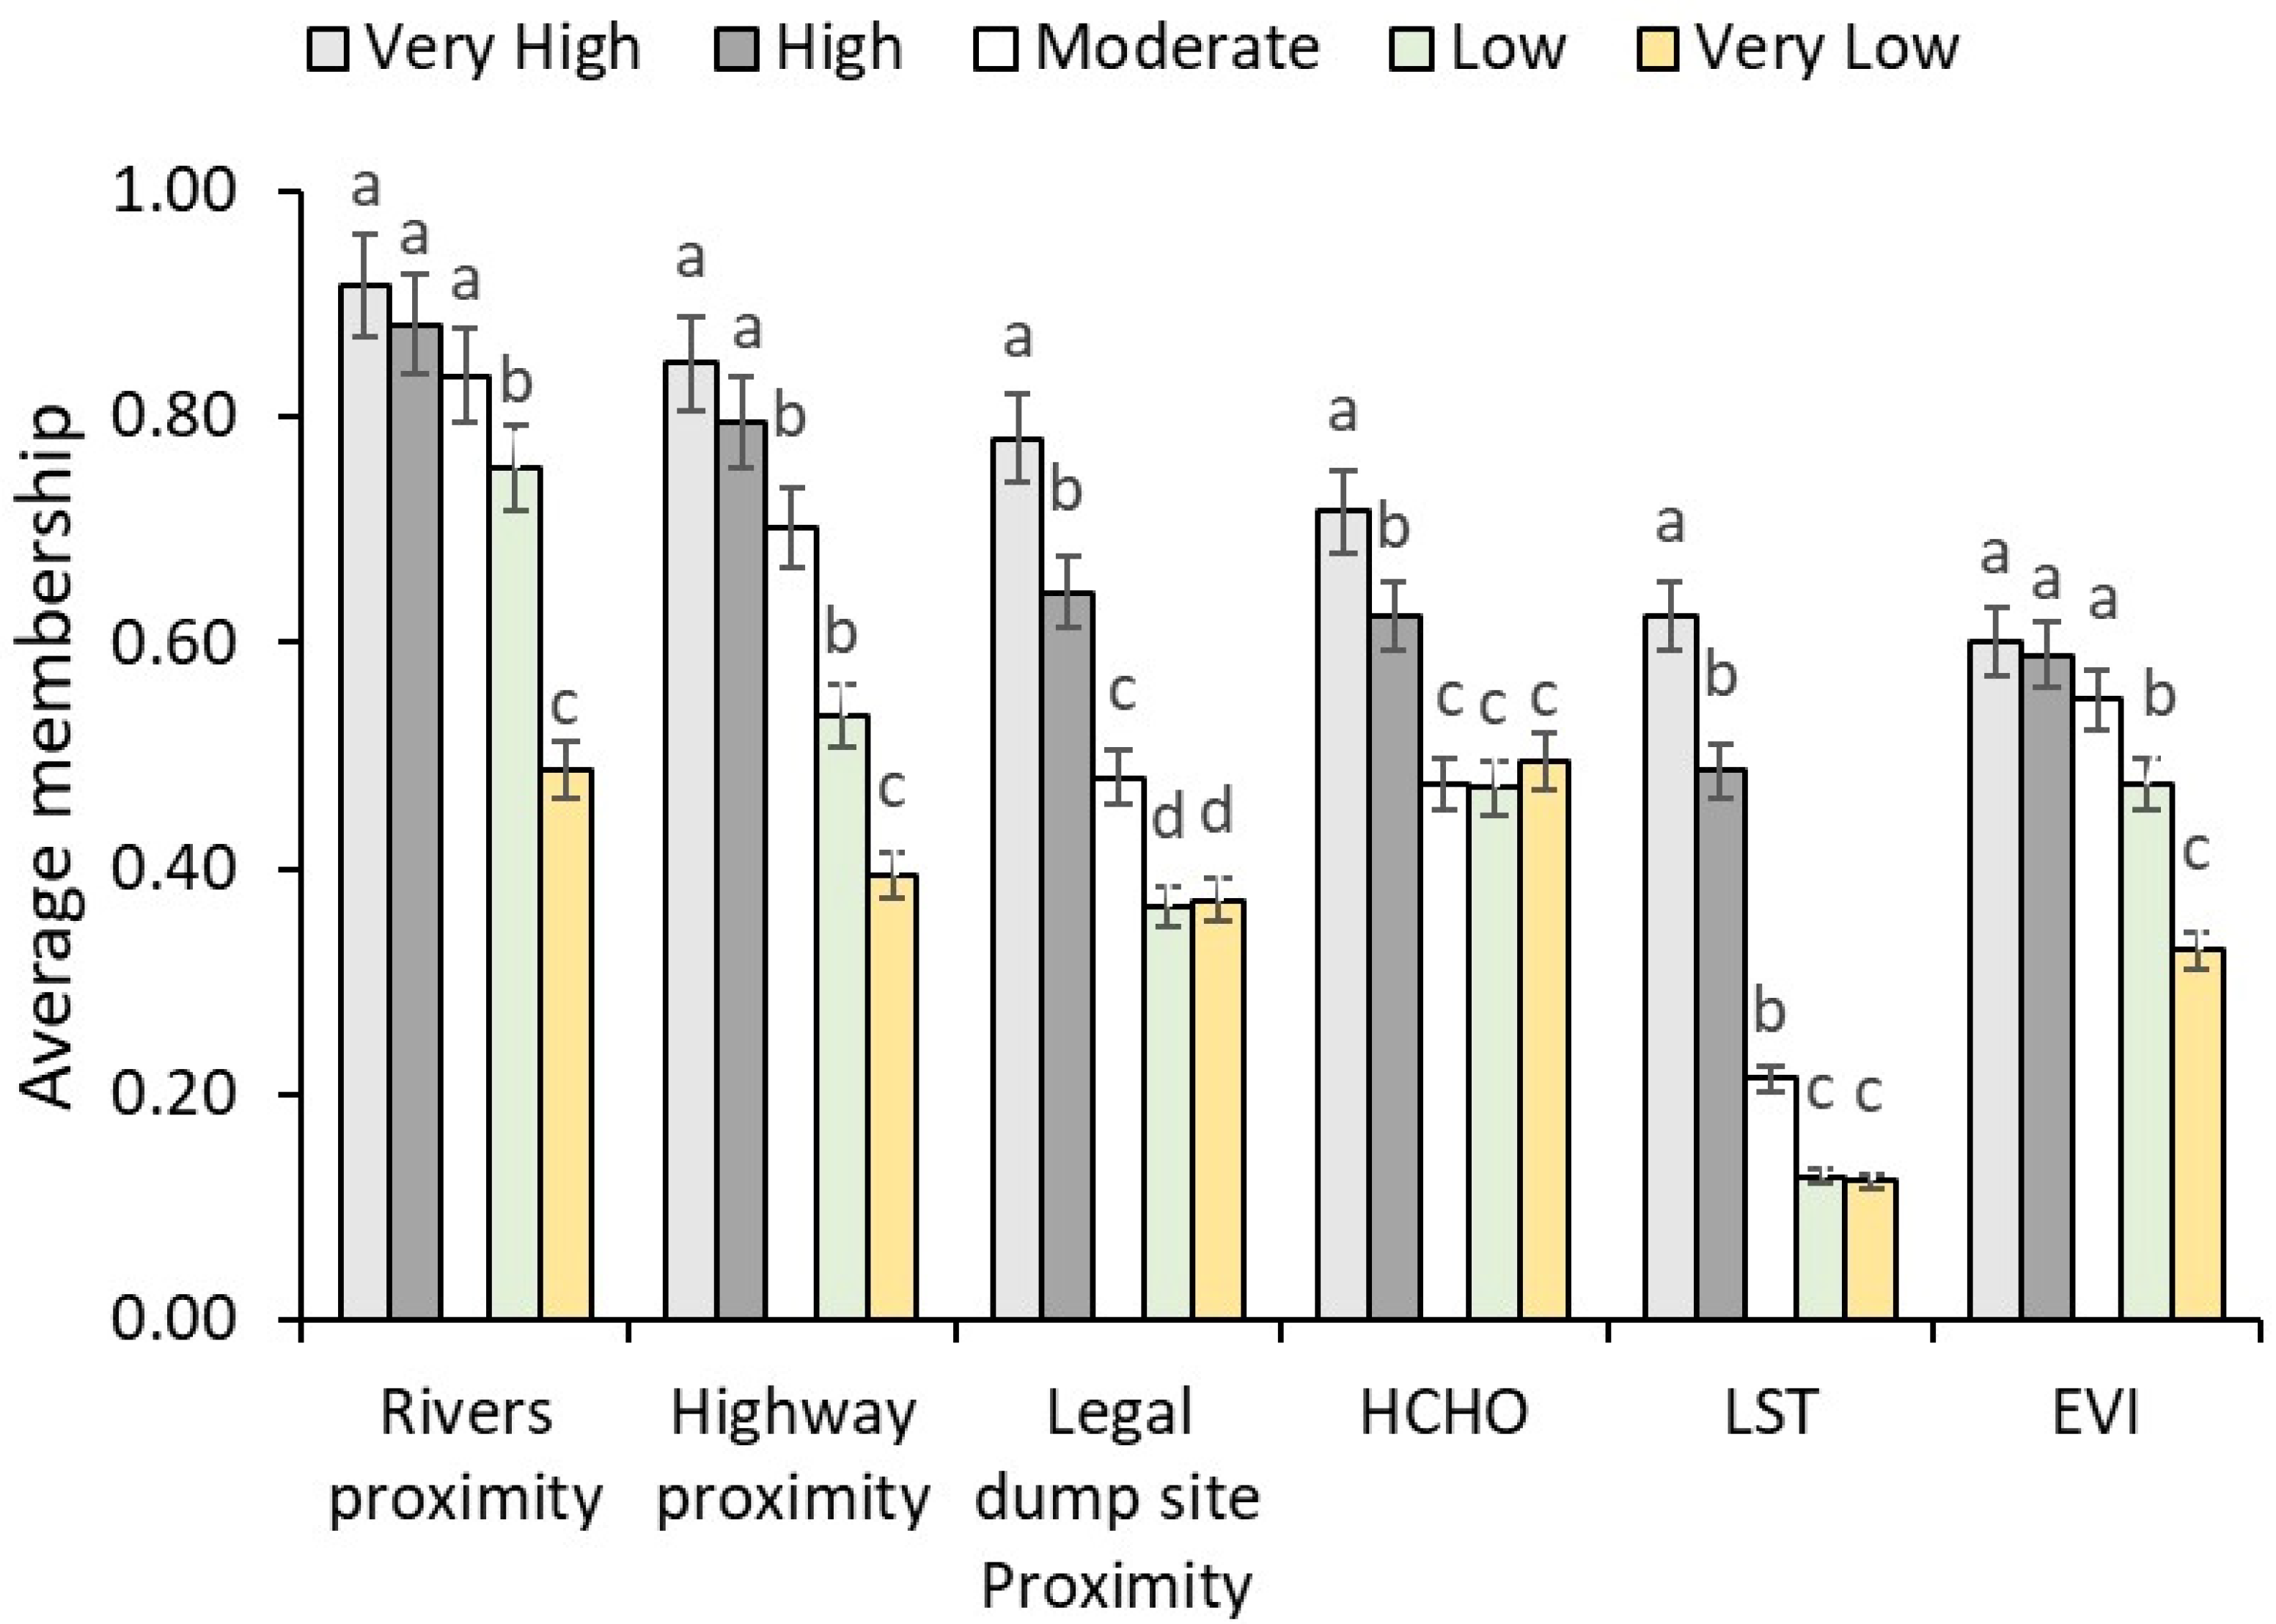
The observation that proximity to authorized dump sites significantly influences illegal dumping (Figure 9) aligns with prior research indicating that the convenience and reduced transportation costs associated with nearby legal facilities can inadvertently encourage illicit waste disposal [47]. This suggests that while authorized sites aim to centralize waste management, their presence can sometimes create “hot zones” for illegal waste disposal. Conversely, LST was found to have a lesser impact in this context, likely because its prominence as an indicator of environmental concern, particularly concerning gas release, is more pronounced in large, established landfills rather than the typically smaller, more dispersed sites often associated with illegal dumping [53].
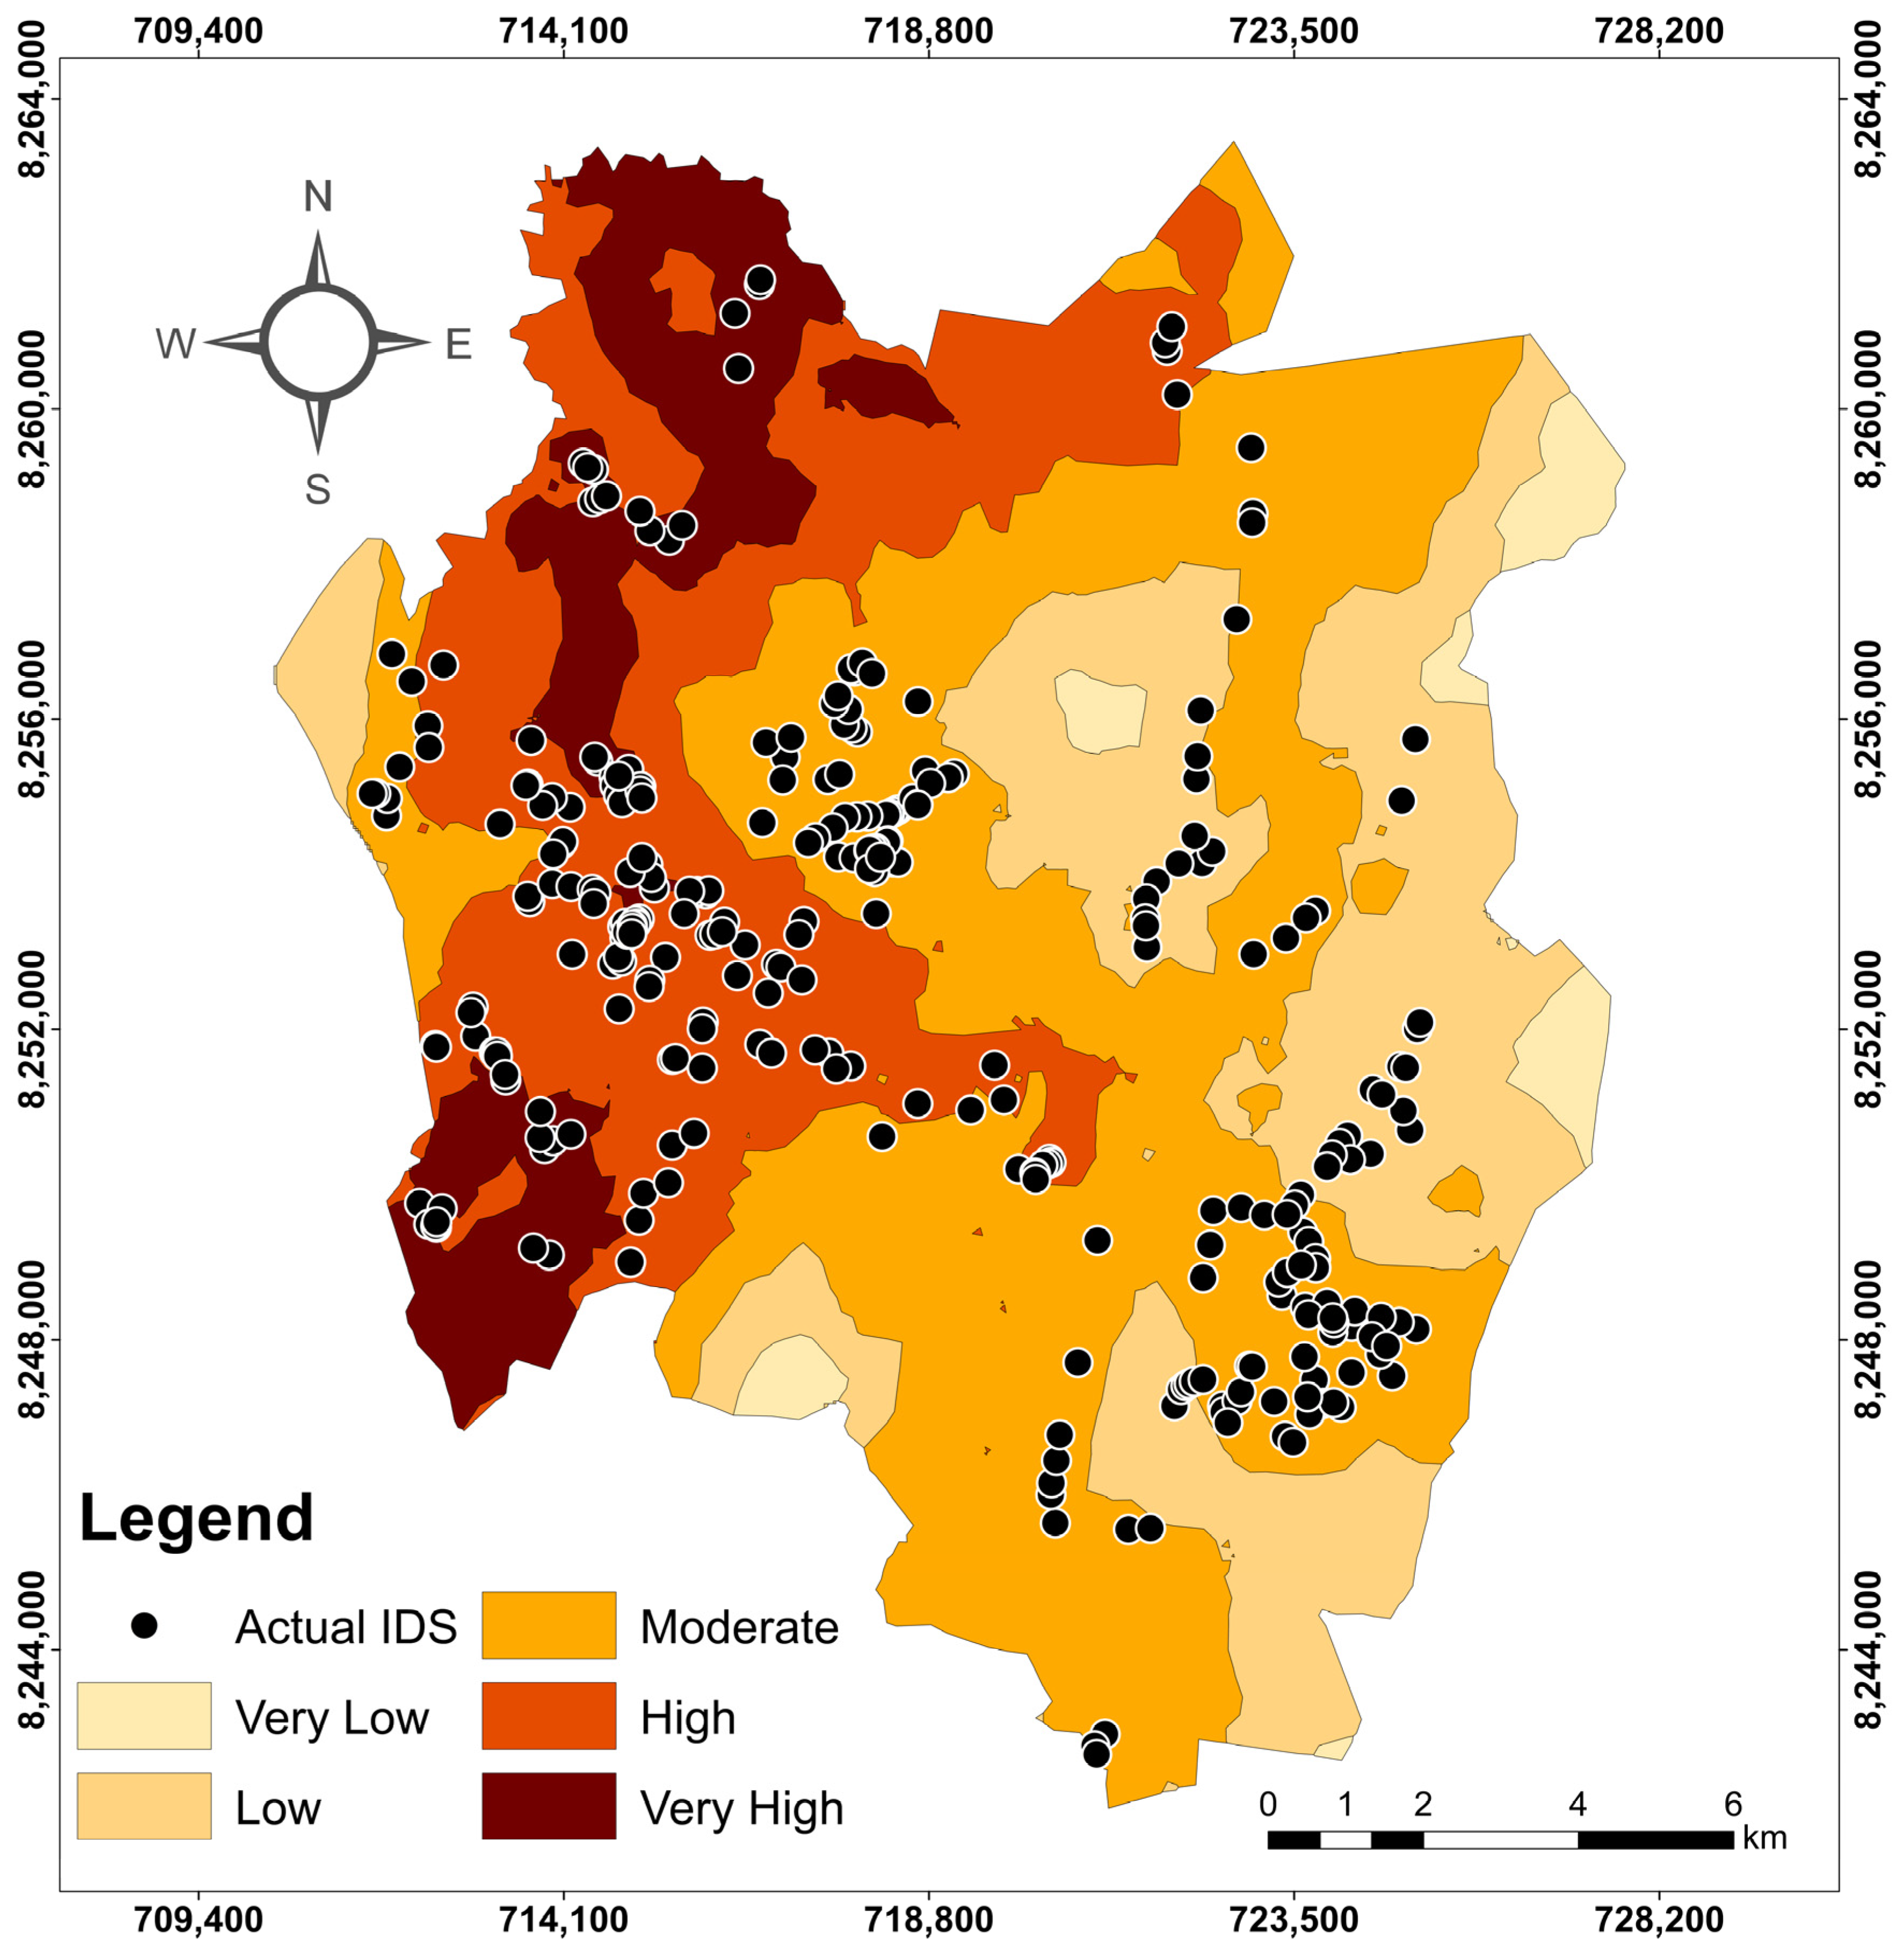
Prior studies consistently demonstrate that the closeness of rivers and highways significantly contributes to illegal dumping [31,47,54]. This corresponds with observations of areas with very high and high probabilities of illegal dumping, which are directly associated with dense networks of rivers and roadways. Field surveys provide additional evidence for this phenomenon, revealing that many unlawful dump sites are near water bodies. These regions are typically defined as informal settlements that lack sufficient waste management infrastructure, including a shortage of collection centers and low collection rates [55]. These settlements often do not receive regular waste management services from the city council, which worsens the issue.
In contrast, regions identified as having a minimal likelihood of illegal dumping generally correspond to formal, affluent neighborhoods. These areas typically experience adequate waste collection rates and are not susceptible to illegal dumping. Accessibility is a significant factor, as indicated by the moderate class of dumping probability. Although it is not as critical as the presence of rivers and highways, ease of access through road networks can still promote illegal dumping activities. This aligns with findings from other studies that emphasize denser road networks as a significant factor in enhancing the likelihood of unlawful dumping [40,43].
Proximity to rivers emerged as the most influential variable in identifying PIDS, consistent with [55]. At the same time, proximity to highways emerged as the second most influential factor. This result is consistent with multiple previous studies [46,47,48], indicating that easy access via road networks plays a crucial role in selecting illegal dumping locations. The convenience of simply pulling over and offloading waste near a highway makes these areas attractive for illicit activities. Interestingly, this study also found that distances to legal dumpsites are essential in mapping illegal disposal sites. This discovery, however, contradicts the findings of [48], which concluded that the distance to a landfill was not a significant factor in mapping PIDSs. This discrepancy could be due to various reasons, such as differences in geographical context, the availability and accessibility of legal dumpsites in the respective study areas, or socioeconomic factors influencing waste disposal behaviors. This suggests that in the current study’s location, the presence or absence of nearby legal disposal options significantly impacts where illegal dumping occurs.
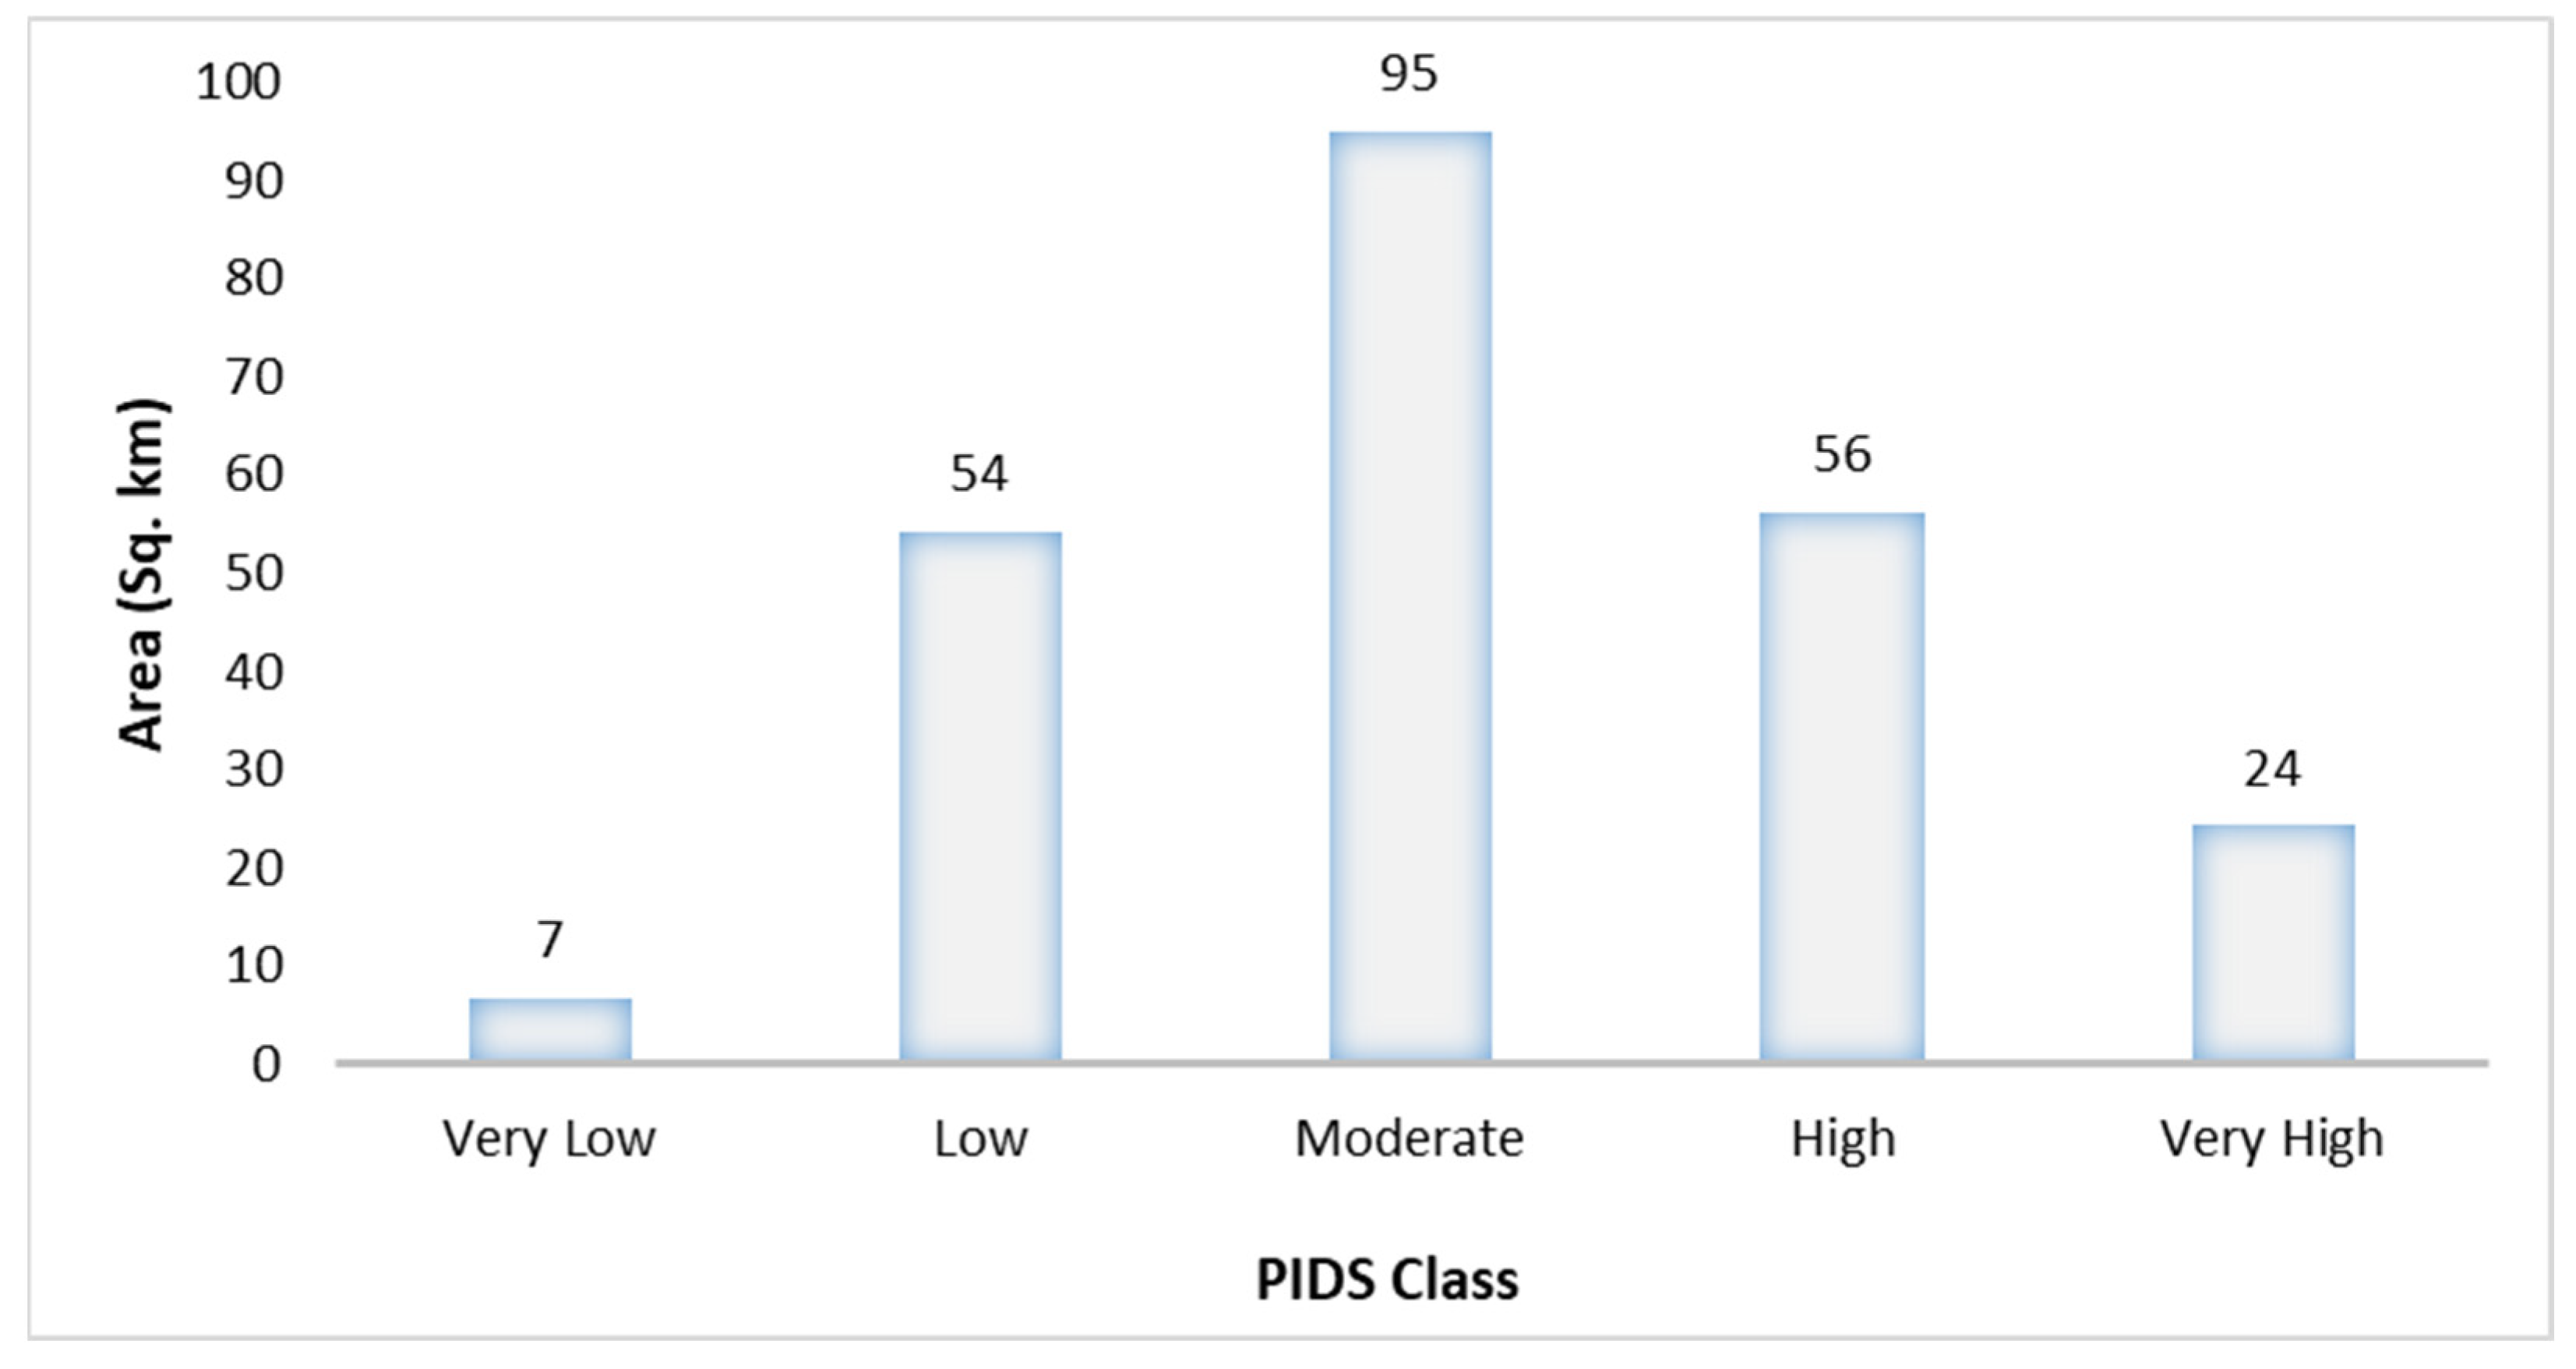
The predominance of points within the moderate classification, as opposed to the very high or high classifications, can be attributed to various factors, including land use patterns, population density [46], and household income levels [56] among other factors, which were not included in the current study. Their exclusion may limit the predictive accuracy of the current model, underscoring the significance of including socioeconomic and demographic factors in subsequent research to increase the predictability of illegal dumping sites.
Despite providing valuable insights into the factors influencing illegal dumping, the current study has several limitations. A notable gap arose regarding the influence of distance to legal dumpsites, with this study finding it to be an essential factor, directly contradicting previous research in [48]. This variance could stem from contextual differences, including geographical variations, the specific availability and accessibility of legal disposal options in the study area, or unique socioeconomic dynamics influencing waste disposal behaviors. Furthermore, this study’s scope regarding LST was limited, as its lesser impact in this context may be due to its primary relevance to larger, established landfills and their associated gas release, rather than the smaller, more dispersed illegal dumping sites examined. While field surveys provided valuable qualitative data, the quantitative extent of their contribution to the overall analysis and the potential for sampling bias were not explicitly detailed. Characterizing “informal settlements” and “formal, affluent neighborhoods” could also benefit from more precise definitions and a deeper exploration of the socioeconomic factors in these areas that contribute to varying waste disposal behaviors. Finally, while this study identified hot zones for illegal activities, it did not explicitly propose specific intervention strategies tailored to these zones. It also did not delve into the potential effectiveness of improved waste management services in the identified vulnerable areas.

5. Conclusion and Future Insights

This study utilized remote sensing and GIS techniques to identify potential illegal dump sites (PIDSs) within Blantyre City. Our findings demonstrate the critical role of proximity to rivers and highways as primary drivers of illegal dumping, aligning with previous research that highlights the convenience and reduced transportation costs associated with disposing waste near these features. The prevalence of illegal dumping in areas characterized by dense river networks and major roadways was further corroborated by field surveys, which consistently located unauthorized dump sites in these vicinities. This study also revealed a strong correlation between illegal dumping and informal settlements, which often lack adequate waste collection services and infrastructure. Conversely, formal, affluent neighborhoods demonstrated a significantly lower probability of illegal dumping, attributed to their robust waste management systems. While proximity to authorized dump sites was also identified as a significant factor, possibly due to convenience, land surface temperature (LST) had a lesser impact, likely because its influence is more pronounced in larger landfill environments. Despite the effectiveness of the employed methodologies, limitations such as the exclusive focus on visible dumps identified within moderate zones and the absence of seasonal considerations in data collection suggest areas for future research. Integrating additional variables, accounting for seasonal variations, and leveraging advanced techniques like Unmanned Aerial Vehicles (UAVs) could further refine the accuracy of PIDS detection models. Ultimately, the consistent identification of proximity to rivers and highways as key indicators provides valuable insights for developing targeted interventions to mitigate illegal dumping in urban environments.

Author Contributions

Conceptualization, R.L.S.M.; methodology, R.L.S.M., Y.M.B. and M.A.N.; software, Y.M.B. and M.A.N.; validation, R.L.S.M., H.M.T. and J.N. (Jabulani Nyengere); formal analysis, Y.M.B. and M.A.N.; investigation, R.L.S.M., Y.M.B. and M.A.N.; resources, W.K. and F.E.E.; data curation, Y.M.B. and M.A.N.; writing—original draft preparation, Y.M.B. and M.A.N.; writing—review and editing, R.L.S.M., C.C., H.M.T. and J.N. (Jabulani Nyengere), F.E.E., W.K. and J.N. (John Njalam’mano); visualization: Y.M.B. and M.A.N.; supervision, R.L.S.M., W.K. and J.N. (John Njalam’mano); project administration, R.L.S.M.; funding acquisition, F.E.E. and W.K. All authors have read and agreed to the published version of the manuscript.

Funding

This work has been funded by the Malawi University of Science and Technology and the Uit Arctic University of Norway under the NORHED II One Health Project (Project No. 61720), “The Urban-Suburban Nexus Towards a One Health Approach”.

Data Availability Statement

The datasets used and/or analyzed during the current study are available from the corresponding author on reasonable request.

Conflicts of Interest

The authors declare no conflicts of interest.

Abbreviations

The following abbreviations are used in this manuscript:
AHPAnalytical Hierarchy Process
CRConsistency Ratio
EVIEnhanced Vegetation Index
HCHOFormaldehyde
GISGeographic Information Systems
IDSIllegal Dump Site
LSTLand Surface Temperature
MODISModerate Resolution Imaging Spectroradiometer
NASANational Aeronautics and Space Administration
PCMPairwise Comparison Matrix
PIDSPotential Illegal Dump Site
RSRemote Sensing

References

  1. Kaza, S.; Yao, L.; Bhada-Tata, P.; Van Woerden, F. What a Waste 2.0: A Global Snapshot of Solid Waste Management to 2050; World Bank: Washington, DC, USA, 2018; Volume 13. [Google Scholar]
  2. Rissman, J.; Bataille, C.; Masanet, E.; Aden, N.; Morrow, W.R., III; Zhou, N.; Elliott, N.; Dell, R.; Heeren, N.; Huckestein, B.; et al. Technologies and policies to decarbonize global industry: Review and assessment of mitigation drivers through 2070. Appl. Energy 2020, 266, 114848. [Google Scholar] [CrossRef]
  3. Christensen, T.H.; Damgaard, A.; Levis, J.; Zhao, Y.; Björklund, A.; Arena, U.; Barlaz, M.; Starostina, V.; Boldrin, A.; Astrup, T.; et al. Application of LCA modelling in integrated waste management. Waste Manag. 2020, 118, 313–322. [Google Scholar] [CrossRef] [PubMed]
  4. Duh, D.; Hasic, S.; Buzan, E. The impact of illegal waste sites on a transmission of zoonotic viruses. Virol. J. 2017, 14, 134. [Google Scholar] [CrossRef]
  5. Cook, E.; Silva, N.; Lima, D.S.; Velis, C.A. Informal recycling sector contribution to plastic pollution mitigation: A systematic scoping review and quantitative analysis of prevalence and productivity. Resour. Conserv. Recycl. 2024, 206, 107588. [Google Scholar] [CrossRef]
  6. Ramos, M.; Martinho, G. Relation between construction company size and the use of recycled materials. J. Build. Eng. 2022, 45, 103523. [Google Scholar] [CrossRef]
  7. Moonsammy, S.; Oyedotun, T.D.T.; Renn-Moonsammy, D.M.; Oyedotun, T.D.; Ally, N.; Kasim, O.F.; Famewo, A. COVID-19 effects on municipality waste collection services for households: Statistical modelling of perspectives from Guyana and Nigeria. J. Mater. Cycles Waste Manag. 2021, 23, 1678–1687. [Google Scholar] [CrossRef]
  8. Riahi, K.; Van Vuuren, D.P.; Kriegler, E.; Edmonds, J.; Neill, B.C.O.; Fujimori, S.; Bauer, N.; Calvin, K.; Dellink, R.; Fricko, O.; et al. The Shared Socioeconomic Pathways and their energy, land use, and greenhouse gas emissions implications: An overview. Glob. Environ. Change 2017, 42, 153–168. [Google Scholar] [CrossRef]
  9. Ngalo, N.; Thondhlana, G. Illegal Solid-Waste Dumping in a Low-Income Neighbourhood in South Africa: Prevalence and Perceptions. Int. J. Environ. Res. Public Health 2023, 20, 6750. [Google Scholar] [CrossRef] [PubMed]
  10. Ottersen, O.P.; Dasgupta, J.; Blouin, C.; Buss, P.; Chongsuvivatwong, V.; Frenk, J.; Fukuda-Parr, S.; Gawanas, B.P.; Giacaman, R.; Gyapong, J.; et al. The political origins of health inequity: Prospects for change. Lancet 2014, 383, 630–667. [Google Scholar] [CrossRef]
  11. Yang, S. Trade for the Environment: Transboundary Hazardous Waste Movements After the Basel Convention. Rev. Policy Res. 2020, 37, 713–738. [Google Scholar] [CrossRef]
  12. Mrozik, W.; Rajaeifar, M.A.; Heidrich, O.; Christensen, P. Environmental impacts, pollution sources and pathways of spent lithium-ion batteries. Energy Environ. Sci. 2021, 14, 6099–6121. [Google Scholar] [CrossRef]
  13. Adams, E.A. Thirsty slums in African cities: Household water insecurity in urban informal settlements of Thirsty slums in African cities: Household water insecurity in urban informal settlements of Lilongwe, Malawi. Int. J. Water Resour. Dev. 2018, 34, 869–887. [Google Scholar] [CrossRef]
  14. Sharma, A.; Gupta, A.K.; Ganguly, R. Impact of open dumping of municipal solid waste on soil properties in mountainous region. J. Rock. Mech. Geotech. Eng. 2018, 10, 725–739. [Google Scholar] [CrossRef]
  15. Nguyen, T.G.; Huynh, N.T.H. Characterization of Groundwater Quality and Human Health Risk Assessment. Civ. Eng. J. 2023, 9, 618–628. [Google Scholar] [CrossRef]
  16. Kabeyi, J.M.B.; Olanrewaju, O.A. Sustainable Energy Transition for Renewable and Low Carbon Grid Electricity Generation and Supply. Front. Energy Res. 2022, 9, 743114. [Google Scholar] [CrossRef]
  17. Singh, S.K.; Chokhandre, P.; Salve, P.S.; Rajak, R. Open dumping site and health risks to proximate communities in Mumbai, India: A cross-sectional case-comparison study. Clin. Epidemiol. Glob. Health 2021, 9, 34–40. [Google Scholar] [CrossRef]
  18. Chen, H.L.; Nath, T.K.; Chong, S.; Foo, V.; Gibbins, C.; Lechner, A.M. The plastic waste problem in Malaysia: Management, recycling and disposal of local and global plastic waste. SN Appl. Sci. 2021, 3, 437. [Google Scholar] [CrossRef]
  19. Edelman, D.J. Management of the Urban Environment in Three Southeast Asian Coastal Metros: Bangkok, Manila and Jakarta. Adv. Appl. Sociol. 2023, 13, 765–839. [Google Scholar] [CrossRef]
  20. Okoji, O.O.; Adeyemi, T.O.; Olawuni, O.A. Assessment of community perception on waste management practice in Ilorin Metropolis, Kwara, Nigeria. Real. Politics 2023, 25, 114–132. [Google Scholar] [CrossRef]
  21. Babayemi, J.O.; Ogundiran, M.B. Overview of Environmental Hazards and Health Effects of Pollution in Developing Countries: A Case Study of Nigeria. Environ. Qual. Manag. 2016, 26, 51–71. [Google Scholar] [CrossRef]
  22. Mishra, R.K. Fresh Water availability and Its Global challenge. Br. J. Multidiscip. Adv. Stud. 2023, 4, 1–78. [Google Scholar] [CrossRef]
  23. Swart, E.C.; Van Der Merwe, M.; Williams, J.; Blaauw, F.; Viljoen, J.M.M.; Schenck, C.J. Nutritional Status, Dietary Intake and Dietary Diversity of Landfill Waste Pickers. Nutrients 2022, 14, 1172. [Google Scholar] [CrossRef] [PubMed]
  24. Chandrasekaran, H.; Subramani, S.E.; Partheeban, P. IoT- and GIS-Based Environmental Impact Assessment of Construction and Demolition Waste Dump Yards. Sustainability 2023, 15, 13013. [Google Scholar] [CrossRef]
  25. Mallick, J. Municipal solid waste landfill site selection based on fuzzy-AHP and geoinformation techniques in ASIR region Saudi Arabia. Sustainability 2021, 13, 1538. [Google Scholar] [CrossRef]
  26. Manaf, L.A.; Armi, M.; Samah, A.; Ilyana, N.; Zukki, M. Municipal solid waste management in Malaysia: Practices and challenges. Waste Manag. 2009, 29, 2902–2906. [Google Scholar] [CrossRef]
  27. Mihai, F.C. Rural plastic emissions into the largest mountain lake of the Eastern Carpathians. R. Soc. Open Sci. 2018, 5, 172396. [Google Scholar] [CrossRef]
  28. Godfrey, L.; Oelofse, S. Historical Review of Waste Management and Recycling in South Africa. Resources 2017, 6, 57. [Google Scholar] [CrossRef]
  29. Sawyer, L.; Kallenberger, P. Bypass urbanism: Re-ordering center-periphery relations in Kolkata, Lagos and Mexico City. Environ. Plan. A Econ. Space 2021, 53, 675–703. [Google Scholar] [CrossRef]
  30. Wang, C.; Zhao, L.; Lim, M.K.; Chen, W.Q.; Sutherland, J.W. Structure of the global plastic waste trade network and the impact of China’s import Ban. Resour. Conserv. Recycl. 2020, 153, 104591. [Google Scholar] [CrossRef]
  31. Nel, M.; Simuyaba, M.; Muchelenje, J.; Chirwa, T.; Simwinga, M.; Speight, V.; Mhlanga, Z.; Jacobs, H.; Nel, N.; Seeley, J.; et al. Broad Brush Surveys: A rapid qualitative assessment approach for water and sanitation infrastructure in urban sub-Saharan cities. Front. Sustain. Cities 2023, 5, 1185747. [Google Scholar] [CrossRef]
  32. Matandika, I.; Mategula, D.; Kasenda, S.; Adeniyi, Y.; Muula, A. Prevalence and correlates of common mental disorders among children and adolescents in Blantyre-Urban, Malawi. Malawi Med. J. 2022, 34, 105–110. [Google Scholar] [CrossRef]
  33. Sowers, J.; Vengosh, A.; Weinthal, E. Climate change, water resources, and the politics of adaptation in the Middle East and North Africa. Clim. Change 2011, 104, 599–627. [Google Scholar] [CrossRef]
  34. Jakiel, M.; Bernatek-Jakiel, A.; Gajda, A.; Filiks, M.; Pufelska, M. Spatial and temporal distribution of illegal dumping sites in the nature protected area: The Ojców National Park, Poland. J. Environ. Plan Manag. 2019, 62, 286–305. [Google Scholar] [CrossRef]
  35. Huang, J.; Zhang, S.; Zhang, J.; Zheng, X.; Meng, X.; Yang, S.; Bai, Y. Integrating Meteorological and Remote Sensing Data to Simulate Cropland Nocturnal Evapotranspiration Using Machine Learning. Sustainability 2024, 16, 1987. [Google Scholar] [CrossRef]
  36. Gorelick, N.; Hancher, M.; Dixon, M.; Ilyushchenko, S.; Thau, D.; Moore, R. Remote Sensing of Environment Google Earth Engine: Planetary-scale geospatial analysis for everyone. Remote Sens. Environ. 2017, 202, 18–27. [Google Scholar] [CrossRef]
  37. Kumar, R.; Dwivedi, S.B.; Gaur, S. A comparative study of machine learning and Fuzzy-AHP technique to groundwater potential mapping in the data-scarce region. Comput. Geosci. 2021, 155, 104855. [Google Scholar] [CrossRef]
  38. Caniani, D.; Lioi, D.S.; Mancini, I.M.; Masi, S. Hierarchical Classification of Groundwater Pollution Risk of Contaminated Sites Using Fuzzy Logic: A Case Study in the Basilicata Region (Italy). Water 2015, 7, 2013–2036. [Google Scholar] [CrossRef]
  39. Döpp, A.; Eberle, C.; Streeter, M.; Irshad, F.; Lin, J.; Streeter, M. Data-driven science and machine learning methods in laser—Plasma physics. High Power Laser Sci. Eng. 2023, 11, e55. [Google Scholar] [CrossRef]
  40. Karimi, N.; Ng, K.T.W. Mapping and Prioritizing Potential Illegal Dump Sites Using Geographic Information System Network Analysis and Multiple Remote Sensing Indices. Earth 2022, 3, 1123–1137. [Google Scholar] [CrossRef]
  41. Mahmood, K.; Batool, S.A.; Chaudhry, M.N. Studying bio-thermal effects at and around MSW dumps using Satellite Remote Sensing and GIS. Waste Manag. 2016, 55, 118–128. [Google Scholar] [CrossRef]
  42. Seror, N.; Portnov, B.A. Identifying areas under potential risk of illegal construction and demolition waste dumping using GIS tools. Waste Manag. 2018, 75, 22–29. [Google Scholar] [CrossRef]
  43. Matsumoto, S.; Takeuchi, K. The effect of community characteristics on the frequency of illegal dumping. Environ. Econ. Policy Study 2011, 13, 177–193. [Google Scholar] [CrossRef]
  44. Thokala, P.; Devlin, N.; Marsh, K.; Baltussen, R.; Boysen, M.; Kalo, Z.; Longrenn, T.; Mussen, F.; Peacock, S.; Watkins, J.; et al. Multiple Criteria Decision Analysis for Health Care Decision Making—An Introduction: Report 1 of the ISPOR MCDA Emerging Good Practices Task Force. Value Health 2016, 19, 1–13. [Google Scholar] [CrossRef]
  45. Cheval, S.; Baciu, M.; Breza, T. An investigation into the precipitation conditions in Romania using a GIS-based method. Theor. Appl. Climatol. 2003, 88, 77–88. [Google Scholar] [CrossRef]
  46. Glanville, K.; Chang, H.C. Mapping illegal domestic waste disposal potential to support waste management efforts in Queensland, Australia. Int. J. Geogr. Inf. Sci. 2015, 29, 37–41. [Google Scholar] [CrossRef]
  47. Bielecka, E.; Jenerowicz, A.; Pokonieczny, K.; Borkowska, S. Land Cover Changes and Flows in the Polish Baltic Coastal Zone: A Qualitative and Quantitative Approach. Remote Sens. 2020, 12, 2088. [Google Scholar] [CrossRef]
  48. Karimi, N.; Ng, K.T.W.; Richter, A. Development and application of an analytical framework for mapping probable illegal dumping sites using nighttime light imagery and various remote sensing indices. Waste Manag. 2022, 143, 195–205. [Google Scholar] [CrossRef]
  49. Saaty, T.L. Decision making with the analytic hierarchy process. Int. J. Serv. Sci. 2008, 1, 83–97. [Google Scholar] [CrossRef]
  50. Goepel, K.D. Implementing the Analytic Hierarchy Process as a Standard Method for Multi-Criteria Decision Making in Corporate Enterprises—A New AHP Excel Template with Multiple Inputs. In Proceedings of the International Symposium on the Analytic Hierarchy Process, Sorrento, Italy, 15–18 June 2011; pp. 1–10. [Google Scholar]
  51. Mager, A.; Blass, V. From Illegal Waste Dumps to Beneficial Resources Using Drone Technology and Advanced Data Analysis Tools: A Feasibility Study. Remote Sens. 2022, 14, 3923. [Google Scholar] [CrossRef]
  52. Silva López, J.O.; Salas López, R.; Rojas Briceño, N.B.; Gómez Fernández, D.; Terrones Murga, R.E.; Iliquín Trigoso, D.; Barboza Castillo, E.; Oliva Cruz, M.; Barrena Gurbillón, M.Á. Analytic Hierarchy Process (AHP) for a Landfill Site Selection in Chachapoyas and Huancas (NW Peru): Modeling in a GIS-RS Environment. Adv. Civ. Eng. 2022, 1–15. [Google Scholar] [CrossRef]
  53. Yan, W.Y.; Mahendrarajah, P.; Shaker, A.; Faisal, K.; Luong, R.; Al-Ahmad, M. Analysis of multi-temporal landsat satellite images for monitoring land surface temperature of municipal solid waste disposal sites. Environ. Monit. Assess. 2014, 186, 8161–8173. [Google Scholar] [CrossRef] [PubMed]
  54. Thakur, R.; Onwubu, S.C. Household waste management behaviour amongst residents in an informal settlement in Durban, South Africa. J. Environ. Manage 2024, 349, 119521. [Google Scholar] [CrossRef] [PubMed]
  55. Graham, R.E.D. A study of illegal dumping near coastal zones and waterways in Grenada: Advancing waste management solutions and reducing marine litter. PLoS Water 2024, 3, e0000175. [Google Scholar] [CrossRef]
  56. Oyekale, A.S. Factors Explaining Households’ Cash Payment for Solid Waste Disposal and Recycling Behaviors in South Africa. Sustainability 2015, 7, 15882–15899. [Google Scholar] [CrossRef]
Figure 1. The location of the study area.
Urbansci 09 00254 g001
Figure 2. The methodology framework of the study.
Urbansci 09 00254 g002
Figure 3. Euclidean distance rasters for highways (1), legal dump sites (2), and rivers (3).
Urbansci 09 00254 g003
Figure 4. Interpolated satellite indices for HCHO (1), LST (2), and EVI (3).
Urbansci 09 00254 g004
Figure 5. Normalized variables; fuzzy layers for Euclidean distance from rivers (1), Formaldehyde (2), Euclidean distance from highways (3), Euclidean distance from a legal dumpsite (4), EVI (5), and LST (6).
Urbansci 09 00254 g005
Figure 6. Map of potential illegal dump sites.
Urbansci 09 00254 g006
Figure 7. Graph showing areas covered by each PIDS class in square meters.
Urbansci 09 00254 g007
Figure 8. Map showing the intersection of actual IDS points and PIDS classes.
Urbansci 09 00254 g008
Figure 9. Graph showing average fuzzy membership grades for each variable in each class.
Urbansci 09 00254 g009
Table 1. Details of satellite imagery and products used.
SatelliteSensorResolutionPeriodProduct NameOutcome
NASA MODISMOD21A1N~1000 mNovember 2023–April 2024LSTAveraged LST values ranging from 17.71 °C to 24.03 °C
NASA MODISMOD13Q1250 mNovember 2023–April 2024EVIAveraged EVI values ranging from 0.0977 to 0.595
Sentinel-5P (ESA)TROPOMI1.1 kmNovember 2023–April 2024HCHOAveraged HCHO data used for identifying PIDS
Table 2. Fuzzification variables and their details.
Variable Fuzzification Type Details and Source
LSTPositive linearThe probability of PIDS occurrence increases with higher surface temperatures. Larger LST values result in a higher probability of PIDSs [43].
EVINegative linearA decrease in vegetation health increases the likelihood of PIDS occurrence. Smaller EVI values indicate a higher probability of PIDSs [44].
HCHOPositive linear Higher HCHO concentration indicates higher anthropogenic activity, which increases the probability of PIDS occurrence [45,46].
Distance from legal dumpsite Positive linearThe probability of PIDS increases as the distance from the legal dump site increases [45,46].
Distance from highways Negative linearThe probability of PIDS increases as the proximity to highways decreases. Closer proximity to highways increases PIDS occurrence [31,47,48].
Distance from riversNegative linear The probability of PIDSs increases as the proximity to rivers decreases. Areas closer to rivers are more likely to have PIDSs [31,47].
Table 3. The AHP evaluation scale.
IntensityDefinition Explanation
1Equal importance Two elements contribute equally to the objective
3Moderate importance Experience and judgment slightly favor one element over another
5Strong importance Experience and judgment strongly favor one element over another
7Very strong importance One element is favored very strongly over another, and its dominance is demonstrated in practice
9Extreme importanceThe evidence favoring one element over another is of the highest possible order of affirmation
Here, 2, 4, 6, and 8 can be used to express intermediate values.
Table 4. The steps followed for identifying PIDSs in the study area.
StepTool/Method UsedPurpose
1Equal interval classificationReclassified the raster into 5 classes: very high to very low
2Majority filterRemoved isolated/random pixels from the raster
3Boundary cleanSmoothed jagged boundaries between different classes
4Raster to polygonConverted the cleaned raster to vector polygons
5ClipTrimmed the output to match the study area
6IntersectOverlayed PIDS with known illegal dumpsites, population centers, river network, and highways, with each class for quantification
Table 5. AHP pairwise comparison matrix.
Matrix RiverHighwayLSTEVIHCHOLegal DumpsiteWeight %
123456
River1156261/221.3
Highway21/515251/416.8
LST31/61/511/51/31/710.2
EVI41/21/2511/41/615.7
HCHO51/61/53411/711.6
Legal Dumpsite624767124.4
Total 100
Table 6. Distribution of IDS points for each PIDS class.
ClassNumber of PointsProportion (%)
High10531.53
Low3510.51
Moderate15646.85
Very High3711.11
Very Low00
Total333100
Disclaimer/Publisher’s Note: The statements, opinions and data contained in all publications are solely those of the individual author(s) and contributor(s) and not of MDPI and/or the editor(s). MDPI and/or the editor(s) disclaim responsibility for any injury to people or property resulting from any ideas, methods, instructions or products referred to in the content.

