Article

Transforming Chiller Plant Efficiency with SC+BAS: Case Study in a Hong Kong Shopping Mall

by
Fong Ming-Lun Alan
* and
Li Baonan Nelson
*
Department of Construction, Environment and Engineering, Technological and Higher Education Institute of Hong Kong, Hong Kong, China
*
Authors to whom correspondence should be addressed.
Urban Sci. 2025, 9(7), 253; https://doi.org/10.3390/urbansci9070253
Submission received: 24 May 2025 / Revised: 21 June 2025 / Accepted: 29 June 2025 / Published: 2 July 2025

Abstract

The imperative for building managers, in the face of high-density urban environments, is to drive existing chiller plants to greater operational efficiency through the application of advanced technological interventions. The case for applying Supervisory Control (SC) and a Building Automation System (SC+BAS) for optimizing chiller plants is the subject of investigation here, through the lens of a typical commercial shopping mall in the high-density infrastructure of Hong Kong. The application of SC+BAS falls into the realm of advanced Trim/Respond algorithms coupled with sophisticated sequencing algorithms that allow for refined optimization of the chiller operations in response to the dynamic demands of urban infrastructure. The SC+BAS features an array of optimizations specifically for the chiller plant. Incentive parameters such as cooling capacity, energy usage, and Coefficient of Performance (COP) were thoroughly studied through 12 months’ worth of data, before and after the implementation of the SC+BAS. Empirical observations indicate a statistically significant 17.6% energy usage decrease, coupled with a 15.3% decrease in the related energy expenditure costs. Furthermore, the environmental impact is calculated, with an estimated 61.1 tons reduction in the amount of CO2 emissions, hence emphasizing the capacity for SC+BAS in offsetting the carbon footprint for commercial buildings. These data prove convincingly that the implementation of SC+BAS can increase the energy efficiency in chiller plants in commercial buildings, supporting the overall sustainability of the urban infrastructure. In turn, the authors suggest other areas for optimization through the advanced sequencing of chillers and demand-based cooling strategies. This highlights the ability of SC+BAS in creating more economical and green building operations regarding urban microclimates, occupant behavior patterns, and interactivity with the power grid, leading ultimately to the holistic optimization of chiller plant performance within the urban framework.

1. Introduction

Shopping malls are major energy consumers, and the major reason for this is the use of chiller-based HVAC systems in them. Operation in the conventional manner, though, leads to major energy inefficiencies and waste. An important question, then, is how can we make the operation efficient through advanced technologies? Building Automation Systems (BASs) have proven incredibly valuable in optimizing the energy efficiency of chillers. With the ability to monitor parameters in real-time and make dynamic adjustments in parameters such as temperature, flow rates, and operating schedules for equipment, BAS facilitates smarter and responsive operations. Such abilities help maintain energy usage in closer conformity with actual cooling requirements, eliminating unnecessary usage. This forward-looking control method not only increases the performance of the chiller, but it has the potential for revolutionizing the practice of energy management in the contemporary shopping center. The ramifications reach wide: from substantial cost benefits to decreasing the environmental impact. This work examines the in-practice advantages of adopting a Supervisory Control and Building Automation System (SC+BAS) for maximizing the efficiency in the chiller plants and enabling the adoption of sustainable practices in the urban, energy-hungry, built environment. Particular emphasis is given to the assessment of an off-the-shelf product—Tracer® SC+: Flexible. Open. Secure.—with the objective of providing tangible performance improvements [1]. Tracer® SC+ works in complete harmony with existing chiller plant infrastructure through the availability of open communication protocol support, such as BACnet [2,3,4], Modbus [5], and LonTalk. Such compatibility facilitates solid interoperability among HVAC equipment for enhanced supervisory control, as well as higher operational efficiency, all while ensuring occupant comfort within desired parameters.
Supervisory Control plus Building Automatic System (SC+BAS) is the latest generation in control technology produced by the HVAC industry for the optimization of chiller plant operations. It accomplishes its task through its Chiller Plant Control (CPC) application, an advanced piece of software that facilitates the centralized, smart controlling of the system. SC+BAS offers complete function, including real-time system status and alarm notifications for both local and remote users, the ability to enable and disable chiller plants, start, stop, and monitor chilled water pumps, and calculate the individual chilled water setpoints for each chiller in multiple-series configurations. It also automates adding or removing chillers based on building load conditions, utilizing user-established logic, and supports chiller sequencing at predetermined intervals, including the conditional removal of units from sequential sequencing based on need. One of its most advanced features is the Trim/Respond (T/R) algorithm [6], which dynamically resets the setpoints for the system. The algorithm incrementally changes the setpoint at a preset rate until the downstream device is dissatisfied, generating a request. When the desired amount accumulates within the predetermined interval, the system reacts by altering the setpoint accordingly. It also features the ability for users to set the priority level for each zone, ensuring essential zones get consistent, adequate cooling. When the amount falls below the threshold, the system returns to its original fixed-rate adjustment. The SC+BAS monitors requests from every zone in real-time, allowing it to identify the zones responsible for the reset logic, as well as the ability to target optimization. Multiple implementations of the T/R logic can be performed in a single platform for the control of multiple setpoints. Users can use predetermined strategies, such as those described in ASHRAE Guideline 36 [7], or create customized solutions specific to the needs of the system. Available reset strategies consist of chilled water temperature reset, chilled water enable, chilled water pressure reset, cooling discharge air temperature setpoint reset, static pressure setpoint reset, and customized reset configurations.
This case study discusses a busy shopping mall in the metropolitan Mong Kok area in Hong Kong, an urban area famous for its high number of retail shops, eateries, and entertainment facilities. In such a high-demand area, energy waste is an important consideration, and Building Automation Systems (BASs) have proven to be an efficient and innovative method for managing the same. With the incorporation of advanced control features, BAS enhances the functioning of HVAC systems, causing waste in energy usage and overall inefficiency in the system. In 2024, the shopping mall installed a Supervisory Control and Building Automation System (SC+BAS) for maximizing the performance of its chiller plant. The system was installed with an aim towards enhancing the operational efficiency, while reducing energy usage and the cost associated with it, and decreasing the maintenance cost through the benefit of intelligent monitoring, control, and automated functions. The chiller plant consists of three 300-ton refrigeration (TR) chillers (WCPC-1 through WCPC-3), three duty and a single standby chilled water pumps, three cooling towers, and three duty and one standby condenser water pumps. In this real-world commercial application, the impact of the incorporation of SC+BAS on the efficiency in energy usage in the chillers is analyzed in this paper, together with an analysis of the resulting cost saving in the form of energy usage and the expenditure in the form of maintenance. It also identifies the important parameters affecting the efficiency of the optimization of the chiller plant in the shopping mall scenario.
This work examines the in-practice advantages of adopting a Supervisory Control and Building Automation System (SC+BAS) for maximizing the efficiency in the chiller plants and enabling the adoption of sustainable practices in the urban, energy-hungry, built environment.
The objectives of this study were to:
  • Investigate the optimized performance of the chiller plant in terms of energy and cost efficiency through the integration of SC and BAS.
  • Provide practical insights for the application of SC+BAS in commercial buildings. By examining the real-world implementation in a typical shopping mall in Hong Kong, this study aims to offer actionable recommendations for facility managers and stakeholders seeking to enhance the sustainability and economic viability of their HVAC systems.

2. Literature Review

Van Roosmale et al. (2024) point out the high potential of Building Automation and Control Systems (BACSs) in improving energy efficiency and indoor environmental quality in buildings. BACSs allow the capture of real-time data and uses automated control to facilitate informed decision-making in the facilities. This not only maximizes the use of energy, but it also improves the controlled and comfortable indoor environment. Furthermore, coupling BACS with artificial intelligence (AI) for predictive maintenance increases its benefit such that equipment failure can be detected early. Such an early intervention decreases the cost of maintenance, increases equipment life, and improves the overall sustainability of building operations in the long term [8].
Real-time prediction and subsequent optimization of cooling system setpoints utilizing Artificial Intelligence (AI) in Chiller Systems with Artificial Neural Network (ANN) techniques are employed by Kang et al. (2021) for significant improvement in the energy efficiency. In the work, the ANN algorithm was implemented in the actual building and the average energy saving rate of the ANN controlled chiller was 24.7% and the COP improvement rate was 28.2%. It indicates that the building management system (BAS) energy consumption can be enhanced through the operation of smart algorithms [9]. It is feasible to save energy in HVAC systems while not sacrificing the thermal comfort through resetting the setpoint for the chilled water temperature. Fong et al. (2005) propose a simulation-optimization based method for the determination of a reset strategy for the chilled water and the supply air temperatures for an HVAC system placed in the subway station. It used the optimization of the parameters at work through the use of evolutionary programming in order to reduce the annual energy usage. It has been identified in the findings that the energy saving can be up to 7% in case the chilled water and the supply air temperatures can be adjusted from the operational point [10].
With mechanical vapor compression chiller as the control variate, Thu et al. (2017) [11] performed experiments to analyze the effect of chilled water supply temperature (Tchws) on the performance of the chiller. The tests showed that the COP as well as the cooling capacity, both increase in a linear relationship with increasing Tchws. Specifically, for each increase in Tchws by 2 °C, the COP increases about 3.5%. Their findings indicate that in HVAC systems where only sensible cooling is needed (i.e., without dehumidification), it is possible to increase the Tchws—up to about 17 °C—without harming indoor thermal comfort. The change lowers the power consumed by chillers substantially. Literature identifies the promise of chilled water temperature reset as an energy-saving intervention further, pointing out that boosting the temperature setpoint for sensible cooling lowers the compressor lift, hence making the chiller efficient.
In another related experiment, Schibuola et al. (2018) [12] performed an experimental analysis into the implementation of Variable Speed Drive (VSD) technology in a fan coil system in a public building. In the experiment, based on monitoring the system’s performance in the long term, it was shown that the incorporation of VSD technology in the fan coil system lowered the global annual energy use of pumps and fans by 38.9% compared to that in the conventional constant flow rate system. The authors noted that such an effect would only be reliably predicted via simulation models and noted that prolonged monitoring was necessary in an effort to fully evaluate the long-run advantages of the implementation of VSD.
Wang et al. (2015) [13] studied an all-variable speed, water-cooled chiller plant supplying a laboratory building. The authors used trend data gathered from the building management system (BMS) to identify operational inefficiencies and opportunities for commissioning. A dynamic energy simulation model for the chiller plant was created in order to assess control strategies for optimizing energy performance. The results upheld the significant potential for VSD technology to increase the efficiency in the operation of chiller plants.
Collectively, these studies highlight the enormous energy-saving value in Variable Speed Drive technology for HVAC equipment, especially fans and pumps. In contrast with conventional constant-speed equipment, VSD makes motor speed dynamic in response to actual load demand, achieving very high electricity savings and reducing the energy waste in the system.
The efficiency and performance of the cooling system rely on the choice of sequencing control methods for the chillers. Most often, traditional sequencing methods assume an invariable maximum cooling capacity for each chiller, which may not be the real conditions. Liu et al. (2017) propose an ideal chiller sequencing control method taking into account the variation in the single chiller maximum cooling capacity. Existing methods assume an invariable amount, while the authors formulate the actual capacity based on the condenser water temperature, among other parameters. Optimization is then used in determining the best chiller loading along with the number of operational chillers in order to minimize power usage. The findings indicate the optimum strategy outperforms traditional methods in systems with varying speed chillers and non-dedicated pumps. With proper modeling of the chiller capacity, the optimum strategy can save up to 21.2% power compared to traditional approaches [14].
The gap in knowledge in evaluating the real benefits of the Supervisory Control and Building Automation System (SC+BAS) in the given shopping mall stems from the use of the single case study. The actual economic and environmental benefits resulting from the application of SC+BAS in a chiller plant can be markedly conditioned by such multifaceted contextual variables as local weather, the type of functional building use, building material choice, and local building legislation compliance.
As an example, the building envelope transmission loss is directly influenced by regulatory requirements like Overall Thermal Transfer Value (OTTV) standards [15,16]. Such standards specify acceptable heat gain limits through the building envelope, in turn influencing the energy efficiency in HVAC systems. Hence, local climate variations and regulatory regimes need to be factored in while considering the performance in the case of SC+BAS systems.
The idea of keeping global temperature at no more than 1.5 degrees Celsius above the pre-industrial levels became a key global goal since the signing of the Paris Agreement (UNFCCC, 2021) [17,18] and the publication of the special report by the Intergovernmental Panel on Climate Change (IPCC, 2018) [19]. The success of this will depend on the concept of carbon neutrality, in which the quantities of CO2 that people have emitted are compensated in terms of equivalence (Dhanda and Hartman, 2011) [20].
Hong Kong has made the commitment to achieve carbon neutrality in 2050 and has laid down the *Hong Kong’s Energy Saving Plan 2015–2025+* (Environmental Bureau, 2015) [21] with the aim of reducing the energy intensity (terajoules per billion HKD GDP) by 40% by 2025, relative to 2005 levels. This was followed by the introduction of the *Climate Action Plan 2030+* [22], policies by the Environmental Bureau on climate change adaptation policies, as well as improving the resilience of the climate and reducing carbon emissions into building, transport and infrastructure. The pending issue is whether the current energy efficiency guidelines are capable of meeting these two plans and what measures Hong Kong need to enhance and do to realize carbon-neutral buildings.
Commercial buildings in the city of Hong Kong have been conforming to the Overall Thermal Transfer Value (OTTV) since 1995 which governs heat gain via building envelopes by the buildings (Energy Efficiency) Regulation (1995) (Buildings Department, 1995) [23]. This regulation experienced major development in the year 2012 when the Building Energy Code (BEC) was introduced, which sets design standards of energy efficiency on four key categories of building services installations (BSIs), including namely, air-conditioning, lighting, electrical, and lift and escalator installations (EMSD, 2012a). At the same time, the Code of Practice for Energy Audit (EMSD, 2012b) [24] was published with the aim of surveying energy-consuming systems in the building in use and realizing the opportunity of energy saving. The OTTV and BEC requirements are generally revised after every 5–10 years, taking into consideration the new technologies and matching the requirements to the international standards like the ASHRAE Standard 90.1 (ASHRAE, 2022) [25] and CIBSE Guide F (CIBSE, 2012) [26]. The current update of the BEC was published in 2024 [27], and OTTV requirements were changed in 2019.
To evaluate building sustainability, Hong Kong came up with the BEAM Plus (HKGBC, 2021) [28], which was based on BREEAM (BRE, 1990) [29] and LEED (USGBC, 2000) [30]. BEAM Plus contains energy use and efficiency standards to rate building ranks as green using energy performance, the area that contributes to the largest number of credits. Even though BEAM Plus certification is voluntary, its usage in the commercial sector is still on an increasing trend.
In addition, variations in operating practices, occupancy, and upkeep methods can also impact the overall performance and efficiency of the SC+BAS. Therefore, an enhanced and localized approach is necessary in order to properly monitor and measure the advantages provided through these systems, such that the results will be based on the specifics regarding the traits and needs of the urban setting in which it is implemented. Addressing such variables, the potential of SC+BAS in providing tangible economic and environmental payoffs in various urban environments can be better explored in follow-up studies.
These methods underscore the need for combining AI, adaptive control, and dynamic optimization toward sustainable HVAC operations. As far as quantification of energy efficiency improvements and cost reduction goes, methodical analyses of BAS implementations in shopping mall chillers currently remain sparse. The objective of the project is to determine the impact of BAS on chiller energy efficiency as well as cost-saving in a shopping mall environment, hence offering meaningful analysis for facility managers and stakeholders.

3. Methodology

In 2023, the building owner collected log data from energy meters, chiller control panels, and MVAC switchboards. In 2024, the shopping mall installed a SC+BAS, which allows direct export of energy consumption data. The BAS records real-time energy usage of equipment and generates log files. The analysis is based on log data, electricity bills, and design and operational information of the chiller plant. The control logic and data processing workflow for the chiller plant are illustrated in Figure 1.

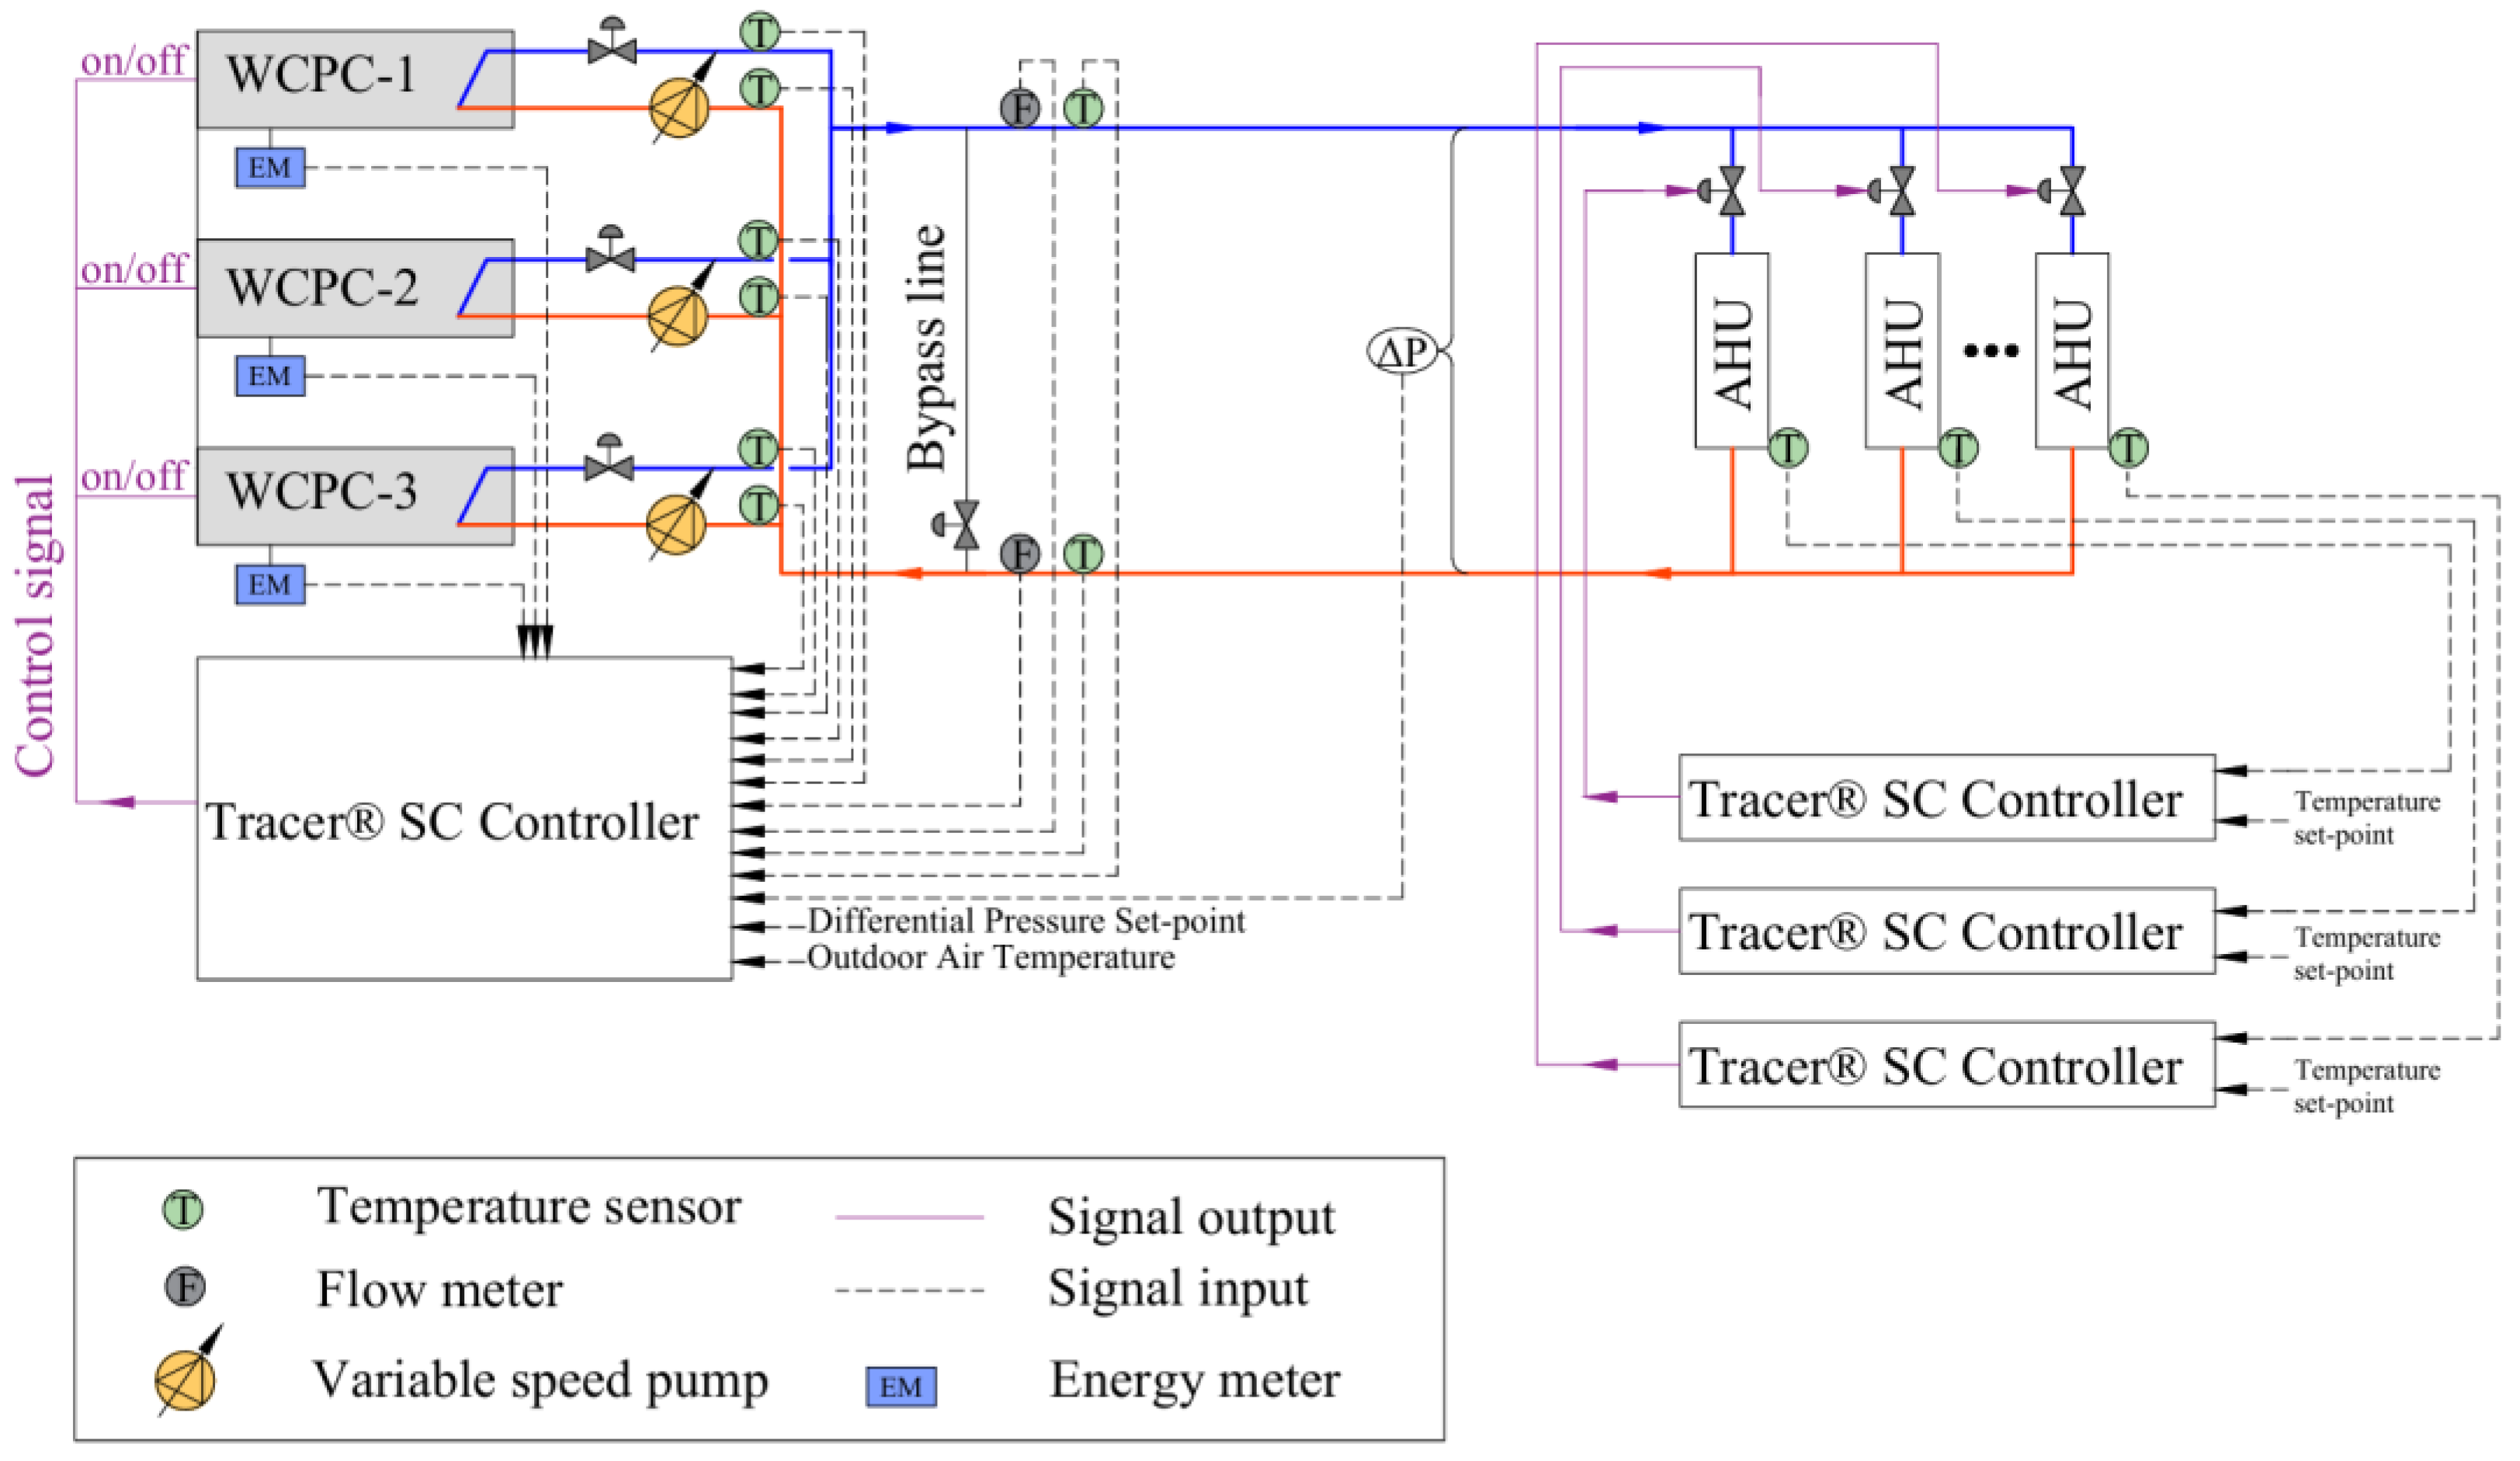
3.1. HVAC Plant Configuration and Instrumentation

The manufacturer-certified performance data for the Water-Cooled Screw Chillers (WCPC-1 to WCPC-3) under design conditions are presented in Table 1.
The chiller plant consists of 3 numbers of 300 TR chillers WCPC-1 to 3, the associated chilled water pumps (3 duty and 1 standby), 3 numbers of cooling towers, and the associated condenser water pumps (3 duty and 1 standby). The schematic diagram and local control strategies of the typical multi-chiller system are depicted in Figure 2.
Figure 2 illustrates a schematic representation of a chilled water system that is integrated with a Tracer® SC Controller, which is engineered to facilitate efficient operational management and monitoring. This system is equipped with an array of components and sensors designed to optimize control mechanisms and energy management protocols.
Energy meters are strategically installed at the electrical input points of each chiller unit (WCPC-1, WCPC-2, and WCPC-3) to monitor real-time power consumption metrics. Temperature sensors are positioned at the inlet and outlet ports of the chilled water circuits associated with each chiller to provide essential data for maintaining the optimal water temperature, thereby ensuring effective cooling processes. Additionally, flow meters are incorporated within the primary chilled water and condenser water circuits to measure the flow rates of the water, which assists in balancing the system dynamics and preventing conditions of overcooling or undercooling.
The Tracer® SC Controller functions as the central regulatory hub, managing the operational dynamics of the chiller units and pumps. It leverages inputs from temperature sensors and differential pressure set-points to enhance performance optimization. Moreover, it integrates outdoor air temperature data to further refine the control strategies. Multiple Air Handling Units (AHU) are interfaced with the system, each outfitted with an individual Tracer® SC Controller. These controllers modulate the temperature set-points in accordance with the specific demands of the spaces they are designed to serve, thereby ensuring a harmonious balance between occupant comfort and energy efficiency.
The schematic delineates various signal lines, depicted by solid and dashed lines, which represent the control signals and inputs that are exchanged between the controllers. This facilitates seamless communication and coordination across the entire system. The integrated setup ensures that the chilled water system operates with heightened efficiency, supported by real-time monitoring and control capabilities that are provided by the Tracer® SC Controllers and the associated sensor array, thereby achieving superior energy management and operational performance.

3.2. Data Collection from Various Sources

The bi-hourly log data of Chilled water inlet temperature, Tin, Chilled water outlet temperature, Tout, kWh reading from control panel, Wch,panel were collected from the control panels of chillers. To establish a baseline for energy consumption, the total electrical energy consumption of the chillers was recorded over one year. Data was collected daily from the electricity meters installed at the chiller units, including energy consumption of chiller WCPC-1, WCPC-2 & WCPC-3, measured by energy meters CH1, CH1 & CH3.
The information is acquired from the O&M manual, including chilled water flow rates of chillers WCPC-1, 2, and 3; electricity tariff from January 2023 to December 2024; and usable floor area of a typical shopping mall.

3.3. Computation of Performance Parameters

3.3.1. Information from Control Panels of Chillers

Based on the collected and available information from the control panels of chillers, the following performance parameters were determined according to Equations (1)–(7) as follows.
  • Cooling output of each chiller, Qch (kWh)
    Q c h = ρ V ˙ c w T o u t T i n
    where
    • ρ : water density (kg/m3)
    • V ˙ : chilled water flow rate in an hour ((m3/s) × h)
    • cw: specific heat capacity of water with a value of 4.2 (kJ/(kg × K))
  • Daily and monthly total cooling output of the entire chiller plant, Qtotal,d and Qtotal,m (kWh)
    Q t o t a l , d = j = 1 3 i = 1 k Q c h , i , j
    Q t o t a l , m = p = 1 n Q t o t a l , d , p
    where
    • i: operating hour of the jth chiller, 1 £ i £ k
    • j: 1 for chiller WCPC-1 and so forth, 1 £ j £ 3
    • k: last operating hour according to the log data of energy meter, 1 £ k £ 24
    • p: day of a month, 1 £ p £ n
    • n: 31 for September and November; or 30 for October
  • Daily and monthly total energy consumption of chillers, Wch,total,m
    P = 3 × V L × I L × cos ( )
    where:
    • P is the power in watts (W).
    • VL is the line voltage in volts (V) = 380 (V)
    • IL is the line current in amperes (A).
    • cos(ϕ) is the power factor = 0.89
Converting to kilowatts:
To convert the three-phase power from watts to kilowatts
P k W = 3 × V L × I L × cos ( ) 1000
d.
Daily energy consumption from control panels, Wch,panel,d (kWh)
W c h , p a n e l , d = j = 1 3 i = 1 k W c h , p a n e l , i , j
e.
Overall coefficient of performance (COP) of chiller plant based on control panels, COPpanel,d
C O P p a n e l , d = Q t o t a l , d W c h , p a n e l , d

3.3.2. Information from Energy Meters

With the collected information from energy meters, the following performance parameters were determined according to Equations (8) and (9) as follows.
  • Daily total energy consumption from energy meters CH1, CH2, and CH3, Wch,total,d (kWh)
    W c h , t o t a l , d = j = 1 3 i = 1 k W c h , m e t e r , i , j
  • Overall COP of operating chillers based on energy meters CH1, CH2, and CH3, COPch,d
    C O P c h , d = Q t o t a l , d W c h , t o t a l , d

3.4. Data Handling and Assumption

Daily Cooling Output

The building owner recorded operational log data in 2023 from energy meters, chiller control panels, and MVAC switchboards. In 2024, the shopping mall was equipped with a Supervisory Control and Building Automation System (SC+BAS) that allowed for the direct export of energy use data. The equipment energy use is monitored in real-time and automatically generates log files by the SC+BAS. System log data, electricity bills, and the design and operational characteristics of the chiller plant form the basis for the analysis in the current study.

3.5. Data Collection Frequency

Installed sensors and monitoring tools gathered real-time operational data on the chiller system following BAS installation. To catch the dynamic changes in the system, the data-collecting frequency was set to a high rate—every 15 min. The key parameters monitored include
  • Power Consumption: measured by the electricity meters installed on the chillers.
  • Temperature: high-precision temperature sensors tracked inlet and outlet water temperatures.
  • Flow Rate: flow sensors put on the pipes measured chilled water flow rates.

3.6. Preliminary Analysis and Data Organization

The data gathered were arranged and preliminarily analyzed to guarantee their correctness and completeness.
  • Data Cleaning: using data analysis tools to find missing values and anomalies and remove them.
  • Preliminary Analysis: Monthly total energy consumption, operating time, and load demand were calculated. Trends in energy consumption, operating time, and load demand were plotted to provide a preliminary understanding of the data.

3.7. The Energy Consumption of the Chiller Plant

Assessing the energy consumption of the chiller plant is crucial for optimizing its operational efficiency and minimizing operating costs. However, in 2023, direct extraction of energy consumption data from the Building Management System (BMS) was not possible, as the system had not yet been installed. As a result, alternative methods were employed to obtain energy usage data for the chiller units, including:
  • Manual recording of equipment operation;
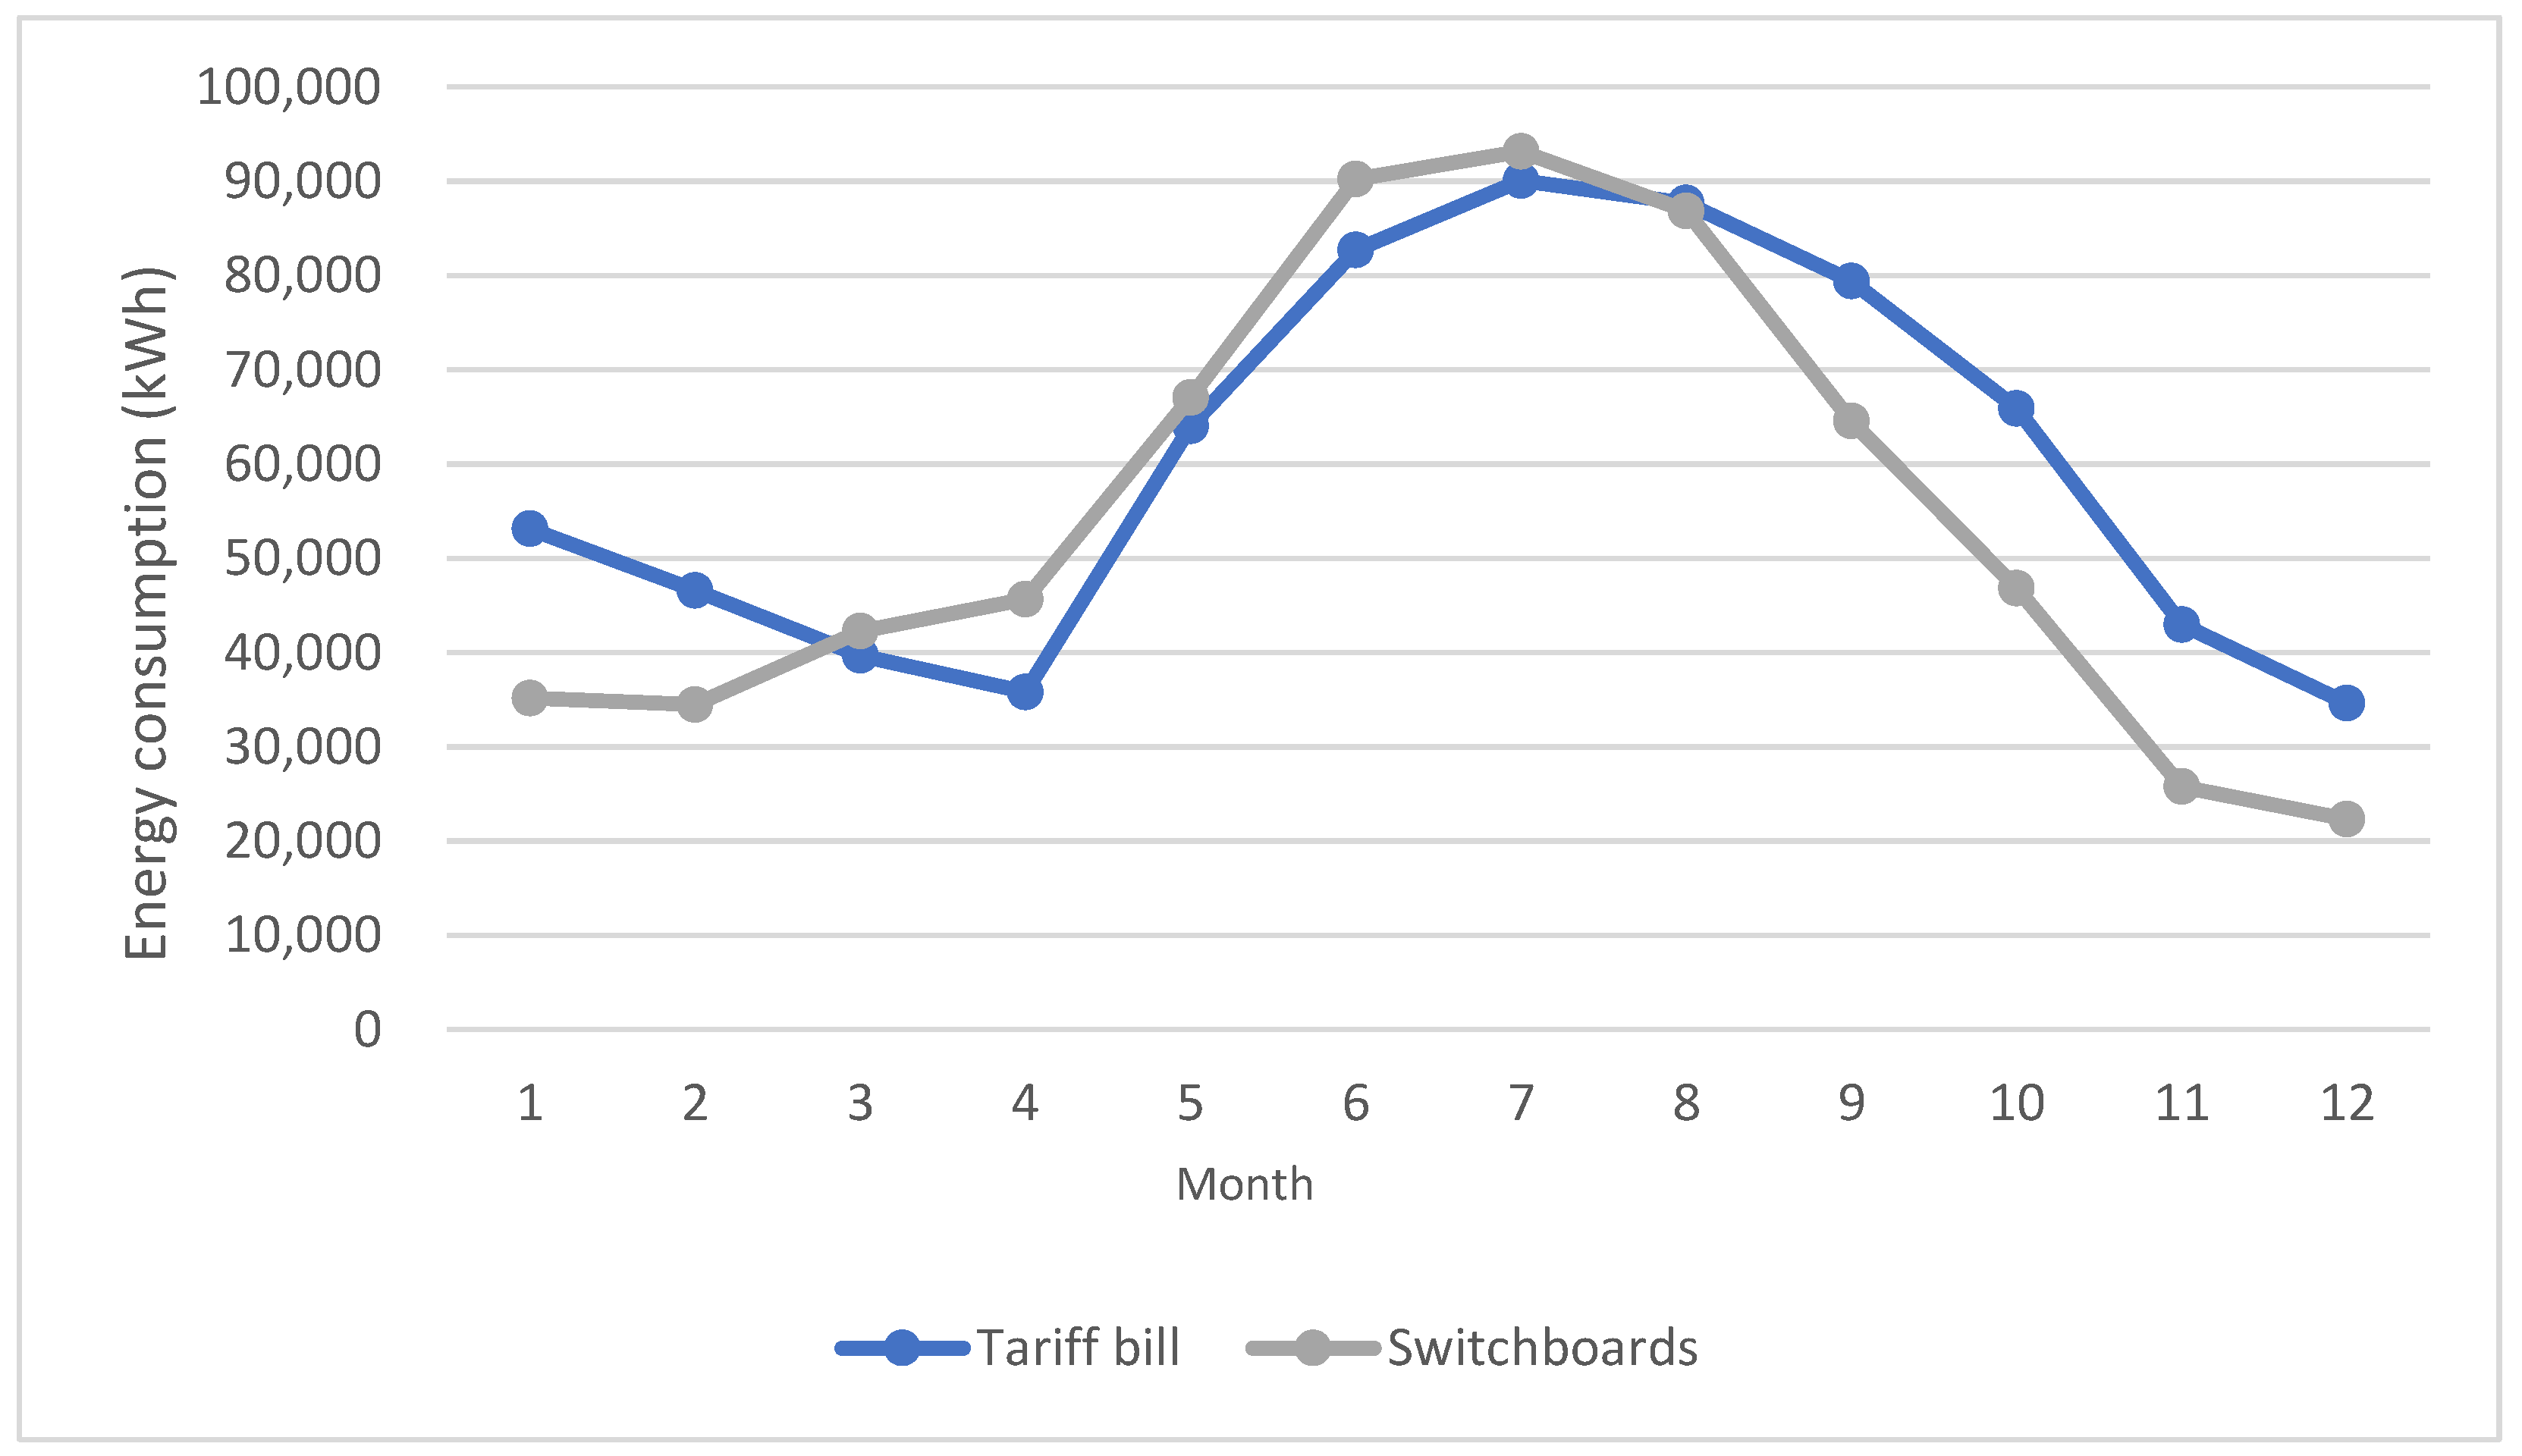
  • Electricity consumption from tariff bill;
  • Energy consumption data from switchboards of chiller plant.
  • Manual Recording of Equipment Operation.
Manually documenting start and stop times for equipment, load levels, and rough estimates of energy usage based on rated power is an often-employed method in the absence of computerized monitoring systems. It is, however, very much reliant on the observation and input of humans. In practice, the actual running times and load rates recorded by operating staff will often be approximate, introducing much uncertainty. As such, the method is limited in accuracy and is best reserved for short-term usage or initial energy assessments.
b.
Electricity Consumption from Tariff Bills.
The electricity bills give total energy use during a billing cycle, often monthly. The information is the total electricity use for the building or building complex, giving an overall picture of energy use patterns. Keep in mind that the amount the chiller system uses is only part of the total amount consumed, and it cannot be individually isolated from other building loads.
c.
Energy Consumption Data from Chiller Plant Switchboards.
Switchboard data provide higher granularity and system-specific information on energy usage. For the purposes of this case, an entire year of high-resolution energy usage information—from January 2023 through December 2023—had been pulled directly off the switchboards in the chiller plants. Such information provides for higher accuracy and specificity in the analysis of the chiller plant performance.
In order to analyze the quality of electricity bill data compared with switchboard data, the two types can be compared along multiple axes, including data accuracy, resolution in time, and the capacity for the measurement of specific system usage. Switchboard data allow for system-level information with greater resolution and specificity, yet utilizes electricity bill data for only the total monthly measurement. Differences might occur if the measurement intervals between the two datasets conflict. In order to reduce such differences, it is important that the billing cycle for the electricity company align with the operating periods in the switchboard data.
As shown in Figure 3, he 2023 electricity bill data were compared with the energy usage data from the switchboard in the chiller plant, and substantial differences in the annual usage patterns were noted. The electricity bill likely indicates the overall power usage throughout the chiller plant room, including perhaps not just the chillers proper but auxiliary equipment such as fans for ventilation, lighting, and other non-associated systems. Conversely, the switchboard data break down into greater specificity, permitting the association and segregation of the usage into an analysis for each component in the chiller system—e.g., the chillers, cooling towers, and pumps. With greater resolution and specificity, the switchboard data represent a better and more credible source for the chiller system annual usage analysis. As such, the analysis in this report relies on the chiller switchboard data for the energy performance analysis.

3.8. Control Strategy Prior to and After SC+BAS Implementation

3.8.1. Control Strategy Prior to SC+BAS Implementation

Before the implementation of the SC+BAS system, the chiller plant operated under a conventional control strategy that relied on manual adjustments and basic automation. The control strategy primarily focused on maintaining a constant chilled water supply temperature and flow rate, with limited real-time adjustments based on the cooling load. The chillers were operated in a fixed sequence, and the pumps and fans were controlled based on pre-set schedules. This approach, while effective in maintaining basic operational parameters, did not optimize energy usage or adapt dynamically to varying cooling demands.

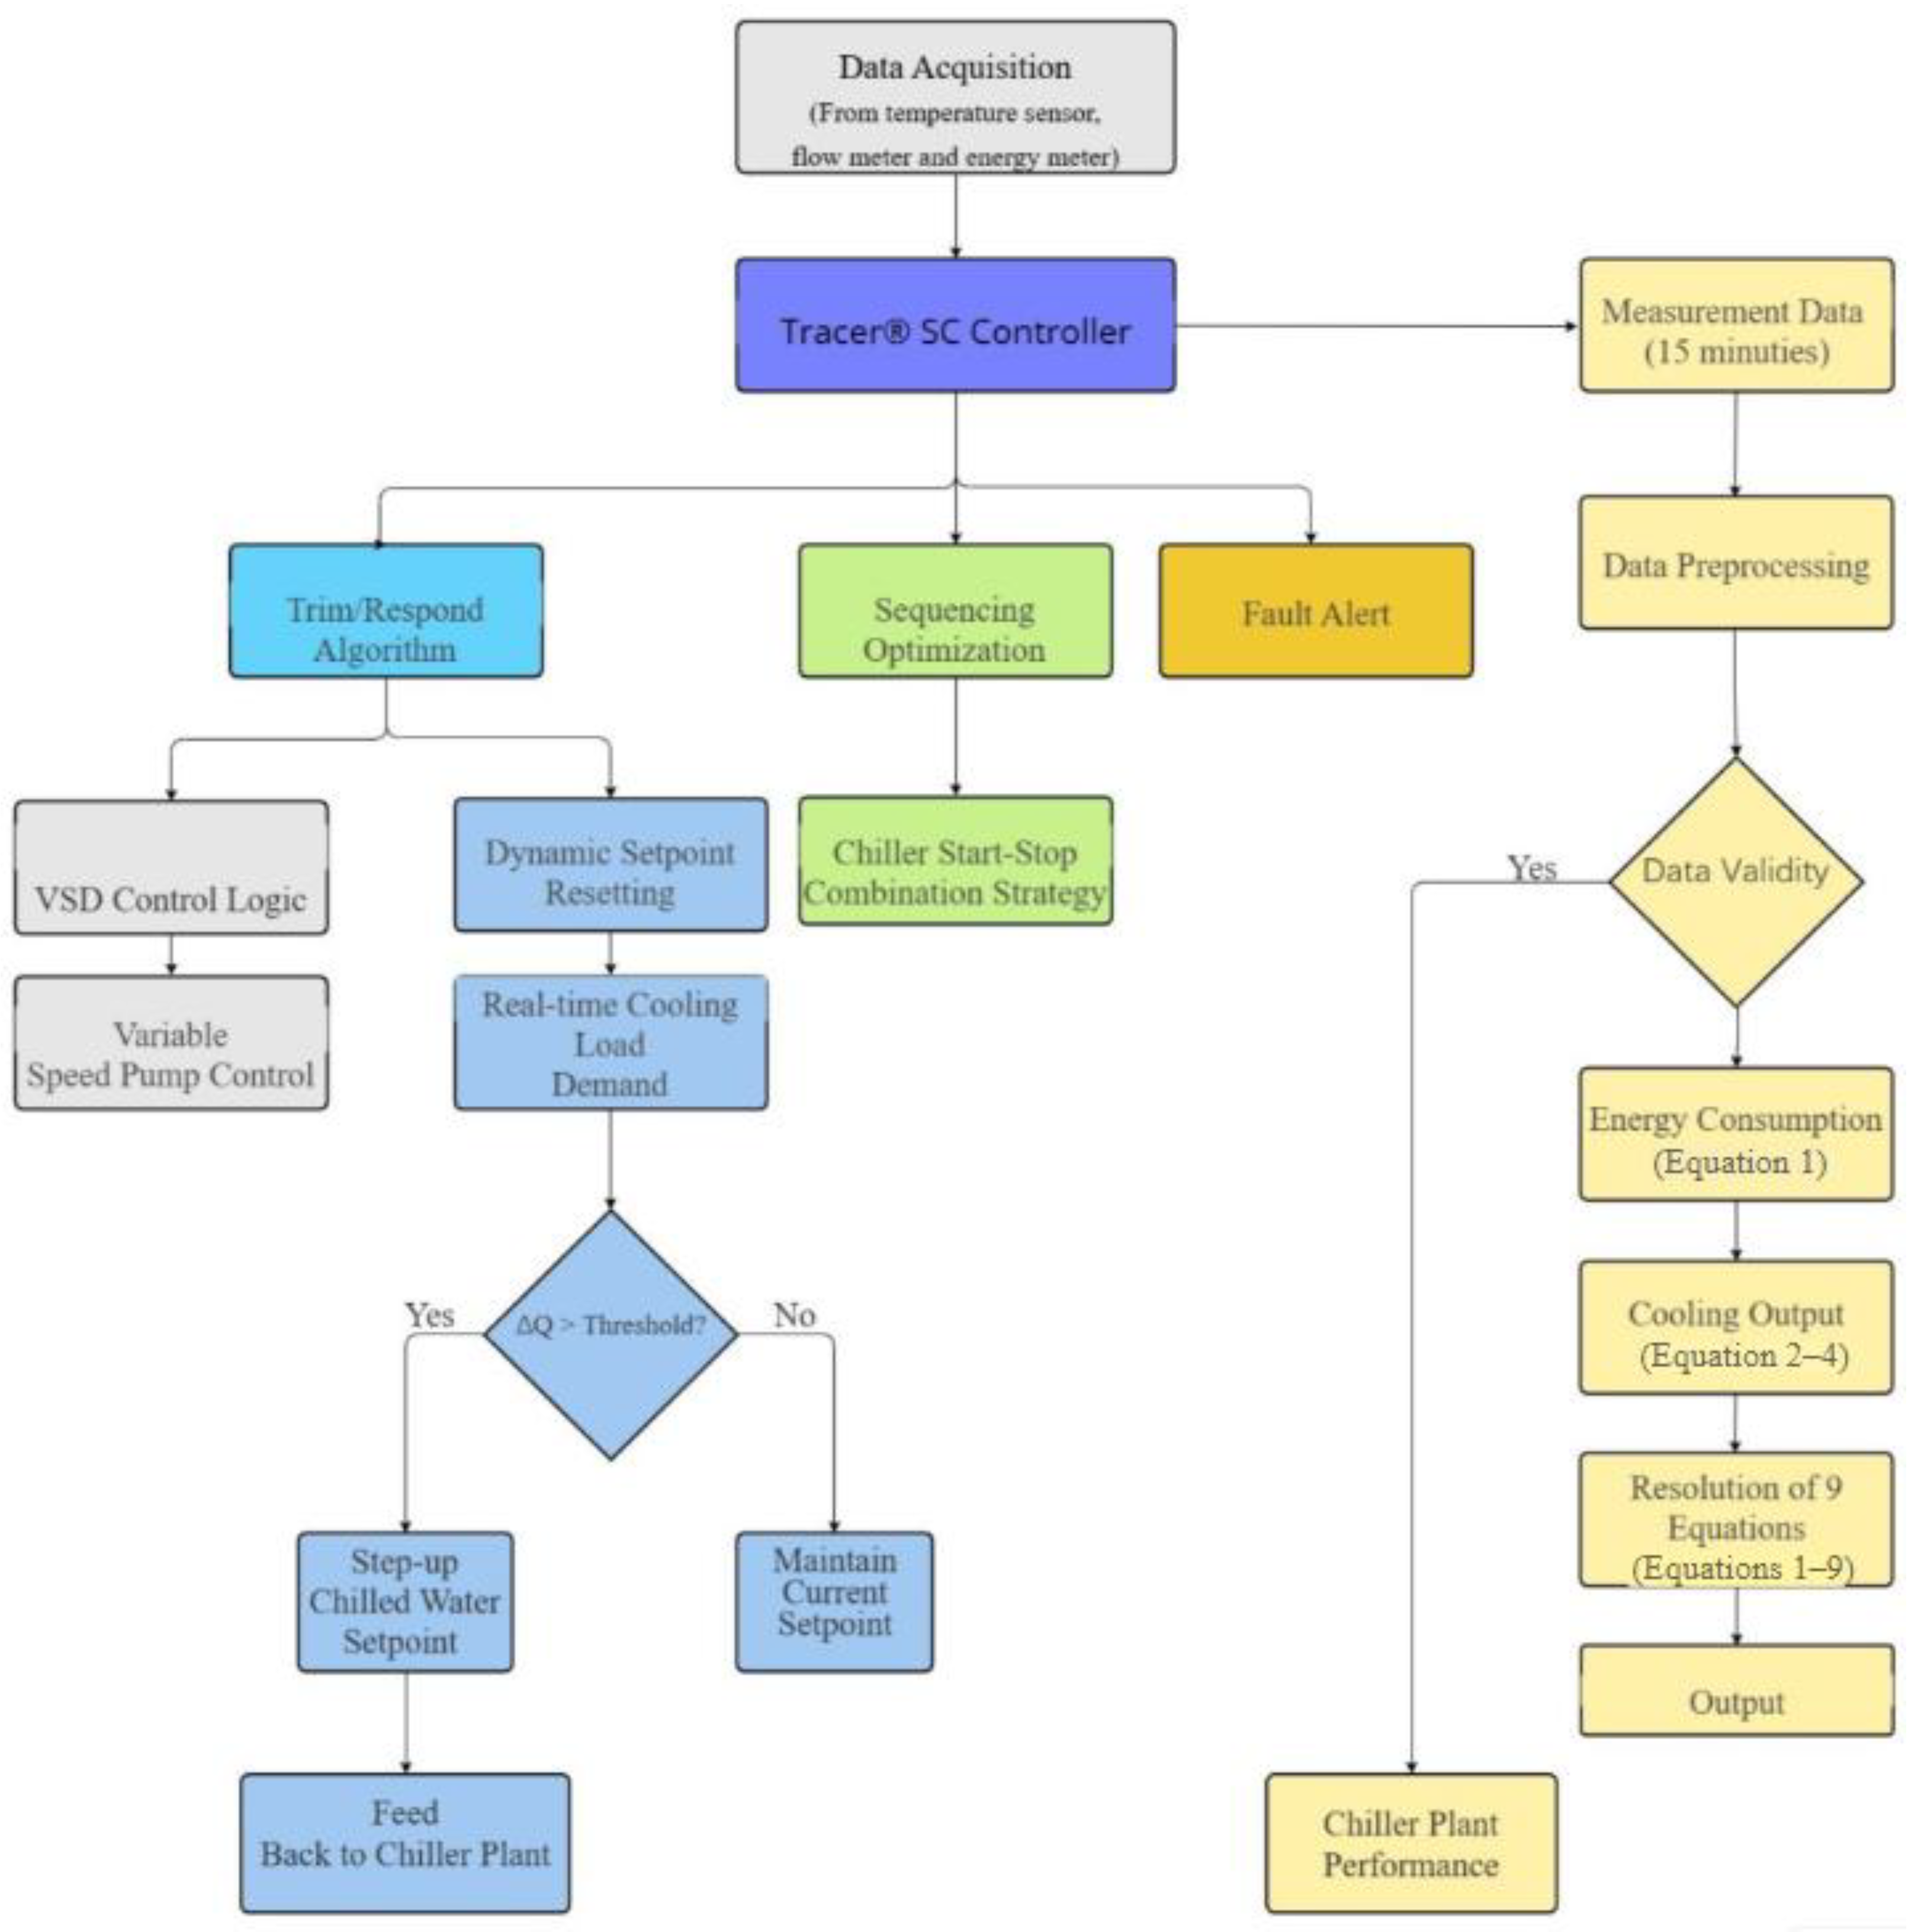
3.8.2. Optimized Control Strategy with SC+BAS Implementation

The introduction of the SC+BAS system allowed for a more sophisticated and dynamic control strategy. The optimized control strategy incorporates several advanced features, including:
  • Trim/Respond (T/R) Algorithm: This algorithm dynamically adjusts the setpoints for the chilled water temperature and flow rate based on real-time feedback from the sensors. The system continuously monitors the cooling load and adjusts the setpoints to maintain optimal performance while minimizing energy consumption.
  • Chiller Sequencing: The SC+BAS system optimizes the sequencing of the chillers based on the actual cooling demand. It dynamically adds or removes chillers from operation to match the load, ensuring that only the necessary number of chillers are running at any given time. This reduces energy waste and improves overall efficiency [31].
  • Variable Speed Drives (VSD): The optimized control strategy integrates VSD technology for the pumps and fans, allowing them to operate at variable speeds based on the actual load. This flexibility significantly reduces energy consumption compared to fixed-speed systems.
  • Real-Time Monitoring and Adjustments: The SC+BAS system continuously monitors key parameters such as temperature, flow rate, and power consumption. It uses this data to make real-time adjustments, ensuring that the system always operates at peak efficiency.

3.9. Climatic Context

Hong Kong exhibits predictable interannual thermal stability, with the Observatory recording annual mean temperature fluctuations consistently below ±1.0 °C in 85% of years since 2000 (Hong Kong Observatory, 2024). Although a warming trend exists (0.37 °C/decade in 1995–2024), modern commercial HVAC systems routinely compensate for variations exceeding ±2 °C—substantially above observed interannual swings. Consequently, single-year operational analysis remains valid for climate-adapted buildings in this regime [32].

4. Data Collection and Analysis

4.1. Analysis of Measurement Results

4.1.1. Monthly Results and Summary

The following parameters are the key results of the chiller plant in each month:
  • Monthly cooling output of chiller plant, Qtotal,m (kWh);
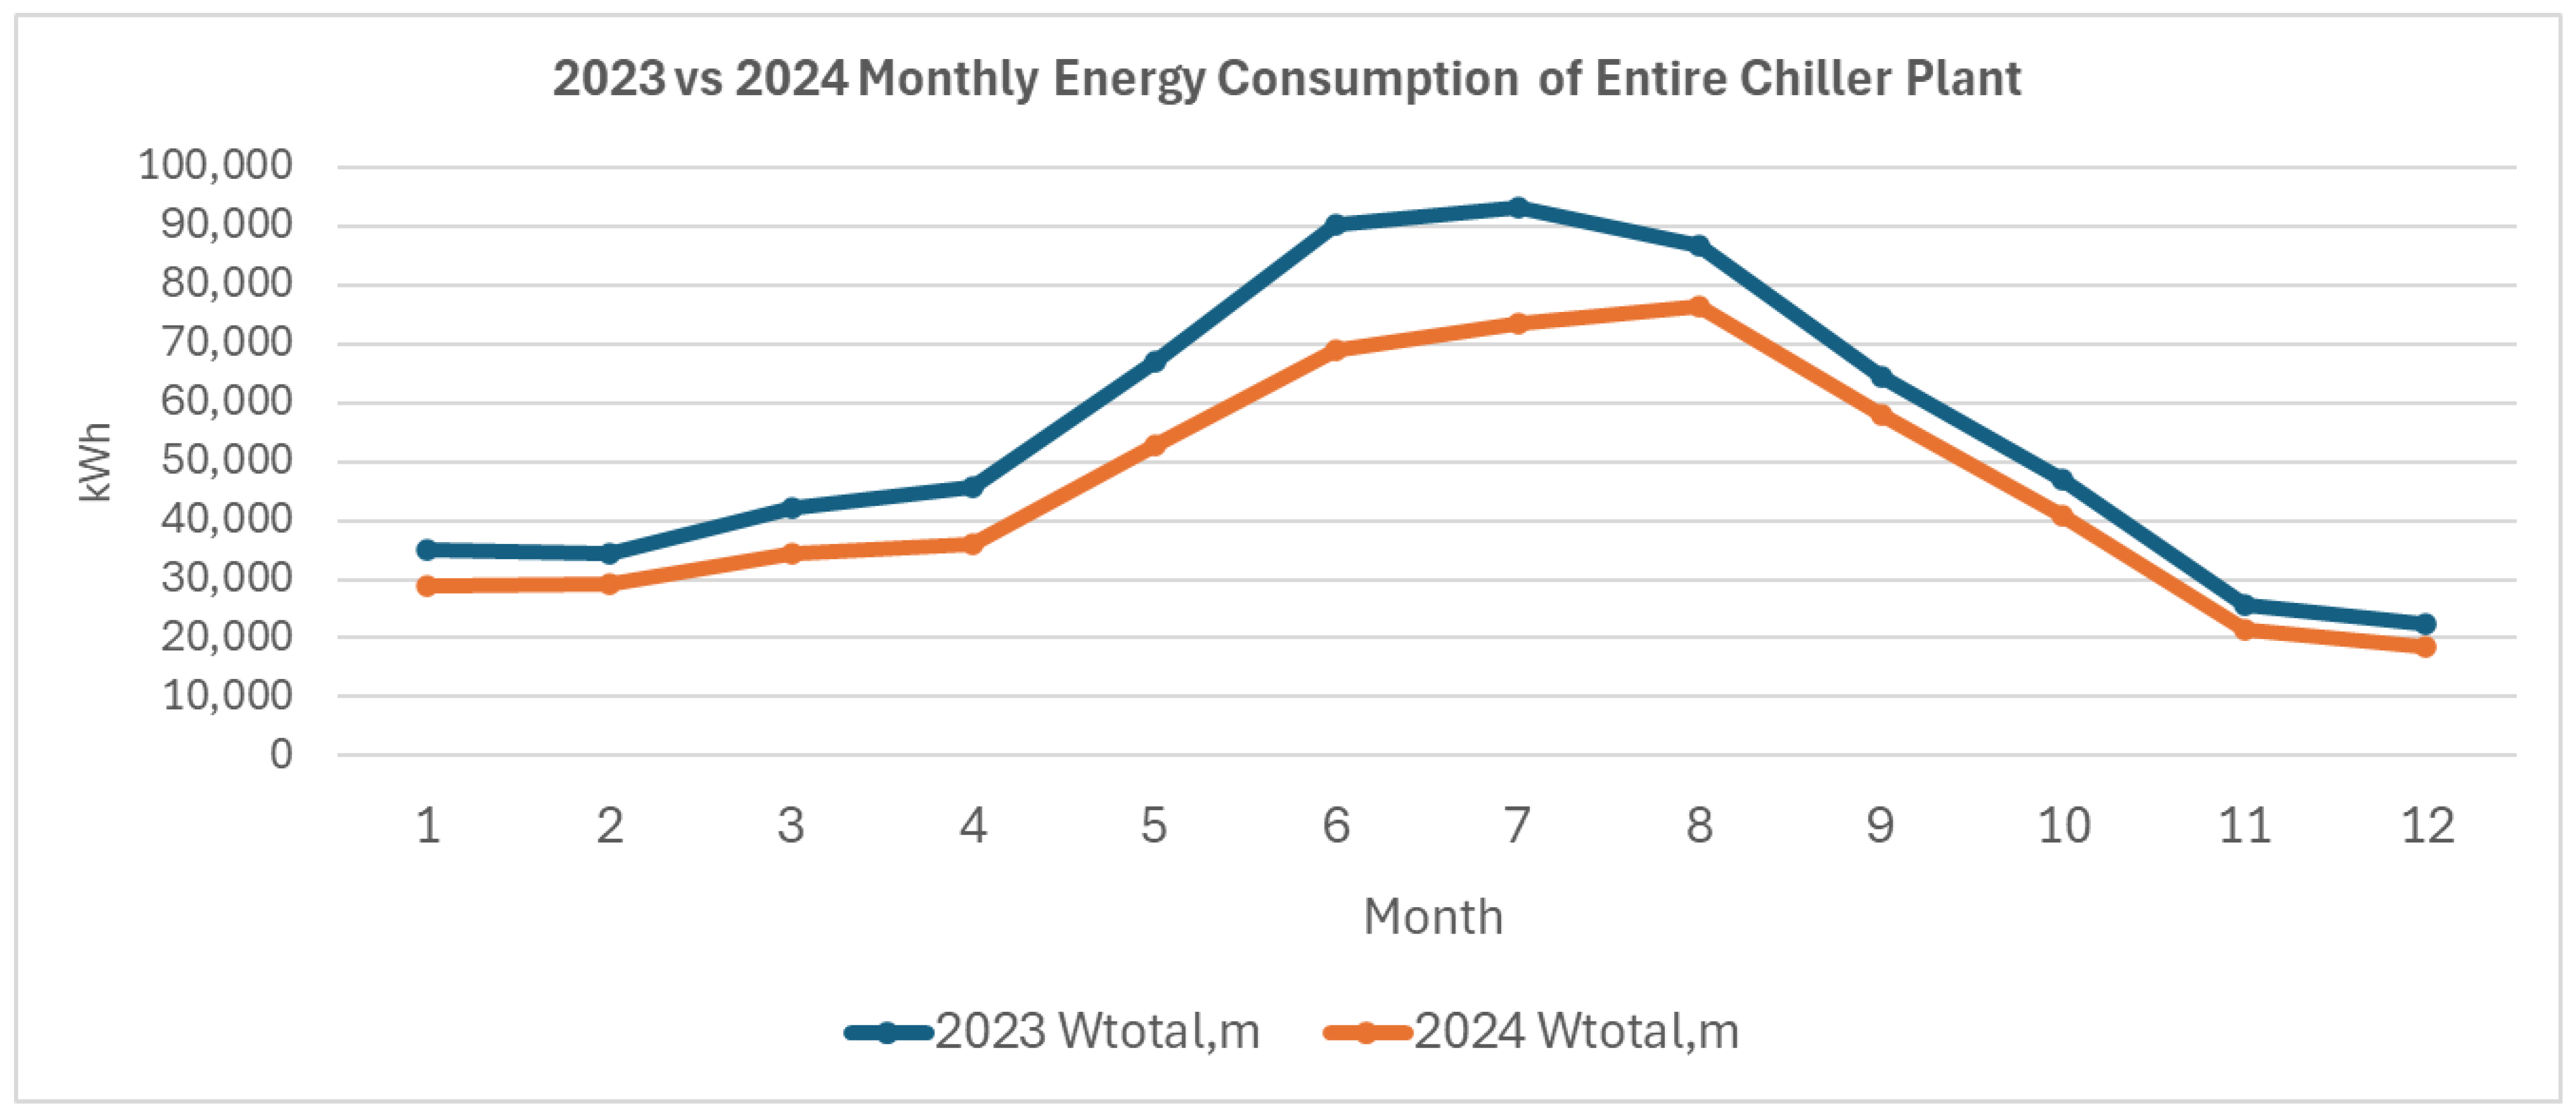
  • Monthly energy consumption of entire chiller plant, Wtotal,m (kWh);
  • Monthly overall COP of chiller plant, COPm;
  • Difference of monthly energy consumption between 2023 and 2024, DW (kWh);
  • Difference of monthly cooling output between 2023 and 2024, DQ (kWh);
  • Ratio of monthly 2024 energy consumption to 2023 energy consumption, Re.
The outcomes of these parameters for the months between January and December 2023 and January and December 2024 appear in Table 2. The trend analysis indicates sharper decreases in electricity usage and cooling load for the summer months (May through August). Conversely, the decrease in energy consumption and cooling demand is weaker for the winter months (November through February) because, by nature, these months involve lower cooling demands. Such observations indicate an acceptable seasonal shift in the cooling demand profile, following the anticipated changes in ambient conditions throughout the year.

4.1.2. Changes in Electricity Consumption

From the perspective of electricity consumption, the monthly electricity consumption (Wtotal,m) in 2024 showed a consistent reduction compared to 2023. This indicates a significant improvement in energy efficiency following the installation of the BMS.As shown in Figure 4, the reduction in electricity consumption varied across months, ranging from 12% to 23.4% (calculated based on Re values). For instance, the largest reduction occurred in June (ΔW = 21,132 kWh), while the smallest reduction was observed in December (ΔW = 3669 kWh).

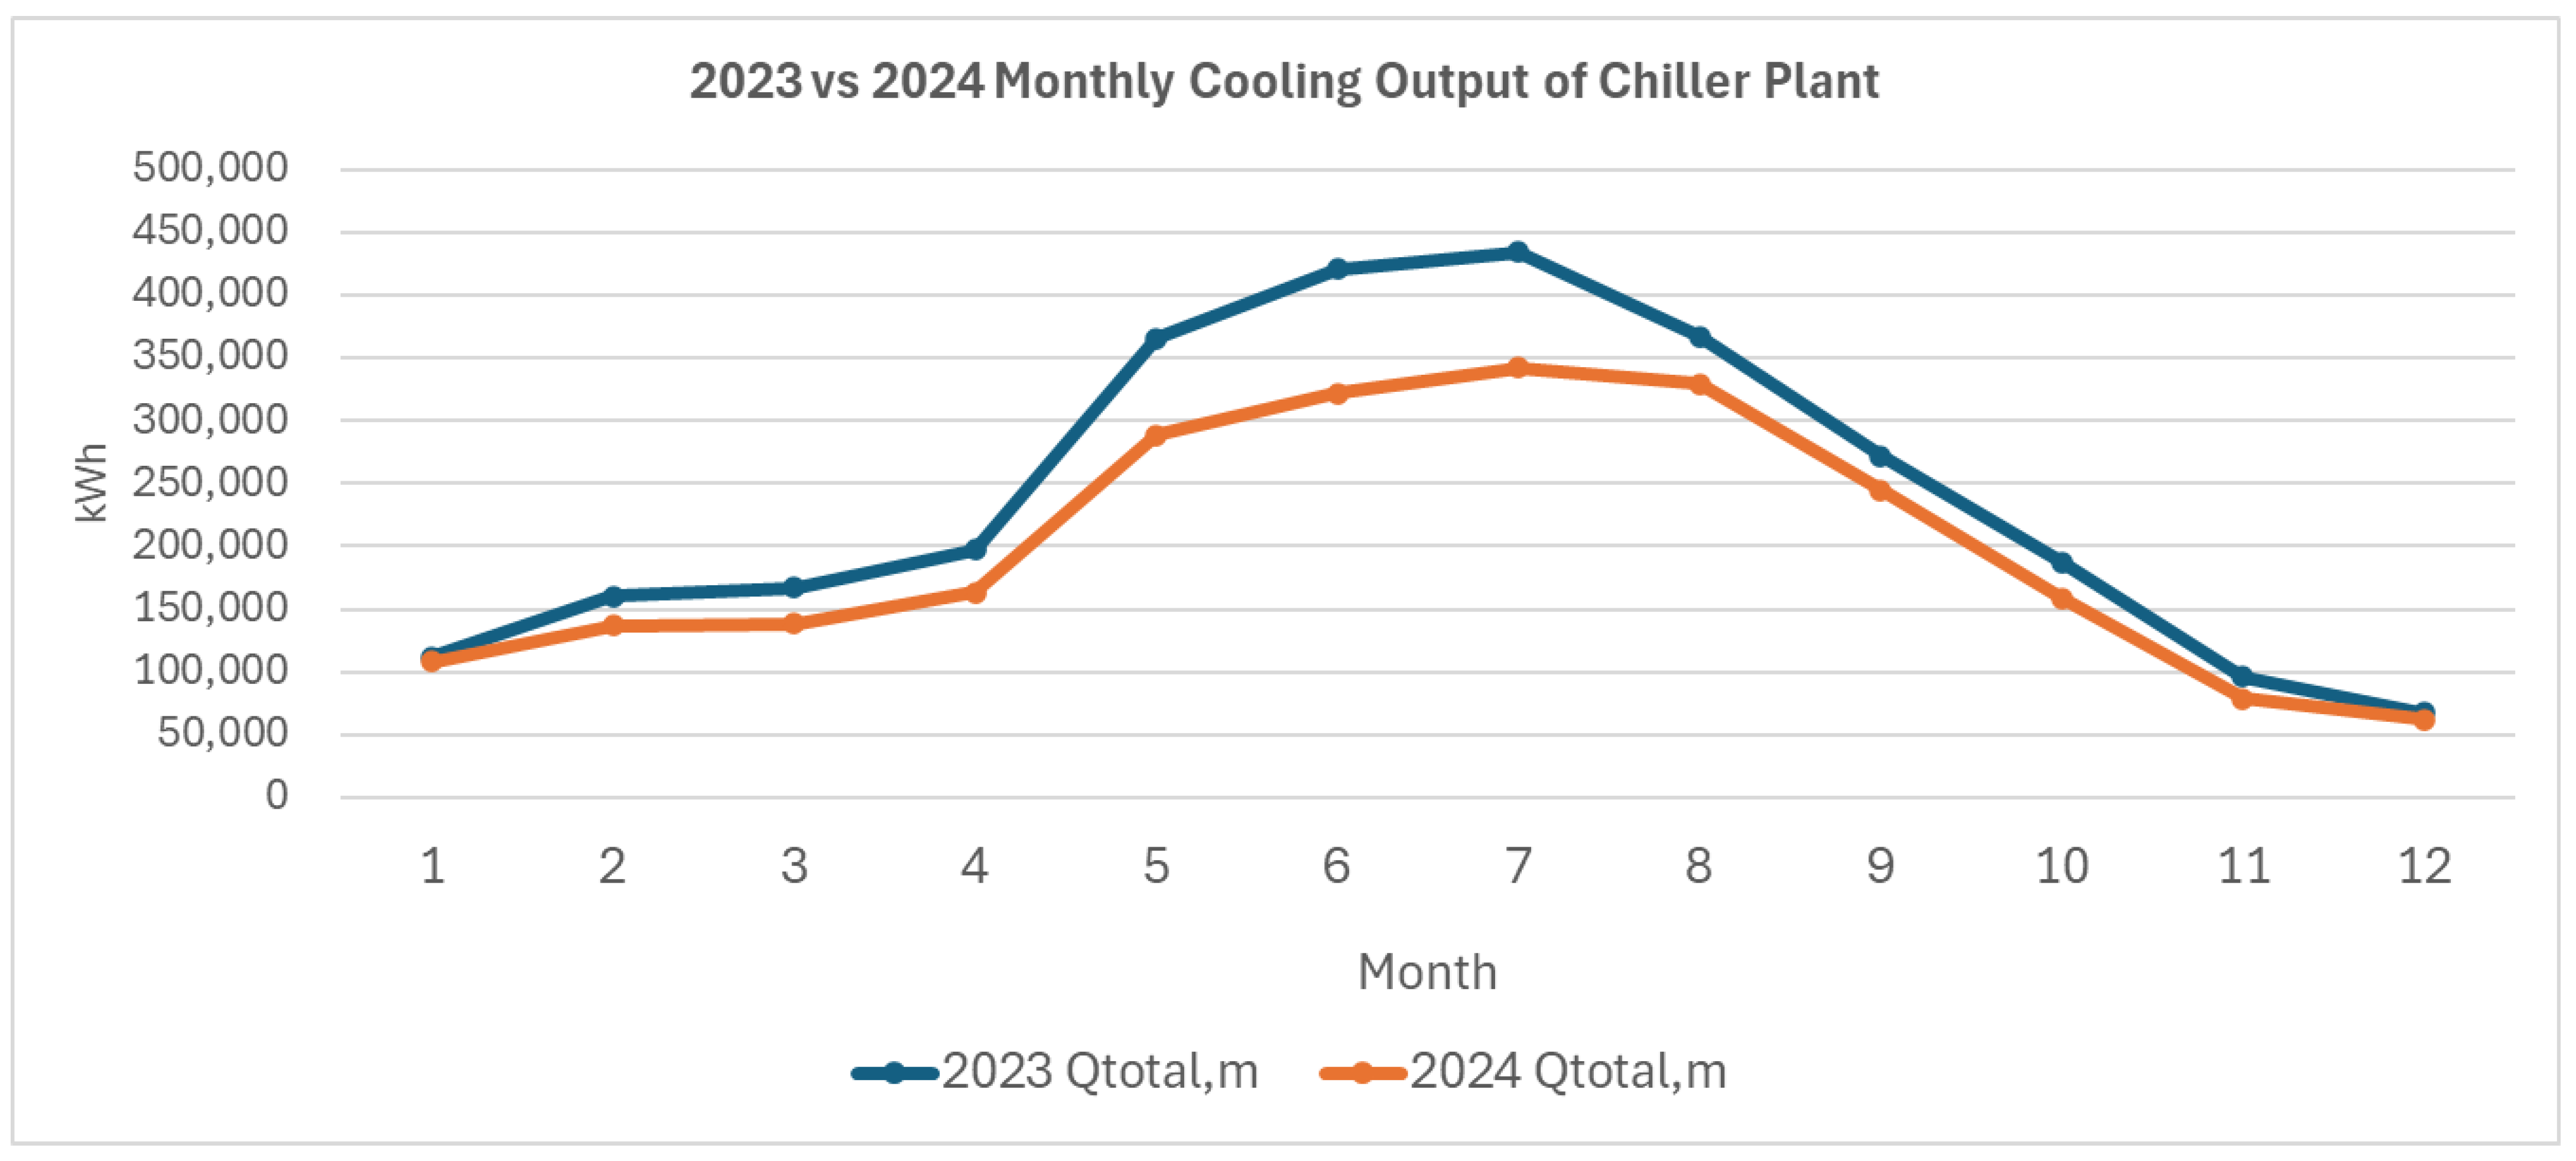
4.1.3. Changes in Cooling Load

As shown in Figure 5, aside from decreasing energy usage, the system showed a reduction in monthly cooling load (Qtotal,m) during 2024. This indicates that the BMS not only made the system more energy efficient, but it also optimized the cooling demand through the elimination of unnecessary loads. The minimum cooling load reduction occurred in January, with the decrease in cooling load from 111,877 kWh down to 107,786 kWh. The greatest drop in cooling load was seen in June, where the cooling load reduced from 420,849 kWh down to 321,640 kWh. It is most likely that the reduction is the result of the BMS fine-tuning the systems for smoother operations and the prevention of unnecessary overcooling, thereby maximizing overall efficiency.

4.1.4. Changes in System Efficiency (COP)

A detailed examination of the monthly Coefficient of Performance (COPm) reveals that system efficiency improved in most months of 2024, indicating enhanced energy performance of the chiller plant. For example, the COPm increased from 3.18 to 3.74 in January, and from 4.32 to 4.52 in April, reflecting a more efficient conversion of electrical energy into cooling output. However, in some months, the improvements were marginal—such as in June and July—or even slightly negative, as observed in October, where the COPm declined from 4.01 to 3.87. These findings indicate that, in general, the chiller system was more efficient under normal operating conditions in 2024, presumably aided by efficient evaporative cooling-based heat rejection methods. Variability in the efficiency of the system among different months can be explained as being influenced by external environmental conditions or varying load conditions. The COP is still an important and accepted method for assessing the operating efficiency of chillers under different demand conditions.

4.1.5. Energy Savings

ΔW is the monthly electricity savings, from 3669 kWh (December) to 21,132 kWh (June), in terms of energy savings. Re, on the other hand, shows the ratio of electricity use between 2023 and 2024, from 0.766 (June) to 0.896 (September). Specifically, a lower Re value indicates more obvious energy savings. For instance, Re = 0.766 in June suggests that the 2024 power use was only 76.6% of the 2023 one, resulting in 23.4% savings. On the other hand, a higher Re value indicates lower energy savings. For example, Re = 0.896 in September indicates that the 2024 power use was 89.6% of the 2023 consumption, resulting in 10.4% energy savings.

4.1.6. Cost–Benefit Analysis

By comparing the power consumption and the related costs between the reference year 2023 and the year after the installation in 2024, the paper measures the energy and cost saving through the installation of the SC+BAS system. The electricity tariff rates applied in the analysis hereunder are derived from the non-residential electricity tariff schedule issued by CLP Power Hong Kong Limited [33,34], with charges per unit at 103.1 cents/kWh in 2023 and 106 cents/kWh in 2024, an increase in the cost for each unit by 2.8%.
The fuel adjustment charge, varying each month based on actual versus projected fuel expense differences, has been omitted from the electricity cost analysis. It has been omitted because it may be influenced by differences in timing, geographically, or in utility policies, that would bias the analysis.
Also left out is the energy-saving rebate, being offered only for actual metered consumption and not for estimated usage, in order for the comparison to be accurate and consistent.
Table 3 presents the outcomes of the energy and cost saving analysis. Detailed monthly calculations for the three stand-alone chillers for the two years are presented in Table 4.
Applying the greenhouse gas emissions intensity in 2024 of 0.53 kg CO2e/kWh from the CLP Power Hong Kong Limited 2024 Annual Report [35], the carbon emission reduction is 61,109.64 kg CO2e (i.e., 115,301.21 kWh × 0.53 kg CO2e/kWh), which is 61.1 tonnes of CO2 equivalent in greenhouse gas emissions (t CO2e).
In short, the above analysis identifies an impressive annual cost saving of HKD $103,242 (15.3%) evidencing the organization’s focus on economic resilience as well as sustainable operations. At the same time, the 2024 energy use is complemented by an estimated 61.11 tonnes of CO2 equivalent in greenhouse gas emissions. Both cost-saving and environmental performance represent combined requirements for holistic urban sustainability analysis and long-term strategy planning. The analysis identifies the imperative for further efforts in reducing emissions and green energy alternatives. As urban areas and industries transition toward decarbonization, organizations need to find balance between economic performance and environmental stewardship—meaningfully contributing toward overall sustainability objectives while reinforcing competitiveness in an increasingly green-conscious urban development model.

5. Discussion

5.1. Savings Through the Integration of SC+BAS

Since the 2024 installation of the SC+BAS system, both energy usage and the related costs decreased substantially. In particular, the annual power usage decreased 115,301.21 kWh, representing 17.6%, while actual cost saving totaled HKD 103,241.98, 15.3% less. The result proves the effectiveness in saving energy through the SC+BAS and its substantial contribution towards enhanced energy efficiency as well as lower operating expenses.
The significant 17.6% decrease in energy consumption noticed in an average urban shopping mall can be contributed to many important features and operational optimizations facilitated through the SC+BAS:

5.1.1. Advanced Monitoring and Control of Chiller Operations

One of the principal advantages of the SC+BAS is its capacity for detailed, real-time monitoring and control of chiller performance. Via the application of automated devices and smart control algorithms, including Trim/Respond logic, the system makes dynamic adjustments in setpoints in response to real-time feedback. This allows the chillers to respond optimally under conditions of varying loads, reducing unnecessary energy usage without impeding cooling performance.

5.1.2. Chilled Water Temperature Reset Methods

Temperature reset using chilled water is another important consideration. Dynamically manipulating chilled water temperature setpoints (CWP) through real-time data and predetermined optimization algorithms, the system minimizes compressor lift, notably in times of low cooling demand. This directly improves the coefficient of performance (COP) for the chillers, and overall system efficiency.

5.1.3. Variable Speed Drive (VSD) Technology Integration

The use of Variable Speed Drive (VSD) technology saves considerably in energy. In comparison with conventional constant-speed systems, VSDs enable motors in fans and pumps to vary their operating speeds in response to actual load conditions. This flexibility helps save power through efficient utilization, particularly under part-load conditions, reducing power usage overall.

5.1.4. Demand-Based Cooling Strategies

SC+BAS further accommodates demand-based cooling strategies. With real-time analysis of occupancy and thermal loads, the system can curtail cooling delivery in low-traffic and vacant spaces during off-peak periods. It saves energy through the targeted strategy that prevents unnecessary cooling in poorly occupied spaces, further reducing the energy wastage throughout the mall.

5.1.5. Improved Maintenance Procedures and Predictive Control

Apart from operational efficiency, the SC+BAS optimizes maintenance activities through predictive analytics. Using continuous monitoring of system performance, the system will detect the likelihood of equipment failure beforehand, allowing for predictive maintenance. This minimizes unexpected downtime, improves equipment longevity, and provides high operating efficiency consistently. The system can further distribute the load among multiple chillers such that the most efficient equipment will be reserved for partial-load operations.
In conclusion, the 17.6% energy saving measured is an outright consequence of the holistic and synergetic features of the SC+BAS, combining real-time monitoring, smart algorithms, dynamic setpoint control, VSD integration, load-responsive cooling, and upgraded monitoring and maintenance procedures. In combination, these features allow the chiller plant to maintain its efficiency in all operating conditions. The outcomes from the applied project clearly identify that SC+BAS systems can save significant energy, in particular if the system is optimized in such a manner that it dynamically adjusts in response to the real-time needs—maximizing the performance and contributing towards larger scale sustainability for urban commercial buildings.

5.2. Recommended Enhancement Initiatives

In pursuit of further enhancing the performance and efficiency of the chiller plant within the shopping mall, the following strategies are proposed:

5.2.1. Optimization of Chiller Sequencing and Load Balancing

Advanced sequencing control for the chillers can make it start, stop, and load rank the chillers in response to real-time cooling loads. It optimizes chiller usage, especially in partial loads, and minimizes the running of extra units. Dynamic load balancing through the BAS improves the performance of the system further by distributing the loads evenly, thereby eliminating overload and underutilization of the chillers.
While existing Trim/Respond logic accommodates simple start-stop control and load modulation, it mainly runs on fixed parameters and pre-programmed control procedures. This constrains its capacity for responding to uncertain future conditions and sophisticated scenarios. For instance, fixed scheduling for the activation of chillers may not be best suited in the case of varying cooling loads. To break beyond this constraint for deeper energy saving, the incorporation of artificial intelligence (AI) is suggested. In an AI-augmented system, the building thermal behaviour and actual operational data can be analyzed for chiller sequencing and load distribution optimization in real-time. In the pilot project carried out in the Hong Kong MTR Corporation, such AI-based predictive control realized an extra 8.7% annual energy saving through real-time optimization of the chiller operations—showcasing better performance in comparison with conventional rule-based approaches [36].

5.2.2. Implementation of Demand-Based Cooling Strategies

The BAS should be utilized further to enforce demand-based cooling through the modulation of chiller outputs with respect to real-time occupancy and local cooling requirements. Off-peak cooling in low-traffic areas or zones that remain vacant can be downsized using occupancy detectors or foot traffic analysis. The BAS should be combined with Variable Air Volume (VAV) systems to facilitate zonal cooling optimization for the distribution of cooling only where it is necessary. Such centralized cooling avoids wasting energy and supports smart building concepts for efficient HVAC operations.

5.2.3. Optimizing Chiller Plant Maintenance and Operation

A properly planned maintenance program is needed, according to the Electrical and Mechanical Services Department (EMSD) in its Best Practices for Operation and Maintenance Service. Preventing equipment failure induced by normal wear, neglect, and fatigue is contingent on conducting preventive maintenance. Keeping the chiller plant operating at its best efficiency and reducing unexpected repair expenses hinges on the replacement of worn parts prior to actual failure.
The shopping mall is not currently integrated with artificial intelligence. Faults in the chiller plant hence are only discovered after they occur, increasing the cost of repair and potentially leading to downtime. Preventative work is typically performed on a schedule, independent of the actual condition of the equipment, hence creating unnecessary work at times.
The use of artificial intelligence (AI) and the incorporation with SC+BAS will assist in enhancing the quality and upkeep of chiller plants. Merging the two will assist in the development of predictive maintenance. AI identifies patterns for potential equipment failure utilizing real-time analysis from SC+BAS, such as temperature, pressure, and flow rates. It provides the benefit of undertaking the upkeep ahead of actual breakdown, hence decreasing the cost of repair and enhancing equipment lifespan.
In summary, the suggested improvement measures will enhance the energy efficiency of the chiller plant, increase system reliability, extend equipment life, and provide a better climate for the tenants and visitors. Moreover, the measures will maximize operational efficiency and save considerable costs, ensuring the overall sustainability and efficiency of the shopping mall.

6. Conclusions

The overall analysis of the SC+BAS deployed in the urban shopping mall offers an in-depth analysis of its effect on chiller energy efficiency and the resultant economic advantages. The analysis uncovered discernible changes in the energy usage characteristics and operating efficiency of the chiller plant after the installation of the BAS, necessitating an in-depth investigation of the performance of the system.
A comparative assessment of monthly energy usage and cooling production clearly identifies the Supervisory Control and Building Automation System (SC+BAS) as the best approach to maximize chiller operations. Significantly, in the months when cooling requirements were the highest, the energy usage was notably less, such that the chiller plant in 2024 showed a 17.6% decrease in usage as compared to 2023. At the same time, the overall Coefficient of Performance (COP) of the chillers increased in most months, reflecting greater operational efficiency. All these clearly prove the chiller plant performance in maximizing the cooling loads while reducing unnecessary usage of energy, thus contributing towards greater overall energy efficiency in the HVAC system. All these conform with conventional building performance optimization and sustainable design practices.
The cost–benefit analysis emphasizes the economic benefits accruing from the implementation of the SC+BAS. The annual electricity spending was reduced by 15.3%, presenting significant economic benefits for the shopping center. In defiance of the increase in electricity charges in 2024, the SC+BAS recorded major energy savings, resulting in net cost savings worth HKD 103,241.98. The figure reflects the economic feasibility and long-run economic returns from investing in advanced building automation systems. The recorded saving presents empirical proof for the implementation of the system as an approach towards attaining environmental and economic sustainability in the operation of commercial buildings.
In addition, the case study highlights the pivotal value of urban science for maximizing building performance in the complex framework of urban contexts. Utilizing data-driven insights together with advanced control systems, we can advance the design of smarter, more efficient urban infrastructure. The fruitful realization of the application of SC+BAS demonstrates an exemplary application of urban science concepts, promoting the minimization of energy usage and costs at the shopping mall. It provides an actionable framework for similar implementations in other urban environments, in compliance with the global goals for realizing smarter, more sustainable, and environmentally-stewardship-based urban environments. Future work needs to address the scale and flexibility of such an application in varying building typologies and urban environments for maximizing related impact on urban sustainability.

Limitations and Future Research Directions

While this study provides robust empirical evidence for the efficacy of SC+BAS in enhancing chiller plant efficiency, several limitations warrant acknowledgment. First, the analysis is based on a single case study in a high-density urban shopping mall. The unique operational context (e.g., subtropical climate, specific occupancy patterns, and existing equipment configurations) may limit the direct generalizability of results to other building typologies (e.g., offices, hospitals) or climatic zones. Second, external variables such as annual weather fluctuations and post-pandemic occupancy recovery (2023–2024) were not fully isolated, though monthly trend analysis (Section 4.1) confirms consistent energy savings. Third, the SC+BAS implementation focused on operational optimization rather than hardware upgrades (e.g., chiller replacements); thus, savings are attributable to control logic enhancements, not capital improvements.
These limitations illuminate critical pathways for future research:
  • Multi-Building Validation: Replicate this study across diverse commercial buildings (e.g., offices, hotels) and climatic regions to develop scalable energy-saving benchmarks for SC+BAS.
  • AI Integration: Explore hybrid “SC+BAS+AI” frameworks (e.g., embedding reinforcement learning for setpoint optimization, as in Qiu et al. [37]), building on our recommendation in Section 5.2.1. Pilot data from Hong Kong’s MTR suggest potential for more than 8% additional savings.
  • Holistic Sustainability Metrics: Extend analysis to non-energy benefits (e.g., maintenance cost reduction, equipment lifespan extension, thermal comfort quantification) to strengthen cost–benefit arguments for SC+BAS adoption. Addressing these directions will advance the role of data-driven automation in achieving carbon-neutral urban infrastructure.

Author Contributions

F.M.-L.A. and L.B.N.; methodology, F.M.-L.A. and L.B.N.; software, L.B.N.; validation, F.M.-L.A. and L.B.N.; formal analysis, L.B.N.; investigation, L.B.N.; resources, F.M.-L.A.; data curation, L.B.N.; writing—original draft preparation, L.B.N.; writing—review and editing, F.M.-L.A. and L.B.N.; visualization, L.B.N.; supervision, F.M.-L.A.; project administration, F.M.-L.A. All authors have read and agreed to the published version of the manuscript.

Funding

This research received no external funding.

Data Availability Statement

The data presented in this study are not publicly available due to ethical and privacy restrictions. Requests to access the datasets should be directed to the corresponding author.

Acknowledgments

I would like to express my gratitude to the building owner and Hang Lung Real Estate Agency Limited for their invaluable support in providing all necessary documents, drawings, and technical data related to the control panels and energy meters of the chiller plant. Their collaboration ensured access to the corresponding two-year electricity tariff in 2023 and 2024, which was essential for this analysis.

Conflicts of Interest

The authors declare no conflict of interest.

Abbreviations

SC+BASSupervisory Control plus Building Automation System
COPCoefficient of Performance
VSDVariable Speed Drive
ANNArtificial Neural Network
HVACHeating, Ventilation, and Air Conditioning
AIArtificial Intelligence
CPCChiller Plant Control
T/RTrim/Respond
VSDVariable Speed Drives

References

  1. Trane. Product Catalog Tracer SC+ System Controller with the Tracer Synchrony User Interface. 2021. Available online: https://www.tranehk.com/files/Products/BAS-PRC087D-EN%2020Aug2021.pdf (accessed on 24 January 2025).
  2. Hong, S.H.; Kim, S.H.; Kim, G.M.; Kim, H.L. Experimental evaluation of BZ-GW (BACnet-ZigBee smart grid gateway) for demand response in buildings. Energy 2014, 65, 62–70. [Google Scholar] [CrossRef]
  3. Li, Y.; Hong, S.H. BACnet–EnOcean smart grid gateway and its application to demand response in buildings. Energy Build. 2014, 78, 183–191. [Google Scholar] [CrossRef]
  4. Moosavi, S.A.; Asgari, M.; Kamel, S.R. Developing a comprehensive BACnet attack dataset: A step towards improved cybersecurity in building automation systems. Data Brief 2024, 57, 111192. [Google Scholar] [CrossRef] [PubMed]
  5. Elamanov, S.; Son, H.; Flynn, B.; Yoo, S.K.; Dilshad, N.; Song, J. Interworking between modbus and internet of things platform for industrial services. Digit. Commun. Netw. 2024, 10, 461–471. [Google Scholar] [CrossRef]
  6. Elehwany, H.; Gunay, B.; Ouf, M.; Cotrufo, N.; Venne, J. Evaluating common supply air temperature setpoint reset strategies with varying occupancy patterns and behaviours. Build. Environ. 2024, 266, 112129. [Google Scholar] [CrossRef]
  7. American Society of Heating, Refrigerating and Air-Conditioning Engineers. ASHRAE Guideline 36-2018: High-Performance Sequences of Operation for HVAC Systems; American Society of Heating, Refrigerating and Air-Conditioning Engineers: Atlanta, GA, USA, 2018; Available online: https://kh.aquaenergyexpo.com/wp-content/uploads/2023/02/High-Performance-Sequences-of-Operation-for-HVAC-Systems.pdf (accessed on 10 February 2025).
  8. Van Roosmale, S.; Hellinckx, P.; Meysman, J.; Verbeke, S.; Audenaert, A. Building Automation and Control Systems for office Buildings: Technical Insights for Effective Facility Management—A Literature review. J. Build. Eng. 2024, 97, 110943. [Google Scholar] [CrossRef]
  9. Kang, W.H.; Yoon, Y.; Lee, J.H.; Song, K.W.; Chae, Y.T.; Lee, K.H. In-situ application of an ANN algorithm for optimized chilled and condenser water temperatures set-point during cooling operation. Energy Build. 2021, 233, 110666. [Google Scholar] [CrossRef]
  10. Fong, K.; Hanby, V.; Chow, T. HVAC system optimization for energy management by evolutionary programming. Energy Build. 2005, 38, 220–231. [Google Scholar] [CrossRef]
  11. Thu, K.; Saththasivam, J.; Saha, B.B.; Chua, K.J.; Murthy, S.S.; Ng, K.C. Experimental investigation of a mechanical vapour compression chiller at elevated chilled water temperatures. Appl. Therm. Eng. 2017, 123, 226–233. [Google Scholar] [CrossRef]
  12. Schibuola, L.; Scarpa, M.; Tambani, C. Variable speed drive (VSD) technology applied to HVAC systems for energy saving: An experimental investigation. Energy Procedia 2018, 148, 806–813. [Google Scholar] [CrossRef]
  13. Wang, L.; Greenberg, S.; Piette, M.A.; Meier, A.; Fiegel, J. Data analysis and modeling of an all-variable speed water-cooled chiller plant. In Proceedings of the ASHRAE Annual Conference; American Society of Heating, Refrigerating and Air-Conditioning Engineers (ASHRAE): Atlanta, GA, USA, 2015; Available online: https://www.ashrae.org (accessed on 13 February 2025).
  14. Liu, Z.; Tan, H.; Luo, D.; Yu, G.; Li, J.; Li, Z. Optimal chiller sequencing control in an office building considering the variation of chiller maximum cooling capacity. Energy Build. 2017, 140, 430–442. [Google Scholar] [CrossRef]
  15. Building Authority. Code of Practice for Overall Thermal Transfer Value in Buildings; Building Authority: Hong Kong, 1995. Available online: https://www.bd.gov.hk/doc/en/resources/codes-and-references/code-and-design-manuals/OTTV1995_e.pdf (accessed on 14 February 2025).
  16. Pompei, L.; Nardecchia, F.; Viglianese, G.; Rosa, F.; Piras, G. Towards the Renovation of Energy-Intensive Building: The Impact of Lighting and Free-Cooling Retrofitting Strategies in a Shopping Mall. Buildings 2023, 13, 1409. [Google Scholar] [CrossRef]
  17. United Nations Framework Convention on Climate Change (UNFCCC). The Paris Agreement. 2021. Available online: https://unfccc.int/process-and-meetings/the-paris-agreement (accessed on 30 May 2025).
  18. de Kleijne, K.; Hanssen, S.V.; van Dinteren, L.; Huijbregts, M.A.J.; van Zelm, R.; de Coninck, H. Limits to paris compatibility of CO2 capture and utilization. One Earth 2022, 5, 168–185. [Google Scholar] [CrossRef]
  19. Intergovernmental Panel on Climate Change (IPCC). Global Warming of 1.5 °C: An IPCC Special Report on the Impacts of Global Warming of 1.5 °C Above Pre-Industrial Levels and Related Global Greenhouse Gas Emission Pathways, in the Context of Strengthening the Global Response to the Threat of Climate Change. 2018. Available online: https://www.ipcc.ch/sr15/ (accessed on 30 May 2025).
  20. Dhanda, K.K.; Hartman, L.P. The ethics of carbon neutrality: A critical examination of voluntary carbon offset providers. J. Bus. Ethics 2011, 100, 119–149. [Google Scholar] [CrossRef]
  21. Hong Kong Special Administrative Region. Energy Saving Plan for Hong Kong’s Built Environment 2015~2025+; Environment Bureau, Development Bureau, Transport and Housing Bureau: Hong Kong, 2015. Available online: https://www.eeb.gov.hk/sites/default/files/pdf/EnergySavingPlanEn.pdf (accessed on 30 May 2025).
  22. Hong Kong Special Administrative Region. Hong Kong’s Climate Action Plan 2030+; Environment Bureau: Hong Kong, 2017; Available online: https://www.hkgbc.org.hk/eng/engagement/file/ClimateActionPlanEng.pdf (accessed on 30 May 2025).
  23. Building Department. Practice Note for Authorized Persons, Registered Structural Engineers and Registered Geotechnical Engineers APP-67: Energy Efficiency of Buildings Building (Energy Efficiency) Regulation; Building Department: Hong Kong, 2024. Available online: https://www.bd.gov.hk/doc/en/resources/codes-and-references/practice-notes-and-circular-letters/pnap/APP/APP067.pdf (accessed on 30 May 2025).
  24. Electrical and Mechanical Services Department (EMSD). Code of Practice for Building Energy Audit; EMSD: Hong Kong, 2012. Available online: https://www.emsd.gov.hk/beeo/en/pee/EAC_2012.pdf (accessed on 31 May 2025).
  25. Standard 90.1-2022; Energy Standard for Sites and Buildings Except Low-Rise Residential Buildings. American Society of Heating, Refrigerating and Air-Conditioning Engineers: Atlanta, GA, USA, 2022. Available online: https://www.ashrae.org/technical-resources/bookstore/standard-90-1 (accessed on 31 May 2025).
  26. Chartered Institution of Building Services Engineers. Energy Efficiency in Buildings: Guide F; CIBSE: London, UK, 2012; Available online: https://www.cibse.org/knowledge-research/knowledge-portal/guide-f-energy-efficiency-in-buildings-2012/?id=a0q20000008I7oTAAS (accessed on 31 May 2025).
  27. Electrical and Mechanical Services Department (EMSD). Code of Practice for Energy Efficiency of Building Services Installation; EMSD: Hong Kong, 2024. Available online: https://www.emsd.gov.hk/beeo/en/pee/BEC_2024_ENG.pdf (accessed on 31 May 2025).
  28. BEAM Society Limited. BEAM Plus New Buildings Version 2.0; Hong Kong Green Building Council: Hong Kong, 2019; Available online: https://www.beamsociety.org.hk/ (accessed on 31 May 2025).
  29. Sweden Green Building Council. BREEAM-SE New Construction v6.0 Technical Manual 1.1; Sweden Green Building Council: Stockholm, Sweden, 2023; Available online: www.breeam.com (accessed on 31 May 2025).
  30. U.S. Green Building Council. LEED v4 for Building Design and Construction; U.S. Green Building Council: Washington, DC, USA, 2019; Available online: https://www.usgbc.org/sites/default/files/LEED%20v4%20BDC_07.25.19_current.pdf (accessed on 31 May 2025).
  31. Lu, S.; Zhou, S.; Ding, Y.; Kim, M.K.; Yang, B.; Tian, Z.; Liu, J. Exploring the comprehensive integration of artificial intelligence in optimizing HVAC system operations: A review and future outlook. Results Eng. 2025, 25, 103765. [Google Scholar] [CrossRef]
  32. Hong Kong Observatory. Climate Change in Hong Kong—Temperature. 1995–2024. Available online: https://www.hko.gov.hk/en/climate_change/obs_hk_temp.htm (accessed on 6 June 2025).
  33. CLP Power Hong Kong Limited. Non-Residential Electricity Tariff Schedule; CLP Power Hong Kong Limited: Hong Kong, 2023; Available online: https://www.clp.com.hk/content/dam/clphk/documents/tariff-adjustment-20221/TariffTable%20-%20English-(2023-01-01).pdf (accessed on 31 May 2025).
  34. CLP Power Hong Kong Limited. Non-Residential Electricity Tariff Schedule; CLP Power Hong Kong Limited: Hong Kong, 2024; Available online: https://www.clp.com.hk/content/dam/clphk/documents/tariff-adjustment-2024/TariffTable2024_ENG.pdf (accessed on 31 May 2025).
  35. CLP Holdings. 2024 Annual Report; CLP Holdings: Hong Kong, 2024; p. 43. Available online: https://www.clpgroup.com/content/dam/clp-group/channels/investor/document/3-3-financial-reports/2024/e_2024%20Annual%20Report.pdf (accessed on 31 May 2025).
  36. Suen, A.T.Y.; Ying, D.T.W.; Choy, C.T.L. Application of artificial intelligence (AI) control system on chiller plant at MTR station. HKIE Trans. 2022, 29, 90–97. [Google Scholar] [CrossRef]
  37. Qiu, S.; Li, Z.; Fan, D.; He, R.; Dai, X.; Li, Z. Chilled water temperature resetting using model-free reinforcement learning: Engineering application. Energy Build. 2021, 255, 111694. [Google Scholar] [CrossRef]
Figure 1. Chiller plant performance evaluation flowchart: data flow and computational steps.
Urbansci 09 00253 g001
Figure 2. Schematic diagram and local control strategies of a typical multi-chiller system.
Urbansci 09 00253 g002
Figure 3. 2023 annual profiles of electricity consumption from tariff bill and energy consumption from MVAC switchboards.
Urbansci 09 00253 g003
Figure 4. 2023 vs. 2024 monthly energy consumption of entire chiller plant.
Urbansci 09 00253 g004
Figure 5. 2023 vs. 2024 monthly cooling output of chiller plant.
Urbansci 09 00253 g005
Table 1. Chiller specifications.
ParameterValueUnit
Refrigeration Capacity1054kW
Total Power Input180.3kW
Design COP (100% Load)5.85-
Chilled Water Flow Rate50.2L/s
Chilled Water ΔT5°C
Condenser Water Flow Rate59.5L/s
Condenser Water ΔT5°C
Part-Load COP (70% Load)5.65-
Note: COP calculated per standard conversion: 1 RT = 3.516 kW.
Table 2. Monthly results and summary.
Months20232024DWDQRe
Qtotal,mWtotal,mCOPmQtotal,mWtotal,mCOPmkWhkWh
Jan111,87735,1603.18107,78628,8233.74633740910.820
Feb160,42234,4814.65136,59729,1804.68530123,8250.846
Mar167,32442,2693.96138,68034,3654.04790428,6440.813
Apr197,29545,6774.32163,07436,0744.52960334,2210.790
May365,19167,0625.45288,45052,8005.4614,26276,7410.787
Jun420,84990,2324.66321,64069,1004.6521,13299,2090.766
Jul433,96593,1794.66342,02473,4424.6619,73791,9410.788
Aug366,75486,8554.22329,06176,4704.3010,38537,6930.880
Sep272,25964,5444.22245,03457,8264.24671827,2250.896
Oct187,73246,8324.01158,56040,9723.87586029,1720.875
Nov96,08825,7683.7378,80321,3743.69439417,2850.829
Dec67,53622,3313.0261,70018,6623.31366958360.836
Table 3. Energy and Cost Savings Analysis.
Energy and Cost Savings Analysis
Metric20232024Δ AmountRate of Change
Annual Consumption, kWh 654,389.47539,088.26−115,301.21−17.6%
Annual Cost, HKD$674,675.54$571,433.56−103,241.98−15.3%
Table 4. Energy Consumption Analysis.
Year 2023 (Without SC+BAS)Year 2024 (with SC+BAS)
Water-Cooled Chiller Designation & its CapacityWCPC-1WCPC-2WCPC-3Sub-Total Power, kWh of WCPC-1, 2 & 3 of Each Month in 2023 WCPC-1WCPC-2WCPC-3Sub-Total Power, kWh of WCPC-1, 2 & 3 of Each Month in 20242023 vs. 2024 Variance (%)
300 TR300 TR300 TR300 TR300 TR300 TR
Operating Power of each MonthJan8438.41-26,721.6035,160Jan20,176.10-8646.9028,823−18.0%
Feb22,412.70-12,068.3034,481Feb20,426.008754.00-29,180−15.4%
Mar31,279.1010,989.90-42,269Mar-25,773.808591.2034,365−18.7%
Apr32,927.40-12,749.6045,677Apr25,251.80-10,822.2036,074−21.0%
May30,237.8023,814.6013,009.6067,062May23,760.30-29,039.7052,800−21.3%
Jun38,729.3031,452.7020,050.0090,232Jun29,022.7024,835.9015,241.4069,100−23.4%
Jul42,862.3028,114.9022,201.8093,179Jul33,048.9025,702.7014,690.4073,442−21.2%
Aug36,517.1030,338.5019,999.4086,855Aug32,117.4028,246.8016,105.8076,470−12.0%
Sep29,044.8021,005.2014,494.0064,544Sep26,021.7020,820.4010,983.9057,826−10.4%
Oct33,892.3012,939.70-46,832Oct-10,243.0030,729.0040,972−12.5%
Nov17,522.208245.80-25,768Nov5,343.5016,030.50-21,374−17.1%
Dec15,855.106475.90-22,331Dec13,063.405598.60-18,662−16.4%
Variance∑ Jan to Dec[a] Annual operating Power in 2023654,389.47∑ Jan to Dec[b] Annual operating Power in 2024539,088.26−17.6%
Remark: −17.6% is an overall annual saving 2023 vs. 2024 Variance, {[b] − [a]}/[a], (%).
Disclaimer/Publisher’s Note: The statements, opinions and data contained in all publications are solely those of the individual author(s) and contributor(s) and not of MDPI and/or the editor(s). MDPI and/or the editor(s) disclaim responsibility for any injury to people or property resulting from any ideas, methods, instructions or products referred to in the content.

