Article

Urban Greenprint: A Decision Support Tool for Optimizing Urban Forest Strategies in Sustainable Cities

by
Marco di Cristofaro
1,*,
Federico Valerio Moresi
1,
Mauro Maesano
1,
Bruno Lasserre
2 and
Giuseppe Scarascia-Mugnozza
3
1
Department for Innovation in Biological, Agro-Food and Forest Systems (DIBAF), University of Tuscia, Via San Camillo de Lellis, snc, 01100 Viterbo, Italy
2
Dipartimento di Bioscienze e Territorio, Università degli Studi del Molise, Cda Fonte Lappone s.n.c., 86090 Pesche, Italy
3
Biocities Facility, European Forest Institute (EFI), Via Manziana 30, 00189 Rome, Italy
*
Author to whom correspondence should be addressed.
Urban Sci. 2025, 9(6), 216; https://doi.org/10.3390/urbansci9060216
Submission received: 25 March 2025 / Revised: 27 May 2025 / Accepted: 30 May 2025 / Published: 11 June 2025

Abstract

Urban forests (UFs) play a crucial role in mitigating climate change, but their management presents complex trade-offs between environmental, economic, and social aspects. We developed a Decision Support Tool (DST) to simulate 27-year UF dynamics under six different management strategies, aiming to maximize socio-economic and environmental benefits while considering costs. Business as Usual (BaU), Yielding Scenario (YS), High Management (HM), Forest Development (FD), Social Boost (SB), and Cover Maximizing (CM) strategies were tested with the DST in the Vazzieri district of Campobasso, central Italy. The DST integrates CO2 removal, management expenditures and revenues, and the social usability of UFs. The findings show that while all the strategies contribute to climate change mitigation, FD and SB offer the best balance between the environmental and social sides. FD demonstrates significant CO2 removal with moderate expenditures, whereas SB maximizes CO2 removal despite its high management expenditures. Otherwise, YS and BaU show limited environmental benefits with beneficial economic outcomes. While achieving the highest environmental and social benefits, CM incurs the greatest economic costs. This study highlights the need for long-term, integrated UF strategies to harmonize climate change mitigation with economic viability and social inclusivity. The DST provides a valuable framework for urban planners and policymakers to optimize sustainable UF management.

Graphical Abstract

1. Introduction

According to the United Nations World Urbanization Prospects 2018 [1], the global urban population has increased from 30% in 1930 to 55% today. This proportion is projected to reach 68% by 2050 [1]. Urbanization has led to a series of global challenges that require urgent attention [2,3,4,5]. Despite covering only 3% of the Earth’s surface, urban areas contribute over 70% of carbon emissions, produce more than 50% of global waste, consume 60% to 80% of global energy, and drive 75% of global demand for natural resources, such as food and water [5]. Once symbols of progress, urban structures now pose major environmental challenges, as growing populations force cities to balance economic growth, environmental protection, and social equity in line with Agenda 2030 priorities [6,7]. In recent years, particularly following the COVID-19 pandemic, the role of urban green spaces (UGS) in promoting not only ecological values but also social and economic well-being has gained increased recognition [8]. National and international policies have increasingly directed financial resources toward enhancing urban greenery [9]. However, without strategic planning, these investments may turn into mere ‘greenwashing’ efforts, ultimately weakening the impact of sustainability policies [10]. Nevertheless, the right strategies, driven by innovation and data, can unlock new possibilities for urban resilience and long-term well-being [3,10].
Amid these urban challenges, UGS and, particularly, Urban forests (UFs), emerge as crucial components for achieving sustainability goals [7,11]. UFs provide a wide range of ecological, social, and economic benefits essential for enhancing urban quality of life. One of the key benefits is carbon sequestration, which helps mitigate climate change by capturing CO2 from the atmosphere [12,13]. Additionally, UFs improve air quality by reducing pollutants [14] and regulate local microclimates, helping to minimize the urban heat island effect [15]. In addition to environmental benefits, UFs also contain land consumption, prevent urban sprawl, and limit uncontrolled development. This highlights their pivotal role in shaping urbanization patterns [16]. UFs enhance residents’ well-being by offering spaces for recreation and relaxation, reducing stress, and improving mental health, while fostering social cohesion and engagement through inclusive green areas [17]. They also improve the aesthetic value of neighborhoods, increasing overall livability, social cohesion, and preferences [18]. Additionally, they reduce socio-economic disparities, promote healthier lifestyles, and decrease social isolation [17], particularly in underserved communities. Economically, UFs reduce energy costs by lowering air conditioning demand, increasing property values, and boosting local economies through tourism and job creation related to green space maintenance [19,20,21]. They also generate jobs in forest management and green space maintenance [22], further stimulating the local economy. Additionally, municipalities can generate carbon credits through sustainable forest management and reforestation projects, which can be sold in voluntary markets to fund further investments in green infrastructure and sustainability efforts [23,24].
Despite these benefits, managing UFs presents several challenges. One of the primary obstacles is the competition for limited urban space [25]. As cities expand, the demand to convert green areas into housing, commercial developments, and infrastructure increases, often leading to conflicts between urban growth and the preservation or enhancement of green spaces. In addition to spatial constraints, municipalities face budgetary pressures. Despite these benefits, managing UFs faces challenges, especially competition for limited urban space [25]. As cities grow, green areas are increasingly converted into housing and infrastructure. For instance, the permeable/sealed soil ratio in Italian cities declined from 49.8% to 44.7% between 1990 and 2018, reflecting more gray urban areas [16]. At the global level, efforts to counterbalance such trends have led 162 countries to adopt specific National Urban Policies (NUP) to promote sustainable urban development by aligning sectoral policies and encouraging balanced spatial planning [4]. Besides space constraints, municipalities often struggle with limited budgets for UGS and UF management and maintenance. Many operate under tight financial constraints, making it difficult to allocate sufficient funds for effective UGS and UF management, reforestation, and maintenance. Municipalities often face tight financial constraints that limit their ability to effectively manage, maintain, and expand UGS and UFs [10]. UFs are increasingly vulnerable to the impacts of climate change. Rising temperatures, more frequent extreme weather events, and altered precipitation patterns require UFs to become resilient to heatwaves, floods, and droughts. This necessitates cities to invest not only in green infrastructure but also in management practices that promote climate resilience, ensuring UFs continue to provide critical ecosystem services [26,27]. Moreover, there is an urgent need to address social equity in UF distribution. Research shows that economically disadvantaged neighborhoods often have limited access to green spaces, exacerbating social inequalities [28] and depriving residents of the numerous benefits of UFs, including improved health and recreational opportunities. Managing and expanding UFs also entails significant financial and environmental costs. Planting new trees, maintaining existing forests, and mitigating the impacts of pests and diseases require substantial investments. Furthermore, certain maintenance practices, such as tree pruning, soil aeration, or lawn mowing, may result in CO2 emissions that sometimes outweigh the immediate benefits of carbon sequestration [29]. Therefore, cities must carefully assess the trade-offs between the long-term benefits of UFs and the operational costs associated with their management and upkeep. Balancing ecological, economic, and social considerations is crucial for effective UF management planning. Decisions must consider the needs and priorities of various stakeholders, including local authorities, developers, residents, and environmental organizations [30,31,32,33,34].
Given this complexity, effective UF management requires more than intuition or isolated interventions. Effective management necessitates a comprehensive, evidence-based approach that integrates the interconnected ecological, economic, and social dimensions of sustainability [35]. This integrated approach is increasingly essential as cities aim to meet sustainability targets while managing competing demands for space and resources [36]. UF management must align ecological objectives with financial constraints and societal needs to ensure that interventions are both feasible and beneficial for all stakeholders [37]. In this context, models play a pivotal role in helping local governments select the most appropriate forest management strategies to contribute to sustainable urban development. Among these models, Decision Support Tools (DSTs) provide policymakers and urban planners with data-driven insights into the long-term impacts of various strategies, enabling informed decisions aligned with sustainability goals. Several types of DST have been applied in urban ecology, such as Multi-Criteria Decision Analysis (MCDA) models, which compare NBS options based on weighted objectives [38]. The use of these tools is currently supported by online platforms enabling practitioners to evaluate environmental costs and benefits of multiple NBS [39]. The strength of DSTs lies in their ability to compare strategic alternatives using scenario-based approaches [40], facilitating long-term decision-making. Furthermore, DSTs foster holistic approaches to UF management by integrating ecological, economic, and social factors into the decision-making process [41]. While the ecological benefits of UFs, such as carbon sequestration, are well-documented, DSTs also facilitate the inclusion of economic and social considerations, ensuring that UF strategies are not only ecologically effective but also economically viable and socially equitable [38,39,41].
Despite the promising potential of DSTs in optimizing UF management, significant gaps remain in their current application. Many UF models still primarily focus on ecological aspects and ecosystem services [42,43], often neglecting the economic and social dimensions of forest management and its long-term impacts on urban sustainability. Furthermore, although some DSTs include economic data, they frequently overlook the full life-cycle implications of UF interventions, such as the costs of installation, maintenance, and long-term environmental trade-offs. This limitation hinders their ability to guide cities in making truly sustainable decisions that consider both the immediate and long-term effects. Additionally, many DST models rely on static assumptions, failing to consider the dynamic nature of urban environments and ecosystems [42,44]. Addressing these gaps is essential for improving the effectiveness of UF management. A comprehensive DST that integrates life-cycle analysis (LCA) and costing (LCC) would enable planners to evaluate strategies not only for their ecological performance but also for their financial sustainability and social benefits [45]. Incorporating a life-cycle perspective into DSTs offers a more nuanced and practical approach to decision-making, helping cities make informed choices that support sustainable urban development while balancing the competing demands of ecology, economy, and social equity [39,40,41,42,43,44,45].
This study aims to develop an innovative Decision Support Tool (DST) to assist urban administrations in selecting optimal strategies for the implementation and management of urban forests (UFs). The tool is designed to identify strategies that maximize social, economic, and environmental benefits, while taking into account related costs. To ensure a holistic, long-term approach, the methodology includes a life cycle perspective (Life Cycle Assessment—LCA, and Life Cycle Costs—LCC), applied to dynamic inventories of tree cover changes over a 27-year period (2024–2050). DSTs were tested across various UF management strategies. The evaluation of the trade-offs is based on ecological (net CO2 sequestration), economic (monetary balance), and social (well-being indicators) metrics. This work is part of the National Innovative Program for Housing Quality [46]. Although still in its early stages, this tool represents a first attempt to provide valuable insights for municipalities, exploring key mechanisms for sustainable urban development through urban forestry.

2. Materials and Methods

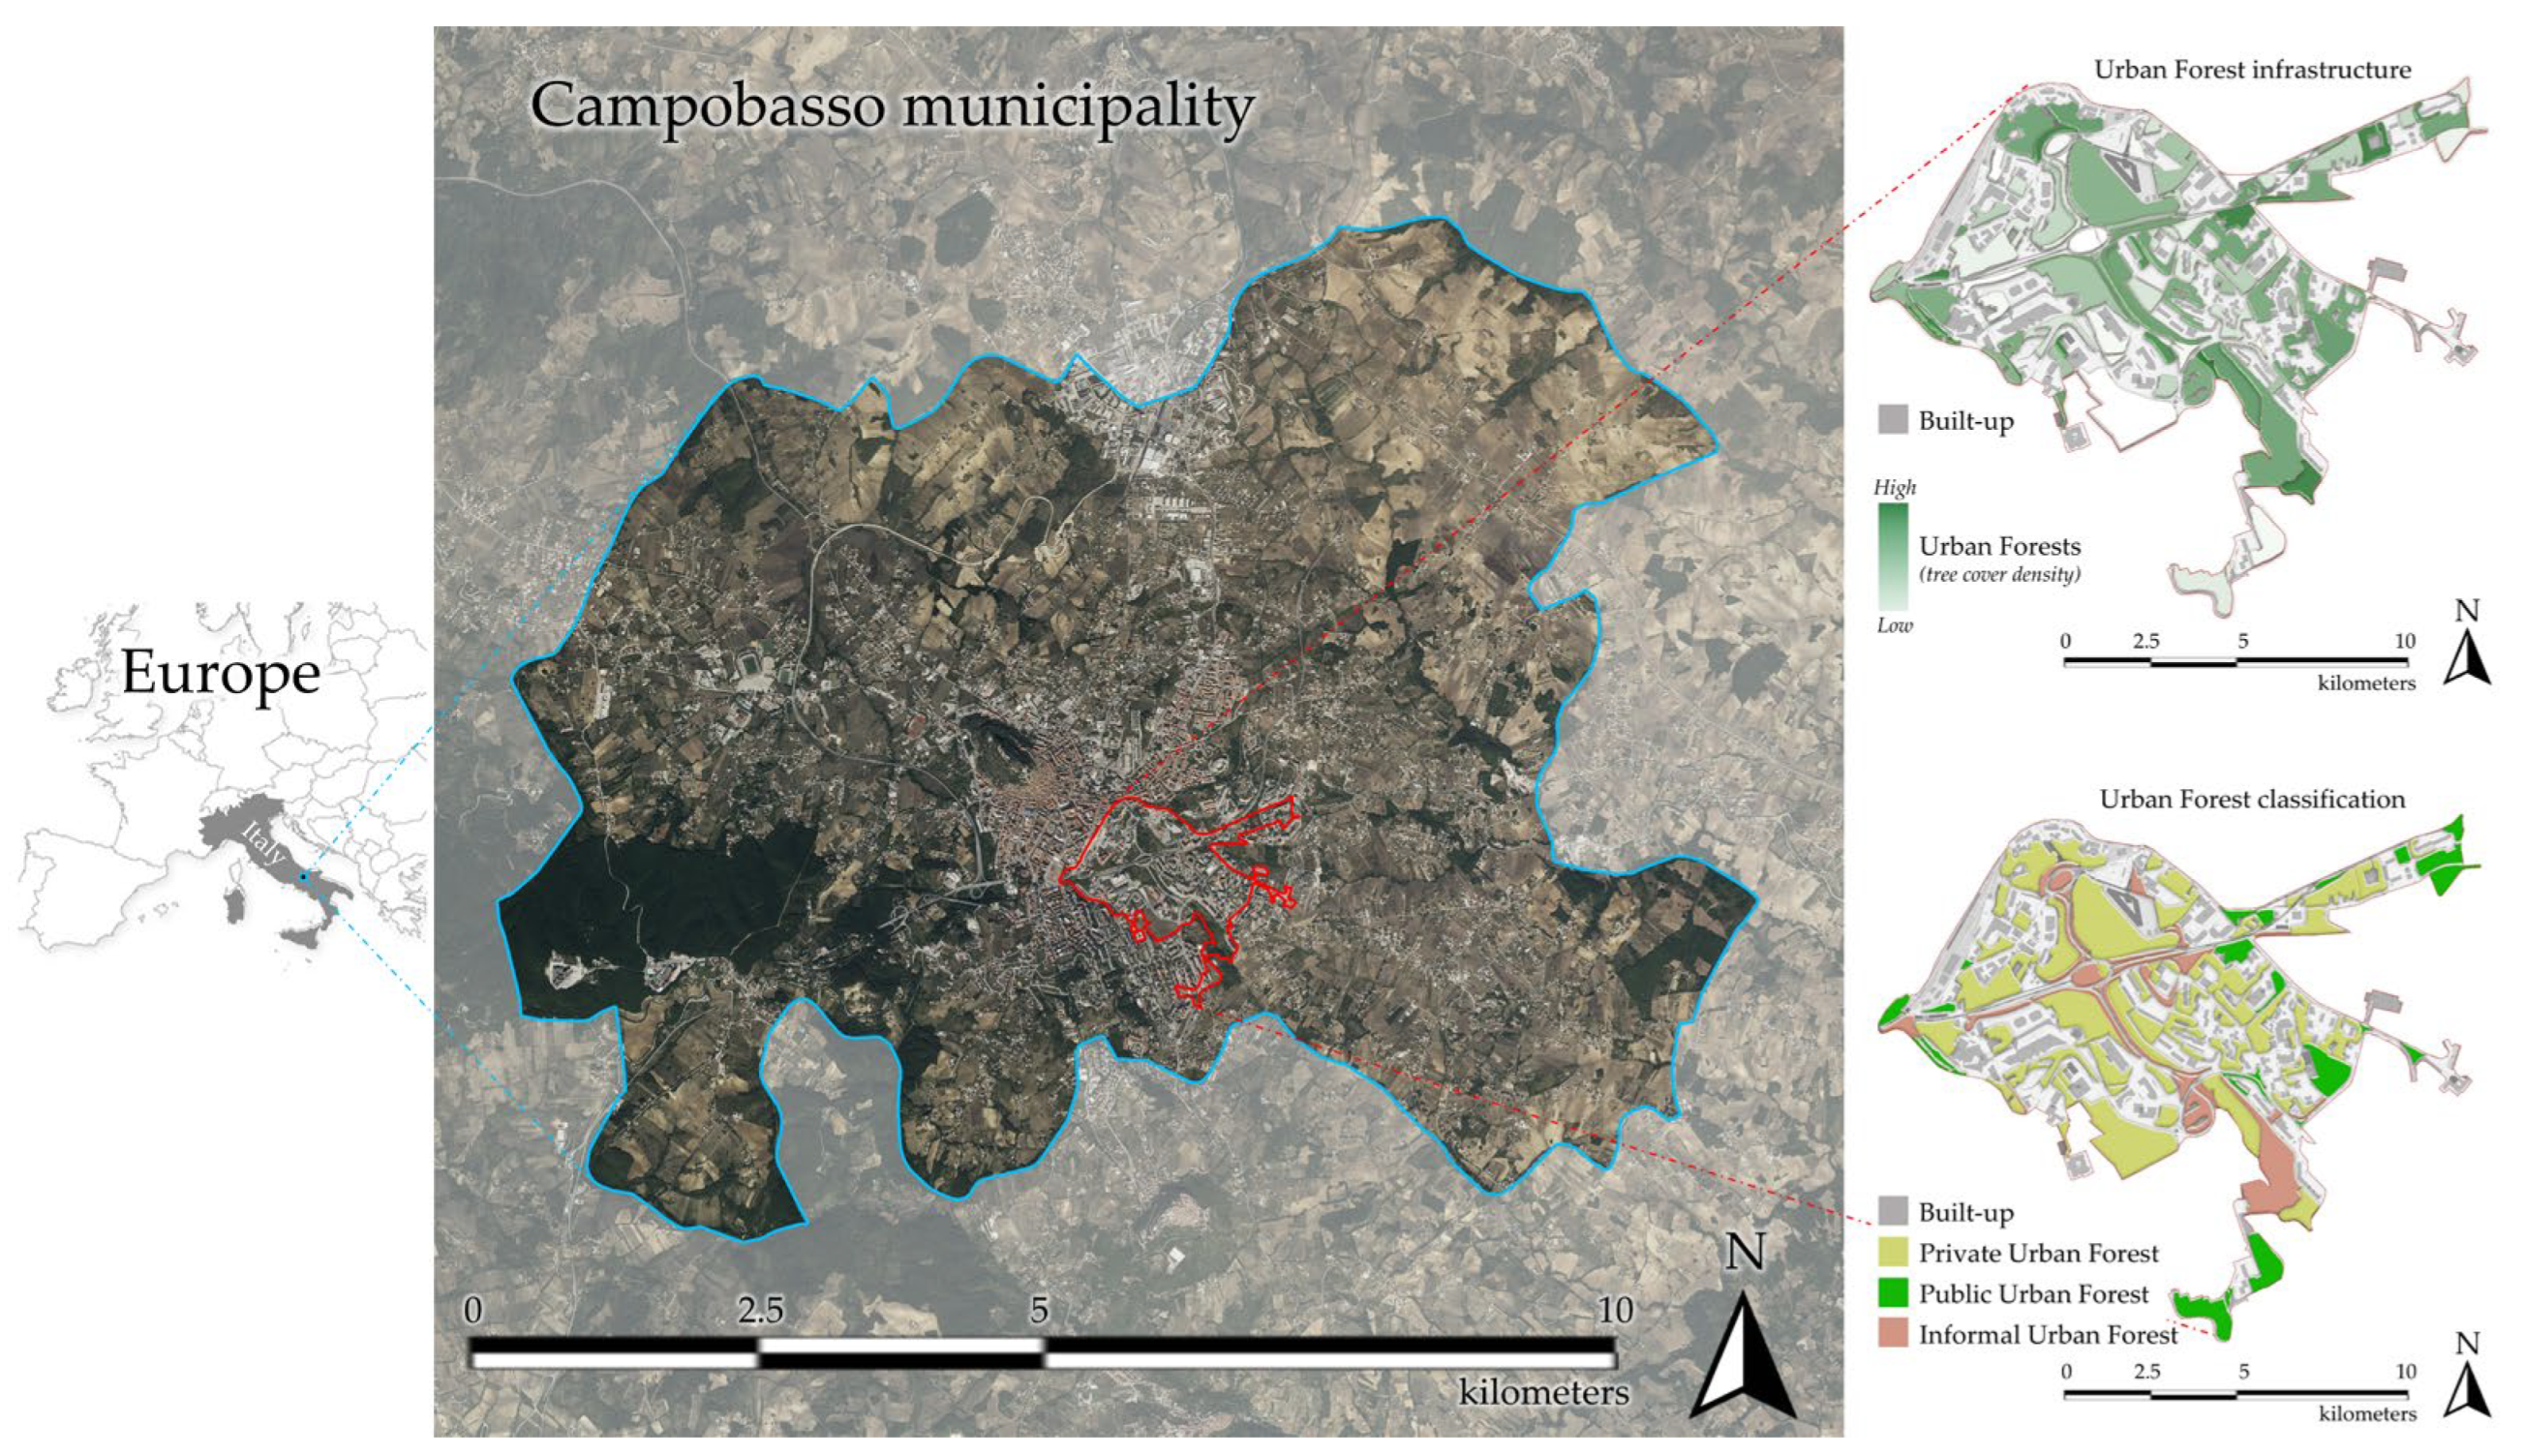
2.1. The Testing Area and the Cartographic Database

The testing area is located in Campobasso, central Italy (41°32′52.128′′ N—14° 40′12.594′′ E), covering 1.21 square kilometers within the residential district of ‘Vazzieri’ (Figure 1). The Vazzieri district, predominantly developed in the 1980s, has experienced significant urbanization and socio-economic changes. Originally designed as a residential area for young families, it featured low-density housing with minimal commercial and social infrastructure, contributing to its suburban character. In the early 2000s, urban transformation accelerated with the establishment of a university campus, resulting in increased residential density, expanded commercial services, and the growth of gray infrastructure. As a result, the spatial layout of the Vazzieri district began to reflect broader patterns of urban sprawl typical of expanding urban fringes across Italy [16,17,18,19,20,21,22,23,24,25,26,27,28,29,30,31,32,33,34,35,36,37,38,39,40,41,42,43,44,45,46,47]. This shift had substantial effects on land use and the availability of green areas. Over the past two decades, the area shifted from agricultural and rural land to built-up areas, significantly reducing the availability of urban green spaces (UGS). The current ratio of permeable to sealed surfaces in the testing area is 72.8%, with urban forests (UFs) accounting for approximately half of the green spaces present. In response, recent urban renewal efforts have prioritized the re-integration of ecological considerations into urban development. The testing area, along with the broader urban context, is currently benefiting from national and European funding aimed at revitalizing urban environments, with a particular focus on enhancing UGS (e.g., [48,49]). This research is part of the ‘Programma Innovativo Nazionale per la Qualità dell’Abitare’ (PINQuA), a national initiative aimed at urban renewal and improving the quality of life in residential areas [46]. The ongoing transformation of the Vazzieri district presents a unique opportunity to analyze the effects of urbanization on green infrastructure, with a specific focus on UF management strategies within the evolving targets of urban requalification.
Green infrastructure within the testing area was mapped through an on-screen interpretation process within a GIS environment. The mapping process involved the photointerpretation of high-resolution color orthophotos from 2021 to identify UF polygons. Each photointerpretation of the UF polygons was performed using ArcGIS software version 9.3 on color aerial photographs from 2021 with a resolution of 0.5 m. Each UF polygon was manually clipped to delineate the area of interest. Specifically, only homogeneous UGS polygons containing trees with at least 10% canopy coverage were selected and clipped. The UF polygons were then categorized based on tree cover density, expressed as the percentage of tree canopy cover. Subsequently, the UF polygons were further classified by their ownership. UF polygons located on land parcels classified as private property in the Campobasso city cadastral maps were designated as Privately-owned UF (Priv-UF). The remaining UF polygons were classified as Collectively owned UFs (Col-UFs). The Col-UFs were further classified according to their management status. Two classes were defined. The first class related to Publicly managed UF (Pub-UF), referring to Col-UF under municipal responsibility for maintenance and care, while the second class related to Informal UF (Inf-UF), referring to Col-UF not actively managed by the municipality. This classification was derived from surveys conducted by municipal green space management employees. Figure 1 illustrates the UF infrastructure within the testing area, while Table 1 provides detailed information on its classification and coverage.

2.2. Decision Support Tool (DST)

The Decision Support Tool (DST) framework simulates the dynamics of UFs over time. UF dynamics are shaped by a combination of interoperable models, incorporating both ecological variables and human factors. The models employed in the DST were made interoperable by utilizing a common functional unit to represent UFs. The three ecological variables considered in the DST are i. canopy cover densification due to tree growth over time; ii. forest expansion, defined as the increase in the area occupied by UFs; and iii. tree mortality, referring to the rate of tree loss due to natural causes. These three variables were incorporated into the DST framework using models derived from the literature and adapted to meet the specific objectives of this research, following an expert-based evaluation.
To model the canopy cover growth over time, we utilized the model proposed by [29]. This model simulates the annual growth of canopy cover for three oak species (Quercus spp.) due to their high suitability in Mediterranean urban contexts. As demonstrated in similar studies [29], the current distribution of these species across various urban and peri-urban forests in Italy support their common use in recent UF planting interventions.
The model assumes an equal distribution of these species within the representative UF, with one-third of trees allocated to each species. The species were selected based on their suitability and prevalence in the urban and peri-urban green spaces of the testing area. Allometric models were applied to estimate tree growth [50]. Specifically, the canopy area of individual trees was calculated annually using the formula below:
Ci = π/4 · (Dbhi · K/d)2
where Ci is the canopy cover (in square meters) of each tree for the i-th year, Dbhi is the annual value of the tree diameter at breast height (Dbh; in meters) for the i-th year, and K/d is the ratio between the crown diameter (K) and the tree diameter for the i-th year (both in meters). The Dbhi values were derived from tree ring analyses of sample trees, and these data were used to construct the mean diametric growth curve for the three species over time. The K/d values were obtained from [51] based on data for the Quercus spp. trees. This canopy cover growth model was uniformly applied across all the UFs in the testing area.
Forest expansion and tree mortality rates were considered to be directly influenced by management practices. For managed UFs (both Priv-UFs and Pub-UFs), forest expansion is limited by various ordinary management practices, such as lawn mowing and tree pruning. While these practices promote tree health, they hinder the establishment of new vegetation. Consequently, the forest expansion rate for both Pub-UFs and Priv-UFs was set to zero. As for Inf-UFs, forest expansion occurs rapidly because vegetation grows freely without human management. Based on the findings from similar studies (e.g., [52,53]), an annual forest expansion rate of 4.4% was applied to Inf-UFs due to the lack of management. While the absence of management promotes increased forest expansion, it also leads to higher tree mortality due to natural causes, such as aging, infestations, or uncontrolled diseases. Tree mortality is also influenced by the intensity of forest management. Generally, private UGS and UFs receive more frequent and effective interventions, which further reduce tree mortality. As a result, the mortality rate for Pub-UFs was set at 1.4% per year, as reported by [54]. Meanwhile, the tree mortality rate was assumed to be twice as high for Inf-UFs and half as high for Priv-UFs.
Table 2 summarizes the application of the three models previously described in relation to the different UF classes present in the testing area. Using these models in relation to the different UF types, the DST simulated the evolution of UFs under various management strategies and natural drivers, forecasting tree cover dynamics in the testing area. The DST was designed to forecast tree cover dynamics over a 27-year period, with projections extending to 2050. The year 2050 was chosen as the projection horizon because it aligns with various climate-related targets in Italy and across Europe [55].

2.3. Urban Forest Management and Scenarios

As previously described, the DST framework simulates various UF dynamics over time, considering both ecological variables and human factors, the latter being primarily represented by UF management interventions. The simulation model incorporates a range of management actions and interventions tailored to the targets of different UF strategies. The investigated UF strategies are designed to enhance long-term urban sustainability and vitality. Specifically, the main objectives include maintaining existing UFs, improving their health and functionality, and expanding UF coverage. Depending on the intensity of forest management, the strategies and interventions involve several actions based on different management intensities. These actions consist of basic ordinary management (low impact), dead tree replacement (medium impact), and tree planting for reforestation (high impact).

2.3.1. Management Actions and Interventions Considered in the DST

Low-impact UF management consists of ordinary actions aimed at ensuring the long-term conservation of UFs. These primarily involve regular lawn mowing and systematic tree pruning practices. Lawn mowing helps prevent UF degradation, enhancing their usability for citizens, while tree pruning removes dead or hazardous branches and promotes balanced canopy growth. Ordinary management is therefore essential not only for maintaining tree health but also for enhancing the aesthetic value of public and private UFs, as well as maximizing their accessibility and attractiveness. Medium-impact UF management involves the replacement of dead trees, helping to maintain UF coverage and availability. Regarding high-impact UF management, tree planting for reforestation plays a critical role in the ecological regeneration of UFs by enhancing tree density and diversity. For both dead tree replacements and reforestation efforts, the DST incorporates parental care during the first five years. This includes soil tillage, irrigation, and fertilization practices, promoting young tree stabilization and early growth while reducing the risk of planting failures. UF management interventions can be implemented by both public and private stakeholders. However, the intensity of these practices varies significantly across the three UF types. Management of Priv-UFs tends to be more intensive and targeted, while management of Pub-UFs and Inf-UFs may be less frequent or absent. Hence, along with the parental care of young trees, the DST also considers the different types of UFs in the testing area.

2.3.2. Urban Forest Management Scenarios

Six forest management scenarios were developed, each featuring specific UF strategies. These scenarios vary from minimal intensity to more intensive management approaches. The six scenarios are presented in increasing order of intensity in UF management, with strategies outlined for Pub-, Inf-, and Priv-UFs. The six scenarios are outlined below:
  • Yielding Scenario (YS), representing a strategy with minimal intervention. For Pub-UFs, ordinary management is restricted to lawn mowing and tree pruning (basic), without the replacement of dead trees. Inf-UFs remain unmanaged, following natural processes. Priv-UFs are maintained through basic ordinary management, including lawn mowing and tree pruning, without the replacement of dead trees. This scenario serves as a baseline, reflecting minimal investment in the health, appeal, and expansion of UFs by the public administration.
  • Business as Usual Scenario (BaU), representing the standard (and current) UF management. Pub-UFs receive full ordinary maintenance (i.e., lawn mowing, tree pruning, and replacement of dead trees). Inf-UFs remain unmanaged, following natural processes. Priv-UFs follow full ordinary management, with the same interventions as Pub-UFs.
  • High-Management Scenario (HM), involving more intensive UF management. Pub-UFs are managed with ordinary maintenance, including the replacement of dead trees. Inf-UFs begin receiving the same ordinary management (lawn mowing, tree pruning, and replacement of dead trees) that was previously absent. Priv-UFs also follow the same management approach.
  • Forest Development Scenario (FD), employing a proactive approach aimed at increasing UF coverage. Pub-UFs receive full ordinary management, and reforestation actions are conducted in Pub-UFs with less than 50% tree cover to increase coverage to at least 50%. In Pub-UFs where tree cover ranges from 50% to 100%, additional trees are planted to achieve full coverage. Inf-UFs remain unmanaged. Priv-UFs continue with full ordinary management.
  • Social Boost Scenario (SB), in which private owners are engaged through incentives to enhance Priv-UF coverage. Specifically, private owners continue to implement full ordinary management of Priv-UFs and are incentivized to increase tree coverage by 20%, supported by green subsidies. Pub-UFs are maintained with full ordinary management, while Inf-UFs remain unmanaged.
  • Cover Maximizing Scenario (CM), aimed at maximizing UF coverage through the most intensive UF management. Pub-UFs are maintained with full ordinary management, and reforestation actions are conducted to achieve 50% coverage where current coverage is below this threshold, or 100% coverage where it ranges between 50% and 100%. Inf-UFs begin receiving full ordinary management, and additional reforestation actions are implemented to reach 100% coverage in Inf-UFs with tree cover ranging from 75% to 100%. Priv-UFs continue with full ordinary management, with an additional 20% increase in tree coverage incentivized through green subsidies.
  • The UF management scenarios are reported and described in Table 3.

2.4. Cost–Benefit Assessment and Trade-Off Analysis

The cost–benefit assessment aims to quantify the environmental, economic, and social impacts linked to the six UF management scenarios. This analysis is crucial for evaluating the effectiveness of different UF strategies by quantifying their ecological (e.g., net CO2 sequestration), economic (e.g., cost–benefit balance), and social (e.g., well-being indicators) impacts. These criteria enable urban planners to compare alternatives based on measurable outcomes, thus supporting evidence-based decision-making in urban planning. The cost–benefit assessment is structured around three key dimensions of urban sustainability. First, an ecological evaluation is carried out, including both the costs and benefits related to CO2 removal and emissions. Next, an economic evaluation is carried out, focusing on management costs and the potential financial benefits for public administration from carbon credits generated through sustainable forest management. Then, a social evaluation is carried out, assessing the social impacts on citizens’ well-being, considering UF availability, accessibility, and attractiveness. Finally, a trade-off analysis is conducted to compare the results across scenarios and identify the most advantageous UF strategies in terms of overall sustainability, with a focus on recognizing the necessary trade-offs between ecological, economic, and social aspects.

2.4.1. Environmental Evaluation

The ecological evaluation involves a NET analysis comparing the environmental impacts of UF management (in terms of CO2 emissions from interventions and actions implemented) with the CO2 removal capacity of UF. Environmental impacts were estimated using a Life Cycle Assessment (LCA) approach, with a specific focus on Global Warming Potential (GWP) impacts. The LCA adopts a “cradle-to-service” perspective, excluding the end-of-life phase. The analysis was conducted using SimaPro software (v. 9.4.0.2), following the four-step framework defined by the ISO 14040–14044 series standards [56]. The functional unit was defined as one square meter of representative UF. The LCA was performed based on dynamic Life Cycle Inventories (LCI) that include input/output material and energy flows for UF management over 27 years. Primary data were collected through questionnaires sent to companies involved in UGS management within the testing area. Secondary data were obtained from the Ecoinvent 3.3 database [57]. The analysis focused on GWP impacts related to tree planting, parental tree care, basic ordinary management (lawn mowing and tree pruning), and wood waste treatment. CO2 emissions from transport processes, where relevant, are included among the input data directly provided by the Ecoinvent database. The ReCiPe 2016 midpoint (H) method [58] was used to assess GWP impacts in terms of kg of CO2 eq emitted. The LCA also accounts for the annual CO2 emissions generated by reforestation efforts, and any other interventions contributing to the carbon footprint of each scenario. Conversely, the environmental benefits were estimated by quantifying the CO2 sequestered by UFs. Consistent with previous studies, tree canopy cover was used as a proxy for CO2 removal capacity [59]. The i-Tree Canopy software was thus used to estimate annual CO2 sequestration based on the percentage of canopy cover in the testing area. This tool simulates carbon sequestration dynamics, calculating the amount of carbon annually stored by tree biomass while accounting for environmental variables, such as tree species, age, and canopy size. By comparing the CO2 emissions from different UF management strategies with the CO2 removal capacity of UFs, the net environmental benefits and costs were quantified for each scenario. Based on dynamic inventories, the cost–benefit analysis was conducted annually and as a cumulative balance over the entire reference period. Detailed information on the LCA is provided in the Supplementary Materials (please see Tables S1–S3 and S5).

2.4.2. Economic Evaluation

The economic evaluation involves a cost–benefit analysis comparing the financial expenditures of the public administration for UF management with the potential economic benefits derived from carbon credit trading. Financial costs were estimated using a Life Cycle Cost (LCC) approach, focusing on the total monetary expenditures required for different UF management strategies. Consistent with the LCA, the LCC analysis was performed using a “cradle-to-service” perspective, excluding the end-of-life phase, and based on a functional unit of one square meter of UF. The costs were estimated by calculating the annual expenditures related to all proposed UF management interventions and actions over the 27-year reference period. Detailed cost calculations were based on data gathered through questionnaires distributed to companies engaged in urban green space management within the testing area. The data specifically covered expenses related to tree planting, parental care, and ordinary maintenance practices. In parallel with the LCC analysis, the economic benefits were estimated based on the potential revenue municipalities could generate by selling carbon credits in a voluntary market. The value of carbon credits was assumed to be EUR 71.02/Mg of CO2 eq, based on current market estimates [60]. According to rules of most of the carbon market [60], carbon credits were calculated exclusively for CO2 sequestration resulting from reforestation activities and the sustainable UF management actions (e.g., management of previously unmanaged UFs). The total amount of CO2 sequestered annually was determined based on the CO2 removal capacity of UFs, as estimated by the i-Tree Canopy software. Consistent with the ecological evaluation, a cost–benefit analysis was performed annually, with a cumulative analysis over the entire 27-year reference period. These calculations yielded the net economic analysis, both annual and cumulative, for each UF management scenario. Detailed information on the LCC is provided in the Supplementary Materials (please see Tables S1, S2, S4 and S5).

2.4.3. Social Evaluation

The social evaluation of UF strategies focused on the benefits derived from their availability, accessibility, and attractiveness for citizens. To account for these benefits, three new indicators were developed, inspired by the work of [61], assessing different dimensions of social value associated with UFs. UF availability, accessibility, and attractiveness were quantified in terms of the area (square meters) of UF that are available, accessible, and attractive for public use. UF availability refers to the total area of UF in the testing area, including Pub-, Inf-, and Priv-UFs. This indicator measures the overall presence of forested spaces that can potentially benefit citizens. UF accessibility measures the UF area (square meters) that is both public and within reach of all individuals (i.e., without physical or legal barriers). It includes Pub- and Inf-UFs that are open and accessible to the public, providing equal opportunities for recreational use. UF attractiveness focuses only on Pub-UFs (square meters), assessing their aesthetic and recreational qualities, which are enhanced through active management, making them more appealing and user-friendly. The social benefit analysis was conducted by evaluating the annual and cumulative changes in these three indicators for each of the six UF management scenarios over a 27-year period. By comparing these changes, the potential social benefits of each scenario were estimated.

2.4.4. Trade-Off Evaluation

The trade-off analysis aimed to assess the interplay among the environmental, economic, and social impacts of each scenario. By comparing the costs and benefits of each UF strategy across these three dimensions, it identified the UF management scenarios that achieve the most favorable balance among the diverse targets of UF strategies. This final step enables an integrated evaluation of each strategy, highlighting potential trade-offs that policymakers may need to consider to prioritize long-term sustainability. To carry out the trade-off analysis among the six UF management scenarios, it was necessary to first normalize the NET results of the environmental, economic, and social cost–benefit analyses to values comparable across all scenarios. Normalization was achieved through a min–max standardization process [62], in which the cost–benefit results of each scenario were scaled to values ranging from −1 to +1. The Business as Usual (BaU) scenario served as the baseline, with the results of its cost–benefit analysis assigned a 0 value. For the social results, the three distinct social indicators were first integrated into a single social index. The weight assigned to each social indicator was adjusted according to an expert-based evaluation. The attractiveness indicator was weighted twice as much as accessibility, and accessibility was weighted twice as much as availability. After aggregating the three social indicators into a single social index, the resulting values were also normalized to a scale from −1 to +1 for each scenario, as with the ecological and economic indices. To facilitate interpretation of the ecological, economic, and social indices, which range from −1 to +1, we adopted a simple classification scheme. Indices were considered negative if ranging from −1 to 0, and positive if ranging from 0 to +1. Furthermore, the magnitude of values was qualitatively described as low (0–0.33), medium (0.34–0.66), or high (0.67–1.0) for both positive and negative scores. This approach was intended to provide intuitive understanding of the relative performance of each scenario, without implying strict thresholds. Finally, a comprehensive comparison was made across the six UF management scenarios.

3. Results

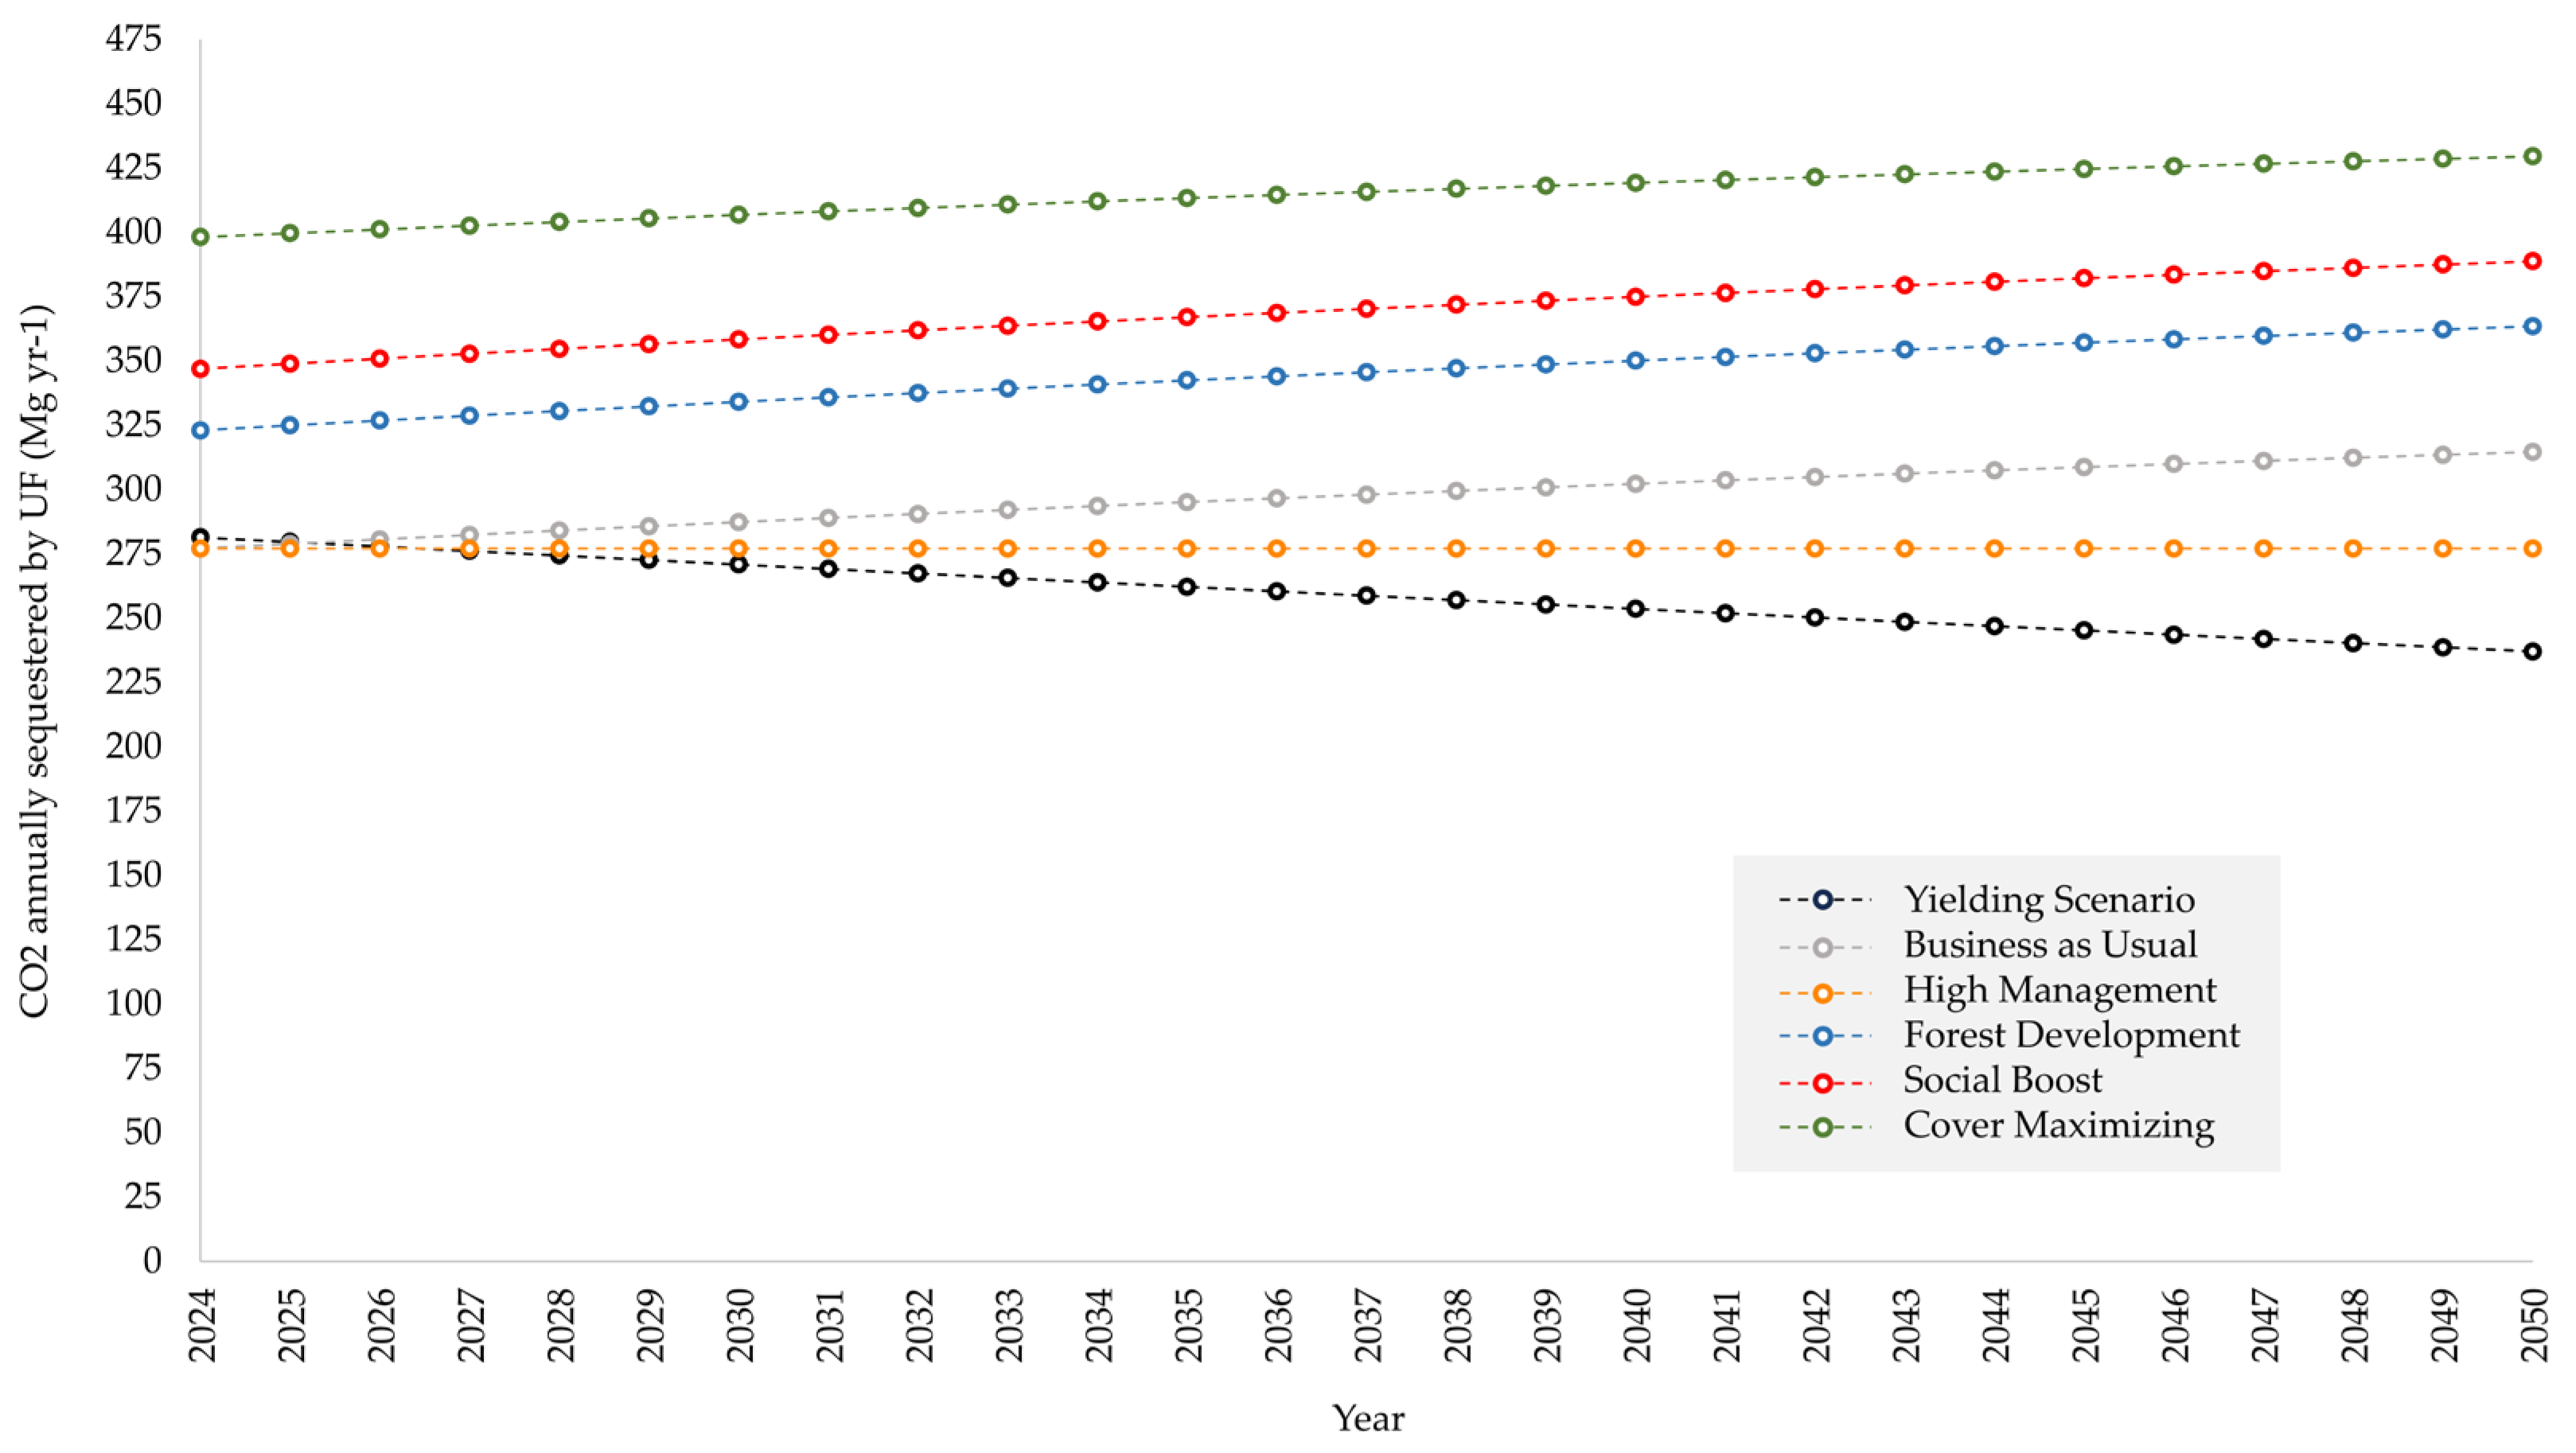
3.1. Environmental Costs and Benefits

The annual CO2 removal capacity of the six urban forest (UF) management scenarios is shown in Figure 2. During the period 2024–2050, UF of the Business as Usual (BaU) scenario increased the CO2 removal capacity by 13.5%, passing from 277.1 Mg yr−1 CO2 sequestered in 2024 to 314.7 Mg yr−1 CO2 sequestered in 2050. The CO2 annually sequestered by the UF of the Yielding Scenario (YS) decreased from 281.5 Mg yr−1 CO2 in 2024 to 237.1 Mg yr−1 CO2 in 2050, reflecting a general 15.8% reduction in CO2 removal capacity, with an annual change rate of −0.66%. In the High-Management (HM) scenario, the UF maintained a constant annual CO2 removal capacity of 277.1 Mg yr−1 throughout the reference period. In contrast, the UF management of the Forest Development (FD) scenario resulted in a 12.5% increase in the CO2 removal capacity over 27 years, rising from 323.1 Mg yr−1 CO2 sequestered in 2024 to 363.5 Mg yr−1 CO2 sequestered in 2050 (with an average annual removal of 344.8 Mg yr−1 of CO2). Regarding the Social Boost (SB) scenario, which encouraged private owners to carry out beneficial interventions, the UF management led to an increase in annual removal capacity from 347.0 Mg yr−1 CO2 sequestered to 388.8 Mg yr−1 CO2 sequestered (i.e., an average annual of 369.5 Mg yr−1 CO2 sequestered, and a 12.1% increase in CO2 removal capacity). Finally, the UF in the Cover Maximizing (CM) scenario increased the CO2 removal capacity passing from 398.2 Mg yr−1 CO2 sequestered in 2024 to 429.5 Mg yr−1 by 2050 (with an average annual CO2 removal capacity of 415.1 Mg yr−1 CO2, and a general 7.9% increase in removal capacity, at an annual change rate of +0.29%).
As shown in Table 4, the UF management of the BaU scenario resulted in a total emission of 1836.2 Mg CO2 over the 27-year reference period, with an average annual emission equal to 68.0 Mg yr−1 CO2. The UF management of the YS scenario led to a total emission of 1639.3 Mg CO2 over the reference period (so, 10.7% lower CO2 emission compared to the BaU scenario), with an average annual emission of 60.7 Mg yr−1 CO2. The HM scenario involved an intensification of UF management effort, which caused an average annual emission of 71.6 Mg yr−1 CO2, with 1933.1 Mg CO2 totally emitted over the reference period. The UF management of the FD scenario emitted 1890.7 Mg CO2 between 2024 and 2050 (so, +3.0% compared to the BaU scenario), with an average of 70.0 Mg CO2 annually emitted. The UF management of the SB scenario involved an average annual emission of 80.5 Mg yr−1 CO2, resulting in a cumulative emission of 2172.3 Mg CO2 by the end of the reference period. Finally, the intensive UF management strategy proposed for the CM scenario resulted in a cumulative emission of 2277.0 Mg CO2 over the 27 years of the reference period (so, 24.0% higher compared to the BaU scenario), with an average annual emission of 84.3 Mg yr−1 CO2.
The basic ordinary management practices (i.e., both lawn mowing and tree pruning practices) of Pub-UFs and Priv-UFs represented the main contributor to the total CO2 emission for all the UF management scenarios, accounting for between 100% in the YS scenario and 93.7% in the CM scenario. Regarding the dead tree replacement actions, they contributed 3.0%, 4.2%, 3.4%, 2.8%, and 3.4% of the total CO2 emission in the BaU, HM, FD, SB, and CM scenarios, respectively. On the other hand, reforestation interventions contributed 1.4%, 1.8%, and 2.9% of the overall CO2 emission in the FD, SB, and CM scenarios, respectively.

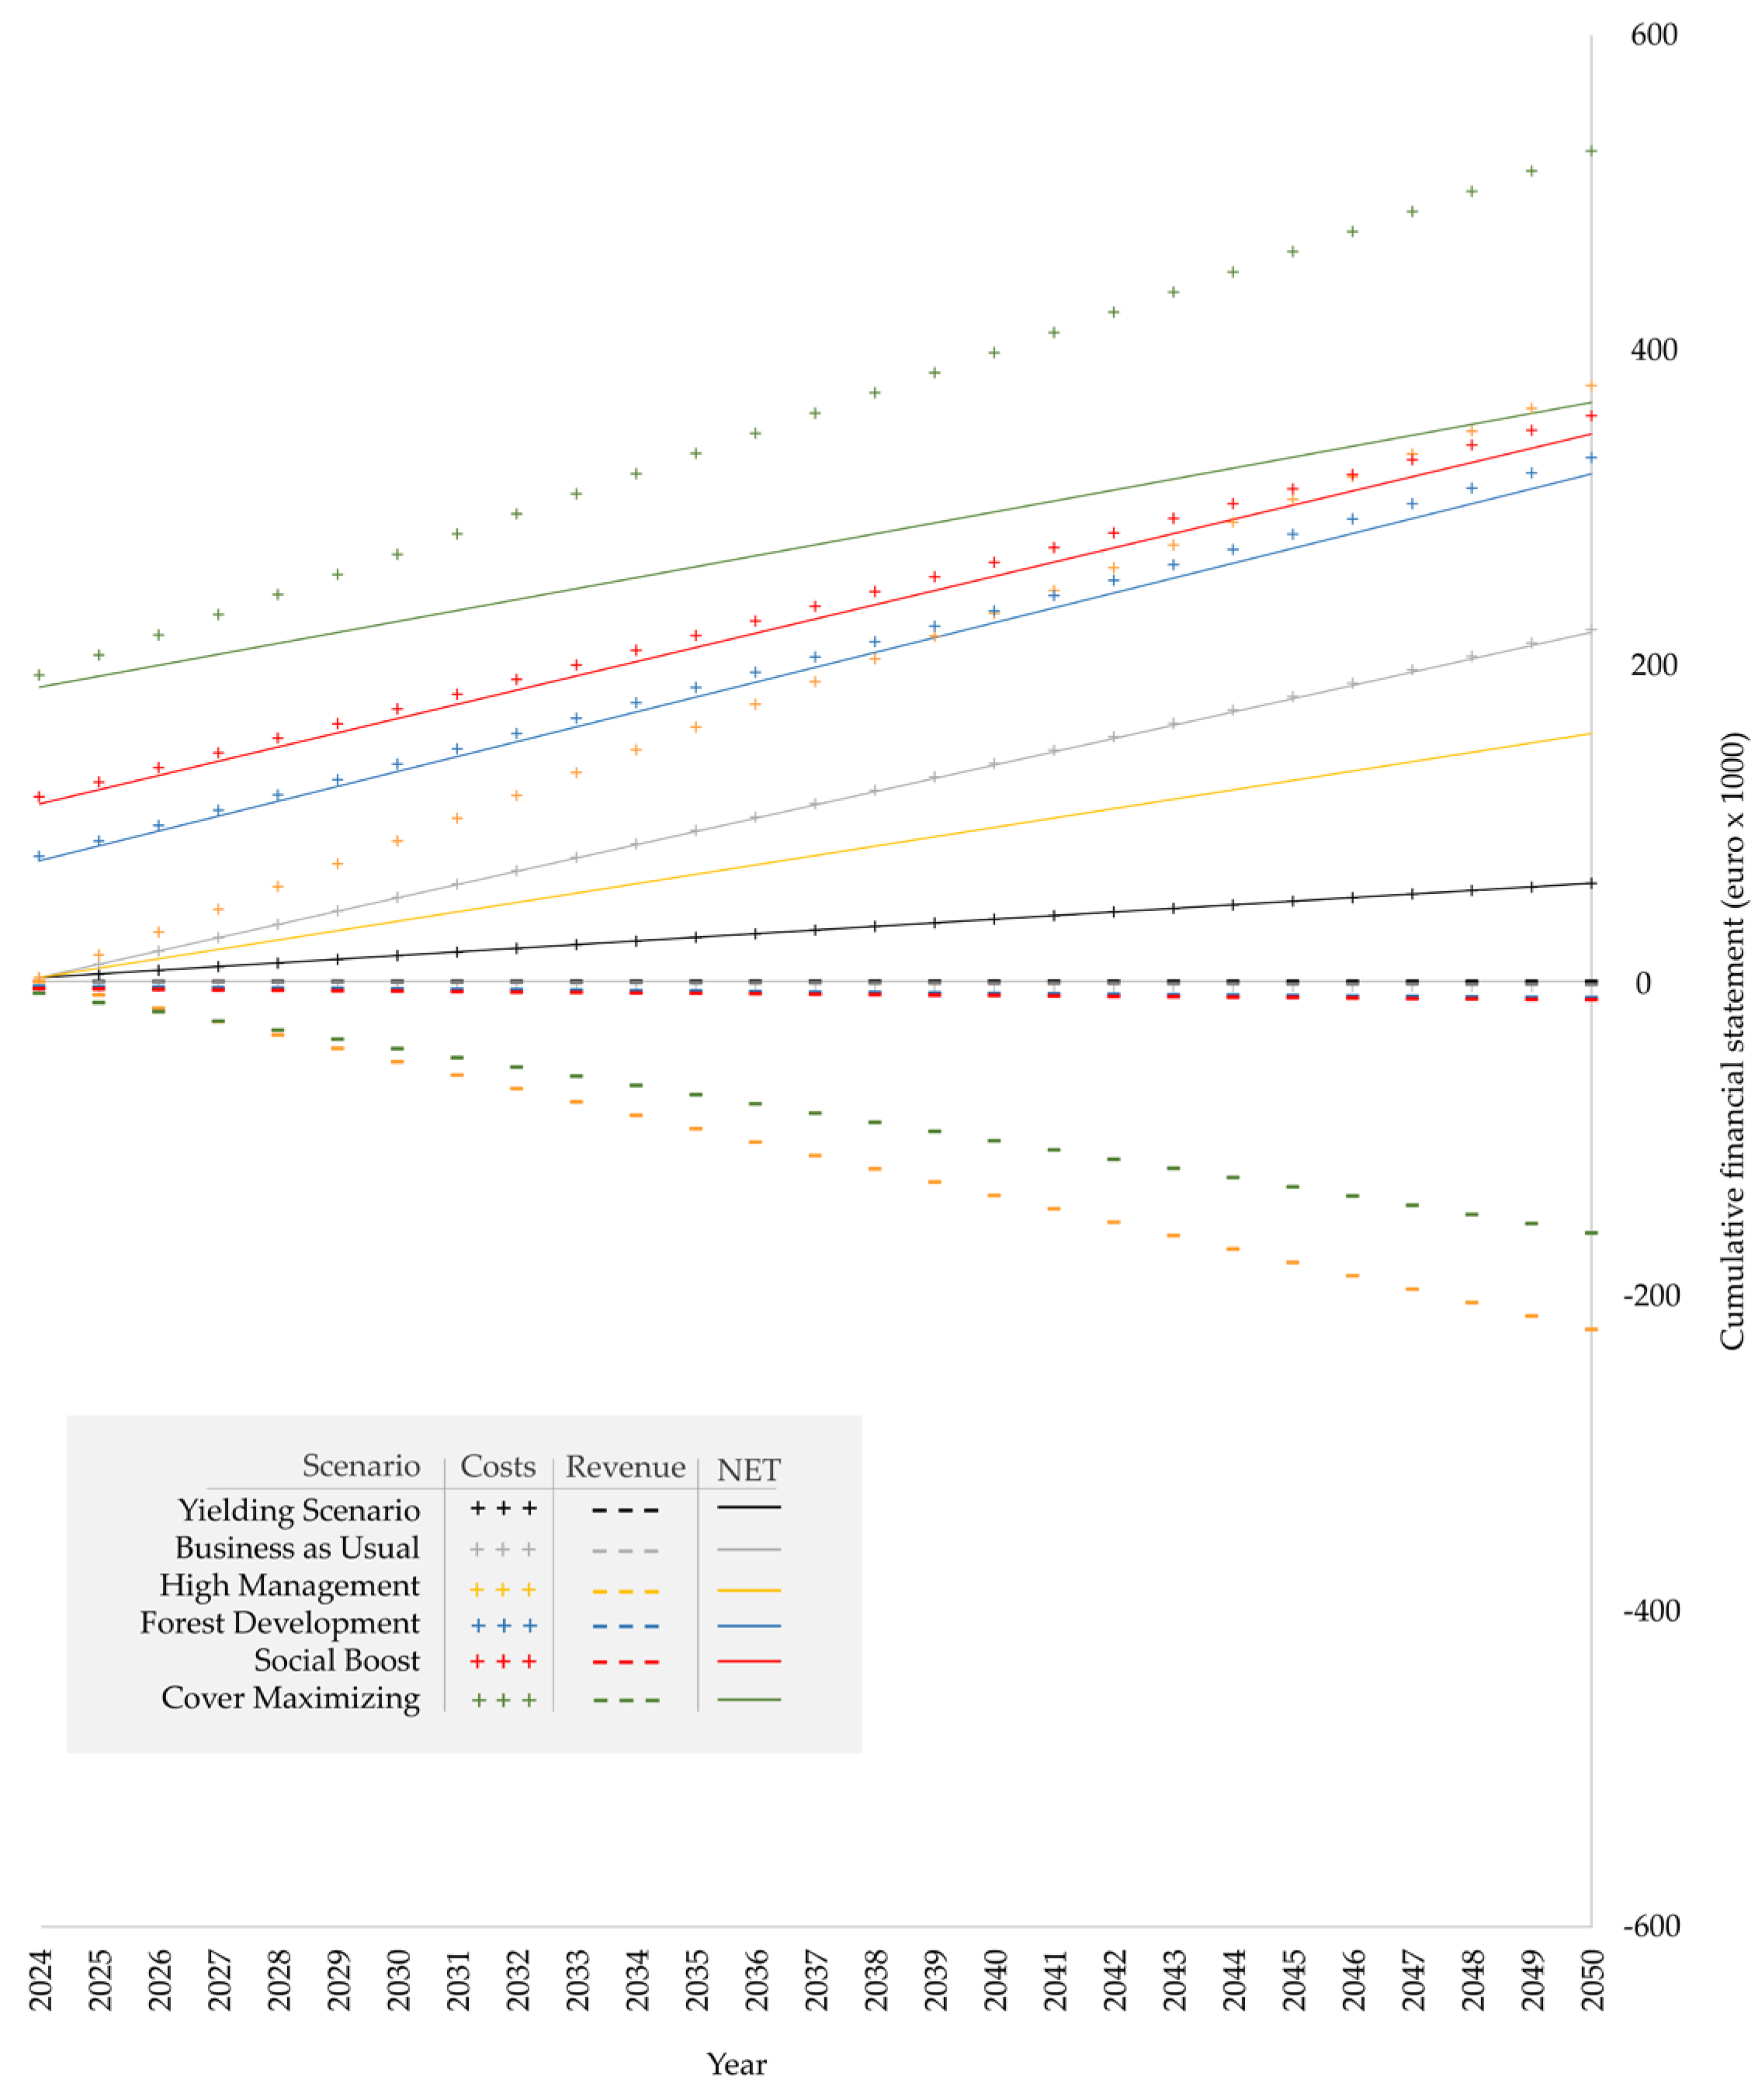
3.2. Economic Costs and Benefits

For the six scenarios, Figure 3 presents i. the cumulative expenditures from the public administration, ii. the potential cumulative revenues from carbon credit sales, and iii. the dynamic balance between estimated revenues and expenditures over the reference period of 2024–2050. Overall, for the UF management of the BaU scenario, the total expenditures and potential revenues were estimated at ERU 223,152.83 and EUR 1746.28, respectively, along the whole reference period. Specifically, the UF strategy of the BaU scenario involved an average annual expenditure of EUR 15,939.49, of which 28.3% was allocated to basic ordinary management, and the rest for dead tree replacement and related parental care. For the UF management of the YS scenario, the estimated total expenditures for the whole reference period amounted to EUR 4441.72 (so, −72.1% compared to BaU scenario). However, potential revenues were absent.
For the UF management of the HM scenario, total expenditures over 27 years were estimated at EUR 377,907.47 (so, 69.3% higher than BaU), with an average annual expenditure of EUR 26,993.39 (of this, 37.7% was allocated to basic ordinary management and 62.3% to dead tree replacement. The potential revenues for the UF management of the HM scenario over the period 2024–2050 were estimated at EUR 220,674.50. For the UF management of the FD scenario, public administration expenditures over 27 years were estimated at EUR 332,278.99 (so, 48.9% higher than those of the BaU scenario), with an average annual expenditure of EUR23,734.21. The 20.3% of the overall expenditures for UF management of the FD scenario was allocated to basic ordinary management, while 79.7% were related to dead tree replacement actions and reforestation interventions. In return, the UF management of the FD scenario ensured potential revenues of EUR 10,371.17 over the 27-year period, five times higher than those projected for BaU scenario. For the UF management of the SB scenario, the estimated total expenditures amounted to EUR 358,811.87, with an average annual expenditure of EUR 25,629.42, distributed as 17.6% for basic ordinary management, 50.4% for dead tree replacement and reforestation, and 32.0% for green subsidies to private UF owners. Being based on chief sustainable UF management efforts, the potential revenues for the SB scenario were estimated at EUR 11,573.50 from 2024 to 2050 (so, +563% compared to BaU scenario). Finally, the total expenditures for implementing the UF management proposed by the CM scenario were estimated at EUR 526,826.70, with an average annual expenditure of EUR 37,630.48. UF management expenditures of the CM scenario were allocated as 20.8% for basic ordinary management, 57.4% for dead tree replacement and reforestation, and 21.8% for green subsidies to private UF owners. Otherwise, the potential revenues from sustainable UF management in the CM scenario were estimated at EUR 159,498.84 between 2024 and 2050 (so, 90 times higher than the potential revenues for BaU scenario).

3.3. Social Costs and Benefits

Table 5 presents the areas of UF available, accessible, and attractive at the beginning and end of the 2024–2050 period for the six investigated scenarios in the testing area. Over the reference period, the UF management of the YS scenario reduced the area of available UF by 8% and the area of attractive UF by 31%, while it gained 8% in terms of area of accessible UF. Between 2024 and 2050, the UF management of the BaU scenario allowed an increase in the availability of UF area by 7% and the accessibility of UF area by 19%, while the area of attractive UF in the BaU scenario remained unchanged during the reference period (i.e., 3.3 ha coverage). Regarding the UF management of the HM scenario, both the area of available UF and accessible UF remained constant (respectively, 25.9 ha and 9.9 ha coverage), while the area of attractive UF notably increased, rising from 3.3 ha coverage in 2024 to 8.9 ha coverage in 2050 (so, +170% over 27 years). Thanks to its expanding strategy of UF management, the FD scenario increased both the availability and accessibility of the UF area by 6% and 16%, respectively. However, the area of attractive UF in the FD scenario remained unchanged, at a stable coverage of 3.3 ha between 2024 and 2050. In the reference period, the UF management of the SB scenario increased the availability of the UF area by 19% and the area of attractive UF by 4%. On the other hand, the area of accessible UF in the SB scenario remained unchanged, at a coverage of 3.3 ha throughout the reference period. Finally, the intensive strategy of UF management proposed for the CM scenario was the only one to concurrently increase the area of available, accessible, and attractive UF during the reference period. In detail, the UF management of the CM scenario allowed an increase in the area of available, accessible, and attractive UF by 4%, 11%, and 70%, respectively.

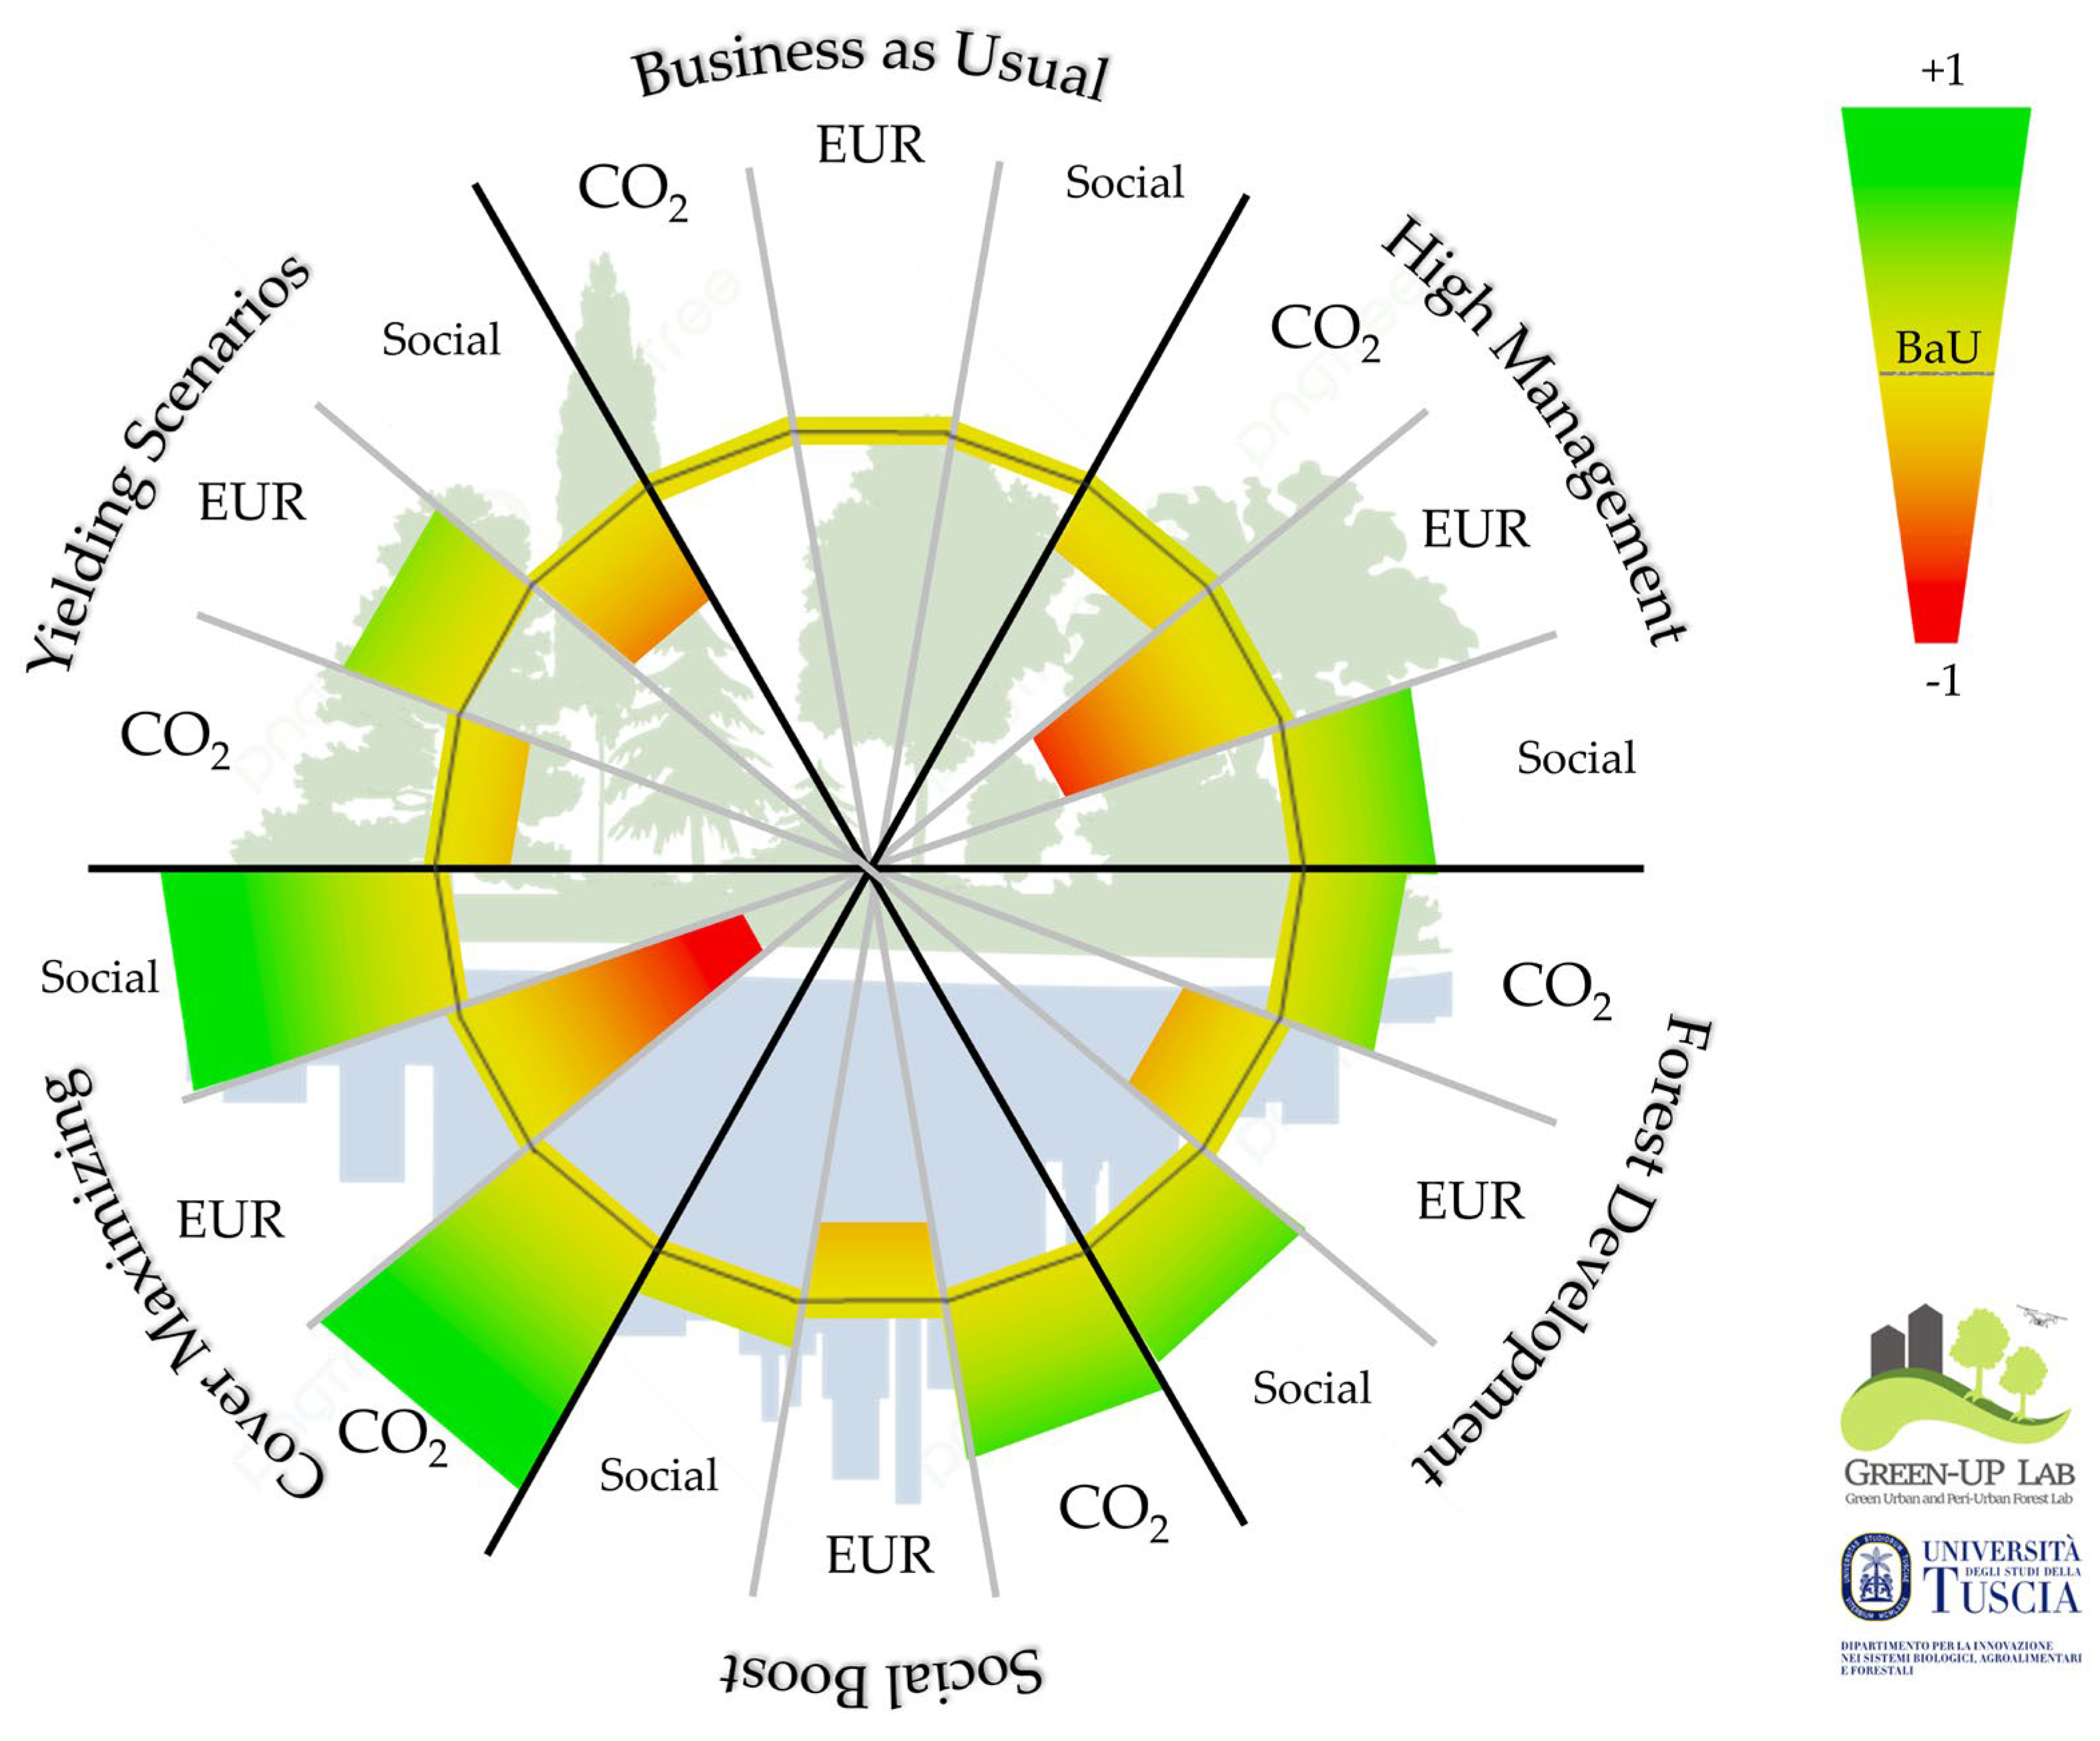
3.4. Environmental, Economic, and Social Trade-Offs

The trade-off analysis between the six investigated scenarios (Figure 4) shows that, overall, the UF management strategies with the best compromises between environment, economic, and social aspects were those of the FD and SB scenarios. Especially, the UF management of the FD scenario demonstrated positive medium-range indices both in terms of environmental and social benefits (i.e., values equal to 0.45 and 0.49 for environmental and social indices, respectively). However, the FD scenario exhibited an economic index with a low negative value (i.e., −0.26). As for the SB scenario, the environmental index was the highest among the six scenarios (i.e., +0.59), demonstrating the best scenario for its climate change mitigation potential. Moreover, the social index of the SB scenario showed a low positive value of +0.12, while the economic index registered a low negative value of −0.32. In contrast, the UF management of the YS scenario, characterized by a passive strategy, resulted in one of the most disadvantageous compromises overall, primarily due to the negative values of the environmental (−0.31) and social (−0.35) indices. On the other hand, the UF management proposed in the YS scenario was the only one to display a positive value for the economic index, even with a medium value equal to +0.35. The scenario with the worst overall compromise was the HM scenario, with a UF management that achieved a positive medium value of the social index (i.e., equal to +0.46) but low to high negative values for both the environmental and economic indices, equal to −0.23 and −0.81, respectively. A separate result was noted for the UF strategy outlined in the CM scenario, which showed extreme values equal to +1, −1, and +1 for the environmental, economic, and social indices, respectively.

4. Discussion

This study introduced and evaluated an innovative Decision Support Tool (DST) to assess the potential impacts of six urban forest (UF) management strategies on CO2 removal, economic outcomes, and social effects in urban areas, while also analyzing the trade-offs inherent in each scenario. The main findings indicate that UF management significantly influenced not only climate change mitigation potential but also key economic and social aspects of sustainable urban development. This study improves the understanding of urban green complexities and offered valuable insights for shaping future urban policies. In this context, developing further data and tools to support governance is crucial for implementing strategies that maximize the multiple benefits of urban green spaces (UGS) and urban forests (UF) [30,37,43,63].

4.1. Overall Performance of the UF Scenarios

From an environmental perspective, for all the investigated scenarios, the UFs effectively offset emissions generated by UF management due to their CO2 removal capacity. In line with the results from other studies (e.g., [29,64]), a complete offset occurred rapidly, in about 6–7 years for all the investigated scenarios. The DST highlighted that the UF management proposed in the High-Management (HM) scenario, which focused on increasing UF managed by public administration, did not result in significant gains in climate change mitigation potential by UFs during the reference period. The lack of improvement in CO2 removal capacity in the HM scenario was mainly due to informal UFs being subject to several management practices that limit natural tree successions. Our results are consistent with the findings reported in the literature [65], indicating that unmanaged UGS and UFs can contribute equally or even more to climate regulation and biodiversity services in urban contexts. To further support this upshot, the DST also found that the Business as Usual (BaU) scenario ensured a 13.5% increase in CO2 removal capacity over 27 years, while avoiding the environmental costs linked to the exponential increase in UF management of the HM scenario. On the other hand, abandoning certain UF management practices (e.g., replacing dead trees) may pose risks to UF CO2 removal capacity, as proved by a 10.7% reduction in CO2 removal observed for the Yielding (YS) Scenario compared to BaU. As emphasized by [66], maintaining (and increasing) urban tree cover is a key challenge for effective UF management. Due to an expansive approach and focus on reforestation, the Forest Development (FD) scenario stood out as a balanced environmental-target UF strategy, showing significant CO2 sequestration without excessive emissions. Beyond CO2 trends, it is important to consider the actual CO2 removal capacities of the tested strategies. Notably, the most significant increases in CO2 sequestration were observed in the more ambitious Social Boost (SB) and Cover Maximizing (CM) scenarios, which represented intensive UF strategies. The findings thus demonstrate that large-scale tree planting is essential for maximizing climate change mitigation potential by UFs. These findings align with previous studies that highlight the potential of sustainable UF management in mitigating climate change (e.g., [67]). However, reforestation interventions come with substantial CO2 emissions due to tree planting practices, claiming an optimal balance across environmental, economic, and social costs and benefits in long-term planning.
Regarding the economic aspect, our study found that, due to the limited size of the testing area used to evaluate the DST, UF management significantly contributes to the public administration budget. Although sustainable UF management could help offset these costs, the results show that the potential revenue from carbon credits remained consistently insufficient to balance expenditures across all the scenarios. In the best-case scenario, potential revenues covered only 58% of the total expenditures. This was applied to the SB scenario, which showed a potential revenue five times higher than that of the BaU. Despite increased costs for UF management and green subsidies for private actors, the SB strategy generated higher revenue through sustainable management actions. Moreover, it further validated how private incentive initiatives would represent both a profitable and effective policy [68]. Nevertheless, the YS scenario was the only one with a non-negative economic performance, as it completely avoided UF management costs. However, it resulted in negative environmental and social impacts, suggesting that a conservative economic approach may undermine environmental and social benefits. Despite showing high revenue potential, the CM scenario raised long-term concerns due to its substantial environmental impact. Moreover, the CM scenario represented the second-best economically performing option, with a revenue/expenditure ratio of 0.3. These findings highlight the need to balance short-term investments with long-term outcomes [69]. Overall, despite the high costs of UF management, the CM, SB, FD, and HM scenarios remain viable options for policymakers. To date, substantial funding is consistently allocated at various governance levels for the implementation of urban greening [9], encouraging municipalities to assign larger budgets to promote sustainable UF management.
Regarding the social impact of the six scenarios, the DST revealed that the availability and accessibility of UFs were strongly influenced by the choices made in each strategy. The CM scenario was the only one that enhanced not only availability but also accessibility and attractiveness of UFs, resulting in overall improvements. However, intensive UF management could involve hidden costs, such as the degradation of ecological quality, which reduces biodiversity and natural traits. Additionally, it could limit public engagement, thereby decreasing community participation and positive perceptions [70]. Less visible effects could undermine the long-term social benefits of UFs. This underscores the need to balance the quantity of UFs with their quality and community usability, as highlighted by studies emphasizing the role of UF access in urban well-being [61]. For instance, the FD scenario, with its expansive yet moderate strategy, offered a more balanced approach, enhancing accessibility without compromising social quality or inclusivity. To effectively capture the complexity of the socio-economic and environmental aspects, the final trade-off analysis proved especially valuable. The analysis allowed for the identification of key differences across the six UF management strategies, balancing environmental, economic, and social factors. The FD and SB scenarios emerged as the most balanced, offering the best environmental and social benefits, although both had negative economic outcomes, which could be justified by substantial public funding. In contrast, the YS and BaU scenarios provided economic benefits (or reduced investments) at the expense of environmental and social outcomes. Thus, effective UF management should prioritize integrated approaches over focusing on individual benefits [35]. We argue that the main challenge lies in balancing these factors while considering local conditions and ensuring long-term sustainability in urban policies. To enhance practical implementation, cities could prioritize strategies like FD and SB, which offer strong environmental and social outcomes, supported by adequate public funding. In general, municipalities could adopt multi-criteria frameworks—such as the one used in this study—to guide decision-making based on local priorities. Additionally, integrating long-term funding tools and citizen engagement may help reconcile economic constraints with sustainable and inclusive urban forestry policies.

4.2. Final Remarks

In light of the findings above, this study offers valuable insights into UF management through the development of the proposed DST. The key strength of the DST lies in its capacity to integrate ecological, economic, and social aspects, offering a comprehensive framework for evaluating different UF management scenarios. Furthermore, the dynamic approach to assess trade-offs between potentially conflicting objectives, such as carbon sequestration, economic costs, and public accessibility, provides added value. At the same time, the presented tool should i. allow decision-makers to visualize the impacts of different UF strategies and ii. offer flexibility for future adjustments as more data become available. While the developed methodology is open to improvement, it has proven effective in addressing the complexities of UF implementation. By combining ecological and social factors with economic performance, it provides a balanced evaluation of different strategies, avoiding decisions that are overly influenced by a single sustainability dimension, such as environmental or financial concerns.
Future research could refine this methodology, for example, by incorporating advanced machine learning techniques [71] or decision-making models that consider both mitigation and adaptation aspects [27], particularly in relation to climate change and socio-economic trends. Several promising directions for future research arise. Further studies could expand to different urban areas, validating the strategies in diverse contexts. Moreover, focusing on informal UFs and UGS, currently left to natural evolution, could uncover effective management practices to enhance their role in sustainability goals. These underutilized spaces could provide valuable resources for carbon sequestration, biodiversity, and social well-being [72]. The DST could be applied to evaluate the impact of ongoing policies, as well. Many cities are already implementing UF strategies; however, their long-term impact on sustainability remains uncertain. Using this tool to evaluate existing policies would offer essential feedback for refining and expanding ongoing strategies. Finally, it is important to explore the practical challenges of implementing these strategies, particularly in urban areas with varying levels of resources and governance structures, to better assess their feasibility. Although this research represents an initial attempt at creating a comprehensive tool for UF management, it lays the foundation for future applications that will be invaluable for decision-making. For this purpose, the main findings of this study represent a step toward more sustainable urban environments. As the tool is further refined and tested in different contexts, it could become a key resource for cities worldwide seeking to improve the resilience, productivity, and inclusivity of their urban ecosystems.

5. Conclusions

This study aimed to assess the potential impact of different urban forest (UF) management strategies on carbon sequestration, economic performance, and social accessibility through the development of an innovative Decision Support Tool (DST). The tool integrated various ecological, economic, and social parameters to evaluate the effectiveness of six management scenarios over a 27-year period. The results reveal that UF management choices not only have significant implications for climate change mitigation but also affect economic and social aspects crucial to sustainable urban development. Among the tested strategies, the Forest Development (FD) and Social Boost (SB) scenarios emerged as the most balanced approaches, offering substantial benefits in carbon sequestration and social inclusivity, while emphasizing the importance of long-term planning and public investment. On the other hand, more intensive approaches, such as Cover Maximizing (CM), showed considerable improvements in CO2 removal but came with high environmental costs and significant economic implications. Additionally, this study highlights the importance of balancing environmental, economic, and social factors when developing UF strategies, as well as the need for flexible and adaptable decision-making tools to optimize these goals.
In conclusion, this study presents a novel and comprehensive approach to UF management through the development of the DST, which could serve as a valuable tool for urban planners and policymakers. Despite the potential of developing the tool for further refinement (e.g., limitations about model simplifications, species homogeneity, static assumptions about carbon credit prices, etc.), the methodology demonstrated its ability to handle the complexities of UF management by integrating ecological, economic, and social dimensions of sustainability. Future research could focus on refining the model by incorporating more detailed data, advanced machine learning techniques, or approaches that consider both mitigation and adaptation strategies. Moreover, expanding the application of the DST to different urban contexts, scales, and UF types would provide further insights into the effectiveness of UF strategies. The findings and methodology of this study could contribute to the growing body of research on urban sustainability, providing a foundation for future work that can help cities worldwide develop more resilient, sustainable, and inclusive urban ecosystems. As urban areas continue to face environmental challenges, the development of robust decision-making tools, such as the DST, will certainly be crucial in shaping effective and comprehensive strategies for UGS and UF planning and management.

Supplementary Materials

The following supporting information can be downloaded at: https://www.mdpi.com/article/10.3390/urbansci9060216/s1, Table S1: Life Cycle Inventory; Table S2: Urban forest management inputs; Table S3: Material and energy flows; Table S4: Market prices of materials and energy; Table S5: Frequency of urban forest management practices.

Author Contributions

Conceptualization, M.d.C.; methodology, M.d.C.; software, M.d.C.; validation, M.d.C., F.V.M. and M.M.; formal analysis, M.d.C.; investigation, M.d.C. and B.L.; resources, F.V.M., M.M. and G.S.-M.; data curation, M.d.C. and B.L.; writing—original draft preparation, M.d.C.; writing—review and editing, M.d.C. and F.V.M.; visualization, M.d.C.; supervision, M.M., B.L. and G.S.-M.; project administration, M.d.C., F.V.M., M.M. and G.S.-M. All authors have read and agreed to the published version of the manuscript.

Funding

This research received no external funding.

Data Availability Statement

The original contributions presented in this study are included in the article/Supplementary Material. Further inquiries can be directed to the corresponding author.

Conflicts of Interest

The authors declare no conflicts of interest.

References

  1. United Nations (UN), Department of Economic and Social Affairs, Population Division. World Urbanization Prospects: The 2018 Revision (ST/ESA/SER. A/420); United Nations: New York, NY, USA, 2020; Available online: https://www.un.org/en/desa/2018-revision-world-urbanization-prospects (accessed on 10 March 2025).
  2. Acuto, M.; Parnell, S.; Seto, K.C. Building a global urban science. Nat. Sustain. 2018, 1, 2–4. [Google Scholar] [CrossRef]
  3. Elmqvist, T.; Andersson, E.; McPhearson, T.; Bai, X.; Bettencourt, L.; Brondizio, E.; Colding, J.; Daily, G.; Folke, C.; Grimm, N.; et al. Urbanization in and for the Anthropocene. NPJ Urban Sustain. 2021, 1, 6. [Google Scholar] [CrossRef]
  4. United Nations (UN). In Global State of National Urban Policy—Achieving Sustainable Development Goals and Delivering Climate Action; OECD Publishing: Paris, France, 2021; Available online: https://www.oecd.org/en/publications/global-state-of-national-urban-policy-2021_96eee083-en.html (accessed on 10 March 2025).
  5. James, N. Urbanization and its impact on environmental sustainability. J. Appl. Geogr. Stud. 2024, 3, 54–66. [Google Scholar] [CrossRef]
  6. Ali, S.; Niaz, H.; Ahmad, S.; Khan, S. Investigating how Rapid Urbanization Contributes to Climate Change and the Social Challenges Cities Face in Mitigating its Effects. Rev. Appl. Manag. Soc. Sci. 2025, 8, 1–16. [Google Scholar] [CrossRef]
  7. United Nations (UN), Department of Economic and Social Affairs, Population Division. Transforming Our World: The 2030 Agenda for Sustainable Development, General Assembly (A/RES/70/1); United Nations: New York, NY, USA, 2015; Available online: https://sdgs.un.org/2030agenda (accessed on 10 March 2025).
  8. Addas, A. The importance of urban green spaces in the development of smart cities. Front. Environ. Sci. 2023, 11, 1206372. [Google Scholar] [CrossRef]
  9. La Torre, M.; Leo, S.; Palma, A.; Zapata, J.D.S. Public spending and green finance: A systematic literature review. Res. Int. Bus. Finance 2024, 68, 102197. [Google Scholar] [CrossRef]
  10. Toxopeus, H.; Polzin, F. Reviewing financing barriers and strategies for urban nature-based solutions. J. Environ. Manag. 2021, 289, 112371. [Google Scholar] [CrossRef]
  11. Esperon-Rodriguez, M.; Gallagher, R.; Calfapietra, C.; Cariñanos, P.; Dobbs, C.; Eleuterio, A.A.; Rodriguez , D.E.; Jahani, A.; Litvak, E.; Livesley, S.J.; et al. Barriers and opportunities for resilient and sustainable urban forests. Nat. Cities 2025, 2, 290–298. [Google Scholar] [CrossRef]
  12. Zhao, D.; Cai, J.; Xu, Y.; Liu, Y.; Yao, M. Carbon sinks in urban public green spaces under carbon neutrality: A bibliometric analysis and systematic literature review. Urban For. Urban Green. 2023, 86, 128037. [Google Scholar] [CrossRef]
  13. Francini, S.; Chirici, G.; Chiesi, L.; Costa, P.; Caldarelli, G.; Mancuso, S. Global spatial assessment of potential for new peri-urban forests to combat climate change. Nat. Cities 2024, 1, 286–294. [Google Scholar] [CrossRef]
  14. Nowak, D.J.; Hirabayashi, S.; Doyle, M.; McGovern, M.; Pasher, J. Air pollution removal by urban forests in Canada and its effect on air quality and human health. Urban For. Urban Green. 2018, 29, 40–48. [Google Scholar] [CrossRef]
  15. Marando, F.; Heris, M.P.; Zulian, G.; Udías, A.; Mentaschi, L.; Chrysoulakis, N.; Parastatidis, D.; Maes, J. Urban heat island mitigation by green infrastructure in European Functional Urban Areas. Sustain. Cities Soc. 2022, 77, 103564. [Google Scholar] [CrossRef]
  16. di Cristofaro, M.; Di Pirro, E.; Ottaviano, M.; Marchetti, M.; Lasserre, B.; Sallustio, L. Greener or Greyer? Exploring the Trends of Sealed and Permeable Spaces Availability in Italian Built-Up Areas during the Last Three Decades. Forests 2022, 13, 1983. [Google Scholar] [CrossRef]
  17. Hartig, T.; Kahn, P.H., Jr. Living in cities, naturally. Science 2016, 352, 938–940. [Google Scholar] [CrossRef]
  18. di Cristofaro, M.; Sallustio, L.; Sitzia, T.; Marchetti, M.; Lasserre, B. Landscape preference for trees outside forests along an urban–rural–natural gradient. Forests 2020, 11, 728. [Google Scholar] [CrossRef]
  19. Nowak, D.J. Assessing the Benefits and Economic Values of Trees. In Routledge Handbook of Urban Forestry, 1st ed.; Ferrini, F., van den Bosch, C.C.K., Fini, A., Eds.; Routledge handbook of urban forestry: New York, NY, USA, 2017; pp. 152–163, Chapter 11. Available online: https://research.fs.usda.gov/treesearch/54838 (accessed on 10 March 2025).
  20. Song, X.P.; Tan, P.Y.; Edwards, P.; Richards, D. The economic benefits and costs of trees in urban forest stewardship: A systematic review. Urban For. Urban Green. 2018, 29, 162–170. [Google Scholar] [CrossRef]
  21. Rahmafitria, F.; Kaswanto, R.L. The role of eco-attraction in the intention to conduct low-carbon actions: A study of visitor behavior in urban forests. Int. J. Tour. Cities 2024, 10, 881–904. [Google Scholar] [CrossRef]
  22. Mwanzu, A.; Nguyu, W.; Nato, J.; Mwangi, J. Promoting sustainable environments through urban green spaces: Insights from Kenya. Sustainability 2023, 15, 11873. [Google Scholar] [CrossRef]
  23. Lee, D.H.; Kim, D.H.; Kim, S.I. Characteristics of forest carbon credit transactions in the voluntary carbon market. Clim. Policy 2018, 18, 235–245. [Google Scholar] [CrossRef]
  24. Papari, C.A.; Toxopeus, H.; Polzin, F.; Bulkeley, H.; Menguzzo, E.V. Can the EU taxonomy for sustainable activities help upscale investments into urban nature-based solutions? Environ. Sci. Policy 2024, 151, 103598. [Google Scholar] [CrossRef]
  25. van Oorschot, J.; Slootweg, M.; Remme, R.P.; Sprecher, B.; van der Voet, E. Optimizing green and gray infrastructure planning for sustainable urban development. NPJ Urban Sustain. 2024, 4, 41. [Google Scholar] [CrossRef]
  26. Esperon-Rodriguez, M.; Tjoelker, M.G.; Lenoir, J.; Baumgartner, J.B.; Beaumont, L.J.; Nipperess, D.A.; Power, S.A.; Richard, B.; Rymer, P.D.; Gallagher, R.V. Climate change increases global risk to urban forests. Nat. Clim. Change 2022, 12, 950–955. [Google Scholar] [CrossRef]
  27. Teixeira, C.P.; Fernandes, C.O.; Ahern, J. Adaptive planting design and management framework for urban climate change adaptation and mitigation. Urban For. Urban Green. 2022, 70, 127548. [Google Scholar] [CrossRef]
  28. Myers, G.; Mullenbach, L.E.; Jolley, J.A.; Cutts, B.B.; Larson, L.R. Advancing social equity in urban tree planting: Lessons learned from an integrative review of the literature. Urban For. Urban Green. 2023, 89, 128116. [Google Scholar] [CrossRef]
  29. Antenucci, E.; Di Pirro, E.; di Cristofaro, M.; Garfì, V.; Marchetti, M.; Lasserre, B. Beneficial or impactful management? Life Cycle Assessment and i-Tree Canopy to evaluate the net environmental benefits of Mediterranean urban forests. Urban For. Urban Green. 2025, 107, 128800. [Google Scholar] [CrossRef]
  30. Roman, L.A.; Conway, T.M.; Eisenman, T.S.; Koeser, A.K.; Barona, C.O.; Locke, D.H.; Jenerette, G.D.; Östberg, J.; Vogt, J. Beyond ‘trees are good’: Disservices, management costs, and tradeoffs in urban forestry. Ambio 2021, 50, 615–630. [Google Scholar] [CrossRef]
  31. Cueva, J.; Yakouchenkova, I.A.; Fröhlich, K.; Dermann, A.F.; Dermann, F.; Köhler, M.; Grossmann, C.; Meier, W.; Bauhus, J.; Schröder, D.; et al. Synergies and trade-offs in ecosystem services from urban and peri-urban forests and their implication to sustainable city design and planning. Sustain. Cities Soc. 2022, 82, 103903. [Google Scholar] [CrossRef]
  32. Breyer, B.; Mohr, H. Right tree, right place for whom? Environmental justice and practices of urban forest assessment. Local Environ. 2023, 28, 1082–1096. [Google Scholar] [CrossRef]
  33. Zhang, B.; MacKenzie, A. Trade-offs and synergies in urban green infrastructure: A systematic review. Urban For. Urban Green. 2024, 94, 128262. [Google Scholar] [CrossRef]
  34. Cheng, H.; Escobedo, F.J.; Thomas, A.S.; De Los Reyes, J.F.; Ng’ombe, J.N.; Soto, J.R. Understanding how urban communities make trade-offs between forest management and ecosystem service objectives. For. Policy Econ. 2025, 172, 103445. [Google Scholar] [CrossRef]
  35. Ordóñez, C.; Threlfall, C.G.; Kendal, D.; Hochuli, D.F.; Davern, M.; Fuller, R.A.; van der Ree, R.; Livesley, S.J. Urban forest governance and decision-making: A systematic review and synthesis of the perspectives of municipal managers. Landsc. Urban Plan. 2019, 189, 166–180. [Google Scholar] [CrossRef]
  36. Albert, C.; Brillinger, M.; Guerrero, P.; Gottwald, S.; Henze, J.; Schmidt, S.; Ott, E.; Schröter, B. Planning nature-based solutions: Principles, steps, and insights. Ambio 2021, 50, 1446–1461. [Google Scholar] [CrossRef]
  37. Wirtz, Z.; Hagerman, S.; Hauer, R.J.; Konijnendijk, C.C. What makes urban forest governance successful?–A study among Canadian experts. Urban For. Urban Green. 2021, 58, 126901. [Google Scholar] [CrossRef]
  38. Croeser, T.; Garrard, G.; Sharma, R.; Ossola, A.; Bekessy, S. Choosing the right nature-based solutions to meet diverse urban challenges. Urban For. Urban Green. 2021, 65, 127337. [Google Scholar] [CrossRef]
  39. Almenar, J.B.; Petucco, C.; Gutiérrez, T.N.; Chion, L.; Rugani, B. Assessing net environmental and economic impacts of urban forests: An online decision support tool. Land 2022, 12, 70. [Google Scholar] [CrossRef]
  40. Barron, S.; Dunster, K.; Williams, N.S.; Rugel, E.; Kozak, R.; Sheppard, S. A scenario process for urban forest design at the neighbourhood level. Futures 2023, 150, 103172. [Google Scholar] [CrossRef]
  41. Nyelele, C.; Kroll, C.N. A multi-objective decision support framework to prioritize tree planting locations in urban areas. Landsc. Urban Plan. 2021, 214, 104172. [Google Scholar] [CrossRef]
  42. Lumeng, L.I.U.; Jianguo, W.U. Scenario analysis in urban ecosystem services research: Progress, prospects, and implications for urban planning and management. Landsc. Urban Plan. 2022, 224, 104433. [Google Scholar] [CrossRef]
  43. Yadav, N.; Rakholia, S.; Yosef, R. Decision Support Systems in Forestry and Tree-Planting Practices and the Prioritization of Ecosystem Services: A Review. Land 2024, 13, 230. [Google Scholar] [CrossRef]
  44. Rötzer, T.; Moser-Reischl, A.; Rahman, M.A.; Grote, R.; Pauleit, S.; Pretzsch, H. Modelling urban tree growth and ecosystem services: Review and perspectives. Prog. Bot. 2021, 82, 405–464. [Google Scholar] [CrossRef]
  45. Almenar, J.B.; Petucco, C.; Sonnemann, G.; Geneletti, D.; Elliot, T.; Rugani, B. Modelling the net environmental and economic impacts of urban nature-based solutions by combining ecosystem services, system dynamics and life cycle thinking: An application to urban forests. Ecosyst. Serv. 2023, 60, 101506. [Google Scholar] [CrossRef]
  46. Italian Ministry of Infrastructures and Transport (MIT). National Innovative Program for the Quality of Living. 2021. Available online: https://www.mit.gov.it/nfsmitgov/files/media/notizia/2022-04/Rapporto_Pinqua_web.pdf (accessed on 10 March 2025).
  47. Sallustio, L.; Quatrini, V.; Geneletti, D.; Corona, P.; Marchetti, M. Assessing land take by urban development and its impact on carbon storage: Findings from two case studies in Italy. Environ. Impact Assess. Rev. 2015, 54, 80–90. [Google Scholar] [CrossRef]
  48. Italian Ministry of Ecological Transition (MITE). National Urban and Extra-Urban Forest Plan. 2021. Available online: https://www.mase.gov.it/portale/documents/d/guest/pnrr_piano_forestazione-pdf (accessed on 10 March 2025).
  49. Italian Ministry of Agricultural, Food and Forestry Policies (MiPAAF). National Forest Strategy. 2022. Available online: https://www.reterurale.it/foreste/StrategiaForestaleNazionale (accessed on 10 March 2025).
  50. National Oceanic and Atmospheric Administration (NOAA). Paleo Data Search. 2024. Available online: https://www.ncei.noaa.gov/access/paleo-search/ (accessed on 10 March 2025).
  51. Hemery, G.E.; Savill, P.S.; Pryor, S.N. Applications of the crown diameter–stem diameter relationship for different species of broadleaved trees. For. Ecol. Manag. 2005, 215, 285–294. [Google Scholar] [CrossRef]
  52. Oldfield, E.E.; Warren, R.J.; Felson, A.J.; Bradford, M.A. Challenges and future directions in urban afforestation. J. Appl. Ecol. 2013, 50, 1169–1177. [Google Scholar] [CrossRef]
  53. Rebele, F.; Lehmann, C. Twenty years of woodland establishment through natural succession on a sandy landfill site in Berlin, Germany. Urban For. Urban Green. 2016, 18, 182–189. [Google Scholar] [CrossRef]
  54. Hilbert, D.R.; Roman, L.A.; Koeser, A.K.; Vogt, J.; van Doorn, N.S. Urban tree mortality: A literature review. Arboric. Urban For. 2019, 45, 167–200. [Google Scholar] [CrossRef]
  55. European Commission (EC). EU Mission: Climate-Neutral and Smart Cities. 2021. Available online: https://research-and-innovation.ec.europa.eu/ (accessed on 10 March 2025).
  56. ISO 14040:2006; Environmental Management. Life Cycle Assessment—Principle and Framework. International Organization for Standardization: Geneva, Switzerland, 2006. Available online: https://www.iso.org/standard/37456.html (accessed on 10 March 2025).
  57. Wernet, G.; Bauer, C.; Steubing, B.; Reinhard, J.; Moreno-Ruiz, E.; Weidema, B. The ecoinvent database version 3 (part I): Overview and methodology. Int. J. Life Cycle Assess. 2016, 21, 1218–1230. [Google Scholar] [CrossRef]
  58. Huijbregts, M.A.; Steinmann, Z.J.; Elshout, P.M.; Stam, G.; Verones, F.; Vieira, M.D.M.; Zijp, M.; Hollander, A.; van Zelm, R. ReCiPe 2016: A harmonised life cycle impact assessment method at midpoint and endpoint level. Int. J. Life Cycle Assess. 2017, 22, 138–147. [Google Scholar] [CrossRef]
  59. Nowak, D.J. Understanding i-Tree: 2021 summary of programs and methods. In General Technical Report NRS-200–2021; Department of Agriculture: Madison, WI, USA, 2021; pp. 1–100. Available online: https://www.fs.usda.gov/nrs/pubs/gtr/gtr_nrs200-2021.pdf (accessed on 10 March 2025).
  60. European Securities and Markets Authority (ESMA), Economics, Financial Stability and Risk Department. ESMA Market Report on EU carbon markets, 2024. Available online: http://www.esma.europa.eu/ (accessed on 10 March 2025).
  61. Biernacka, M.; Kronenberg, J. Classification of institutional barriers affecting the availability, accessibility and attractiveness of urban green spaces. Urban For. Urban Green. 2018, 36, 22–33. [Google Scholar] [CrossRef]
  62. Sneath, P.H. Thirty years of numerical taxonomy. Syst. Biol. 1995, 44, 281–298. [Google Scholar] [CrossRef]
  63. Ordóñez, C.; Threlfall, C.G.; Livesley, S.J.; Kendal, D.; Fuller, R.A.; Davern, M.; van der Ree, R.; Hochuli, D.F. Decision-making of municipal urban forest managers through the lens of governance. Environ. Sci. Policy 2020, 104, 136–147. [Google Scholar] [CrossRef]
  64. Muscas, D.; Petrucci, R.; Orlandi, F.; Torre, L.; Fornaciari, M. Life cycle assessment of common urban trees-The environmental performance of three Mediterranean cities. Sci. Total. Environ. 2024, 954, 176690. [Google Scholar] [CrossRef]
  65. Robinson, S.L.; Lundholm, J.T. Ecosystem services provided by urban spontaneous vegetation. Urban Ecosyst. 2012, 15, 545–557. [Google Scholar] [CrossRef]
  66. Endreny, T.; Santagata, R.; Perna, A.; De Stefano, C.; Rallo, R.F.; Ulgiati, S. Implementing and managing urban forests: A much needed conservation strategy to increase ecosystem services and urban wellbeing. Ecol. Model. 2017, 360, 328–335. [Google Scholar] [CrossRef]
  67. Suhane, S.; Sharma, U.; Agrawal, R.; Singh, S.P. Integrating Urban Forests into Sustainable Urban Planning: Strategies, Challenges and Future Directions. Int. J. Environ. Sci. 2024, 10, 2229–7359. [Google Scholar] [CrossRef]
  68. Fitch, E.R.; Tyrna, A.; Lusk, M.G. A comparative study of the secondary benefits of stormwater ponds in economically distinct neighborhoods of Tampa, Florida USA. Discov. Water 2024, 4, 83. [Google Scholar] [CrossRef]
  69. Vogt, J.; Hauer, R.J.; Fischer, B.C. The costs of maintaining and not maintaining the urban forest: A review of the urban forestry and arboriculture literature. Arboric. Urban For. 2015, 41, 293–323. [Google Scholar] [CrossRef]
  70. Ostoić, S.K.; Vuletić, D.; Kičić, M. Exploring the negative perceptions of tree-based urban green space. People’s behaviour and management are crucial. Urban For. Urban Green. 2024, 101, 128539. [Google Scholar] [CrossRef]
  71. Amati, M.; Tiede, J.; Sun, Q.C.; Deilami, K.; Hurley, J.; Fox, A.; Dickson, J. Using machine learning to identify urban forest crown bounding boxes (CBB): Exploring a new method to develop urban forest policy. Urban For. Urban Green. 2023, 85, 127943. [Google Scholar] [CrossRef]
  72. Luo, S.; Patuano, A. Multiple ecosystem services of informal green spaces: A literature review. Urban For. Urban Green. 2023, 81, 127849. [Google Scholar] [CrossRef]
Figure 1. Location of the Vazzieri district in Campobasso, central Italy, and map of the urban forest (UF) infrastructure within. The UF polygons are color-coded to indicate varying levels of tree cover density and different ownerships (Private-owned UF, Priv-UF; Public-managed UF, Pub-UF; Informal UF, Inf-UF).
Urbansci 09 00216 g001
Figure 2. CO2 sequestration by the six urban forest (UF) management scenarios during the reference period of 2024–2050. The line graph illustrates the CO2 removal trend across six different UF management strategies.
Urbansci 09 00216 g002
Figure 3. Cumulative trends in financial expenditures and potential revenues for the six urban forest (UF) management scenarios over the reference period (2024–2050). The line graph also shows the dynamic net balance for each scenario, illustrating the evolving financial performance over time.
Urbansci 09 00216 g003
Figure 4. Best and worst trade-offs across different UF management strategies proposed in the six scenarios. The comparison is based on three sustainability indices—environmental, economic, and social—over the reference period.
Urbansci 09 00216 g004
Table 1. Coverage (in hectares) of the unsealed area divided into non-forested green spaces (e.g., grassland and brownfields) and urban forest (UF), classified by ownership as private (Priv-UF), public-managed (Pub-UF), or informal (Inf-UF). The sealed area of Vazzieri district is also reported to highlight the distribution of paved, built-up, and other non-permeable spaces within the testing area.
Infrastructures Within the Testing AreaCoverage (ha)
Sealed area69.9
Non-forested (Grassland and brownfields)25.0
Urban forests (UFs)Private Urban Forests (Priv-UFs)17.0
Collective Urban Forests (Col-UFs)Managed (Pub-UFs)3.3
Informal (Inf-UFs)5.6
Table 2. Summary of the three models used to simulate the evolution of urban forest (UF) canopy growth, forest expansion, and tree mortality in the testing area over the reference period of 2024–2050. Each model’s source study is provided, along with its specific application to Public-owned UF (Pub-UF), Private-owned UF (Priv-UF), and Informal UF (Inf-UF).
ModelReferencesApplication
Priv-UFPub-UFInf-UF
Canopy growth[29]Ci = π/4 · (Dbhi · K/d)2
Forest expansion[52,53]NoneNone+4.4% surface yr−1
Tree mortality[54]+0.7% dead trees yr−1+1.4% dead trees per year+2.8% dead trees yr−1
Table 3. Synthesis of the six urban forest (UF) strategies across the six investigated scenarios. The table outlines the specific actions and interventions proposed for each scenario, based on different UF types (Public-owned UF—Pub-UF; Private-owned UF—Priv-UF; Informal UF—Inf-UF). The intensity of tree planting for reforestation interventions is also described.
ScenarioUrban ForestInterventions
Lawn
Mowing
Tree
Pruning
Dead Tree ReplacementReforestation Actions
Yielding ScenarioPub-UFYesYesNoNo
Inf-UFNoNoNoNo
Priv-UFYesYesNoNo
Business as UsualPub-UFYesYesYesNo
Inf-UFNoNoNoNo
Priv-UFYesYesYesNo
High ManagementPub-UFYesYesYesNo
Inf-UFYesYesYesNo
Priv-UFYesYesYesNo
Forest DevelopmentPub-UFYesYesYesYes<50% to 50% UF cover,
and 50–99% to full cover
Inf-UFNoNoNoNo
Priv-UFYesYesYesNo
Social BoostPub-UFYesYesYesNo
Inf-UFNoNoNoNo
Priv-UFYesYesYesYes+20% UF cover
Cover MaximizingPub-UFYesYesYesYes<50% to 50% UF cover,
and 50−99% to full cover
Inf-UFYesYesYesYes75–99% to full cover
Priv-UFYesYesYesYes+20% UF cover
Table 4. Cumulative CO2 emissions from the six urban forest (UF) management scenarios over the reference period. The table breaks down total emissions (in Mg) by UF management actions and interventions, distinguishing between basic management practices (e.g., lawn mowing and tree pruning), dead tree replacement, and reforestation interventions.
ScenarioCumulative CO2 Emitted (Mg)
Basic Ordinary ManagementDead Tree ReplacementReforestation
Yielding Scenario1639.3--
Business as Usual1781.654.5-
High Management1852.880.3-
Forest Development1800.464.126.2
Social Boost2071.561.739.1
Cover Maximizing2134.876.865.4
Table 5. Changes in the coverage of available, accessible, and attractive urban forests (UFs) within the testing area under the six UF management strategies. The availability, accessibility, and attractiveness of UFs (in hectares) are presented for both the starting year (2024) and the final year (2050) of the reference period.
ScenarioUF Social IndicatorCoverage (ha)
20242050
Yielding ScenarioAvailability25.923.7
Accessibility8.99.6
Attractiveness3.32.3
Business as UsualAvailability25.927.6
Accessibility8.910.6
Attractiveness3.33.3
High ManagementAvailability25.925.9
Accessibility8.98.9
Attractiveness3.38.9
Forest DevelopmentAvailability27.929.6
Accessibility10.912.6
Attractiveness5.45.4
Social BoostAvailability28.930.6
Accessibility8.910.6
Attractiveness3.33.3
Cover MaximizingAvailability31.032.2
Accessibility10.912.1
Attractiveness5.49.1
Disclaimer/Publisher’s Note: The statements, opinions and data contained in all publications are solely those of the individual author(s) and contributor(s) and not of MDPI and/or the editor(s). MDPI and/or the editor(s) disclaim responsibility for any injury to people or property resulting from any ideas, methods, instructions or products referred to in the content.

