Article

Quantifying Virtual Urban Commercial Linkages Using Spatial Phone Call Data—A Comparative Study Between Guangzhou and Shenzhen

1
School of Geographical Sciences and Remote Sensing, Guangzhou University, Guangzhou 510006, China
2
Faculty of Geography, Yunnan Normal University, Kunming 650050, China
3
Southwest United Graduate School, Kunming 650092, China
*
Author to whom correspondence should be addressed.
Urban Sci. 2025, 9(5), 176; https://doi.org/10.3390/urbansci9050176
Submission received: 17 February 2025 / Revised: 7 May 2025 / Accepted: 15 May 2025 / Published: 20 May 2025

Abstract

:
The importance of cities hinges on how they connect with other cities globally, yet research has been lacking in the exploration of virtual linkages. This study takes Guangzhou and Shenzhen as samples to measure their virtual urban linkage with other cities in China. First, it improves the gravity model by considering the impact of distance on call intentions in the context of phone conversations. Second, it uses call detail record (CDR) data to measure urban linkage based on the enhanced gravity model. Lastly, it employs a more effective geodetector to analyze the driving factors. The results indicate the following: cities in the southeast exhibit significantly higher connectivity; Guangzhou’s linkage is more pronounced than Shenzhen’s; and the volume of import and export trade is a stronger indicator of urban linkage. The urban linkage measured through CDRs offers new insights into the study of urban linkage.

1. Introduction

The definition of urban linkages is derived from the theory of “flow space” [1,2,3]. It refers to the mutual association and interaction of multiple elements, including materials, information, and populations, among different nodal points [4,5,6,7]. This exchange reshapes urban networks, resulting in tight connections between cities [8,9,10]. With the development of urbanization, urban linkages will be more obvious in the near future [11,12]. Thus, quantifying urban linkages between cities is favorable for resource allocation and planning [13,14,15].
As a heated topic, previous studies have illustrated urban linkages using multi-source data, such as population mobility data [16,17], traffic data [18,19], firm data [20,21,22], and Weibo data [23,24]. The major conclusions are that the linkage between city–pairs is solely dependent upon their respective economic masses and the distance between them [25,26]. However, previous studies have focused on actual urban linkages without considering virtual linkages. Moreover, contradictive conclusions were found in different investigations due to the indiscriminate use of different indicators [27], such as entropy, dominance, relative strength, node symmetry, and link symmetry [28]. The development of information and communication technology (ICT) has led to the growing significance of intercity information flows [29]. Rarely have investigations addressed these virtual linkages among cities, where internet activities transcend spatial constraints, and comparative studies have been lacking. Therefore, it is urgent to compare the virtual urban linkages among cities.
Phone call record data, among big spatiotemporal data, record incoming and outgoing phone calls with detailed spatiotemporal information and are widely used in urban research [30,31]. These data offer the following three advantages: detailed spatiotemporal resolution; detailed location information, including latitude and longitude; large coverage, covering most of population within a study area regardless of whether a smart phone is used or not; and precise category information, categorized into commercial communication phone calls and non-commercial communication phone calls based on the location information [32]. The phone call record data from Guangzhou and Shenzhen are used to measure the virtual urban linkages between the above two selected cities and other cities.
Thus, the scientific question of this study is whether there are various virtual urban linkages existing among different cities. To answer this question, a framework is developed to measure virtual urban linkages using spatiotemporal phone call data. And the potential driving forces are examined. This study provides new insights into urban connections and the application of big data in urban-related studies.

2. Study Area

This study selects Guangzhou (22°26′–23°56′ N, 112°57′–114°03′ E) and Shenzhen (22°27′–22°52′ N, 113°46′–114°37′ E) as the research areas (Figure 1). As co-provincial cities in Guangdong Province, both are located in the core region of the Guangdong–Hong Kong–Macao Greater Bay Area. The two cities demonstrate remarkable regional significance and unique developmental characteristics: at the regional level, they form the “dual-core” spatial structure of the Greater Bay Area, jointly driving regional coordinated development; and at the national level, Guangzhou serves as a national central city and comprehensive gateway hub, while Shenzhen functions as a national economic center and sci-tech innovation hub, both ranking among China’s first-tier cities.
Existing studies have paid limited attention to the differences in urban connectivity. Given their geographical proximity, distinct economic linkages with other cities, and functional complementarity—where Guangzhou emphasizes commerce while Shenzhen specializes in technological innovation—this study quantifies and compares the economic connections between Guangzhou/Shenzhen and other Chinese cities. Notably, their connections exclude certain regions like Hainan and Taiwan provinces, primarily due to diversified transportation modes or customs requirements that alter the impact of distance on connectivity intentions compared to other cities (see Section 3.2.1).

3. Materials and Methods

3.1. Call Detail Records

The CDR data are sourced from China Unicom (China United Network Communications Group Co., Ltd, Beijing, China). It records users’ incoming and outgoing calls. Based on the registered information of phone users, call origination locations, and call reception locations, the data can be categorized into types, such as business calls and residential daily calls. This study selects business call data. Commercial activities are an important manifestation of intercity connections—the stronger the commercial activity linkages, the stronger the intercity connections. Meanwhile, other virtual activities that can characterize commercial behavior, such as WeChat communications, are not easily recorded. Therefore, this study chooses business calls as the primary data for analysis. The processing of this data mainly includes the collection of call detail records, cleaning (removing invalid calls and calls with inaccurate locations), spatial coordinate conversion, and quantitative statistics. The time period covers 7 August 2023 to 13 August 2023, and the study will be divided into weekdays and weekends to quantify urban linkages [33].

3.2. Method

3.2.1. Modified Gravity Model

This study employs two methodological approaches to quantify economic linkages: weighted degree centrality and a modified gravity model. Following established practices in urban network research, degree centrality is adopted to characterize intercity connections [34,35], with its computational formula expressed as follows:
C t o t a l ( i j ) = C i n ( i j ) + C o u t ( i j )
where C t o t a l ( i j ) represents the linkages value between city i and city j , with C i n ( i j ) and C o u t ( i j ) denoting the incoming and outgoing call detail records from city i to city j , respectively. The study will quantify urban linkage under two distinct temporal scenarios: weekdays and weekends.
Furthermore, we have incorporated distance effects into our analysis. Previous studies have used the gravity model to evaluate city linkages [27,36]. In our study, we developed a modified gravity model to integrate with the call record data. Two circumstances were considered. Over long distances, business communications tend to use the telephone. When close, business communication tends to be in person rather than by phone. The gravity model was modified as follows:
R i j = C i j i C i j o 1 e D i j
where R i j reflects the linkage between city i and city j . The larger the value, the closer the linkage between cities. D i j is the relative distance between city i and city j , C i j i refers to the average daily number of incoming calls from city i to city j , and C i j o refers to the average daily number of outgoing calls from city i to city j .
In Equation (2), the D i j is calculated as follows:
D i j = d i j m a x ( d i 1 , d i 2 , , d i j , , d i n )
where D i j represents the relative distance between city i and city j , and d i j in is the relative distance between city i and city n . n is the number of cities.

3.2.2. Geodector Method

The geodetector method is a quantitative technique that determines whether the spatial distribution of geological statistical variables is similar to the spatial distribution of independent variables identified as significant explanatory factors [37,38,39]. Its key idea is based on the assumption that if X has an important influence on Y, then the spatial distribution of X and Y should be similar. The main advantage of this method is that it does not impose any preset constraints, making it versatile and effectively overcoming the limitations of traditional statistical analysis methods when dealing with categorical variables. The model has been applied in various research fields, such as natural sciences, social sciences, urban studies, and human health [38,39,40,41].
This paper mainly uses the factor detector and interaction detector of geodetector to explore influencing factors and their interaction with the urban linkages of Guangzhou and Shenzhen to other cities in China. The factor detector uses the q value to quantify the influence of factors, which is given as
q = 1 h = 1 L N h δ h 2 N δ 2 = 1 S S W S S T
where N is the number of samples, N h represents the number of sub-regions, δ 2 and δ h 2 are the variances of layer h and whole-region Y values, respectively, and q is the dominant factor of linkages. The q value range is [0, 1], which indicates the degree of the spatially stratified heterogeneity of linkages, that is, to what degree linkages can be explained by influencing factors.
Compared to the general identification method of interactions, interactive detectors can detect relationships beyond the multiplicative interactions between two factors. Interactive detectors are mainly used to identify the explanatory power of different factors X 1 and X 2 when they act together on Y. If q( X 1 X 2 ) > Max(q( X 1 ), q ( X 2 )), then the interactions between X 1 and X 2 increase their influences on Y. Conversely, if q( X 1 X 2 ) < Max(q( X 1 ), q ( X 2 )), then the influence of X 1 and X 2 on Y is diminished by the interactions between X 1 and X 2 .

3.2.3. Local Moran’s I

Local Moran’s I can identify both contrasting and similar local spatial patterns and has been widely used in geographical studies [42,43]. In this study, we employ local Moran’s I to characterize the spatial autocorrelation features of connection strength between individual cities and Guangzhou/Shenzhen. The calculation formula is as follows:
I i = ( x i x ¯ ) S 2 j = 1 n w i j ( x j x ¯ )
where I i is the local Moran’s I index for city i ; x i and x j are the link values between cities i and j , respectively; x ¯ is the mean linkage value across all cities; w i j is the spatial weight matrix element; S 2 represents the sample variance of linkage values, and n is the total number of cities. It is worth noting that cities within Guangdong Province were excluded, considering that there would be additional exchanges in the same province.

4. Results

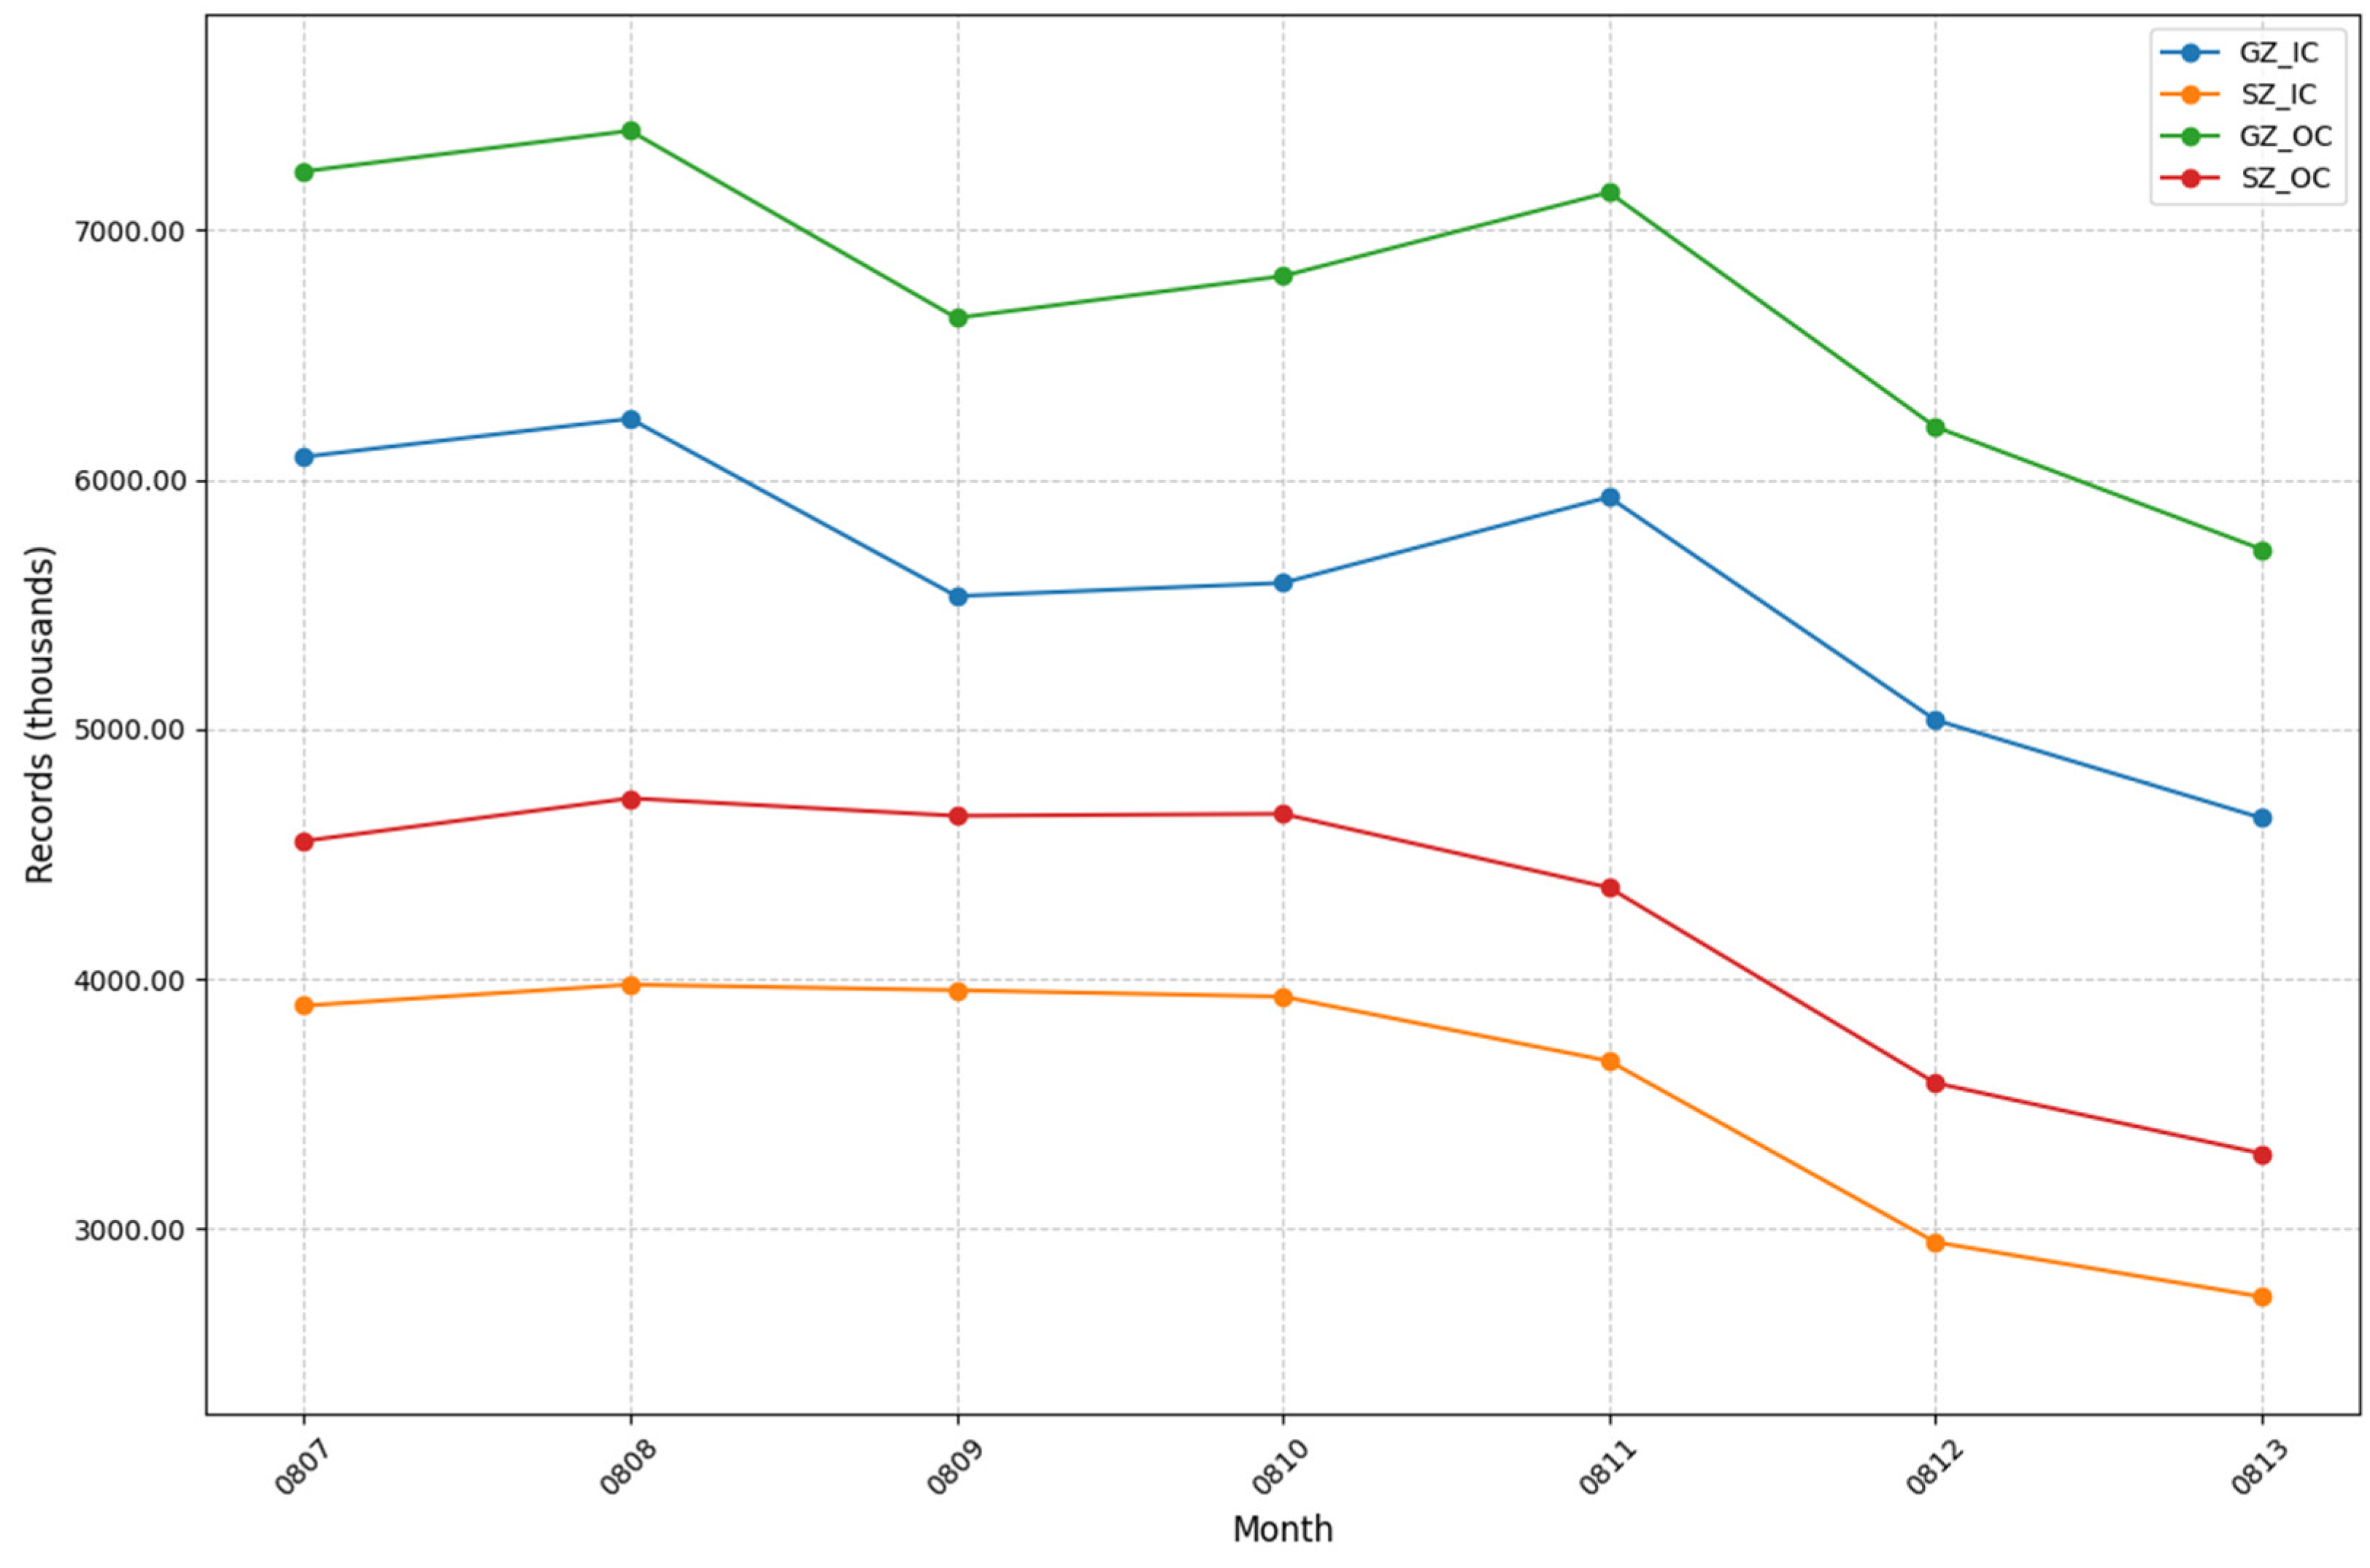
4.1. Quantitative Analysis of Call Records

Figure 2 shows the incoming and outgoing call frequencies of Guangzhou and Shenzhen to other cities on weekdays and weekends. Both cities have a higher call frequency with other cites on weekdays compared to weekends, indicating that the majority of calls are work-related. In addition, phone calls are more frequent in Guangzhou.
Eight scenarios are detected based on call frequency in Figure 3, highlighting that the gap between Guangzhou and Shenzhen is more pronounced in nearby cities. Beijing holds a dominant position, with eight scenarios having the highest value (call frequency greater than 25,000), followed by Shanghai (seven scenarios) and Chongqing (six scenarios).
In general, the CDR align with the unbalanced characteristics of resource distribution of the Hu Line, but there are a few differences to highlight. The frequency of calls between Guangzhou/Shenzhen and other cities varies significantly by region. South China and central China have higher call frequencies. There are fewer calls in the northwest, while the southwest area exhibits higher frequencies in the east and lower frequencies in the west, with an outward radiation trend from Chongqing. High frequencies in east China are mainly concentrated in coastal cities. Most cities in north China show low frequencies, while Beijing exhibits high frequencies and spreads to the sea. Northeast China has moderate frequencies.
Notably, apart from nearby cities, cities with higher call frequencies are often first-tier cities, and their surrounding cities also experience higher call volumes. This aligns with the spillover effect of urban agglomerations, showing that central cities play a significant role in providing services to surrounding areas during urban cluster development in China.

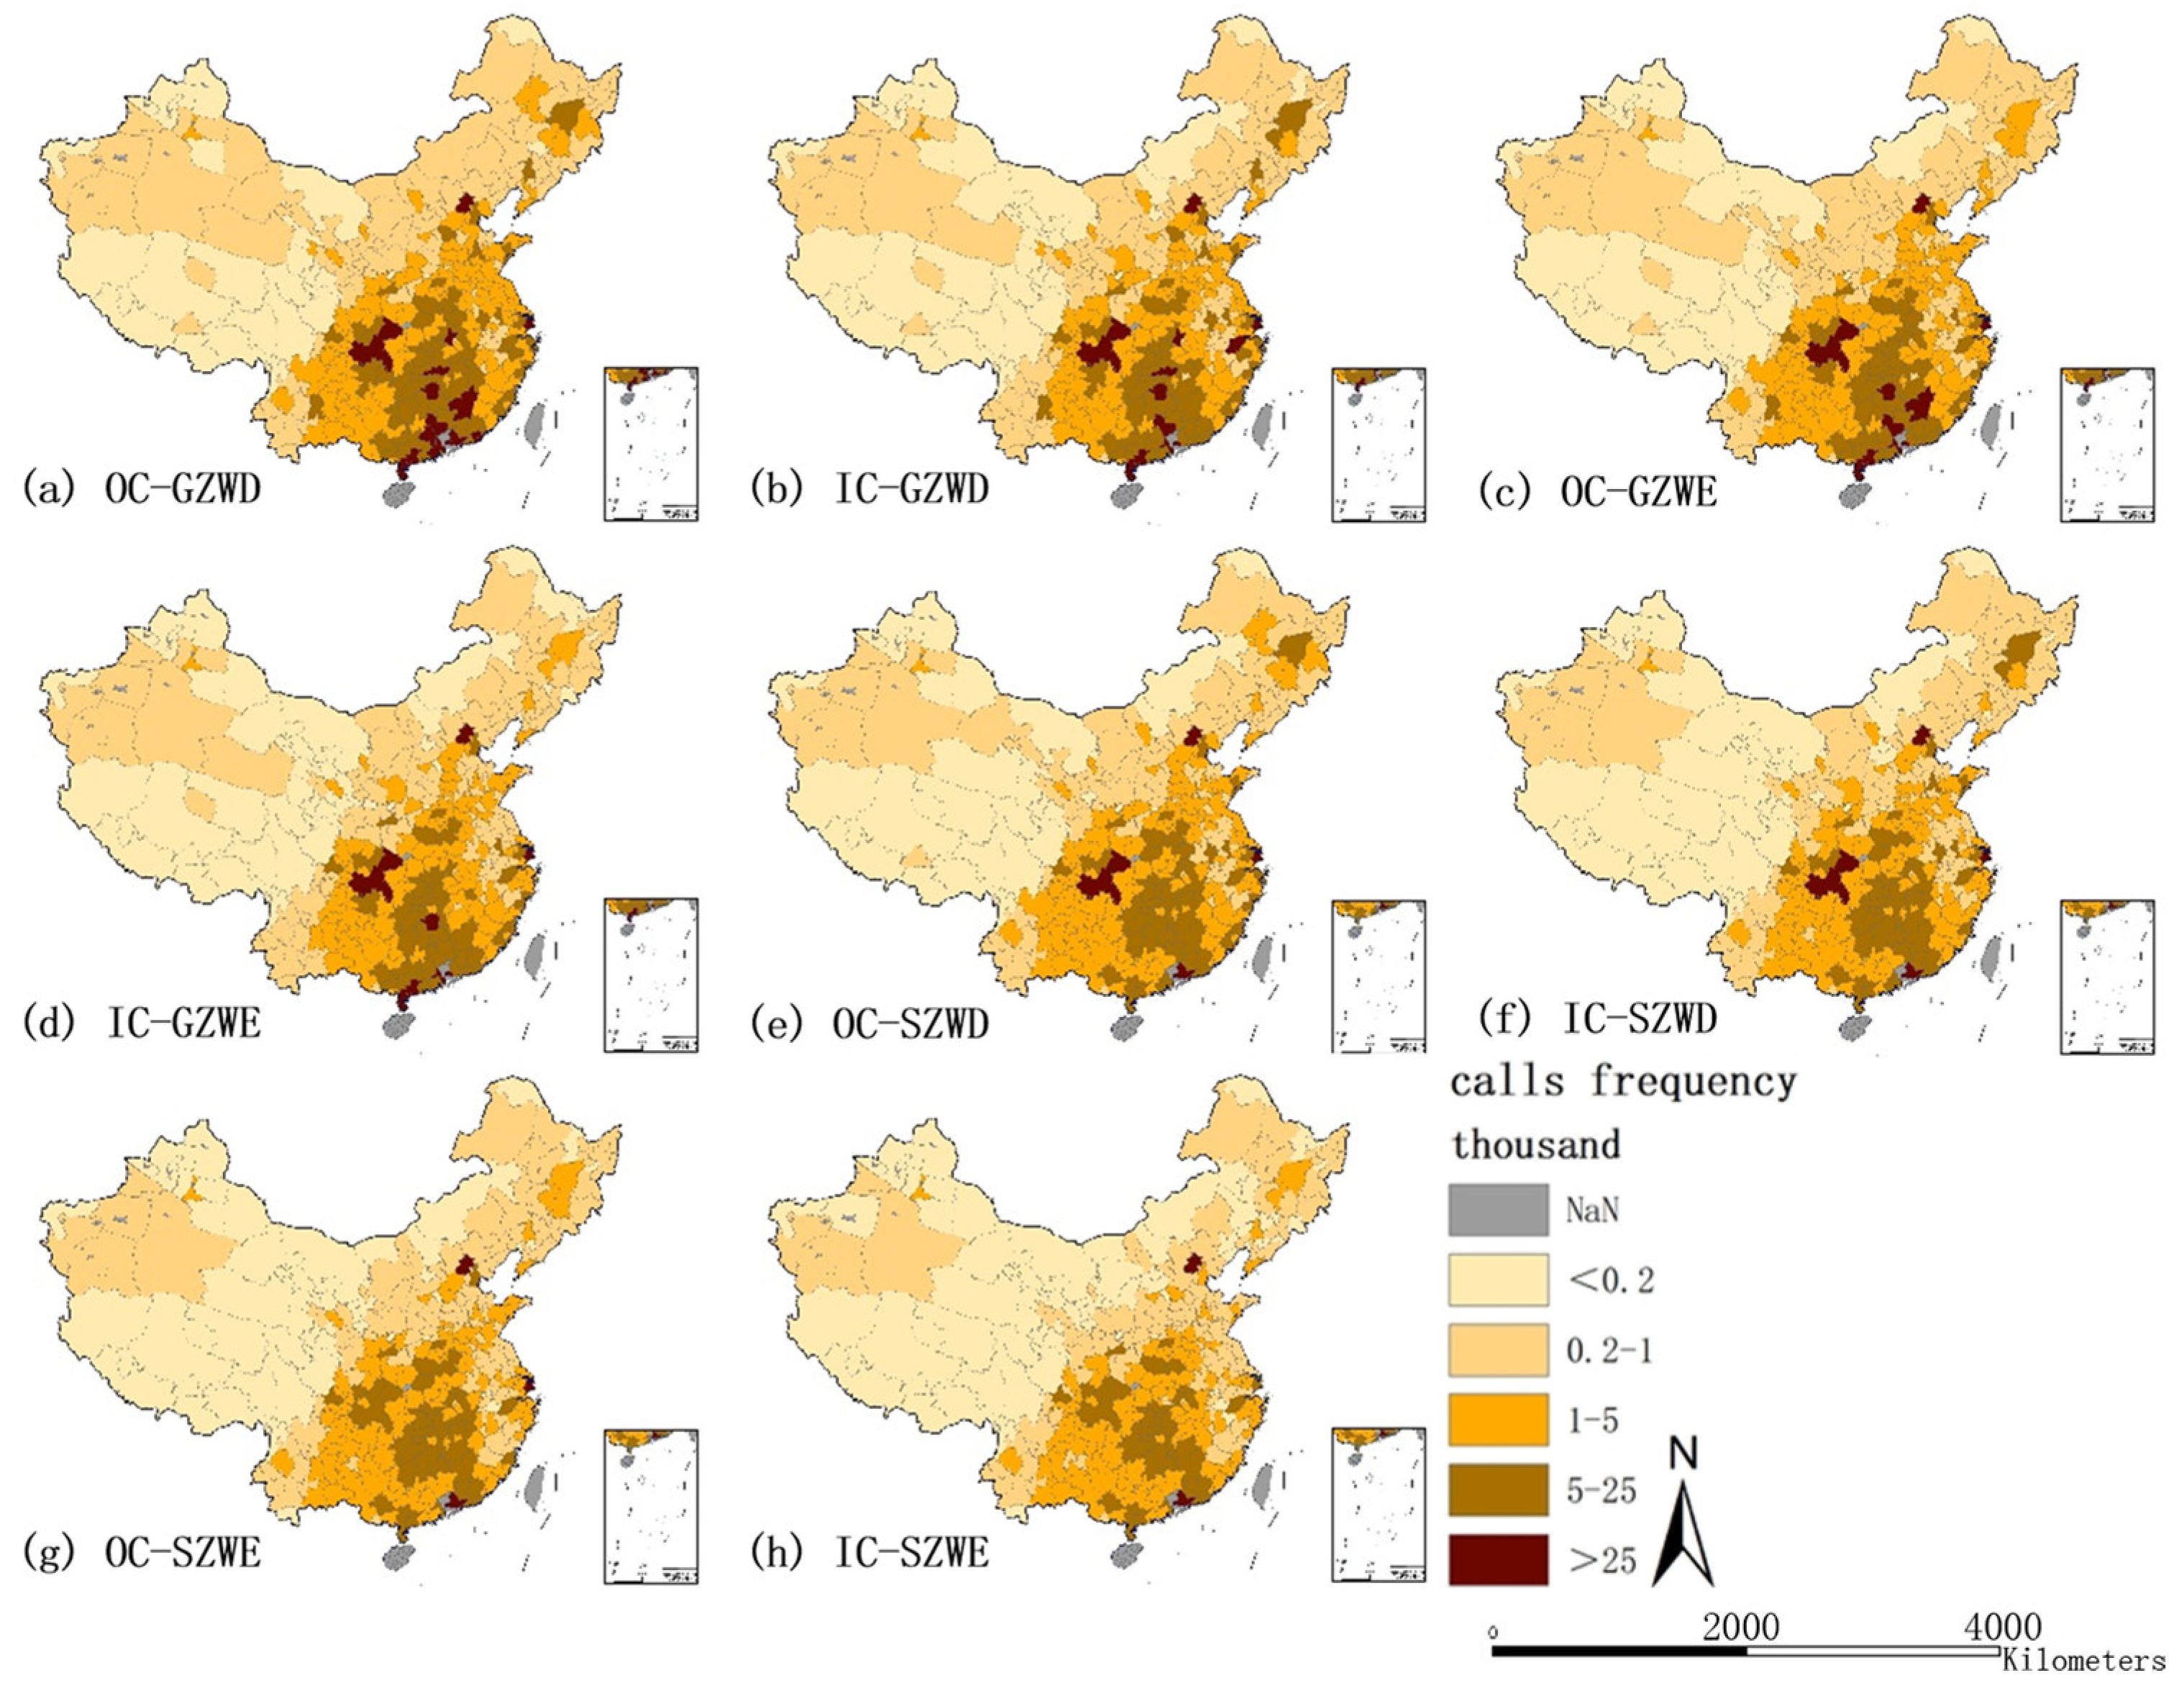
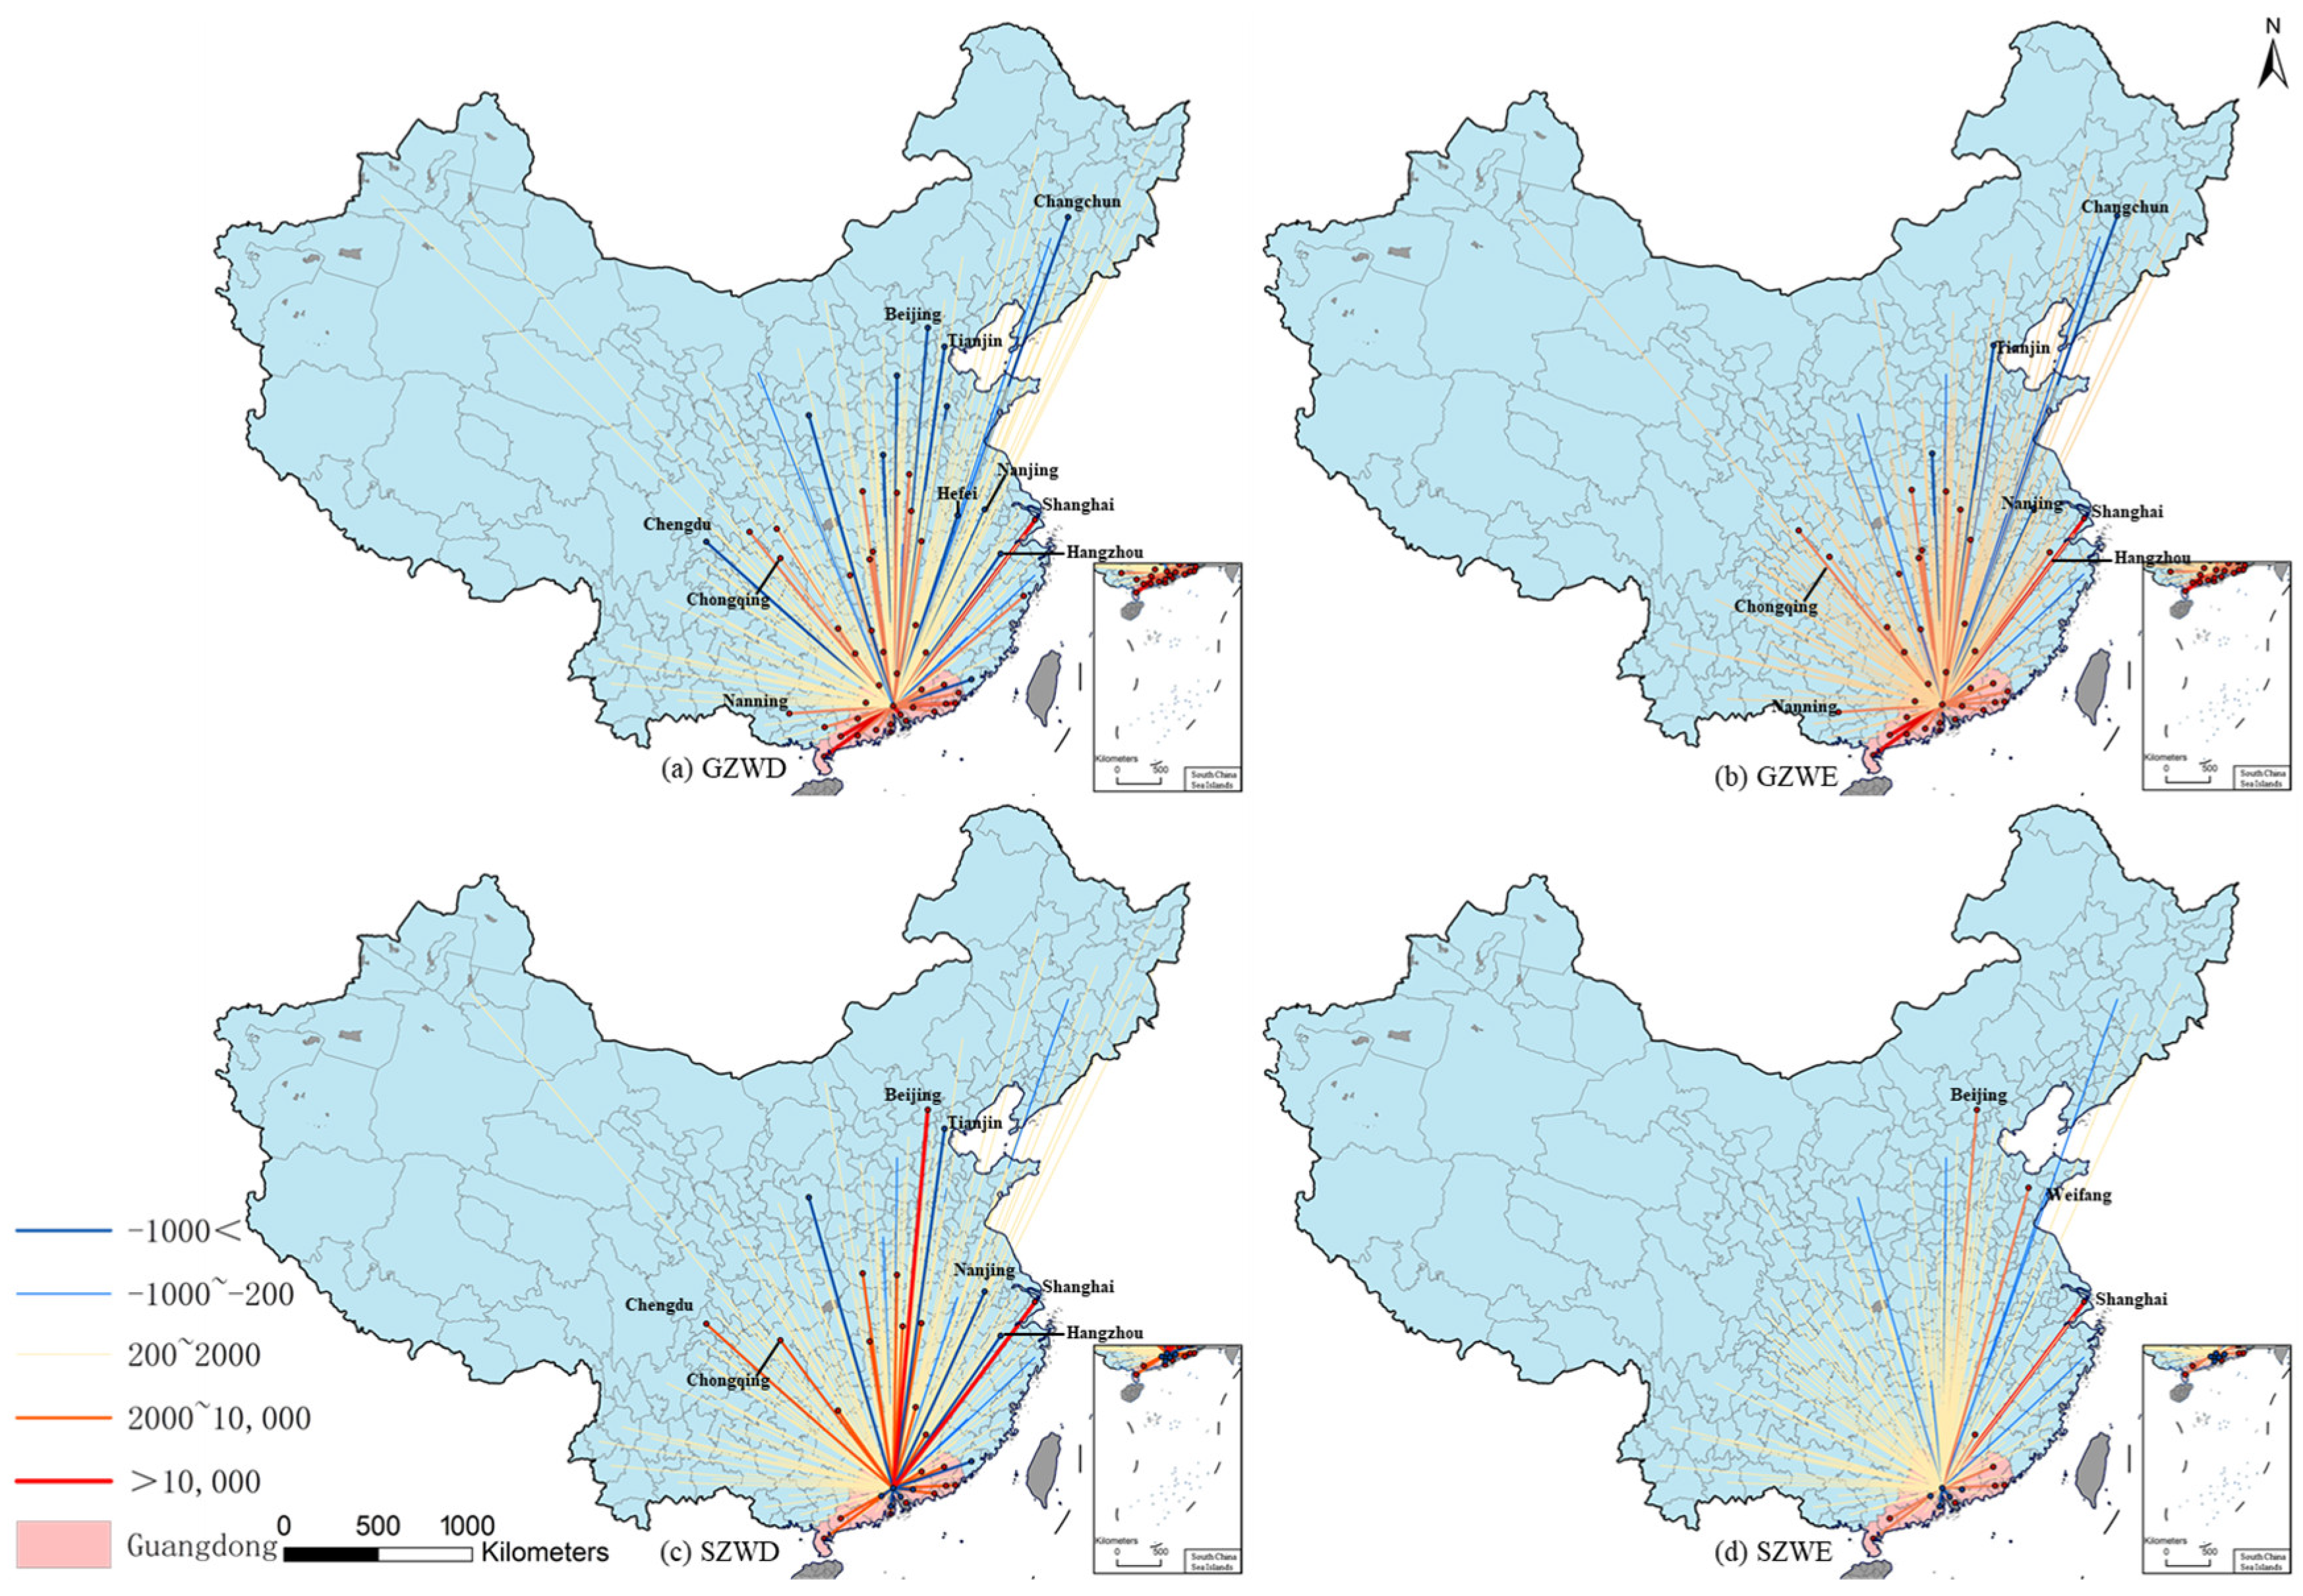
4.2. Flow Characteristics of Call Records

Call data record flow (CDRF) information is obtained by subtraction of outgoing calls and incoming calls. Figure 4 shows that Guangzhou and Shenzhen exhibit clear outflow benefits, with differences in performance on weekends and weekdays. The CDRF in Guangzhou is stronger than that in Shenzhen, which is more obvious in Guangdong Province, especially in Dongguan City, Huizhou City, and Zhongshan City. Guangzhou’s flow to these cities is more than 1000, while Shenzhen’s is negative. It is worth noting that Guangzhou has a negative flow to Beijing, while Shenzhen’s is greater than 1000. We also compared the CDRF between working days and weekends: the negative CDRF is more significant on weekdays for Shenzhen and Guangzhou, while the positive CRDF shows no significant difference for Guangzhou between weekdays and weekends. For Shenzhen, the ability to link with other cities is much stronger on weekdays than weekends.

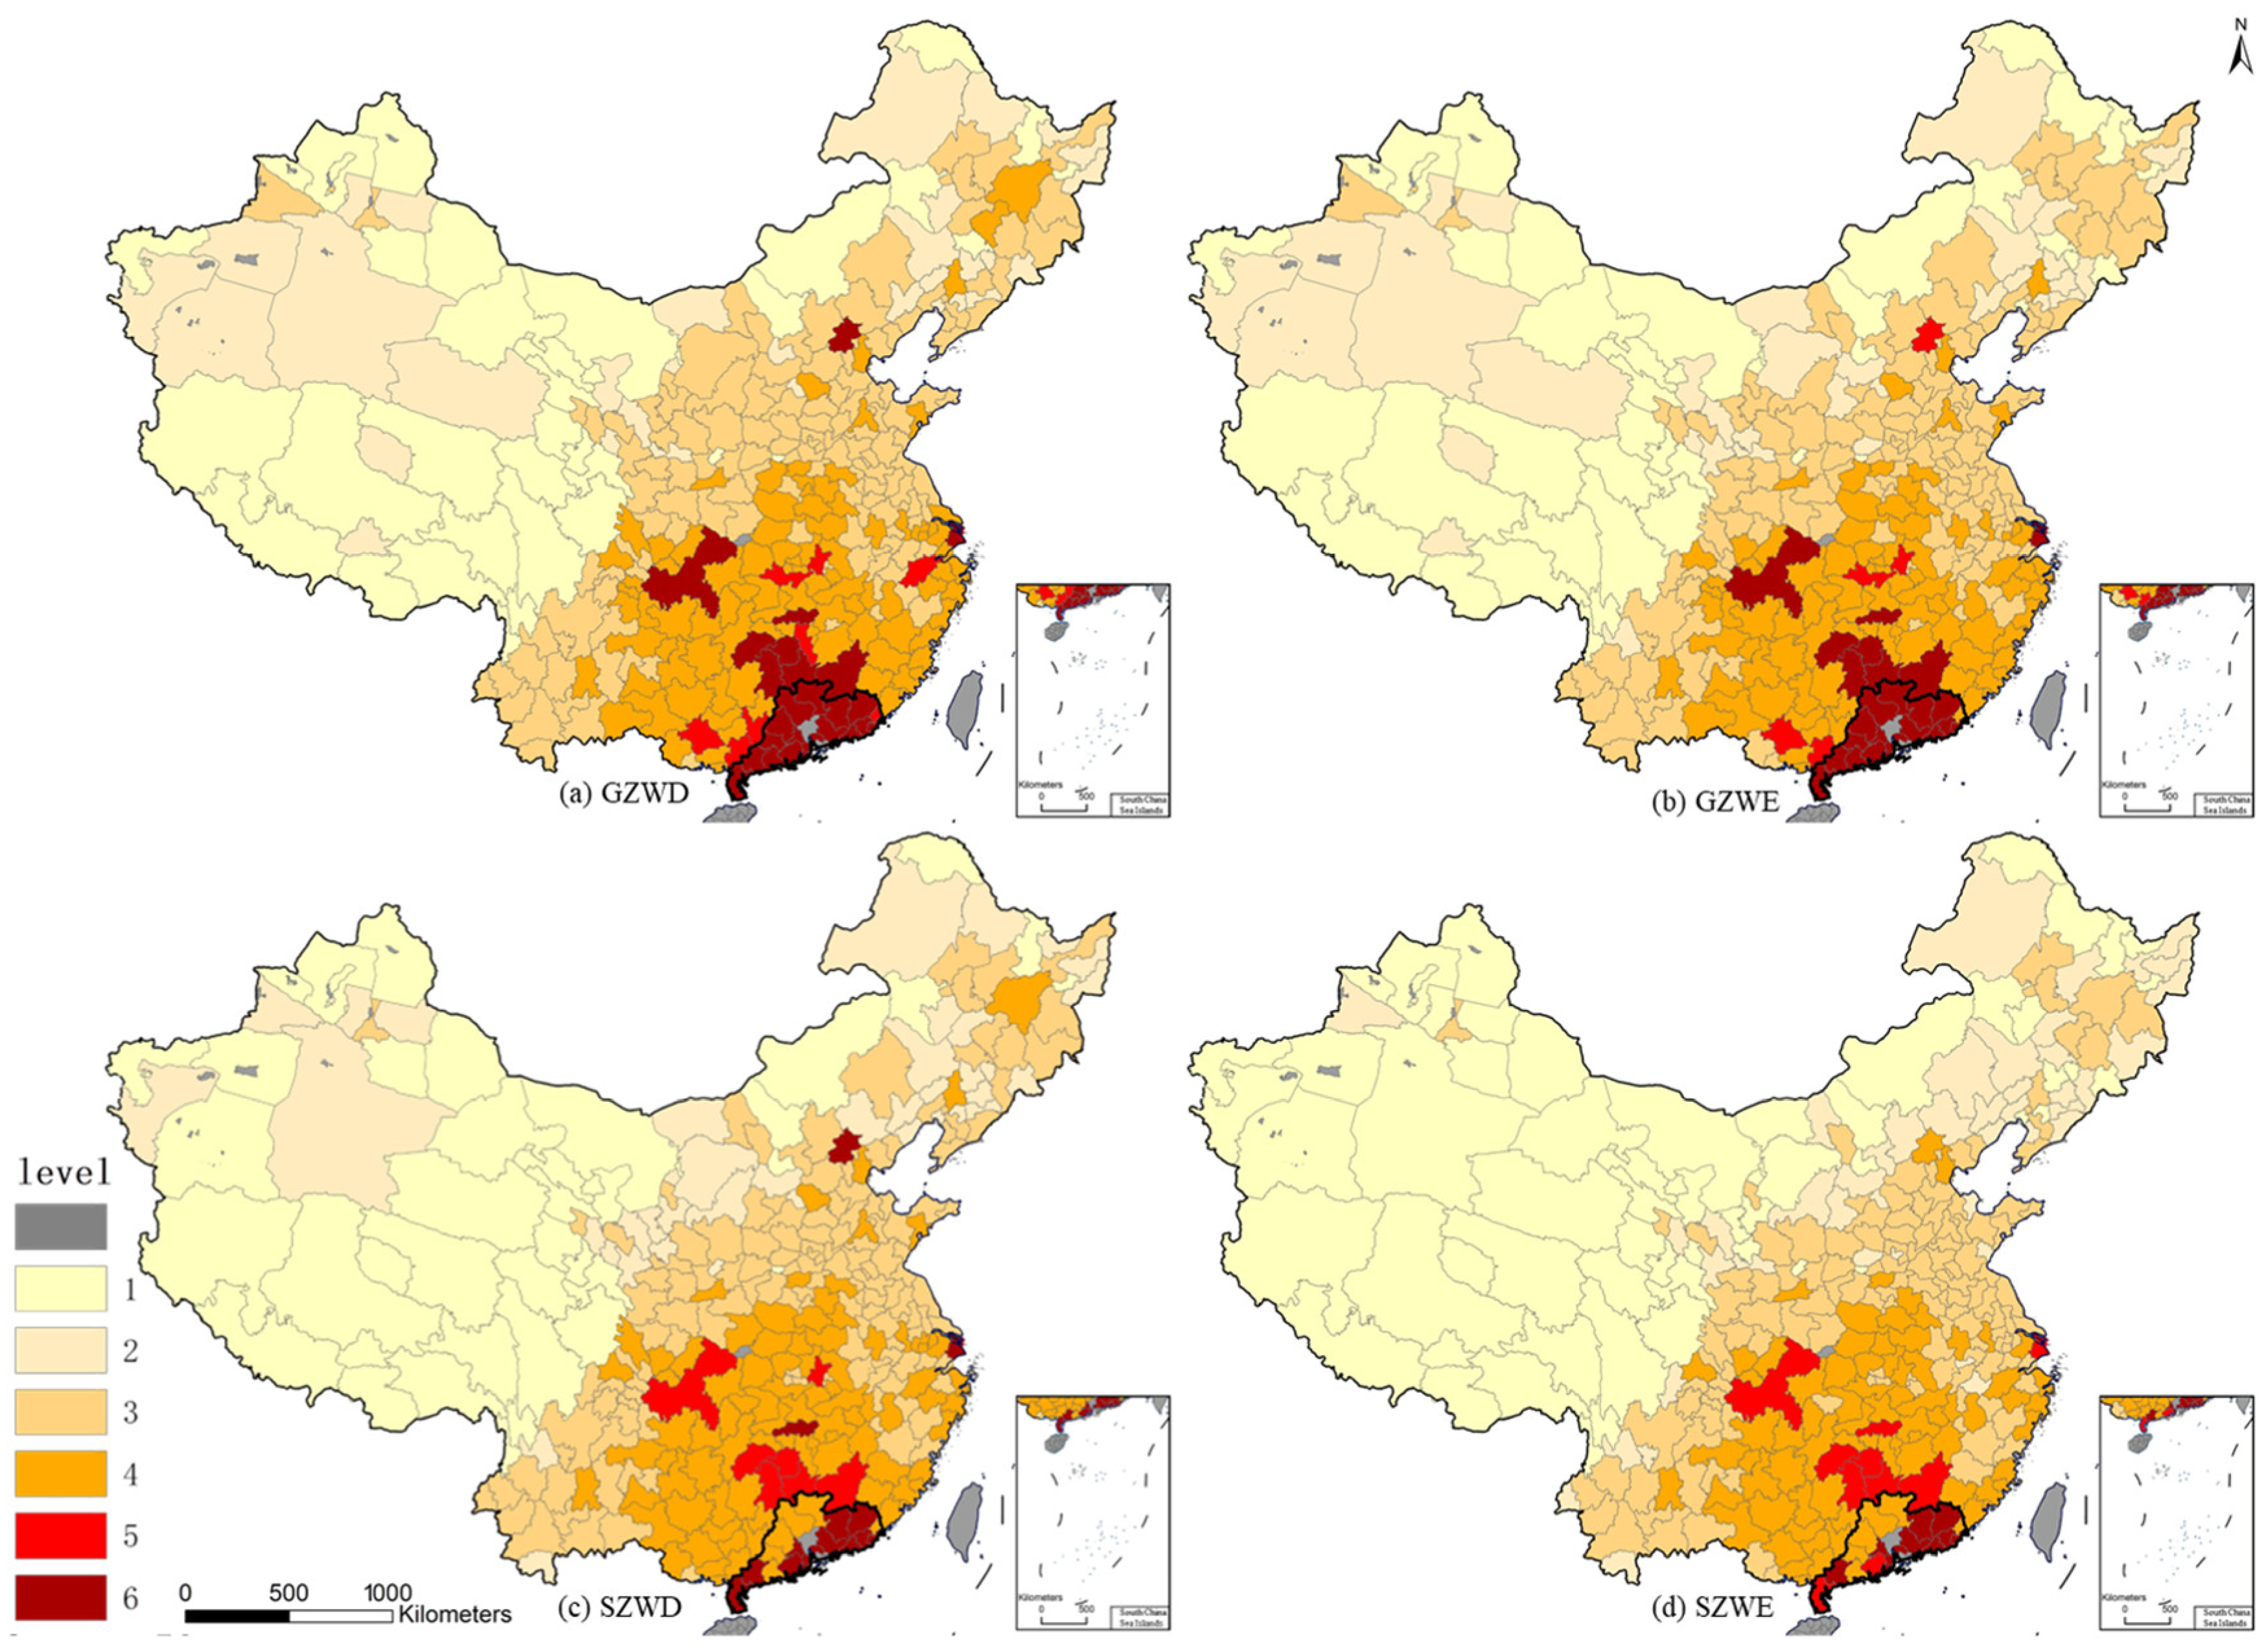
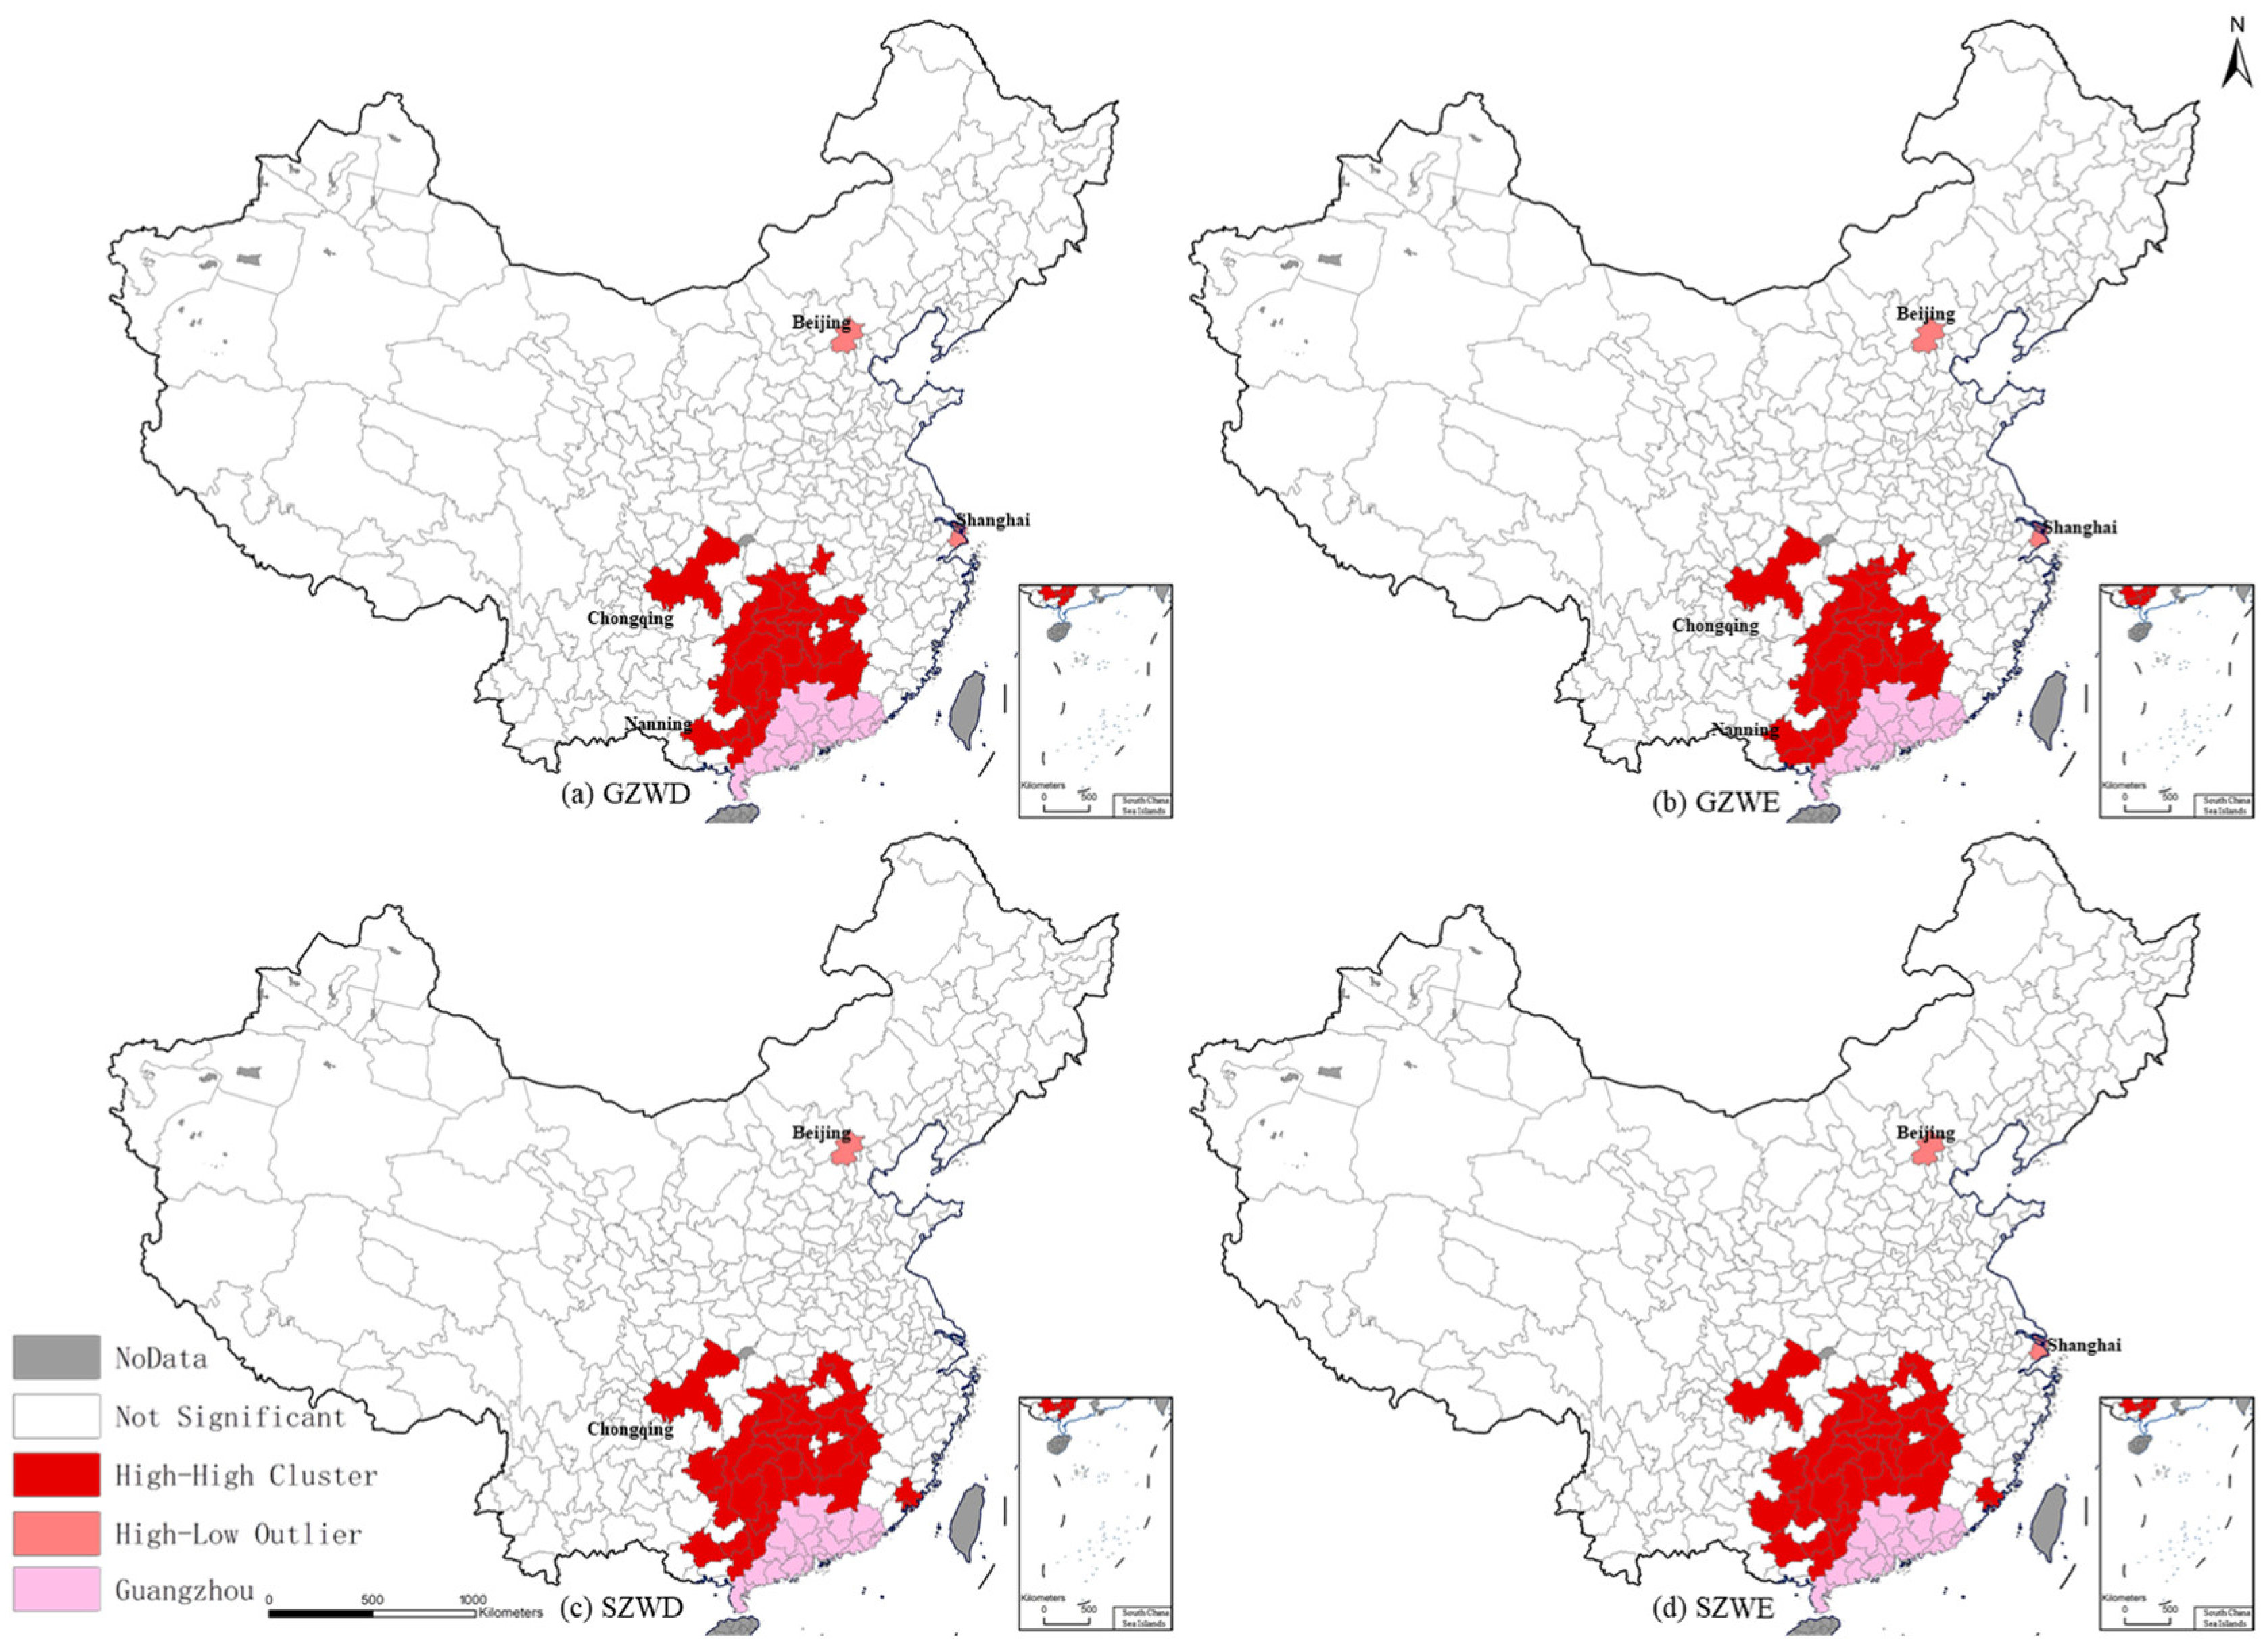
4.3. Urban Linkage Characteristics

Figure 5 presents the urban linkage results based on weighted degree centrality. The analysis reveals two distinct categories of cities maintaining strong linkages with Guangzhou and Shenzhen: cities in adjacent provinces and major metropolitan areas including Beijing, Shanghai, and Chengdu. Guangzhou consistently demonstrates higher connectivity values than Shenzhen, a pattern observed both within Guangdong Province and other provinces, primarily involving inland cities. Notably, western cities in Guangdong Province that are geographically closer to Guangzhou show remarkably weak linkages with Shenzhen. Additionally, linkage values during weekdays are significantly higher than those during weekends.
Figure 6 and Figure 7, respectively, present urban linkage patterns derived from the modified gravity model and their corresponding clustering results. Both Guangzhou and Shenzhen have stronger linkages with other cities on weekdays compared to weekends, with the majority of linkages (levels greater than 4) concentrated in nearby cities such as those in Guangdong Province, Guangxi Province, Hunan Province, and Jiangxi Province, as well as key cities like Chongqing and Shanghai.
In the comparison between Guangzhou and Shenzhen, Guangzhou shows more linkages with other cities. In central China, south China, and east China, Guangzhou generally has stronger connections than Shenzhen, especially with cities in Shanghai, many cities in Hunan Province, most areas in Guangdong Province, and the western part of Guangdong Province. In contrast, cities in eastern Guangdong such as Shanwei and Huizhou are more closely connected to Shenzhen than Guangzhou. Most cities in northeast China, north China, northwest China, and southwest China have stronger linkages with Guangzhou, while a few have stronger connections with Shenzhen. Notably, on weekdays, Beijing has stronger ties with Shenzhen, at 177,329, than with Guangzhou, at 164,379, but on weekends, it has closer ties with Guangzhou.

4.4. Potential Driving Force Detecting

We collated statistical yearbook data (https://www.stats.gov.cn/sj/ndsj/, accessed on 6 May 2025). Ten driving factors were selected based on whether they are human activity-related or business behavior-related. From the three perspectives of population, economy, and trade (Table 1), we analyzed effects on linkages under four scenarios: Guangzhou working day (GZWD), Guangzhou weekend (GZWE), Shenzhen working day (SZWD), and Shenzhen weekend (SZWE), by means of geodetector.
Table 2 shows the results of single-factor detection, with p-values less than 0.1, except for the GDP of the primary and tertiary industries, indicating that these factors significantly influence the spatial distribution of connections. The p-values are lower on weekdays than on weekends. It is worth noting that the p-value of X1 is higher for Shenzhen, while the p-value of X3 is higher for Guangzhou. The q-value indicates the driving force of the factors to city linkages. Overall, q-values are higher on weekdays than on weekends, with a more significant difference in Guangzhou. The driving factors with the highest q-values are the import value of goods (X6) > export value of goods (X7) > number of industrial enterprises (X8) > number of domestic enterprises (X9) > tertiary industry GDP (X5) > GDP (X2), indicating that these factors have the greatest impact on city linkages. A noteworthy finding is that the import and export values of goods have greater explanatory power for Shenzhen’ s city linkages, which reflects that Shenzhen, as an important special economic zone in China and a significant trade center globally, has a larger scale and influence on foreign trade activities compared to Guangzhou. In contrast, the number of industrial enterprises and domestic enterprises is more significant for Guangzhou, indicating that Guangzhou has a greater advantage in industrial production and the development of domestic enterprises. This phenomenon may reflect differences in the economic development models and urban functions of Guangzhou and Shenzhen, as well as their distinct roles in the Guangdong–Hong Kong–Macao Greater Bay Area and the broader economic network.
Figure 8 illustrates that the interaction between the dual factors enhances the explanatory power of city linkages and the effect observed in Shenzhen compared to Guangzhou. Except for the interaction between GDP (X2), the value of goods imported (X6), the value of goods exported (X7), the number of domestic-funded enterprises (X8), and other contributing factors that enhance the interaction, all other factors show nonlinear enhancement. The number of industrial enterprises plays a dominant role in explaining city linkages in Guangzhou, while the value of goods imported and exported plays a dominant role in explaining city linkages in Shenzhen. The interaction with the greatest explanatory power in Guangzhou is tertiary industry GDP (X5) ∩ number of industrial enterprises (X8), with a q-value of 0.95 and 0.94 on weekdays and weekends, respectively. In Shenzhen, the interactions with the highest explanatory power are GDP (X2) ∩ export value of goods (X7) and tertiary industry GDP (X5) ∩ export value of goods (X7), both with q-values of 0.97. It is worth noting that although the explanatory power of population and primary industry GDP is relatively small, their combination significantly enhances explanatory power, especially for Shenzhen’s cities linkages.

5. Discussion

Studying urban linkages can help explain urban relationships, guide resource allocation, and promote regional coordination. Previous studies have concentrated on physical linkages, such as traffic flow and population flow, while virtual linkages have often been easily overlooked. Therefore, we proposed a city linkage assessment method based on an improved gravity model with CDR data. We assessed linkages between cities and uncovered driving forces. The discussion of the main results is as follows.
We found that urban connections exhibit geographical differences, which can be divided into two regions: southeast China and northwest China, with a boundary similar to the Hu Line [44]. Significant linkages are concentrated in the southeast of China (Figure 9), with an average of 201,066, whereas the linkages in the northwest of China number 1852. Similar results were obtained in the Huang et al. [45], Qi et al. [46], and Zhao et al. [47] investigations. They showed that eastern cities play an important role in China’s urban network, and cities with high connectivity values are typically developed cities.
Three major reasons may explain this phenomenon. First, regional disparities in development have led to significant polarization, with large cities and provincial capitals attracting population inflows while smaller cities experience population loss [48], and the siphoning effect, in which resource and population aggregation leads to higher urban connectivity in large cities. Furthermore, Guangzhou and Shenzhen tend to connect with large cities, a finding further supported by the research of Andersson et al. [49] and Feng et al. [50]. They found that urban networks are highly controlled by a few centers, with provincial capitals playing a dominant role in urban networks. In addition, some cities may benefit from their proximity to large cities, reflecting the diffusion effect of central cities [51].
The linkages in Guangzhou are significantly greater than those in Shenzhen (Figure 9), despite Shenzhen’s rapid development in recent years. We believe this is due to three main factors. First, Guangzhou has a long history and rich commercial traditions, having established a relatively complete commercial network over time [52]. Second, Guangzhou, as a provincial capital, has significant advantages in policymaking and resource allocation, offering more political opportunities for business connections. Li et al. found that cities in the province are more connected to Guangzhou than to Shenzhen [53]. Third, Shenzhen has a unique development model [54], which focuses more on overseas cities. Wang et al. [55] found that Shenzhen–Hong Kong collaborations, especially in business and innovation, surpass those between Guangzhou and Hong Kong. Moreover, the results indicate that import and export values of goods explain Shenzhen’s urban connections more significantly in the geographic detector analysis. This further illustrates that Shenzhen, as a major special economic zone and global trade center, surpasses Guangzhou in terms of the scale and influence of its foreign trade activities [53].
The four factors that best explained the linkage were the import and export values of goods, the number of industrial enterprises, and the number of domestic enterprises, but their performance was different in Guangzhou and Shenzhen. The explanatory power of interaction factors was enhanced, meaning that two factors combined could further explore the linkage. It is worth noting that the GDP of the tertiary sector did not have a strong direct effect on explaining urban linkages, but it achieved the highest explanatory power when interacting with other factors, such as number of industrial enterprises and export value of goods. A possible explanation is that the tertiary sector has a relatively minor direct influence on urban linkages but plays a key supportive and auxiliary role in the development of Guangzhou and Shenzhen, particularly by providing essential non-productive services to Guangzhou’s industrial enterprises and supporting Shenzhen’s export activities through international logistics, finance, and trade services [56]. Differences in service focus and industrial structure reflect the distinct economic development strategies and industrial positioning of the two cities. Understanding and analyzing these differences can provide more targeted recommendations for urban industrial policies and economic planning.
Compared with previous studies, we introduced CDR data, which are easier to obtain, have widespread user coverage, and allow for high temporal resolution in studying urban connections. Using CDR data, we studied city connections based on the improved gravity model while considering two scenarios. First, proximity may encourage more in-person interactions, reducing the likelihood of phone calls and suggesting that urban connections may be greater than reflected by CDR data. Second, the greater the distance, the more people may rely on phone calls, making CDR data more closely aligned with actual urban connections.
A potential limitation of this study is that the spatial scale was not further refined, focusing only on the city scale. A more granular analysis could help reveal internal urban linkages. Furthermore, the research does not fully capture the nonlinear relationship between distance and communication propensity, which also varies across different business service ranges. Moreover, firm call patterns serve multiple fields such as services, logistics, and commerce, which are not differentiated in this study. In the future, company types can be identified to explore the differences between different types and other cities. In addition, we only used a few days’ data for the study. Future work could incorporate multi-month data or compare pre- and post-pandemic data. In the driver analysis, covering more factors may discover new results, so more metrics can be included for mining.

6. Conclusions

This study quantitatively examined the economic linkages between Guangzhou and Shenzhen with other Chinese cities. Methodologically, we employed traditional weighted degree centrality and a modified gravity model to quantify urban linkages, supplemented by geographical detector analysis to identify driving factors. Compared with existing studies, our research focused on virtual connections while incorporating the inverse distance decay effect of communication propensity, with additional comparative analyses of regional variations. The main conclusions revealed the following: (1) urban connectivity in southeastern China is significantly stronger than in northwestern regions, with highly connected areas concentrated in Guangdong Province, adjacent inland cities, and major metropolitan areas; (2) weekday connections exceed weekend connections, and Guangzhou demonstrates more pronounced linkages than Shenzhen, particularly within Guangdong Province; and (3) the number of industrial and domestic enterprises shows greater significance for Guangzhou’s urban connections, whereas import and export values exhibit stronger explanatory power for Shenzhen’s intercity linkages. Notably, the tertiary sector performs well in the interaction detector analysis.

Author Contributions

Conceptualization, Z.C. and Z.W.; formal analysis, H.J.; data curation H.J. and H.S.; supervision, H.S. and Z.C.; writing—review editing, H.S., Z.C., Z.W., Q.Z. and Z.Z. All authors have read and agreed to the published version of the manuscript.

Funding

This study was supported by the National Natural Science Foundation of China [No. 42471490], Natural Science Foundation of Guangdong Province [No. 2023A1515011341], Guangzhou Basic Research Project [No. SL2022A04J01107], and Open Research Fund Program of MNR Key Laboratory for Geo-Environmental Monitoring of Great Bay [No. 2023007].

Data Availability Statement

The data are not publicly available due to privacy restrictions.

Acknowledgments

The authors thank the editor and anonymous reviewers for their helpful comments and suggestions.

Conflicts of Interest

The authors declare no conflicts of interest.

Abbreviations

The following abbreviations are used in this manuscript:
CDRsCall detail records
ICIncoming calls
OCOutcoming calls
GZWDGuangzhou weekdays
GZWEGuangzhou weekend
SZWDShenzhen weekdays
SZWEShenzhen weekend
CDRFCall data record flow

References

  1. Wang, Q.; Zhao, M. Research on the city network of Guangdong, Hongkong and Macao from the perspective of information flow: Analysis based on baidu index. J. Reg. City Plan. 2018, 29, 281–293. [Google Scholar] [CrossRef]
  2. Zhang, H.M.; Sun, T.S. Disentangling urban network externalities: The juxtaposition of central place theory and central flow theory. Reg. Stud. 2025, 59, 2461753. [Google Scholar] [CrossRef]
  3. Castells, M. Rise of the Network Society: The Information Age: Economy, Society and Culture; Wiley: Hoboken, NJ, USA, 1996. [Google Scholar]
  4. Alavi, S.A.; Esfandi, S.; Khavarian-Garmsir, A.R.; Tayebi, S.; Shamsipour, A.; Sharifi, A. Assessing the Connectivity of Urban Green Spaces for Enhanced Environmental Justice and Ecosystem Service Flow: A Study of Tehran Using Graph Theory and Least-Cost Analysis. Urban Sci. 2024, 8, 14. [Google Scholar] [CrossRef]
  5. Batten, D.F. Network cities: Creative urban agglomerations for the 21st century. Urban Stud. 1995, 32, 313–327. [Google Scholar] [CrossRef]
  6. Zhen, F.; Qin, X.; Ye, X.; Sun, H.; Luosang, Z. Analyzing urban development patterns based on the flow analysis method. Cities 2019, 86, 178–197. [Google Scholar] [CrossRef]
  7. Lüthi, S.; Thierstein, A.; Hoyler, M. The world city network: Evaluating top-down versus bottom-up approaches. Cities 2018, 72, 287–294. [Google Scholar] [CrossRef]
  8. Sainan, L.; Huilin, D.; Xinyu, P.; Shudi, C.; Yu, W. Pattern and Influencing Factors of Urban Spatial Connection in Wuhan Metropolitan Area from the Perspective of Flow Space. Econ. Geogr. 2024, 44, 81–89. [Google Scholar]
  9. Freeman, L.C. Centrality in social networks conceptual clarification. Soc. Netw. 1978, 1, 215–239. [Google Scholar] [CrossRef]
  10. Beaverstock, J.V.; Smith, R.G.; Taylor, P.J.; Walker, D.R.; Lorimer, H. Globalization and world cities: Some measurement methodologies. Appl. Geogr. 2000, 20, 43–63. [Google Scholar] [CrossRef]
  11. Beaverstock, J.V.; Smith, R.G.; Taylor, P.J. World-city network: A new metageography? Ann. Assoc. Am. Geogr. 2000, 90, 123–134. [Google Scholar] [CrossRef]
  12. Christaller, W. Central Places in Southern Germany; Prentice-Hall: Englewood Cliffs, NJ, USA, 1966. [Google Scholar]
  13. TAYLOR, P. Urban hinterworlds: Geographies of corporate service provision under conditions of contemporary globalisation. Geography 2001, 86, 51–60. [Google Scholar] [CrossRef]
  14. Castells, M. Globalisation, Networking, Urbanisation: Reflections on the Spatial Dynamics of the Information Age. Urban Stud. 2010, 47, 2737–2745. [Google Scholar] [CrossRef]
  15. Henderson, J.; Dicken, P.; Hess, M.; Coe, N.; Yeung, H.W.C. Global production networks and the analysis of economic development. Rev. Int. Political Econ. 2002, 9, 436–464. [Google Scholar] [CrossRef]
  16. Pan, J.; Lai, J. Spatial pattern of population mobility among cities in China: Case study of the National Day plus Mid-Autumn Festival based on Tencent migration data. Cities 2019, 94, 55–69. [Google Scholar] [CrossRef]
  17. Wang, X.; Pei, T.; Song, C.; Chen, J.; Shu, H.; Chen, X.; Wu, M. A new flow-based centrality method for identifying statistically significant centers. Sustain. Cities Soc. 2023, 99, 104984. [Google Scholar] [CrossRef]
  18. Ghanbari, M.; Karimi, M.; Claramunt, C.; Lagesse, C. Enhancing Urban Transportation Flow Modeling Through a Graph Neural Network-based Spatially Weighted Interaction Model: A Case Study of Chicago Taxi Data. J. Geovisualiz. Spat. Anal. 2025, 9, 15. [Google Scholar] [CrossRef]
  19. Li, C.; Lin, S.; Wang, Y.; Chen, L. Evaluation of regional integration in urban agglomeration area from the perspective of urban symbiosis. Sustain. Cities Soc. 2024, 105, 105338. [Google Scholar] [CrossRef]
  20. Chong, Z.; Pan, S. Understanding the structure and determinants of city network through intra-firm service relationships: The case of Guangdong-Hong Kong-Macao Greater Bay Area. Cities 2020, 103, 102738. [Google Scholar] [CrossRef]
  21. Taylor, P.J.; Derudder, B.; Faulconbridge, J.; Hoyler, M.; Ni, P.F. Advanced Producer Service Firms as Strategic Networks, Global Cities as Strategic Places. Econ. Geogr. 2014, 90, 267–291. [Google Scholar] [CrossRef]
  22. Xu, D.; Shen, W. Evolution Characteristics and Influencing Factors of City Networks in China: A Case Study of Cross-Regional Automobile Enterprises. ISPRS Int. J. Geo-Inf. 2024, 13, 145. [Google Scholar] [CrossRef]
  23. BRUNN, S.D.; DODGE, M. Mapping the “Worlds” of the World Wide Web: (Re)Structuring Global Commerce through Hyperlinks. Am. Behav. Sci. 2001, 44, 1717–1739. [Google Scholar] [CrossRef]
  24. Hu, X.; Wang, C.; Wu, J.; Stanley, H.E. Understanding interurban networks from a multiplexity perspective. Cities 2020, 99, 102625. [Google Scholar] [CrossRef]
  25. De Goei, B.; Burger, M.; Van Oort, F.; Kitson, M. Functional polycentrism and urban network development in the Greater South East, United Kingdom: Evidence from commuting patterns, 1981–2001. Reg. Stud. 2010, 44, 1149–1170. [Google Scholar] [CrossRef]
  26. Van Oort, F.; Burger, M.; Raspe, O. On the economic foundation of the urban network paradigm: Spatial integration, functional integration and economic complementarities within the Dutch Randstad. Urban Stud. 2010, 47, 725–748. [Google Scholar] [CrossRef]
  27. Gu, X.; Tang, X.; Chen, T.; Liu, X. Predicting the network shift of large urban agglomerations in China using the deep-learning gravity model: A perspective of population migration. Cities 2024, 145, 104680. [Google Scholar] [CrossRef]
  28. Limtanakool, N.; Dijst, M.; Schwanen, T. A theoretical framework and methodology for characterising national urban systems on the basis of flows of people: Empirical evidence for France and Germany. Urban Stud. 2007, 44, 2123–2145. [Google Scholar] [CrossRef]
  29. Fang, C.; Yu, X.; Zhang, X.; Fang, J.; Liu, H. Big data analysis on the spatial networks of urban agglomeration. Cities 2020, 102, 102735. [Google Scholar] [CrossRef]
  30. Kreindler, G.; Miyauchi, Y. Measuring commuting and economic activity inside cities with cell phone records. Rev. Econ. Stat. 2023, 105, 899–909. [Google Scholar] [CrossRef]
  31. Schläpfer, M.; Dong, L.; O’Keeffe, K.; Santi, P.; Szell, M.; Salat, H.; Anklesaria, S.; Vazifeh, M.; Ratti, C.; West, G.B. The universal visitation law of human mobility. Nature 2021, 593, 522–527. [Google Scholar] [CrossRef]
  32. Bianchi, F.M.; Rizzi, A.; Sadeghian, A.; Moiso, C. Identifying user habits through data mining on call data records. Eng. Appl. Artif. Intell. 2016, 54, 49–61. [Google Scholar] [CrossRef]
  33. Gu, Y.; Shi, R.; Zhuang, Y.; Li, Q.; Yue, Y. How to determine city hierarchies and spatial structure of a megaregion? Geo-Spat. Inf. Sci. 2023, 27, 276–288. [Google Scholar] [CrossRef]
  34. Lu, C.; Ouyang, Q. Environmental regulation and urban position in the inter-urban pollution transfer network: A perspective on network analysis of pollution-intensive enterprises’ relocation. J. Clean. Prod. 2024, 435, 140418. [Google Scholar] [CrossRef]
  35. Zeng, F.; Sun, H. Spatial Network Analysis of Coupling Coordination between Digital Financial Inclusion and Common Prosperity in the Yangtze River Delta Urban Agglomeration. Mathematics 2024, 12, 1285. [Google Scholar] [CrossRef]
  36. Gan, J.; Zhang, D.; Guo, F.; Dong, E. Intensity of Tourism Economic Linkages in Chinese Land Border Cities and Network Characterization. Sustainability 2024, 16, 1843. [Google Scholar] [CrossRef]
  37. Guo, Y.; Wu, Z.; Zheng, Z.; Li, X. An optimal multivariate-stratification geographical detector model for revealing the impact of multi-factor combinations on the dependent variable. GIScience Remote Sens. 2024, 61, 2422941. [Google Scholar] [CrossRef]
  38. Wang, J.F.; Li, X.H.; Christakos, G.; Liao, Y.L.; Zhang, T.; Gu, X.; Zheng, X.Y. Geographical Detectors-Based Health Risk Assessment and its Application in the Neural Tube Defects Study of the Heshun Region, China. Int. J. Geogr. Inf. Sci. 2010, 24, 107–127. [Google Scholar] [CrossRef]
  39. Wang, J.F.; Xu, C.D. Geodetector: Principle and prospective. Acta Geogr. Sin. 2017, 72, 116–134. [Google Scholar] [CrossRef]
  40. Feng, R.; Wang, F.; Wang, K.; Wang, H.; Li, L. Urban ecological land and natural-anthropogenic environment interactively drive surface urban heat island: An urban agglomeration-level study in China. Environ. Int. 2021, 157, 106857. [Google Scholar] [CrossRef]
  41. Li, W.; Yan, D.; Weng, B.; Lai, Y.; Zhu, L.; Qin, T.; Dong, Z.; Bi, W. Nonlinear effects of surface soil moisture changes on vegetation greenness over the Tibetan plateau. Remote Sens. Environ. 2024, 302, 113971. [Google Scholar] [CrossRef]
  42. Gedamu, W.T.; Plank-Wiedenbeck, U.; Wodajo, B.T. A spatial autocorrelation analysis of road traffic crash by severity using Moran’s I spatial statistics: A comparative study of Addis Ababa and Berlin cities. Accid. Anal. Prev. 2024, 200, 107535. [Google Scholar] [CrossRef]
  43. Zhang, C.; Luo, L.; Xu, W.; Ledwith, V. Use of local Moran’s I and GIS to identify pollution hotspots of Pb in urban soils of Galway, Ireland. Sci. Total Environ. 2008, 398, 212–221. [Google Scholar] [CrossRef] [PubMed]
  44. Liu, M.; Liu, S.; Xu, Y.; Jin, J.; Liu, W. The Cooperativity and Spatial Network Relationship Between Regional Economic Quality Development and Higher Education Scale in China. Sustainability 2025, 17, 1520. [Google Scholar] [CrossRef]
  45. Huang, Y.; Hong, T.; Ma, T. Urban network externalities, agglomeration economies and urban economic growth. Cities 2020, 107, 102882. [Google Scholar] [CrossRef]
  46. Qi, W.; Deng, Y. How to define the city size in China? A review over a century from 1918 to 2020. Cities 2024, 144, 104649. [Google Scholar] [CrossRef]
  47. Zhao, M.; Liu, X.; Derudder, B.; Zhong, Y.; Shen, W. Mapping producer services networks in mainland Chinese cities. Urban Stud. 2014, 52, 3018–3034. [Google Scholar] [CrossRef]
  48. Yang, L.; Chen, W.; Fang, C.; Zeng, J. How does the coordinated development of population urbanization and land urbanization affect residents’ living standards? Empirical evidence from China. Cities 2024, 149, 104922. [Google Scholar] [CrossRef]
  49. Andersson, D.E.; Gunessee, S.; Matthiessen, C.W.; Find, S. The Geography of Chinese Science. Environ. Plan. A Econ. Space 2014, 46, 2950–2971. [Google Scholar] [CrossRef]
  50. Feng, Z.; Bo, W.; Yingxue, C. Research on China’s city network based on users’ friend relationships in online social networks: A case study of Sina Weibo. GeoJournal 2016, 81, 937–946. [Google Scholar] [CrossRef]
  51. Pan, F.; Bi, W.; Lenzer, J.; Zhao, S. Mapping urban networks through inter-firm service relationships: The case of China. Urban Stud. 2017, 54, 3639–3654. [Google Scholar] [CrossRef]
  52. Liu, L.; Dong, Y.; Lang, W.; Yang, H.; Wang, B. The Impact of Commercial-Industry Development of Urban Vitality: A Study on the Central Urban Area of Guangzhou Using Multisource Data. Land 2024, 13, 250. [Google Scholar] [CrossRef]
  53. Li, R.; Yu, B.; Wang, Q.; Wu, G.; Ma, Z. Changes in Economic Network Patterns and Influencing Factors in the Urban Agglomeration of Guangdong–Hong Kong–Macao Greater Bay Area: A Comprehensive Study. Buildings 2024, 14, 93. [Google Scholar] [CrossRef]
  54. Cheng, J.; Chen, M.; Tang, S. Shenzhen—A typical benchmark of Chinese rapid urbanization miracle. Cities 2023, 140, 104421. [Google Scholar] [CrossRef]
  55. Wang, C.; Ye, Y.; Huang, Z. Synergistic development in the Guangdong-Hong Kong-Macao Greater Bay Area: Index measurement and systematic evaluation based on industry-innovation-infrastructure-institution perspectives. J. Clean. Prod. 2024, 434, 140093. [Google Scholar] [CrossRef]
  56. Guo, Y. Study on the Impact of the Service Economy in China’s First-Tier Cities on the Employment Structure. Technol. Invest. 2024, 15, 28–38. [Google Scholar] [CrossRef]
Figure 1. Schematic diagram of the study area.
Urbansci 09 00176 g001
Figure 2. Daily trends of incoming and outgoing calls. Scenarios include Guangzhou incoming calls (GZ-IC), Shenzhen incoming calls (SZ-IC), Guangzhou outcoming calls (GZ-OC), and Shenzhen Outcoming calls (SZ-OC).
Urbansci 09 00176 g002
Figure 3. Calls frequency to other cities in different scenarios. The workday scenarios include incoming calls in Guangzhou on weekdays (b) IC-GZWD, outcoming calls in Guangzhou on weekdays (a) OC-GZWD, incoming calls in Shenzhen on weekdays (f) IC-SZWD, and outcoming calls in Shenzhen on weekdays (e) OC-SZWD; the weekend scenarios include incoming calls in Guangzhou on weekend (d) IC-GZWE, outcoming calls in Guangzhou on weekend (c) OC-GZWE, incoming calls in Shenzhen on weekend (h) IC-SZWE, and outcoming calls in Shenzhen on weekend (g) OC-SZWE.
Urbansci 09 00176 g003
Figure 4. Flow characteristics to other cities in different scenarios. Scenarios include Guangzhou weekdays (a) GZWD, Guangzhou weekend (b) GZWE, Shenzhen weekdays (c) SZWD, and Shenzhen weekend (d) SZWE.
Urbansci 09 00176 g004
Figure 5. Spatial distribution of cities linkages based on degree centrality. Scenarios include Guangzhou weekdays (a) GZWD, Guangzhou weekend (b) GZWE, Shenzhen weekdays (c) SZWD, and Shenzhen weekend (d) SZWE.
Urbansci 09 00176 g005
Figure 6. Spatial distribution linkage of cities is based on improved gravity model. Scenarios include Guangzhou weekdays (a) GZWD, Guangzhou weekend (b) GZWE, Shenzhen weekdays (c) SZWD, and Shenzhen weekend (d) SZWE.
Urbansci 09 00176 g006
Figure 7. Spatial distribution of cities linkages. Scenarios include Guangzhou weekdays (a) GZWD, Guangzhou weekend (b) GZWE, Shenzhen weekdays (c) SZWD, and Shenzhen weekend (d) SZWE.
Urbansci 09 00176 g007
Figure 8. Interaction detector. Scenarios include Guangzhou weekdays (a) GZWD, Guangzhou weekend (b) GZWE, Shenzhen weekdays (c) SZWD, and Shenzhen weekend (d) SZWE.
Urbansci 09 00176 g008
Figure 9. Comparison of urban linkages. Scenario includes Guangzhou weekdays (a) GZWD and Shenzhen weekdays (b) SZWD.
Urbansci 09 00176 g009
Table 1. Driving factor breakdown table.
PopulationEconomic FactorsTrade Factors
Population (X1)GDP (X2)Import value of goods (X6)
Primary industry GDP (X3)Export value of goods (X7)
Secondary industry GDP (X4)Number of industrial enterprises (X8)
Tertiary industry GDP (X5)Number of domestic enterprises (X9)
Table 2. Factor detector. Scenarios include Guangzhou weekdays (GZWD), Guangzhou weekend (GZWE), Shenzhen weekdays (SZWD), and Shenzhen weekend (SZWE).
FactorsGZWDGZWESZWDSZWETotal
qpqpqpqpMeanRank
X10.0510.0090.0500.0090.0300.0870.0290.0890.0407
X20.0950.0000.0920.0000.0560.0080.0540.0090.0746
X30.0020.9780.0010.9870.0060.7800.0060.8100.0049
X40.1150.0000.1110.0000.0690.0030.0670.0030.0905
X50.0500.0110.0480.0120.0300.0890.0290.0930.0398
X60.2610.0000.2370.0000.4650.0000.4620.0000.3571
X70.2110.0000.1950.0000.3260.0000.3230.0000.2642
X80.3150.0000.3080.0000.1830.0000.1810.0000.2473
X90.2050.0000.2000.0000.1180.0000.1160.0000.1604
Disclaimer/Publisher’s Note: The statements, opinions and data contained in all publications are solely those of the individual author(s) and contributor(s) and not of MDPI and/or the editor(s). MDPI and/or the editor(s) disclaim responsibility for any injury to people or property resulting from any ideas, methods, instructions or products referred to in the content.

