Abstract
This paper examines the various functions of urban parks in the city of Novi Sad (Serbia). This study’s respondents were landscape architecture students, and the methodology employed was a survey, which was subsequently analyzed using multiple statistical tests. This paper explores the different roles that urban parks in Novi Sad play, such as aesthetic, ecological, recreational, psychological, economic, and educational functions. The analysis also includes an assessment of the correlation between the scores for each function and visitors’ habits and behaviors (e.g., frequency and duration of visits). Together, these findings provide detailed insight into the current state of urban park functions in Novi Sad and highlight how these functions relate to visitors’ experiences. The results obtained are valuable for enhancing both the quality of park visits and the overall functionality of urban parks. This paper also provides recommendations for future research, including potential methodologies to be applied and directions for a more detailed assessment of ecological functions.
1. Introduction
Urban parks serve as essential components of urban ecosystems, providing multifaceted benefits that enhance quality of life for city dwellers [1,2,3]. Urban parks are green spaces that serve vital functions in enhancing the aesthetic appeal of cities, supporting ecological integrity, stimulating local economies, facilitating educational experiences, improving psychological health, and providing recreational opportunities [4,5,6]. The text that follows will further discuss the aesthetic, ecological, economic, educational, psychological, and recreational functions of urban parks.
Aesthetic functions of urban parks encompass their role in enhancing the visual appeal of cities. The incorporation of diverse flora, including trees, shrubs, and flowering plants, contributes to the beauty of urban environments, providing a strong contrast to concrete and steel structures [5,7]. This greenery improves overall landscape quality, allowing city residents and visitors to experience nature within dense urban settings [8]. Aesthetically pleasing parks serve as picturesque backdrops for photography and events, fostering cultural appreciation and creative expression [9]. Additionally, design elements like pathways, water features, and seating areas enhance their aesthetic quality, making them inviting for social interactions and relaxation [10]. As urban populations grow, the aesthetic function of parks becomes increasingly important for mental rejuvenation and cultural identity [11].
Ecological functions refer to the environmental benefits that urban parks provide, which play a vital role in urban sustainability. Parks contribute to ecosystem services essential for urban health, such as air and water purification, carbon sequestration, and temperature regulation [12]. They serve as habitats for various wildlife species, supporting biodiversity within city limits [3]. Studies have shown that urban parks can significantly mitigate urban heat islands, contributing to cooler city temperatures during hot weather [13]. Parks also aid stormwater management by facilitating natural rainwater absorption and filtration [14]. By maintaining native plant species, urban parks can restore local ecosystems and enhance the resilience of urban biodiversity [15]. In this way, urban parks function as essential ecological infrastructure that supports urban environmental health and promotes sustainability [16].
The economic implications of urban parks are significant. Well-maintained parks can enhance property values in surrounding neighborhoods, as proximity to green spaces often correlates with higher real estate prices [17]. Economic studies have shown that urban parks can lead to increased local business activity by attracting visitors for recreational activities, events, and gatherings [16,18]. Moreover, the presence of parks stimulates tourism, serving as significant attractions that draw visitors to a city [14, 19]. Beyond direct economic benefits, urban parks can improve overall quality of life, making cities more attractive for residents and businesses [20]. These economic advantages underline the importance of investing in urban parks for fostering economic growth and community development [21].
Urban parks provide vital educational opportunities for individuals of all ages. They serve as venues for environmental education, allowing visitors to learn about local ecosystems and conservation practices [22]. Many parks offer guided tours and interpretive signage aimed at fostering a greater understanding of environmental issues [23]. Educational programs tailored to schools can promote ecological literacy among youth [24]. By integrating educational functions into park planning, urban spaces can enhance community engagement and empowerment, fostering a more informed citizenry [25].
The psychological benefits of urban parks are profound, contributing to the mental and emotional well-being of city residents. Access to green spaces has been linked to lower stress levels and improved mental health outcomes [26]. Research indicates that spending time in nature can lead to restorative experiences, enhancing mood and cognitive function [27]. The social interactions fostered by parks also contribute to psychological well-being by alleviating feelings of isolation and promoting community cohesion [26,27]. This relationship between green spaces and mental health is particularly important in urban areas, where individuals may experience higher levels of stress and mental health challenges [28,29].
Urban parks are vital for promoting physical activity and recreational opportunities, contributing to healthier lifestyles for urban residents. These green spaces provide venues for walking, running, cycling, and various sports, all essential for maintaining physical health. The incorporation of amenities such as playgrounds and picnic areas makes parks suitable for families, increasing their utility for various recreational needs [30]. By offering accessible and safe environments for physical activities, urban parks can significantly impact public health outcomes [5].
Evaluation of urban parks’ functions can be conducted using various methods, including on-site observations, interviews, focus group discussions, questionnaires, etc. [31]. Among these, questionnaires are particularly common and employ a variety of techniques to collect responses. For example, this paper [32] utilized a Likert scale to assess citizens’ satisfaction with urban forests and greenery, a method also applied in evaluating the benefits of public urban green spaces in [33]. Questionnaires can also include open-ended questions, which offer opportunities for gaining deeper insights into respondents’ thoughts and perspectives [31]. Other methodologies include voting methods and social choice theory [34], participatory tools [35], and various multi-criteria analysis approaches [36,37,38], which provide diverse frameworks for evaluating and prioritizing urban park functions based on multiple factors. Nowadays, the use of city cameras to extract big data, combined with computer vision and spatial analysis, presents a new trend in evaluating urban parks by providing rich insights into park users’ spatial and temporal behaviors [39]. Recent research [40] indicates that some of the biggest challenges in urban greening are population growth and densification, effective greenspace management, and biodiversity conservation and proposes that urban planners should leverage existing research, promote the co-benefits of biodiversity and ecosystem services, and adapt monitoring methods to create and develop sustainable urban green areas.
The main goal is to analyze the success of six functions of urban parks in Novi Sad and examine the correlation between their ratings and visitors’ habits and behaviors, such as visit frequency and duration. The main hypothesis was that the scores for different functions would vary and that visitors’ habits would influence the final ratings. A similar questionnaire and processing of results can be repeated for other parks and stakeholder groups due to the intuitive and straightforward design.
2. Materials and Methods
2.1. Urban Parks in Novi Sad
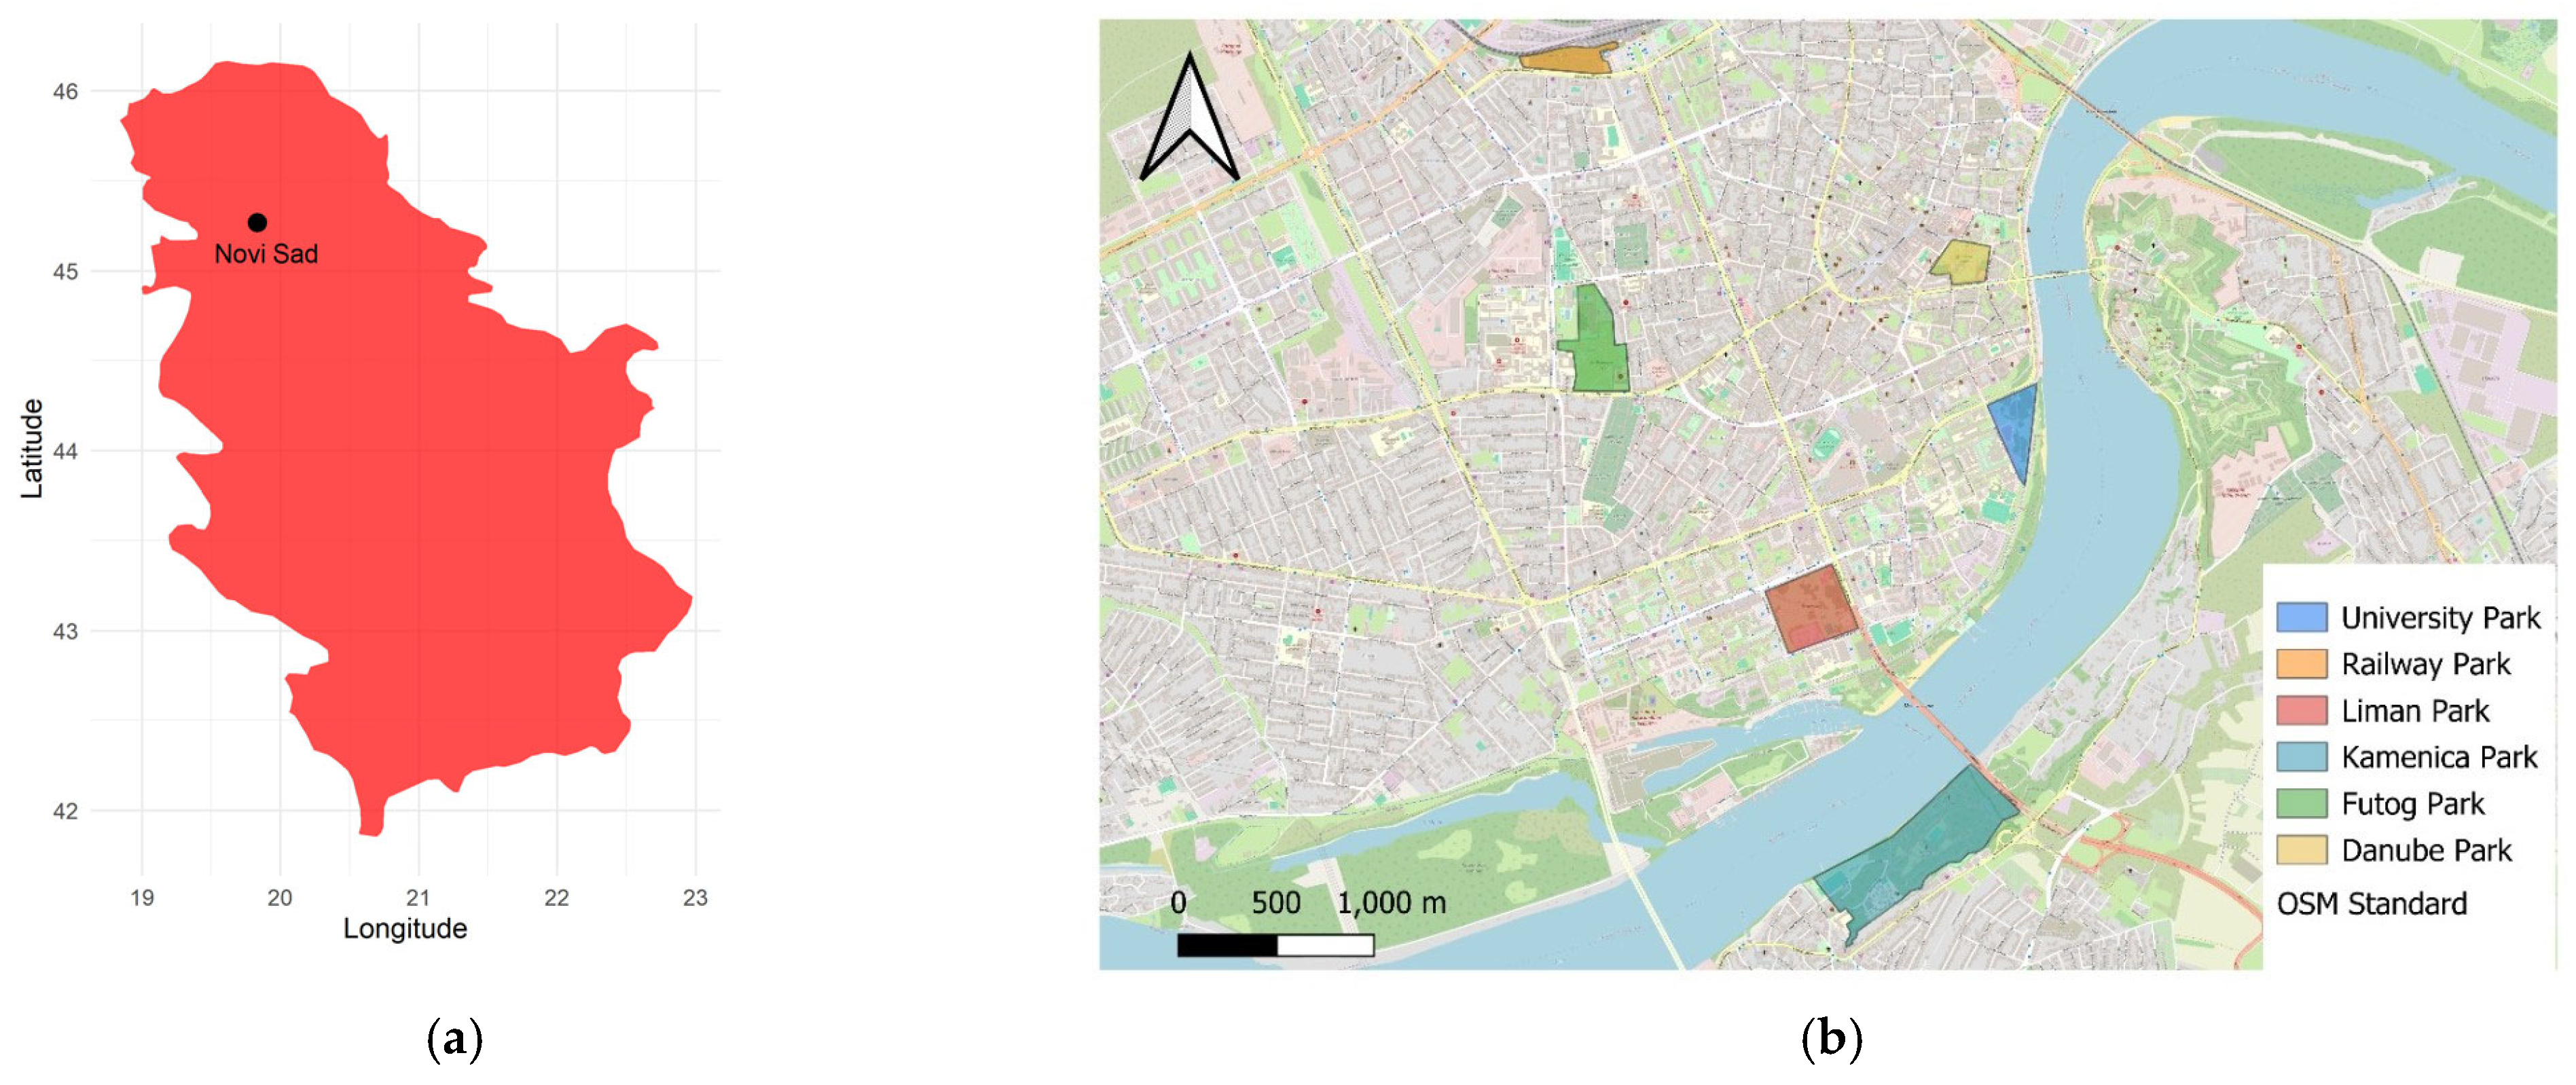
This paper examines six major urban parks in Novi Sad, Serbia—Danube, Liman, Futog, Railway, Kamenica, and University Park—with their spatial distribution illustrated in Figure 1. A brief overview of each park is presented below. The data related to plant material are extracted from the web platform [41] and a recently published report [42].
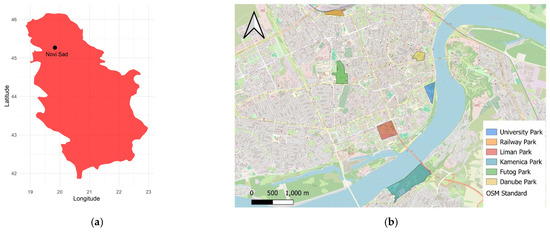
Figure 1.
(a) Location of Novi Sad (Serbia); (b) parks in Novi Sad (Serbia), 2025.
Danube Park is a natural monument located near the Danube River, spanning an area of 3.93 hectares. The park, which is over 120 years old, features many diverse elements, such as a central lake, several artistic sculptures, a music pavilion, and a sculpture of a nymph in the form of a water fountain. The total number of trees in the park is 517, of which approximately 61% (314) are broadleaves, and the remaining 39% (203) are conifers. The total number of tree species is 65, and the five most dominant species are Pinus nigra Arnold, Celtis australis L., Corylus colurna L., Betula pendula Roth, and Cedrus atlantica (Endl.) Manetti, respectively. One specimen of Quercus robur “Fastigiata” is under protection, and other notable floristic elements include Picea omorika (Pancic) Purkyne and Taxodium distichum L.
Futog Park is a natural monument, covering an area of approximately 12 hectares, with 8.5 hectares of the park under protection [43]. The park was designed and constructed around 1910. It is located next to the Hospital for Rheumatism, a stunning architectural landmark in the city, which is also protected as a cultural heritage site. In the park, there are a total of 1584 trees. Of these, approximately 57% (899) are broadleaves, and the remaining 43% (685) are conifers. The park features around 100 species, varieties, and forms of woody flora organized into groups, massifs, and alleys [43]. The most dominant tree species are Pinus nigra Arnold, Sophora japonica (L.) Jacq., Celtis occidentalis L., Tilia tomentosa Moench, and Maclura pomifera (Raf.) Schneid, respectively. In the park, there is one protected tree specimen of Ginkgo biloba L. (approximately 100 years old), and other notable floristic elements include Calocedrus decurrens (Torr.) Florin, Metasequoia glyptostroboides Hu & W.C. Cheng, all of which are exotic to the territory of Serbia.
Kamenica Park is a natural monument, covering 33 hectares on the slopes of Fruška Gora National Park [44]. Recently, the park has undergone extensive renovation, enhancing its outdoor amenities. The park features historical landscape elements, such as the Hill of Roses with five vivid-colored columns topped with sculptural elements, as well as sculptures of the Sphinx and “The Girl Who Lies”. There are approximately 7500 trees in total, with broadleaves comprising 94% of them. The total number of tree species is 88. Along the riverbank of the Danube, Salix spp. and Populus spp. prevail, while Quercus robur L., among other oak species, Tilia tomentosa Moench, Ulmus minor Mill., and Fraxinus angustifolia Vahl. dominate the central area of the park. Notably, two oak trees (Quercus pubescens Willd.), dating back to 1805, stand as the oldest oaks in Novi Sad.
Liman Park spans 12.9 hectares [45] and is located in the Liman settlement, which was developed around the middle of the last century. The park features numerous sports and children’s playgrounds, as well as a well-developed path system and promenades. In the park, there are a total of 1343 trees. Of these, approximately 83% (1112) are broadleaves, and the remaining 17% (231) are conifers. The five most dominant species are Celtis australis L., Sophora japonica (L.) Jacq., Populus nigra L., Pinus nigra Arnold, and Quercus rubra L., respectively.
University Park spans 5.9 hectares and is situated within the University of Novi Sad campus, near the Danube River quay [46]. The park has undergone two major reconstructions. The first, completed in 1969, addressed flooding from 1965 using bio-measures with poplar clones. The second, in 1980–1981, was part of the quay redevelopment, creating a direct link to the Danube River. The park is characterized by 13 tree species, predominantly Populus × euramericana (Dode) Guinier, Celtis australis L., and Celtis occidentalis L., with the latter being a highly invasive species [47]. The total number of trees is 306.
Railway Park, covering 4.2 hectares, is located next to the central bus station and the former railway station in Novi Sad. It serves as a green buffer between heavy traffic and the surrounding residential area. In Railway Park, there are a total of 516 trees, of which 79% (406) are broadleaf species, and 21% (110) are conifers. The total number of tree species in the park is 47. The most dominant tree species are Pinus nigra J.F. Arnold, Celtis australis L., Aesculus hippocastanum L., Tilia cordata Mill., and Fraxinus angustifolia Vahl., respectively.
2.2. Questionnaire
The questionnaire was distributed electronically in January 2024 to two groups of students enrolled in the landscape architecture program at the University of Novi Sad (Serbia): second-year and fourth-year students. A total of 68 students participated in the survey, including 40 s-year students and 28 fourth-year students, representing the entire cohort enrolled in these respective years at the University of Novi Sad. The inclusion of second-year and fourth-year students aimed to examine differences in opinions between those at the early and advanced stages of their studies.
The set of functions to be analyzed and the scoring system were defined through a brainstorming session with all students. After that, the respondents were asked to evaluate six key functions of parks in Novi Sad—namely aesthetic, ecological, economic, educational, psychological, and recreational—using a scale from 1 (lowest) to 5 (highest). These results were integrated with data from a previously published study [48], particularly regarding questions on the frequency and duration of park visits. Additionally, two supplementary questions were included: suggestions for promoting the educational function of parks and respondents’ willingness to pay an entrance fee. Before analyzing the results, we calculated Cronbach’s coefficient α [49] to assess the reliability of the questionnaire. Later on, the responses were processed using analysis of variance (ANOVA) and multivariate analysis of variance (MANOVA) with Tukey’s HSD tests. The significance for all tests was p < 0.05. All results were analyzed using Statistica software [50] (v. 14.1). Additionally, some results and graphics were generated using the R program (v. 4.4.2) [51], which has proven effective for numerical data processing and the creation of high-quality graphs [52].
3. Results
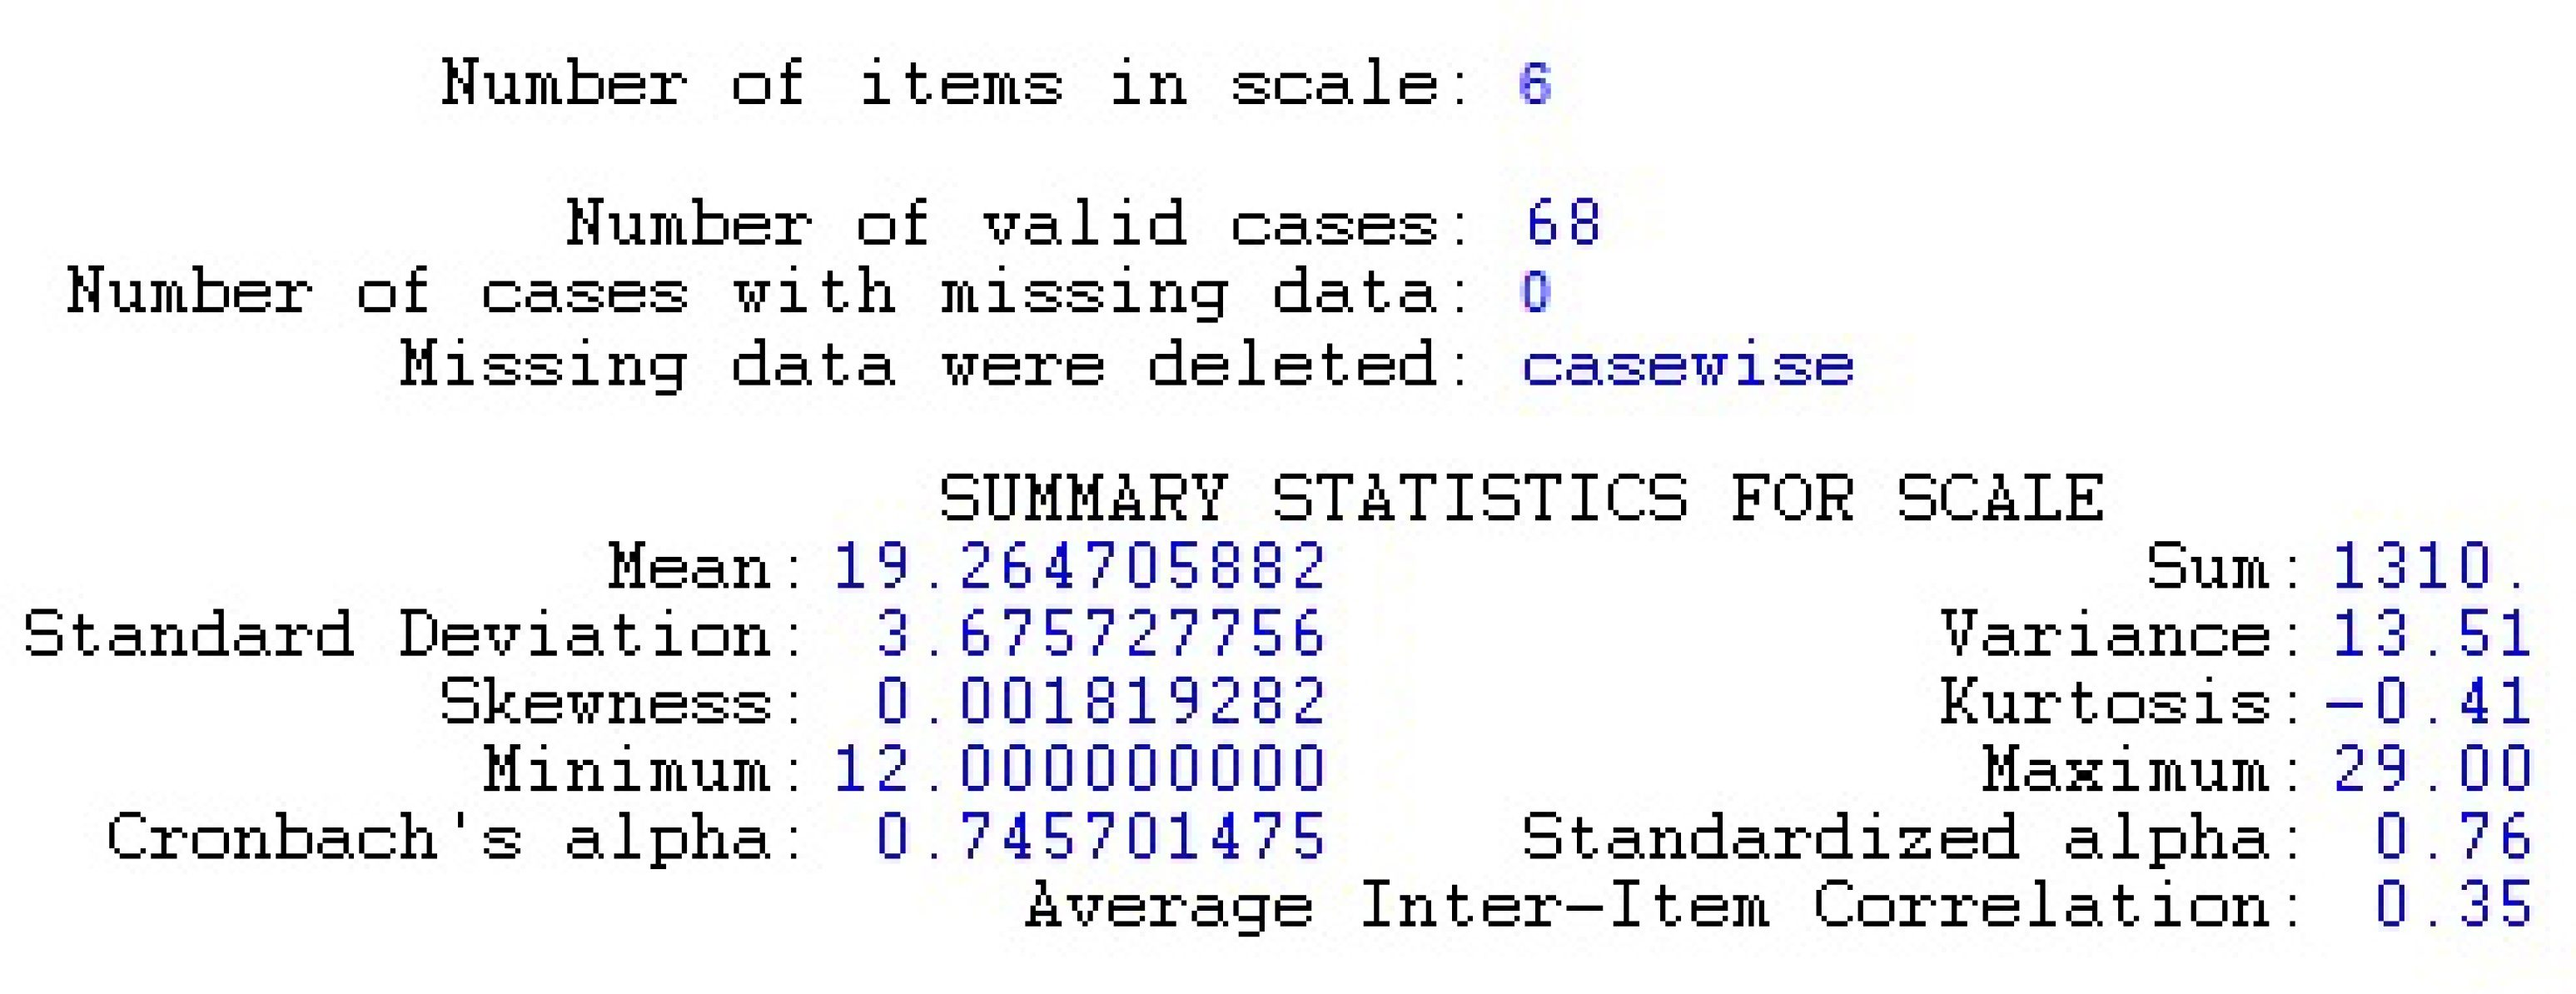
The first step is the analysis of Cronbach’s α coefficient, which is presented in Figure 2 and designed to test the reliability of the sample.
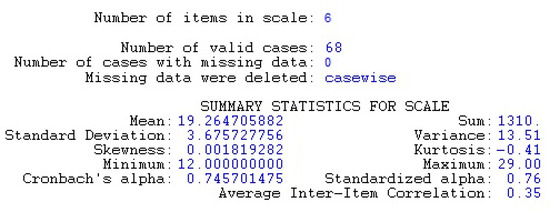
Figure 2.
Cronbach’s α coefficient and reliability of the questionnaire.
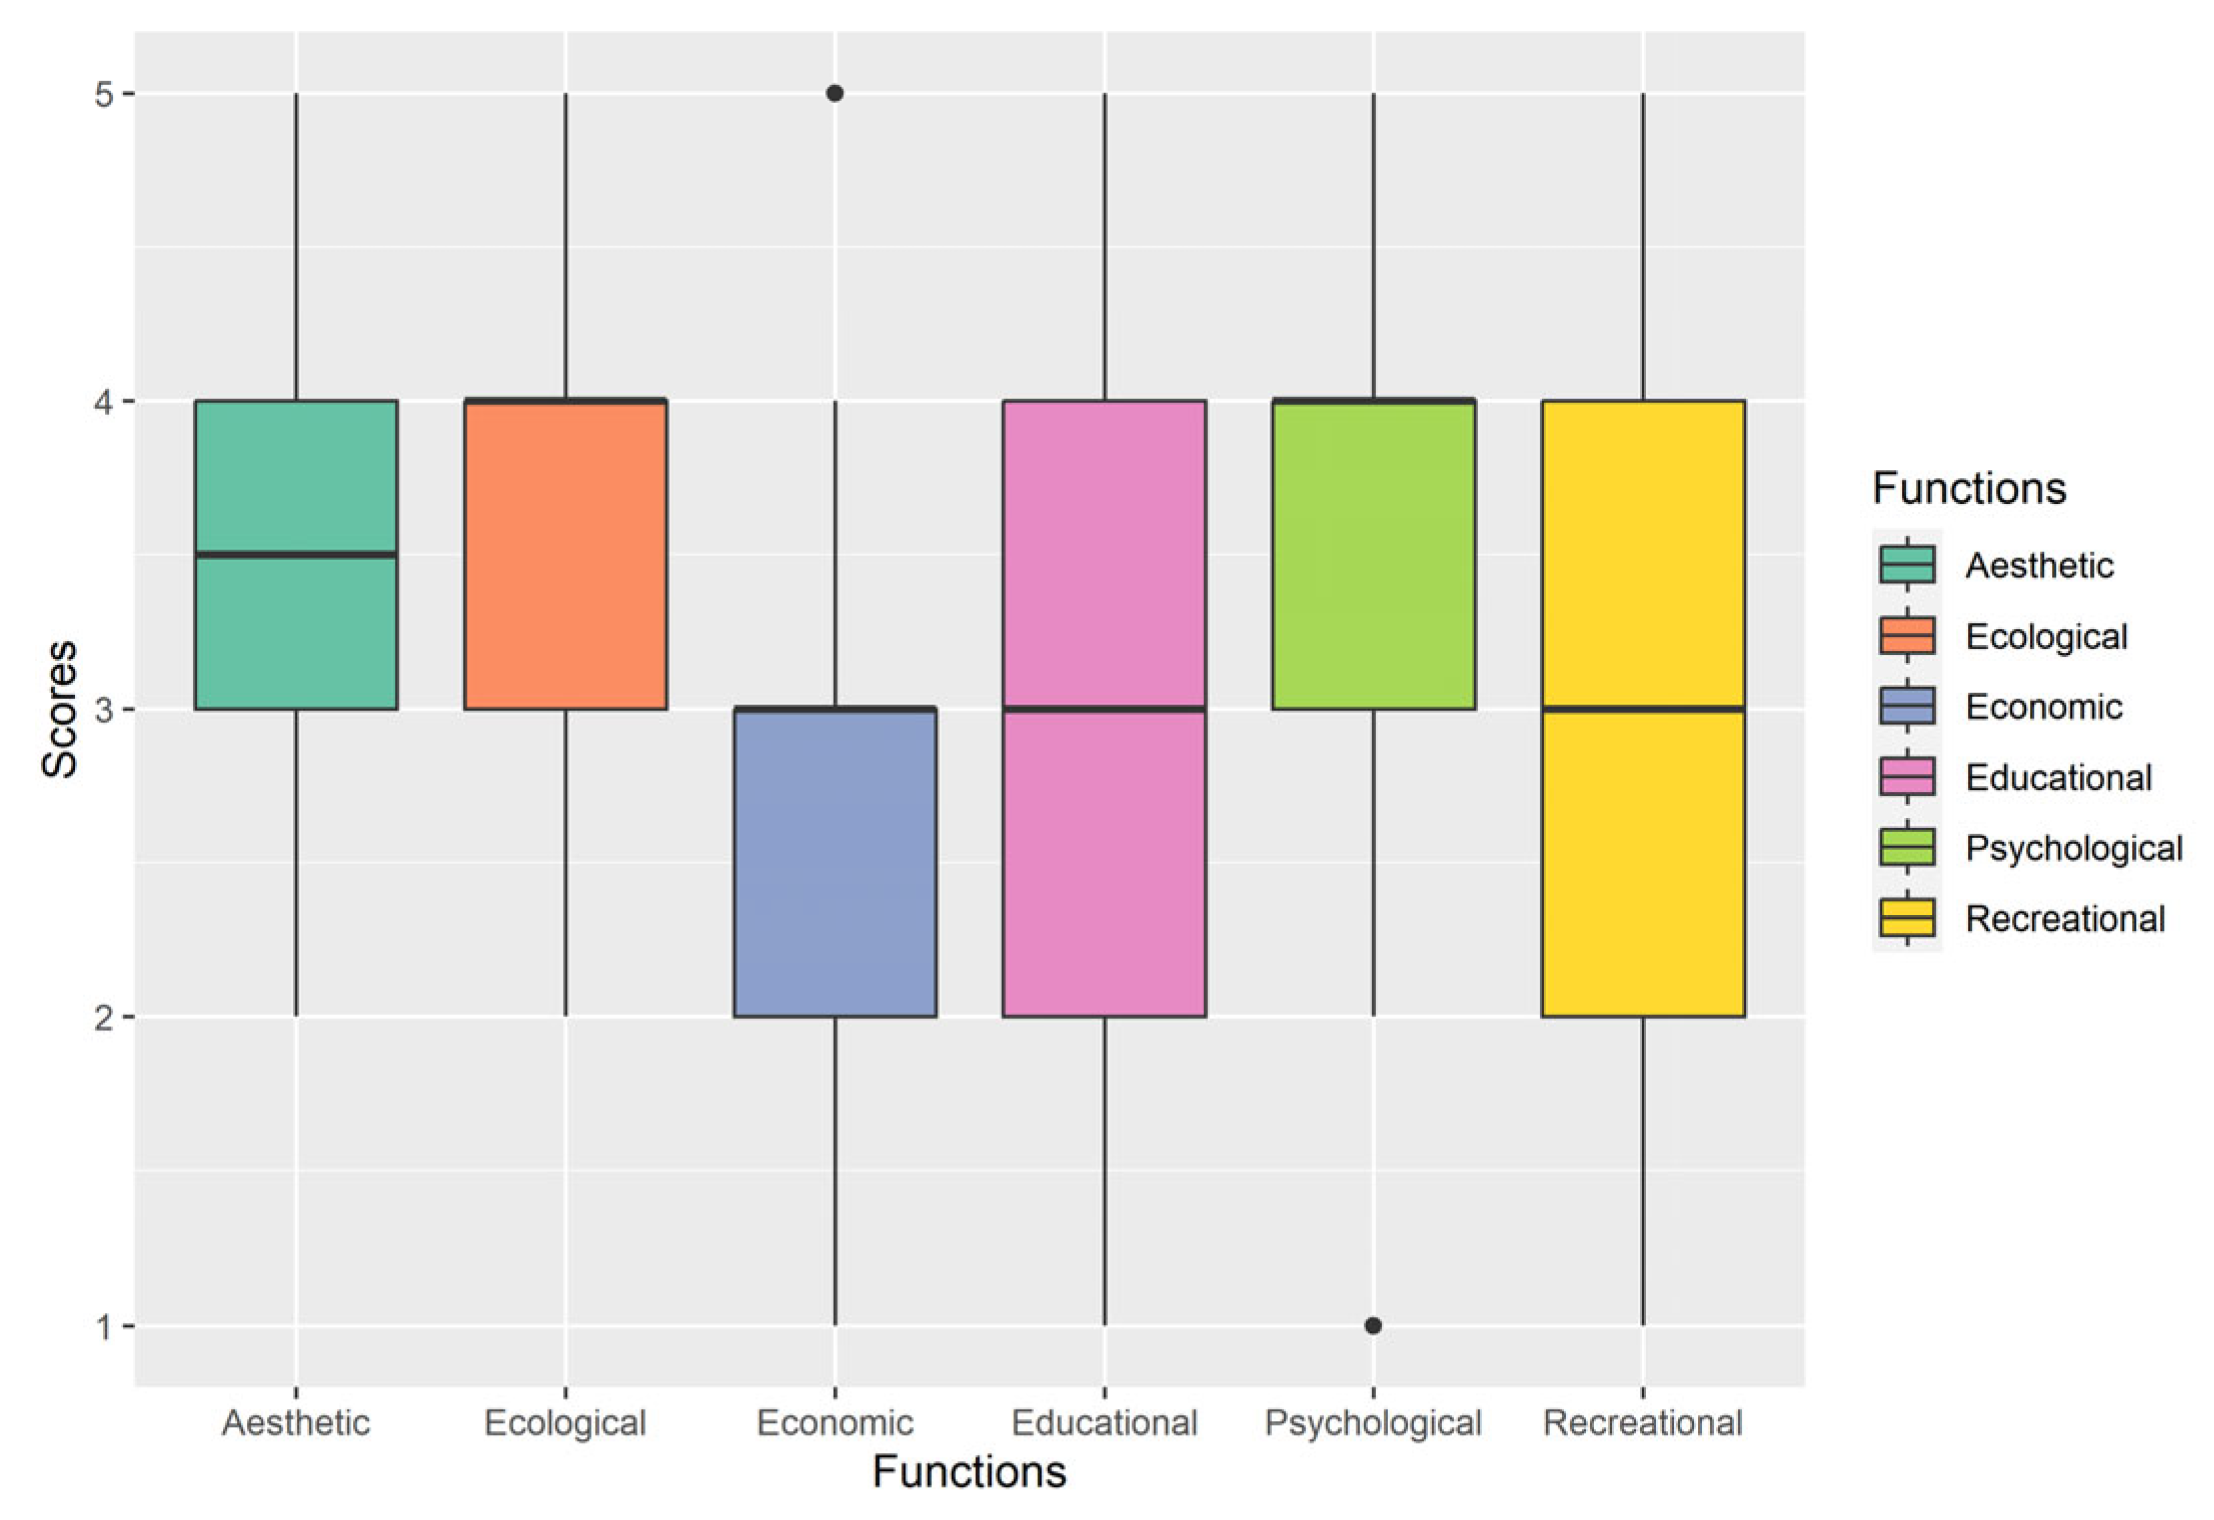
When a table is created with scores for all six functions and sixty-eight respondents, the reliability is found to be acceptable, as the standardized Cronbach’s α coefficient is 0.76 (Figure 2). This confirms the reliability of the questionnaire, allowing us to proceed with result processing and further analysis. The results of the questionnaire are illustrated in Figure A1 (frequency of votes assigned to each score (1, 2, 3, 4, and 5) across six key functions of urban parks in Novi Sad). These responses were statistically analyzed, with the initial results presented as a boxplot (Figure 3).
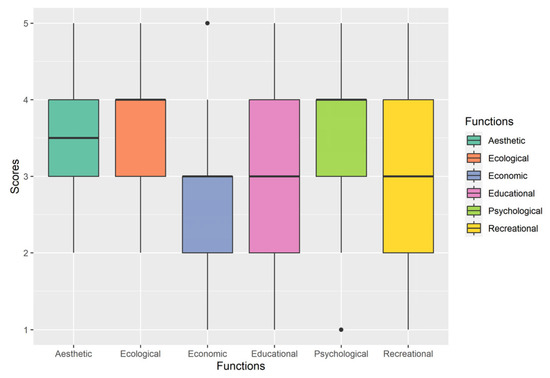
Figure 3.
Scores for functions of urban parks in Novi Sad.
Figure 3 shows the minimum, first quartile (Q1), median, third quartile (Q3), and maximum values, along with outliers, represented in the boxplot. This is further supplemented with basic statistical metrics (Table 1), including the mean value, standard deviation (SD), and standard error (SE).

Table 1.
Statistical metrics for park functions in Novi Sad and results of ANOVA and HSD tests.
The psychological (3.603) and ecological (3.588) functions received the highest mean scores, both belonging to the same homogeneous group (a), indicating that parks are perceived as highly successful in fulfilling these functions. The aesthetic function (3.485) falls between groups a and b, suggesting it is also well fulfilled but with slightly lower effectiveness compared to the top-rated functions. The recreational function (3.074) is positioned in group bc, reflecting a moderate level of success in meeting users’ needs. In contrast, the educational (2.897) and economic (2.618) functions are both classified in group c, signifying that parks are perceived as the least successful in providing these benefits.
3.1. Year of Study, Park Functions, and Scores for Park Functions
Table 2 presents the results of the factorial ANOVA test, in which the categorical variables are the year of study and park function, and the dependent variable is the score the students assign to park functions. Second-year students gave the highest ratings, with the highest average scores for the ecological and psychological functions of parks. Fourth-year students rated the ecological function of parks the highest.

Table 2.
Factorial ANOVA test: park functions, scores, and year of study.
Table 3 presents the results of Fisher’s LSD test for park functions, examining statistically significant differences in ratings between second-year and fourth-year landscape architecture students.

Table 3.
Fisher’s LSD test (Park function fixed).
The only park function whose score was significantly different statistically in comparison to the observed park function was recreation (II (3.300) and IV (2.750)), as indicated by a p-value of 0.0157 (Table 3).
3.2. Aesthetic Park Functions
Now, the categorical variable is the frequency of visits, and the dependent variable is the score of the aesthetic functions of parks. The highest average score for the aesthetic functions of parks was given by students who visit parks daily (Table 4).

Table 4.
Factorial ANOVA test: frequency of visits and score of parks’ aesthetic function.
There is a statistically significant difference in ratings given by students who visit the park daily (3.875) and those who visit once a month (3.308), daily (3.875) and 2–3 times a month (3.357), daily (3.875) and 2–3 times a week (3.312), and once a week (3.706) and 2–3 times a week (3.312) (Table A1).
Now, the categorical variable is the length of stay in parks, and the dependent variable is the rating of the aesthetic functions of parks (Table 5).

Table 5.
One-way ANOVA test: length of stay and scores for aesthetic functions of parks.
Post hoc analysis determined that there are no statistically significant differences in ratings for aesthetic function based on the length of stay in parks (Table A1).
3.3. Ecological Park Functions
The categorical variables are frequency of park visits and length of stay in parks, with the dependent variable being the rating of the ecological functions of parks by students of both second and fourth years (Table 6).

Table 6.
Factorial ANOVA test: frequency of visits, length of stay, and ratings of ecological functions of parks.
After the post hoc analysis, Fisher’s LSD test revealed a statistically significant difference in ratings for the ecological functions of parks (Table 6 and Figure A2 and Figure A3), due to differences in park visiting patterns. Specifically, those visiting parks 2–3 times a month and staying between 10 and 30 min (4.250) differ from those staying between 1 and 2 h (2.000), with a p-value of 0.0156. Similarly, visitors who stay between 10 and 30 min and visit parks once a week (3.429) show a significant difference compared to those visiting daily (4.500), with a p-value of 0.0197. Lastly, those staying between 1 and 2 h and visiting parks once a month (4.500) differ significantly from those visiting 2–3 times a month (2.000), with a p-value of 0.0142.
3.4. Eductional Park Functions
The educational functions of parks in Novi Sad were detailed in a previously published paper [48]. The question was whether there were statistically significant differences in the ratings (scores) of the educational functions of the park depending on the length of stay in the park and the frequency of visits. We summarize those results here (Table 7).

Table 7.
MANOVA test: frequency of visits, length of stay, and scores for educational function of parks.
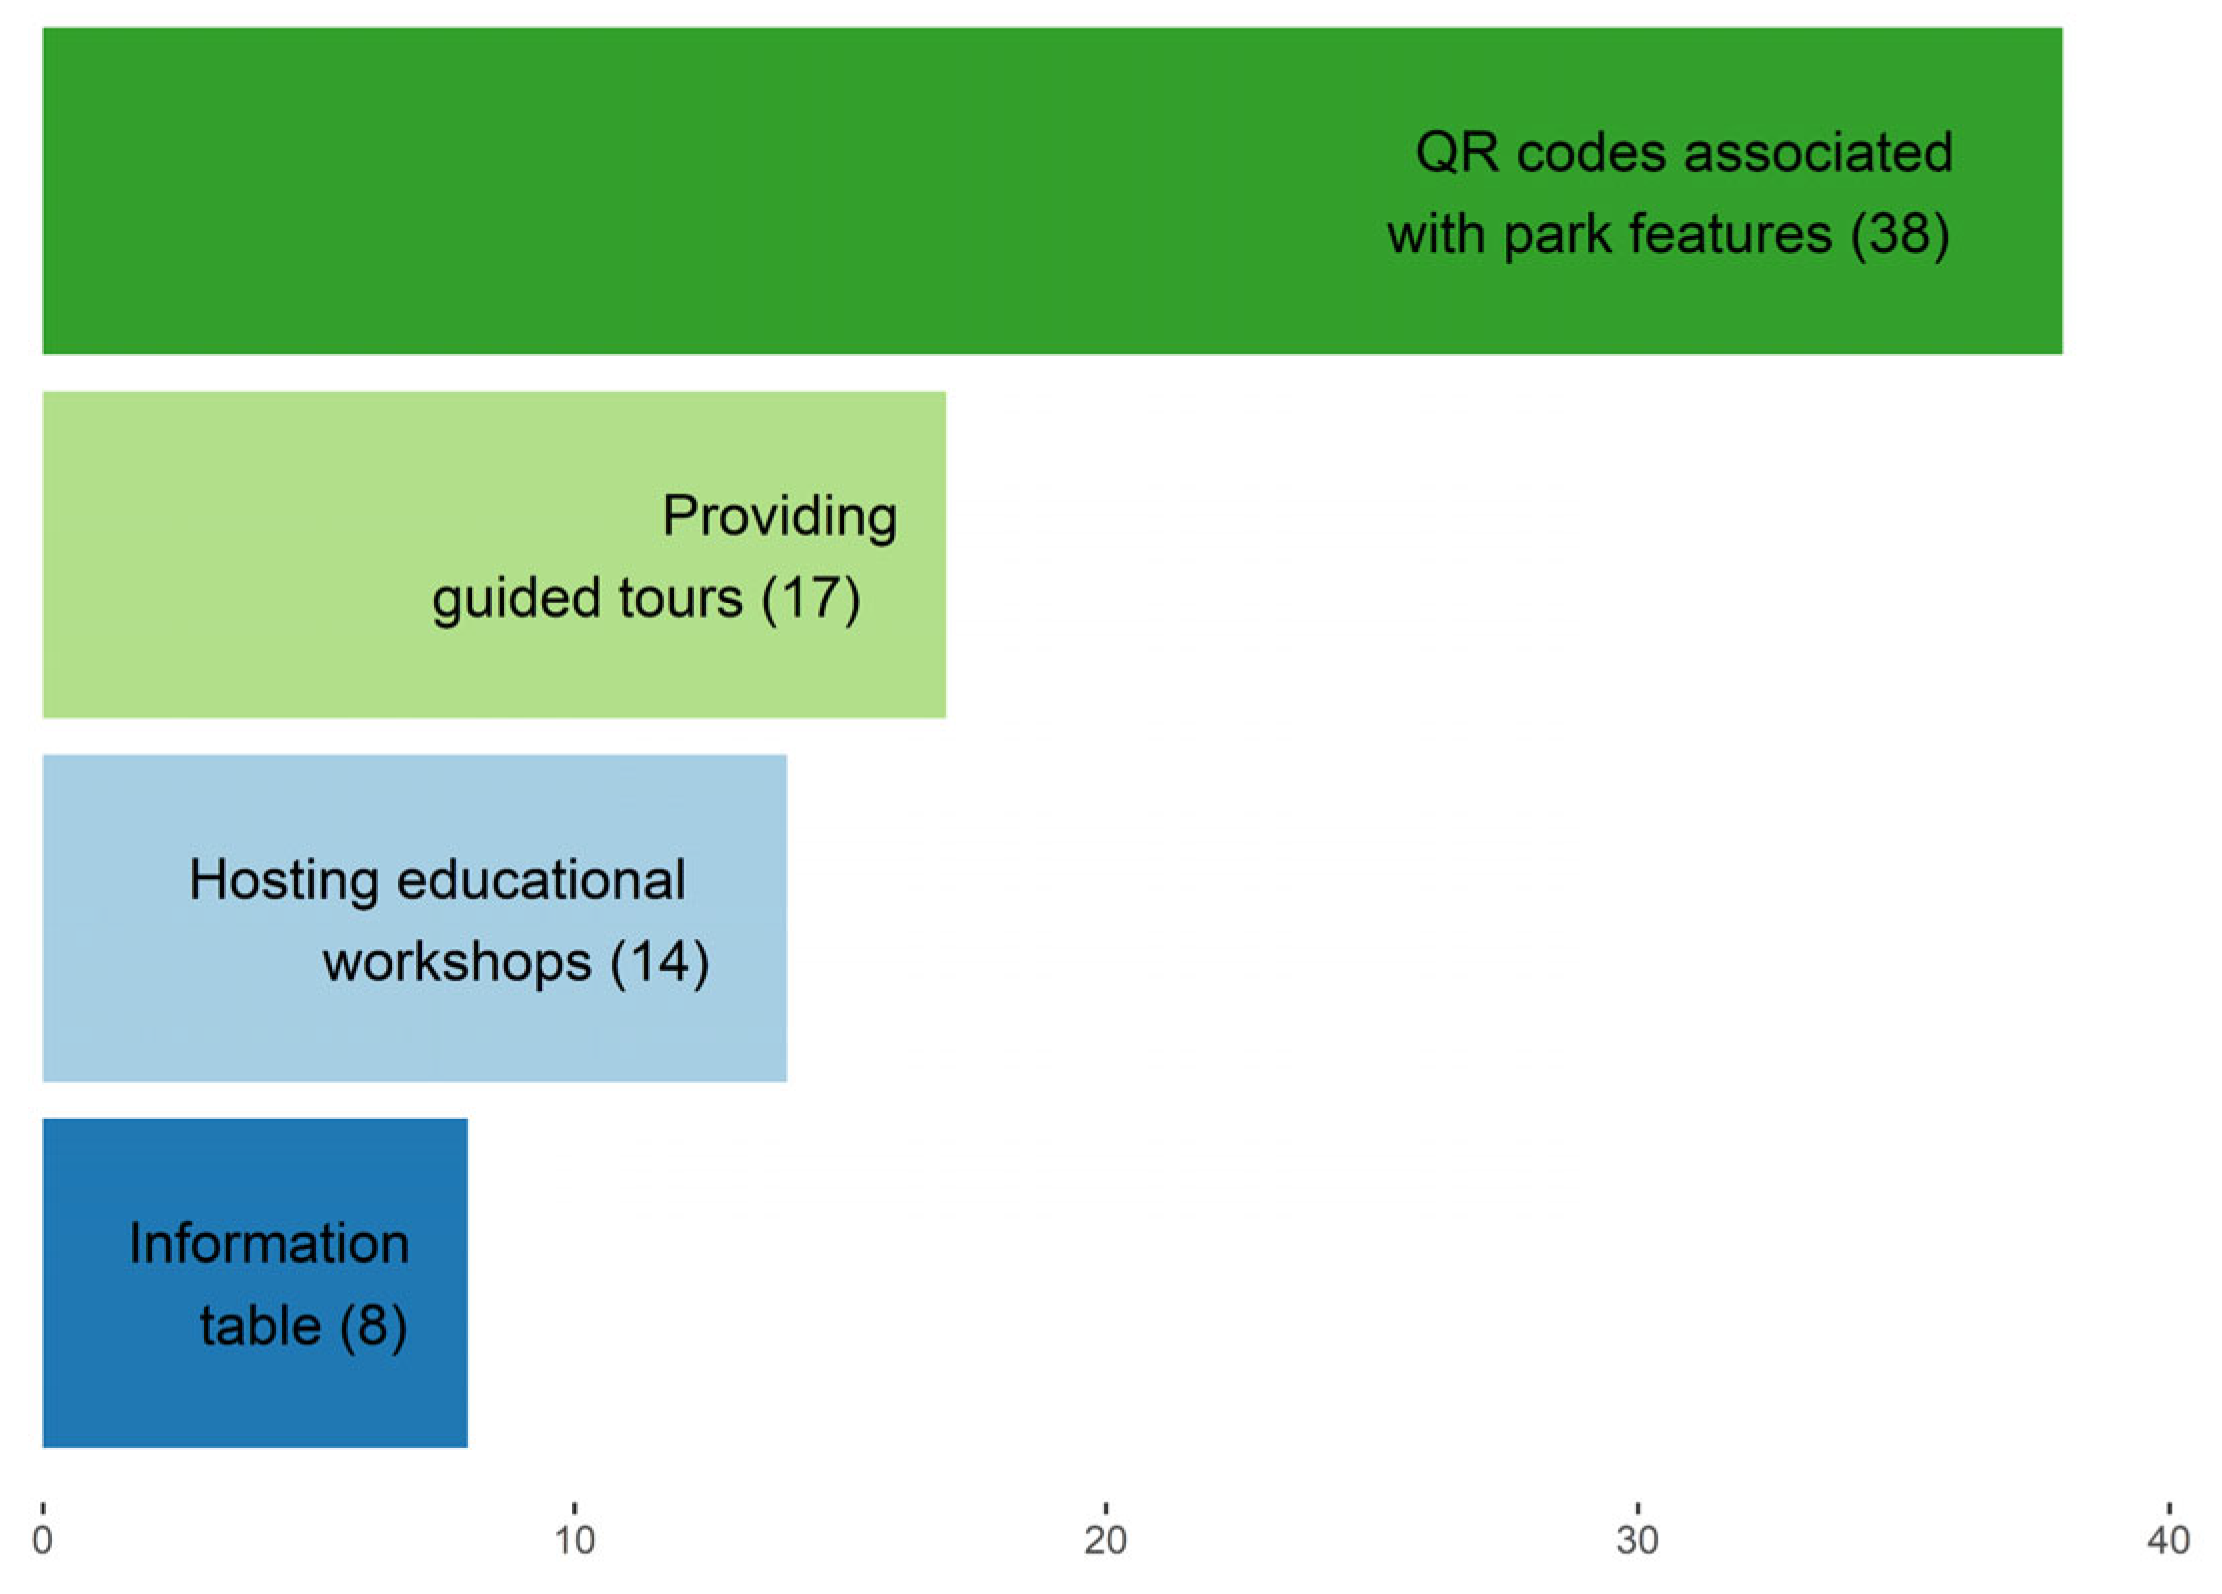
Respondents were also asked to provide suggestions for enhancing the educational function of urban parks through an open-ended question. Their responses were categorized into key themes (Figure 4).

Figure 4.
Suggestions for promoting the educational functions of urban parks in Novi Sad.
The majority of suggestions focused on incorporating QR codes with informational data about park features and offering guided tours. Additionally, some respondents proposed hosting educational workshops and setting up informational tables within the parks. Many of the suggestions focused on recognizing oak species. This is to be expected, as oaks are among the most common tree species in Serbia [53] and are also highly recognized and valued at the European level [54].
3.5. Recreational Park Functions
The categorical variables are the frequency of park visits and the length of stay in the parks, while the dependent variable was the rating of the recreational functions of the parks by students from all years. Following post hoc analysis, Fisher’s LSD test revealed a statistically significant difference in ratings of the recreational functions of the parks in the following cases (Table 8 and Figure A4).

Table 8.
Factorial ANOVA test: frequency of visits, length of stay, and ratings of recreational functions of parks.
Specifically, visitors who come once a week and stay between 10 and 30 min (rating 4.000) show a significant difference compared to those staying between 30 and 60 min (rating 2.444), with p = 0.0055. Additionally, those staying between 10 and 30 min (rating 4.000) differ from those staying less than 10 min (rating 1.000), with p = 0.0111. For visitors coming once a month, those staying between 1 and 2 h (rating 4.500) differ significantly from those staying between 30 and 60 min (rating 2.400), with p = 0.012.
3.6. Psyhological Park Functions
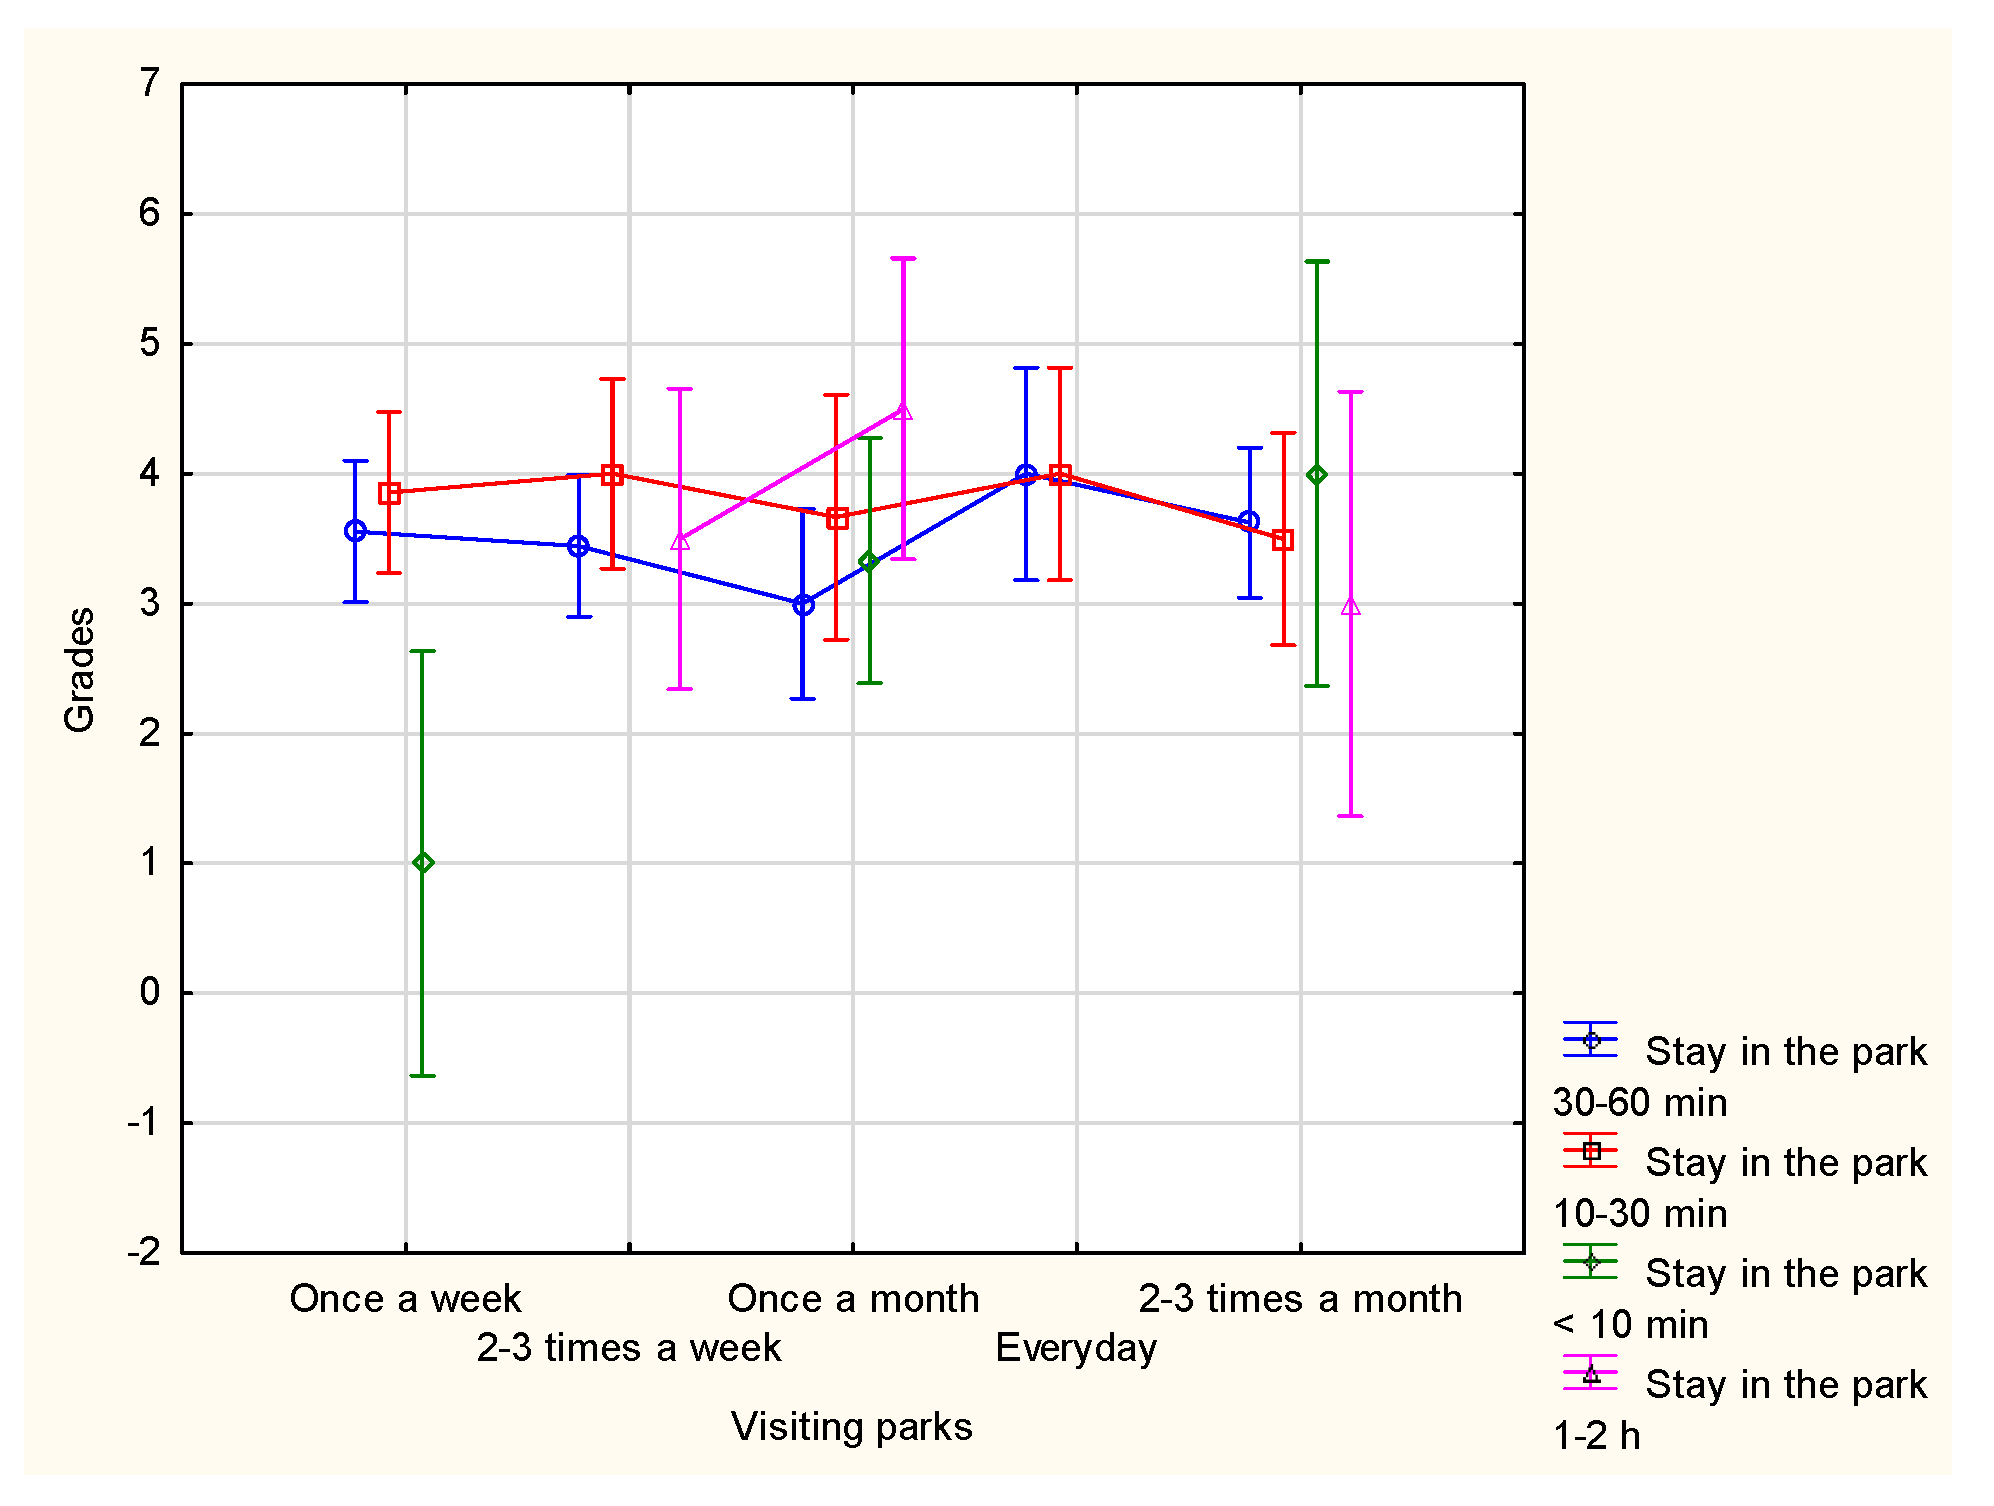
The categorical variables are the frequency of park visits and the duration of stay in the parks, while the dependent variable was the rating of the parks’ psychological functions by students from all years. Following post hoc analysis, Fisher’s LSD test revealed a statistically significant difference in ratings of the psychological functions of the parks in the following cases (Table 9 and Figure A5).

Table 9.
Factorial ANOVA test: frequency of visits, length of stay, and ratings of psychological functions of parks.
Visitors who come once a week and stay between 30 and 60 min (rating 3.556) differ from those staying less than 10 min (1.000), with p = 0.0044. Similarly, visitors who stay between 10 and 30 min (3.857) on a weekly basis show a significant difference compared to those staying less than 10 min (1.000), with p = 0.0019. Visitors who come once a month and stay between 1 and 2 h (4.500) also differ significantly from those staying between 30 and 60 min (3.000), with p = 0.0322. Furthermore, visitors who stay less than 10 min and visit once a week (1.000) show a significant difference compared to those visiting once a month (3.333), with p = 0.0164. Finally, those who stay less than 10 min and visit once a week (1.000) also differ from those visiting 2–3 times a month (4.000), with p = 0.0120.
The categorical variable is now the frequency of visits, while the dependent variable is the rating of the parks’ psychological functions. The highest average rating for the psychological functions of parks was given by students who visit the parks daily, and the lowest by those who visit once a week (Table 10). Post hoc analysis revealed no statistically significant differences in ratings based on the frequency of park visits.

Table 10.
Factorial ANOVA test: frequency of visits and score of parks’ psychological function.
The categorical variable is now the duration of stay in the parks, while the dependent variable is the score of the parks’ psychological functions. The highest scores were given by students who stayed in the parks for 10 to 30 min and the lowest by those who had the shortest stays (Table 11).

Table 11.
One-way ANOVA test: length of stay and scores for psychological functions of parks.
Post hoc analysis with Fisher’s LSD test revealed a statistically significant difference in scores given by students who stayed in the parks for less than 10 min (3.000) compared to those who stayed between 10 and 30 min (3.8261) (p = 0.0498).
3.7. Economic Park Functions
The categorical variable is now the frequency of visits, while the dependent variable is the score of the parks’ economic functions.
The highest average score for the economic functions of parks was given by students who visit daily and the lowest by those who visit once a month (Table 12). Post hoc analysis revealed no statistically significant differences in ratings based on the frequency of park visits.

Table 12.
Factorial ANOVA test: frequency of visits and score of parks’ economic function.
The categorical variable is now the duration of stay in the parks, while the dependent variable is the rating of the parks’ economic functions. The highest scores are given by students who stayed in the parks for 10 to 30 min and the lowest by those who had the shortest stays (Table 13).

Table 13.
One-way ANOVA test: length of stay and scores for economic functions of parks.
Post hoc analysis with Fisher’s LSD test determined that the scores do not depend on the duration of stay in the parks.
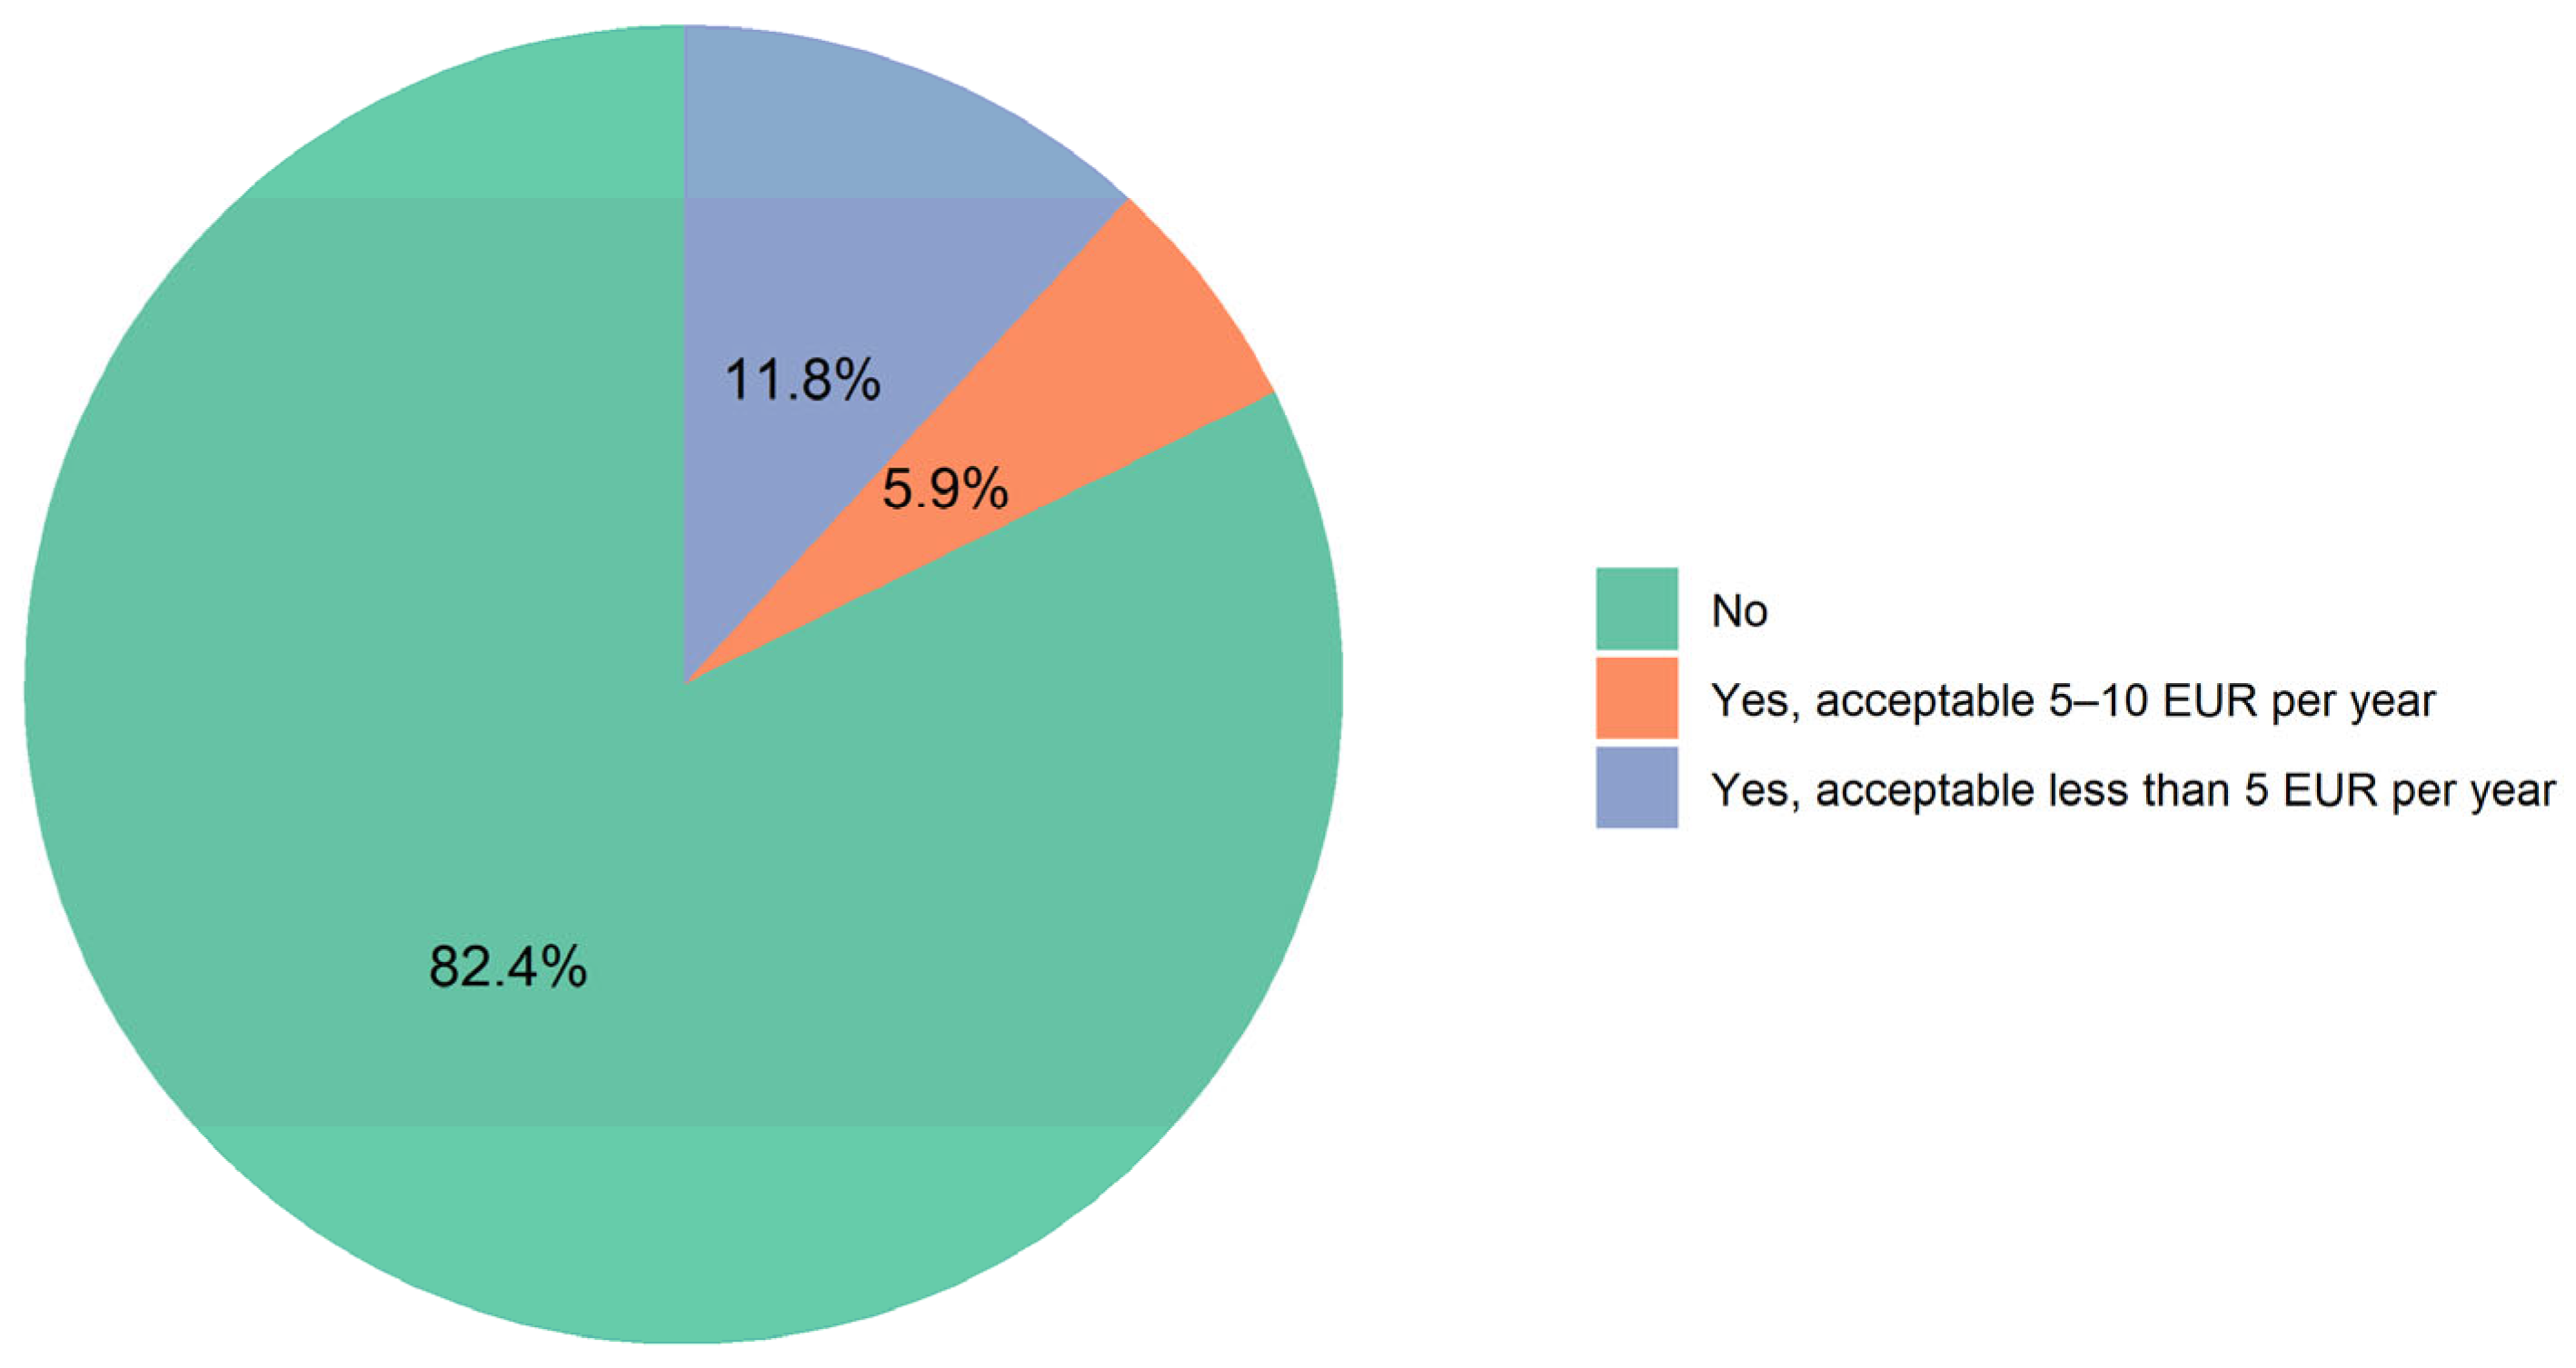
The analysis also examined respondents’ willingness to pay for park entry fees and, if so, how much they would be willing to pay on an annual basis (Figure 5). Figure 5 reveals that the vast majority of respondents (82.4%) are unwilling to pay any entrance fee for park access. A smaller group (11.8%) is willing to pay an amount less than EUR 5 per year, while 5.9% are open to paying up to EUR 10 per year.
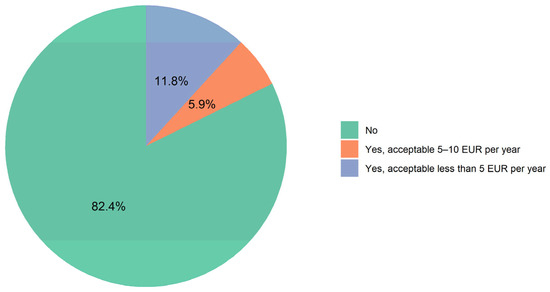
Figure 5.
Willingness to pay park entrance fees.
4. Discussion
Park functions can be assessed using a questionnaire with scores ranging from 1 to 5. The results of this study demonstrate a strong correlation between scoring and the frequency of park visits: students who visit parks more frequently tend to assign higher scores to all park functions and vice versa. In contrast, the length of stay in parks generally shows no correlation with the scoring of park functions, with the exception of the psychological function. Notably, the scoring of psychological functions is correlated with both the frequency of visits and the length of stay, whereas the scoring of all other functions is influenced solely by the frequency of visits.
The highest-ranked functions were psychological and ecological. The high ecological score is attributed to the parks’ rich biodiversity [45] and their perceived significant contribution to climate regulation and air quality improvement [55]. Another contributing factor is that landscape architecture students have practical classes in the subject of landscape ecology, conducted in Novi Sad’s parks, which may have influenced their high assessment. The high score for the psychological function is linked to the fact that the three main reasons for students’ visits—socializing, rest, and recreation [48]—strongly influence their perception of psychological benefits. Conversely, the lower score for economic functions may be due to the limited commercial activities in the parks [48,55] and their free entrance.
The aesthetic functions of parks in Novi Sad are evaluated with an average score of 3.485, reflecting a moderate level of satisfaction with their visual appeal. A more detailed analysis of aesthetic functions can be found in [56]; the researchers began by conducting a site survey of the study area, utilizing a panoramic camera (GoPro) to capture 360-degree images of the visual landscape. Using a semantic segmentation model in QGIS 3.36.2, they identified and categorized the landscape elements into four types: woodland (Wo), lawn (L), water bodies (Wa), and pavements (P). Geographic information system (GIS) tools and spatial syntax methods were then applied to analyze the composition and distribution of these visual elements, enabling an assessment of how people perceive the landscape throughout the entire study area. This can be a direction when analyzing aesthetic function in future research.
The ecological function of urban parks in Novi Sad received a score of 3.588, making it one of the highest-ranked functions, alongside psychological benefits. A more detailed analysis of this function can be conducted using the methodology outlined in [57], which evaluates the ecological performance through five key criteria: the percentage of green area (based on the park’s total and constructed areas), the presence of a pollinator garden, tree density (measured against a standard of 625 trees per hectare), the proportion of native trees (aiming for 80% native species), and the percentage of healthy trees. These metrics provide a comprehensive evaluation of the park’s ecological and biodiversity quality. Green spaces provide important corridors for biodiversity conservation, and this function can be analyzed in detail. For example, researchers have applied landscape ecology principles to design green space networks that improve connectivity, using methods like least-cost path analysis, graph theory, and the gravity model to identify potential corridors and develop networks that reduce fragmentation [58]. This aspect could potentially be a topic for future research.
The educational function of urban parks in Novi Sad received a score of 2.897, indicating a slightly below-average performance for this function. The questionnaire also explored ways to enhance the educational functions of parks. Suggestions from respondents included the integration of QR codes that provide information about park features, as well as the organization of guided tours. Additionally, some proposed hosting educational workshops and placing informational tables throughout the parks to further engage visitors and promote learning. An example from the literature [59] is similar: Korean landscape architects have embraced ecological design as a tool for environmental education in urban parks. Since the late 1990s, ecological activities have been integrated into park programs, reflecting changing attitudes toward recreation and leisure. These include wildlife monitoring, guided tours, and virtual or augmented reality experiences (particularly popular during the COVID-19 pandemic). Such programs aim to foster environmental awareness and values, aligning with the concept of ecological design as an aesthetic and educational experience.
Recreational function of urban parks in Novi Sad has a score of 3.074, and this could be further promoted in order to realize higher tourist and social value. The recreational function of urban parks in Novi Sad has been rated at 3.074, indicating room for improvement. Enhancing this function could significantly increase the parks’ tourist appeal and social value. By incorporating diverse amenities, hosting recreational events, and improving accessibility, these parks can become more attractive to both residents and visitors, boosting their role as key urban assets. Urban parks not only serve as recreational spaces for local residents but also attract visitors from outside the area, enhancing their appeal as tourist destinations and contributing to the overall attractiveness of the city [60].
The psychological function of urban parks in Novi Sad received a score of 3.603. A recent study has shown that reduced psychological distress, such as anxiety or depression, is most closely linked to proximity to neighborhood green spaces. Key characteristics of these spaces, such as accessibility, quality, and safety, play a significant role in improving mental health [61]. Enhancing these elements in the urban parks of Novi Sad could lead to improved psychological benefits for the community.
The economic function of urban parks in Novi Sad received the lowest score of 2.618. In the economic context, urban parks provide both direct and indirect benefits, primarily on a local scale. Direct benefits include job creation through park-related activities and services, as well as increased property values near green spaces [62,63]. Indirectly, parks contribute ecosystem services, such as carbon sequestration, improved air quality, and climate regulation, which lead to energy savings [63]. Respondents in this study primarily focused on direct economic benefits when assessing park functions, while indirect benefits were included in the ecological function assessment. The additional question regarding respondents’ willingness to pay for park entrance fees revealed that most participants showed little or no interest in such fees. This suggests that users generally view urban parks as public spaces meant to be freely accessible.
The functions of urban parks can also be analyzed as a whole, and multi-criteria methods, or a combination of them [64], can be efficient for this purpose. One recent study [65] uses a multi-criteria approach to assess the relationship between ecological and cultural ecosystem services (ESs) demand in urban areas. It integrates both service types using WeChat check-in data to measure ESs demand, along with MC methods.
5. Conclusions
This paper analyzes six functions of urban parks in Novi Sad: aesthetic, ecological, recreational, psychological, economic, and educational. The assessment was conducted through a questionnaire distributed among landscape architecture students at the University of Novi Sad. Overall, the parks were rated positively, with the highest scores for ecological and psychological functions, while the lowest were for economic functions. This study shows that the scoring of park functions is strongly influenced by the frequency of visits, with frequent visitors generally giving higher ratings across all functions. In contrast, the length of stay only affects the scoring of the psychological function. It is important to note that the respondents in this study were landscape architecture students, and their perspectives may differ from those of the general public or individuals without a professional background. This distinction should be considered when interpreting the results. The proposed questionnaire and scoring scale are straightforward and easily understandable to a wide audience, making them suitable for use in future studies involving diverse participant groups. The goal of this research was to better understand the functioning of parks in Novi Sad, providing an overview of their key functions and their usability. A similar procedure may be repeated for other parks worldwide to gain comparable insights.
Future studies could focus on specific functions, such as ecological functions, using various criteria and indicators. A more detailed examination could be applied to a single park, with a focus on aspects such as biodiversity, habitat preservation, threats from invasive species, and climate change, as well as issues related to connectivity and fragmentation.
Author Contributions
Conceptualization, M.L.; methodology, M.L., N.D. and M.G.; software, N.D.; validation, M.L., N.D., M.G. and K.M.R.; formal analysis, M.L.; investigation, M.L., N.D., M.G. and K.M.R.; data curation, M.L., N.D., M.G. and K.M.R.; writing—original draft preparation, M.L., N.D., M.G. and K.M.R.; writing—review and editing, M.L., N.D., M.G. and K.M.R.; visualization, M.L. and N.D.; supervision, K.M.R.; project administration, M.L.; funding acquisition, M.L. All authors have read and agreed to the published version of the manuscript.
Funding
This research was funded by the Ministry of Science, Technological Development and Innovation of the Republic of Serbia, grant number: 451-03-136/2025-03/200032.
Institutional Review Board Statement
Ethical review and approval were waived for this study in accordance with the protocol defined in the Handbook—Ethics of Scientific Research, adopted by the Science Fund of the Republic of Serbia on 10 December 2021.
Informed Consent Statement
Informed consent was obtained from all subjects involved in the study.
Data Availability Statement
All data is provided in manuscript and supplementary.
Acknowledgments
The authors acknowledge the Ministry of Science, Technological Development and Innovation of the Republic of Serbia for funding this research.
Conflicts of Interest
The authors declare no conflicts of interest.
Appendix A

Table A1.
One-way ANOVA, post hoc test: frequency of visits and scores for aesthetic functions of parks.
Table A1.
One-way ANOVA, post hoc test: frequency of visits and scores for aesthetic functions of parks.
| Frequency of Visit | {1} | {2} | {3} | {4} | {5} |
|---|---|---|---|---|---|
| Once a month | |||||
| 2–3 times per month | 0.819713 | ||||
| Once a week | 0.058547 | 0.089879 | |||
| 2–3 times per week | 0.981761 | 0.828555 | 0.048364 * | ||
| Everyday | 0.027915 * | 0.041326 * | 0.484553 | 0.023843 * | |
Note: “*” denotes p-value smaller than 0.05.
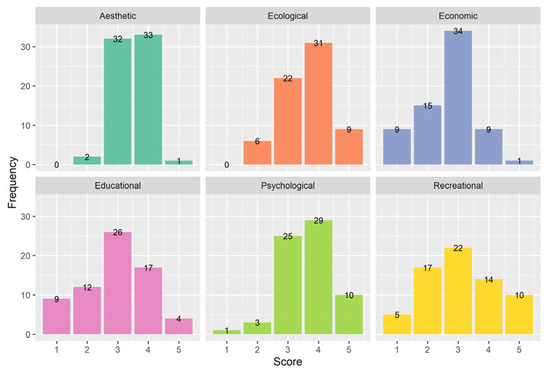
Figure A1.
Results of questionnaire—assessment of functions of urban parks in Novi Sad.
Figure A1.
Results of questionnaire—assessment of functions of urban parks in Novi Sad.
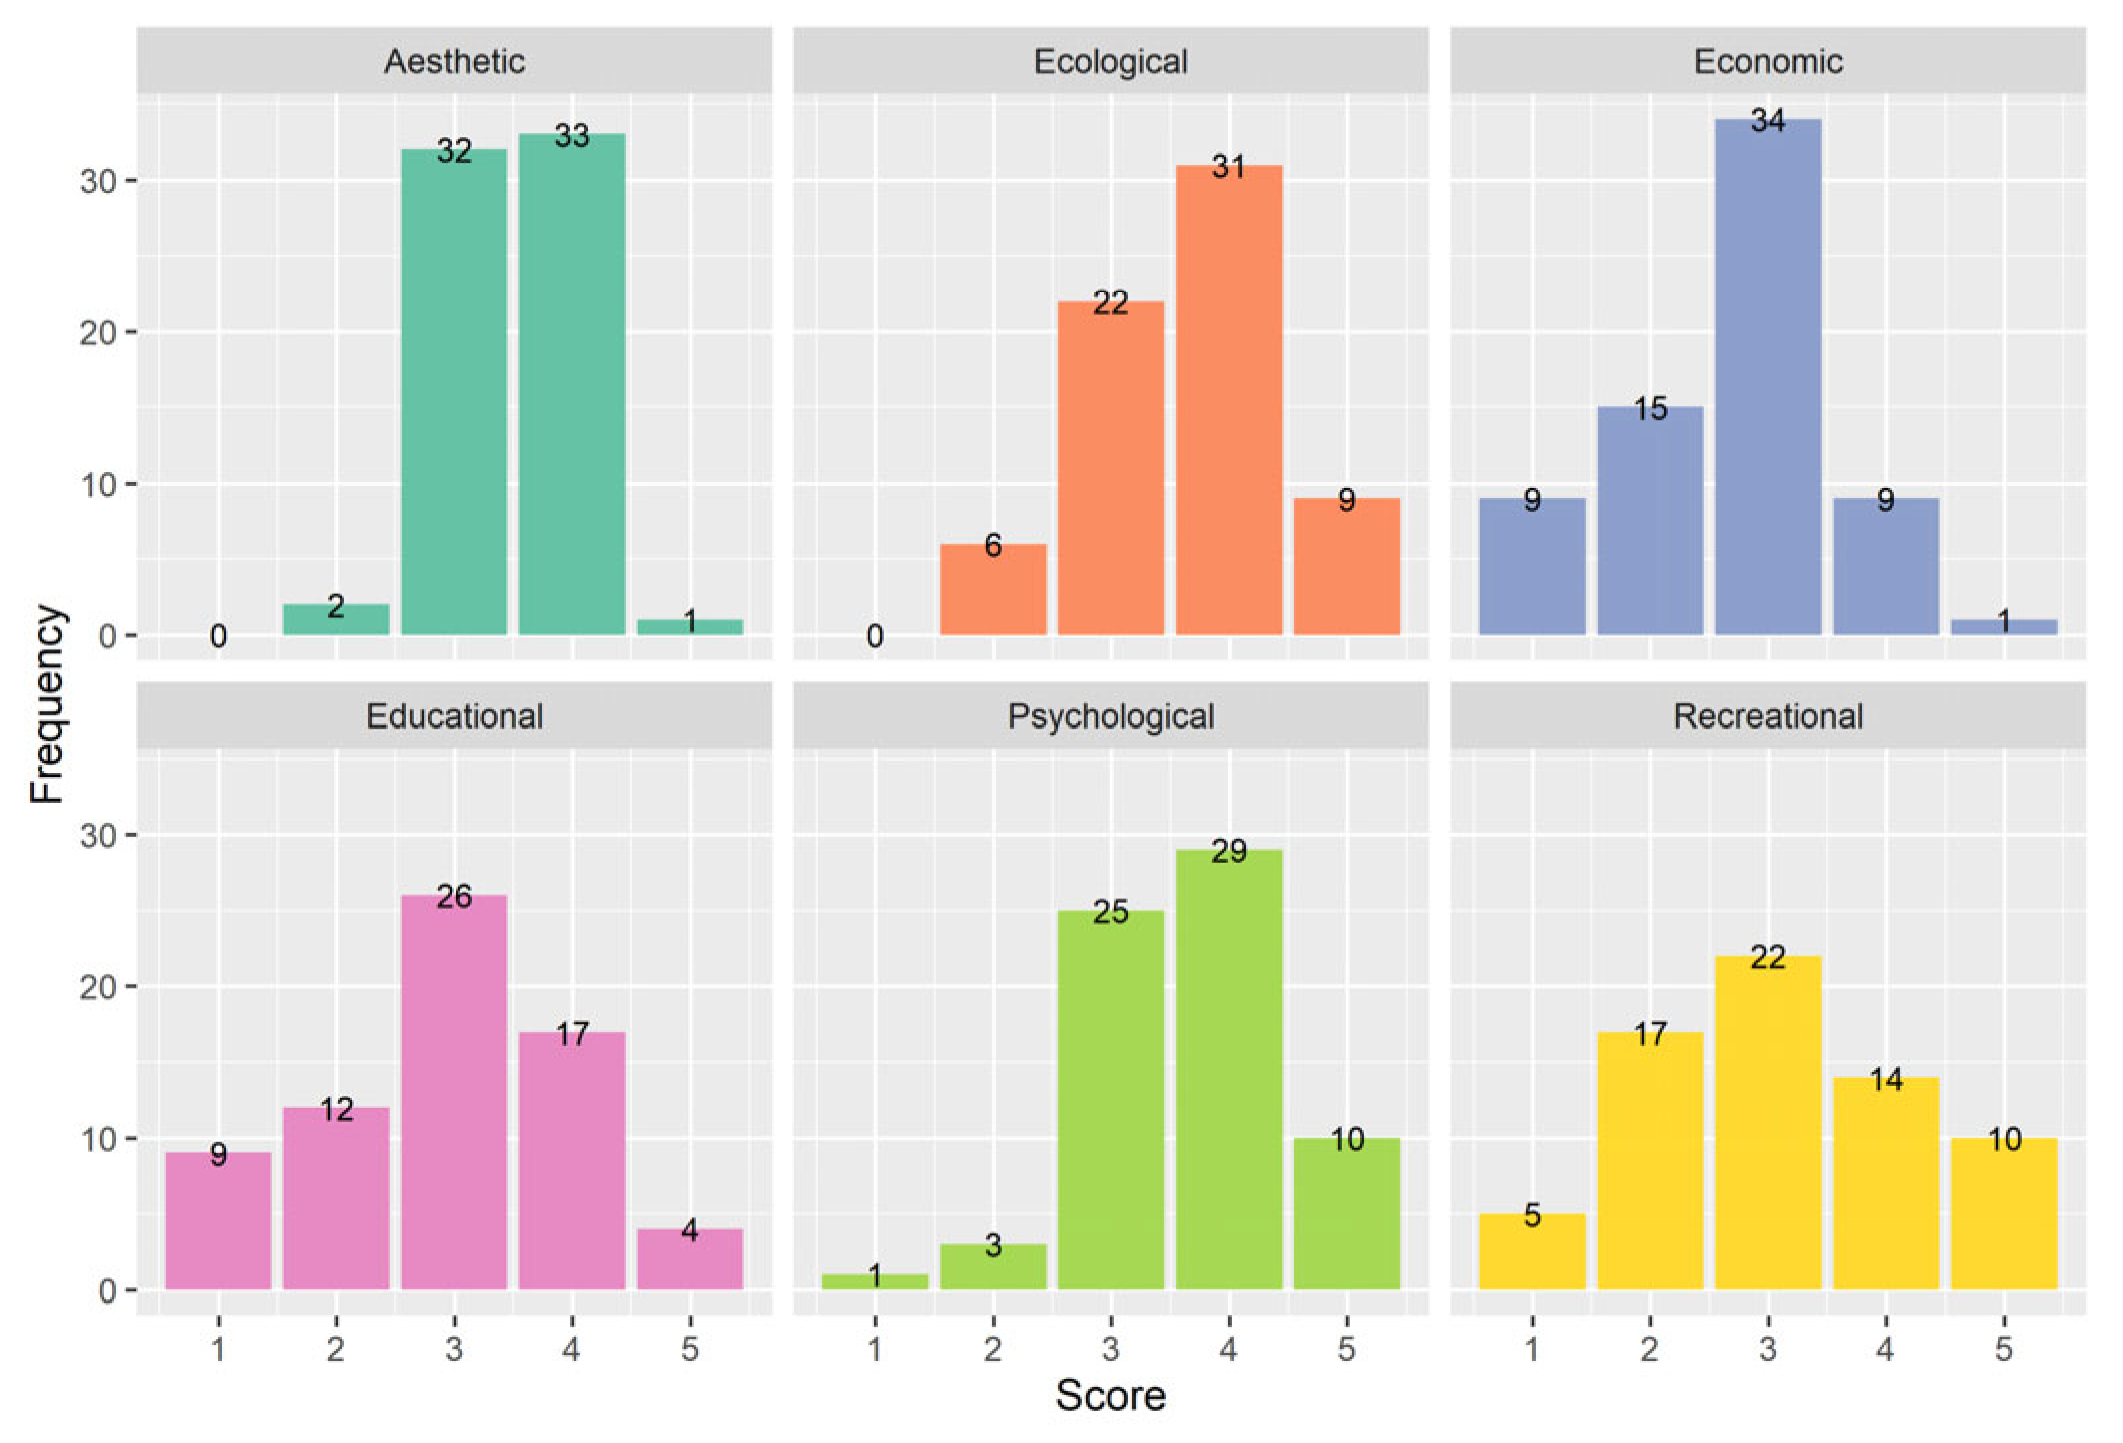
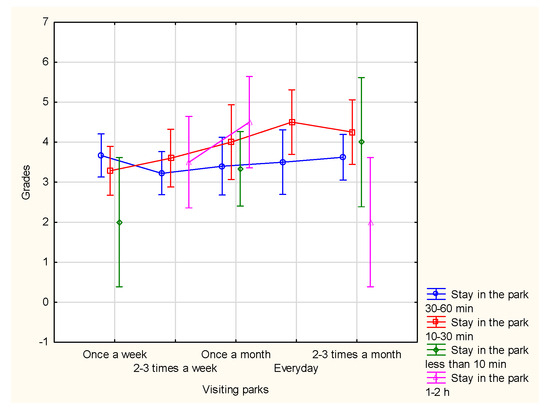
Figure A2.
Ecological functions of parks, visiting parks, F(8.52) = 1.7671, p = 0.10511.
Figure A2.
Ecological functions of parks, visiting parks, F(8.52) = 1.7671, p = 0.10511.
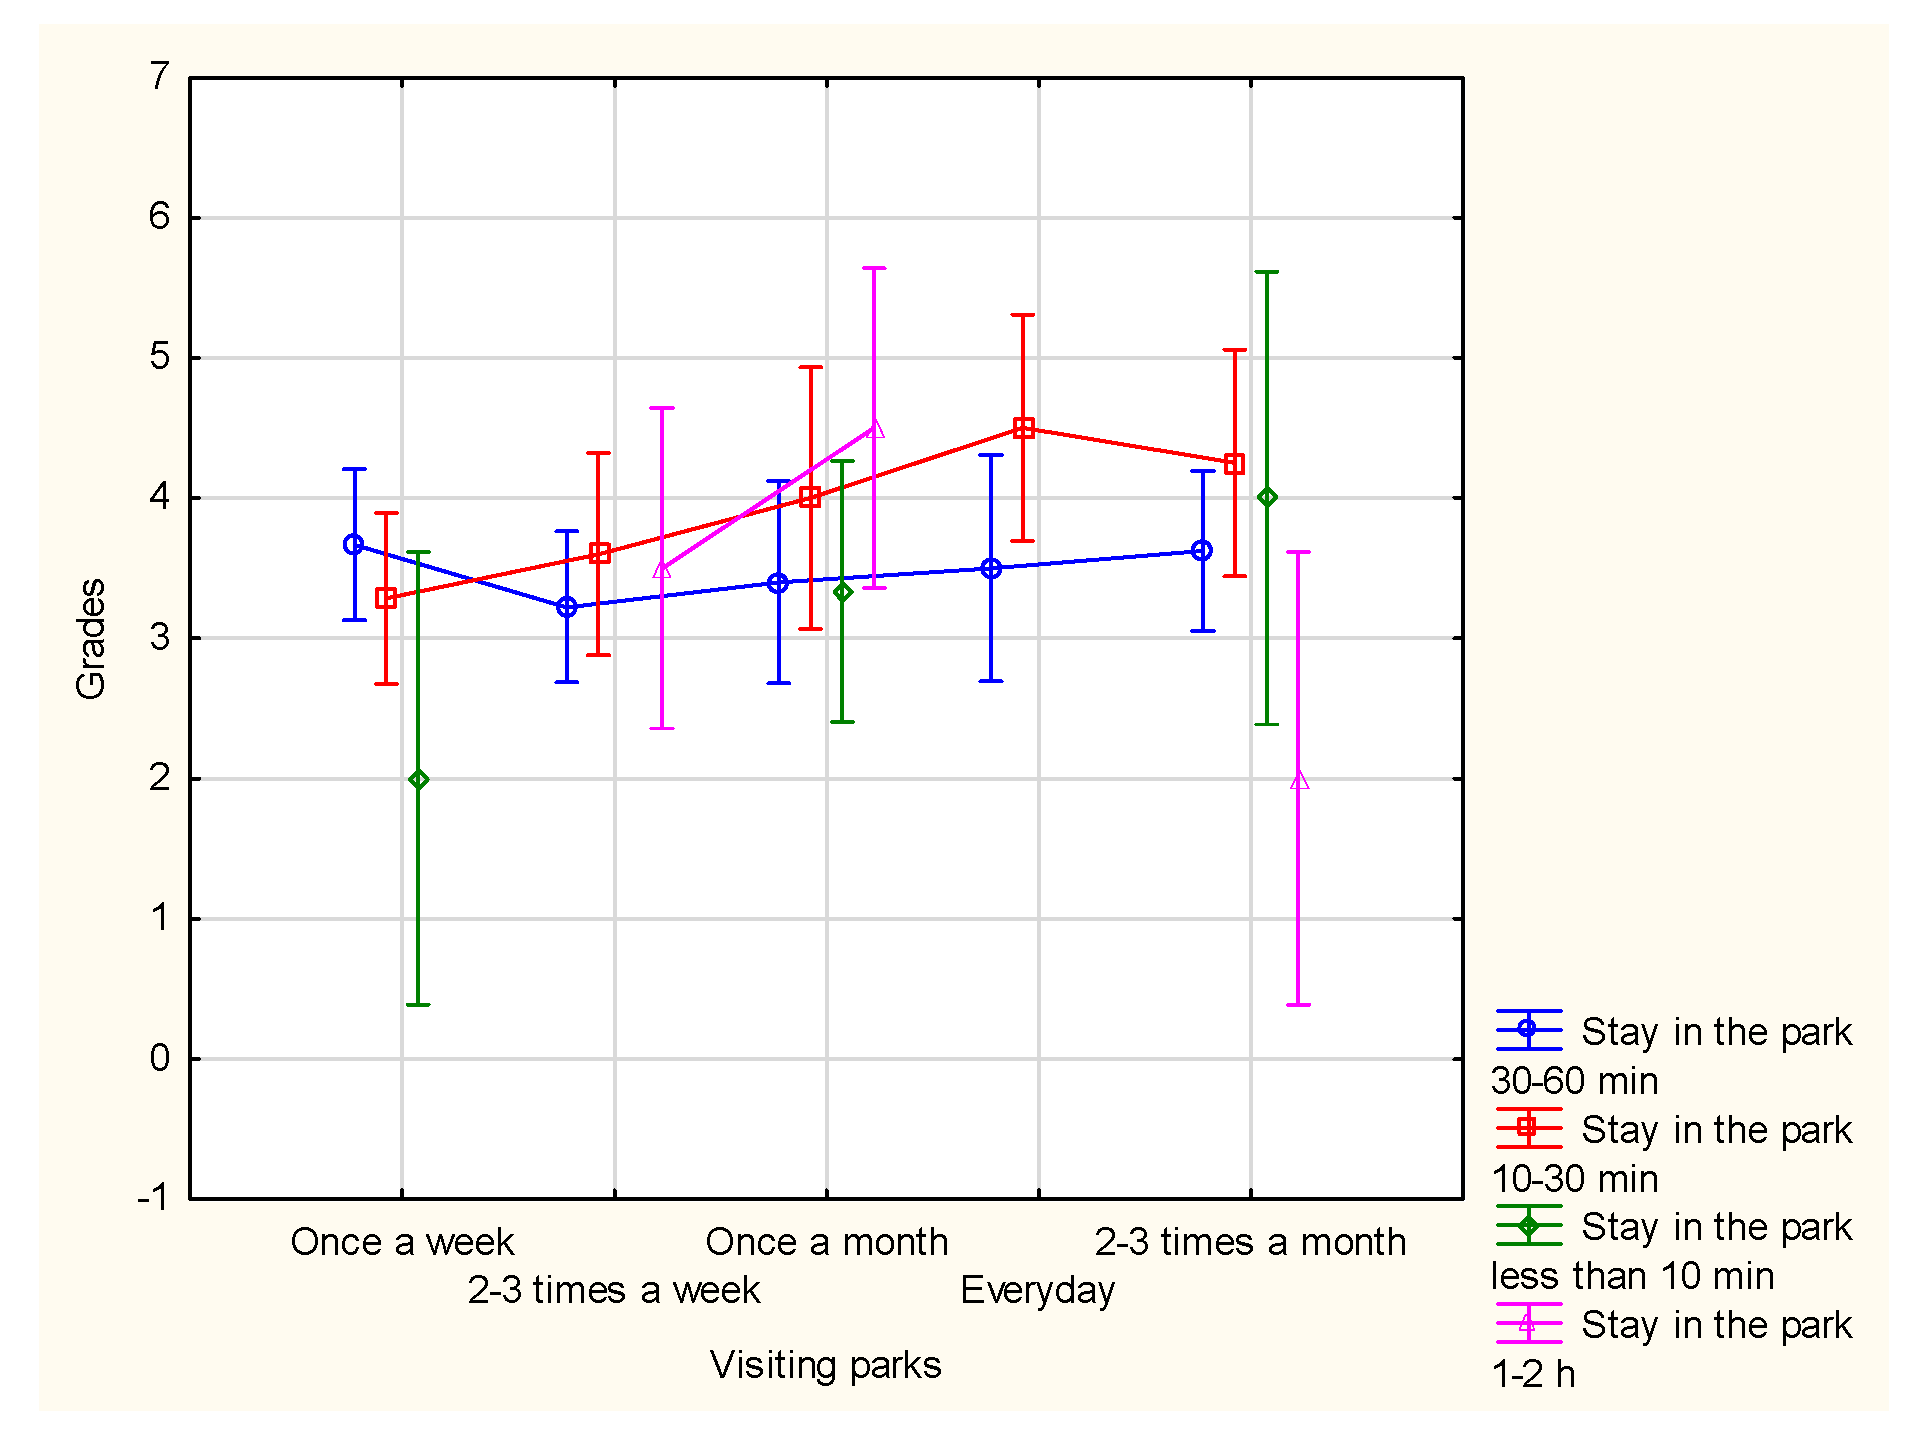
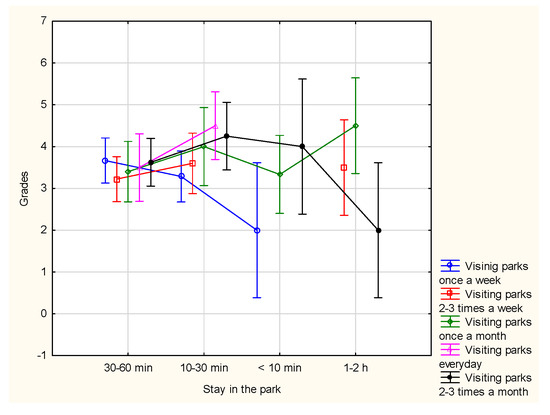
Figure A3.
Ecological functions of parks, stay in the park, F(8.52) = 1.7671, p = 0.10511.
Figure A3.
Ecological functions of parks, stay in the park, F(8.52) = 1.7671, p = 0.10511.
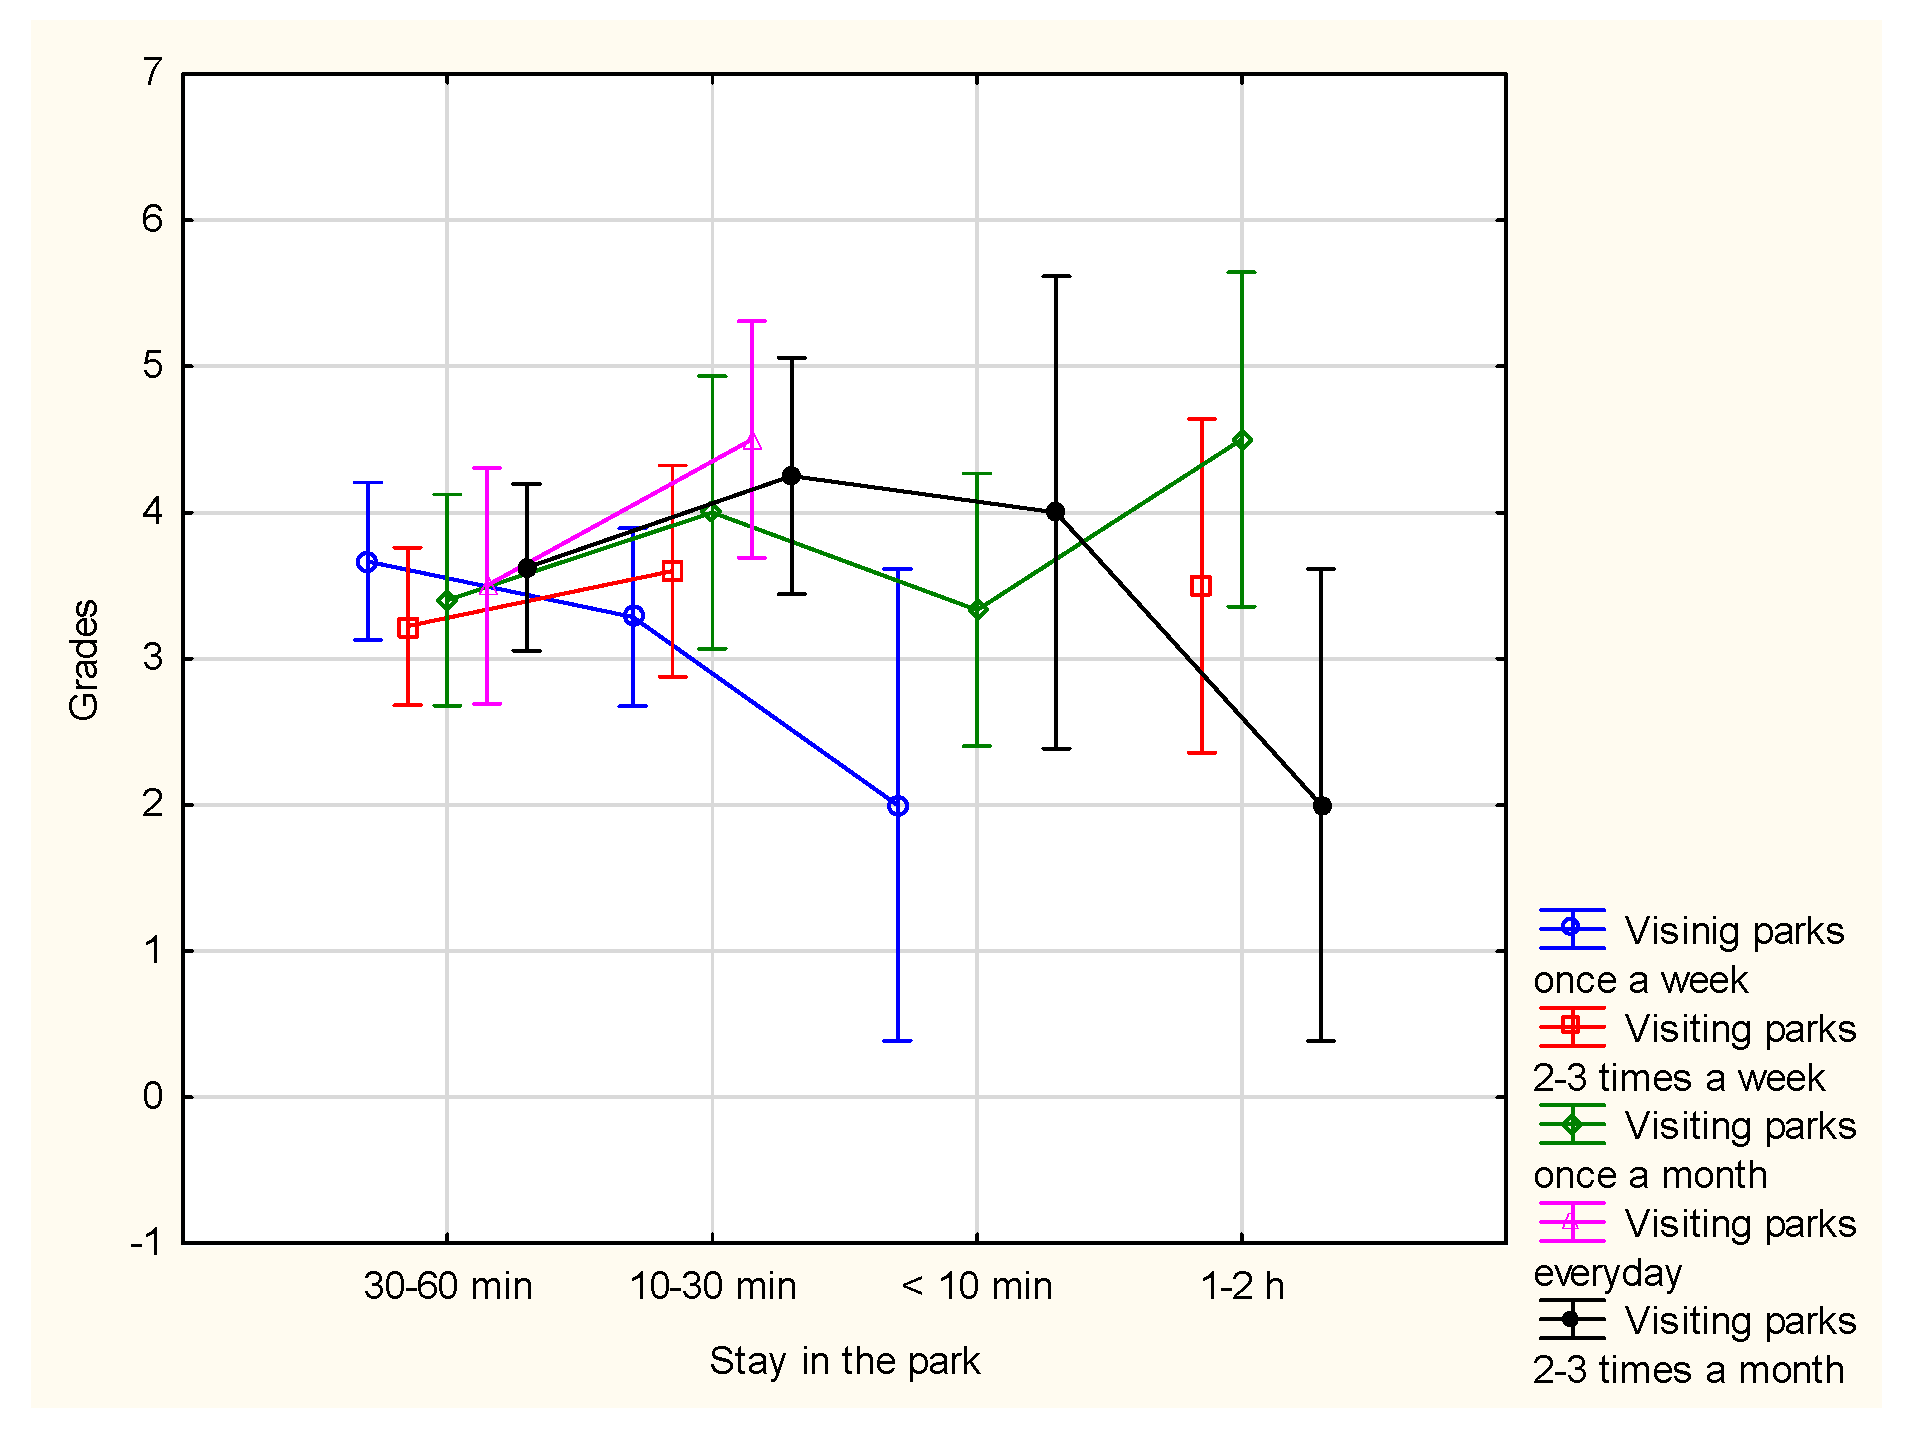
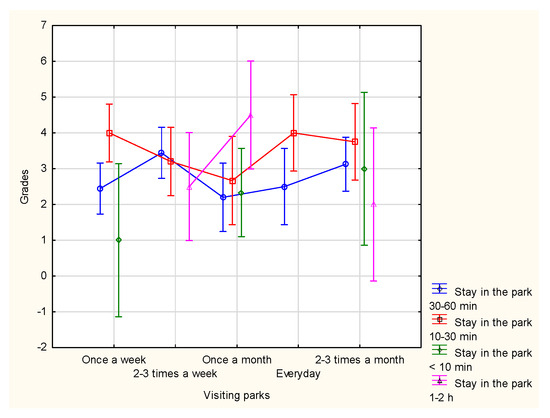
Figure A4.
Recreational functions of parks, visiting parks, , .
Figure A4.
Recreational functions of parks, visiting parks, , .
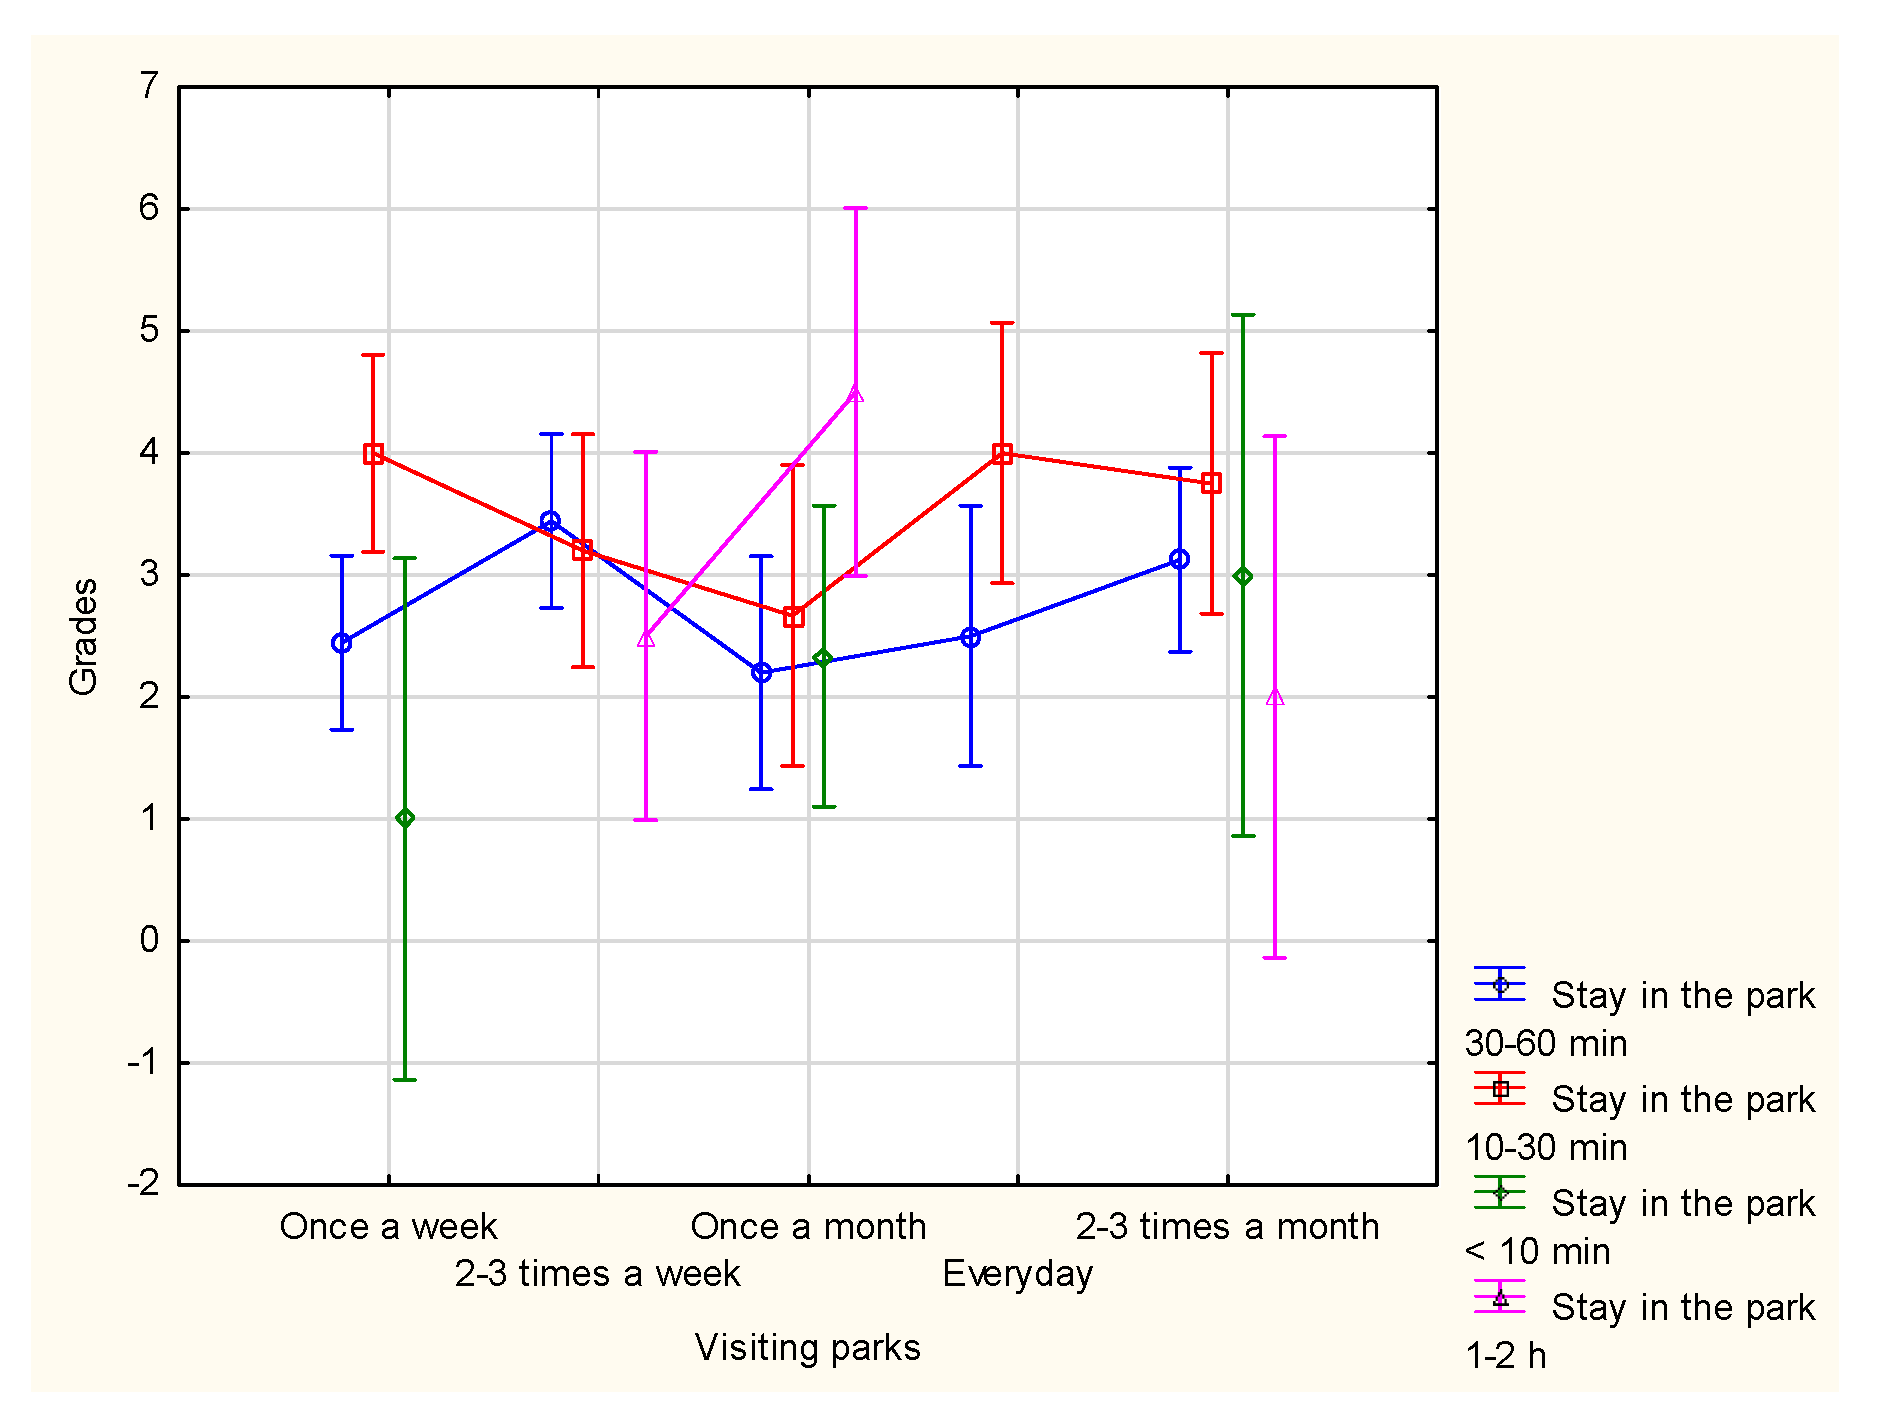
Figure A5.
Psychological functions of parks, visiting parks, , .
Figure A5.
Psychological functions of parks, visiting parks, , .
References
- Kothencz, L.; Lakatos, M.; Keresztes, D. Urban Park System Research in Hungary: A Case Study of Szombathely. Sustainability 2017, 9, 52. [Google Scholar] [CrossRef]
- Brown, G.; Kyttä, M.; Hager, T. An Evaluation of Participatory Mapping Methods to Assess Urban Park Benefits. Landsc. Urban Plan. 2018, 178, 46–56. [Google Scholar] [CrossRef]
- Chiesura, A. The Role of Urban Parks for the Sustainable City. Landsc. Urban Plan. 2004, 68, 129–138. [Google Scholar] [CrossRef]
- Moyle, B.D.; Weiler, B. Revisiting the Importance of Visitation: Public Perceptions of Park Benefits. Tour. Hosp. Res. 2016, 16, 380–393. [Google Scholar] [CrossRef]
- Larson, L.R.; Jennings, V.; Cloutier, S. Public Parks and Wellbeing in Urban Areas of the United States. PLoS ONE 2016, 11, e0153211. [Google Scholar] [CrossRef] [PubMed]
- Giedych, R.; Maksymiuk, J. Specific Features of Parks and Their Impact on Regulation and Cultural Ecosystem Services Provision in Warsaw, Poland. Sustainability 2017, 9, 792. [Google Scholar] [CrossRef]
- Wei, H.; Huang, X.; Wang, S.; Lu, J.; Li, Z.; Zhu, L. A Data-Driven Investigation on Park Visitation and Income Mixing of Visitors in New York City. Environ. Plan. B Urban Anal. City Sci. 2022, 50, 796–813. [Google Scholar] [CrossRef]
- Guan, C.; Song, J.; Keith, M.; Akiyama, Y.; Shibasaki, R.; Sato, T. Delineating Urban Park Catchment Areas Using Mobile Phone Data: A Case Study of Tokyo. Comput. Environ. Urban Syst. 2020, 81, 101474. [Google Scholar] [CrossRef]
- Jang, E.; Choi, H.B.; Kim, M. The Restorative Effects of Urban Parks on Stress Control Ability and Community Attachment. Sustainability 2024, 16, 2113. [Google Scholar] [CrossRef]
- Nadzri, A.A.M.; Hussain, M.R.M.; Tukiman, I.; Zaini, M.A.A.M.; Shazalee, N.R. Physical and Psychological Health Benefits of Urban Park in Relation to Pandemic Crises. J. Soc. Sci. Humanit. 2023, 6, 16–21. [Google Scholar] [CrossRef]
- Xie, J.; Luo, S.; Furuya, K.; Da-jiang, S. Urban Parks as Green Buffers during the COVID-19 Pandemic. Sustainability 2020, 12, 6751. [Google Scholar] [CrossRef]
- Srdjevic, B.; Srdjevic, Z.; Lakicevic, M. Urban Greening and Provisioning of Ecosystem Services within Hesitant Decision Making Framework. Urban For. Urban Green. 2019, 43, 126371. [Google Scholar] [CrossRef]
- Malik, A.; Zubair, M.; Manzoor, S.A. Valuing the Invaluable: Park Visitors’ Perceived Importance and Willingness to Pay for Urban Park Trees in Pakistan. Ecosphere 2021, 12, e3348. [Google Scholar] [CrossRef]
- Halkos, G.; Leonti, A.; Sardianou, E. Assessing the Preservation of Parks and Natural Protected Areas: A Review of Contingent Valuation Studies. Sustainability 2020, 12, 4784. [Google Scholar] [CrossRef]
- Barradas, V.L.; Miranda, J.A.; Esperón-Rodríguez, M.; Ballinas, M. (Re)designing Urban Parks to Maximize Urban Heat Island Mitigation by Natural Means. Forests 2022, 13, 1143. [Google Scholar] [CrossRef]
- Shafee, F.A.A.; Kamaruddin, S.M. The Effective Characteristics of an Urban Park through Visitors’ Perception. Case Study: KLCC Park. Built Environ. J. 2019, 16, 1–14. [Google Scholar] [CrossRef]
- Liu, H.; Li, F.; Lian-fang, X.; Han, B. The Impact of Socio-Demographic, Environmental, and Individual Factors on Urban Park Visitation in Beijing, China. J. Clean. Prod. 2017, 163, S181–S188. [Google Scholar] [CrossRef]
- McCormack, G.R.; Rock, M.; Swanson, K.; Burton, L.; Massolo, A. Physical Activity Patterns in Urban Neighbourhood Parks: Insights from a Multiple Case Study. BMC Public Health 2014, 14, 962. [Google Scholar] [CrossRef] [PubMed]
- Lakicevic, M.; Srdjevic, B. An Approach to Developing the Multicriteria Optimal Forest Management Plan: The “Fruska Gora” National Park Case Study. Land 2022, 11, 1671. [Google Scholar] [CrossRef]
- Bosch, M.v.d.; Mudu, P.; Uscila, V.; Barrdahl, M.; Kulinkina, A.V.; Staatsen, B.; Egorov, A.I. Development of an Urban Green Space Indicator and the Public Health Rationale. Scand. J. Public Health 2015, 44, 159–167. [Google Scholar] [CrossRef]
- Long, Y.; Shi, Q. Growth in Surrounding Consumer Amenities: The Economic Externality of Urban Parks. Growth Change 2021, 52, 1154–1171. [Google Scholar] [CrossRef]
- Nor, A.N.M.; Abdullah, S.A. Developing Urban Green Space Classification System Using Multi-Criteria: The Case of Kuala Lumpur City, Malaysia. J. Landsc. Ecol. 2019, 12, 16–36. [Google Scholar] [CrossRef]
- Jiang, G.; Zheng, J.; Zhang, J. Research on Sustainable Design of Urban Green Spaces. Adv. Soc. Sci. Educ. Humanit. Res. 2024, 490, 490–496. [Google Scholar] [CrossRef]
- Deng, X.; Zhou, Y.; Sun, N. Study on the Evaluation of Urban Park Landscape Pattern Index and Its Driving Mechanisms in Nanchang City. Sustainability 2024, 16, 4132. [Google Scholar] [CrossRef]
- Błaszczyk, M.; Suchocka, M.; Wojnowska-Heciak, M.; Muszyńska, M. Quality of Urban Parks in the Perception of City Residents with Mobility Difficulties. PeerJ 2020, 8, e10570. [Google Scholar] [CrossRef]
- Cheng, Y.; Zhang, J.; Wei, W.; Bing, Z. Effects of Urban Parks on Residents’ Expressed Happiness before and during the COVID-19 Pandemic. Landsc. Urban Plan. 2021, 212, 104118. [Google Scholar] [CrossRef] [PubMed]
- Enßle-Reinhardt, F.; Kabisch, N. Urban Green Spaces for the Social Interaction, Health, and Well-Being of Older People—An Integrated View of Urban Ecosystem Services and Socio-Environmental Justice. Environ. Sci. Policy 2020, 109, 36–44. [Google Scholar] [CrossRef]
- Muhlisin, M.; Iskandar, J.; Gunawan, B.; Cahyandito, M.F. Vegetation Diversity and Structure of Urban Parks in Cilegon City, Indonesia, and Local Residents’ Perception of Its Function. Biodiversitas J. Biol. Divers. 2021, 22, e220706. [Google Scholar] [CrossRef]
- Bratman, G.N.; Anderson, C.B.; Berman, M.G.; Cochran, B.; Vries, S.d.; Flanders, J.; Daily, G.C. Nature and Mental Health: An Ecosystem Service Perspective. Sci. Adv. 2019, 5, eaax0903. [Google Scholar] [CrossRef]
- Zhang, R.; Wulff, H.; Duan, Y.; Wagner, P. Associations between the Physical Environment and Park-Based Physical Activity: A Systematic Review. J. Sport Health Sci. 2019, 8, 412–421. [Google Scholar] [CrossRef]
- Seo, J.; Kim, J. Exploring the Influence of the Private Park on Spatial Equity in Urban Parks: A Case Study in Seoul, South Korea. Urban For. Urban Green. 2024, 104, 128663. [Google Scholar] [CrossRef]
- Krajter Ostoić, S.; van den Bosch, C.C.K.; Vuletić, D.; Stevanov, M.; Živojinović, I.; Mutabdžija-Bećirović, S.; Lazarević, J.; Stojanova, B.; Blagojević, D.; Stojanovska, M.; et al. Citizens’ Perception of and Satisfaction with Urban Forests and Green Space: Results from Selected Southeast European Cities. Urban For. Urban Green. 2017, 23, 93–103. [Google Scholar] [CrossRef]
- Ugolini, F.; Massetti, L.; Calaza-Martínez, P.; Cariñanos, P.; Dobbs, C.; Krajter Ostoić, S.; Marin, A.M.; Pearlmutter, D.; Saaroni, H.; Šaulienė, I.; et al. Understanding the Benefits of Public Urban Green Space: How Do Perceptions Vary between Professionals and Users? Landsc. Urban Plan. 2022, 228, 104575. [Google Scholar] [CrossRef]
- Lakicevic, M.; Srdjevic, Z.; Srdjevic, B.; Zlatic, M. Decision Making in Urban Forestry by Using Approval Voting and Multicriteria Approval Method (Case Study: Zvezdarska Forest, Belgrade, Serbia). Urban For. Urban Green. 2014, 13, 114–120. [Google Scholar] [CrossRef]
- Bruña-García, X.; Marey-Pérez, M. Participative Forest Planning: How to Obtain Knowledge. For. Syst. 2018, 27, e002. [Google Scholar] [CrossRef]
- Srdjevic, B.; Srdjevic, Z.; Reynolds, K.M.; Lakicevic, M.; Zdero, S. Using Analytic Hierarchy Process and Best–Worst Method in Group Evaluation of Urban Park Quality. Forests 2022, 13, 290. [Google Scholar] [CrossRef]
- Zavadskas, E.K.; Bausys, R.; Mazonaviciute, I. Safety Evaluation Methodology of Urban Public Parks by Multi-Criteria Decision Making. Landsc. Urban Plan. 2019, 189, 372–381. [Google Scholar] [CrossRef]
- Zhang, S.; Song, H.; Li, X.; Luo, S. Urban Parks Quality Assessment Using Multi-Dimension Indicators in Chengdu, China. Land 2024, 13, 86. [Google Scholar] [CrossRef]
- Lakicevic, M.; Srdjevic, B. Multiplicative Version of Promethee Method in Assesment of Parks in Novi Sad. Zb. Matice Srp. Za Prir. Nauk. 2017, 132, 79–86. [Google Scholar] [CrossRef]
- Esmail, A.B.; Cortinovis, C.; Suleiman, L.; Albert, C.; Geneletti, D.; Mörtberg, U. Greening Cities through Urban Planning: A Literature Review on the Uptake of Concepts and Methods in Stockholm. Urban For. Urban Green. 2022, 72, 127584. [Google Scholar] [CrossRef]
- City of Novi Sad, City Administration for Environmental Protection, GIS of green areas. Available online: https://zelenilo.com/ (accessed on 23 January 2025).
- Orlović, S.; Mladenović, E.; Čukanović, J.; Ljubojević, M.; Lakićević, M.; Hiel, K.; Pavlović, L.; Vuksanović, V.; Bajić, L.; Kovač, M. Development of a Pilot Project for the Creation of a Database for the Greenery Inventory of the City of Novi Sad; City Administration for Environmental Protection, City of Novi Sad: Novi Sad, Serbia, 2023; pp. 1–81. [Google Scholar]
- Ninić, T.J.; Nešić, L.; Lazović, R.; Kurjakov, A. Futoški park as the preserved nature heritage. Cultural-historical and ecological-landscape values of Futoški Park in Novi Sad. Letop. Naučnih Rad. 2008, 32, 102–110. [Google Scholar]
- Vasiljević, Đ.A.; Vujičić, M.D.; Stankov, U.; Dragović, N. Visitor motivation and perceived value of periurban parks-Case study of Kamenica park, Serbia. J. Outdoor Recreat. Tour. 2023, 42, 100625. [Google Scholar] [CrossRef]
- Lakicevic, M.; Reynolds, K.M.; Orlovic, S.; Kolarov, R. Measuring Dendrofloristic Diversity in Urban Parks in Novi Sad (Serbia). Trees For. People 2022, 8, 100239. [Google Scholar] [CrossRef]
- Tomić, M.C.; Todorović, R.M.; Vračarić, M. University campus as a secondary city center—A case study of Novi Sad in Serbia. In Proceedings of the International conference on Contemporary Theory and Practice in Construction, No. 14, Banja Luka, Bosnia and Herzegovina, 13–14 June 2024. [Google Scholar]
- Lakićević, M.; Orlović, S. The diversity of dendroflora of the University Park in Novi Sad. Letop. Naučnih Rad. 2022, 46, 28–34. (In Serbian) [Google Scholar]
- Lakićević, M.; Dedović, N.; Marto, M.; Reynolds, K.M. Urban Parks in Novi Sad (Serbia)—Insights from Landscape Architecture Students. Urban Sci. 2024, 8, 99. [Google Scholar] [CrossRef]
- Taber, K.S. The Use of Cronbach’s Alpha When Developing and Reporting Research Instruments in Science Education. Res. Sci. Educ. 2018, 48, 1273–1296. [Google Scholar] [CrossRef]
- Cloud Software Group, Inc. Data Science Workbench, Version 14.1 2023. Available online: http://tibco.com (accessed on 1 November 2024).
- R Core Team. R: A Language and Environment for Statistical Computing; R Foundation for Statistical Computing: Vienna, Austria, 2022; Available online: https://www.R-project.org/ (accessed on 1 December 2024).
- Lakicevic, M.; Povak, N.; Reynolds, K.M. Introduction to R for Terrestrial Ecology; Springer International Publishing: Cham, Switzerland, 2020. [Google Scholar] [CrossRef]
- Kostić, S.; Levanič, T.; Orlović, S.; Matović, B.; Stojanović, D.B. Turkey Oak (Quercus cerris L.) is More Drought Tolerant and Better Reflects Climate Variations Compared to Pedunculate Oak (Quercus robur L.) in Lowland Mixed Forests in Northwestern Serbia: A Stable Carbon Isotope Ratio (δ13C) and Radial Growth Approach. Ecol. Indic. 2022, 142, 109242. [Google Scholar] [CrossRef]
- Camisón, Á.; Sánchez Miguel, R.; Rodríguez, A.; Revilla, J.; Tardáguila, M.Á.; Hernández, D.; Lakicevic, M.; Jovellar, L.C.; Silla, F. Regeneration Dynamics of Quercus pyrenaica Willd. in the Central System (Spain). For. Ecol. Manag. 2015, 343, 42–52. [Google Scholar] [CrossRef]
- Srdjevic, B.; Lakicevic, M.; Srdjevic, Z. Fuzzy AHP Assessment of Urban Parks Quality and Importance in Novi Sad City, Serbia. Forests 2023, 14, 1227. [Google Scholar] [CrossRef]
- Jin, T.; Lu, J.; Shao, Y. Exploring the Impact of Visual and Aural Elements in Urban Parks on Human Behavior and Emotional Responses. Land 2024, 13, 1468. [Google Scholar] [CrossRef]
- González, T.; Berger, P.; Sánchez, C.N.; Mahichi, F. Sustainability of Urban Parks: Applicable Methodological Framework for a Simple Assessment. Sustainability 2023, 15, 15262. [Google Scholar] [CrossRef]
- Xiu, N.; Ignatieva, M.; van den Bosch, C.K.; Chai, Y.; Wang, F.; Cui, T.; Yang, F. A socio-ecological perspective of urban green networks: The Stockholm case. Urban Ecosyst. 2017, 20, 729–742. [Google Scholar] [CrossRef]
- Lee, M.-J. Ecological Design Strategies and Theory for Urban Parks in Seoul, 1990s–Present. Land 2021, 10, 1163. [Google Scholar] [CrossRef]
- Konijnendijk, C.C.; Annerstedt, M.; Nielsen, A.B.; Maruthaveeran, S. Benefits of Urban Parks—A Systematic Review. 2013. Available online: https://www.researchgate.net/profile/Cecil-Konijnendijk-Van-Den-Bosch/publication/267330243_Benefits_of_Urban_Parks_A_systematic_review_-_A_Report_for_IFPRA/links/544b6bae0cf2bcc9b1d51ef5/Benefits-of-Urban-Parks-A-systematic-review-A-Report-for-IFPRA.pdf (accessed on 1 December 2024).
- Delgado-Serrano, M.M.; Melichová, K.; Mac Fadden, I.; Cruz-Piedrahita, C. Perception of Green Spaces’ Role in Enhancing Mental Health and Mental Well-Being in Small and Medium-Sized Cities. Land Use Policy 2024, 139, 107087. [Google Scholar] [CrossRef]
- Park, J.; Kim, J. Economic Impacts of a Linear Urban Park on Local Businesses: The Case of Gyeongui Line Forest Park in Seoul. Landsc. Urban Plan. 2019, 181, 139–147. [Google Scholar] [CrossRef]
- Ferreira, F.; Vasconcelos, L.; Ferreira, J.C. Socio-Ecological and Economic Evaluation of Urban Parks—A Methodology Integrating and Articulating Diverse Components. J. Outdoor Recreat. Tour. 2022, 40, 100512. [Google Scholar] [CrossRef]
- Lakicevic, M.; Srdjevic, B.; Velichkov, I. Combining AHP and SMARTER in Forestry Decision Making. Balt. For. 2018, 24, 42–49. [Google Scholar]
- Li, F.; Guo, S.; Li, D.; Li, X.; Li, J.; Xie, S. A Multi-Criteria Spatial Approach for Mapping Urban Ecosystem Services Demand. Ecol. Indic. 2020, 112, 106119. [Google Scholar] [CrossRef]
Disclaimer/Publisher’s Note: The statements, opinions and data contained in all publications are solely those of the individual author(s) and contributor(s) and not of MDPI and/or the editor(s). MDPI and/or the editor(s) disclaim responsibility for any injury to people or property resulting from any ideas, methods, instructions or products referred to in the content. |
© 2025 by the authors. Licensee MDPI, Basel, Switzerland. This article is an open access article distributed under the terms and conditions of the Creative Commons Attribution (CC BY) license (https://creativecommons.org/licenses/by/4.0/).

