Article

Environmental Benefits Evaluation of a Bike-Sharing System in the Boston Area: A Longitudinal Study

1
School of Architecture and Fine Art, Dalian University of Technology, Dalian 116024, China
2
College of Engineering, City University of Hong Kong, Kowloon 999077, Hong Kong
*
Authors to whom correspondence should be addressed.
These authors contributed equally to this work.
Urban Sci. 2025, 9(5), 159; https://doi.org/10.3390/urbansci9050159
Submission received: 10 February 2025 / Revised: 29 April 2025 / Accepted: 3 May 2025 / Published: 8 May 2025

Abstract

With increasing concerns over climate change and air pollution, sustainable transportation has become a critical component of modern city planning. Bike-sharing systems have emerged as an eco-friendly alternative to motorized transport, contributing to energy conservation and emission reduction. To elaborate on bike-sharing’s contribution to urban sustainable development, this study conducts a quantitative analysis of its environmental benefits through a case study of the Bluebikes program in the Boston area, using a longitudinal dataset of 20.07 million bike trips from January 2015 to December 2024, with data between January 2020 and December 2021 excluded. A combination of Scheiner’s model and Multinomial Logit model was adopted to evaluate the substitution of Bluebikes trips, an optimized Seasonal Autoregressive Integrated Moving Average (SARIMA) model was employed to predict future usage, while energy savings were calculated by estimating reductions in gasoline and diesel consumption. The findings reveal that during the analyzed period, Bluebikes trips saved 2616.44 tons of oil equivalent and reduced CO2 and NOX emissions by 7614.96 and 16.43 tons, respectively. Furthermore, based on the historical trends, it is forecasted that the Bluebikes program will annually save an average of 723.66 tons of oil equivalent and decrease CO2 and NOX emissions by 2422.65 and 4.52 tons between 2025 and 2027. The results highlight the substantial environmental impact of Bluebikes and support policies that encourage their usage.

1. Introduction

The overreliance on motor vehicles has significantly resulted in increased fossil energy consumption and greenhouse gas emissions, posing serious challenges to urban sustainability [1]. In response, governments worldwide have prioritized the transportation industry, implementing measures to mitigate its environmental impact. Among the various interventions, bike-sharing systems have emerged as a pivotal strategy, gaining widespread popularity across various countries [2]. In the U.S., for example, where the public relies strongly on private motor vehicles, the number of bike-sharing users exceeded 40 million in 2020 [3].
Previous research has examined the dynamics and environmental impacts of bike-sharing systems across different cities and countries [4,5]. A 2014 literature review highlighted the critical role of bike-sharing in reducing car dependency and air pollution while offering a healthier transportation alternative [6]. Studies have shown that communities adopting bike-sharing systems perceive them as an effective replacement and complement to cars, particularly for short-distance commuting [7]. This shift can reduce road congestion, making urban travel more efficient [8]. Furthermore, Chen et al. (2020) leveraged OFO Curve bike data to estimate the life-cycle carbon footprint of shared bikes, demonstrating their potential to replace short-distance car trips and improve first- and last-mile connectivity to public transit, thereby enhancing the overall use of public transport [9,10].
Despite the substantial body of literature on bike-sharing systems, research quantifying their long-term environmental benefits remains limited. To address this gap, this study aims to provide a comprehensive assessment of the environmental performance of bike-sharing systems. Boston and its neighboring municipalities have been making a long-running effort to promote a bike-sharing system, one of the most effective strategies to save vehicle-related energy and reduce the corresponding greenhouse gas emissions [11]. By analyzing spatial trajectories of shared bikes on the basis of longitudinal data, this study makes two key contributions. First, it utilizes eight years of data to deliver a robust and detailed evaluation of energy savings and emissions reductions achieved through bike-sharing. Second, it predicts bike-sharing usage over the next three years and forecasts its prospective environmental advantages, providing valuable insights for policy-making.
The paper is structured in five parts. Section 2 provides a comprehensive review of existing academic studies on bike-sharing systems, focusing on their usage patterns and predictions, as well as the associated benefits. Section 3 introduces the data sources and modeling approaches used in this research. Section 4 presents and interprets the analysis results, highlighting key findings related to energy savings and emissions reductions. Section 5 concludes the paper, discussing the implications of the findings for planning policies and offering perspectives for future research in bike-sharing systems.

2. Literature Review

2.1. The Environmental Benefits of Bike-Sharing Systems

Bike-sharing, a service that provides shared access to bicycles as a green mode of transportation, has gained widespread popularity in cities worldwide. It is increasingly recognized as a crucial component of sustainable urban transport due to its significant benefits, such as reducing traffic congestion, conserving energy, mitigating air pollution, and promoting public health [12,13]. Investments in bike-sharing systems yield substantial advantages. For instance, Fishman et al. (2014) analyzed bike-sharing programs in Melbourne, Brisbane, Washington D.C., Minneapolis–Saint Paul, and London, demonstrating that these initiatives significantly reduced vehicle kilometers traveled, thereby alleviating traffic congestion [14]. Beyond transportation benefits, bike-sharing systems also contribute to economic development by saving time for users [15]. A case study in Beijing revealed that bike-sharing allows each worker to save approximately 8 min daily. When applied to American, Danish, and Japanese economic models, these time savings correspond to GDP increases of about CNY 1.20, 592.25, and 337.87 million, respectively [5].
From an environmental perspective, the production of shared bicycles, which involves raw materials like steel and rubber, can result in pollution to the environment. Additionally, underutilized or ageing shared bicycles also pose sustainability challenges [16]. However, the positive environmental effects during usage often outweigh the negative effects in the production and recycling process [17]. Furthermore, bike-sharing systems reduce fuel use and emissions. Kou and Cai (2019) [18], Kou et al. (2020) [19], and Zhang (2021) [20] proposed carbon reduction estimation models and Cheng et al. (2022) [21] adopted the life cycle assessment model to identify the transportation modes replaced by shared bikes and calculated the corresponding reduction in greenhouse gas emissions. Using the emission coefficient method, a study conducted in Shanghai reported that the bike-sharing system saved 8358 tons of petrol and decreased CO2 by 25,240 tons in 2016 [22]. Lu et al. (2022) assessed the carbon emission reduction of sharing bikes in Ningbo and revealed that the system reduced the average carbon emission by 1.97 kg per person per month [4]. Since the environmental performance of bike-sharing largely depends on the rate at which it replaces other modes of transportation [14]—particularly cars—for the short term, evaluating the system’s long-term effectiveness in reducing car usage is increasingly crucial for any given city.

2.2. The Spatiotemporal Distribution of Bike-Sharing Usage

Spatiotemporal variables play a crucial role in determining the usage patterns of shared bikes. A study conducted in Cork, a medium-sized city in Ireland, examined the dynamics of a small-scale bike-sharing scheme and highlighted how such programs offer citizens an alternative mode of transportation [23]. The distance covered while cycling is another key factor, as longer cycling distances are associated with greater reductions in emissions [24]. Moreover, variations in time significantly influence participation in bike-sharing programs. Research indicates that bicycle usage fluctuates throughout the day, peaking during morning and evening rush hours. Interestingly, the evening peak lasts longer, with riders traveling greater distances during this period [25]. Gebhart and Noland (2014) observed similar trends in Washington, DC, documenting daily and seasonal variations in the usage of bike-sharing systems, particularly distinguishing between peak and non-peak periods [26].
Accurate demand prediction for bike-sharing systems is essential for optimizing station operations and enhancing service quality. Advanced data analysis techniques have been employed to infer spatiotemporal trip patterns in bike-sharing programs. For instance, Vogel et al. (2011) applied data mining methods to identify cycling patterns using extensive operational data from bike-sharing systems [27]. Zeng et al. (2016) utilized deep learning algorithms to capture global characteristics of bike-sharing usage and improve demand prediction accuracy [28]. Furthermore, Kaspi et al. (2016) analyzed transaction data to estimate the probability and quantity of unusable bikes at stations [29].

2.3. The Prediction of Bike-Sharing’s Environmental Benefits

Recently, some research has tried to forecast the demand for shared bikes using their usage data. For instance, Cheng et al. (2023) used an Autoregressive Integrated Moving Average (ARIMA) model to encapsulate the dynamics of Divvy shared bike trips in Chicago and predict a strong seasonal usage trend [30]. Fan (2024) employed a Seasonal Autoregressive Integrated Moving Average (SARIMA) model to simulate and forecast the demand for shared bicycles in the central city of Shanghai [31]. To offer more efficient operation strategies, some studies have been making efforts to develop more accurate and integrated models. For example, Yu et al. (2022) proposed a Seasonal Autoregressive Integrated Moving Average with Long Short-Term Memory (SARIMA-LSTM) hybrid model to predict the spatiotemporal heterogeneous demand for shared bikes around rail transit stations in Xicheng District, Beijing, taking bike allocation into account in the demand prediction [32]. Wang et al. (2025) proposes a model–data dual-driven approach that integrates the classical statistical regression model as a model-driven component and the advanced deep learning model as a data-driven component. The model-driven component uses the Seasonal Autoregressive Integrated Moving Average (SARIMA) model to extract periodic patterns and seasonal variations of historical data, while the data-driven component employs an Extended Long Short-Term Memory (xLSTM) neural network to process nonlinear relationships and unexpected variations [33]. However, existing studies used short-term data to forecast the usage of shared bikes, such as 3-month data, and randomly predicted the corresponding environmental advantages [32].
Overall, prior studies have only evaluated short-term or annual environmental benefits, lacking long-term trend analysis. Meanwhile, much research focused on the emission coefficient method and life cycle assessment model, with little consideration for integrating behavior-driven models and predictive models. Building on this foundation, the current study focuses on the bike-sharing system in the Boston area. It quantitatively evaluates long-term spatiotemporal usage features and environmental benefits, while also forecasting usage patterns and environmental performance for the next three years.

3. Data and Methods

3.1. Study Area and Data Source

Boston, the capital and largest city of Massachusetts in the U.S., covered an area of approximately 125 km2 and had a population exceeding 670,000 by the end of 2020 [34]. Over the past two decades, Boston has emerged as one of the pioneering U.S. cities in promoting cycling through consistent, top-down efforts aimed at creating a bike-friendly environment throughout the metropolitan area. These efforts include initiatives such as Complete Streets, Vision Zero, and Go Boston, alongside significant investments in bicycle infrastructure, like dedicated bike lanes and dock-based shared bikes [35]. The dock-based bike-sharing system, initially called Hubway and later rebranded to Bluebikes, was launched in Boston in 2011 and subsequently expanded to neighboring municipalities, including Brookline, Cambridge, Everett, and Somerville. By December 2019, the system possessed 3800 bicycles and 393 stations across these areas. Bluebikes enables users to unlock a bike from one station and return it to any other station near their destination, making it a convenient and popular choice for various trip purposes, like commuting and leisure [36]. As an integral component of Boston’s carbon neutrality strategy, Bluebikes serves as a valuable case for assessing the environmental benefits of bike-sharing programs [37].
The Bluebikes data, including detailed trip histories and station information, are publicly accessible via the Bluebikes System Data website (https://bluebikes.com/system-data (accessed on 12 January 2025)). The trip data contain comprehensive information about each trip, including bike ID, start/end station names and IDs, and start/stop times and dates. User-related information, such as user type, gender, and birth year, is also included. The station data provide station details, including station names, geographic coordinates (latitudes and longitudes), total dock capacity, and the municipality to which each station belongs. Our research employs a dataset spanning eight years, from January 2015 to December 2024, encompassing over 20.07 million trips and 523 stations, with data from January 2020 to December 2021 excluded. The annual number of trips and stations is presented in Table 1, generally showing steady increases over the studied years.

3.2. Estimating Bluebikes’ Spatiotemporal Distributions

To assess the environmental performance of Bluebikes, it is crucial to first examine the spatiotemporal distributions of cycling trips. This analysis involved calculating trip distances, mapping station locations, and identifying temporal patterns through the following steps:
  • Bicycle network construction: Cyclable roads with administrative boundaries of the Boston area were extracted from OpenStreetMap using OSMnx. The cycling network was then constructed using the Network Analysis function in ArcGISpro (Version: 3.15);
  • Data integration: Station and trip data were geocoded and spatially joined to the constructed bicycle network in ArcGISpro, ensuring spatial alignment for subsequent analysis;
  • Trip distance calculation: Trip origin and destination coordinates were defined separately as (Olon, Olat) and (Dlon, Dlat). The nearest points on the cycling network for these coordinates were identified, and the shortest paths for cycling trips were computed using Dijkstra’s algorithm in ArcGISpro;
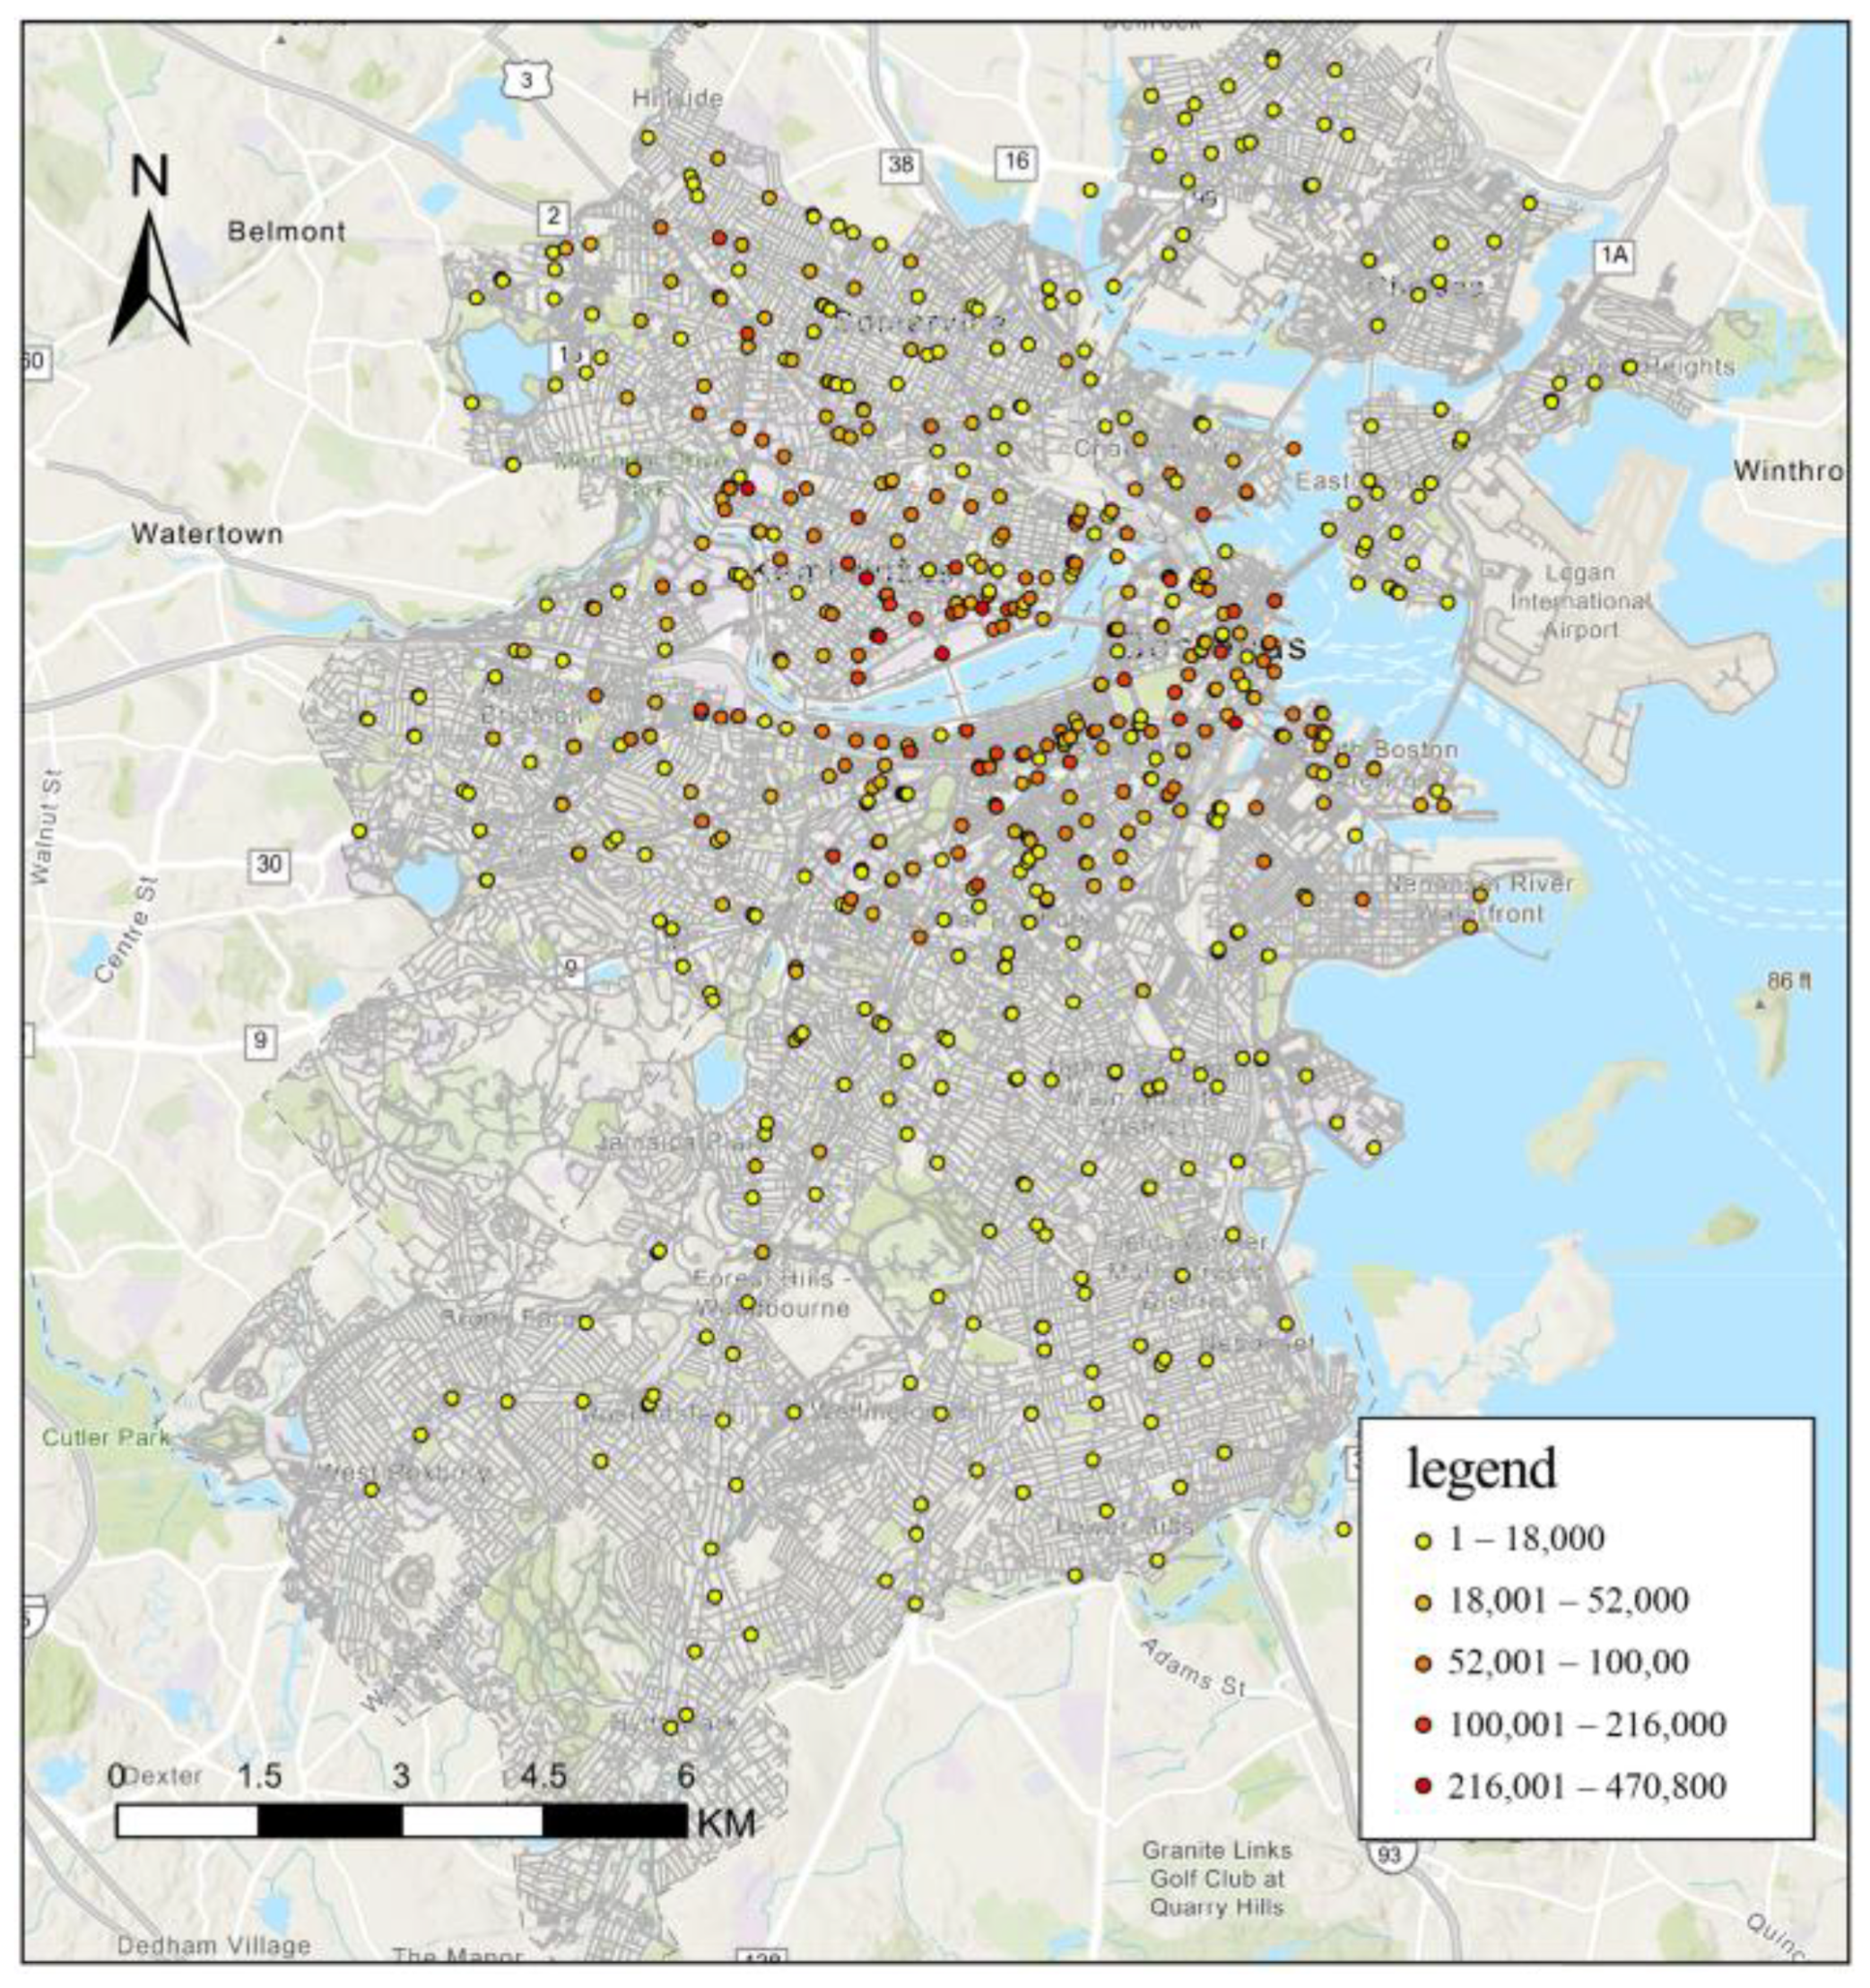
  • Station distribution visualization: The number of rented/returned bicycles at each station was calculated and visualized using point features with graduated symbols and color coding to represent usage intensity. This step was also conducted in ArcGISpro;
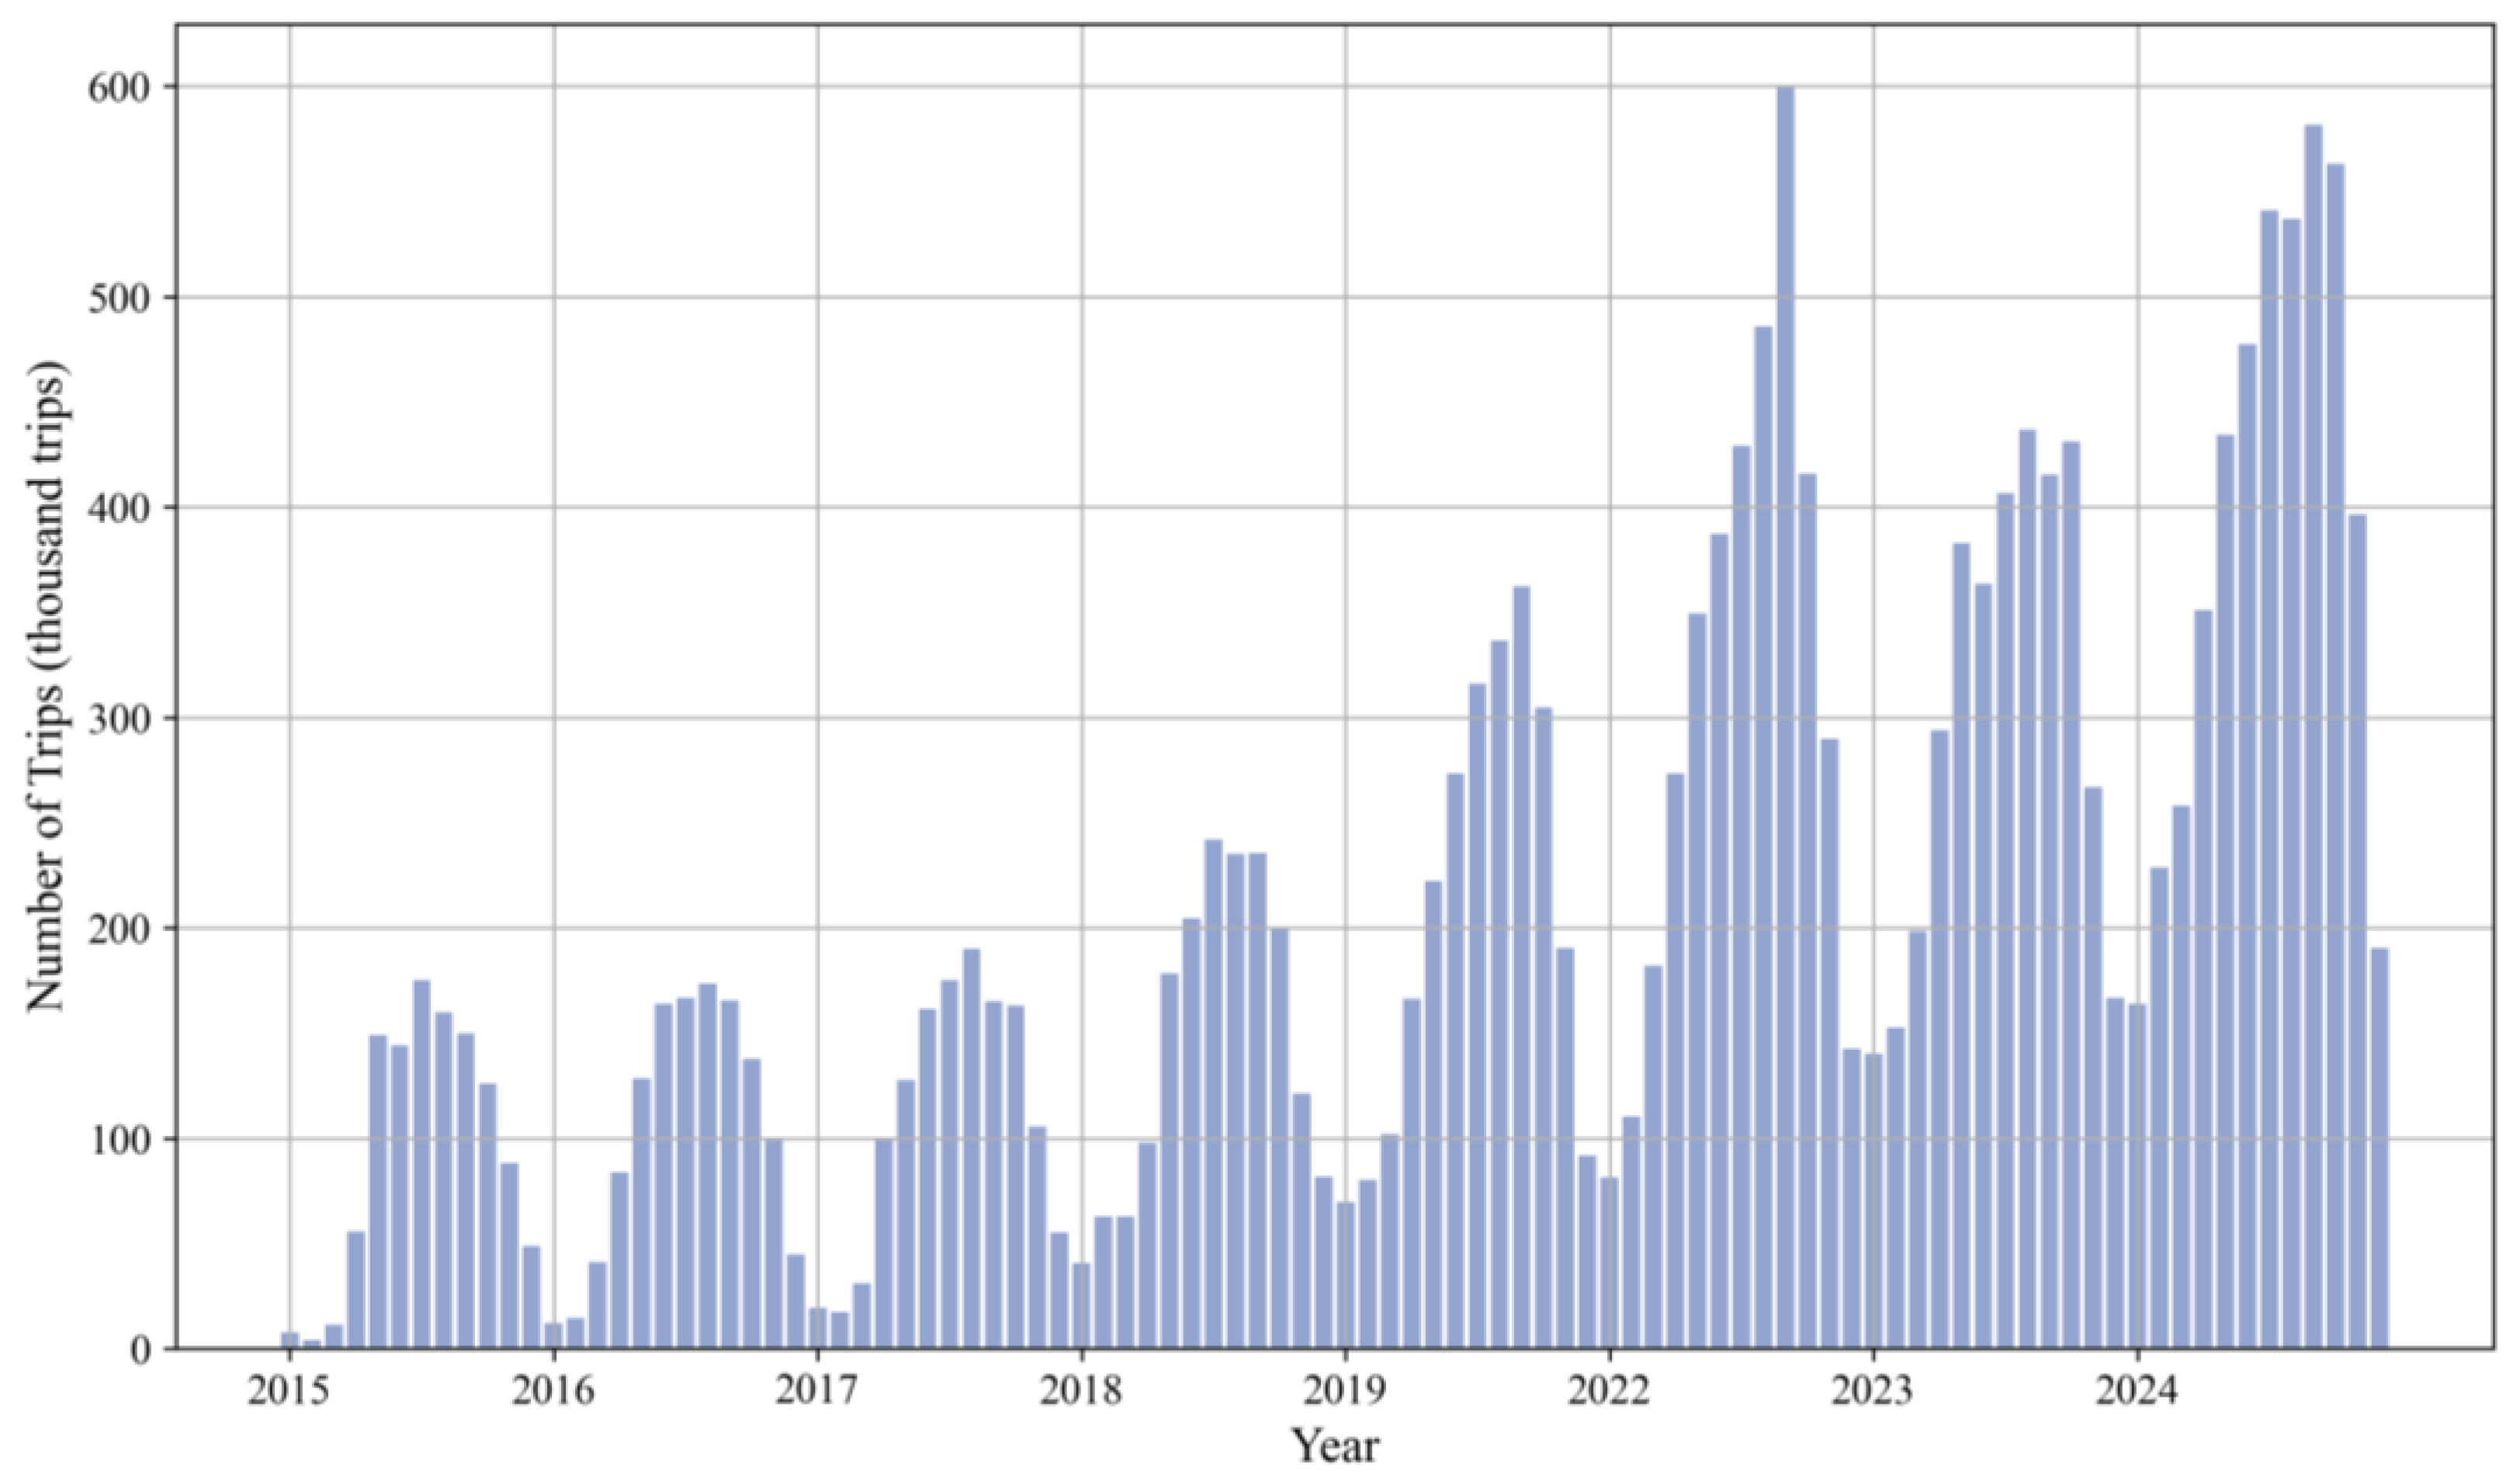
  • Temporal pattern analysis: The trip data were imported into PyCharm (Version: 23.4), with start and end times converted into datetime format. Time information was extracted to calculate the number of trips per hour, day, and month. The temporal distribution of Bluebikes trips was visualized using the matplotlib library.

3.3. Evaluating Environment Benefits

3.3.1. Modal Substitution

(1) Description of transport mode shares in the Boston Area
According to the Go Boston 2030 [38], the proportions of walking, cycling, public transit, private cars, and carpooling were separately 14.0%, 6.0%, 20.0%, 54.0%, and 6.0% in 2014. By converting these proportions, the estimated annual traffic volumes for walking, public transit, and private cars are approximately 137.89 million, 196.99 million, and 531.85 million.
(2) Modal substitution
To accurately calculate the substitution rates of different transport modes, this study drew on the travel mode selection patterns of Boston residents in 2014 [38], combined with the relevant coefficients revealed by Scheiner (2010) [39] and Tang and Zhou (2024) [40]. Accordingly, short-distance travel (<1.60 km) primarily relies on walking and shared bicycles, buses, and subways dominate medium-distance travel (1.60–8.00 km), while private cars are more commonly used long-distance travel (>8.00 km). Based on the mode choice pattern, we hypothesized coefficients for each transportation mode. To improve data accuracy, cycling trips exceeding 1.0 h were excluded from the calculations.
The Multinomial Logit model, which can effectively simulate the choice between multiple transportation modes [41,42], was used to capture the substitution between Bluebikes and other modes through the following equation:
U = β 0 + β 1 · t + β 2 · c s + β 3 · c v + β 4 · d
where U represents the utility or attractiveness of a transportation mode; t (unit: h) represents the average travel time for the transportation mode; cs is the fare or fuel cost; cv is convenience, including frequency, ease of use, and coverage; d (unit: km) represents the travel distance; β0 is the intercept; β1, β2, β3, β4 are the coefficients that represent the strength of the influence of each respective variable (t, cs, cv, d) on the dependent variable.
In a Multinomial Logit model, the probability of choosing each mode of transportation is derived by calculating the utility value of each mode of transportation. The final results are shown in Table 2.
The choice probability is calculated by the formula:
P mode   = exp U mode   all e x p U mode  
where Pmode is the probability of choosing a transportation mode; Umode is the utility of the specific mode.

3.3.2. Energy Saving and Emission Reduction

We evaluated the environmental performance of Bluebikes by quantifying the usage of gasoline and diesel due to the shift in bike-sharing trips to bus, car, and subway trips.
The amount of energy a bus/car consumes is calculated as follows:
C = d p 1 ρ 1 λ e 1 λ t 1 d p 2 ρ 2 λ e 2 λ t 2 ,
where C (unit: kg) represents the energy a bus/car consumes; d (unit: km) represents the trip distance a bus/car traveled; p (unit: L/km) denotes the fuel consumption per unit of travel distance for a bus/car, with p1 and p2 referring to the diesel and gasoline consumption per unit of travel distance for a bus and a car, respectively; ρ (unit: kg/L) represents the fuel density, where ρ1 and ρ2 refer to the density of diesel and gasoline, respectively; λe1 and λt1 indicate the efficiency of diesel extraction and transportation, and λe2 and λt2 represent the efficiency of gasoline extraction and transportation.
The amount of greenhouse gas emissions generated by the fuel consumption of a bus/car is calculated using Equation (4).
E = d · p 1 · ρ 1 · f i d · p 2 · ρ 2 · f i
where E represents the amount of CO2 and NOX emissions generated by gasoline and diesel consumption for a bus/car; fi denotes the emission factor of CO2 and NOX.
Considering that travel behavior is affected by factors like social culture and population preference, we set the thresholds for the above parameters based on findings from previous studies [37,40,41,42,43,44,45,46] focused on U.S. cities, see Table 3.
The energy consumption of the subway is calculated as follows:
C s = d · η
where CS (unit: kWh) represents the energy a subway consumes; d (unit: km) represents the trip distance a subway traveled; p (unit: kWh/(person·km)) denotes the energy consumption per person per kilometer.
Since the subway is powered by electricity, its emissions are based on the carbon intensity of the power source and the pollution emission factor. The calculation formula is as follows,
E s = d · η · f i
where ES represents the energy consumption emissions of a subway; η represents the total energy consumption per unit per person (kWh/km); fi represents the emission factor of CO2 (kg/kWh) and the NOX emission factor of the power grid (g/kWh).
According to the MBTA’s report, titled Energy and Emissions Tracking for Rapid Transit Vehicles, the average energy consumption of a Boston subway train is approximately 24.89 kWh per subway kilometer. The Red Line trains have a rated passenger capacity of 252, while the Orange Line trains have a slightly lower capacity of approximately 205. Based on U.S. Environmental Protection Agency data, the Massachusetts state’s average grid emission factors are 0.349 kg of carbon dioxide (CO2) per kWh and 0.206 g of nitrogen oxides (NOX) per kWh, see Table 3 [43,44,45,46,47,48,49,50,51].

3.4. Predicting 3-Year Potential Usage and Environmental Impacts

To predict the potential usage of Bluebikes over the next three years and the corresponding environmental impacts, an optimized Seasonal Autoregressive Integrated Moving Average (SARIMA) model was employed. SARIMA, a widely used time series forecasting method, is well-suited for analyzing data with long-term trends and periodic fluctuations. Three key steps were implemented to improve the model’s performance as follows:
  • Localized emission factors (CO2: 0.349 kg/kWh, NOX: 0.206 g/kWh) were integrated to quantify Boston-specific emission reductions precisely;
  • Data refinement: A 99.9th percentile threshold was applied to exclude trip durations exceeding 1.0 h, with missing values addressed through linear interpolation;
  • Weekly cyclicity integration via explicit seasonal decomposition (s = 168 h, corresponding to 7-day cycles) to better capture Boston’s cycling patterns.
The enhanced SARIMA model demonstrated a 12.7% reduction in Mean Absolute Error compared to the baseline configuration. Eight-year longitudinal Bluebikes’ trip data from 2015 to 2024 (excluding 2020 and 2021) were used to train and validate the model. An 80.0%/20.0% temporal split was then applied to the remaining data to evaluate out-of-sample model performance. Seasonal parameters were strategically configured with dual periodicities: 12 months for annual trends and 24 h for daily fluctuations, synergistically combined with the weekly cycle parameter to effectively capture long-term trends, multi-scale seasonality, and random variations. Implemented using the statsmodels library in PyCharm, the optimized model provides a reliable foundation for forecasting the number of cycling trips and estimating the resulting energy savings and greenhouse gas emission reductions. Residual diagnostics confirmed that model residuals were approximately normally distributed with minimal autocorrelation, indicating a good model fit. Additionally, 95% confidence prediction intervals were generated to capture forecast uncertainty and provide a robust basis for evaluating environmental benefits.

4. Results and Discussion

4.1. The Spatiotemporal Characteristics of Bluebikes

Figure 1 illustrates the distribution of 480 bike-sharing stations across the Boston area from 2015 to 2024, showing the volume of bicycles rented and returned. Stations are densely concentrated in downtown Boston and along the Charles River, serving as key hubs for commerce and tourism. High-activity stations, marked by red dots, are predominantly located in central Boston and Cambridge, indicating the popularity of bike-sharing in areas like downtown, university neighborhoods near Harvard University and Massachusetts Institute of Technology, and busy commuting corridors. This distribution highlights the system’s role in facilitating short-distance trips and supplementing public transit. Notably, stations near Boston’s subway system experience higher usage rates, likely due to their function as convenient connections to public transportation.
As depicted in Figure 2, most bike-sharing trips are short, with durations ranging from 5.0 to 15.0 min. Trip frequency declines as duration increases, with rides exceeding 30.0 min being rare. Similarly, most cycling distances fall between 1.0 and 3.0 km, with trips over 5.0 km being uncommon. These patterns suggest that the Bluebikes are primarily used for short and fast trips within the area. Longer distance trips, which require more time and physical exertion, are less frequent, possibly due to considerations such as comfort, speed, and cost. Additionally, the average cycling time per trip increased slightly, from 14.67 min in 2015 to 15.22 min in 2024, while annual cycling times rose dramatically from 2017 to 2024 (see Table 4), reflecting a sharp surge in the overall usage of the Bluebikes service.
The number of Bluebikes trips increased year-over-year from 2015 to 2024, with usage peaking during the summer months (June to September) and dropping significantly in the winter, especially in January and February, due to adverse weather conditions like low temperature, freezing, and snowfall. Peak usage months varied across years, with the highest number of trips occurring in July (2015, 2018, and 2023), August (2016 and 2017), and September (2019, 2022, and 2024). Similarly, the lowest usage months also fluctuated, with February having the fewest trips in 2015 and 2017, January in 2016, 2018, 2019, and 2024, and March in 2022 and 2023, as shown in Figure 3.
Figure 4 shows the hourly distributions of Bluebikes trips throughout the day in the Boston area. Weekday usage follows a consistent pattern, with a morning peak from 8:00 to 9:00 and an afternoon peak from 16:00 to 18:00. These peaks indicate the use of bike-sharing as a commuting tool. The morning peak is typically shorter, indicating focused commuting activity, whereas the afternoon peak is longer, suggesting users engage in a wider variety of activities after work. Additionally, a smaller midday peak, occurring between 12:00 and 14:00, is likely related to lunchtime trips for errands or food purchases. Weekend usage patterns differ markedly. Activity increases significantly between 10:00 and 16:00, aligning with findings from previous studies by Nosal and Miranda-Moreno (2014) [52], which indicate that bike-sharing is predominantly used for leisure-related activities on weekends. This distinction between weekday and weekend patterns highlights the diverse roles bike-sharing plays in urban mobility, serving both functional and recreational purposes.

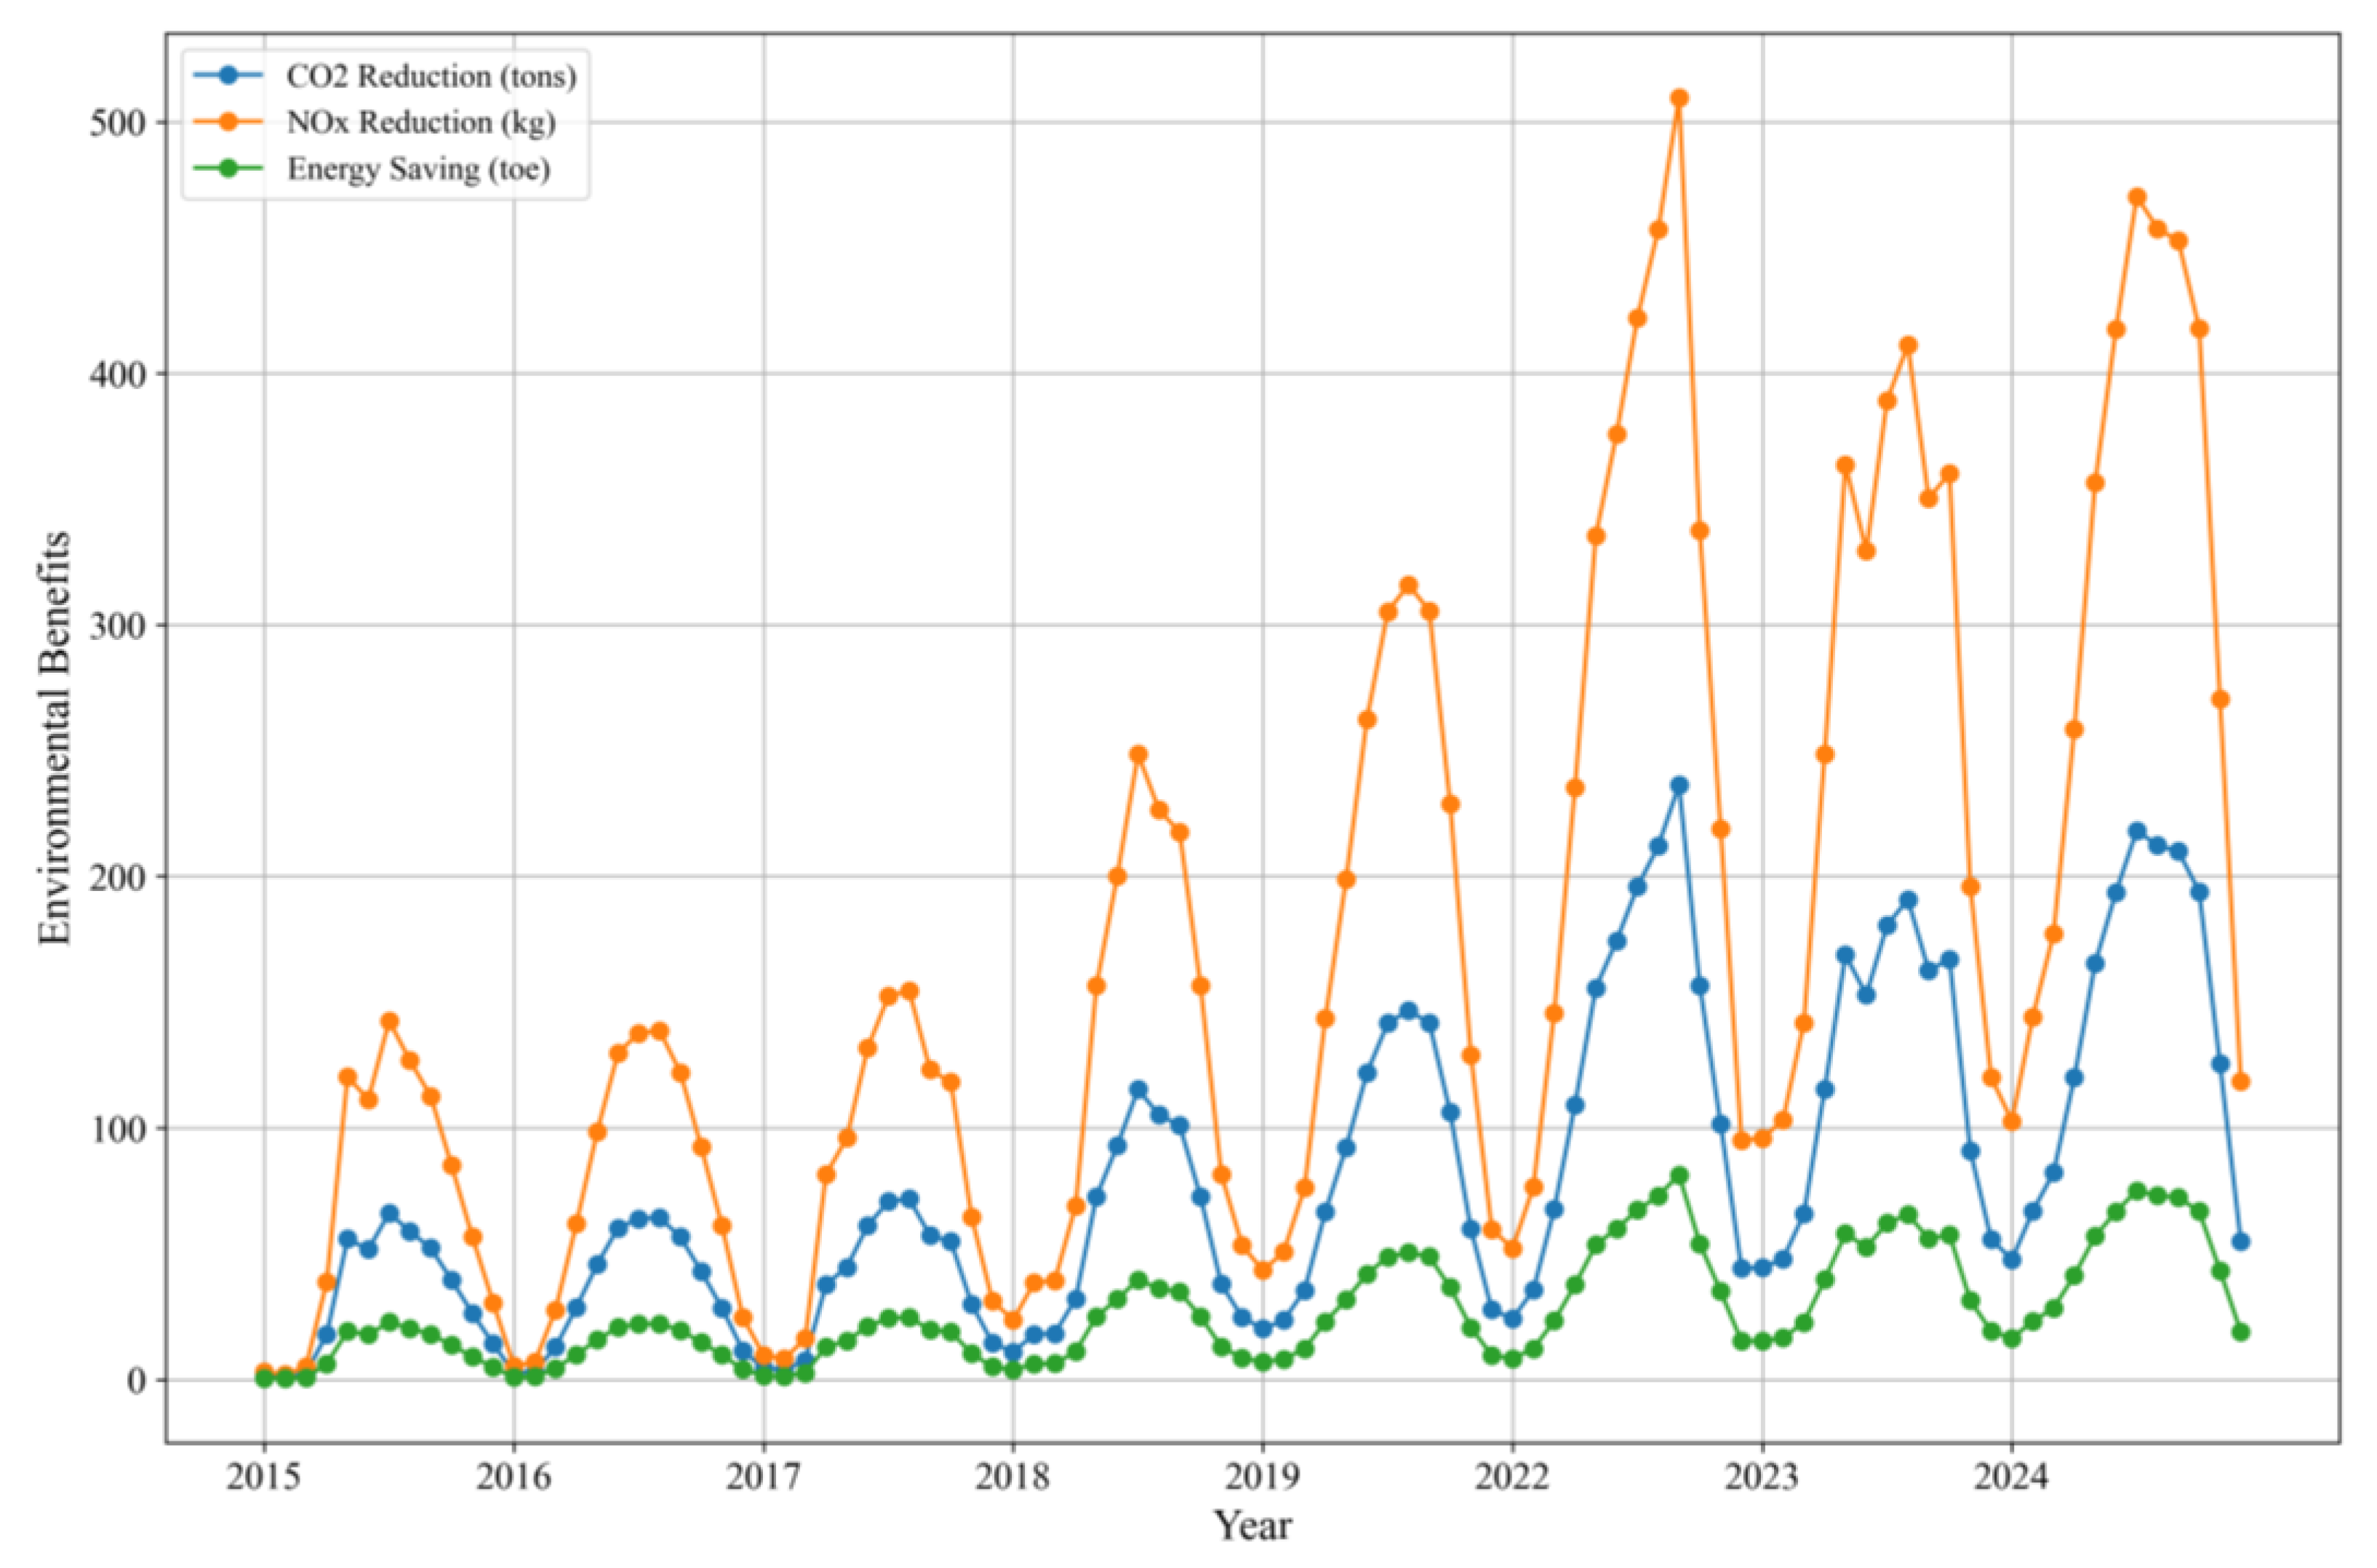
4.2. The Environmental Benefits of Bluebikes

Figure 5 illustrates the monthly distribution of the environmental advantages of Bluebikes in the Boston area between 2015 and 2024. Over the years, Bluebikes have made substantial contributions to energy savings and emissions reductions. In 2015, Bluebikes saved 133.57 tons of oil equivalent and reduced CO2 and NOX emissions by 388.22 and 0.84 tons, respectively. This level of environmental performance remained constant throughout 2016 and 2017. However, starting in 2018, there was a noticeable and consistent improvement. The annual oil equivalent savings grew steadily, increasing from 241.49 tons in 2018 to 582.41 tons in 2024. Similarly, reductions in CO2 and NOX emissions also followed an upward trend, from 703.25 and 1.49 tons in 2018 to 1694.25 and 3.66 tons in 2024. In addition, significant monthly variations in environmental advantages were evident throughout the studied period. Peak environmental benefits were observed in July during 2015, 2018, and 2024; in August during 2016, 2017, 2019, and 2023; and in September during 2022. Conversely, the lowest performance months varied, occurring in February during 2015 and 2017, and in January during the studied years.
Figure 6 depicts the hourly distribution of the environmental performance of Bluebikes in the Boston area from 2015 to 2024. The environmental advantages of Bluebikes are particularly pronounced during weekday peak commuting hours. Over this period, Bluebikes usage contributed to a cumulative saving of 2616.44 tons of oil equivalent and reductions of 7614.96 and 16.43 tons of CO2 and NOX, respectively. Specifically, during the evening peak at 18:00, Bluebikes saved 212.25 tons of oil equivalent and separately reduced CO2 and NOX emissions by 617.71 and 1.33 tons. These temporal fluctuations emphasize the critical role of usage patterns in shaping the environmental impact of Bluebikes.

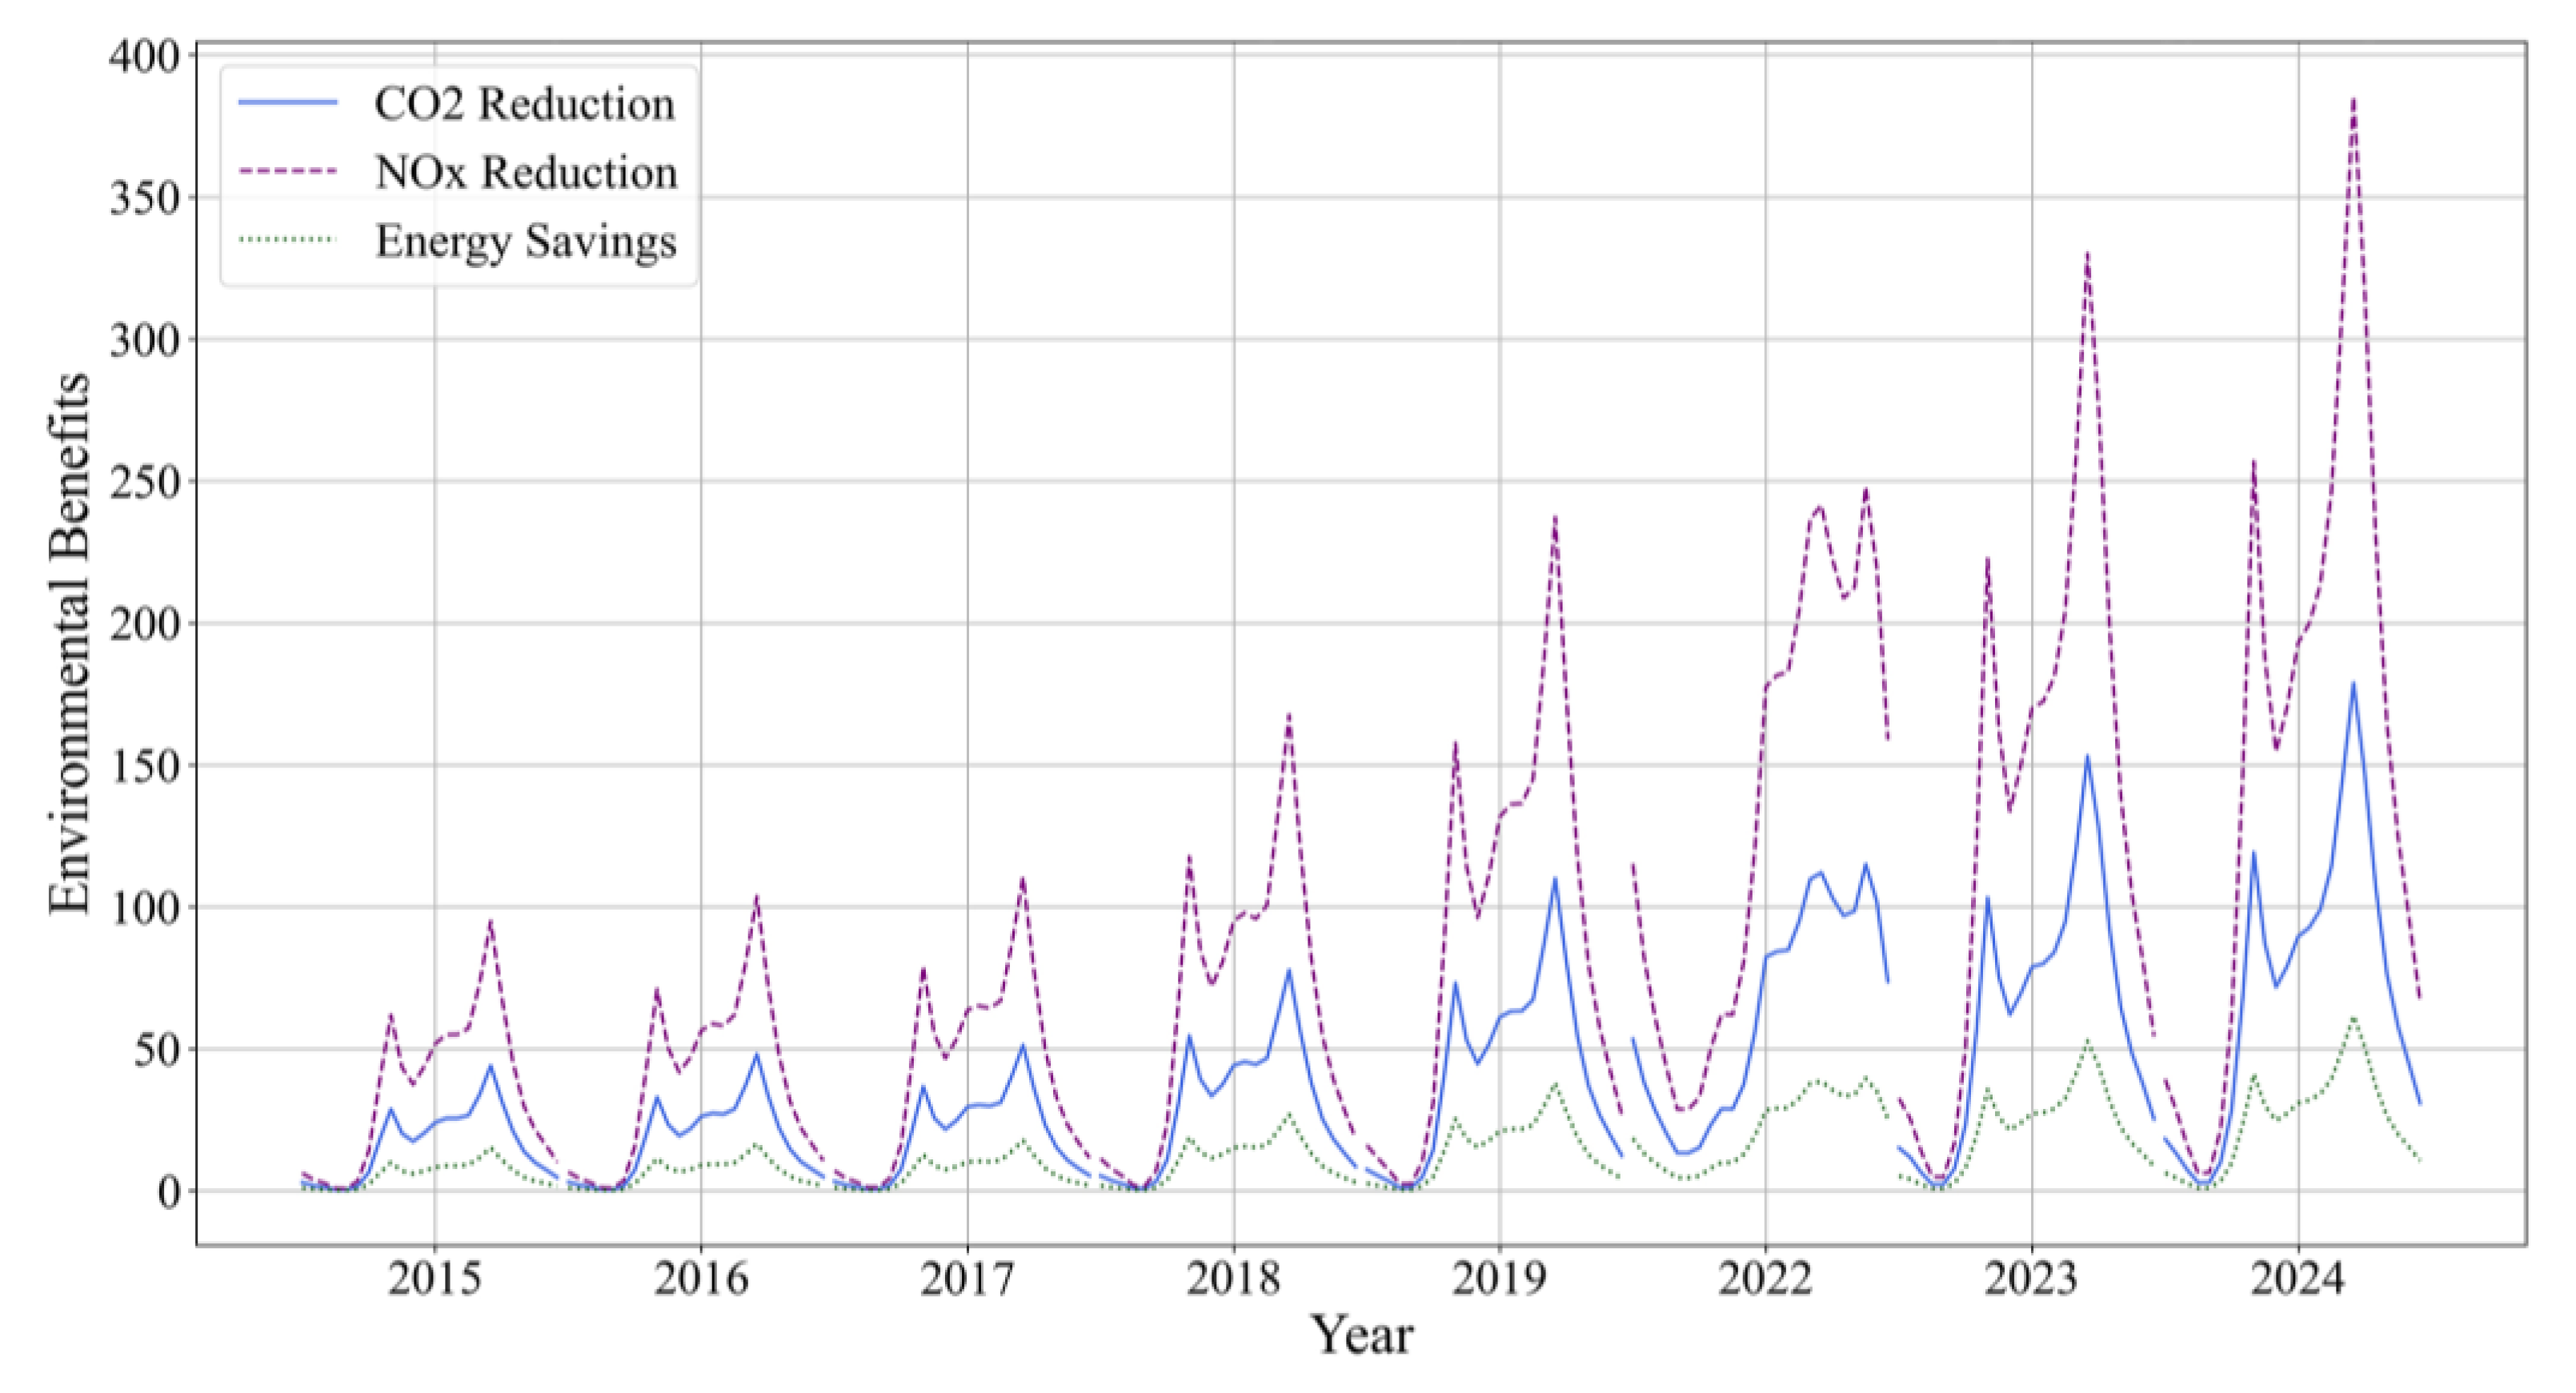
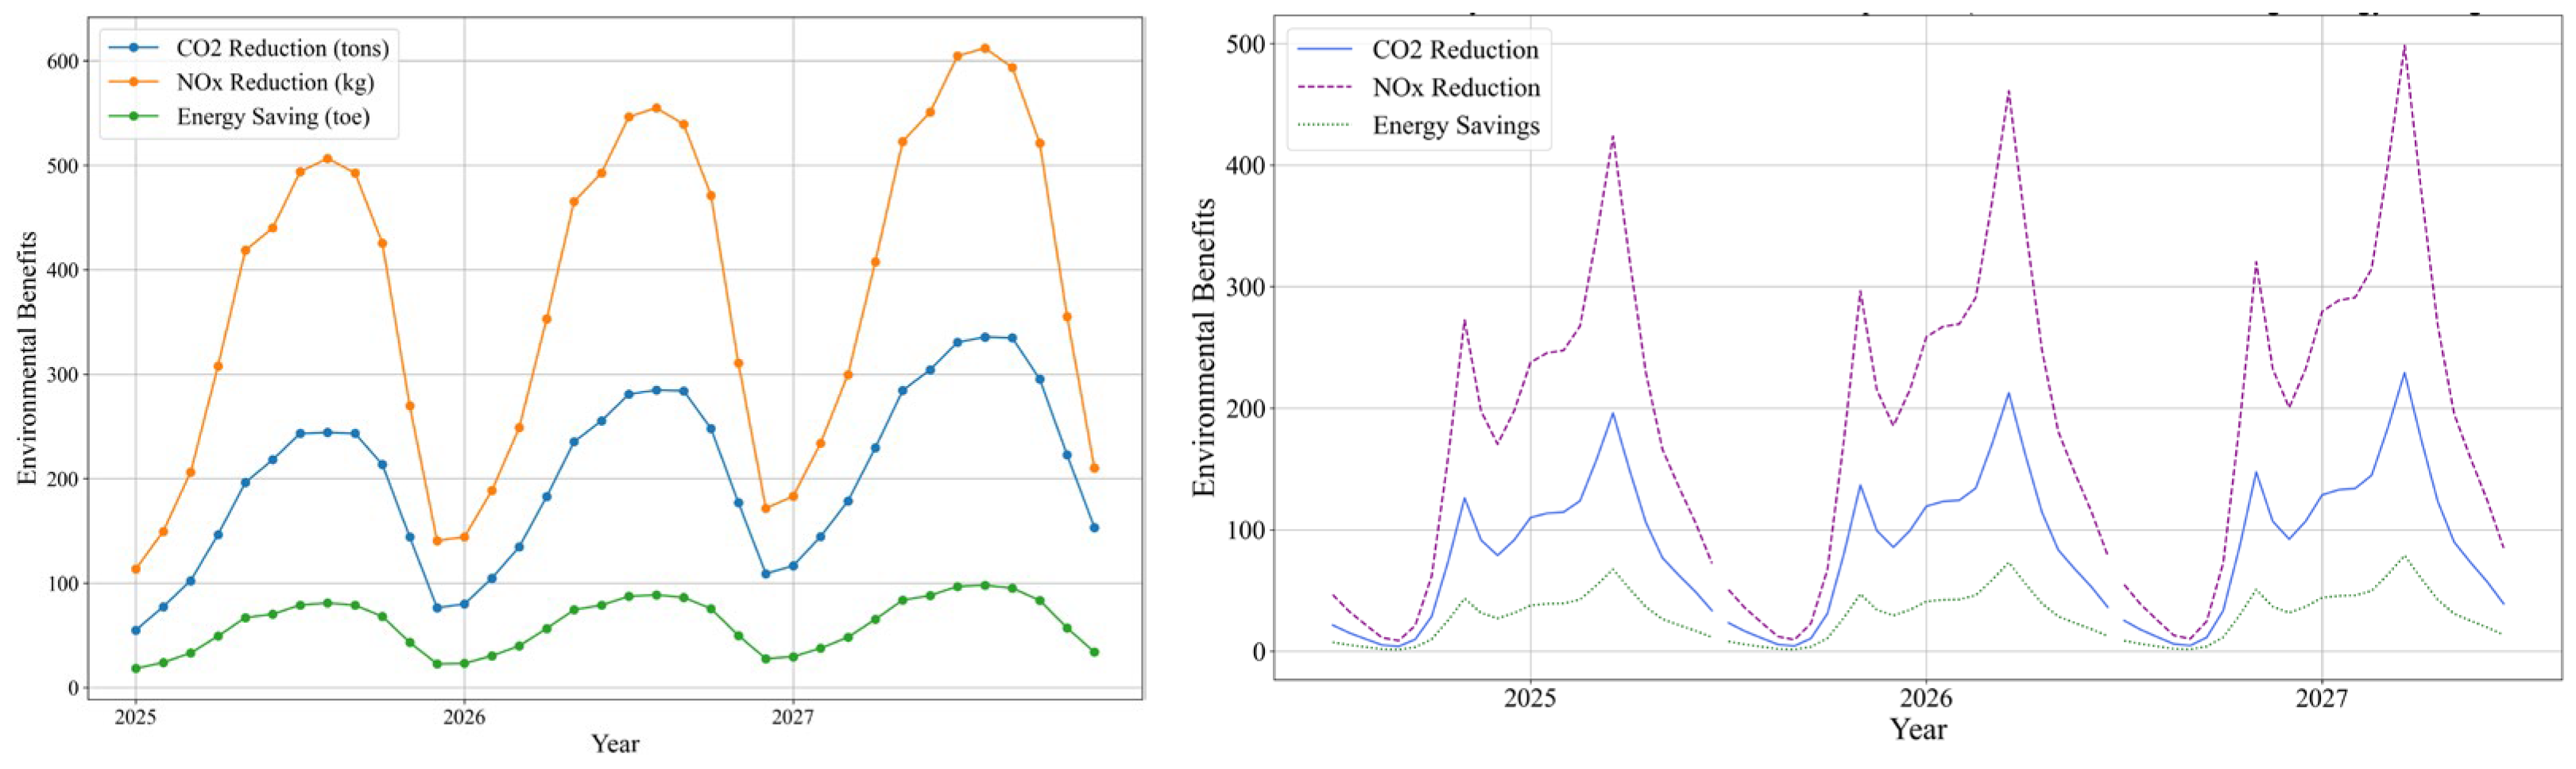
4.3. The 3-Year Predictions of Bluebikes

The usage of Bluebikes is projected to show a steady increase between 2025 and 2027. As presented in Figure 7, Bluebikes is expected to maintain a consistent upward trend in usage during this period. Monthly cycling trips are predicted to display strong seasonal patterns, with summer months consistently recording the highest ridership. By 2027, monthly cycling trips during peak months are forecasted to reach 690,000, an increase of more than 100,000 trips compared to the trips in the peak month in 2024. Weekly hourly cycling trip patterns are expected to remain similar to those observed between 2015 and 2024, with the number of trips steadily increasing over time. Morning peak-hour trips are anticipated to exceed 90,000, while afternoon peak-hour trips are projected to surpass 110,000 in 2027.
The 3-year prediction for Bluebikes’ environmental impact (2025–2027) suggests a continued positive trajectory in energy savings and emissions reductions, see Figure 8. Based on historical trends from 2015 to 2024, Bluebikes is projected to save an average of 723.66 tons of oil equivalent annually, with total savings reaching approximately 2170.97 tons by the end of 2027. Similarly, annual reductions in CO2 and NOX emissions are expected to increase steadily, from 1960.87 and 3.96 tons in 2025 to 2930.40 and 5.10 tons by 2027. These projections account for anticipated growth in Bluebikes’ usage, driven by expanded infrastructure, increased public awareness, and policy initiatives promoting sustainable urban mobility. Seasonal and daily variations in environmental performance are also expected to persist, with peak benefits continuing during weekday commuting hours and summer months. These predictions underscore the importance of implementing a range of targeted interventions. These may include further investments in the Bluebikes program and dedicated cycling infrastructure, implementation of incentives for frequent users, and public awareness campaigns. Such strategies would not only enhance the Bluebikes usage rates but also reinforce long-term environmental sustainability.

5. Conclusions

This study evaluates the long-term environmental performance of the Bluebikes program in the Boston area by analyzing its potential contributions to energy savings and reductions in CO2 and NOX emissions. A longitudinal analysis was conducted to uncover key spatial and temporal patterns in bike-sharing usage, emphasizing both annual trends and peak-hour activity, as well as their associated environmental impacts. Furthermore, the study employed a SARIMA model to predict Bluebikes usage over the next three years and estimate its prospective benefits in terms of energy conservation and emissions mitigation.
The findings underscore the significant environmental gains from the Bluebikes program in the Boston area. Between 2015 and 2024, the Bluebikes initiative contributed to saving 2616.44 tons of oil equivalent while reducing CO2 and NOX emissions by 7614.98 and 16.43 tons, respectively. These benefits were most pronounced during peak commuting hours in the summer, coinciding with the highest demand for Bluebikes. Looking ahead, Bluebikes usage is predicted to grow steadily over the next three years, with monthly and weekly cycling trips maintaining similar patterns but increasing in frequency. This growth is expected to drive further energy savings and emissions reductions. These results indicate that Bluebikes’ effectiveness in saving energy and mitigating greenhouse gas emissions during periods of high urban congestion solidifies its role as a sustainable urban transportation option. To amplify these benefits, corporate decision-makers in bike-sharing systems, along with government and third-sector stakeholders, should prioritize policies that incentivize greater participation. As bike-sharing systems gain traction, it is crucial to implement continuous interventions, such as improving Bluebikes accessibility, expanding well-designed bicycle networks, and providing more user-friendly bikes. These measures can enhance participation rates and maximize the environmental and social advantages of the Bluebikes program.
Although this study has highlighted the environmental benefits of the bike-sharing system, focusing primarily on energy savings and emissions reductions during the operational phase, there remain several opportunities for further research. First, the modal substitution framework employed in our research offers a practical method for estimating the substitution of bike-sharing trips. However, this approach relies on spatial patterns and prior empirical assumptions rather than direct validation through user-level behavioral data. Meanwhile, the Multinomial Logit model assumes that different mode choices are independent, but in reality, there may be interdependencies among the modes. Consequently, the resulting substitution estimates may not fully capture individual travel behavior or contextual factors that influence modal choice. More robust methodologies, such as state filtered disturbance rejection control [53] and multilayer neurocontrol of high-order uncertain nonlinear systems with active disturbance rejection [54], incorporating more detailed data like GPS-based mobility records and actual air pollution indices, are required to explore more accurate impacts of bike-sharing systems on environmental performance. Secondly, this study is limited to evaluating the operational phase of the Bluebikes without considering the carbon footprint of the production and recycling stages. Future research could extend this work by considering the carbon footprint of the production, use, and recycling phases, thereby providing a more comprehensive assessment of the lifecycle environmental impacts of Bluebikes. Thirdly, future research should also consider a broader range of influencing factors, such as weather conditions (e.g., temperature and precipitation), economic variables (e.g., gasoline prices and car-parking fees), and urban infrastructure (e.g., bike lane provision and bicycle signals), to gain a more comprehensive understanding of bike-sharing’s effects. Additionally, investigating regional disparities in usage, particularly between central and suburban areas, would help optimize the system’s accessibility and operational efficiency. Finally, addressing social equity concerns, such as ensuring equitable access to bike-sharing in low-income neighborhoods and among underrepresented groups, will be essential for maximizing the societal benefits of the program.

Author Contributions

M.D., S.Z. and L.L. contributed equally to this manuscript. Conceptualization, J.C. and Q.Y.; methodology, M.D., L.L. and Y.W.; software, M.D., S.Z. and Y.W.; validation, M.D., L.L. and Q.Y.; formal analysis, S.Z.; resources, L.L.; data curation, S.Z.; writing—original draft preparation, M.D., S.Z., L.L. and Q.Y.; writing—review and editing, Q.Y., J.C. and Y.W.; visualization, M.D., S.Z. and L.L.; supervision, Q.Y. and J.C.; project administration, Q.Y. and J.C.; funding acquisition, J.C. All authors have read and agreed to the published version of the manuscript.

Funding

This research was funded by the National Natural Science Foundation of China [grant number: 52278048].

Data Availability Statement

The dataset presented in this study is available upon request from the corresponding author.

Conflicts of Interest

The authors declare no conflicts of interest.

References

  1. Zhang, L.; Long, R.; Li, W.; Wei, J. Potential for Reducing Carbon Emissions from Urban Traffic based on the Carbon Emission Satisfaction: Case Study in Shanghai. J. Transp. Geogr. 2020, 85, 102733. [Google Scholar] [CrossRef]
  2. Ricci, M. Bike sharing: A Review of Evidence on Impacts and Processes of Implementation and Operation. Res. Transp. Bus. Manag. 2015, 15, 28–38. [Google Scholar] [CrossRef]
  3. Clockston, R.L.M.; Rojas-Rueda, D. Health Impacts of Bike-sharing Systems in the US. Environ. Res. 2021, 202, 111709. [Google Scholar] [CrossRef]
  4. Lu, T.; Xu, Y.; Chen, L.; Lu, L.; Ren, R. The Potential of Carbon Reductions of Public Bikes. Sustainability 2022, 14, 14831. [Google Scholar] [CrossRef]
  5. Qiu, L.Y.; He, L.Y. Bike Sharing and the Economy, the Environment, and Health-Related Externalities. Sustainability 2018, 10, 1145. [Google Scholar] [CrossRef]
  6. Bocken, N.M.; Short, S.W.; Rana, P.; Evans, S. A Literature and Practice Review to Develop Sustainable Business Model Archetypes. J. Clean. Prod. 2014, 65, 42–56. [Google Scholar] [CrossRef]
  7. Frade, I.; Ribeiro, A. Bike-sharing Stations: A Maximal Covering Location Approach. Transp. Res. Part A Policy Pract. 2015, 82, 216–227. [Google Scholar] [CrossRef]
  8. Pfrommer, J.; Warrington, J.; Schildbach, G.; Morari, M. Dynamic Vehicle Redistribution and Online Price Incentives in Shared Mobility Systems. Trans. Intell. Transp. Syst. 2014, 15, 1567–1578. [Google Scholar] [CrossRef]
  9. Chen, J.; Zhou, D.; Zhao, Y.; Wu, B.; Wu, T. Life Cycle Carbon Dioxide Emissions of Bike Sharing in China: Production, Operation, and Recycling. Resour. Conserv. Recycl. 2020, 162, 105011. [Google Scholar] [CrossRef]
  10. Alfaris, R.E.; Patel, D.; Jalayer, M.; Meenar, M. Barriers Associated with the First/Last Mile Trip and Solutions to Bridge the Gap: A Scoping Literature Review. Transp. Res. Rec. J. Transp. Res. Board 2024, 2678, 38–48. [Google Scholar] [CrossRef]
  11. City of Boston. Greenhouse Gas Emissions Inventory 2005–2021; City of Boston: Boston, MA, USA, 2022.
  12. Martin, E.W.; Shaheen, S.A. Evaluating Public Transit Modal Shift Dynamics in Response to Bikesharing: A Tale of Two US Cities. J. Transp. Geogr. 2014, 41, 315–324. [Google Scholar] [CrossRef]
  13. Yang, Q.; Cai, J.; Feng, T.; Liu, Z.; Timmermans, H. Bikeway Provision and Bicycle Commuting: City-Level Empirical Findings from the US. Sustainability 2021, 13, 3113. [Google Scholar] [CrossRef]
  14. Fishman, E.; Washington, S.; Haworth, N. Bike Share’s Impact on Car Use: Evidence from the United States, Great Britain, and Australia. Transp. Res. Part D Transp. Environ. 2014, 31, 13–20. [Google Scholar] [CrossRef]
  15. Zhi, D.; Sun, H.; Lv, Y.; Xu, G. Quantifying the Comprehensive Benefit of the Bike-sharing System under Cycling Behavior Differences. J. Clean. Prod. 2022, 379, 134660. [Google Scholar] [CrossRef]
  16. Zheng, F.; Gu, F.; Zhang, W.; Guo, J. Is Bicycle Sharing an Environmental Practice? Evidence from a Life Cycle Assessment based on Behavioral Surveys. Sustainability 2019, 11, 1550. [Google Scholar] [CrossRef]
  17. Mao, G.; Hou, T.; Liu, X.; Zuo, J.; Kiyawa, A.H.I.; Shi, P.; Sandhu, S. How can Bicycle-sharing Have a Sustainable Future? A Research based on Life Cycle Assessment. J. Clean. Prod. 2021, 282, 125081. [Google Scholar] [CrossRef]
  18. Kou, Z.; Cai, H. Understanding Bike Sharing Travel Patterns: An Analysis of Trip Data from Eight Cities. Phys. A Stat. Mech. Its Appl. 2019, 515, 785–797. [Google Scholar] [CrossRef]
  19. Kou, Z.; Wang, X.; Chiu, S.F.A.; Cai, H. Quantifying Greenhouse Gas Emissions Reduction from Bike Share Systems: A Model Considering Real-World Trips and Transportation Mode Choice Patterns. Resour. Conserv. Recycl. 2020, 153, 104534. [Google Scholar] [CrossRef]
  20. Zhang, L. A Study on Carbon Emission Reduction of Urban Bike Sharing Based on Carbon Inclusivity: A Case Study of Beijing. Urban Public Transp. 2021, 5, 43–46. [Google Scholar] [CrossRef]
  21. Cheng, B.; Li, J.; Su, H.; Lu, K.; Chen, H.; Huang, J. Life Cycle Assessment of Greenhouse Gas Emission Reduction through Bike-sharing for Sustainable Cities. Sustain. Energy Technol. Assess. 2022, 53, 102789. [Google Scholar] [CrossRef]
  22. Zhang, Y.; Mi, Z. Environmental Benefits of Bike Sharing: A Big Data-based Analysis. Appl. Energy 2018, 220, 296–301. [Google Scholar] [CrossRef]
  23. Cao, Y.; Shen, D. Contribution of Shared Bikes to Carbon Dioxide Emission Reduction and the Economy in Beijing. Sustain. Cities Soc. 2019, 51, 101749. [Google Scholar] [CrossRef]
  24. Faghih-Imani, A.; Eluru, N. Determining the Role of Bicycle Sharing System Infrastructure Installation Decision on Usage: Case Study of Montreal BIXI System. Transp. Res. Part A Policy Pract. 2016, 94, 685–698. [Google Scholar] [CrossRef]
  25. Diao, M.; Song, K.; Liu, Z.B. The Environmental Benefits of Dockless Bike Sharing Systems for Commuting Trips. Transp. Res. Part D Transp. Environ. 2023, 124, 103959. [Google Scholar] [CrossRef]
  26. Gebhart, K.; Noland, R.B. The Impact of Weather Conditions on Bikeshare Trips in Washington, DC. Transportation 2014, 41, 1205–1225. [Google Scholar] [CrossRef]
  27. Vogel, P.; Greiser, T.; Mattfeld, D. Understanding Bike-sharing Systems using Data Mining: Exploring Activity Patterns. Procedia—Soc. Behav. Sci. 2011, 20, 514–523. [Google Scholar] [CrossRef]
  28. Xu, C.; Ji, J.; Liu, P. The Station-Free Sharing Bike Demand Forecasting with a Deep Learning Approach and Large-Scale Datasets. Transp. Res. Part C Emerg. Technol. 2018, 95, 47–60. [Google Scholar] [CrossRef]
  29. Kaspi, M.; Raviv, T.; Tzur, M. Detection of Unusable Bicycles in Bike-sharing Systems. Omega 2016, 65, 10–16. [Google Scholar] [CrossRef]
  30. Cheng, H.; Li, M.; Zhang, H. Research on the Urban Bike-sharing Usage Based on ARIMA Model. J. Urban Transp. 2023, 29, 512–526. [Google Scholar] [CrossRef]
  31. Fan, Y. Demand Prediction of Bike-sharing in Urban Center of Shanghai Based on SARIMA Model. Inf. Comput. 2024, 36, 210–214. [Google Scholar]
  32. Yu, L.; Feng, T.; Li, T.; Cheng, L. Demand Prediction and Optimal Allocation of Shared Bikes Around Urban Rail Transit Stations. Urban Rail Transit 2022, 9, 57–71. [Google Scholar] [CrossRef] [PubMed]
  33. Wang, Z.; Yu, D.; Zheng, X.; Meng, F.; Wu, X. A Model-Data Dual-Driven Approach for Predicting Shared Bike Flow near Metro Stations. Sustainability 2025, 17, 1032. [Google Scholar] [CrossRef]
  34. Dong, L.; Jiang, H.; Li, W.; Qiu, B.; Wang, H.; Qiu, W. Assessing Impacts of Objective Features and Subjective Perceptions of Street Environment on Running Amount: A Case Study of Boston. Landsc. Urban Plan. 2023, 235, 104756. [Google Scholar] [CrossRef]
  35. Handy, S. Making US Cities Pedestrian-and Bicycle-Friendly. In Transportation, Land Use, and Environmental Planning; Elsevier: Amsterdam, The Netherlands, 2020; pp. 169–187. Available online: https://www.sciencedirect.com/science/article/pii/B9780128151679000098 (accessed on 3 November 2024).
  36. De Chardon, C.M. The Contradictions of Bike-share Benefits, Purposes and Outcomes. Transp. Res. Part A Policy Pract. 2019, 121, 401–419. [Google Scholar] [CrossRef]
  37. Fraser, T.; Van Woert, K.; Olivieri, S.; Baron, J.; Buckley, K.; Lalli, P. Cycling Cities: Measuring Transportation Equity in Bikeshare Networks. Available at SSRN 2022. Available online: https://papers.ssrn.com/sol3/papers.cfm?abstract_id=4076776 (accessed on 3 November 2024).
  38. City of Boston. Go Boston 2030: Vision and Action Plan—Imagining Our Transportation Future; Boston Transportation Department: Boston, MA, USA, 2017.
  39. Scheiner, J. Interrelations between Travel Mode Choice and Trip Distance: Trends in Germany 1976–2002. J. Transp. Geogr. 2010, 18, 75–84. [Google Scholar] [CrossRef]
  40. Tang, H.; Zhou, D. Understanding the Competition and Cooperation between Dockless Bike-Sharing and Metro Systems in View of Mobility. Sustainability 2024, 16, 5780. [Google Scholar] [CrossRef]
  41. Teixeira, J.F.; Lopes, M. The Link between Bike Sharing and Subway Use during the COVID-19 Pandemic: The Case Study of New York’s Citi Bike. Transp. Res. Interdiscip. Perspect. 2020, 6, 100166. [Google Scholar] [CrossRef]
  42. Chen, Y.; Zhang, Y.; Coffman, D.M.; Mi, Z. An Environmental Benefit Analysis of Bike Sharing in New York City. Cities 2022, 121, 103475. [Google Scholar] [CrossRef]
  43. Cain, T. Year-End US Passenger Car Sales Ranking: Top 158 Best-Selling Cars in America. 2013. Available online: https://scholar.google.com/scholar_lookup?title=Top%20158%20best-selling%20cars%20in%20America&publication_year=2013&author=Automotive%20News%20Data%20Center (accessed on 7 December 2024).
  44. Speight, J.G. Production, Properties and Environmental Impact of Hydrocarbon Fuel Conversion. In Advances in Clean Hydrocarbon Fuel Processing; Elsevier: Amsterdam, The Netherlands, 2011; pp. 54–82. [Google Scholar]
  45. Ou, X.; Zhang, X.; Chang, S. Alternative Fuel Buses Currently in Use in China: Life-cycle Fossil Energy Use, GHG emissions and policy recommendations. Energy Policy 2010, 38, 406–418. [Google Scholar] [CrossRef]
  46. Yu, B.; Ma, Y.; Xue, M.; Tang, B.; Wang, B.; Yan, J.; Wei, Y.M. Environmental Benefits from Ridesharing: A case of Beijing. Appl. Energy 2017, 191, 141–152. [Google Scholar] [CrossRef]
  47. Intergovernmental Panel on Climate Change (IPCC). Guidelines for National Greenhouse Gas Inventories; Chapter I. Introduction; IGES Japan: Hayama, Japan, 2006; pp. 1–21. [Google Scholar]
  48. Ježek, I.; Katrašnik, T.; Westerdahl, D.; Močnik, G. Black Carbon, Particle Number Concentration and Nitrogen Oxide Emission Factors of Random in-use Vehicles Measured with the on-road Chasing Method. Atmos. Chem. Phys. 2015, 15, 11011–11026. [Google Scholar] [CrossRef]
  49. American Public Transportation Association. 2023 Public Transportation Fact Book; American Public Transportation Association: Washington, DC, USA, 2023; Available online: https://www.apta.com/research-technical-resources/transit-statistics/public-transportation-fact-book/ (accessed on 3 November 2024).
  50. United States Environmental Protection Agency. Emissions & Generation Resource Integrated Database (eGRID) 2021 Data; Environmental Protection Agency: Washington, DC, USA, 2023. Available online: https://www.epa.gov/egrid (accessed on 3 November 2024).
  51. Massachusetts Department of Transportation. Tracking the Energy and Emissions of MBTA Rapid Transit Vehicles; University of Massachusetts Amherst: Amherst, MA, USA, 2021. Available online: https://www.mass.gov/doc/tracking-the-energy-and-emissions-of-mbta-rapid-transit-vehicles-final-report/download (accessed on 3 November 2024).
  52. Nosal, T.; Miranda-Moreno, L.F. The Effect of Weather on the Use of North American Bicycle Facilities: A Multi-City Analysis Using Automatic Counts. Transp. Res. Part A Policy Pract. 2014, 66, 213–225. [Google Scholar] [CrossRef]
  53. Yang, G. State Filtered Disturbance Rejection Control. Nonlinear Dyn. 2024, 113, 6739–6755. [Google Scholar] [CrossRef]
  54. Yang, G.; Yao, J. Multilayer Neurocontrol of High-order Uncertain Nonlinear Systems with Active Disturbance Rejection. Int. J. Robust Nonlinear Control 2024, 34, 2972–2987. [Google Scholar] [CrossRef]
Figure 1. Distribution of Bluebikes stations with bike usage.
Urbansci 09 00159 g001
Figure 2. Distributions of trip durations and distances.
Urbansci 09 00159 g002
Figure 3. Monthly cycling trips of Bluebikes.
Urbansci 09 00159 g003
Figure 4. Hourly cycling trips of Bluebikes.
Urbansci 09 00159 g004
Figure 5. Monthly distribution of environmental benefits of Bluebikes.
Urbansci 09 00159 g005
Figure 6. Hourly distribution of environmental benefits of Bluebikes.
Urbansci 09 00159 g006
Figure 7. Predicted monthly and hourly cycling trips of Bluebikes.
Urbansci 09 00159 g007
Figure 8. Predicted monthly and hourly distribution of environmental benefits of Bluebikes.
Urbansci 09 00159 g008
Table 1. Annual number of trips and number of stations.
20152016201720182019202220232024Total
Number of trips (million)1.121.231.311.762.523.753.664.7220.07
Number of stations190189200317339458500480523
Table 2. Mode splits by trip distances in the U.S.
Trip Distance (km)Mode Shares (%)Trip Distance (km)Mode Shares (%)
WalkBicycleBusSubwayCarWalkBicycleBusSubwayCar
≤0.294.05.00.00.01.01.5–2.018.017.05.01.059.0
0.2–0.481.011.00.00.08.02.0–3.010.014.07.05.064.0
0.4–0.664.019.00.00.017.03.0–5.04.09.08.015.064.0
0.6–0.860.020.01.00.019.05.0–7.01.06.010.020.063.0
0.8–1.056.021.01.00.022.07.0–10.01.04.012.025.058.0
1.0–1.525.019.03.00.053.0>10.00.02.010.030.058.0
Table 3. Parameters for calculating energy consumption.
pρλeλtηfCO2fNOx
Bus0.0060.8500.9300.990--3.0900.055
Car0.0880.7200.8700.950--2.9300.006
Subway--------0.1000.3490.206
Table 4. Annual average cycling distances and times.
20152016201720182019202220232024Total
Average cycling distance (km)2.932.902.963.353.293.393.343.043.20
Average cycling time (minutes)14.6714.5014.8116.7416.4616.9716.6915.2216.00
Annual cycling time (years)31.4234.0036.9256.1578.82120.96116.05136.79610.95
Disclaimer/Publisher’s Note: The statements, opinions and data contained in all publications are solely those of the individual author(s) and contributor(s) and not of MDPI and/or the editor(s). MDPI and/or the editor(s) disclaim responsibility for any injury to people or property resulting from any ideas, methods, instructions or products referred to in the content.

