Article

Contradiction or Coordination? Spatial Heterogeneity Between Urbanization and Green Development in the Yangtze River Delta Region, China

1
School of Business, NingboTech University, 1 Xuefu Road, Ningbo 315000, China
2
Simon Business School, University of Rochester, 500 Joseph C. Wilson Blvd., Rochester, NY 14627, USA
3
Weatherhead School of Management, Case Western Reserve University, 11119 Bellflower Road, Cleveland, OH 44106, USA
4
Zhejiang Institute of Talent Development, Hangzhou 310058, China
*
Author to whom correspondence should be addressed.
These authors contributed equally to this work.
Urban Sci. 2025, 9(4), 89; https://doi.org/10.3390/urbansci9040089
Submission received: 4 January 2025 / Revised: 9 March 2025 / Accepted: 18 March 2025 / Published: 21 March 2025

Abstract

With the rapid acceleration of socio-economic development, the potential contradiction between urbanization and green development becomes a concerning issue. Ascertaining their relationship is conducive to new-type urbanization transformation and ecologically sustainable development. To reveal their complex and dynamic relationship, this study first calculates urbanization and green development by a linear weighting method and the coupling coordination degree (CCD) model. Then, the local spatial autocorrelation method is adopted to explore the CCD spatial effect on the Yangtze River Delta Region (e.g., Shanghai Municipality, and Jiangsu, Zhejiang, and Anhui provinces) in China. The results reveal three key findings as follows: (1) Overall, the 41 cities within the Yangtze River Delta Region (YRDR) exhibited a relatively high level of coordination, albeit with notable regional disparities. (2) Several cities experienced unbalanced development, with either green development lagging behind urbanization or vice versa. (3) Spatial clustering patterns indicate that neighboring cities influence one another, highlighting the importance of regional collaboration. These findings provide critical insights for policymakers to enhance sustainable urban planning and foster balanced development across the region.

Graphical Abstract

1. Introduction

Nowadays, urbanization is becoming a major trend around the world, and China’s urbanization in recent decades has been rapidly advancing. After reforming and opening in 1978, the establishment of urban agglomerations and special economic zones propelled China into a long and steady period of industrial and economic development. As a result of urbanization, the demographic structure of China’s towns and villages has changed, with a large number of rural people moving to the cities to work for better incomes and livelihoods [1]. As a result, the government has also been vigorously developing urban infrastructure and implementing welfare policies. Rapid urbanization has nearly become ubiquitous across the world in recent decades [2]. China’s urbanization has made rapid progress since the 21st century, with the urbanization rate increasing at an average rate of 1.04% per year [3]. During the early stage of development, China’s urbanization mainly focused on the speed of growth, which exposed cities to “urban diseases” (e.g., air pollution, energy deficiency, natural disasters, etc.) [4,5,6,7]. These pressing issues significantly constrain China’s socio-economic sustainable development, thereby underscoring the imperative need for green transformation as an innovative pathway towards high-quality development.
Green development has emerged as a pivotal tool for China to monitor regional environmental advancements and assist the government in formulating sustainable development policies [8,9]. Obviously, different indicators have different effects on green development. People’s productivity, positive policy responses, and green innovation can be the main factors contributing to green development [10,11]. At the Third Plenary Session of the 20th Central Committee of the Communist Party of China on 18 July 2024, President Xi Jinping emphasized the urgent need to accelerate comprehensive green transformation across both economic and social spheres; enhance mechanisms for sustainable, low-carbon growth; and deeply instill the values of respecting, harmonizing with, and safeguarding the natural environment. The green development indicator system can reflect the level of a city’s green environment [12]. To ensure that both subjective and objective factors are considered, people’s satisfaction with the current environment is added as a subjective indicator, in addition to the environment-related indicators, to effectively evaluate the current state of the environment [9,13]. Hence, the framework for green development indicators is continually refined and perfected.
Several studies have provided insights into the challenges and opportunities within urbanization and green development in China’s urban clusters. Urban expansion impacts water resources, revealing regional disparities and indicating a need for localized policy interventions to protect water quality amid growing urban demands [14]. The Beijing–Tianjin–Hebei agglomeration shows that urbanization’s impact on ecosystem services varies spatially, with some areas experiencing greater ecological strain than others [15]. In the Chengdu–Chongqing urban agglomeration, urbanization is found to inversely affect ecological quality over time [16]. These findings suggest that urbanization, if not carefully managed, could degrade essential ecological functions, emphasizing the necessity for integrating green initiatives into urban policies. Further studies reveal that urbanization’s environmental implications are not limited to land and water but also extend to air quality. The coupling between urbanization and air pollution in the Bohai Rim identifies the positive impact of pollution control policies in improving air quality, despite the rising urbanization rates [17]. This suggests that regulatory measures can mitigate environmental impacts, underscoring the importance of policy in balancing urban and ecological priorities. Ecosystem services within 12 Chinese urban agglomerations typically deteriorate due to habitat loss and degradation, recommending the implementation of regional strategies that align urban development with ecosystem preservation [18]. In the Yangtze River Economic Belt, urban growth places significant threats on water ecosystems, particularly in the eastern regions [19].
The coupling coordination method, as an important tool for revealing the regularity of various data, has been widely adopted to explore the relationship between the degree of urbanization and ecological security [20,21], urbanization and low-carbon development quality [22,23,24], etc. Moreover, the spatialization of inter-regional development could reveal more underlying regularities [25,26]. However, less attention has been paid to spatializing the coupling coordination relationship between urbanization and green development, as well as their interactive impact mechanism. To fill this research gap, this study aims to map the relationship between urbanization and green development. Selected as the study area due to its pivotal strategic role, encompassing both economic and ecological values in China, the Yangtze River Delta Region (YRDR) serves as a crucial juncture connecting the “Belt and Road” Initiative and the Yangtze River Economic Belt, and it functions as a significant platform for international trade exchanges.

2. Materials and Methods

2.1. Case Study

The Yangtze River Delta Region (YRDR), shown in Figure 1, is renowned as one of China’s most hierarchical and economically vibrant urban agglomerations, ranking as the sixth largest globally. The YRDR is an alluvial plain formed before the Yangtze River entered the sea, covering a total area of 211,700 km2, representing 2.2% of China’s total land mass. It is home to 236 million people, with a regional GDP of RMB 30.51 trillion, which represents 16.74% and 24.2% of the total population and GDP of China, respectively. It is located at 114°54′–123°10′ east longitude and 27°02′–35°8′ north latitude, in eastern coastal China. The YRDR consists of Shanghai Municipality (i.e., provincial-level city), Jiangsu Province, Zhejiang Province, and Anhui Province, with a total of 41 cities (1 municipality and 40 prefecture-level cities). With an average urbanization rate of 67.38%, 2% of the land area carries 20% of the economic volume and absorbs 10% of the population of China, making it one of the most remarkable regions in China’s urbanization development [27]. The YRDR is one of the regions that is the most active in economic development, representing the most in-depth regional cooperation, and having the highest degree of openness across China [28]. Acting as an important pole of economic growth in China, it serves as both the spatial carrier and strategic support of China’s regional economic development strategy, radiating to the Yangtze Economic Belt and even to the entire country. Within the current national strategic practice of higher-quality integration, the YRDR is a critical hub for economic activity and a focal point of national sustainability policies.

2.2. Data Source

This study involves the following two main categories of data sources: (1) Statistical data for analyzing the coupling relationship between urbanization and green development, using the Shanghai Statistical Yearbook, Zhejiang Statistical Yearbook, Jiangsu Statistical Yearbook, and Anhui Statistical Yearbook for a total of 41 cities in the YRDR. For a few missing data points, interpolation between neighboring years is applied. (2) Geographical data for mapping spatial heterogeneity. District boundaries of the study site and the geographical features (e.g., the Yangtze River waterbody) are taken from the First National General Survey of Geographical Conditions (2013–2015).

2.3. Evaluation Index System

The urbanization (UR) and green development (GD) index system are designed based on the existing relevant literature and data availability, involving sixteen UR indicators (Table 1) and eight GD variables (Table 2). As shown in Table 1, UR is divided into two main indicator systems (i.e., the economic urbanization subsystem and the innovation urbanization subsystem). The economic urbanization subsystem refers to indicators related to economic development, which mainly shows the economic strength and demographic status of cities. Among them, the per capita disposable income of urban and rural residents, urban population density, per capita investment in fixed assets, industrial output value as a share of GDP, and tertiary industry output value as a share of GDP are related to production. The innovation urbanization subsystem refers to the impact of science and technology innovation on the process of urbanization. It is divided into education expenditure per capita, the number of scientific research institutions, the total number of books in public libraries, R&D expenditure, the number of newly registered enterprises per 10,000 people, the number of invention patents granted per 10,000 people, and the number of invention patents granted per 10,000 people, which are related to the input and output of talents.
Based on Table 2, the green development system includes eight indicators, as follows: urban green coverage, urban per capita public green space, sewage treatment rate, comprehensive utilization rate of general industrial solid waste, average annual concentration of sulfur dioxide, PM5 (i.e., Particulate Matter with a diameter of 5 μm or less), and average number of days with good ambient air quality, which are the main external environment-related indicators; and general industrial solid waste, average annual concentration of sulfur dioxide, PM2.5 (i.e., Particulate Matter with a diameter of 2.5 μm or less), and average number of days with good ambient air quality, which are the main external environment-related indicators, reflecting the influence of green development. Public satisfaction with the environment, which is related to people’s subjective views, expresses people’s views on the current green environment construction.

2.4. Linear Weighting Method

In the multi-index evaluation system, due to the different nature and meaning of each index, there are usually differences in the dimension and order of magnitude. Therefore, in constructing the multi-index evaluation system, the indexes cannot be compared directly. To reduce the unit difference between the index data, the original data were standardized using Equations (1) and (2), and we eliminated the influence of dimension, magnitude, and positive and negative orientation [29].
Positive indicator:
Y ij = X i j m i n ( X j ) m a x ( X j ) m i n ( X j )   + 0.01
Negative indicator:
Y ij = m a x X j X i j m a x ( X j ) m i n ( X j )   + 0.01
where Yij is the standardized matrix and Xij refers to the initial data. Max (Xij) and min (Xij) represent the maximum and minimum values of the initial data, respectively. Most indicators of the urbanization and green development index systems are positive indicators, so Equation (1) is adopted for the calculation. Only three of the indicators, urban year-end registered unemployment rate, annual average sulfur dioxide concentration, and PM2.5 are calculated by Equation (2) [30]. Calculating the data j proportion corresponding to the index i, and Equation (3) is expressed as follows:
P i j = Y i j / j = 1 n Y i j
The calculation of the entropy ej of indicator j by using Equation (4) is expressed as follows:
e j = k   j = 1 n P i j   ×   l n P i j , k = 1 / l n N
where N represents the number of the indicators of this study. This study selected panel data from 41 cities in 2021; therefore, N = 41. Then, the difference coefficient qj ( S j ) of indicator j was calculated by Equation (5), and the weights of each indicator were determined by Equation (6) [30].
S j = 1 e j
w j = S j /   j = 1 n q j
The comprehensive development level of the urbanization system and green development system is measured by linear weighting method Equations (7) and (8) [31,32,33,34,35].
U 1 = j = 1 n w i j   × Y i j ,   a n d   j = 1 n w i j   = 1
U 2 = j = 1 n w i j   × Y i j ,   a n d   j = 1 n w i j   = 1
where U1 represents the evaluation results of the comprehensive urbanization level and U2 is the comprehensive green development level data. In terms of wij, which refers to the weight matrix based on the calculation of the entropy weight method. For U1, the closer the value is to 1, the higher the degree of regional urbanization achieved. Also, for U2, the closer the value is to 1, the higher the level of economic growth and social development that aims at efficiency, harmony, and sustainability.
Coupling is a phenomenon in which two systems interact to develop harmoniously. The capacity coupling coefficient model’s formula was used to determine the coupling degree of the two subsystems of urbanization and ecological environment [36,37,38], as follows:
C = 4 ( U 1 × U 2 ) / ( U 1 + U 2 ) 2
where C is the coupling degree between Urbanization (UR) and Green Development (GD). C ∈ [0, 1] is composed of the comprehensive level of UR and GD. The coupling degree is largest at C = 1, indicating that the two systems are in a balanced coupling state, and the coupling system will develop into a newly ordered structure. When C = 0, the coupling degree is the smallest and in an independent disordered state.
Since the coupling degree is insufficient in reflecting the overall efficacy of urbanization and green development, it cannot objectively reflect the coordination degree of urbanization and green development. Therefore, it is necessary to construct the coupling coordination degree model of urbanization and green development with the following formula:
T = α × U1 + β × U2
D = C × T
where T is the comprehensive evaluation value of the two subsystems, and D refers to the coupling coordination degree between UR and GD. α and β indicate the undetermined coefficients of the UR subsystem and GD subsystem, respectively. Based on the existing investigation of the dynamic relationship between different urban subsystems, the equitation method is widely used for the value of undetermined coefficients in studies on the relationship between two systems. Therefore, both α and β have values of 0.5, and α + β = 1.

2.5. Local Spatial Autocorrelation Method

Local spatial autocorrelation analysis is used to quantitatively investigate the relationship among U1, U2, and the coupling coordination degrees in 41 cities. The spatial weight matrix is the premise of spatial autocorrelation analysis. An adjacency matrix is used to construct a spatial weight matrix in this study, and spatial adjacency information between cities is generated based on Arc GIS10.8, an adjacency matrix is established, and the spatial weight is determined based on this method.

2.6. Coupling Method

“Coupling”, a phenomenon originating in the physical sciences, is when two or more systems influence each other through various interactions. Coupling is now widely used in urbanization studies. Additionally, empirical studies have focused on the nonlinear relationship between urbanization, environmental Kuznet curves (EKC), and the environment. However, a lack of data is an obstacle to research on the relationship between carbon emissions and urbanization, especially in China. Its advantage is in showing the degree of correlation between the two elements. However, one shortcoming is that it cannot show whether these two elements are correlated at a high level or a low one, introducing the use of the coupling coordination degree model (CCDM), which shows that the property of the correlation is necessary when analyzing data [36,37,38].

3. Results

3.1. Comprehensive Level Analysis

Using the methods above, the composite index of urbanization and green development are calculated, as well as the coupling and coupling coordination between these two systems (Table 3). The composite index of urbanization exhibits a narrow range, spanning from 0.13 to 0.56, indicating that the differences in urbanization levels across these 41 cities are relatively small. This suggests that urbanization development is generally balanced among these cities. In contrast, the composite index of green development shows a wider range, from 0.18 to 0.86, suggesting significant disparities exist. Some cities have made notable progress in green development, while others are still at a relatively low level. The coupling scope, measuring the closeness between urbanization and green development, is relatively small, ranging from 0.872 to 0.999. This reflects a high degree of correlation between the two indexes, implying that green development is closely aligned with urbanization, regardless of the urbanization level.
However, the coupling coordination degree varies significantly, ranging from 0.374 to 0.808. This indicates that while urbanization and green development are strongly linked, the level of coordinated development differs substantially across cities. Some cities achieve high coordination (close to 0.808), successfully balancing urbanization with green development, whereas others exhibit low coordination (close to 0.374), possibly due to imbalanced resource allocation or inadequate policy implementation.

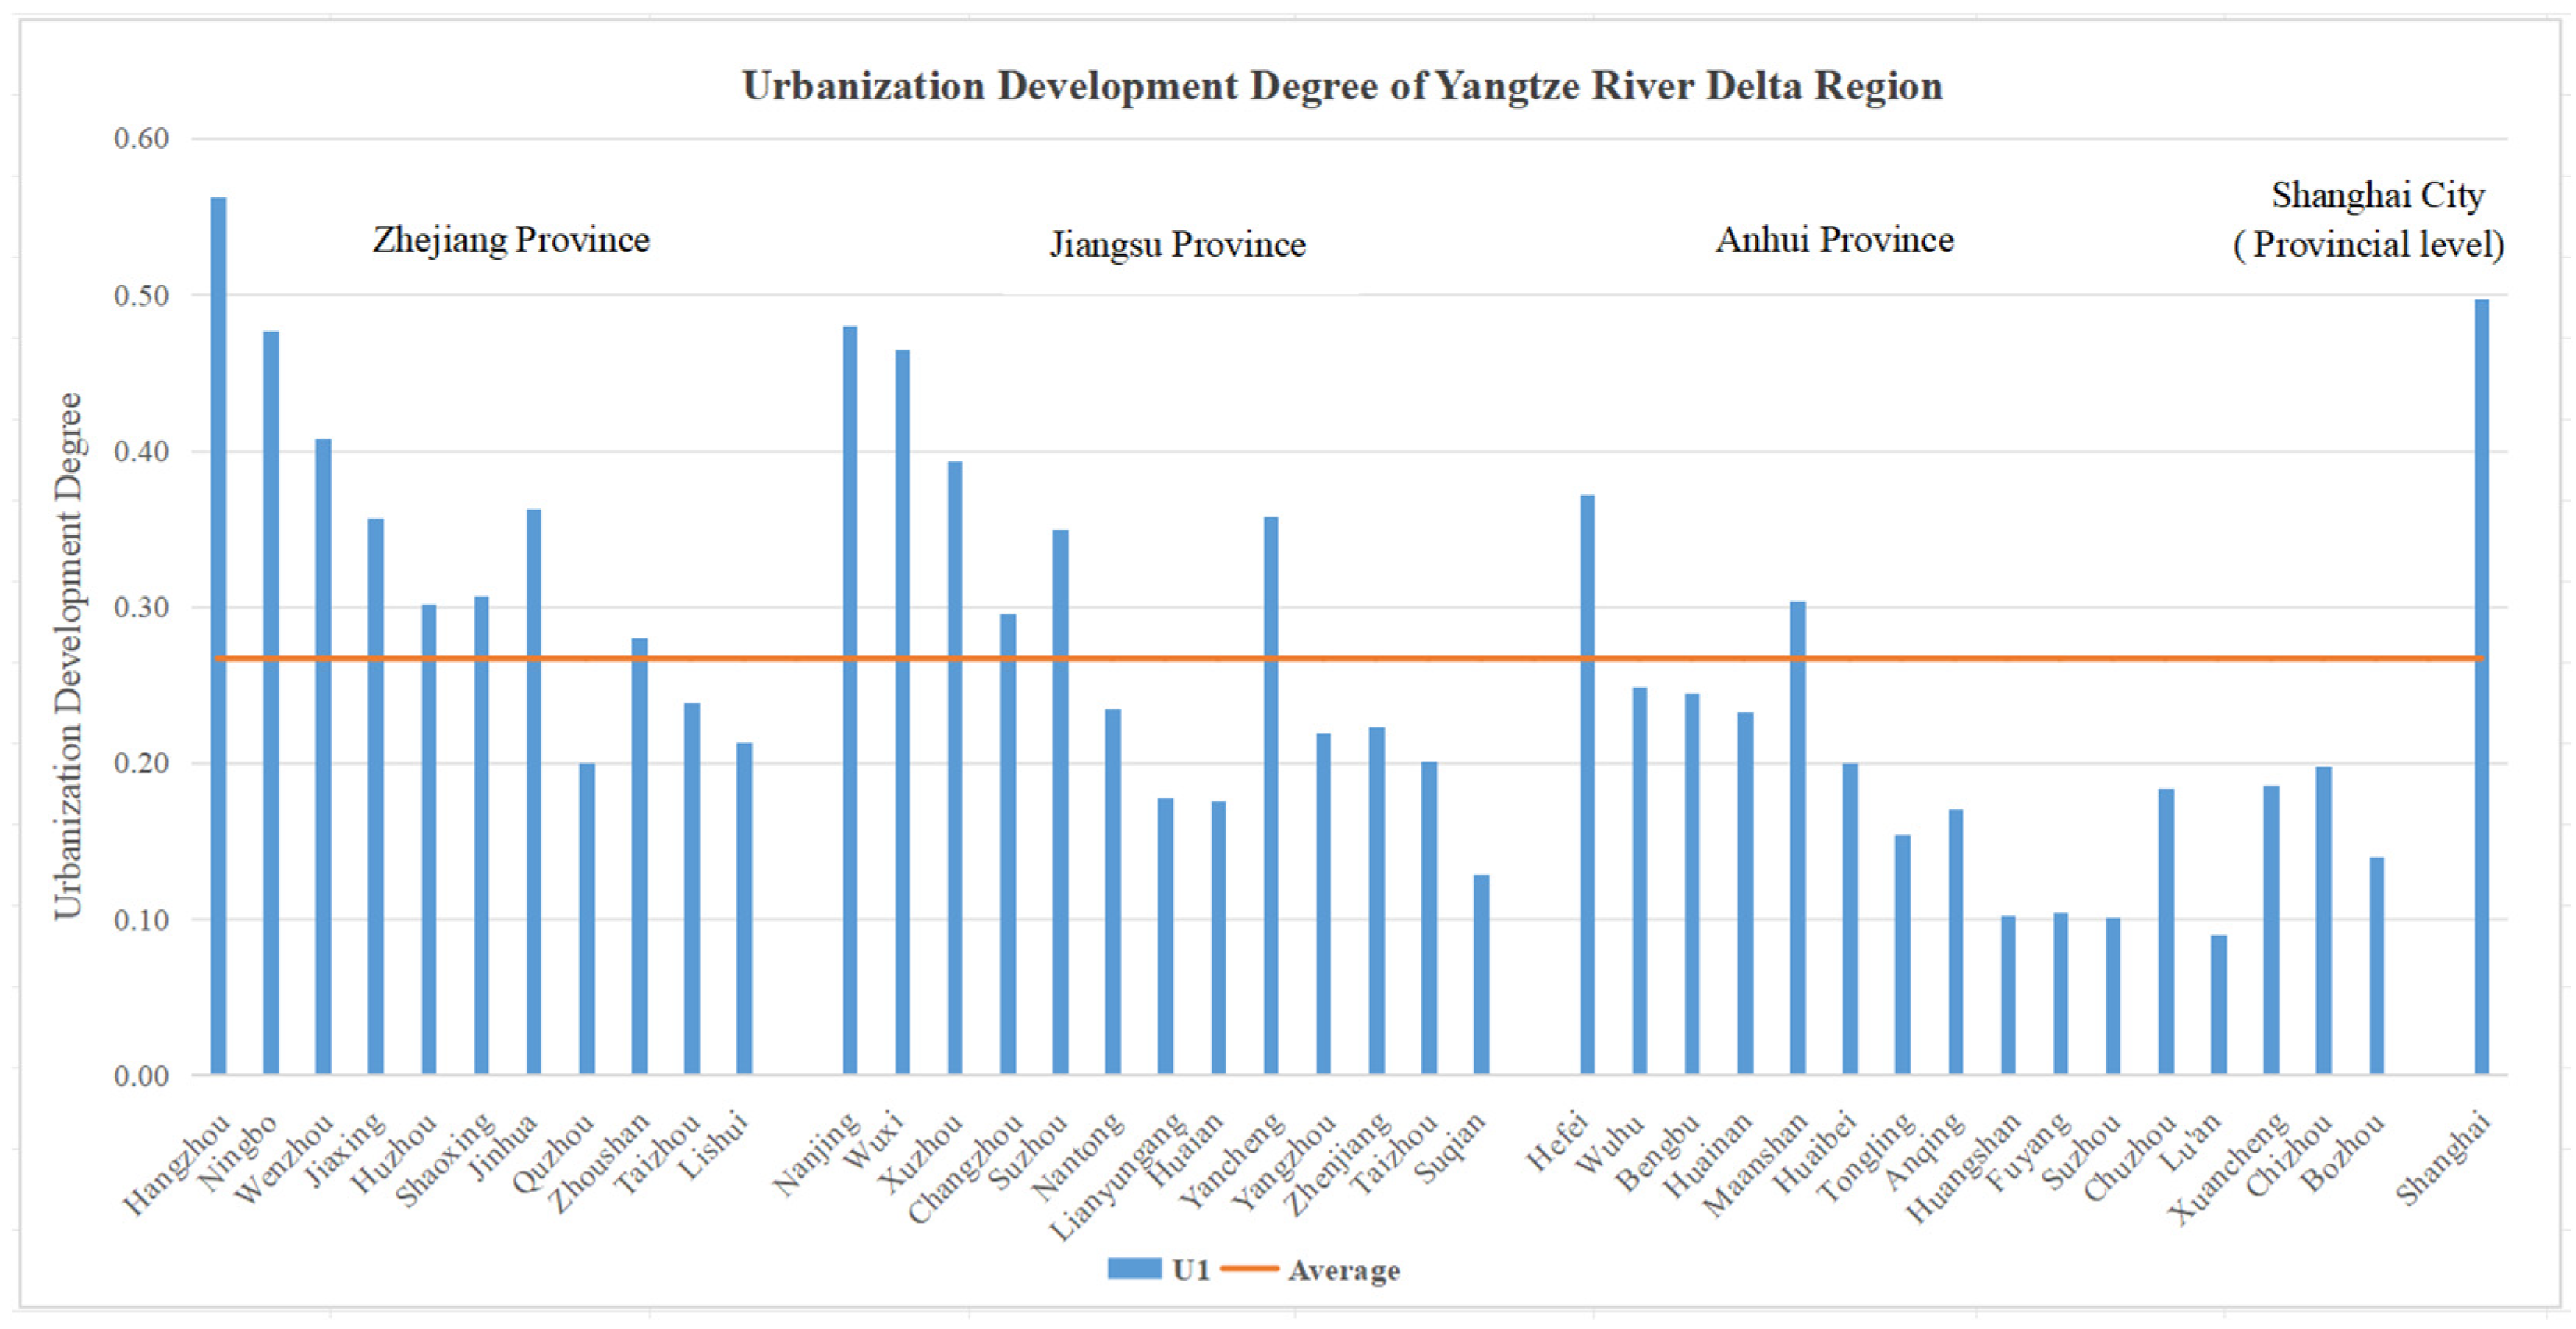
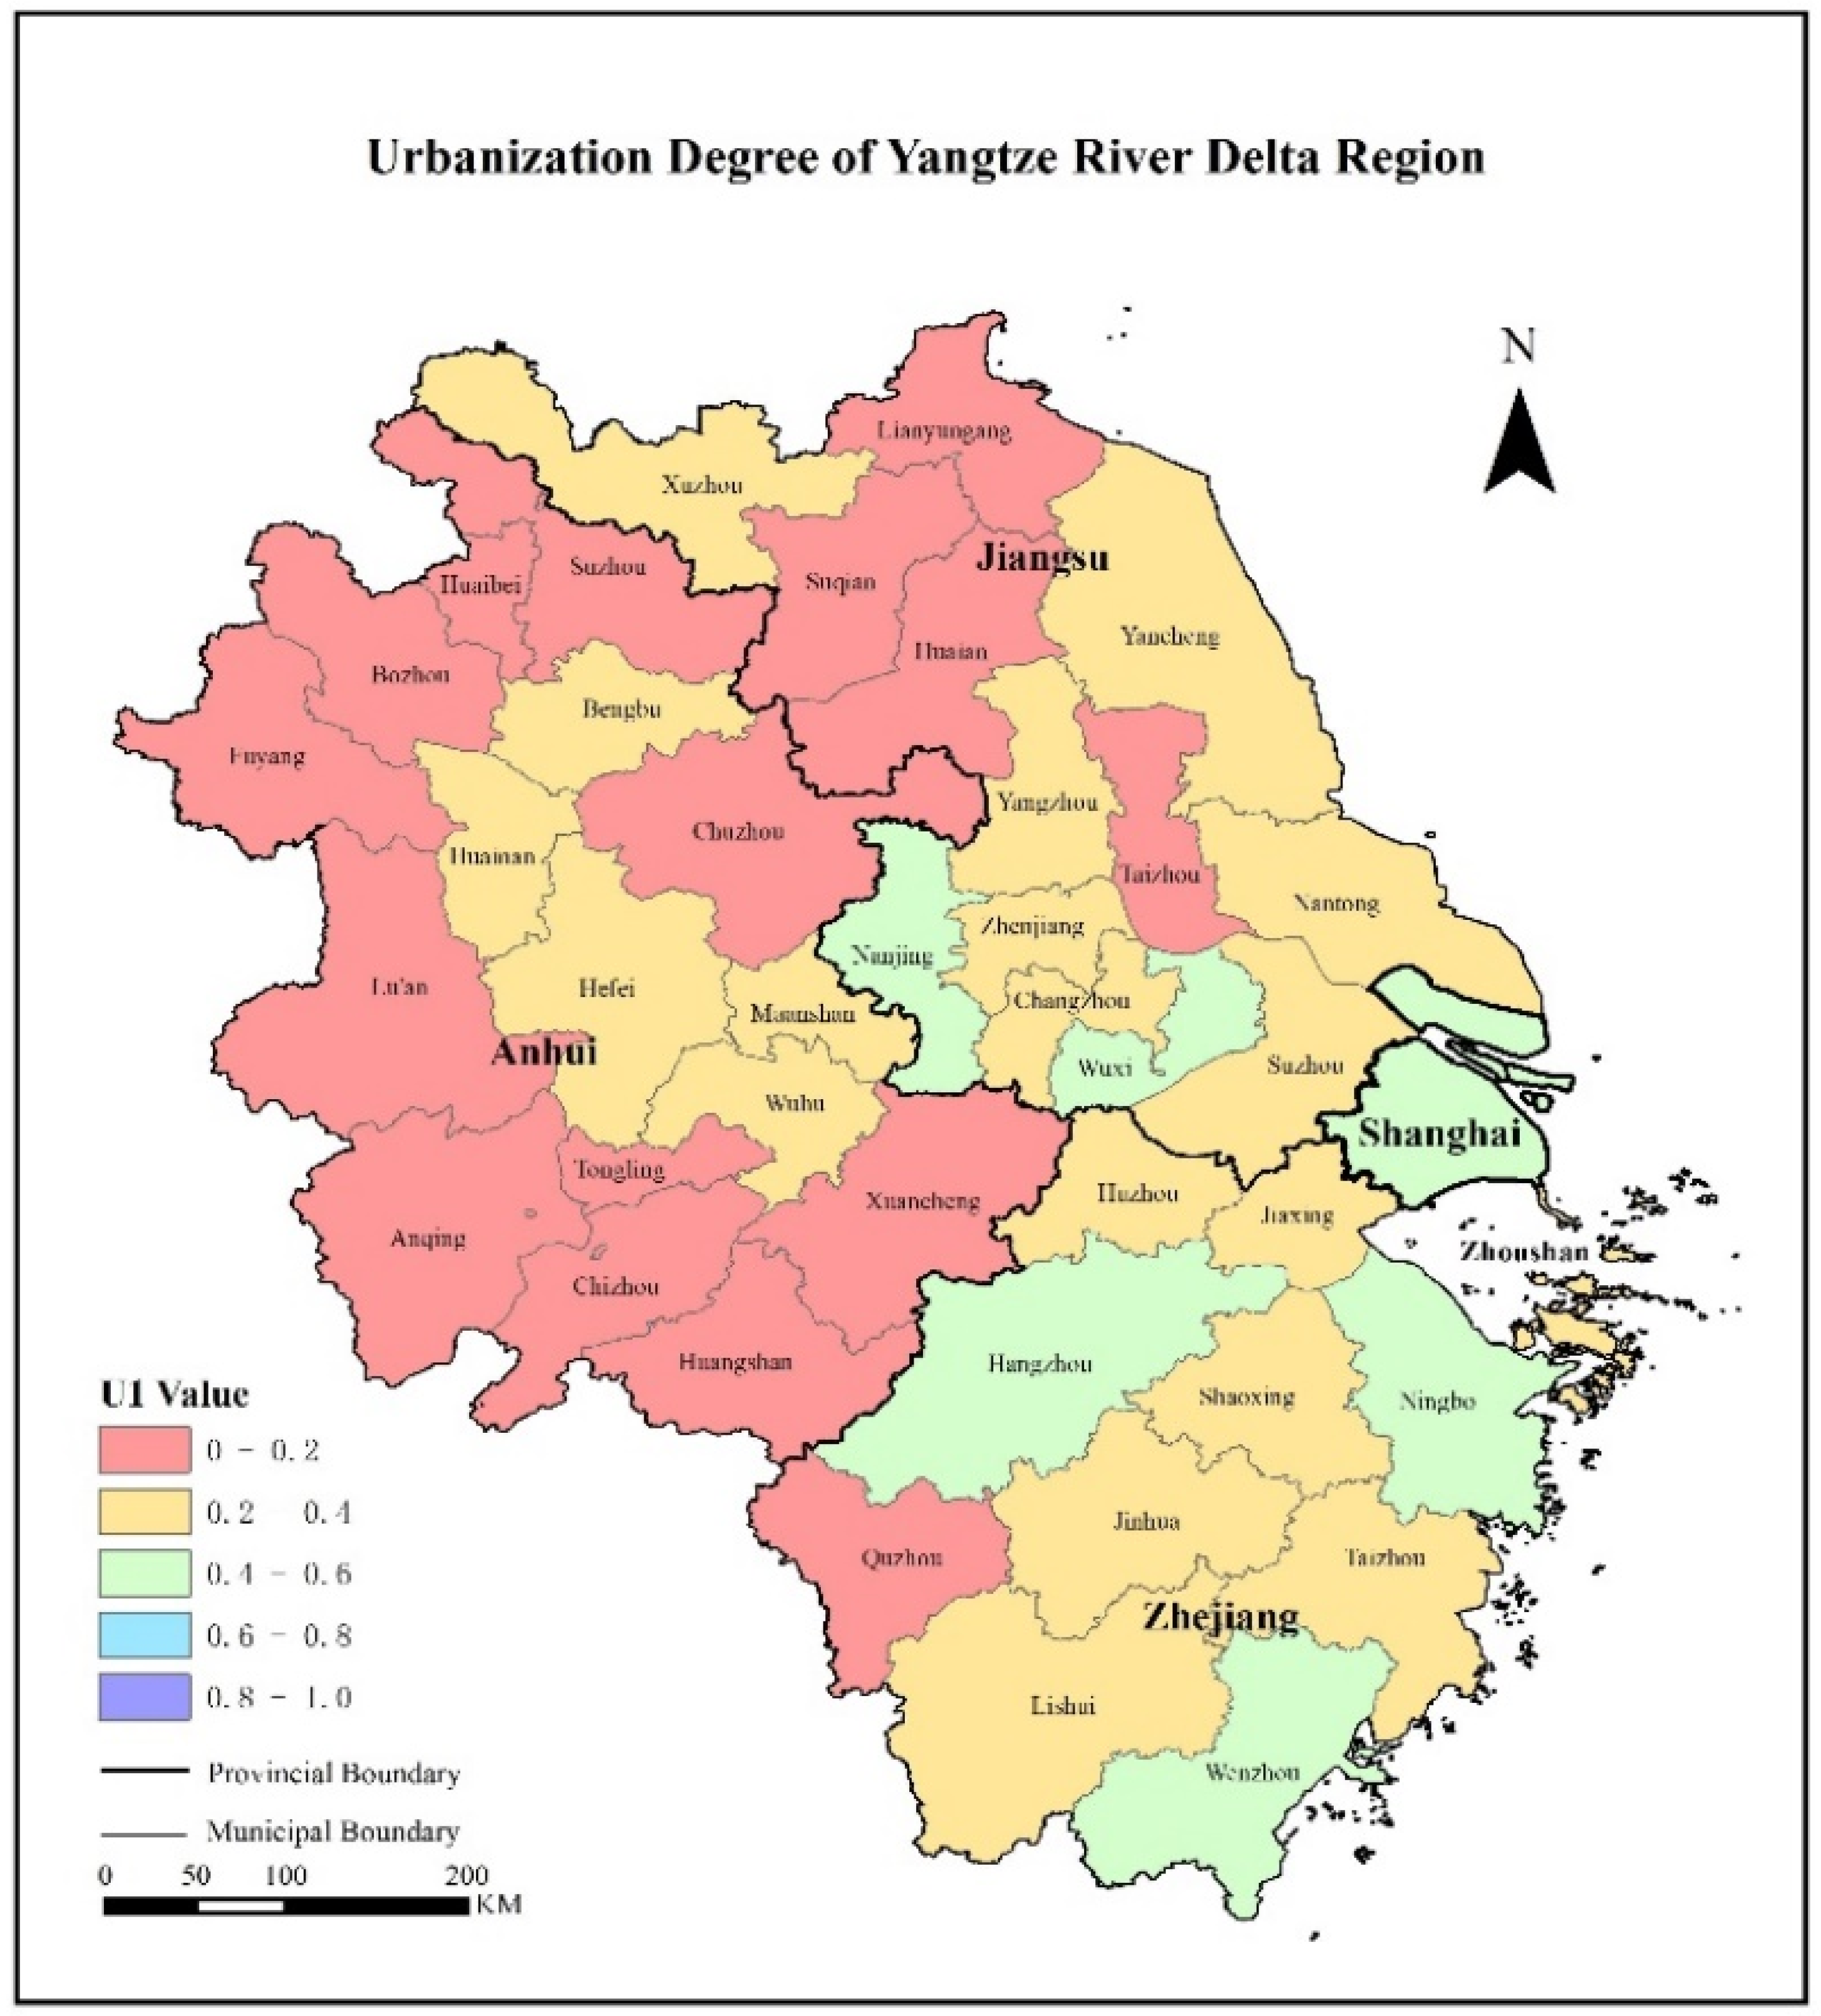
3.2. Analysis of the Urbanization System

To illustrate the urbanization development degree in the Yangtze River Delta Region, we applied a bar chart and a map, as shown in Figure 2 and Figure 3, respectively.
Urbanization development shows a trend within each province that is proportional to the economic level. The provincial capitals of Zhejiang Province, Jiangsu Province, and Anhui Province (i.e., Hangzhou City, Nanjing City, and Hefei City, respectively) ranked the highest in their respective provinces. Comparing interprovincial discrepancies, Zhejiang Province ranked first, with the highest level of 0.56 and the average level of 0.34. Following was Jiangsu Province, with a slightly lower level of urbanization degree, whose highest level was 0.48 and the average level was 0.28. There is a large gap between the level of urbanization development in Anhui Province and the other two provinces, with Hefei (0.37), which has the highest level in Anhui Province, only ranking in the medium level of the other two provinces. Its average level was 0.19, which was much lower than others.
As shown in Figure 3, the levels of urbanization development are uneven within the region, decreasing from the southeast part to the northwest part. There was no city whose degree was higher than 0.6. Coastal cities, led by Shanghai (0.50) and Ningbo (0.48), have relatively high levels. For the inland areas, except for Hangzhou (0.56), Nanjing (0.48), and Wuxi (0.47), most of the cities have relatively low levels of urbanization, which is closely related to their level of economic development. The overall average level in the Yangtze River Delta Region was 0.27, showing a relatively low level of urbanization.

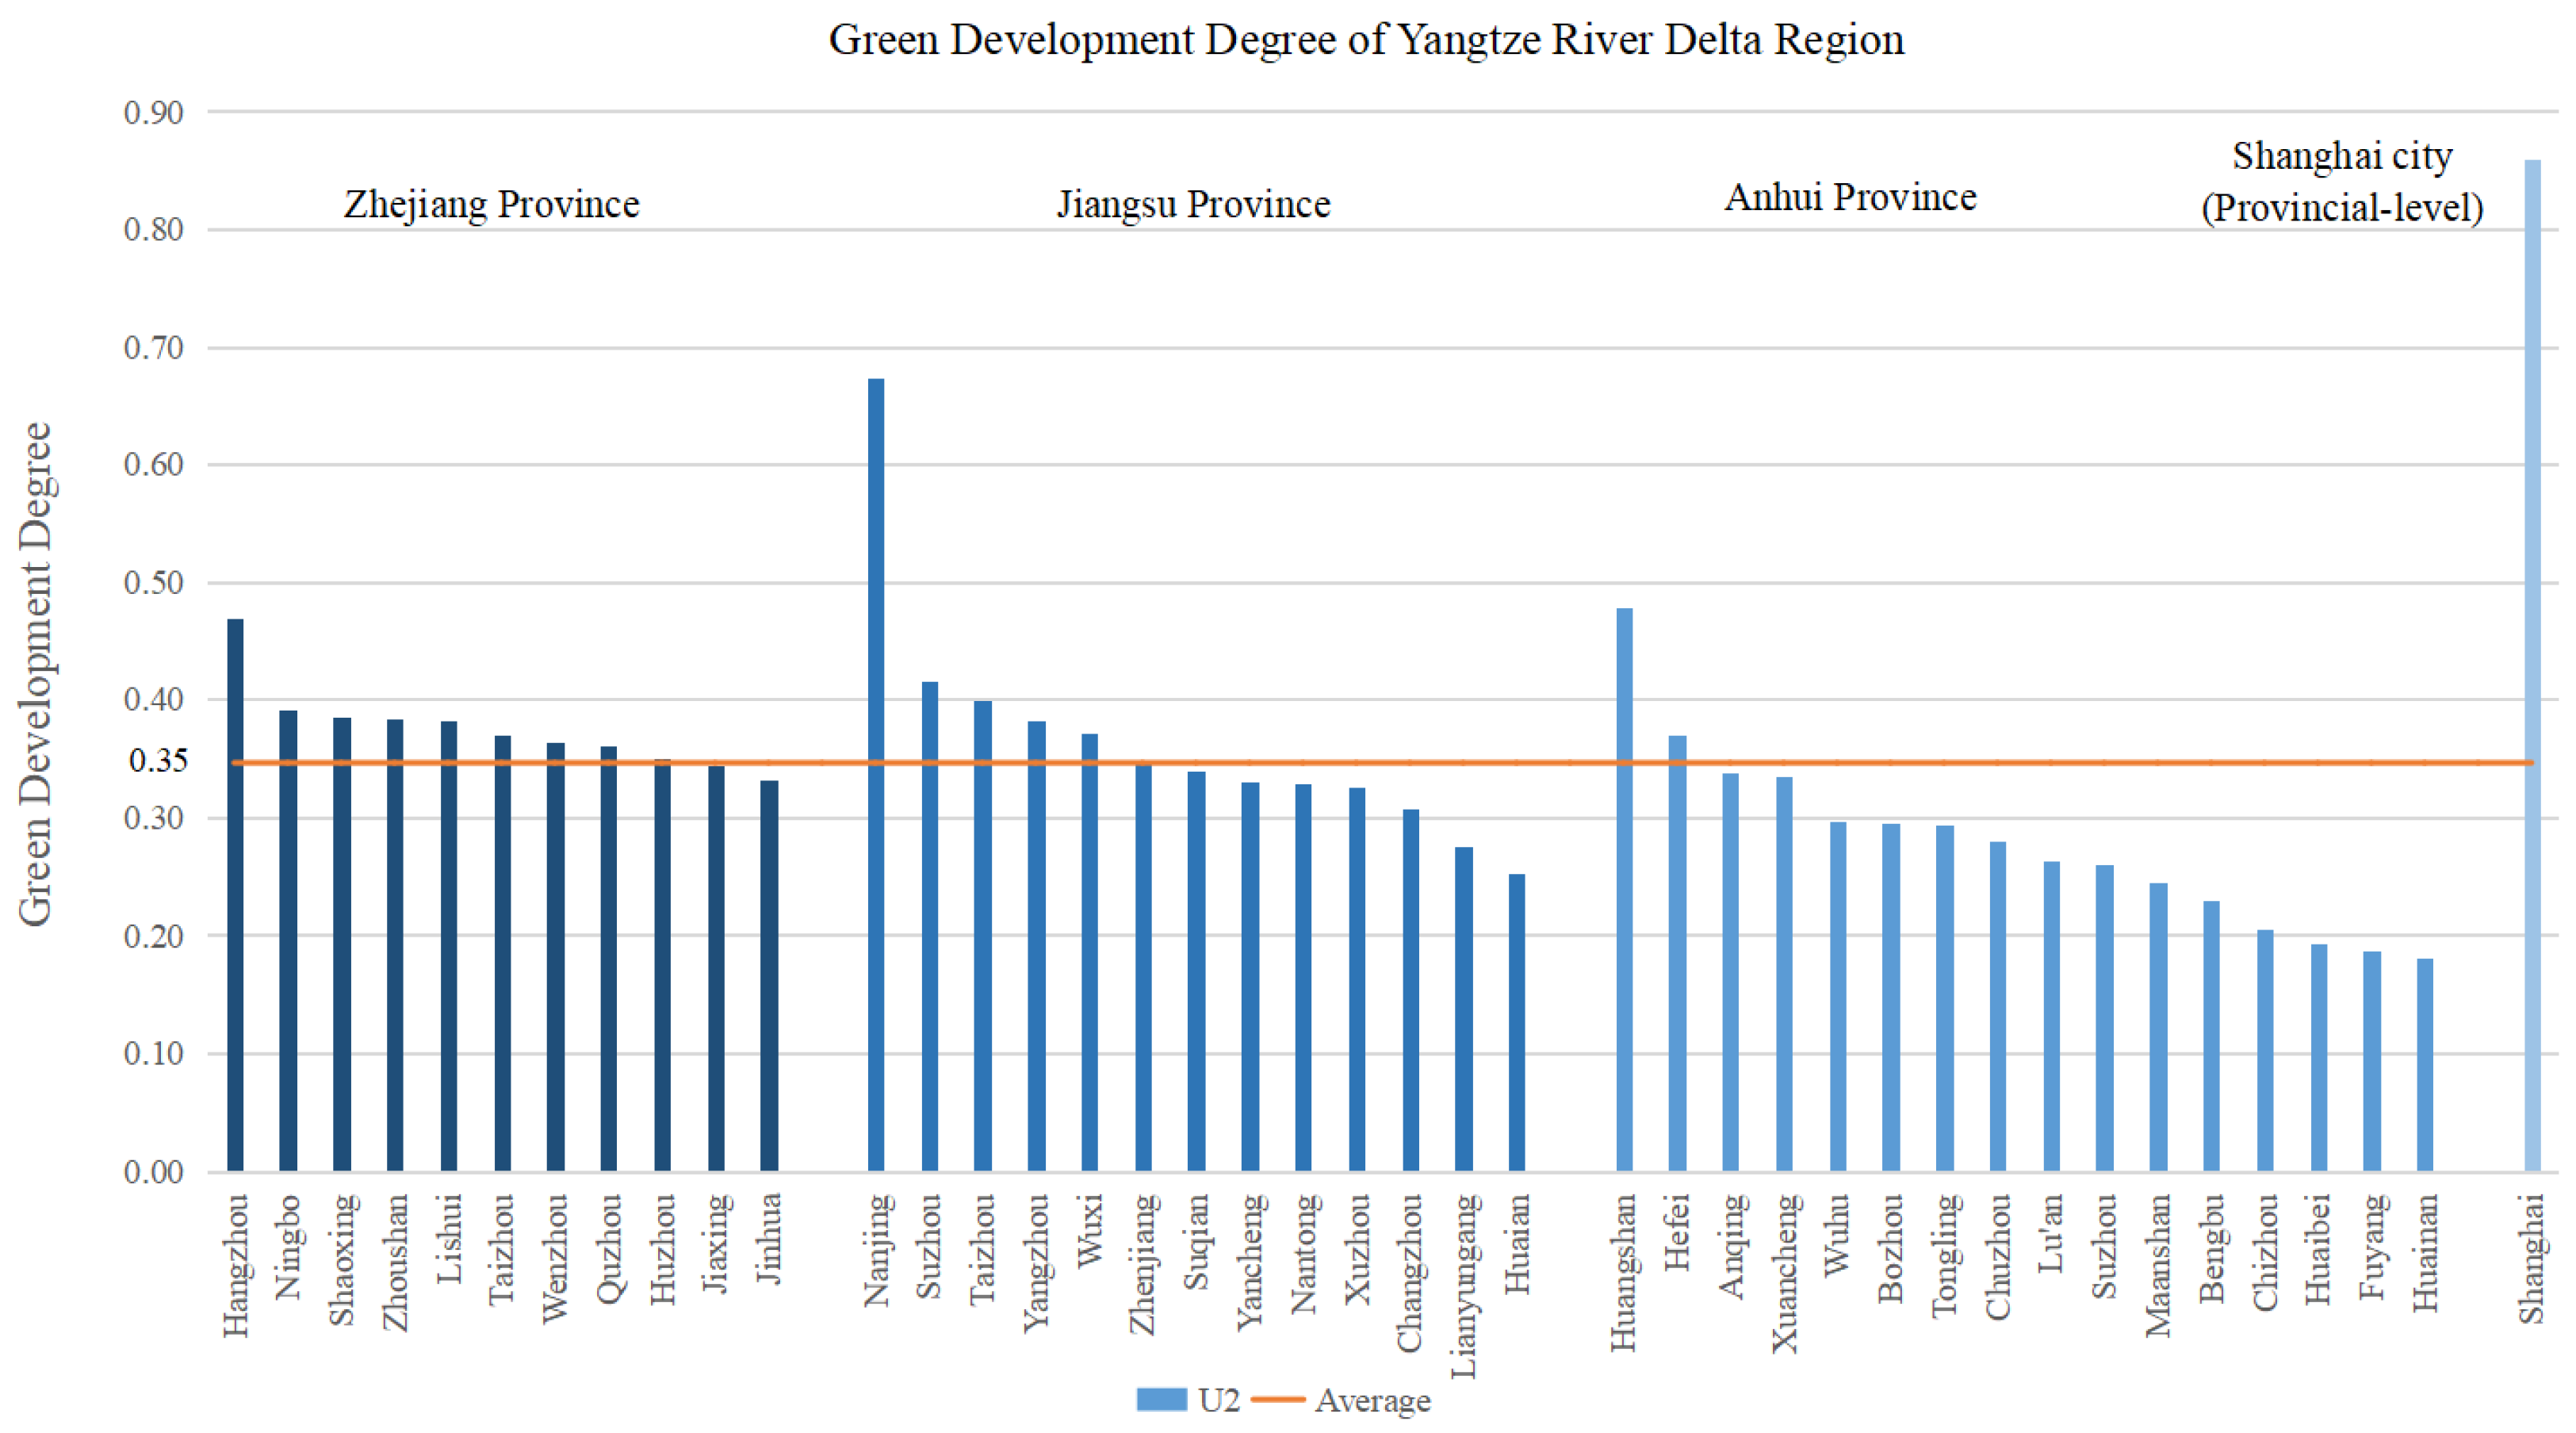
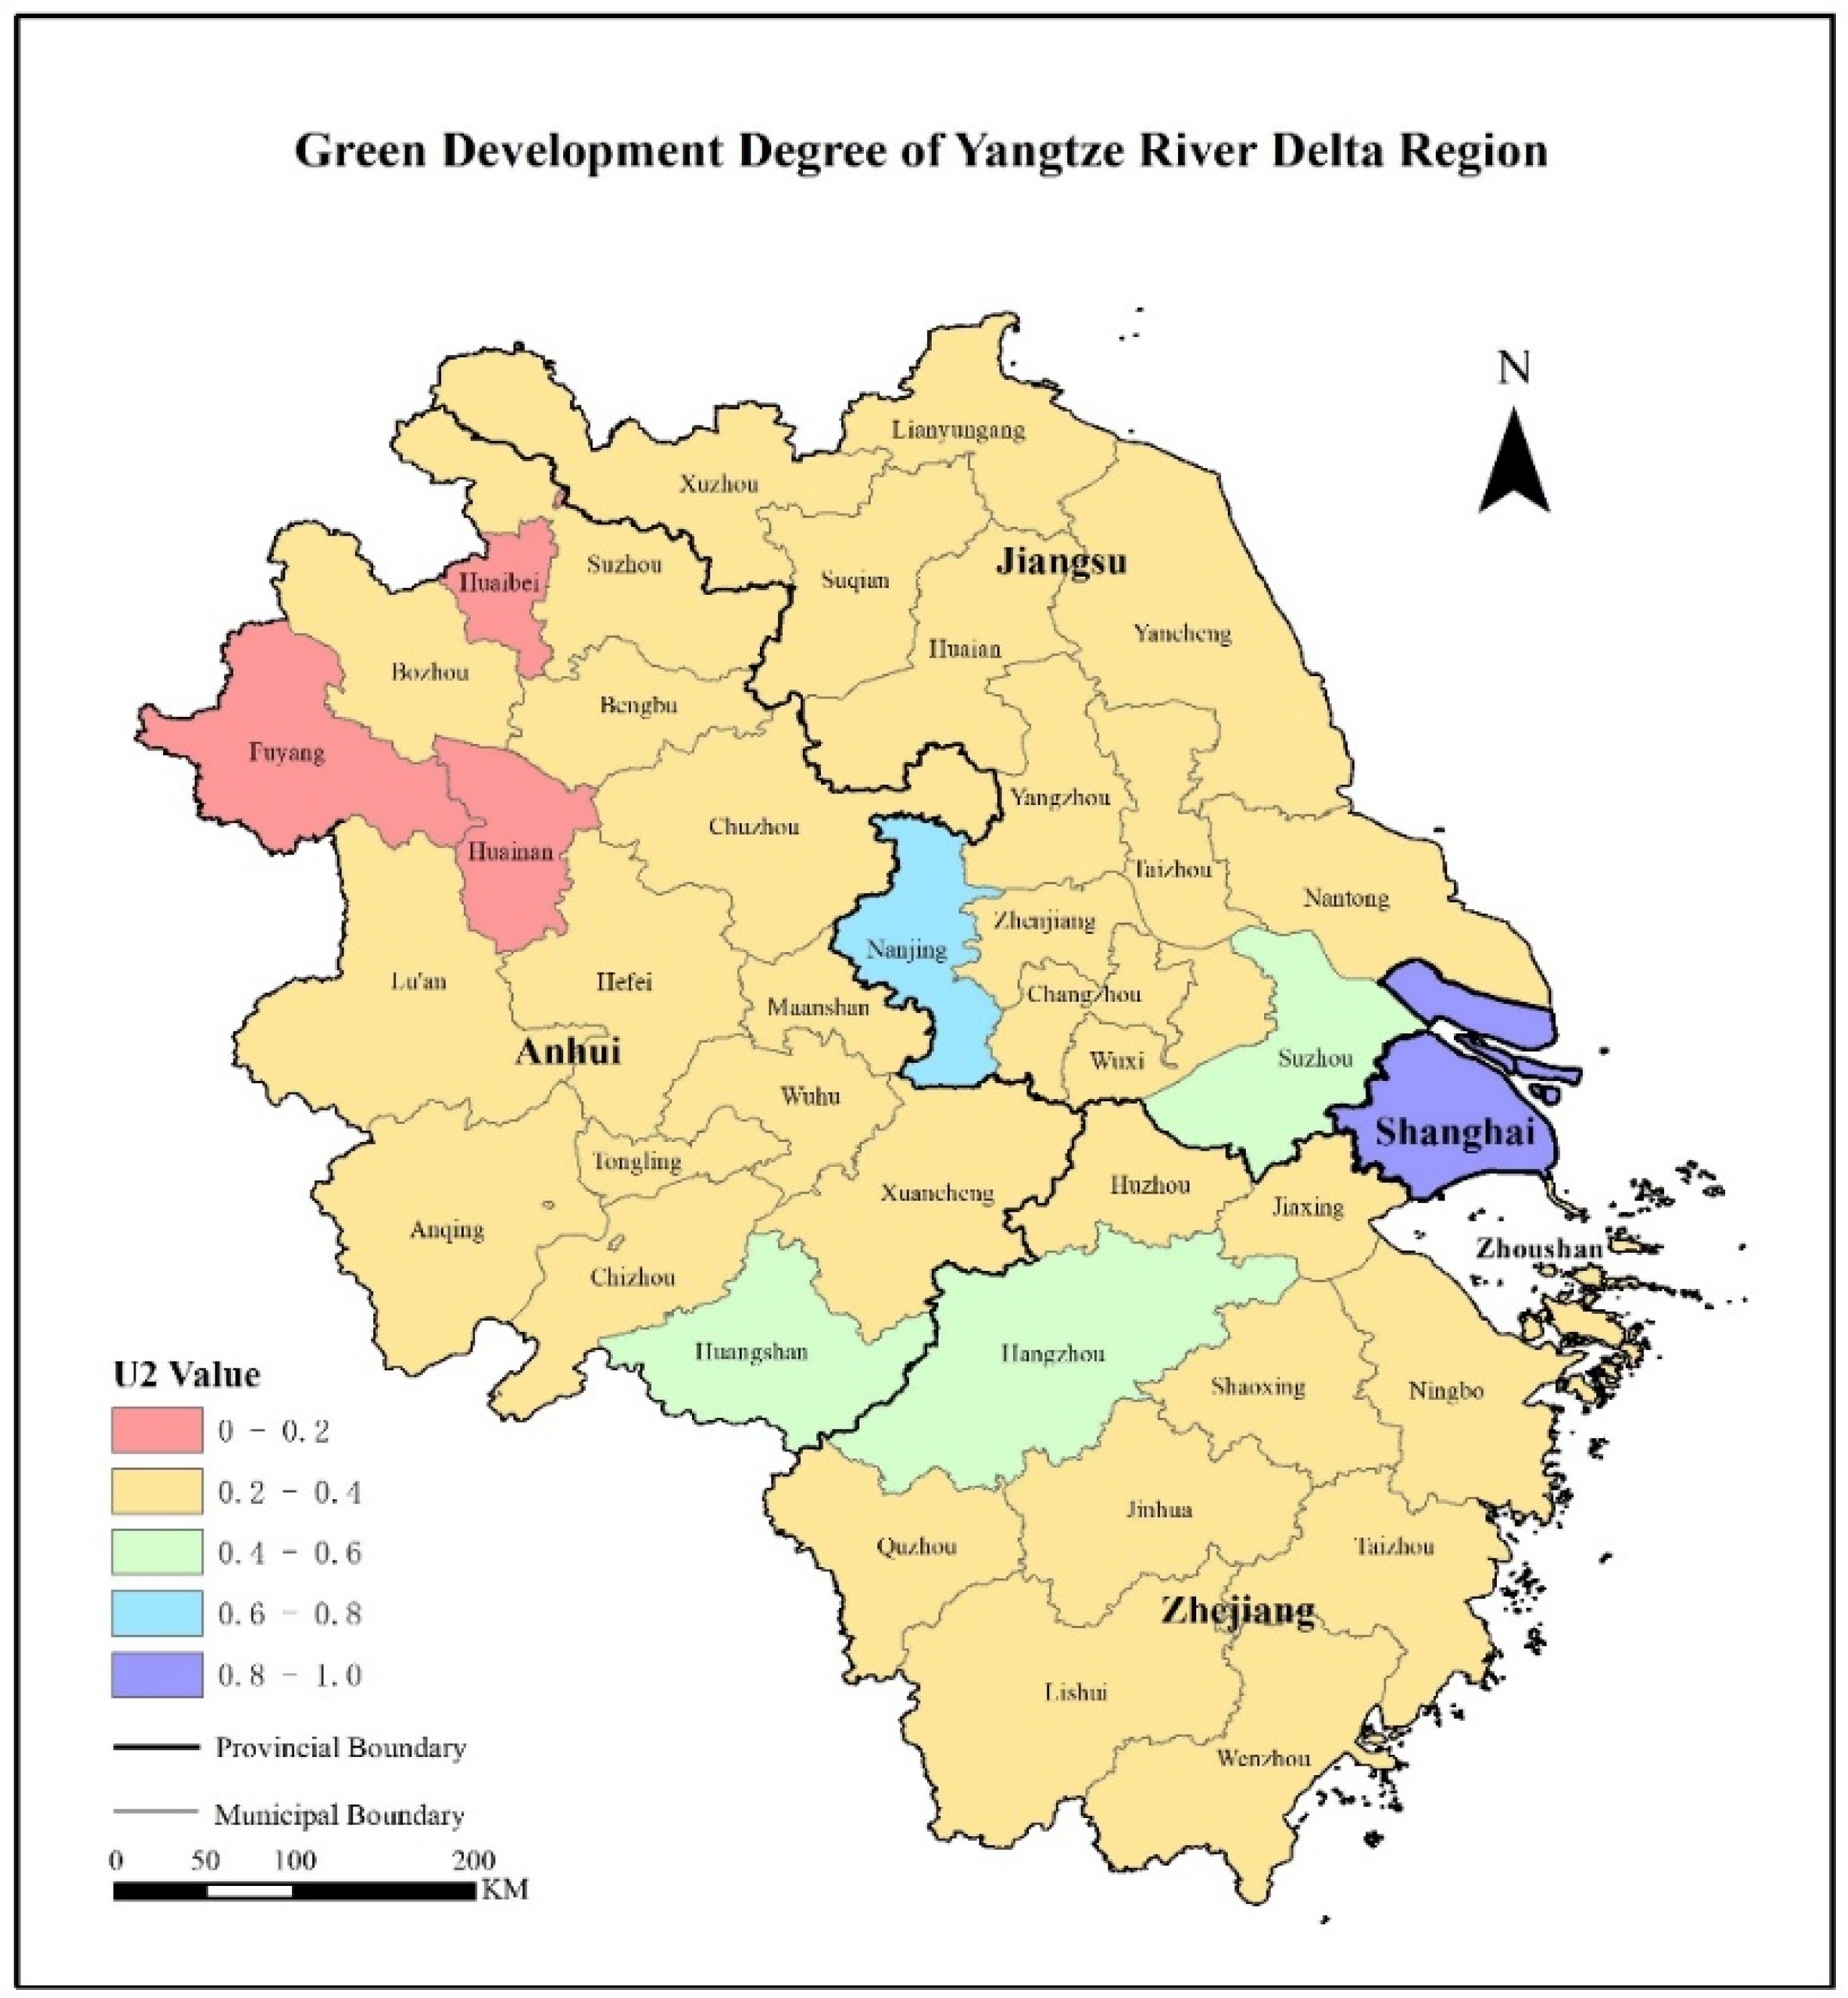
3.3. Analysis of the Green Development System

We present a bar chart and a map to illustrate the green development degree in the Yangtze River Delta Region, respectively. As shown in Figure 4, the level of green development shows a trend within each province that is also proportional to the level of the economy. Shanghai (0.86) was particularly high among all the cities. The provincial capitals of Zhejiang and Jiangsu (Hangzhou and Nanjing) ranked the highest in these two provinces. However, as for Anhui province, Huangshan ranked first, at 0.48, due to its developed tourism and urban greening. Comparing interprovincial disparity, the three provinces had generally similar average levels to each other, at 0.38 (Zhejiang Province), 0.37 (Jiangsu Province), and 0.28 (Anhui Province), respectively, except for Nanjing City (0.67), Huangshan City (0.48), Hangzhou City (0.47), Suzhou City (0.42), which were relatively higher, which followed Shanghai City. In general, the overall average level of green development in the Yangtze River Delta Region was 0.35, which was a relatively low level.
As shown in Figure 5, the green development of all the cities was at a low level, which was in a range from 0.2 to 0.4, except for five cities including Shanghai, Nanjing, Huangshan, Hangzhou, and Suzhou. The green development degrees in the northwest part of Anhui province were particularly low, caused by lagging economic development and lack of attention.

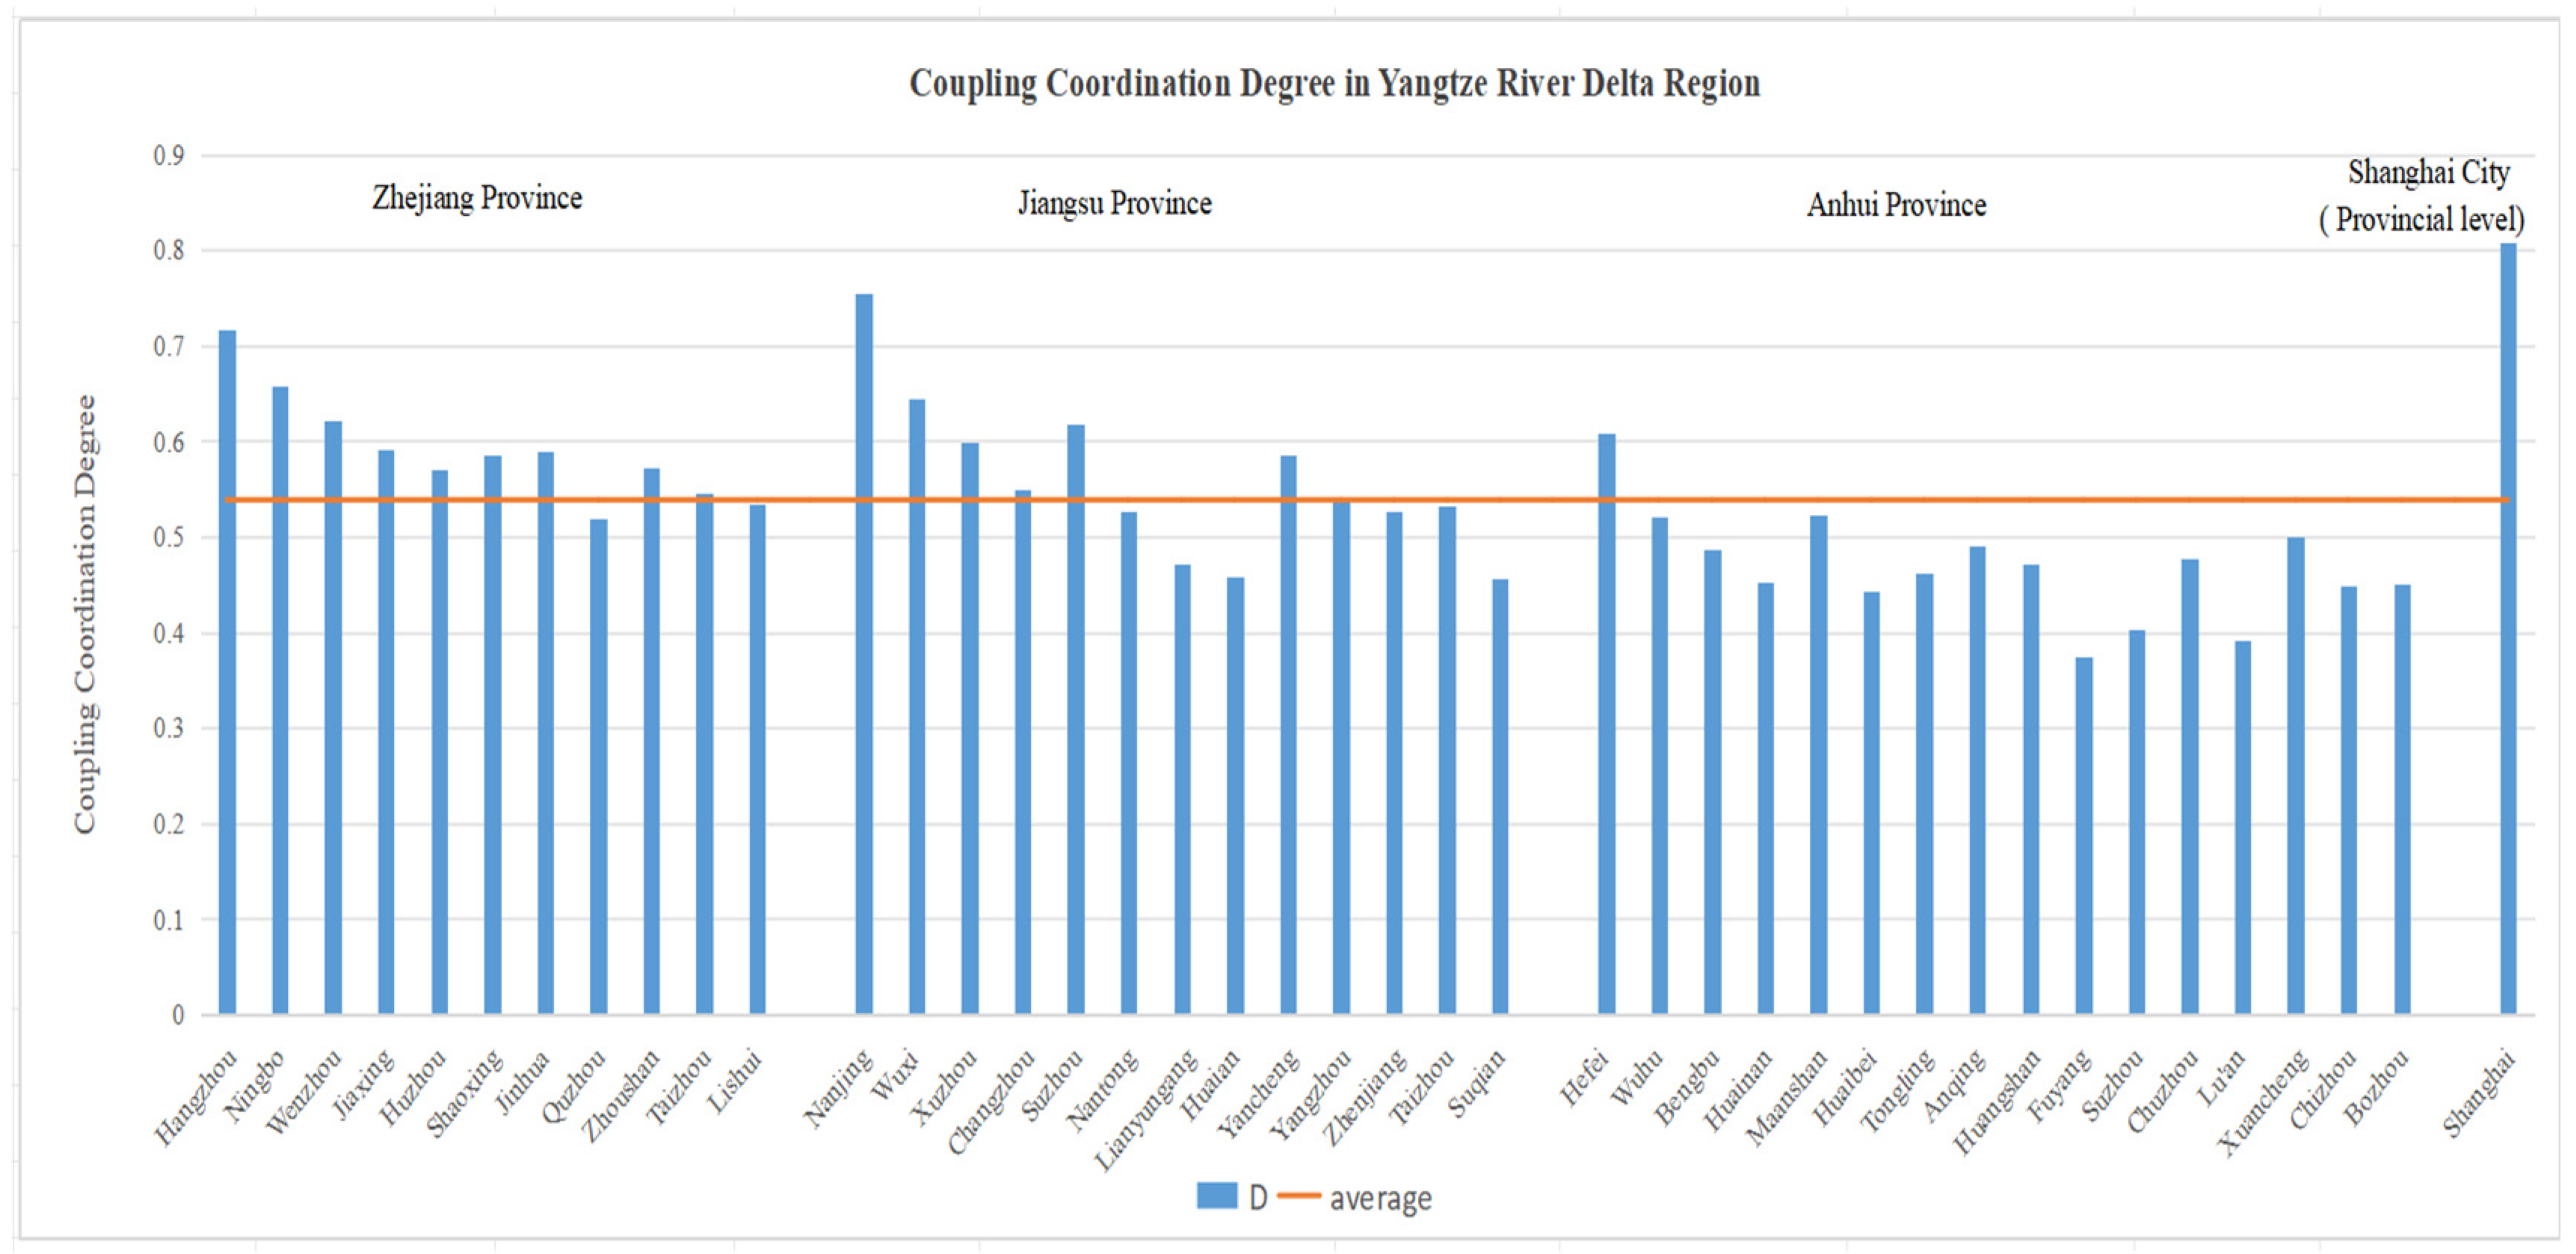
3.4. Analysis of the Coupling Coordination Degree

The coupling coordination degree model (CCDM) proposed in this study was designed with the following objectives in mind: (1) to reveal the current average development level of urbanization and green development in the 41 cities; (2) to evaluate the current level and development of the coupling of urbanization and green development; (3) to explore different influences on the parameters of the coupling model in different provinces [24].
According to the distribution of the degree of urbanization (U1) and the degree if green development (U2), the value of the comprehensive efficacy of the subsystem, or the value of the degree of coordination (D), is between 0 and 1. The higher the comprehensive efficacies that the urbanization and green development subsystems contribute to the whole system, the more harmonious their relationship is, and the higher the value of the D will be. Figure 6 and Figure 7 illustrate the coupling coordination degree in the Yangtze River Delta Region, in the form of a bar chart and a map, respectively.
As shown in Figure 6, the coupling coordination degree shows a trend within each province that is proportional to the level of the economy. Shanghai (0.81) was the highest among all the cities, followed by Nanjing (0.75) and Hangzhou (0.72), which are the provincial capitals of Jiangsu and Zhejiang. Through the comparisons between different provinces, the three provinces had generally similar average levels to each other, at 0.59 (Zhejiang Province), 0.56 (Jiangsu Province), and 0.47 (Anhui Province), respectively. In general, the overall average level of coupling coordination degree in the Yangtze River Delta Region was 0.54, which is indicative of a moderate level.
As shown in Figure 7, the levels of coupling coordination are uneven within the region, relatively higher at the provincial capitals and coastal cities, and lower at the inland cities, especially in the western part of Anhui Province and the northern part of Jiangsu Province. The lower level of development in Anhui Province is driven by national policy that prioritizes the growth of coastal cities, with a strong emphasis on environmental sustainability [39]. While cities in Shanghai, Jiangsu, and Zhejiang provinces focus on advancing coastal development through sustainable practices, Anhui Province is not included in this initiative. As a result, many coastal cities exhibit higher development levels compared to inland cities. In the northern part of Jiangsu Province, slower economic growth and inherent geographical disadvantages further hinder development. Similarly, inland cities face intrinsic geographical constraints, leading to relatively lower levels of both green development and urbanization.

3.5. Data Classification and Analysis

In previous studies [40], the coupling coordination degree was divided into five categories—high coordination, moderate coordination, low coordination, mild imbalance, and moderate imbalance (shown in Table 4). Each major category is divided into three subcategories according to the difference between urbanization and green development. The classification results show that urbanization and green development in most cities are relatively balanced in different coupling coordination degrees. And in cases of imbalance, all cities exhibit urbanization lagging behind green development. It is worth mentioning that moderate imbalance only accounts for a small percentage, only Lu’an and Fuyang are in this category. The coupling coordination degree of most cities is between 0.4 and 0.6; only Ningbo, Wenzhou, Wuxi, Suzhou, and Hefei are higher than 0.6, and Shanghai, Nanjing, and Hangzhou are even higher than 0.7.

4. Discussion

4.1. Research Findings

This study identifies cities in the YRDR exhibiting five types of coordination degrees, namely, high coordination, moderate coordination, low coordination, mild imbalance, and moderate imbalance. (1) There are only three cities that fall within the high coordination category, including Shanghai, Nanjing, and Hangzhou. (2) There are five cities, including Ningbo, Wenzhou, Wuxi, Suzhou, and Hefei, in the moderate coordination category, which have relatively balanced urbanization and green development degrees. (3) The second- to third-tier cities, including Jiaxing, Huzhou, Shaoxing, Jinhua, Xuzhou, Changzhou, Nantong, Yancheng, Wuhu, and Maanshan, belong to the low coordination of balanced development of urbanization level and green development level category, and Quzhou, Zhoushan, Taizhou, Lishui, Yangzhou, Zhenjiang, and Taizhou belong to the low coordination of lagging urbanization level category. Zhoushan, Taizhou, Lishui, Yangzhou, Zhenjiang, and Taizhou are in the low coordination of lagging urbanization level category. (4) Lianyungang, Huaian, Bengbu, Huainan, Huaibei, Chuzhou, and Chizhou are relatively balanced in terms of urbanization and green development in the mild imbalance category, while Suqian, Tongling, Anqing, Huangshan, Suzhou, Xuancheng, and Bozhou lag in urbanization. (5) The moderate imbalance category, which is not ideal, includes only two cities, Fuyang and Lu’an, where the urbanization level of Lu’an is lagging in green development, and both are at a very low level. The reasons for the cities being categorized into different categories are discussed below.
For cities with high coordination, based on the economic development level of these three cities, it can be deduced that the higher the overall economic level, the more positive the effect on the urbanization and green development. When the overall level of society has reached a certain height, the government and the people have more energy to focus on the ecological environment, and more resources and money are spent on harmonizing human–nature–society development. For Shanghai and Nanjing lagging in urbanization, the possible reason is that these two cities have been at a relatively high level of urbanization for a long time, and they have been more concerned about the development of urban greening and other objectives in recent years. Hangzhou, as a newly promoted first-tier city, has been committed to the rapid development of urban construction (i.e., new office buildings, housing, large shopping malls, etc.) in recent years, and the degree of green development is not excessively higher than the level of urbanization.
For the cities with moderate coordination, the reason for this is probably that they have adopted a steady development strategy while maintaining high ecological and environmental quality. Therefore, there is no obvious gap between these two systems. For cities with low coordination, their overall social development is not as high as that of provincial capitals or coastal cities. However, compared with highly developed cities, these cities have a relatively high level of green development and follow good practices in ecological environmental protection. In the case of lagging urbanization, the relevant governmental departments should make decisions according to the local situation and formulate strategies that combine local characteristics and sustainable development.
For cities with mild imbalance. As relatively landlocked cities, they lack opportunities for innovative development and social dividends, and they can only rely on traditional industries as the pillars of the local socio-economy. Moreover, because there are many cities in the Yangtze River Delta Region with the highest level of economic development in the country, these cities attract young and strong labor force and divert them away from the third- and even fourth-tier cities, which further hampers the vitality of the development of these third- and fourth-tier cities. For cities with moderate imbalance, apart from their geographic location, which is not conducive to development, the level of attention to social development and the ecological environment has also hindered the development of these two cities to a great extent. They should quickly idnetify the existing problems and formulate strategies that are suitable for their low level of development, ensuring they do not neglect the protection of the environment while vigorously strengthening the level of urbanization.

4.2. Political Implications

First, the differences in inter-regional development should be narrowed in terms of both urbanization and green development to ensure good coordination among cities. Some promising paths might be to strengthen commute infrastructure so that people can conveniently travel between cities in the Yangtze River Delta. Then, to achieve radiation diffusion, the provincial capitals need function as satellite hubs, spreading influence to other cities [41]. Provinces need to prioritize the development of provincial capitals (Hangzhou, Nanjing, and Hefei), which experience a fast pace of economic development, and radiate that to the remaining cities, thus driving the economic development of the Yangtze River Delta city cluster.
Secondly, to foster urban development and enhance competitiveness, cities can implement various favorable policies to attract both high-end talent and enterprises. To encourage the migration of high-end talent, cities have introduced a range of supportive policies aimed at promoting socio-economic growth. Talented individuals with bachelor’s degrees or above can receive local registered permanent residence, along with reduced or waived costs for buying a house, etc. The inflow of talents can promote scientific and technological innovation, enhance the number of patent property rights, improve competitive advantage, and promote the rational use of resources and economic development. In order to attract enterprises, cities might also consider providing preferential policies. The presence of enterprises can bring about a large number of employment opportunities, industrial talent, or labor demand, attracting foreign employment and promoting the development of urbanization.
Third, integrating the synchronous development of urbanization and green growth into the policy implementation system is essential. In 2019, the State Council of the People’s Republic of China introduced an outline for integrated regional development and provided support to cities in the YRDR [42]. For the core cities, the coupling and coordination of urbanization and green development are high enough, while that of most cities is not very high. Therefore, it is imperative to promote the timely and simultaneous development of both advantaged and disadvantaged regions and consciously enhance the development level of the latter.

4.3. Strengths and Limitations

4.3.1. Strengths

This study boasts two primary strengths as follows: (1) Theoretically, it delves deep into the intricate interplay between green development and urbanization, examining their spatial heterogeneity to shed light on the inherent synergies within their nexus from a spatial perspective. Furthermore, the study explores how urban landscapes evolve and transform under the influence of green development initiatives, elucidating the spatial patterns and interactions that define this symbiotic relationship. China’s commitment to green development is reflected in its “dual carbon” policy framework, which aims to achieve carbon peaking by 2030 and carbon neutrality by 2060. The Carbon Peaking and Carbon Neutrality Action Plan sets ambitious targets, including increasing the share of non-fossil energy consumption to 20% and reducing carbon emissions per unit of GDP by 18% by 2025. Additionally, the 14th Five-Year Plan (2021–2025) emphasizes the construction of a new power system centered on renewable energy, fostering the growth of green industries and improving energy efficiency. At the urban level, low-carbon transformation efforts have been actively promoted through initiatives such as green building standards, smart transportation systems, and the development of “sponge cities”, which enhance urban resilience to water-related challenges. However, despite strong national policies, regional disparities exist, with provinces and cities adopting green development strategies at varying paces, influenced by their economic structures and policy priorities. This variation further shapes the spatial dynamics of urban transformation under the green development agenda. (2) Empirically, this is an enhanced case study with a specific emphasis on the YRDR. By conducting an in-depth examination of the YRDR’s green development landscape, this study might provide insights into practices that can guide future policy formulation and implementation in comparable contexts.

4.3.2. Limitations

This study has the following limitations: (1) For the urbanization and green development index systems, other factors might exist which are not taken into consideration. That is, these two index systems remain to be optimized. (2) Given that this research adopts statistical data and geographical data, excluding first-hand data (field investigation, questionnaires, etc.), some bias might occur, and multi-source data can be integrated in further studies. (3) The statistical data adopted in this study are only representative of one year of panel data, and time-series data remain to be integrated to further reveal more underlying dynamic mechanisms based on the analysis of trends in recent years.

5. Conclusions

This study investigated the relationship between urbanization and green development in the YRDR in China through the Coupling Coordination Degree (CCD) model and spatial analysis methods. Three major conclusions were drawn as follows: Firstly, although all 41 cities in the YRDR exhibited a relatively coordinated relationship between urbanization and green development, significant spatial heterogeneity was evident. Some cities lagged in either green development or urbanization, highlighting the uneven progress across the region. This underscores the importance of tailored regional policies that address these disparities. Secondly, provincial capital cities consistently exhibited the highest CCD values, showcasing their stronger alignment between urban and green development. This underscores their role as leaders and the importance of scaling best practices through policy frameworks that could be replicated in other cities. Lastly, spatial clustering patterns revealed that neighboring cities influence one another’s development trajectories, emphasizing the critical need for regional collaboration and policy integration to achieve sustainable development. Policy integration at the regional level could help harmonize urbanization and green development efforts, ensuring balanced growth across the YRDR. These findings offer valuable insights for policymakers to design targeted strategies aimed at fostering balanced growth and promoting green governance in the region.

Author Contributions

Conceptualization, Y.J. and Q.M.; Methodology, Y.Y. and Y.L.; Software, Y.Y. and Y.L.; Formal analysis, Y.Y. and Y.L.; Investigation, Y.Y. and Y.L.; Resources, Y.J. and Q.M.; Writing—original draft, Y.Y. and Y.L.; Writing—review & editing, Y.J. and Q.M.; Supervision, Y.J. and Q.M.; Funding acquisition, Y.J. and Q.M. All authors have read and agreed to the published version of the manuscript.

Funding

This research was funded by the Natural Science Foundation of China, grant number [42201214], the General scientific research project of Zhejiang Education Department, grant number [Y202249631], the General Fund Project of Ningbo Natural Science Foundation, grant number [20221JCGY010743], and the National Social Science Foundation of China, grant number [21&ZD184].

Data Availability Statement

The data is available on request from the corresponding author. The data is not publicly available.

Conflicts of Interest

The authors declare no conflicts of interest.

References

  1. Zhao, J. Financial Geographical Structure and the Gap of Green Development: Evidence from Chinese Cities. Geogr. Res. 2022, 2022, 6134985. [Google Scholar]
  2. Dinda, S.; Chatterjee, N.D.; Ghosh, S. An integrated simulation approach to the assessment of urban growth pattern and loss in urban green space in Kolkata, India: A GIS-based analysis. Ecol. Indic. 2021, 121, 107178. [Google Scholar]
  3. Yu, B. Ecological effects of new-type urbanization in China. Renew. Renew. Sustain. Energy Rev. 2021, 135, 110239. [Google Scholar]
  4. Liang, L.; Chen, M.; Lu, D. Revisiting the relationship between urbanization and economic development in China since the reform and opening-up. Chin. Geogr. Sci. 2022, 32, 1–15. [Google Scholar] [CrossRef]
  5. Qu, W.H.; Xu, L.; Qu, G.H.; Yan, Z.J.; Wang, J.X. The impact of energy consumption on environment and public health in China. Nat. Hazards 2017, 87, 675–697. [Google Scholar]
  6. Hao, Y.; Xu, L.; Guo, Y.; Wu, H. The inducing factors of environmental emergencies: Do environmental decentralization and regional corruption matter? J. Environ. Manag. 2022, 302, 114098. [Google Scholar] [CrossRef]
  7. Qin, C.; Yang, C.; Zhang, M.; Zhu, B. Does high-speed rail improve green development? Evidence from a quasi-natural experiment. J. Clean. Prod. 2023, 407, 137174. [Google Scholar]
  8. Wang, Y.; Wang, K.; Guo, F. Green Development Evaluation of Tai’an Based on Entropy Method. Geogr. Res. 2022, 2022, 8472758. [Google Scholar] [CrossRef]
  9. Xiong, W.; Guo, X.; Sun, Y.; Ou, J.-J. Green standard and green development: Theory and empirical evidence. J. Clean. Prod. 2023, 414, 137768. [Google Scholar] [CrossRef]
  10. Zhao, Y.; Zhang, Q.; Zhang, H.; Huang, S. Spatio-temporal patterns and driving factors of green development level in alpine meadow regions: A case study in Gannan Tibetan Autonomous Prefecture. Ecol. Indic. 2024, 168, 112751. [Google Scholar]
  11. Jiang, H.; Sun, T. Unravelling the impact pathways of green innovation and environmental regulation on China’s green development efficiency goals: Direct and spillover effects. Ecol. Indic. 2024, 168, 112713. [Google Scholar]
  12. Ling, J.; Peng, J.; Peng, T. Can institutional opening-up promote green development in cities? Evidence from China’s Pilot Free Trade Zones. J. Clean. Prod. 2024, 473, 143573. [Google Scholar]
  13. Holland, S.P.; Hughes, J.E.; Knittel, C.R. Greenhouse gas reductions under low carbon fuel standards? Am. Econ. J. Macroecon. Econ. Policy 2009, 1, 106–146. [Google Scholar]
  14. Wan, H.; He, G.; Li, B.; Zeng, J.; Cai, Y.; Shen, X. Coupling coordination relationship between urbanization and water environment in China. J. Clean. Prod. 2024, 472, 143423. [Google Scholar]
  15. Zhai, Y.; Zhai, G.; Yu, Z.; Lu, Z.; Chen, Y.; Liu, J. Coupling coordination between urbanization and ecosystem services value in the Beijing-Tianjin-Hebei urban agglomeration. Sustain. Cities Soc. 2024, 113, 105715. [Google Scholar]
  16. Lei, X.; Liu, H.; Li, S.; Luo, Q.; Cheng, S.; Hu, G.; Wang, X. Coupling coordination analysis of urbanization and ecological environment in Chengdu-Chongqing urban agglomeration. Ecol. Indic. 2024, 161, 111969. [Google Scholar]
  17. Chengjing, N.; Yixuan, L.; Linsheng, Y.; Li, W.; Fengying, Z. Spatio-temporal characteristics and coupling coordination relationship between urbanization and atmospheric particulate pollutants in the Bohai Rim in China. Ecol. Indic. 2023, 153, 110387. [Google Scholar]
  18. Shao, M.; Wu, L.; Li, F.; Lin, C. Spatiotemporal dynamics of ecosystem services and the driving factors in urban agglomerations: Evidence from 12 national urban agglomerations in China. Front. Ecol. Evol. 2022, 10, 804969. [Google Scholar] [CrossRef]
  19. Bi, Y.; Zheng, L.; Wang, Y.; Li, J.; Yang, H.; Zhang, B. Coupling relationship between urbanization and water-related ecosystem services in China’s Yangtze River Economic Belt and its socio-ecological driving forces. Ecol. Indic. 2023, 146, 109871. [Google Scholar]
  20. Shi, J.-G.; Xu, K.; Duan, K. Investigating the intention to participate in environmental governance during urban-rural integrated development process in the Yangtze River Delta Region. Environ. Sci. Policy 2022, 128, 132–141. [Google Scholar]
  21. Dong, C.; Hu, X.; Zhang, Y.; Liang, Q. Yangtze River Delta in China space-time effect research on influencing factors for ecological civilization construction. Ecol. Indic. 2023, 153, 110442. [Google Scholar] [CrossRef]
  22. Zou, Z.-H.; Yun, Y.; Sun, J.-N. Entropy method for determination of weight of evaluating indicators in fuzzy synthetic evaluation for water quality assessment. J. Environ. Sci. 2006, 18, 1020–1023. [Google Scholar] [CrossRef]
  23. Zhou, J.; Xu, N.; Zhang, W.; Ning, X. Can agricultural low-carbon development benefit from urbanization?—Empirical evidence from China’s new-type urbanization pilot policy. J. Clean. Prod. 2024, 435, 140388. [Google Scholar] [CrossRef]
  24. Song, Q.; Zhou, N.; Liu, T.; Siehr, S.A.; Qi, Y. Investigation of a “coupling model” of coordination between low-carbon development and urbanization in China. Energy Policy 2018, 121, 346–354. [Google Scholar] [CrossRef]
  25. Jing, Y.; Liu, Y.L. Quantifying the spatiality of urban leisure venues in Wuhan, Central China-GIS-based spatial pattern metrics. Sustain. Cities Soc. 2018, 40, 638–647. [Google Scholar] [CrossRef]
  26. Jing, Y.; Shu, J.J.; Wang, R.; Zhang, X. Tempo-spatial variability of urban leisure functional zones: An analysis based on geo-big data. Growth Change A J. Urban Reg. Policy 2021, 52, 1852–1865. [Google Scholar] [CrossRef]
  27. Wang, H.; Lu, X.; Feng, L.; Yuan, Z.; Tang, Y.; Jiang, X. Dynamic change and evolutionary mechanism of city land leasing network—Taking the Yangtze River Delta region in China as an example. Land Use Policy 2023, 132, 106821. [Google Scholar] [CrossRef]
  28. Zeng, S.; Gu, J. Coordination evaluation and dynamic adjustment mechanism of China’s green development at inter-provincial level. Ecol. Indic. 2023, 153, 110419. [Google Scholar] [CrossRef]
  29. Ariken, M.; Zhang, F.; Chan, N.W.; Kung, H.-T. Coupling coordination analysis and spatio-temporal heterogeneity between urbanization and eco-environment along the Silk Road Economic Belt in China. Ecol. Indic. 2021, 121, 107014. [Google Scholar] [CrossRef]
  30. Wang, J.; Wang, S.; Li, S.; Feng, K. Coupling analysis of urbanization and energy-environment efficiency: Evidence from Guangdong province. Appl. Energy 2019, 254, 113650. [Google Scholar] [CrossRef]
  31. Xiao, Y.; Zhong, J.-L.; Zhang, Q.-F.; Xiang, X.; Huang, H. Exploring the coupling coordination and key factors between urbanization and land use efficiency in ecologically sensitive areas: A case study of the Loess Plateau, China. Sustain. Cities Soc. 2020, 86, 104148. [Google Scholar] [CrossRef]
  32. Moya, S. Behavior of Endemic and Non-Endemic Species in Urban Green Infrastructures: Sustainable Strategies in Quito. Sustainability 2025, 17, 2333. [Google Scholar] [CrossRef]
  33. Cox, P.M.; Betts, R.A.; Jones, C.D.; Spall, S.A.; Totterdell, I.J. Acceleration of global warming due to carbon-cycle feedbacks in a coupled climate model. Nature 2000, 408, 184–187. [Google Scholar]
  34. Lacroix, K. Comparing the relative mitigation potential of individual proenvironmental behaviors. J. Clean. Prod. 2018, 195, 1398–1407. [Google Scholar] [CrossRef]
  35. Suki, N.M.; Sharif, A.; Afshan, S.; Suki, N.M. Revisiting the environmental Kuznets curve in Malaysia: The role of globalization in sustainable environment. J. Clean. Prod. 2020, 264, 121669. [Google Scholar]
  36. Sun, Y.; Cui, Y. Analyzing urban infrastructure economic benefit using an integrated approach. Cities 2018, 79, 124–133. [Google Scholar]
  37. Sun, Y.Y.; Liu, D.F.; Wang, P. Urban simulation incorporating coordination relationships of multiple ecosystem services. Sustain. Cities Soc. 2021, 76, 103432. [Google Scholar] [CrossRef]
  38. Xiao, Y.; Tian, K.; Huang, H.; Wang, J.; Zhou, T. Coupling and coordination of socioeconomic and ecological environment in Wenchuan earthquake disaster areas: Case study of severely affected counties in Southwestern China. Sustain. Cities Soc. 2021, 71, 102958. [Google Scholar]
  39. State Council of the People’s Republic of China. Master Plan for Territorial Space of the Yangtze River Delta Ecological and Green Integrated Development Demonstration Zone (2021–2035). 2023, The State Council of the People’s Republic of China. Available online: www.gov.cn/gongbao/content/2023/content_5745287.htm (accessed on 6 March 2025).
  40. Deng, Z.; Zong, S.; Su, C.; Chen, Z. Study on the Coupling, Coordinated Development and Driving Factors of Ecological Civilization Construction and New-type Urbanization in the Yangtze River Economic Belt. J. Econ. Geogr. 2019, 33, 78–86. [Google Scholar]
  41. National Development and Reform Commission of the People’s Republic of China. Yangtze River Delta Multi-Level Rail Transit System Plan. 2021, The State Council of the People’s Republic of China. Available online: www.ndrc.gov.cn/xxgk/zcfb/ghwb/202107/P020210706504326496368.pdf (accessed on 17 March 2025).
  42. State Council of the People’s Republic of China. Outline for Integrated Regional Development of the Yangtze River Delta. 1 December 2019, The State Council of the People’s Republic of China. Available online: www.gov.cn/gongbao/content/2019/content_5462503.htm (accessed on 6 March 2025).
Figure 1. Study site.
Urbansci 09 00089 g001
Figure 2. Bar chart of the degree of urbanization development.
Urbansci 09 00089 g002
Figure 3. Spatial cartography of the degree of urbanization development.
Urbansci 09 00089 g003
Figure 4. Bar chart of the degree of green development.
Urbansci 09 00089 g004
Figure 5. Spatial cartography of the degree of green development.
Urbansci 09 00089 g005
Figure 6. Bar chart of the coupling coordination.
Urbansci 09 00089 g006
Figure 7. Spatial cartography of the coupling coordination.
Urbansci 09 00089 g007
Table 1. Urbanization evaluation index.
SystemSub-SystemIndicatorsUnitAttribute
UrbanizationEconomic Urbanization Per capita disposable income of urban and rural residentsRMB+
Urban population densityPerson per square meter+
Gross industrial product as a percentage of GDP%+
Proportion of output value of tertiary industry in GDP%+
Per capita social fixed asset investmentRMB per person+
The proportion of the population employed in the tertiary industry%+
Per capita urban road areaSquare meter
per person
+
Urban registered unemployment rate at the end of the year%-
Innovation UrbanizationTen thousand people invent professional authorization quantityPiece+
Per capita educational expenditureRMB 10,000 +
Number of research institutesInstitute+
Total public library holdings10,000 pieces+
R&D expenditureRMB 100 million +
R&D personnel number of personnel input10,000 people
per year
+
Number of newly registered enterprises per 10,000 peopleInstitute+
Comprehensive energy consumption of RMB 10,000 GDPTons of standard coal per RMB 10,000-
Table 2. Evaluation index of green development.
SystemIndicatorsUnitAttribute
Green
Development
Urban green coverageHectare+
Urban per capita public green spaceSquare meters per person+
Sewage treatment rate%+
The comprehensive utilization rate of general industrial solid waste%+
Average annual concentration of sulfur dioxideMicrograms per cubic meter-
PM2.5Micrograms per cubic meter-
Public satisfaction with the environment%+
Average number of days with good ambient air quality%+
Table 3. Composite index, coupling, and CCD of UR and GD in the YRDR in 2020.
ProvincesCitiesComposite Index of Urbanization (U1)Composite Index of Green Development (U2)Coupling (C12)Coupling Coordination (D)
ZhejiangHangzhou0.560.470.9960.717
Ningbo0.480.390.9950.657
Wenzhou0.410.360.9980.621
Jiaxing0.360.340.9990.592
Huzhou0.300.350.9970.570
Shaoxing0.310.390.9930.586
Jinhua0.360.330.9990.589
Quzhou0.200.360.9580.518
Zhoushan0.280.380.9880.572
Taizhou0.240.370.9770.545
Lishui0.210.380.9590.534
JiangsuNanjing0.480.670.9860.754
Wuxi0.470.370.9940.644
Xuzhou0.390.330.9950.598
Changzhou0.300.310.9990.549
Suzhou0.350.420.9960.618
Nantong0.230.330.9860.527
Lianyungang0.180.280.9770.471
Huaian0.180.250.9840.459
Yancheng0.360.330.9990.586
Yangzhou0.220.380.9630.538
Zhenjiang0.220.350.9760.528
Taizhou0.200.400.9440.532
Suqian0.130.340.8920.457
AnhuiHefei0.370.370.9990.609
Wuhu0.250.300.9960.522
Bengbu0.240.230.9990.487
Huainan0.230.180.9920.453
Maanshan0.300.240.9940.522
Huaibei0.200.190.9990.443
Tongling0.150.290.9500.461
Anqing0.170.340.9440.490
Huangshan0.100.480.7620.470
Fuyang0.100.190.9590.374
Suzhou0.100.260.8970.403
Chuzhou0.180.280.9780.477
Lu’an0.090.260.8720.392
Xuancheng0.190.330.9580.499
Chizhou0.200.210.9990.449
Bozhou0.140.300.9340.451
ShanghaiShanghai0.500.860.9640.808
Table 4. Grade classification of coupling coordination degree.
TypeCoupling Coordination Degree Sub-TypeCities
High Coordination0.7 ≤ D ≤ 1High coordination–urbanization lagU2 − U1 > 0.1Shanghai, Nanjing
High coordination0 ≤ |U1 − U2| ≤ 0.1Hangzhou
High coordination–green lagU1 − U2 > 0.1/
Moderate Coordination0.6 ≤ D < 0.7Basic coordination–urbanization lagU2 − U1 > 0.1/
Basic coordination0 ≤ |U1 − U2| ≤ 0.1Ningbo, Wenzhou, Wuxi, Suzhou, Hefei
Basic coordination–
green lag
U1 − U2 > 0.1/
Low Coordination0.5 ≤ D < 0.6Basic imbalance–urbanization lagU2 − U1 > 0.1Quzhou, Zhoushan, Taizhou, Lishui, Yangzhou, Zhenjiang, Taizhou
Basic imbalance0 ≤ |U1 − U2| ≤ 0.1Jiaxing, Huzhou, Shaoxing, Jinhua, Xuzhou, Changzhou, Nantong, Yancheng, Wuhu, Maanshan
Basic imbalance–green blockedU1 − U2 > 0.1/
Mild Imbalance0.4 ≤ D < 0.5Severe imbalance–urbanization lagU2 − U1 > 0.1Suqian, Tongling, Anqing, Huangshan, Suzhou, Xuancheng, Bozhou
Severe imbalance0 ≤ |U1 − U2| ≤ 0.1Lianyungang, Huaian, Bengbu, Huainan, Huaibei, Chuzhou, Chizhou
Sever imbalance–green blockedU1 − U2 > 0.1/
Moderate Imbalance0 < D < 0.4High imbalance–urbanizationU2 − U1 > 0.1Lu’an
High imbalance0 ≤ |U1 − U2| ≤ 0.1Fuyang
High imbalance–green lagU1 − U2 > 0.1/
Disclaimer/Publisher’s Note: The statements, opinions and data contained in all publications are solely those of the individual author(s) and contributor(s) and not of MDPI and/or the editor(s). MDPI and/or the editor(s) disclaim responsibility for any injury to people or property resulting from any ideas, methods, instructions or products referred to in the content.

