Article

Personalized Guidance Information and Travel Choice Behavior During Metro Service Disruptions: Evidence from Beijing, China

1
Key Laboratory of Transport Industry of Big Data Application Technologies for Comprehensive Transport, Beijing Jiaotong University, Beijing 100044, China
2
Institute of Materials and Systems for Sustainability, Nagoya University, Nagoya 4648603, Japan
3
College of Metropolitan Transportation, Beijing University of Technology, Beijing 100124, China
*
Author to whom correspondence should be addressed.
Urban Sci. 2025, 9(12), 546; https://doi.org/10.3390/urbansci9120546
Submission received: 26 September 2025 / Revised: 26 November 2025 / Accepted: 15 December 2025 / Published: 18 December 2025

Abstract

Guidance information plays an important role in influencing metro passengers’ travel choices and enhancing their travel experience during unplanned service disruptions. However, limited research has examined passengers’ behavioral responses to personalized guidance information in such contexts. This study aims to fill the gap and explore the impact of personalized guidance information on passengers’ travel choice behavior during unplanned metro service disruptions. First, we reconstruct the decision-making process of metro passengers under disruption scenarios and design personalized guidance strategies, followed by a stated preference survey to collect preference data. Using data from Beijing, China, a hybrid utility–regret model is developed to analyze how the content and frequency of personalized guidance information affect passengers’ travel choice preferences. The results show that recommended plans with explanatory information are more likely to be adopted, particularly when explanations are framed from the passenger’s perspective. A single notification serves as a timely reminder, whereas overly frequent messages may trigger annoyance and reduce effectiveness. These findings provide practical implications for the design of personalized guidance strategies, thereby mitigating the impacts of metro service disruptions.

1. Introduction

The metro system, a critical component of urban public transportation, has undergone rapid development in many cities, including Beijing, Tokyo, and New York City. Despite this expansion, with increasing travel demand, aging infrastructure, and prolonged high-load operations, metro service disruptions have become more frequent [1,2]. These disruptions can be categorized into two types based on their cause: planned service disruptions and unplanned service disruptions [3]. Planned disruptions primarily encompass scheduled maintenance, holiday-related service adjustments, and similar pre-determined events [4,5,6]. In such cases, metro operating companies typically adjust their operational plans in advance and notify passengers ahead of time so they can modify their travel arrangements accordingly. In contrast, unplanned disruptions are largely attributed to equipment failures, signal malfunctions, external environmental influences, etc. The unpredictable nature and uncertain duration of these unplanned disruptions significantly diminish passenger travel experience and pose great challenges to metro operation and management [7,8].
Information guidance, as a flexible management strategy, can influence passenger travel choices during unplanned metro service disruptions [9,10]. This, in turn, influences passenger flow distribution across the metro network, thereby preventing excessive passenger aggregation and mitigating the negative impact of unplanned disruptions on passenger travel satisfaction and safety. Meanwhile, passengers exhibit an increased demand for information when confronted with the uncertainties of unplanned service disruptions [11,12]. Currently, metro operating companies typically disseminate descriptive information regarding service disruptions via in-station announcements, in-station displays, social media platforms, etc. With the widespread adoption of travel applications (apps), it has become feasible to provide passengers with personalized guidance information through them. Such information refers to travel recommendations tailored to individual passengers’ characteristics, preferences, and travel contexts. Compared to homogeneous descriptive information, passengers are more likely to respond to personalized information [13]. Therefore, to reduce the negative effects of unplanned metro service disruptions, it is crucial to explore personalized guidance information strategies during such disruptions.
Understanding the impact of guidance information on travel choice behavior plays a key role in developing personalized guidance information strategies. While many studies have explored the impact of travel information on travel behavior, most have focused on the field of road traffic—for example, how guidance information affects driver decision-making [14,15,16]. However, there are significant differences between metro networks and road networks. Moreover, despite growing research on passenger travel choice behavior during metro service disruptions [2,3,17], research specifically on the impact of personalized guidance information on passenger behavior during such disruptions remains very limited. Passenger waiting behavior under the influence of guidance information has also received limited attention. As a result, the influence of personalized guidance information on passenger choice behavior during unplanned disruptions is still not well understood. Therefore, this study aims to explore the impact of personalized guidance information on travel choice behavior during unplanned metro service disruptions, thereby supporting the development of personalized guidance information strategies and mitigating the impacts of metro service disruptions.
The contributions of this paper are twofold. First, we reconstruct the decision-making process of metro passengers during unplanned service disruptions considering their heterogenous waiting behavior, and further design personalized guidance strategies. Second, we explore the impact of personalized guidance information on travel choice behavior under metro service disruptions using a hybrid utility-regret model, and propose practical strategies for designing personalized guidance information.
The remainder of the paper is organized as follows. Section 2 describes the decision-making process of metro passengers under service disruptions, followed by survey design and data collection. Section 3 develops a hybrid utility-regret model to explore how guidance information influences passenger’s travel choice behavior. Section 4 analyzes the model results. Section 5 discusses the impact of key factors on travel choices and proposes suggestions for the design of personalized guidance information. The conclusions and limitations of the paper are given in Section 6.

2. Literature Review

2.1. Travel Choice Behavior During Metro Service Disruptions

Individual travel choice behavior is influenced by various factors, including sociodemographic characteristics, travel time, cost, number of transfers, and the availability of travel information, etc. [3,12,18,19,20]. There are growing studies on metro passengers’ behavior in response to unplanned service disruptions [6,7,8,21,22]. The decision-making process of transit users during an unplanned disruption generally involves in two phases. Initially, passengers tend to wait for a period of time before considering alternatives. Once their waiting threshold is reached, they decide on an alternative, which may involve canceling the trip, changing the destination, or switching to another mode to reach the planned destination [23,24]. Most studies have focused on the second phase. For example, Pnevmatikou et al. [17] examined mode choice behavior during a long-run metro service disruptions using individual revealed preference (RP) and SP data. The findings indicate that the likelihood of shifting to buses or cars in such situations largely depends on travelers’ income levels. Rahimi et al. [25] examined transit users’ responses to unplanned service disruptions using SP-RP survey data from the Chicago Metropolitan Area and identified key factors shaping their travel choice behavior. The study revealed that sociodemographic characteristics, personal attitudes, trip-specific attributes, and built environment have significant impacts on passengers’ travel choices during such disruptions. In addition to SP and RP data, smart card data can also be used to analyze passengers’ choice behavior. Mo et al. [2] developed a probabilistic framework that leverages smart card data to infer passengers’ responses to unplanned urban rail service disruptions. The estimation results were found to be consistent with the specific incident context. However, heterogenous waiting behavior during metro service disruptions has received limited attention.
Discrete choice models [8,21,26] and agent-based simulation methods [7,12] are generally used for analyzing passengers’ choice behavior during transit service disruptions. Regarding discrete choice models, random utility maximization (RUM) models are often used to explore travel choice behavior during metro service disruptions [17,21]. RUM models assume that a traveler is rational and will select the alternative from their choice set that maximizes their utility [27,28]. These models also allow for compensation among attributes. However, during unplanned metro service disruptions, passengers are not perfectly rational. A shorter travel time may also not compensate for the uncertainty of the waiting time on a disrupted route. To address this issue, Chorus et al. considered the principle of semi-compensatory behavior and proposed a Random Regret Minimization (RRM) model [29,30]. This model assumes that decision-makers aim to minimize anticipated regret and the regret arising from one attribute cannot be fully compensated by other attributes. However, neither the assumption of pure utility maximization nor that of regret minimization can fully explain passengers’ complex travel choice behavior in response to guidance information during unplanned service disruptions. On the one hand, passengers evaluate the potential benefits of following the guidance information, such as a shorter journey or a smoother travel experience, to maximize their utility. On the other hand, they also worry about the regret that could result from a wrong decision, so they try to avoid choices that might lead to a worse outcome. Essentially, a passenger’s final decision is a trade-off between maximizing utility and minimizing regret [31,32,33]. Therefore, a hybrid utility-regret model is more appropriate for analyzing travel choice behavior during metro service disruptions.

2.2. The Impact of Travel Information on Travel Choice Behavior

Given the uncertainty of unplanned service disruptions, providing information to passengers is crucial for alleviating anxiety and enhancing satisfaction [11,12]. Travel information can be categorized as descriptive information (DI), reporting current or predicted conditions pre-trip or en-route; and prescriptive information (PI), providing guidance or recommended alternatives such as the fastest route [34]. Most studies have focused on the impact of descriptive information on travel behavior [9,35,36]. For example, Hua and Ong [36] explored the impact of social media-based information provision during train service disruptions. The results demonstrate the crucial role of information awareness in passengers’ travel behaviors during disruptions. Although descriptive information aids travel decision-making and enhances the travel experience, passengers must first understand and process it, which can be challenging for some [10,37]. In contrast, prescriptive information directly suggests travel options to travelers by evaluating the utility of various alternatives. Research has demonstrated that traveler adherence to such prescriptive information is higher than to descriptive information [33]. However, existing research on prescriptive information has predominantly focused on its impact on drivers’ choice behavior. Yet, metro networks are significantly different from road networks in their structure and operation. Here, we define “guidance information” as recommendations that balance the interests of both the system and its passengers. To our knowledge, understanding of how such guidance information influences passenger choice behavior in metro systems remains very limited, apart from a few studies conducted under normal operating conditions [10,38,39].
During metro service disruptions, travel information is mainly disseminated through traditional channels (e.g., official websites and station signage) and mobile channels (e.g., social media or smartphone alerts) [11]. However, these channels typically provide uniform guidance to passengers, such as notifying them of a specific line disruption and suggesting that those in a hurry switch to alternative travel modes. With the widespread adoption of travel apps, it is feasible to provide personalized guidance to passengers during metro service disruptions. Compared with homogeneous information, passengers are more likely to respond to personalized information [13]. While some studies have examined personalized guidance in metro systems under normal conditions [10,34], little is known about how such information influences passengers’ travel choice behavior during metro service disruptions.
In summary, previous studies have examined travel guidance via social media, station broadcasts, or apps, but these generally provide only general disruption alerts or feasible alternatives, without offering personalized recommendations that consider individual characteristics and metro-disrupted conditions. Consequently, there is very limited understanding of how personalized guidance information affects travel choice behavior during metro service disruptions. This study aims to address this gap and explore the impact of personalized guidance information on passenger decision-making.

3. Methodology

3.1. Travel Choice Behavior Under Guidance Information During Metro Service Disruptions

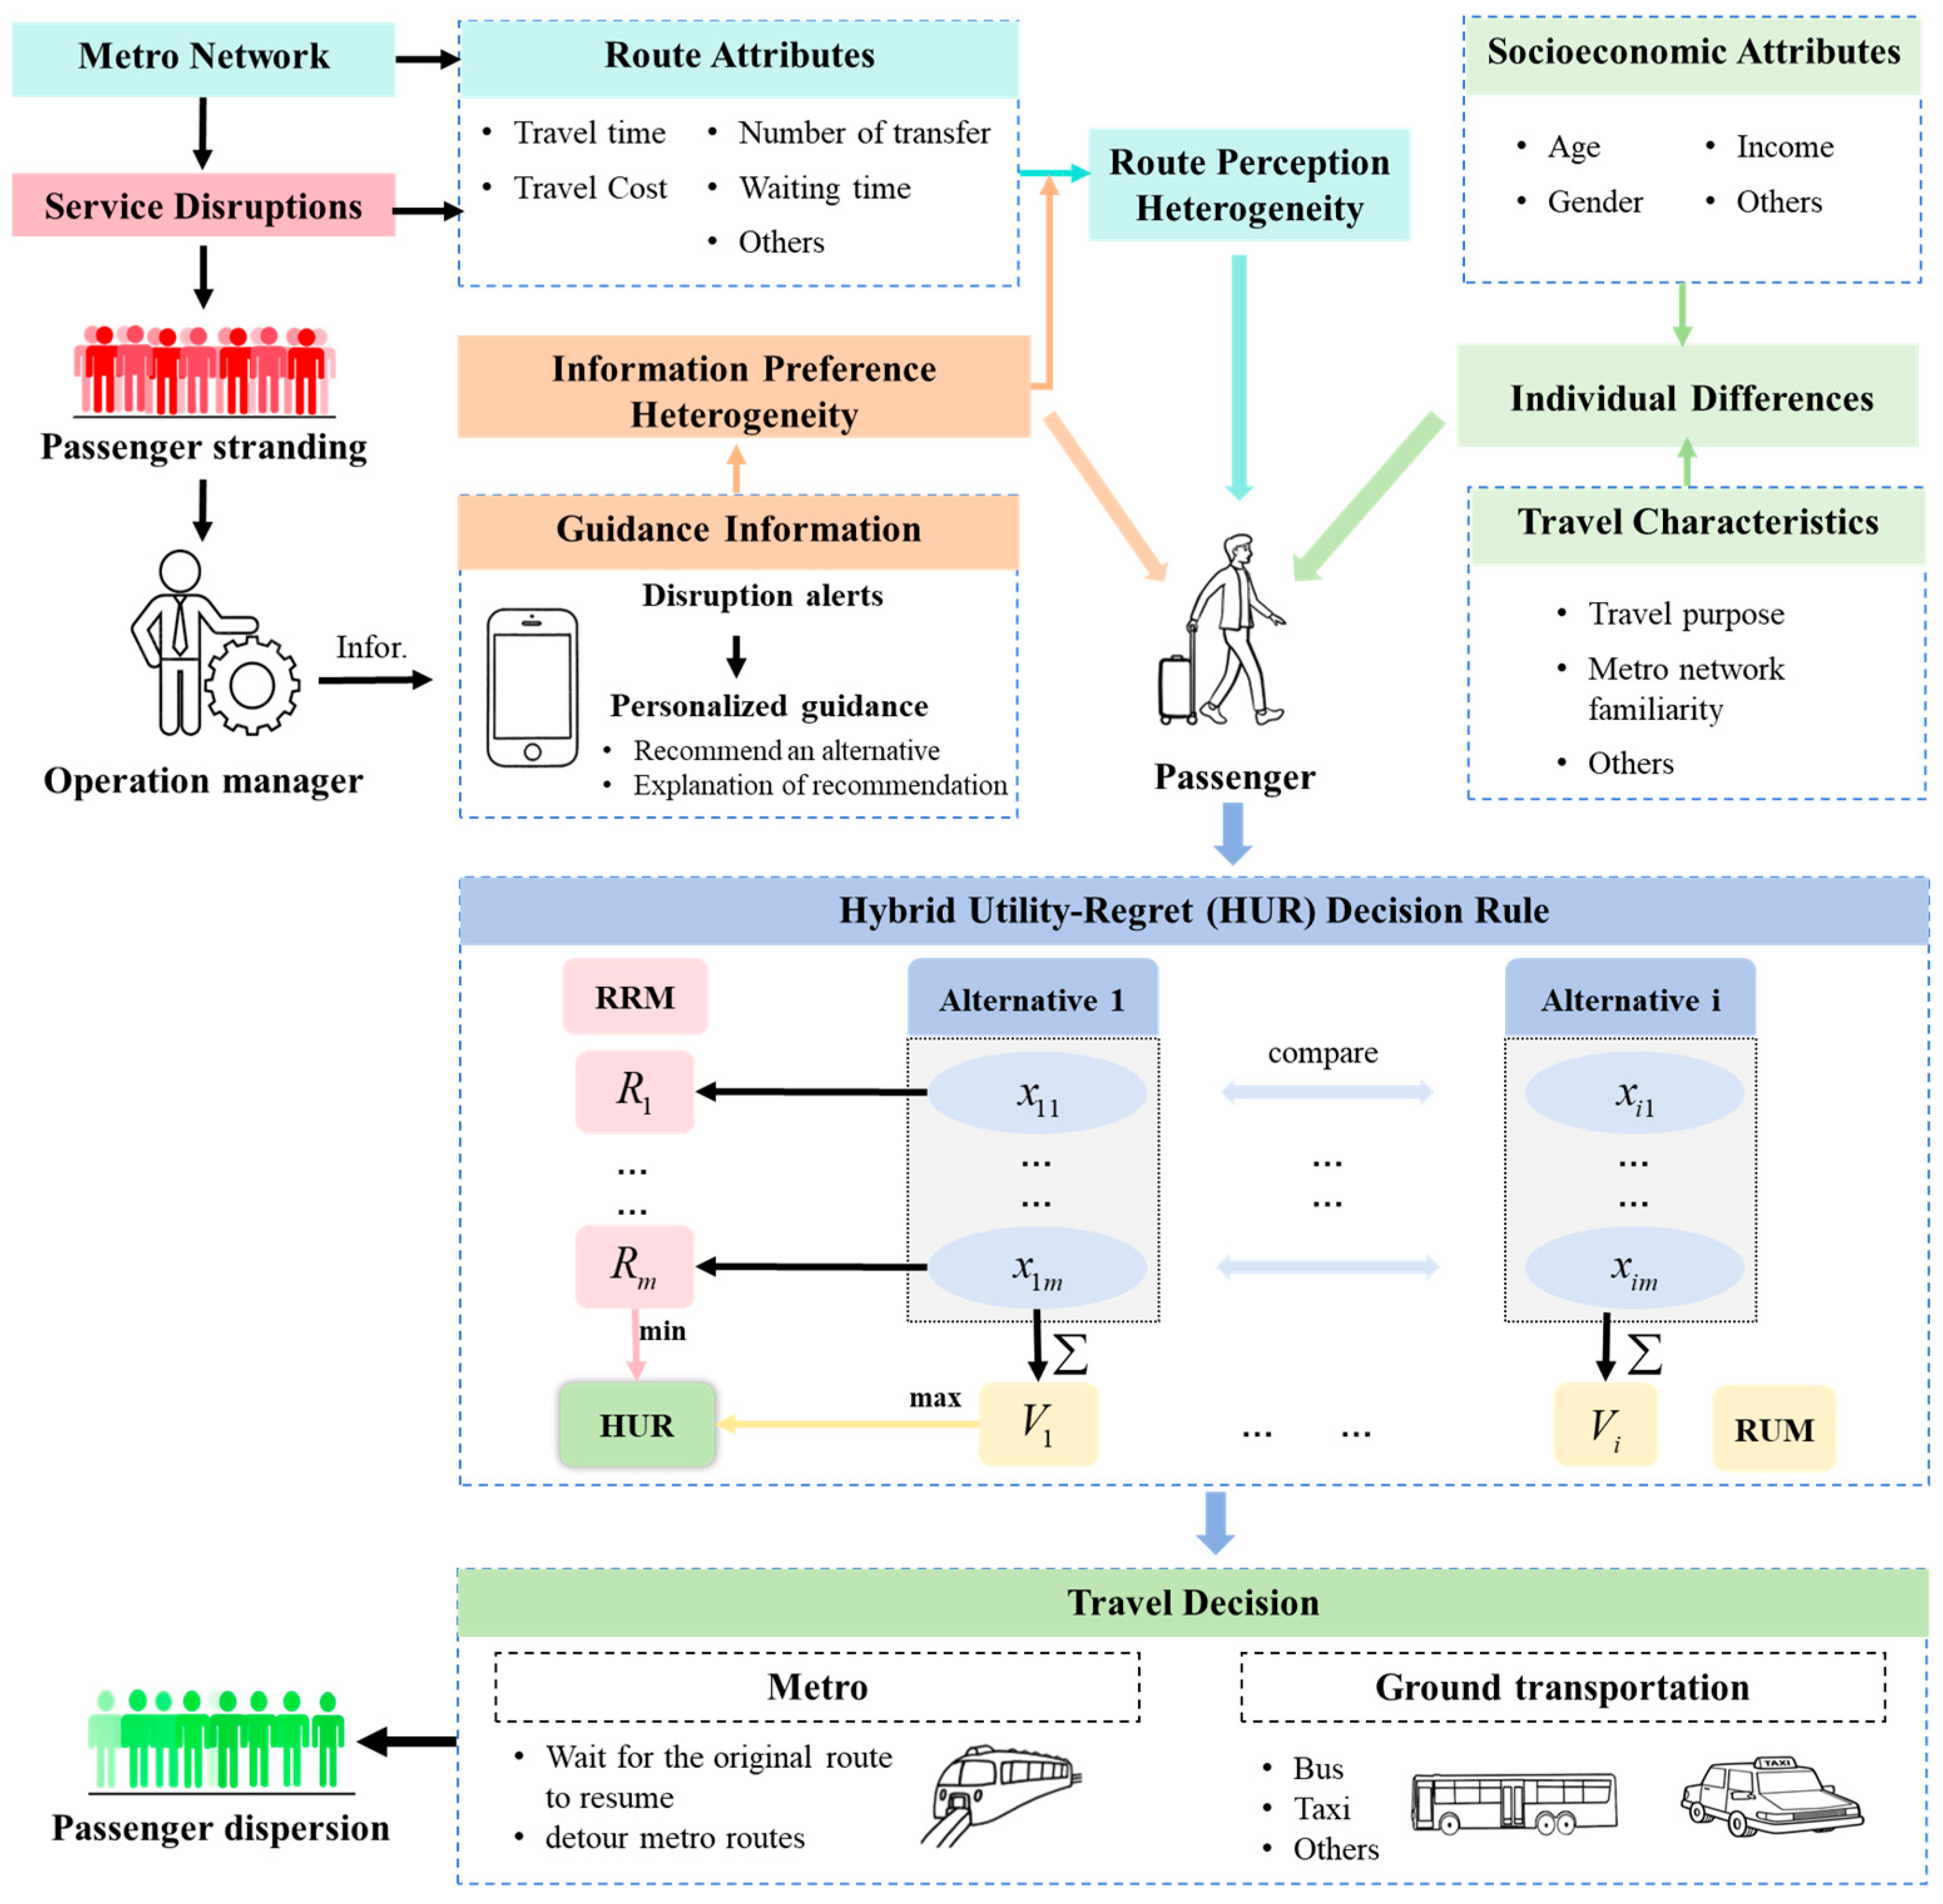
This study focuses on passengers who have already arrived at the metro station when an unplanned service disruption occurs, affecting the entire metro line and with an unknown duration. Personalized guidance information plays an important role in passenger travel choices during such disruptions. According to cognitive load theory, human working memory is limited, and overly complex information may reduce comprehension and decision quality. Compared with descriptive information that only presents multiple attributes of alternative options, prescriptive information that directly recommends a specific option can reduce cognitive load, enabling passengers to process information more efficiently and act upon it. Furthermore, the Elaboration Likelihood Model (ELM) suggests that providing explanatory information—such as the reasons behind a recommendation—can trigger central route processing, thereby enhancing the persuasiveness and acceptance of the message. Therefore, we developed personalized guidance information strategies delivered through the travel app. First, we send metro service disruption alerts to passengers via the travel app. When passengers open the app and enter their origin and destination, we present a set of alternative routes visually. Based on the passengers’ departure time, current location, and metro operating conditions, we recommend a specific route and provide an explanation for the recommendation.
Under the provision of guidance information, the travel decision-making process of metro passengers can be characterized as: “information perception and processing → heuristic/rational judgment → decision-making”, as shown in Figure 1. Specifically, passengers first receive disruption-related and personalized guidance information through the travel app, and process it. RUM decision rule assumes that travelers are fully rational and will select the alternative that maximizes their utility. However, during unplanned metro service disruptions, passengers are not perfectly rational. Under conditions of high uncertainty and time pressure, they cannot fully evaluate all travel alternatives, and heuristic judgments often dominate. Consequently, passengers aim not only to maximize potential benefits, such as shorter or smoother trips, but also to minimize potential regret from making a poor choice, as captured by RRM decision rule. Therefore, a hybrid utility–regret (HUR) framework is adopted to characterize passengers’ travel choice behavior under guidance information during metro service disruptions.
Regarding the alternatives considered in the decision-making process, most passengers do not immediately choose an alternative travel plan or wait blindly for service to resume due to the uncertainty of unplanned disruptions. Instead, passengers exhibit heterogeneous waiting tolerance thresholds. Empirical studies demonstrate that most individuals initially display waiting behavior during service disruptions [23], while adjusting their decisions as waiting duration extends. Generally, they will choose to wait and continue their journey via the original route if the service on a passenger’s original route is restored within their waiting tolerance threshold. However, if the disruption persists beyond this threshold, they will abandon the original route and opt for an alternative.

3.2. Survey Design and Data Collection

Based on the above travel choice behavior analysis, we designed a stated preference (SP) survey, which mainly comprises two sections: an individual information section and a travel choice section. The individual information section investigates respondents’ socio-demographics, travel characteristics and information use characteristics. The travel choice section designs hypothetical metro disruption scenarios based on Beijing Metro network in Beijing, China, providing alternative travel plans to capture respondents’ travel choice preferences under different disruption conditions. The Beijing Metro network was selected as the background for the stated choice experiment primarily to enhance the realism of the scenarios. As respondents are familiar with the Beijing Metro, they can better understand the described situations, thereby improving the reliability of the survey data.
To develop alternative travel plans for passengers during metro disruptions, we first categorize passengers into four types based on their locations relative to the disrupted sections:
  • Type 1: Both the origin and destination stations are located within the disrupted sections.
  • Type 2: Either the origin or the destination station is located in the disrupted sections, but not both.
  • Type 3: The passenger’s route has at least one alternative that goes through the disrupted sections.
  • Type 4: All alternative routes are not affected by the disruption.
In the travel choice section, respondents are first asked to indicate their acceptable waiting time for disruption recovery. The options are: no waiting, 0–5 min (Plan A1), 5–10 min (Plan A2), 10–15 min (Plan A3), 15–20 min (Plan A4), and 20–25 min (Plan A5). It is important to note that the waiting time question is only asked of passengers whose origin or destination stations are directly impacted by the disruption (Type 1 and Type 2). If respondents choose “no waiting” or if the disruption exceeds their stated waiting threshold, they are then required to select an alternative travel plan to complete their trips from the following options: original metro route (Plan B1), detour metro route 1 (Plan B2), detour metro route 2 (Plan B3), change in origin or destination station to Station A (Plan B4) or Station B (Plan B5), bus (Plan B6), or taxi (Plan B7). The available alternative plans vary depending on the passenger type: Passengers of Type 1 may only choose ground transportation (Plans B6 and B7); passengers of Type 2 may either change their origin or destination station (Plans B4 and B5) or take ground transportation (Plans B6 and B7); passengers of Type 3 may opt for detour routes within the metro network (Plans B2 and B3) in addition to ground transportation (Plans B6 and B7); and passengers of Type 4 have access to all alternative metro routes (Plans B1, B2, and B3).
The design of hypothetical scenarios in the travel choice section takes into account three types of variables: travel-related variables, metro service disruption-related variables, and guidance information-related variables, as shown in Table 1. The selection of these variables and their attribute levels was primarily guided by theoretical and empirical considerations. Specifically, travel-related attributes such as travel distance and purpose are commonly adopted in stated choice studies examining travel choice behavior under metro service conditions [3,17]. Attributes related to the affected passenger types and recommended alternatives were derived from metro operation management practices, aiming to reflect the situational differences in passengers under service disruptions and to capture their influence on travel choices. Additionally, the attributes concerning the push frequency and explanation type of guidance message were designed with reference to practical experience in travel guidance and previous studies on message design in travel behavior interventions [40], aiming to explore how guidance information affects passengers’ travel choices. Based on the variables and their levels in Table 1, 576 scenarios can be designed. Due to the large workload, we employed an orthogonal design to generate 24 hypothetical scenarios. The orthogonality and level balance of the design were verified to ensure the independence and representativeness of the attribute levels. Considering respondents’ limited time and patience, each respondent is only required to answer questions for four scenarios, corresponding to four different affected passenger types.
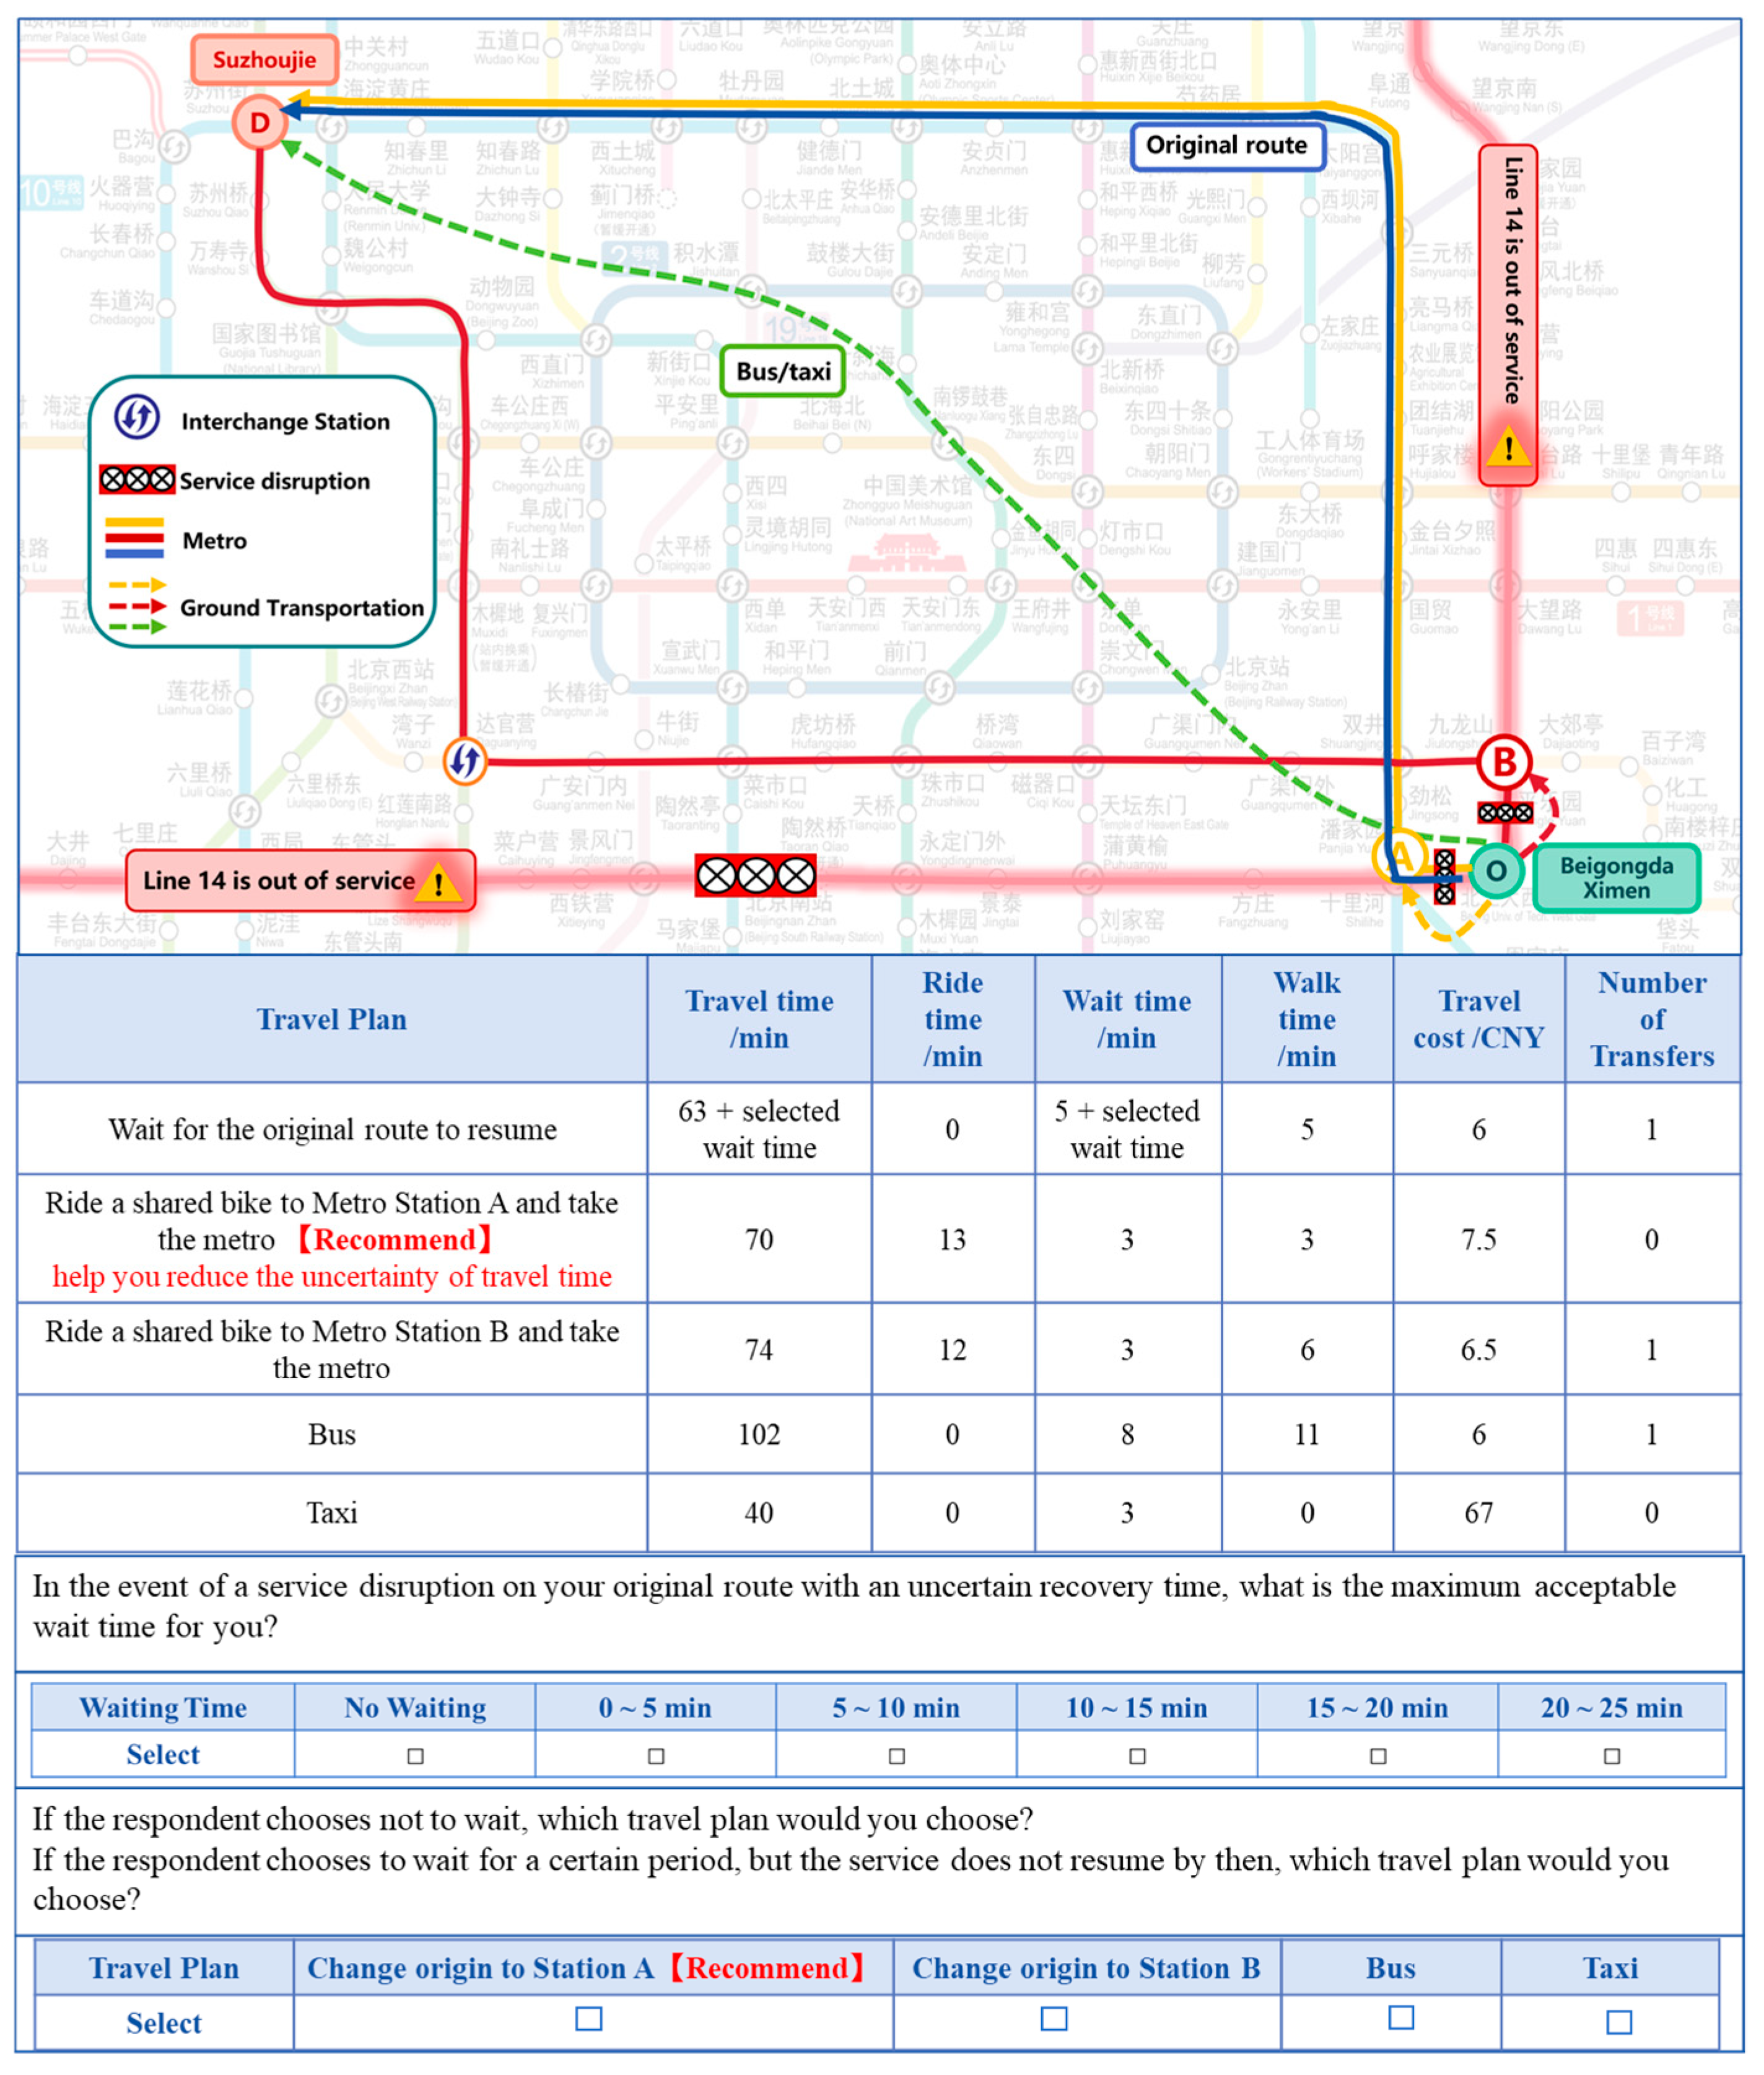
In the hypothetical scenarios, it is assumed that metro passengers obtain travel information via a mobile app during service disruptions. Notifications regarding metro service disruptions are delivered through the travel app, with three levels of message push frequency. When passengers open the app and enter their origin and destination, the app provides personalized information about the disruption and available alternatives based on their locations, recommends a travel plan, and explains the reasons for the recommendation. Figure 2 presents an example of a hypothetical scenario used in the questionnaire.
To test the clarity and plausibility of the scenarios, a pilot survey involving 30 metro users was first conducted offline in September 2023. Participants confirmed that the choice tasks were understandable, and minor refinements were made to the wording and presentation accordingly. Subsequently, the main survey was carried out in October 2023 by a professional online survey company (Wenjuanxing, WJX) in China, targeting individuals who live in Beijing and have prior metro travel experience. A total of 493 respondents participated in the survey. To ensure data quality, several selection criteria were applied: (1) respondents were required to spend at least five minutes completing the questionnaire to ensure careful reading and comprehension of the questions; and (2) the responses had to pass both a consistency check (i.e., the maximum acceptable waiting times reported by the same respondent under identical travel distance and purpose should be similar) and a rationality check (i.e., the maximum acceptable waiting time should not exceed the total travel time in the same scenario). After data cleaning based on these criteria, 465 valid samples were retained, with each respondent providing four choices, resulting in a total of 1860 choice observations.

3.3. Hybrid Utility-Regret Model

We firstly introduce basic utility-based and regret-based decision rules, and then develop a hybrid utility-regret model to explore the impact of guidance information on passengers’ travel choice behavior during unplanned metro service disruptions.
Let n (n = 1, 2, …, N) be the index for metro passengers, and i (i = 1, 2, …, J) be the index for alternative travel plans characterized by m (m = 1, 2, …, M) attributes. Following the RUM decision rule, passengers will choose the alternative from their choice set J that maximizes their utility [41]. The utility function can be described as
U n i = V n i + ε n i = M β m x n m i + ε n i
where U n i is the utility of alternative i to passenger n, V n i is the deterministic portion of the utility, ε n i is the random error term, x n m i is the value of attribute m for alternative i, and β m is the parameter which defines the direction and importance of the impact of attribute m on the utility of an alternative.
Assuming that the random error term ε n i follows a Gumbel distribution, the probability of alternative i chosen by passenger n can be described by
P n i = p r o b { U n i > U n j , i j } = exp ( V n i ) J exp ( V n j )
In contrast, the RRM decision rule assumes that passengers aim to minimize regret arising from the possibility that the chosen alternative may be outperformed by other alternatives in one or more attributes [29]. The RRM model can be formulated as follows:
R n i * = R n i + ε n i = j i M ln 1 + β m x n m j x n m i + ε n i
where R n i * represents the random regret of M attributes for alternative i, and R n i is the deterministic portion of the regret.
Furthermore, we develop a hybrid utility-regret model that combines the RUM and RRM decision rules. The hybrid utility-regret equation can be described as
H n i * = H n i + ε n i = V n i R n i + ε n i
H n i = M β m x n m i j i s = 1 S M ln 1 + β s x n s j x n s i
where H n i * is the mixed utility of alternative i to passenger n, H n i is the deterministic portion of the mixed utility, M β m x n m i is the utility term, j i s = 1 S M ln 1 + β s x n s j x n s i is the regret term, M denotes the set of attributes characterized by utility, including sociodemographic characteristics, waiting time variables, travel alternative attributes, and variables related to guidance information, and S denotes the set of attributes characterized by regret, including variables related to travel alternatives and guidance information.
Similarly, we assume that the random error term ε n i follows a Gumbel distribution. The probability of passenger n choosing alternative i can be described as
P n i = p r o b { H n i > H n j , i j } = exp ( H n i ) J exp ( H n j )
Moreover, to characterize the heterogeneity and time-varying nature of individual waiting times, we propose a waiting-related variable. When metro passengers face unplanned service disruptions with uncertain durations, they often wait for a period of time initially, during which the utility gained from waiting outweighs the utility loss from abandoning the original plan. However, as the waiting time increases, passengers’ irritation and anxiety grow, causing the utility from waiting to gradually decrease. In other words, the waiting utility first increases and then decreases, which can be represented as
V w a i t = β w a i t x w a i t t ¯ b e s t 2
where V w a i t is the waiting utility, β w a i t denotes the parameter to be estimated, x w a i t is the actual waiting time of the alternative, and t ¯ b e s t denotes the optimal waiting time. Since the optimal waiting time varies across decision contexts and decision-makers, we assume it follows a normal distribution, i.e., t ¯ b e s t ~ N b b e s t ,   σ w a i t 2 . The choice of a normal distribution is motivated by the following reasons. First, Lu et al. [42] found that passengers show significant variation in their preferences for waiting time under metro service disruptions, and the normal distribution provides a good fit to represent such heterogeneity. This finding is further supported by Bi et al. [43] and Szeto et al. [44], who demonstrated that the normal distribution captures decision-makers’ heterogeneous preferences regarding waiting time. Second, compared with other distributions, using a normal distribution to characterize behavioral heterogeneity reduces model complexity and computational difficulty.
Then, the probability of passenger n choosing alternative i can be formulated as
P n i = P n i | t ¯ b e s t f t ¯ b e s t d t ¯ b e s t
P n i | t ¯ b e s t = exp ( H n i | t ¯ b e s t ) J exp ( H n j | t ¯ b e s t )
where P n i | t ¯ b e s t is the probability of passenger n choosing alternative i when the optimal waiting time is t ¯ b e s t , and f t ¯ b e s t denotes the probability density function of the random parameter t ¯ b e s t .
To estimate the parameters of the hybrid utility–regret model, we employed Monte Carlo simulation with 1000 draws. The estimation was implemented in Biogeme 3.2.6, an open-source Python package for discrete choice model estimation.

4. Results

4.1. Data Description

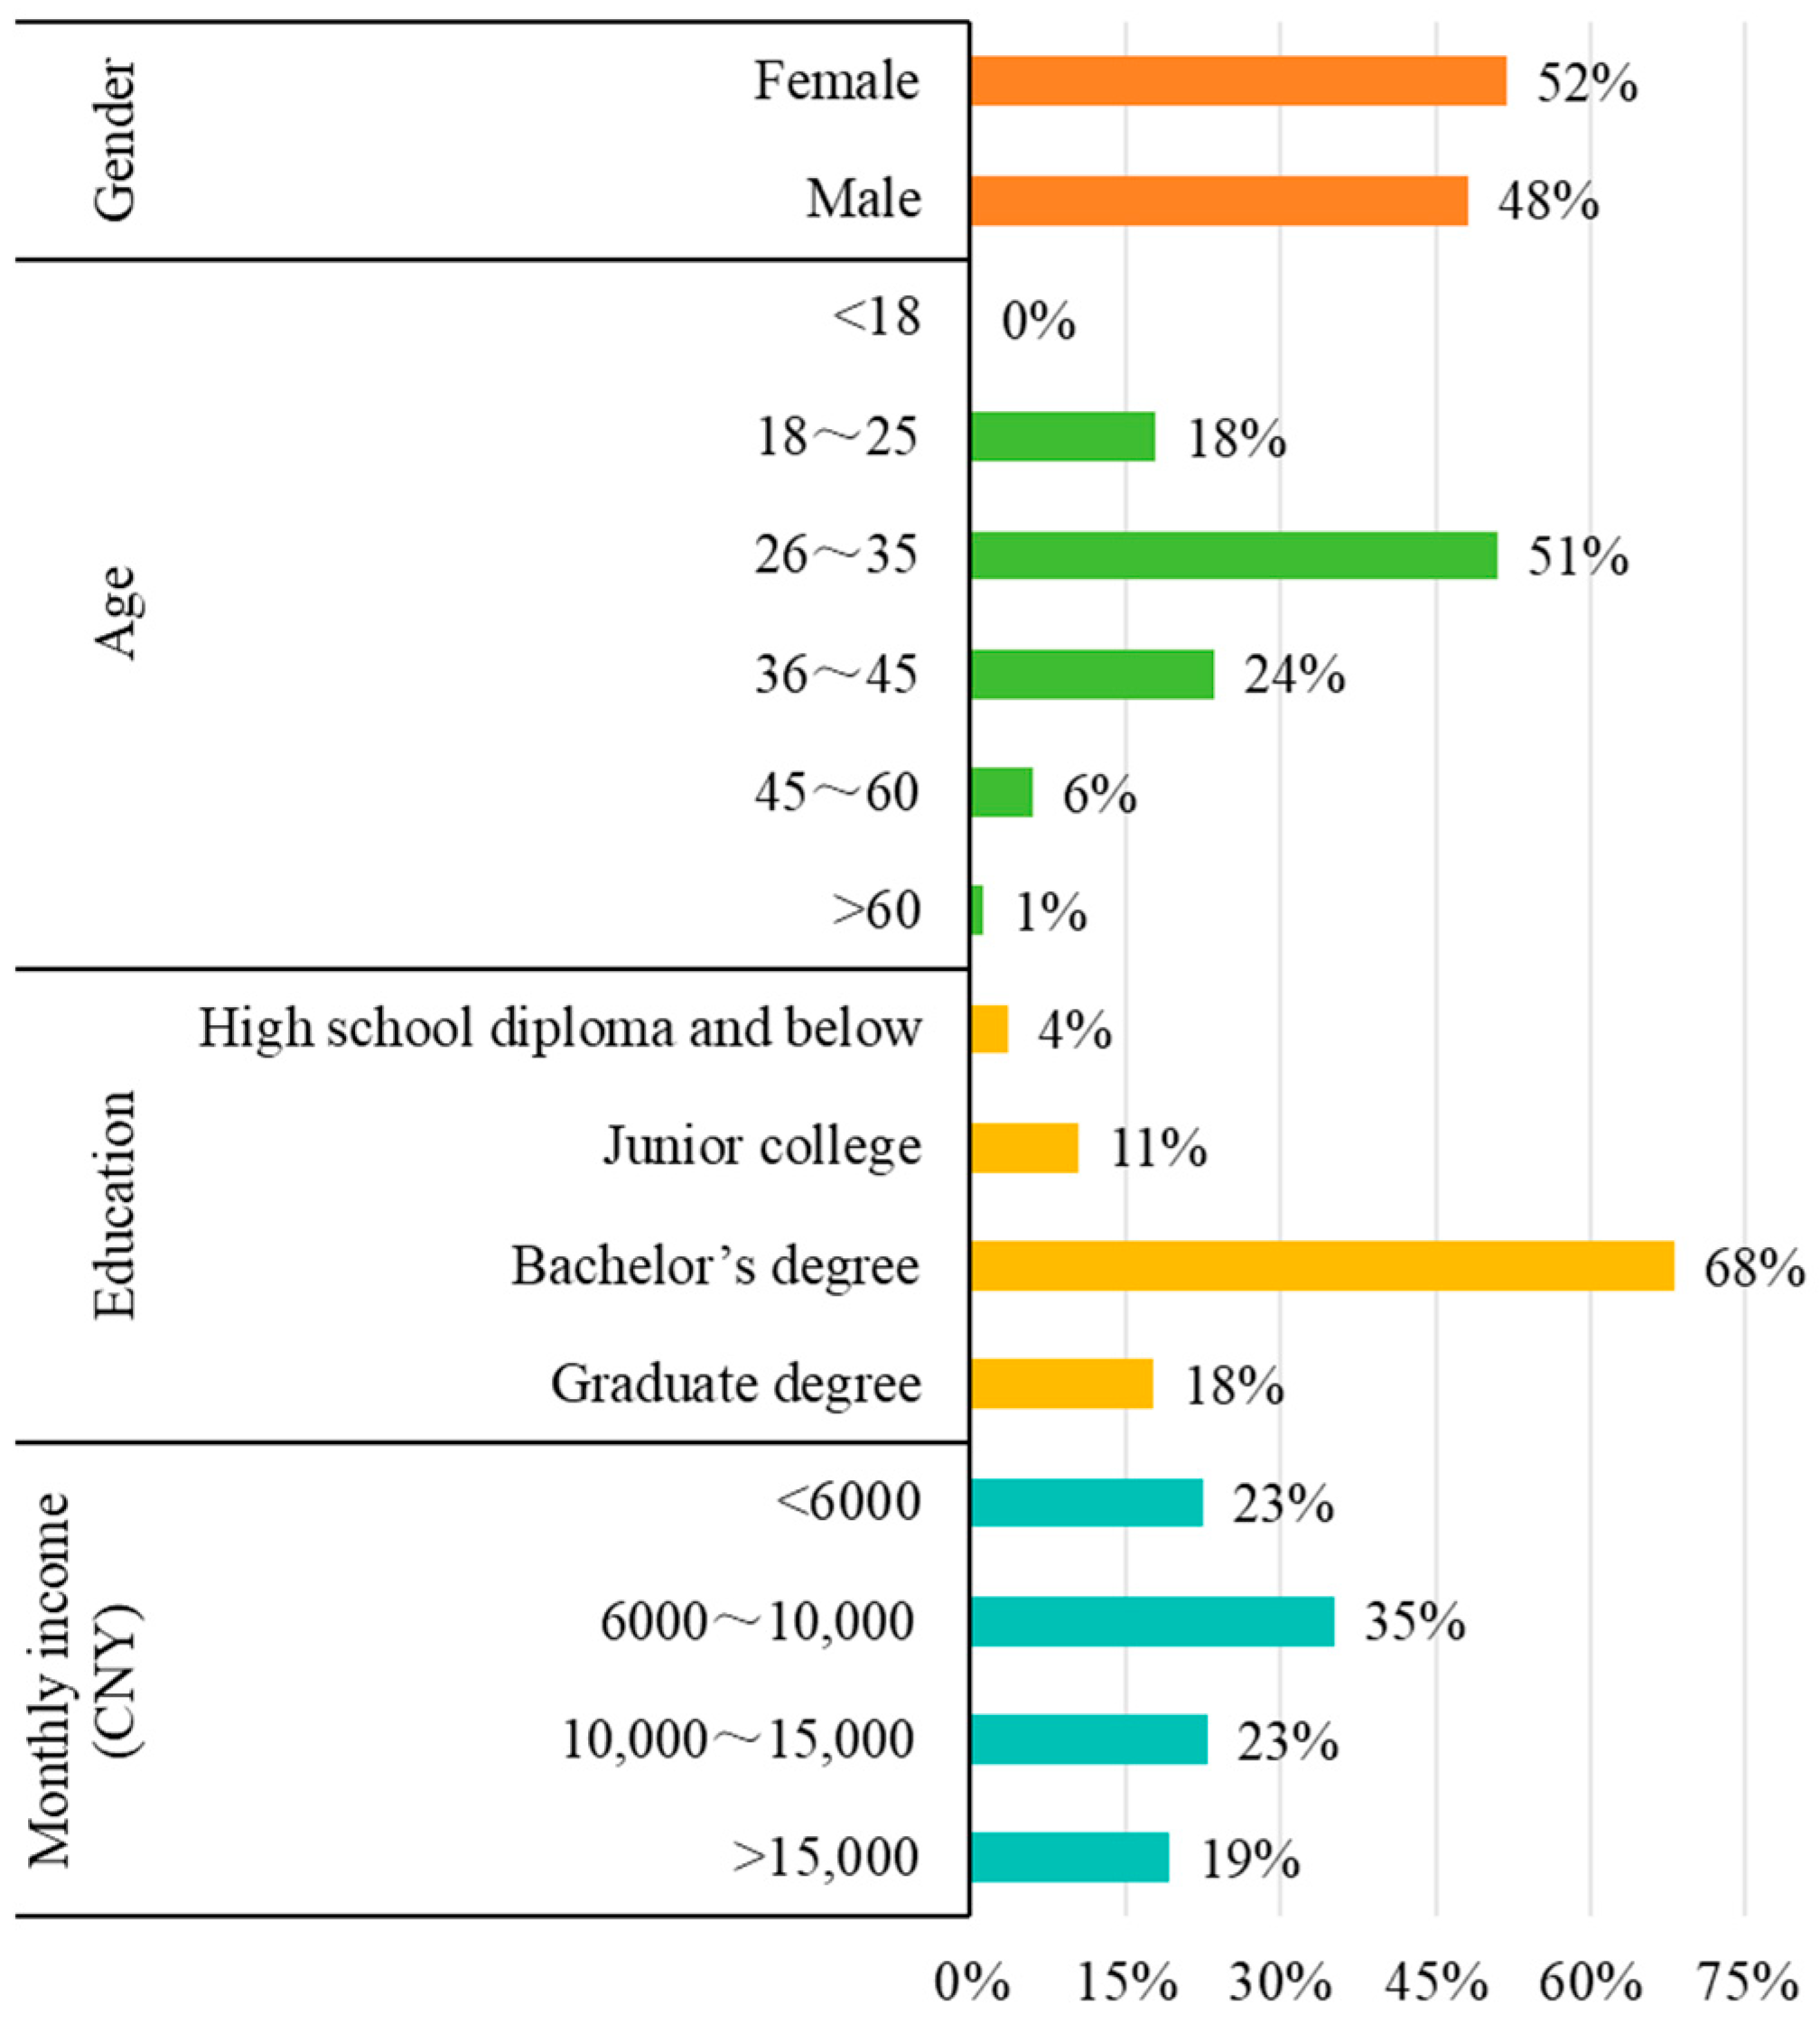
Figure 3 presents the socioeconomic attribute distribution of the respondents. The gender distribution is relatively balanced, with females slightly outnumbering males. The age distribution is approximately normal, with more than 98% of respondents falling within the 18–60 age range, representing the primary demographic of metro users. Approximately 86% of respondents possess a bachelor’s degree or higher, indicating a generally high educational attainment. In terms of personal monthly income, 81% of respondents earn less than 15,000 CNY, suggesting that the metro primarily serves middle- and lower-income groups.
Table 2 presents the travel characteristic and travel information use habits of the respondents. Over 98% of respondents take the metro at least once a week, and 81% have a commuting distance of within 15 km. The metro is the predominant mode for commuting, used by 71% of respondents. For leisure travel, the share of metro use declines, while the proportions of private car and taxi/ride-hailing increase, indicating that comfort plays a more important role in leisure travel choices. Additionally, 59% of respondents typically obtain travel information through travel apps, and 88% often check travel information on their smartphones before traveling, indicating that delivering guidance information via travel apps is feasible. Moreover, 85% of respondents had previously noticed news or notifications about metro service disruptions, and 43% had personally experienced such disruptions, suggesting that most people have a certain understanding of metro service disruptions.
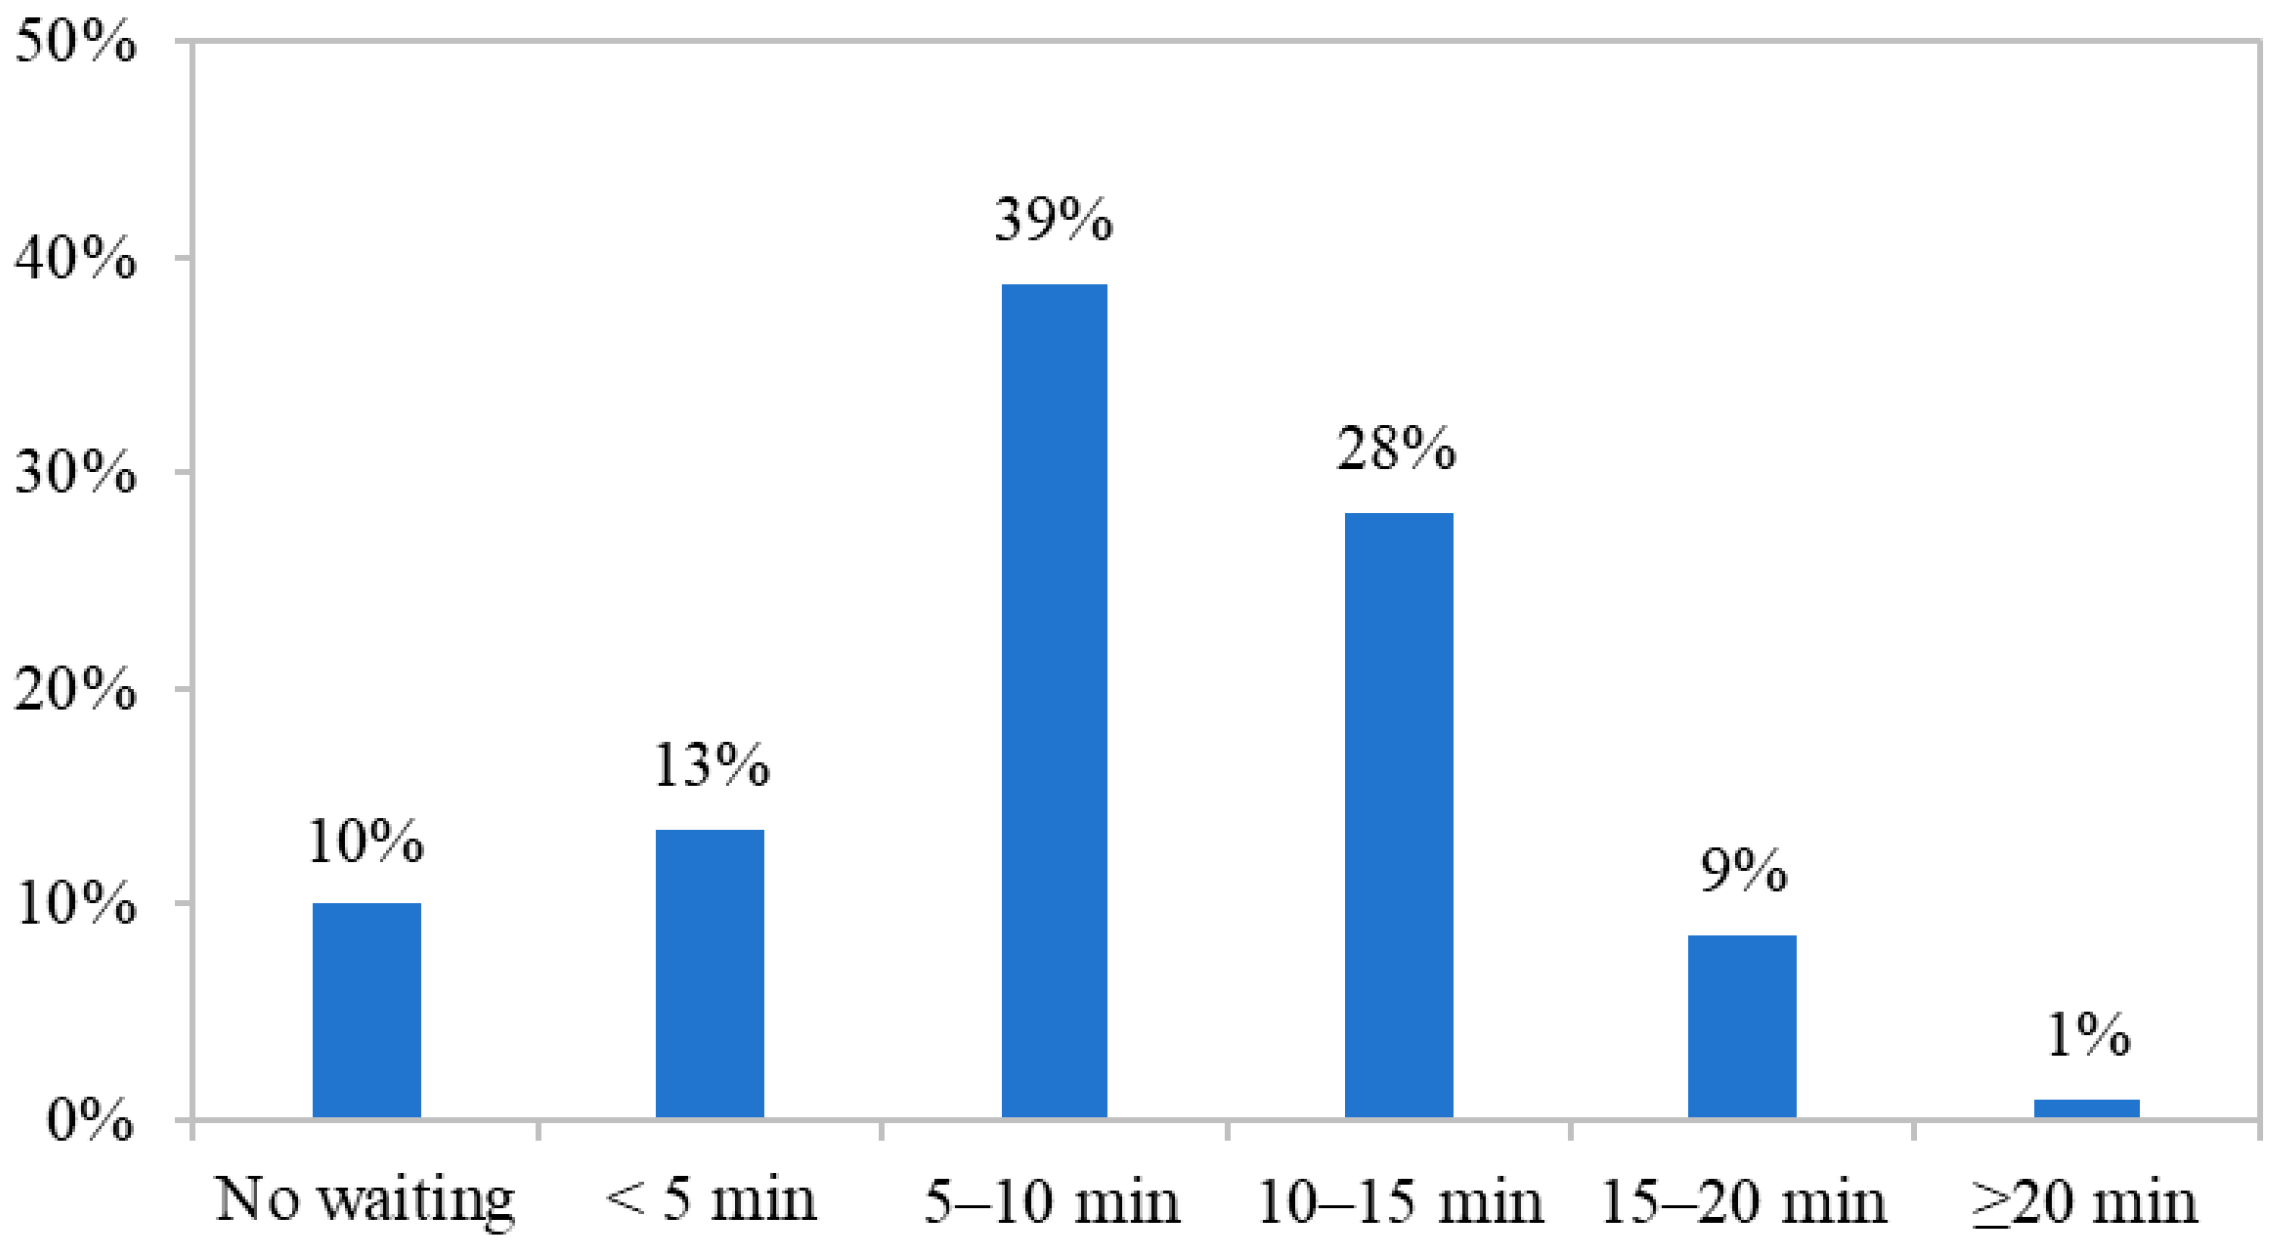
In metro service disruption scenarios, passengers of Type 1 and Type 2, whose origin or destination stations are directly affected, face the choice of either waiting or switching to alternative travel plans to leave. As shown in Figure 4, during unplanned service disruptions of uncertain duration, 90% of respondents choose to wait initially, in line with the analysis in Section 3.1. The largest proportion (39%) of respondents tolerate a waiting time of 5–10 min.

4.2. Model Results

Based on the survey data, we estimated the RUM, RRM, and HUR models, respectively. The comparison results are presented in Table 3, which shows that the HUR model outperforms both the RUM and RRM models.
In the HUR model, the two variables of recommendation reasons, including explanation from the perspective of passenger’s interest and explanation from the perspective of metro system’s interest, were specified under the hybrid RUM–RRM decision rule, while the remaining variables were specified under the RUM decision rule after extensive testing. The results are shown in Table 4.
As shown in Table 4, travel time and travel cost have significant negative effects on utility, indicating that the longer the travel time and the higher the travel cost, the less likely passengers are to choose the travel plan. The effect of the number of transfers on passenger choice behavior is not significant, which may be because transfers are difficult to avoid during metro service disruptions and the differences in the number of transfers across alternatives are relatively small.
Regarding guidance information variables, the parameters for explaining the reasons for recommending a plan from both the passenger benefit perspective and the metro system benefit perspective are significantly positive. This indicates that providing explanations for recommended plans can significantly influence passengers’ travel choices, making the recommended plans more likely to be chosen. Moreover, compared with explanations from the metro system perspective, explanations from the passenger perspective are more effective in encouraging passengers to select the recommended plan. With respect to message push frequency, both medium and high levels of push frequency have significant negative effects on utility. This indicates that overly frequent messages may cause passenger annoyance, thereby reducing the effectiveness of the guidance information. Furthermore, repeatedly pushing the same information is more likely to exacerbate passenger annoyance than delivering multiple different messages.
Regarding waiting time variables, the negative value of β w a i t indicates waiting utility first increases and then decreases, which is consistent with the expected results discussed in Section 3. This suggests that a short period of waiting may be acceptable for passengers, but prolonged waiting leads to diminishing utility. The estimated value of the optimal waiting time expectation b b e s t is 6.40, which provides further evidence supporting this conjecture. Additionally, both the expectation b b e s t and the standard deviation σ w a i t are statistically significant at the 95% confidence level, supporting the assumption that the optimal waiting time follows a normal distribution. Given t ¯ b e s t ~ N 6.40 , 7.85 2 , we can obtain p r o b t ¯ b e s t > 0 79 % , indicating that about 79% of passengers have an optimal waiting duration greater than zero. This suggests that, when a disruption of uncertain duration occurs, most passengers tend to wait initially. The findings are consistent with the previous studies [23].
In terms of socio-demographic characteristics, the negative parameter for age (<35) indicates that younger individuals are less willing to wait for metro services to resume or take slower alternatives like buses. Passengers with a bachelor’s degree or higher are more likely to choose a more comfortable option like a taxi during a metro service disruption. Moreover, passengers who have prior knowledge of a service disruption are often more willing to wait for the metro to resume operation. Additionally, the interaction variables of Type 2 and explaining from the perspective of the metro system’s interest show a significantly negative impact, suggesting that passengers whose journey begins or ends in the disrupted section are particularly frustrated with having to spend personal energy, like cycling to a nearby station, just for the sake of the metro system’s interest. The positive parameter for commute purpose × travel cost indicates that commuters become less sensitive to taxi fares during a metro service disruption. This is likely because commuters prioritize saving time and are more willing to pay to shorten their journey and enhance their travel experience.

5. Discussion

5.1. Waiting Tolerance Analysis

Metro passengers exhibit heterogeneous waiting tolerance during unplanned service disruptions, so a waiting behavior function was incorporated into the HUR model. To further explore differences in waiting tolerance across passenger groups, we estimated the HUR models separately for commuters and leisure travelers, as well as for passengers who had previously noticed metro service disruption information and those who had not. The results are presented in Table 5. Commuters have a lower optimal waiting time expectation than leisure travelers, indicating that time-sensitive travelers are less tolerant of delays and are more inclined to adjust their travel plans when disruptions occur. Additionally, passengers who had previously noticed metro service disruption information exhibit a higher optimal waiting time expectation than those who had not, suggesting that prior exposure to disruption information enhances passengers’ preparedness and reduces uncertainty, thereby increasing their willingness to wait during service disruptions.

5.2. Guidance Information Strategy Analysis

To gain deeper insight into the impact of guidance information strategies on metro passengers’ travel choice behavior, we combine different types of guidance content with varying levels of push frequency to form six guidance strategies, as shown in Table 6. We then take commuting trips with a medium travel distance (15 km) as an example and calculate the changes in the choice probabilities of the recommended plan under different guidance strategies, as presented in Table 7.
According to Table 7, compared to other guidance information strategies, passengers are more likely to accept the recommendation under the strategy that explains the recommended option from the perspective of passenger’s interest and pushes only one message, which is consistent with the above analysis. Compared with not releasing any guidance information, all guidance strategies lead to higher probabilities of passengers choosing the recommended option, which is particularly evident among passengers of Type 3 and Type 4. This is because passengers of Type 3 and Type 4 still have travel options within the metro network during service disruptions, making them more receptive to guidance information that recommends routes within the network.
During metro service disruptions with uncertain durations, passengers of Type 1 and Type 2, whose origin and/or destination stations are located within the disrupted sections, generally tend to wait initially rather than accept the recommended alternative travel plans. This is because if they choose not to wait, they would need to switch to surface transportation or a combination of surface transportation and metro, which typically requires more time or higher travel costs. In such cases, passengers prefer to wait and observe the situation first, which is consistent with the analysis presented above. It is worth noting that an appropriate guidance strategy can still be effective. For example, for Type 2 passengers, the choice probability of travel plan 4 (B4) under guidance strategy 1 increases by 12.01% compared with the case without guidance. Therefore, providing guidance information can somewhat increase the likelihood of Type 1 and Type 2 passengers choosing the recommended route. However, the acceptance rate of the recommended option for these two types of passengers is significantly lower than that of Type 3 and Type 4 passengers.

5.3. Practical Implication

In light of the findings, the following recommendations are proposed for metro operators.
First, guidance information significantly influences passengers’ travel choice behavior during metro service disruptions. Metro operators can use travel apps to push personalized guidance messages to passengers, thereby improving their travel experience and effectively mitigating the negative effects of service disruptions. This study finds that recommendation options that include persuasive wording and explain the reasons for the suggestion are more likely to be adopted by passengers. This offers metro operators a feasible strategy to manage passenger flow distribution during service disruptions. By considering overall system efficiency, operators can provide personalized recommendations to passengers. This approach not only helps reduce passengers’ anxiety caused by uncertainty during disruptions but also enhances the operational efficiency and safety of the metro system. Furthermore, reminders about metro service disruptions should not be excessive. A single reminder is more appropriate, as too many notifications may cause passenger annoyance.
Second, passengers generally exhibit an initial tendency to wait during unplanned metro service disruptions, with significant variations in individual waiting tolerance. In response, metro operators could analyze both the estimated service recovery time and the number of stranded passengers. Subsequently, differentiated recommendations should be delivered via travel apps to passenger groups with varying tolerance levels. For instance, by first inquiring about a passenger’s acceptable wait time, operators can prioritize suggesting route changes to those with low tolerance. For passengers with higher tolerance, personalized advice on whether to wait or change routes can be provided based on the estimated disruption duration and congestion levels. This approach enables targeted passenger flow control and efficient transportation capacity allocation.

6. Conclusions

Personalized information guidance can influence metro passengers’ travel choice behavior, thereby enhancing their travel experience and mitigating the negative impacts of metro service disruptions. Understanding the impact of guidance information on passengers’ travel choice behavior is crucial for developing effective personalized guidance strategies. Given that metro passengers typically make decisions by balancing utility maximization and regret minimization when faced with guidance information, we develop a hybrid utility-regret model to explore how guidance information influences passengers’ travel choice behavior under metro service disruptions. The contribution of this study lies in designing personalized guidance strategies and, through the hybrid utility–regret framework, revealing how passengers respond to personalized guidance information during metro service disruptions.
The results indicate that guidance information content and frequency have a significant impact on passengers’ travel choice behavior. Providing explanations for recommended plans makes the recommended plans more likely to be chosen. Compared with explanations from the metro system perspective, explanations from passengers’ interests are more effective in encouraging passengers to choose the recommended plan. Moreover, pushing one messenger serves as a timely reminder, whereas overly frequent messages may cause passenger annoyance, thereby reducing the effectiveness of guidance information. Repeatedly sending the same information is more likely to provoke passenger annoyance than sending multiple different messages. Additionally, Type 3 and Type 4 passengers exhibit significantly higher compliance with guidance information than Type 1 and Type 2 passengers. We also find that about 79% of passengers have an optimal waiting duration greater than zero, suggesting that most passengers tend to wait initially when a disruption of uncertain duration occurs. Waiting utility first increases and then decreases.
It should be noted that this study has certain limitations. First, we use SP survey data to analyze the impact of guidance information on travel choice behavior; however, SP data may be subject to social desirability bias or intention–behavior gaps. In the future, real RP travel data on passengers’ responses to guidance information could be collected through travel apps to calibrate the findings of this study. Second, in addition to the content and frequency of guidance information, the mode of presentation (e.g., text, images, or interactive information) and the level of personalization (e.g., recommendations based on passengers’ travel habits, preferences, or historical choices) can also influence travel choice behavior. These factors could be further considered in the design of guidance information strategies in future research. Additionally, future studies may explore heterogeneous responses across different passenger groups, integrate psychological constructs such as risk perception as well as smartphone usage habits, and develop adaptive decision-support systems that adjust recommendations based on evolving crowding patterns and network conditions.

Author Contributions

Conceptualization, S.L. and S.C.; methodology, S.L., S.C. and D.Y.; software, S.C.; validation, S.L. and S.C.; formal analysis, S.C.; investigation, S.C. and D.Y.; resources, E.Y.; data curation, S.C.; writing—original draft preparation, S.L., S.C. and M.H.; writing—review and editing, Y.Z., E.Y. and M.H.; visualization, S.C.; supervision, S.L.; project administration, S.L.; funding acquisition, S.L. All authors have read and agreed to the published version of the manuscript.

Funding

This research was funded by the Fundamental Research Funds for the Central Universities (2023XKRC013) and the National Natural Science Foundation of China (52302382).

Institutional Review Board Statement

Ethical review and approval were waived for this study, as it involves a non-interventional, anonymous questionnaire, collects no personally identifiable information, and poses no potential risk or harm to participants. It is stipulated by the ethical standards of Beijing Jiaotong University.

Informed Consent Statement

Informed consent for participation was obtained from all subjects involved in the study.

Data Availability Statement

The data presented in this study are available from the corresponding author upon reasonable request. They are not publicly available due to privacy or ethical restrictions.

Acknowledgments

During the preparation of this manuscript, the authors used ChatGPT 3.5 for the purposes of improving language and readability. The authors have reviewed and edited the output and take full responsibility for the content of this publication.

Conflicts of Interest

The authors declare no conflicts of interest.

References

  1. Zhang, S.; Lo, H.K.; Ng, K.F.; Chen, G. Metro system disruption management and substitute bus service: A systematic review and future directions. Transp. Rev. 2021, 41, 230–251. [Google Scholar] [CrossRef]
  2. Mo, B. Inferring passenger responses to urban rail disruptions using smart card data: A probabilistic framework. Transp. Res. Part E Logist. Transp. Rev. 2022, 159, 102628. [Google Scholar] [CrossRef]
  3. Li, B.; Yao, E.; Yamamoto, T.; Tang, Y.; Liu, S. Exploring behavioral heterogeneities of metro passenger’s travel plan choice under unplanned service disruption with uncertainty. Transp. Res. Part A Policy Pract. 2020, 141, 294–306. [Google Scholar] [CrossRef]
  4. Shires, J.D.; Ojeda-Cabral, M.; Wardman, M. The impact of planned disruptions on rail passenger demand. Transportation 2019, 46, 1807–1837. [Google Scholar] [CrossRef]
  5. Van Exel, N.J.A.; Rietveld, P. When strike comes to town…anticipated and actual behavioural reactions to a one-day, pre-announced, complete rail strike in the Netherlands. Transp. Res. Part A Policy Pract. 2009, 43, 526–535. [Google Scholar] [CrossRef]
  6. Zhu, S.; Masud, H.; Xiong, C.; Yang, Z.; Pan, Y.; Zhang, L. Travel Behavior Reactions to Transit Service Disruptions: Study of Metro SafeTrack Projects in Washington, D.C. Transp. Res. Rec. J. Transp. Res. Board 2017, 2649, 79–88. [Google Scholar] [CrossRef]
  7. Sarker, R.I.; Kaplan, S.; Mailer, M.; Timmermans, H.J.P. Applying affective event theory to explain transit users’ reactions to service disruptions. Transp. Res. Part A Policy Pract. 2019, 130, 593–605. [Google Scholar] [CrossRef]
  8. Adelé, S.; Tréfond-Alexandre, S.; Dionisio, C.; Hoyau, P.-A. Exploring the behavior of suburban train users in the event of disruptions. Transp. Res. Part F Traffic Psychol. Behav. 2019, 65, 344–362. [Google Scholar] [CrossRef]
  9. Papangelis, K.; Velaga, N.R.; Ashmore, F.; Sripada, S.; Nelson, J.D.; Beecroft, M. Exploring the rural passenger experience, information needs and decision making during public transport disruption. Res. Transp. Bus. Manag. 2016, 18, 57–69. [Google Scholar] [CrossRef]
  10. Wang, X.; Xu, X.; Zhang, J.; Liu, J. Individual response prediction and personalized guidance strategy optimization in urban rail transit networks. Transp. Res. Part C Emerg. Technol. 2024, 169, 104875. [Google Scholar] [CrossRef]
  11. Pender, B.; Currie, G.; Delbosc, A.; Shiwakoti, N. Social Media Use during Unplanned Transit Network Disruptions: A Review of Literature. Transp. Rev. 2014, 34, 501–521. [Google Scholar] [CrossRef]
  12. Leng, N. The role of information availability to passengers in public transport disruptions: An agent-based simulation approach. Transp. Res. Part A Policy Pract. 2020, 133, 214–236. [Google Scholar] [CrossRef]
  13. Fujii, S.; Taniguchi, A. Determinants of the effectiveness of travel feedback programs—A review of communicative mobility management measures for changing travel behaviour in Japan. Transp. Policy 2006, 13, 339–348. [Google Scholar] [CrossRef]
  14. Reinolsmann, N.; Alhajyaseen, W.; Brijs, T.; Pirdavani, A.; Ross, V.; Hussain, Q.; Brijs, K. Delay or travel time information? The impact of advanced traveler information systems on drivers’ behavior before freeway work zones. Transp. Res. Part F Traffic Psychol. Behav. 2022, 87, 454–476. [Google Scholar] [CrossRef]
  15. Ben-Elia, E.; Erev, I.; Shiftan, Y. The combined effect of information and experience on drivers’ route-choice behavior. Transportation 2008, 35, 165–177. [Google Scholar] [CrossRef]
  16. Ben-Elia, E.; Shiftan, Y. Which road do I take? A learning-based model of route-choice behavior with real-time information. Transp. Res. Part A Policy Pract. 2010, 44, 249–264. [Google Scholar] [CrossRef]
  17. Pnevmatikou, A.M.; Karlaftis, M.G.; Kepaptsoglou, K. Metro service disruptions: How do people choose to travel? Transportation 2015, 42, 933–949. [Google Scholar] [CrossRef]
  18. Kattan, L.; De Barros, A.G.; Saleemi, H. Travel behavior changes and responses to advanced traveler information in prolonged and large-scale network disruptions: A case study of west LRT line construction in the city of Calgary. Transp. Res. Part F Traffic Psychol. Behav. 2013, 21, 90–102. [Google Scholar] [CrossRef]
  19. Owais, M.; Ahmed, A.S.; Moussa, G.S.; Khalil, A.A. Integrating underground line design with existing public transportation systems to increase transit network connectivity: Case study in Greater Cairo. Expert Syst. Appl. 2021, 167, 114183. [Google Scholar] [CrossRef]
  20. Owais, M.; Ahmed, A.S.; Moussa, G.S.; Khalil, A.A. An Optimal Metro Design for Transit Networks in Existing Square Cities Based on Non-Demand Criterion. Sustainability 2020, 12, 9566. [Google Scholar] [CrossRef]
  21. Zheng, S.; Liu, Y.; Liang, Y.; Yi, H.; Yang, H.; Xu, Y. How will passengers make the joint choice of departure time, trip-chaining, and travel mode under disruption of metro service? Travel Behav. Soc. 2025, 38, 100892. [Google Scholar] [CrossRef]
  22. Currie, G.; Muir, C. Understanding Passenger Perceptions and Behaviors During Unplanned Rail Disruptions. Transp. Res. Procedia 2017, 25, 4392–4402. [Google Scholar] [CrossRef]
  23. Rahimi, E.; Shamshiripour, A.; Shabanpour, R.; Mohammadian, A.; Auld, J. Analysis of transit users’ waiting tolerance in response to unplanned service disruptions. Transp. Res. Part D Transp. Environ. 2019, 77, 639–653. [Google Scholar] [CrossRef]
  24. Li, B.; Ye, Z.; Li, J.; Shao, S.; Wang, C. Analyzing the Passenger Waiting Tolerance during Urban Rail Transit Service Interruption: Using Stated Preference Data in Chongqing, China. Computation 2023, 11, 33. [Google Scholar] [CrossRef]
  25. Rahimi, E.; Shamshiripour, A.; Shabanpour, R.; Mohammadian, A.; Auld, J. Analysis of Transit Users’ Response Behavior in Case of Unplanned Service Disruptions. Transp. Res. Rec. J. Transp. Res. Board 2020, 2674, 258–271. [Google Scholar] [CrossRef]
  26. Zhou, Y.; Wang, P.; Zheng, S.; Zhao, M.; Lam, W.H.K.; Chen, A.; Sze, N.N.; Chen, Y. Modeling dynamic travel mode choices using cumulative prospect theory. Transp. Res. Part A Policy Pract. 2024, 179, 103938. [Google Scholar] [CrossRef]
  27. Phopluechai, R.; Arreeras, T.; Jia, X.; Sittivangkul, K.; Thanasupsin, K.; Chaikaew, P. Investigating Travel Mode Choices Under Environmental Stress: Evidence from Air Pollution Events in Chiang Rai, Thailand. Urban Sci. 2025, 9, 323. [Google Scholar] [CrossRef]
  28. Masoumi, H.; Mehriar, M.; Nosal-Hoy, K. Logit and Probit Models Explaining Mode Choice and Frequency of Public Transit Ridership among University Students in Krakow, Poland. Urban Sci. 2024, 8, 113. [Google Scholar] [CrossRef]
  29. Chorus, C. Random Regret Minimization: An Overview of Model Properties and Empirical Evidence. Transp. Rev. 2012, 32, 75–92. [Google Scholar] [CrossRef]
  30. Chorus, C.G.; Arentze, T.A.; Timmermans, H.J.P. A Random Regret-Minimization model of travel choice. Transp. Res. Part B Methodol. 2008, 42, 1–18. [Google Scholar] [CrossRef]
  31. Li, D.; Gao, Y.; Li, R.; Zhou, W. Hybrid Random Regret Minimization and Random Utility Maximization in the Context of Schedule-Based Urban Rail Transit Assignment. J. Adv. Transp. 2018, 2018, 9789316. [Google Scholar] [CrossRef]
  32. Hensher, D.A.; Greene, W.H.; Ho, C.Q. Random Regret Minimization and Random Utility Maximization in the Presence of Preference Heterogeneity: An Empirical Contrast. J. Transp. Eng. 2016, 142, 04016009. [Google Scholar] [CrossRef]
  33. Keya, N.; Anowar, S.; Eluru, N. Freight Mode Choice: A Regret Minimization and Utility Maximization Based Hybrid Model. Transp. Res. Rec. J. Transp. Res. Board 2018, 2672, 107–119. [Google Scholar] [CrossRef]
  34. Van Essen, M.; Thomas, T.; Van Berkum, E.; Chorus, C. From user equilibrium to system optimum: A literature review on the role of travel information, bounded rationality and non-selfish behaviour at the network and individual levels. Transp. Rev. 2016, 36, 527–548. [Google Scholar] [CrossRef]
  35. Shi, Z.; Pan, W.; He, M.; Liu, Y. Understanding passenger route choice behavior under the influence of detailed route information based on smart card data. Transportation 2023, 52, 615–639. [Google Scholar] [CrossRef]
  36. Hua, W.; Ong, G.P. Effect of information contagion during train service disruption for an integrated rail-bus transit system. Public Transp. 2018, 10, 571–594. [Google Scholar] [CrossRef]
  37. Ben-Elia, E.; Di Pace, R.; Bifulco, G.N.; Shiftan, Y. The impact of travel information’s accuracy on route-choice. Transp. Res. Part C Emerg. Technol. 2013, 26, 146–159. [Google Scholar] [CrossRef]
  38. Xu, X.; Wang, X.; Ye, Z.; Zhang, A.; Liu, J.; Xia, L.; Li, Z.; Feng, B. Route recommendation method for frequent passengers in subway based on passenger preference ranking. Expert Syst. Appl. 2024, 252, 124216. [Google Scholar] [CrossRef]
  39. Arentze, T.A. Adaptive Personalized Travel Information Systems: A Bayesian Method to Learn Users’ Personal Preferences in Multimodal Transport Networks. IEEE Trans. Intell. Transp. Syst. 2013, 14, 1957–1966. [Google Scholar] [CrossRef]
  40. Xu, X.; Xie, L. Route choice behavior of urban rail transit passengers based on guidance information. J. Transp. Syst. Eng. Inf. Technol. 2022, 22, 63–73. [Google Scholar] [CrossRef]
  41. Kenneth, E.T. Discrete Choice Methods with Simulation, 2nd ed.; Cambridge University Press: Cambridge, UK, 2009. [Google Scholar]
  42. Lu, Q.-C.; Zuo, X.-Y.; Chen, C.; Dong, Z.; Xu, P.-C.; Li, J. The heterogeneity of travel mode choice behavior under unplanned metro service disruptions. Transp. Res. Part D Transp. Environ. 2025, 142, 104683. [Google Scholar] [CrossRef]
  43. Bi, H.; Zhang, X.; Zhu, W.; Gao, H.; Ye, Z. Why they take the risk to perform a direct left turn at intersections: A data-driven framework for cyclist violation modeling. Accid. Anal. Prev. 2025, 209, 107846. [Google Scholar] [CrossRef] [PubMed]
  44. Szeto, W.Y.; Wong, R.C.P.; Yeung, J.; Wong, S.C. Mixed logit approach to modelling arrival time choice behaviour of cemetery and columbarium visitors during grave-sweeping festivals. Transp. A Transp. Sci. 2016, 12, 313–329. [Google Scholar] [CrossRef][Green Version]
Figure 1. Framework of travel choice behavior under guidance information provision.
Urbansci 09 00546 g001
Figure 2. Example of a hypothetical scenario used in the questionnaire.
Urbansci 09 00546 g002
Figure 3. Socioeconomic attribute distribution of the respondents.
Urbansci 09 00546 g003
Figure 4. Maximum acceptable waiting time.
Urbansci 09 00546 g004
Table 1. Variables and levels in the design of hypothetical scenarios.
VariablesLevels
Travel-related variables
Travel distance1: short, 5 km; 2: medium, 15 km; 3: long, 25 km
Travel purpose1: commute; 2: leisure
Service disruption-related variables
Affected types of passengers1: Type 1, 2: Type 2, 3: Type 3, 4: Type 4
Guidance information-related variables
Recommended alternative1: recommend detour route in the metro;
2: recommend changing origin or destination station;
3: recommend ground transportation;
4: no recommendation
Message push frequency1: low frequency, pushing one reminder message;
2: medium frequency, pushing three identical reminder messages;
3: high frequency, pushing three different reminder messages
Explanation of recommendation1: Explain the reason from the passenger’s perspective, for example: “This plan can help you reduce the uncertainty of travel time and enhance your travel experience.”
2: Explain the reason from the metro system’s perspective, for example: “This plan can help alleviate passenger congestion in the metro system.”
Table 2. Travel characteristic and information use habits of the respondents.
VariableLevelFrequencyPercentage
Frequency of metro rides per week092%
1~515433%
6~1015233%
10~1511124%
>15398%
Commute distance (km)<510623%
5~1014130%
10~1513128%
>158719%
Primary mode for commutingWalking153%
Shared bicycle/e-bike204%
Private bicycle/e-bike337%
Taxi/Ride-hailing72%
Metro33171%
Bus306%
Private car296%
Primary mode for leisure activitiesWalking20%
Shared bicycle/e-bike123%
Private bicycle/e-bike112%
Taxi/Ride-hailing388%
Metro24954%
Bus296%
Private car12427%
Channels for obtaining travel informationStation passenger information system10523%
Social media6113%
Travel app27659%
Mobility mini program235%
Whether you often check travel information on smartphone before travelingYes40888%
No5712%
Whether you have noticed information related to metro service disruptionsYes39385%
No7215%
Whether you have personally experienced metro service disruptionsYes20043%
No26557%
Table 3. Comparison results for the RRM, RUM, and HUR models.
Model SummaryRUMRRMHUR
Final log likelihood−2128.464−2127.357−2121.538
Rho-squared0.3090.3100.312
Akaike Information Criterion4310.9284308.7144297.076
Bayesian Information Criterion4460.1934457.9794446.341
Note: In the RRM model, variables related to travel alternatives and guidance information were specified under the RRM rule, whereas the other variables were specified under the RUM rule.
Table 4. Estimation results of the hybrid utility-regret model.
VariableApply toParametert-ValueStandard Error
constant termA13.72 ***5.720.65
A25.79 ***8.660.67
A36.21 ***8.510.73
A44.65 ***5.660.82
A52.58 **2.541.02
B11.93 ***4.860.40
B21.50 ***4.050.37
B31.35 ***3.660.37
B42.33 ***5.100.46
B51.46 ***3.070.48
B62.05 ***4.000.51
Travel alternative variables
Travel time (hour)All−1.96 *−1.751.12
Travel cost (100 CNY)All−2.33 **−2.001.17
Number of transfersAll−0.08−0.750.11
Guidance information variables
Explanation from the perspective of passenger’s interest All0.53 ***15.100.04
Explanation from the perspective of the metro system’s interestAll0.49 ***12.400.04
Medium push frequencyB4~B6−1.28 ***−2.620.28
High push frequencyB4~B6−0.75 ***−2.660.49
Waiting time variables
β w a i t A1~A5−112.00 ***−5.0922.00
Expectation b b e s t (min)A1~A56.40 ***7.860.81
Standard error σ w a i t (min)A1~A57.85 ***9.050.87
Socio-demographic characteristics
Age (<35)A1~A3, B6−0.70 ***−3.220.22
Bachelor’s degree or aboveB70.61 **1.970.31
Monthly income (>10,000 CNY)A1~A3, B6−0.70 ***−3.400.21
Have previously noticed service disruption informationA1~A51.33 **2.380.56
Interaction variables
Type 2 × Explanation from the perspective of the metro system’s interestB4~B5−1.03 **−2.000.51
Commute purpose × travel costB70.01 **2.190.01
Model summary
Number of Observations1860
Init log likelihood−3082.039
Final log likelihood−2121.538
Rho-squared0.312
Adjusted Rho-squared0.303
Note: ***, p < 0.01; **, p < 0.05; *, p < 0.1.
Table 5. Estimated results of the waiting behavior function.
Optimal Waiting TimeProbability of the Optimal Waiting Duration Greater than Zero
ExpectationStandard Error
Commuting4.8813.30 **64%
Leisure7.28 ***7.20 ***84%
Have previously noticed metro service disruption information6.78 ***8.04 ***80%
Have not previously noticed metro service disruption information2.748.61 ***62%
Note: ***, p < 0.01; **, p < 0.05.
Table 6. Guidance Information Strategies.
ExplanationFrom Passenger’s PerspectiveFrom Metro System’s Perspective
Frequency
LowStrategy 1Strategy 2
MediumStrategy 3Strategy 4
HighStrategy 5Strategy 6
Note: Each row represents the message push frequency: low (one message pushed), medium (three identical messages pushed), and high (three different messages pushed). Each column represents the perspective from which the reason for recommending a particular option is explained: the passenger’s interest and the metro system’s interest.
Table 7. Results of Sensitivity Analysis.
Passenger
Type
Recommended
Plan
No
Guidance
Guidance Information Strategy
123456
Type 1B60.27%2.47%2.06%0.70%0.58%1.18%0.98%
B70.26%2.38%1.99%----
Type 2B41.01%13.02%4.13%4.00%1.19%6.58%1.99%
B50.51%6.99%2.12%2.05%0.60%3.42%1.01%
B60.28%4.01%3.25%1.15%0.93%1.93%1.56%
B70.38%5.38%4.37%----
Type 3B233.52%69.97%67.17%----
B331.38%67.87%64.98%----
B614.88%44.67%41.49%18.36%16.49%27.54%25.03%
B720.22%53.93%50.69%----
Type 4B225.66%55.85%53.07%----
B324.02%53.68%50.88%----
Disclaimer/Publisher’s Note: The statements, opinions and data contained in all publications are solely those of the individual author(s) and contributor(s) and not of MDPI and/or the editor(s). MDPI and/or the editor(s) disclaim responsibility for any injury to people or property resulting from any ideas, methods, instructions or products referred to in the content.