Article

Urban Heat Island Effect and Unequal Temperature-Related News Attention in Taiwan’s Major Cities

1
Research Center for Environmental Changes, Academia Sinica, 128, Academia Rd., Sec. 2, Nankang, Taipei 11529, Taiwan
2
Department of Civil Engineering and Geomatics, Cheng Shiu University, No. 840, Chengching Rd., Niaosong District, Kaohsiung 83347, Taiwan
*
Author to whom correspondence should be addressed.
Urban Sci. 2025, 9(10), 417; https://doi.org/10.3390/urbansci9100417
Submission received: 11 September 2025 / Revised: 30 September 2025 / Accepted: 3 October 2025 / Published: 8 October 2025

Abstract

Taiwan, located in a subtropical region, has experienced continuous warming in recent years, making the Urban Heat Island (UHI) effect one of its most pressing environmental challenges. Importantly, UHI is not confined to Taipei, the most populous city, but is also present in other metropolitan areas. This study investigates UHI effects in the five largest cities in Taiwan and examines climate-related news attention using web crawling. Cross-city comparisons are further conducted through Urban Heat Island Intensity (UHII) and correlation analysis. The results reveal that Taipei records the highest number of UHI-related news reports, particularly during summer, and its UHII is about 1.5 °C to 3 °C higher than in the other four cities. In addition, UHII in Taipei shows a marked increase between 2021 and 2023, suggesting a worsening impact on citizens’ living conditions. Meanwhile, news coverage in Taipei dominates nationwide attention, creating a spatially uneven distribution of media focus. This imbalance may undermine efforts to promote UHI mitigation and adaptation strategies in cities outside Taipei. Overall, this study highlights that UHI is not solely a problem of Taipei but a widespread issue across Taiwan’s urban areas. The findings provide useful references for policymakers and government agencies, emphasizing the need for equitable attention and broader public engagement through media channels to raise awareness and foster comprehensive climate adaptation actions.

1. Introduction

Due to the issue of higher urbanization intensity, the Urban Heat Island (UHI) effect has become one of the most critical problems in the world, resulting in high air temperatures, poor outdoor thermal comfort, and various health problems [1,2,3,4]. Rapid urban expansion has significantly altered land cover and landscape patterns. These transformations have intensified the UHI effect, where central urban areas experience higher temperatures compared to surrounding suburbs. As a result, greenhouse gas emissions rise, aggravating environmental problems such as air and water pollution, while also disrupting the spatial continuity of Land Surface Temperature (LST) and influencing the surface thermal environment [5,6]. Globally, urban temperatures are increasing at twice the global average, and people worldwide are affected by the UHI phenomenon. Furthermore, cities in East Asia and the Pacific are particularly vulnerable, with some urban areas in Indonesia, Malaysia, and the Philippines experiencing more serious UHI effects. These highlight the urgent need for UHI mitigation and adaptation strategies. Therefore, mitigations and adaptations are necessary. Apart from meteorological conditions, various factors are seriously affecting the UHI effect, such as terrain, urban morphology, and human activities [7,8,9]. Therefore, many methods and strategies have been developed for UHI mitigation and adaptation based on the above factors, especially from an urban planning point of view, including increasing green coverage, better planning for urban ventilation, and improving the shading level of cities [10,11,12]. The above methods or strategies can effectively improve the living environment within cities by urban cooling and providing shelter for people, which can help reduce the impact of climate change and UHI on citizens. Due to the importance of UHI mitigation and adaptation, they have attracted widespread attention around the world. Nevertheless, while numerous studies have addressed UHI formation and mitigation strategies at the global level, there is still limited research that links these environmental impacts to broader social and spatial justice considerations. Understanding the UHI phenomenon not only as an environmental problem but also as a socio-spatial challenge provides a more comprehensive paradigm for sustainable urban development.
UHI is one of the most crucial issues in the world, including Taiwan. Since Taiwan has been rapidly developing like other countries, such as China, Japan, and Korea, UHI is seriously affecting the well-being of Taiwanese, including their health, comfort, and other aspects. Several studies have presented a strong UHI effect in Taiwan, especially in Taipei [13,14]. In Taipei, various factors are seriously affecting the UHI effect, such as urbanization, terrain conditions, and human activities [15,16,17]. According to the above causes, the UHI effect in Taipei becomes stronger and stronger, which has attracted the attention of the Taiwanese government. Therefore, the Taiwanese government proposed different policies for UHI mitigation and adaptation, which mainly focused on improving urban planning, such as increasing green areas and water bodies, identifying potential wind corridors, and developing guidelines for shading strategies [18,19,20,21]. With the above policies, regions within cities that require urgent improvements can be identified, including those with high air temperatures, poor ventilation conditions, and a lack of shading facilities. Following the above identification, further improvements will be implemented, which not only aim to reduce the air temperature within cities but also to enhance the outdoor thermal environment. Apart from the urban environment, the above improvements can also ensure a better well-being of citizens, including living quality, healthcare, and even energy use. However, most of these policies and scientific discussions have centered on Taipei, reflecting an implicit spatial bias in both academic and policy-oriented discourses. This uneven focus raises the question of whether other cities in Taiwan, which also experience rapid development and high thermal exposure, are overlooked in both research and policy frameworks.
Although most studies focused on and presented that the UHI effect in Taipei is serious and requires improvements, the UHI effect in other cities may also be serious and worthy of attention. Several previous studies presented the serious UHI effect in other cities in Taiwan, including Taichung, Tainan, and Kaohsiung [22,23,24]. However, a lack of studies and attention for other cities in Taiwan was observed. Although Taipei is the most important commercial and technical city in Taiwan, other cities are playing an important role in different industries, such as agriculture in Tainan, industry in Taichung and Kaohsiung, and the forestry industry in Hualian. Due to the above issue, an inequality in climate attention was observed, which primarily focused on Taipei and overlooked other cities. This phenomenon may not only be observed in Taiwan, but also in other nations. Equality and justice are critical factors in the sustainability pathway and nature-based solutions, which should be seriously considered during sustainable development [25]. However, justice is a big topic that relates to various aspects, including distributive, procedural, and recognitional justice [26]. Therefore, this study aimed to discuss a kind of climate justice in Taiwan. This indicates a clear research gap: while the severity of UHI in Taipei is well documented, there is inadequate comparative evidence regarding other major cities in Taiwan. Situating this issue within the paradigm of climate and environmental justice allows us to investigate how unequal research and policy attention may itself exacerbate vulnerabilities in less-studied regions.
In the field of urban climate, climate justice is one of the most important issues, which focuses on how climate change impacts people and the inequality of these impacts [27]. Typically, climate justice discussions focus on the impact of climate change on different communities and the costs and benefits of related mitigation and adaptation measures, which should be seriously considered [28]. In this context, climate justice can be understood as ensuring that the burdens and benefits of climate impacts and responses are distributed fairly across different social groups and geographic areas, avoiding the concentration of risks in vulnerable populations. Therefore, it is necessary to clarify and understand the climate change situation in different cities to ensure that appropriate policies and improvements can be further planned and implemented. The UHI effect directly embodies climate justice concerns, as higher urban temperatures disproportionately affect marginalized or less-resourced communities that often lack sufficient adaptive capacity. However, previous studies have shown that most research has focused on climate issues in Taipei (the capital), but has omitted other cities. This imbalance of scientific and media attention may reinforce spatial injustices, where certain cities receive more resources for mitigation while others, facing comparable or even growing risks, remain overlooked. Therefore, this study first investigated the UHI effect in five major cities in Taiwan in recent years and then examined the extent of attention these cities received. According to the results, the climate conditions and related injustice were further discussed. The implications of the findings in this study extend beyond Taiwan and can serve as a valuable reference for global urban sustainable development, since many rapidly urbanizing regions face similar challenges. By integrating physical measurements of UHII with an analysis of media attention, this study helps bridge the gap between environmental science and socio-political discourse. Such an approach not only contextualizes UHI as an urban climate issue but also positions it within the broader paradigm of climate justice and sustainable urban governance.

2. Materials and Methods

2.1. Research Areas

In this study, 5 major cities in Taiwan were selected as the research areas, as shown in Figure 1, including Taipei City (TP, including Taipei City and New Taipei City), Taoyuan City (TY), Taichung City (TC), Tainan City (TN), and Kaohsiung City (KH). In general, the above cities have relatively healthy economic conditions and higher populations, which have been regarded as the most important cities in Taiwan. The above cities have similar subtropical climates. For Taipei City, the average air temperature (Ta) in summer (June to August) ranged from 28.3 °C to 30.1 °C; for Taoyuan City, the Ta in summer ranged from 28.7 °C to 30.2 °C; for Taichung City, the Ta in summer ranged from 28.1 °C to 28.9 °C; for Tainan City, the Ta in summer ranged from 28.9 °C to 29.4 °C; for Kaohsiung City, the Ta in summer ranged from 28.9 °C to 29.4 °C. With the impacts of climate change, high air temperatures and strong UHI effects in these cities have become more frequent, which has seriously deteriorated the living environment of citizens. In addition to the meteorological conditions, there are several factors still affecting the UHI effect in the abovementioned cities, such as terrain conditions, urbanization, and various kinds of artificial heat. The climate projection for Taiwan indicates a substantial increase in the number of hot days (mean temperature ≥30 °C) throughout the mid-21st century. From 2021 to 2030 to 2051 to 2060, hot days are expected to rise from less than 30 days annually in sporadic areas to over 50–60 days across most residential regions, with the strongest impacts in southern Taiwan and eastern coastal areas. In contrast, the number of cold days (≤15 °C) shows only a slight decline, primarily in northern Taiwan, with little change projected in southern and eastern regions. The projection highlights a significant intensification of heat stress in Taiwanese cities, emphasizing the urgency for adaptive urban and environmental strategies [29].
Given the importance of the above cities in Taiwan, they have been selected as the research areas in this study. The UHI effect in the above cities from 2018 to 2023 will be subsequently investigated and analyzed.

2.2. Meteorological Data

To investigate the meteorological conditions of the research areas, related data were obtained from the Central Weather Administration (CWA) in Taiwan. In the 1980s, the CWA developed a global numerical weather forecasting system, publicly providing meteorological information, including air temperature, relative humidity, and wind speed [30]. In order to observe the air temperature distribution within research areas, data from several measurement points in different cities were collected and subsequently analyzed. The details of measurement points in different cities are shown in Table 1. A total of 162 measurement points identified by the CWA were used within the research areas. Due to the update and increase in measurement points as the demand for meteorological monitoring increases, the number of measurement points in recent years may be greater than in earlier years. After the data collection, the data was further processed and analyzed. From the observations, most of the highest air temperatures appeared at 14:00. Due to the stronger UHI effect and more serious health issues caused by higher temperatures in summertime, the daily air temperatures at 14:00 in summertime (June to August) from 2018 to 2023 were selected, and the average air temperature (Ta) of the above period was calculated. The Ta will be used for the subsequent calculation and analysis, including the calculation of UHI and UHI intensity (UHII).

2.3. Urban Heat Island Intensity

After obtaining the meteorological data, the UHI and UHII in the 5 cities can be calculated. For the UHI distribution, there are several methods to perform, such as linear regression, interpolation, simulation, and machine learning models [31,32]. Among the above methods, interpolation is one of the most popular methods, which can efficiently, effectively, and smoothly present the comprehensive distribution of UHI effects within the city [33,34]. Therefore, inverse distance weighted (IDW) interpolation was used for calculating the UHI distribution in the 5 mentioned cities from 2018 to 2023. IDW interpolation is widely applied in spatial analysis, as it is a reliable and effective method [35]. In IDW interpolation, a linear weighted combination of sample points was used for the calculation of cell values, and all IDW interpolations were conducted using QGIS software (version 3.28). Finally, the interpolation maps with a grid size of approximately 50 m were generated.
On the other hand, the UHII of the 5 cities from 2018 to 2023 was also calculated. UHII is a significant index of urbanization widely applied in numerous studies, which primarily describes the temperature difference between urban and rural areas [36]. According to the previous studies [37,38], the UHII can be calculated as follows:
U H I I = T m a x T m i n ¯
where Tmax = the highest air temperature in the city, and T m i n ¯ = the average air temperature of the 5 lowest air temperatures in the city (excluding measurement points from mountains). Overall, UHI maps of the 5 cities from 2018 to 2023 will be generated using IDW interpolation, and UHII will be further calculated based on meteorological data from the CWA.

2.4. Data Mining: Web Crawler

In order to investigate the attention to UHI and high air temperatures in the 5 cities, data mining was conducted. A web crawler was used in this study to obtain news related to UHI and high air temperatures in Taiwan. News media can help inform citizens and scrutinize the government, which is an important role in a democratic society [39]. News media are the information transmitters that inform citizens of various kinds of information, serve as a watchdog that monitors and holds those in power accountable, and legitimize institutions that provide legitimacy to political, social, and economic systems [40]. Due to the importance of news and the positive association between news and opinions from different communities [41], news related to UHI and high air temperatures in Taiwan from 2018 to 2023 was collected from Google News using a web crawler. Several criteria were applied to search for suitable and reliable news, and the processes can be described as follows:
(1)
Two keywords (in traditional Chinese) were selected and applied to search the related news from Google News using a web crawler: “UHI” and “high temperature”.
(2)
Because of the large number of news items that were searched and collected, further filtering is required. Therefore, regional criteria were applied, such as “Taiwan”, “our country”, the name of Taiwan’s cities, “air temperature”, “hot”, and “climate”. A total of 35 sub-keywords were further applied to filter the related news.
(3)
Finally, the UHI- and high temperature-related news were identified and sorted based on their regions, published years, and published months.
In this analysis, correlation analysis was employed to examine the relationships among different variables, thereby reflecting the focus and direction of news discussions in each region. The correlation coefficients were calculated using the Pearson method, expressed as: r x y = ( x i x ¯ ) ( y i y ¯ ) ( x i x ¯ ) 2 ( y i y ¯ ) 2
In Python 3.9, the Pearson correlation coefficients among numerical variables in a DataFrame can be directly calculated using the correlation (method = “Pearson”) function from the pandas library.

3. Results

3.1. UHI Distribution in Five Cities in Taiwan

After calculating Ta in summertime in five cities from 2018 to 2023, UHI maps were generated using IDW interpolation, and the maps with the strongest UHI effect in the five cities are shown in Figure 2. For Taipei City, the strongest UHI effects were observed in 2023, with air temperatures ranging from 27.5 °C to 34.7 °C. High air temperatures can be obviously observed in downtown Taipei City, such as Wanhua District, Banqiao District, and Sanchong District. For Taoyuan City, the strongest UHI effect was observed in 2023, with air temperature ranging from 29.2 °C to 33.5 °C. The highest temperature can be mainly observed in downtown Taoyuan City, Bade District. However, the greater number of ponds in Taoyuan City can help mitigate the UHI effect and urban cooling, resulting in lower air temperatures [42]. For Taichung City, the strongest UHI effects were observed in 2022, with air temperature ranging from 24.9 °C to 33.5 °C. Typical UHI effects can be observed in downtown Taichung City, including the Beitun District, Dali District, and Wuri District. For Tainan City, the strongest UHI effects were observed in 2019, with air temperature ranging from 28.1 °C to 33.0 °C. The higher air temperature observed in downtown Tainan City may be caused by the poor ventilation conditions, higher demand for energy consumption, and less natural landscape due to the higher intensity of urbanization and development [43]. For Kaohsiung City, the strongest UHI effects were observed in 2023, with air temperatures ranging from 28.7 °C to 34.1 °C. Apart from the mountain district in the eastern Kaohsiung City, the higher air temperature can be observed in the downtown districts that are near the sea, such as Qianzhen District, Xiaogang District, and the Sanmin District, which may have poor ventilation conditions because of the higher intensity of urbanization. Overall, the above five major cities in Taiwan have serious UHI effects, especially in Taipei City, Taichung City, and Tainan City.

3.2. UHII in Five Cities in Taiwan

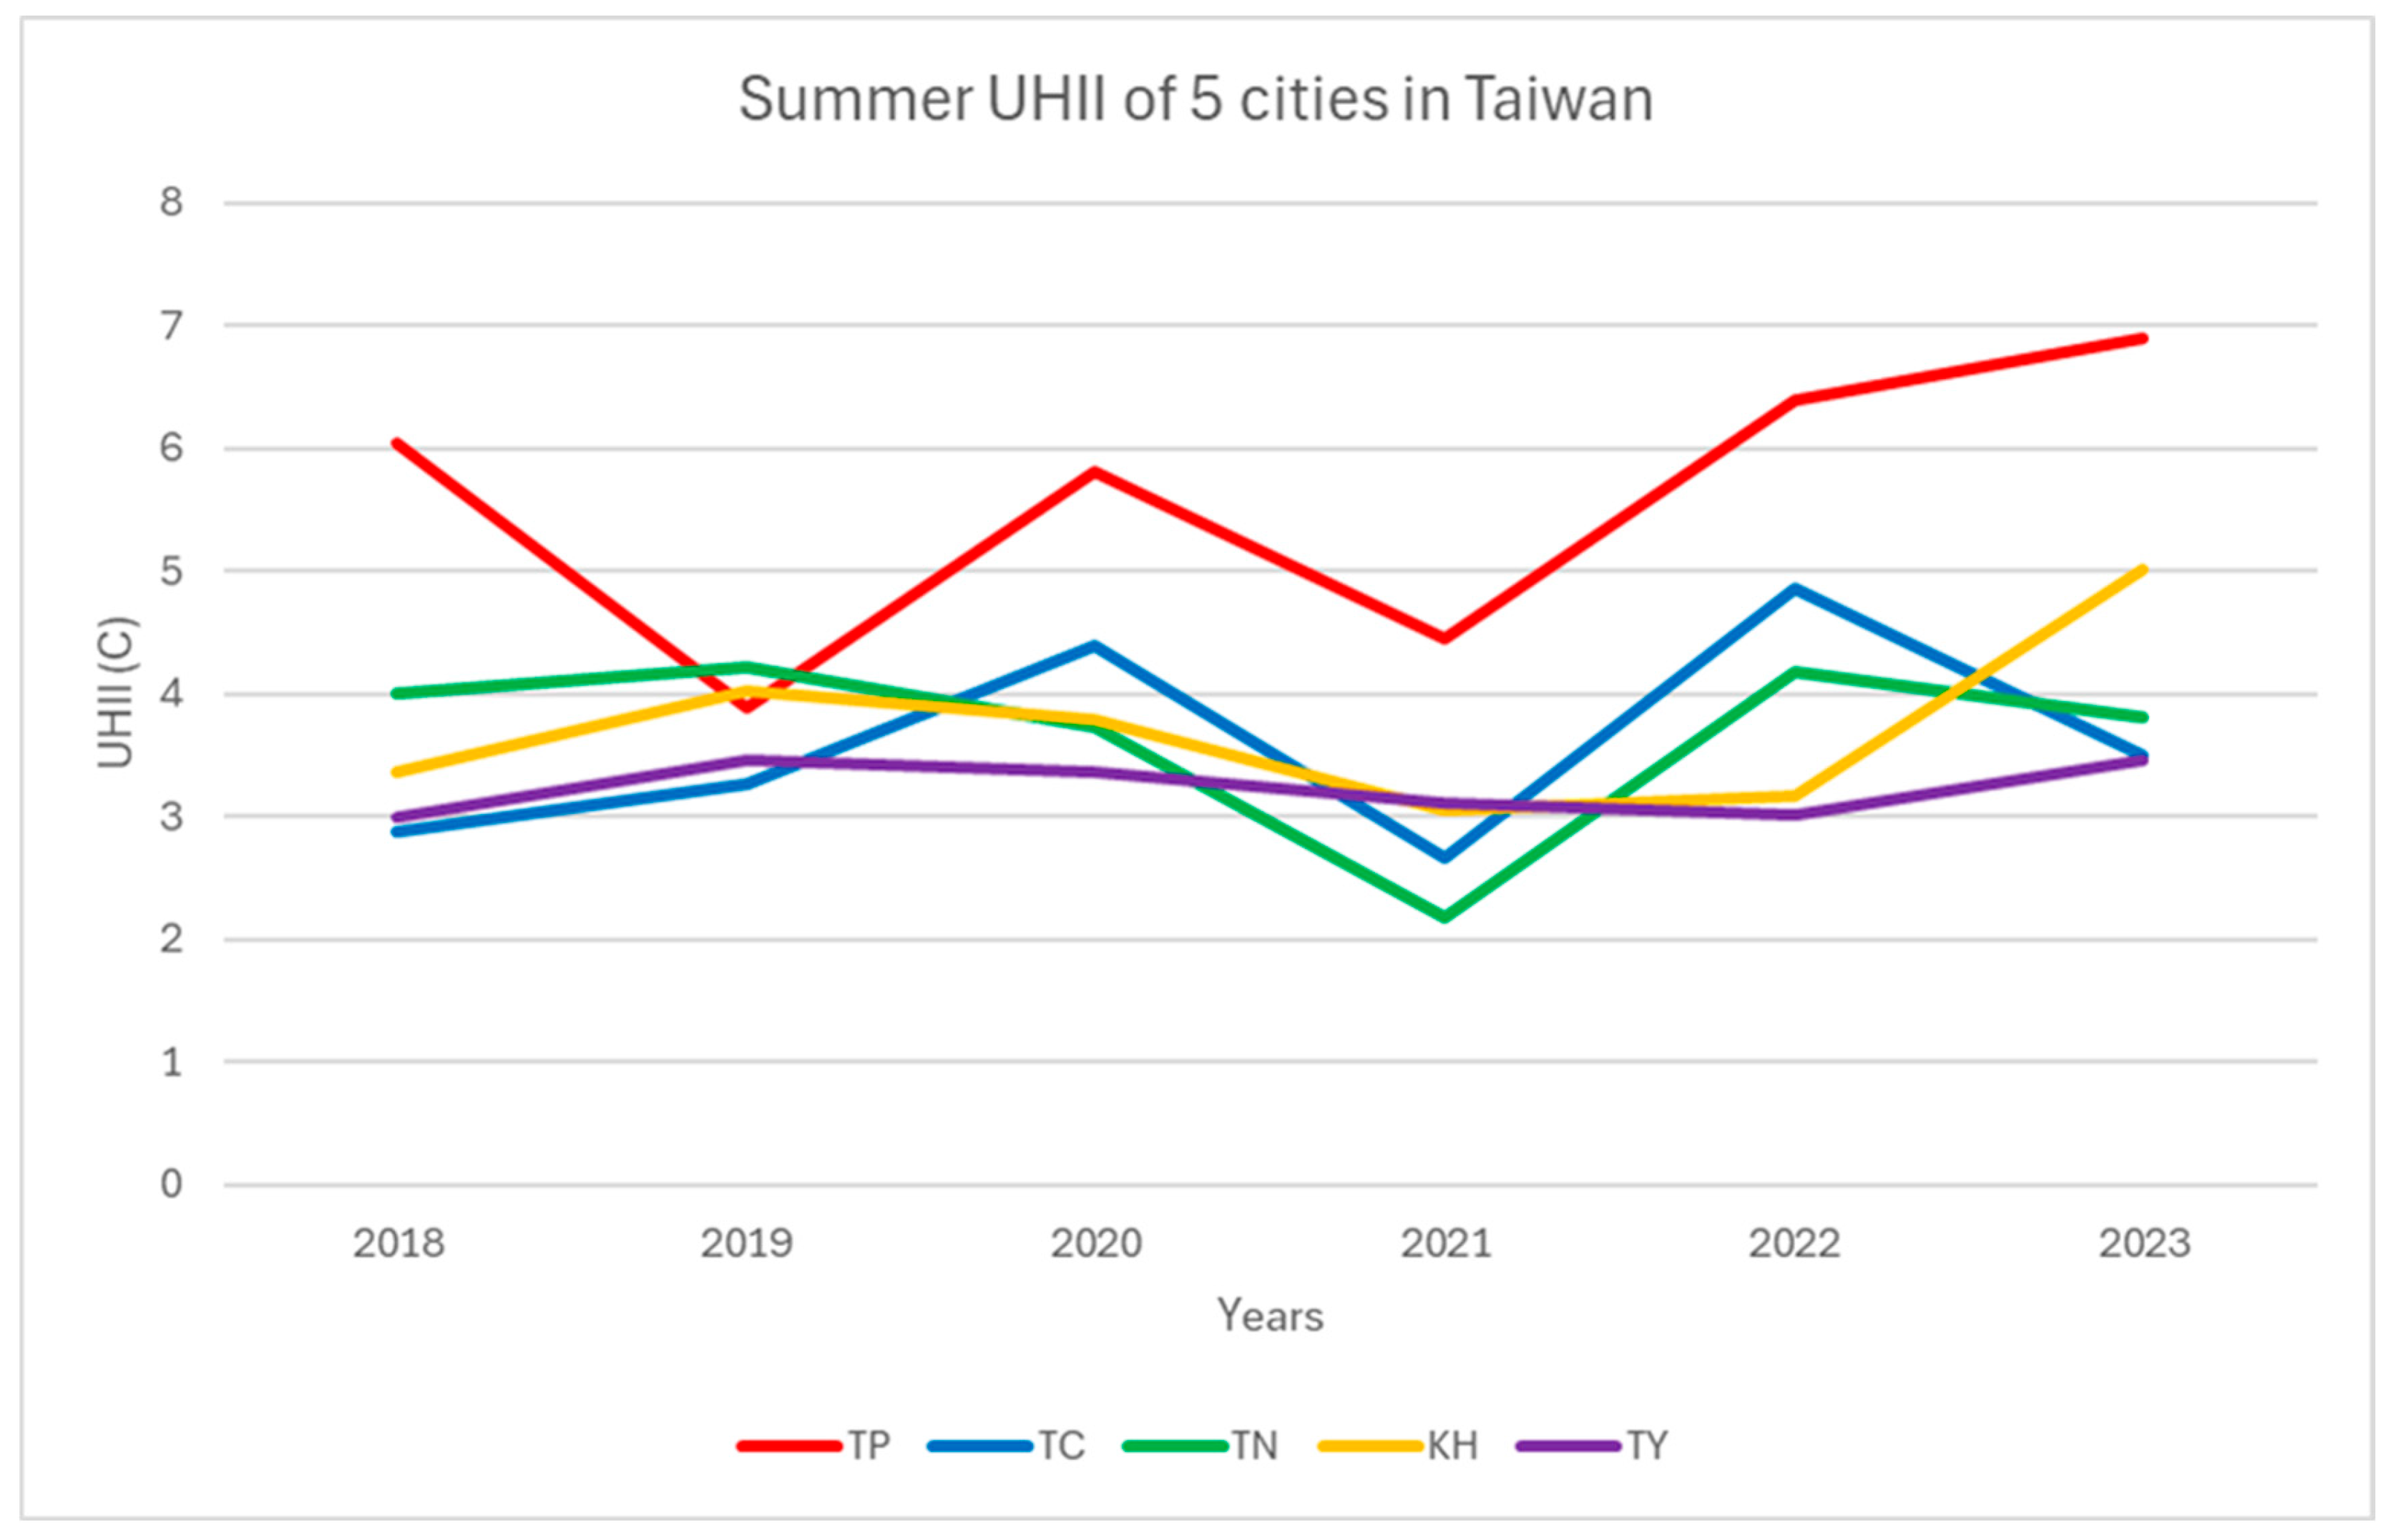
In order to investigate the seriousness of the UHI effect in the five cities, the UHIs of the above cities from 2018 to 2023 were calculated and presented in Figure 3. In general, Taipei City has the most serious UHI effect compared to other cities, which is significantly stronger. For Taipei City, the highest and lowest UHII are about 6.9 °C and 3.9 °C, respectively, which were observed in 2023 and 2019. For Taoyuan City, the highest and lowest UHII are about 3.5 °C and 3.0 °C, respectively, which were observed in 2023 and 2018. For Taichung City, the highest and lowest UHII are about 4.9 °C and 2.7 °C, respectively, which were observed in 2022 and 2021. For Tainan City, the highest and lowest UHII are about 4.2 °C and 3.2 °C, respectively, which were observed in 2019 and 2021. For Kaohsiung City, the highest and lowest UHII are about 5.0 °C and 3.1 °C, respectively, which were observed in 2023 and 2021. Therefore, the results showed that the UHI effect is significantly serious in 2023, which caused a relatively high UHII in several cities. Moreover, Taipei City has experienced significant growth in UHII compared to other cities, which should be a serious concern. Finally, a substantial increase in UHII was observed from 2021 to 2023, which may be caused by higher demands from human activities in the post-pandemic period. Previous studies presented that the resumption of economic activities and energy-intensive production has substantially increased anthropogenic heat emissions and pollutant concentrations in the post-pandemic era, thereby exacerbating urban thermal environments. The synergistic effects of elevated traffic- and industry-related emissions, coupled with the insulating properties of atmospheric pollutants, have contributed to the resurgence of Urban Heat Island intensity [44,45]. However, the results presented the seriousness of the UHI effect in the five cities. Although Taipei City has the strongest UHII, the UHII in other cities typically increased, especially in the post-pandemic period. On the other hand, the pronounced UHII in Taipei City can be largely attributed to its high urbanization intensity, characterized by dense built-up areas, limited vegetation coverage, and a concentration of economic activities, which collectively amplify anthropogenic heat emissions [46]. Compared with other cities, Taipei’s rapid urban development, characterized by dense high-rise buildings and extensive impervious surfaces, exacerbates heat retention and reduces the efficiency of natural ventilation [47]. At the same time, climate change has elevated the background temperature in all cities, but its effects are more evident in highly urbanized regions such as Taipei, where the synergy between urbanization-induced heat accumulation and global climate change intensifies UHII. This explains why Taipei City exhibits significantly stronger UHII and a sharper upward trend compared with the other cities [18].

3.3. High Temperature and UHI Related News Counts in Taiwan

A total of 223 and 33 news articles related to high temperature and UHI in Taiwan from 2018 to 2023 were searched and collected using the web crawler. The number of high-temperature and urban heat island-related news articles increases year by year, from 24 to 84 per year and from 2 to 13 per year, respectively. The results showed that high temperatures and UHI are becoming more important in urban climates and have attracted increasing attention in recent years. The distribution of the above news in the five cities from 2018 to 2023 is shown in Figure 4. In total, there are 44, 5, 8, 15, and 12 high-temperature-related news stories in Taipei City, Taoyuan City, Taichung City, Tainan City, and Kaohsiung City, respectively. On the other hand, there are 21, 0, 3, 3, and 1 UHI-related news items in the 5 major cities, respectively. Taipei City has the most news each year, compared to other cities. In addition to Taipei City, the other four cities have similar counts of news. However, the number of high-temperature-related news increased with the increasing UHII from 2021 to 2023, especially in Taipei City, Taichung City, Tainan City, and Kaohsiung City. Overall, the high temperature and UHI-related news increased and decreased with the UHII from 2018 to 2023, which can be clearly observed in Taipei City. Moreover, the number of UHI-related news is lower than the number of high-temperature-related news. Simple headlines of news can attract more attention from readers, which may cause the above difference between high-temperature and UHI-related news [48].
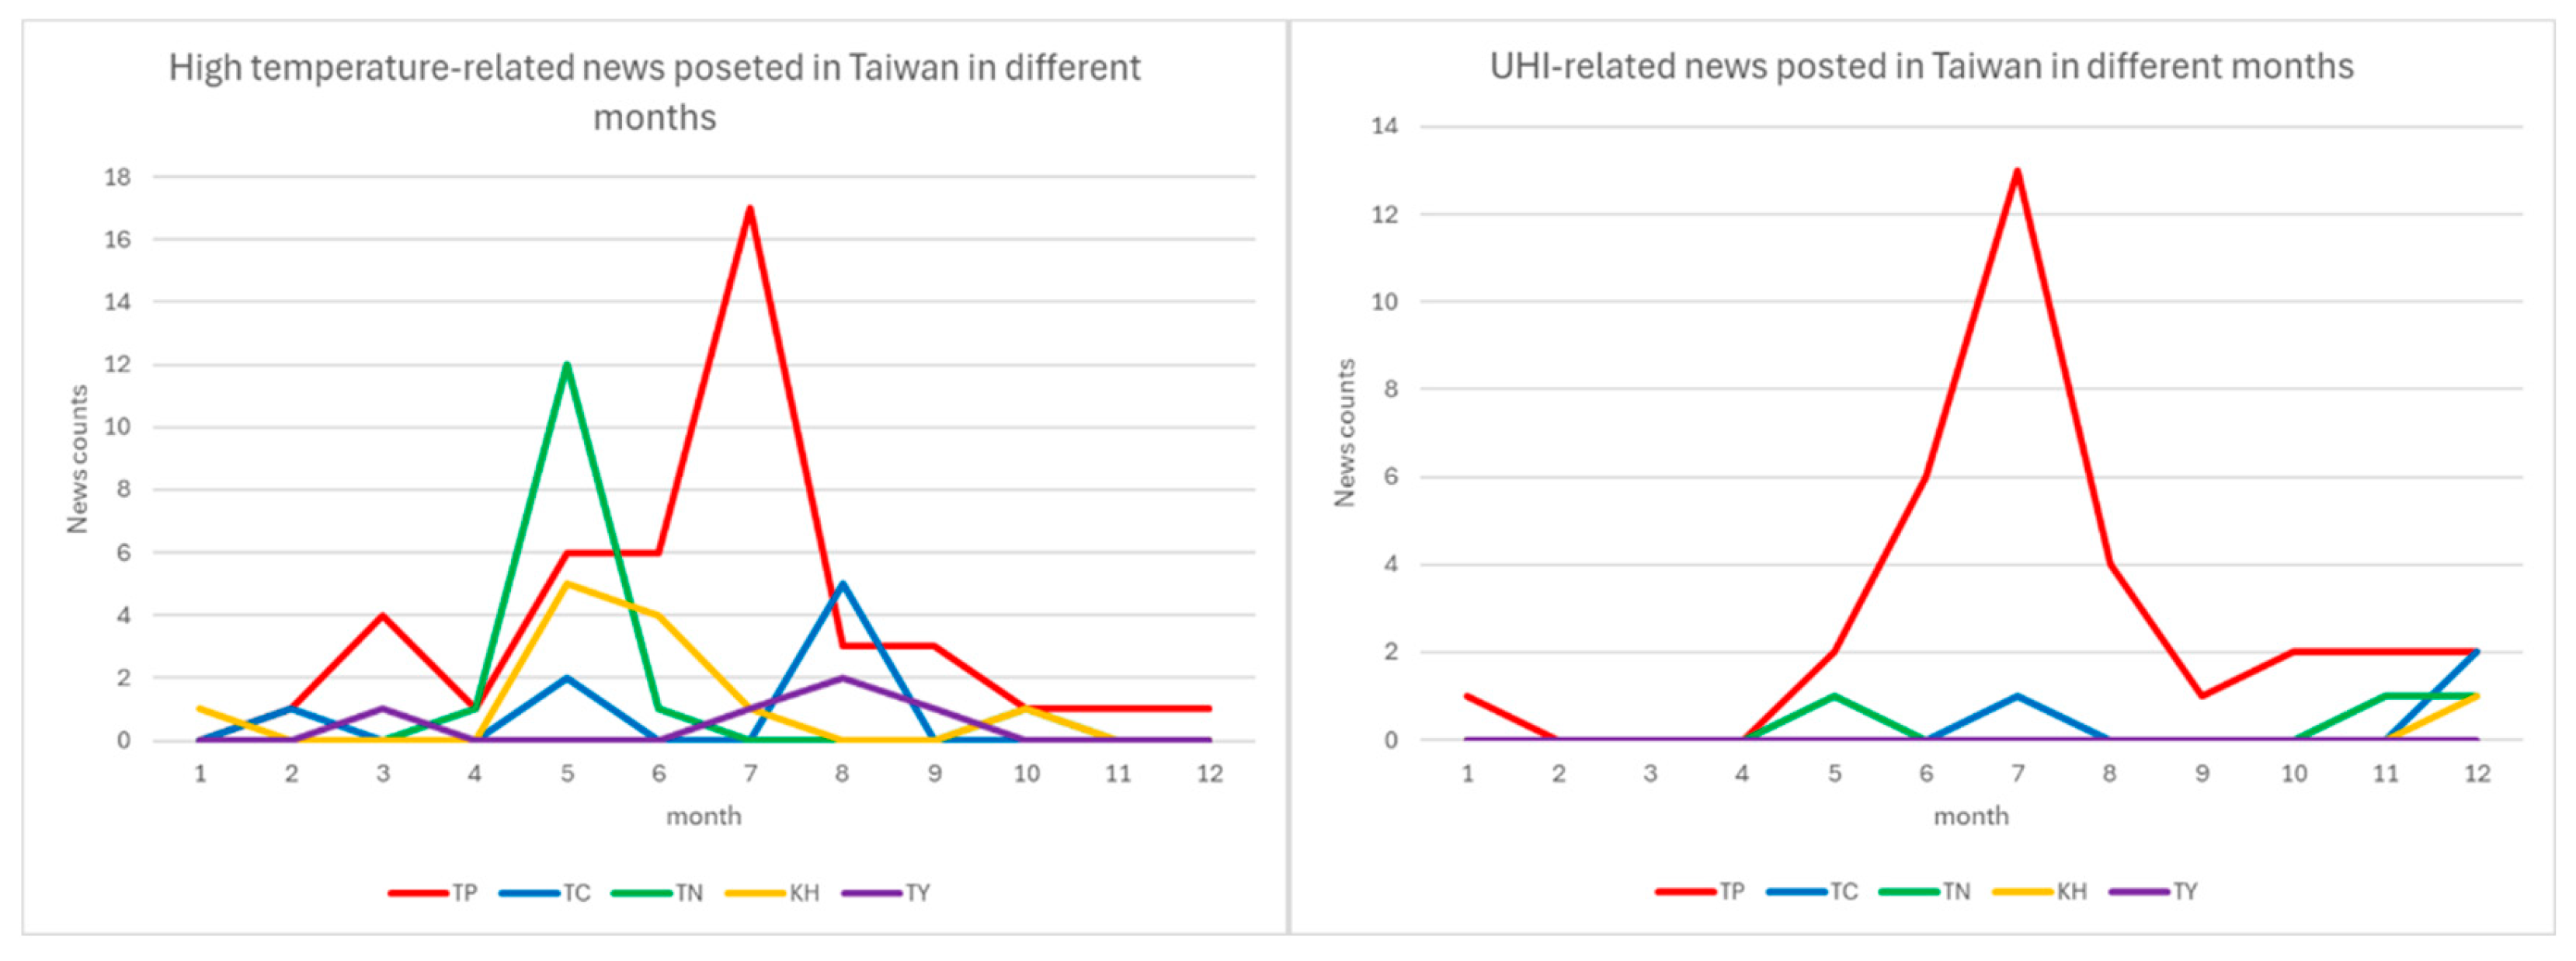
To further investigate the temporal pattern of high temperatures and UHI-related news in Taiwan, the number of related news in the five cities in different months from 2018 to 2023 was analyzed and presented in Figure 5. From Figure 5, there are more high temperatures and UHI-related news observed from April to August. Typically, Taipei City attracts the most attention in Taiwan, which has a higher proportion of related news. It is interesting that higher proportions of high-temperature-related news were observed in pre-summer (before June) and post-summer (after August) in southern Taiwan and central Taiwan, respectively. Overall, the number of high-temperature-related news stories increased with the rising air temperature due to seasonal changes. On the other hand, most of the UHI news was observed from April to August, which is similar to the trend of high-temperature-related news. However, most UHI-related news focused on Taipei City, which may overlook the UHI effect in other cities in Taiwan. In summary, high temperatures and UHI-related news in Taiwan are mainly distributed from April to August, increasing with rising temperatures. Moreover, Taipei City receives the most attention for high temperatures and UHI-related news in Taiwan, with a number that is significantly higher than other cities.

4. Discussions

4.1. UHI Effect Is Not Only in Taipei

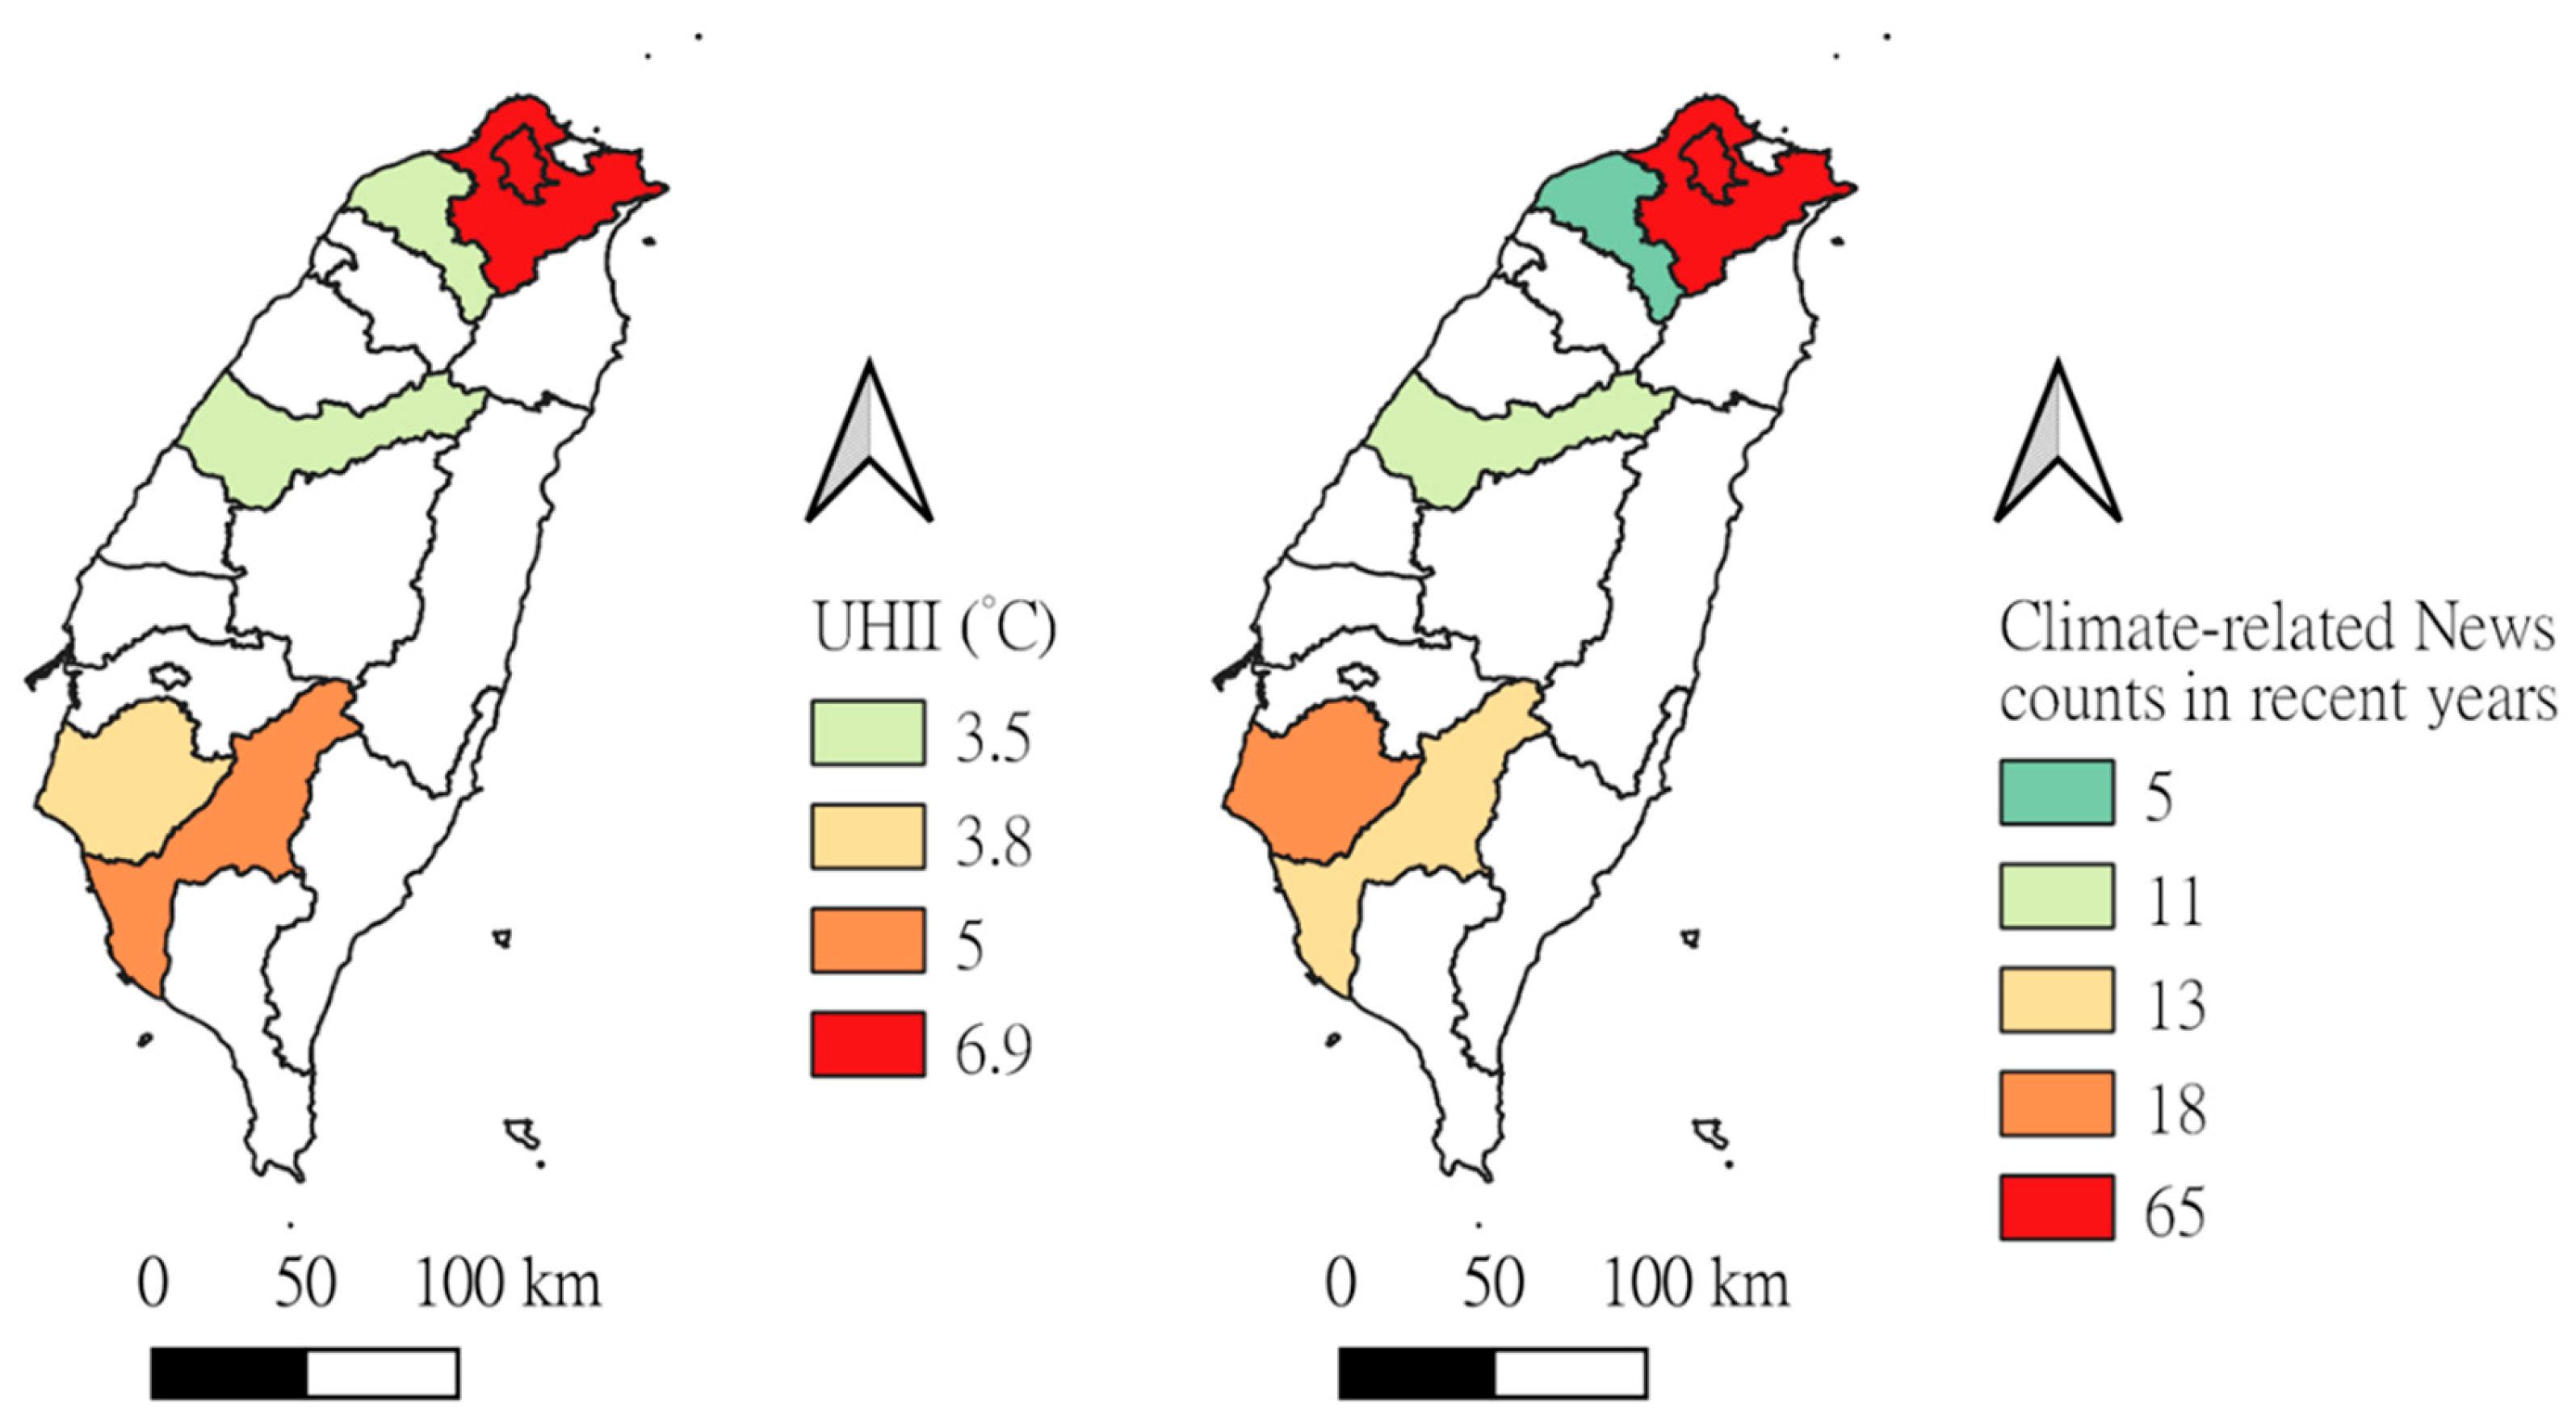
This study presents the UHI diagram and UHII of the 5 major cities in Taiwan. The results showed that compared to the other four cities, the UHI effect in Taipei City is relatively strong, with its UHII ranging from 1.5 °C to 3 °C higher than the other cities. Although Taipei City has a relatively strong UHI problem, the problem of UHI in other cities should be noted, especially the rising UHII from 2021 to 2023. In general, the above five cities have an increase in UHII from 2018 to 2023, especially in Taipei City and Kaohsiung City, which are 0.9 °C and 1.6 °C higher than in 2018. The UHII increases in other cities are also close to 0.5 °C compared to the UHII in 2018. These findings highlight not only the influence of urbanization on local meteorological conditions but also the deterioration of living environments for citizens [49]. The above results presented the different seriousness of the UHI effect in the five cities. However, a spatial injustice of temperature-related news was observed, as shown in Figure 6. Media attention in Taiwan has been disproportionately concentrated on Taipei City’s climate issues, with relatively little focus on other cities.” Given the significant role of media in shaping public awareness, the higher news attention in Taipei City may attract stronger policy responses, thereby exerting greater pressure on policymakers and government agencies to propose mitigation and adaptation measures [50]. Therefore, there may be more policy and resource allocation in Taipei City for high temperature and UHI mitigation and adaptation compared with other cities. Although the UHII in Taoyuan City, Taichung City, Tainan City, and Kaohsiung City is lower than that in Taipei City, it is still necessary to formulate policies to prevent further deterioration of local meteorological and living conditions.
To further discuss the impact of spatial injustice in temperature-related news on high temperatures and UHI mitigation and adaptation, this study employed correlation analysis combined with a literature review. As shown in the correlation analysis in Figure 7, among different cities, only Taipei and Taichung exhibit a strong positive correlation between UHI-related news, temperature-related news, and UHII, while other cities show little or no discussion (e.g., Taoyuan). This indicates a lack of local news coverage, which may limit the attention and responsiveness of local governments to climate issues. Previous studies were reviewed. A higher volume of news coverage often generates more public attention and political pressure, resulting in a greater allocation of resources to Taipei City, regardless of whether the coverage is positive or negative [51,52]. Therefore, limited media coverage in other cities may result in fewer resources and weaker support for local climate action. Moreover, news reporting can raise public awareness and intensify public pressure on governments, indirectly shaping political decision-making [53]. A lack of news coverage in cities outside Taipei may therefore weaken local government action on climate issues, limiting research, policy development, and implementation of mitigation and adaptation strategies. Finally, the spatial injustice of temperature-related news may lead to an uneven distribution of analysis and studies. The resulting findings, methods, and policies may not be directly applicable to other cities, which should be seriously considered in the future. Overall, the spatial injustice of temperature-related news distribution was observed and investigated, which may lead to inequality in resource allocation in cities outside Taipei City. Although the other four major cities in Taiwan are facing a serious problem of spatial injustice, the related problems in other cities with lower populations and economic conditions may be even more severe, which should be reviewed and improved in the future.
In summary, the unequal distribution of temperature-related news coverage contributes to inequities in resource allocation across Taiwanese cities. While the four other major cities already face this challenge, the situation may be even more severe in smaller cities with lower population densities and weaker economic conditions, underscoring the need for more balanced media representation and policy attention in the future. Furthermore, cooling and climate adaptation policies should be formulated based on local research evidence rather than relying solely on findings from the capital. Tailoring strategies to specific urban morphology, socio-economic context, and environmental conditions of each city is essential to ensure effective and equitable mitigation of the UHI effect.

4.2. Why Are All Media Focused on Taiwan but Not on Other Cities?

Since the spatial injustice of temperature-related news distribution was observed, the potential reasons for the above phenomenon were further investigated and discussed. First, Taipei City is the capital city of Taiwan, which is densely populated. Population is one of the most important factors in news items, which is why major news coverage is distributed in big cities [54,55]. Due to the larger population and higher intensity of urbanization, there are more problems within Taipei City, leading to a greater chance of receiving more news attention. Moreover, Taipei City has political and economic significance in Taiwan, which concentrates major governmental and administrative functions, naturally attracting more news attention, including political and temperature-related news. Therefore, the capital city status brought Taipei City more national attention, which may be beneficial for mitigating high temperatures and UHI, as well as adapting to them. Second, the allocation of media and reporters may affect the news attention in different cities [56,57]. The greater number of reporters may lead to a larger number of news stories, resulting in the news domination of those cities. Most media outlets and organizations are currently based in Taipei City, which gives reporters there better proximity and accessibility for local news reporting. Additionally, the cost of reporting news in other cities may be higher than in Taipei City, making it less cost-effective. Therefore, the allocation of media and reporters may be seriously affecting the news attention distribution in Taiwan. Third, due to the dense population and affluent economic conditions of Taipei City, the news consumption rate may be higher than in other cities, resulting in a higher demand for audience. News media have to focus on their target audience and satisfy them, to ensure their survival [58]. In national news, the geographical distribution of readers may seriously affect the news coverage of places [59]. Therefore, the news coverage of Taiwan may mainly focus on Taipei City due to the target audience of news media mostly distributed in Taipei City, including citizens, policymakers, and the government. Therefore, the distribution of audiences may seriously affect the distribution of news attention. Overall, the above content briefly explained the possible causes of the spatial injustice of news attention in Taiwan.
However, the above studies may be old. Therefore, the literal studies of related spatial injustice in news attention have been investigated. However, nowadays, news is integrated into the media, making it difficult to separate. News attention to injustice has been widely observed across different countries and contexts. In the United Kingdom, interregional inequality of media debates has been identified [60]. In the United States, unequal community coverage has been noted in New York, influenced by political and economic factors [61]. Similarly, during the COVID-19 pandemic, local news in rural areas frequently emphasized urban issues rather than their own local conditions [62]. In Japan, news coverage related to COVID-19 was found to focus predominantly on urban areas, while rural areas received far less attention [63]. These cases collectively illustrate that news attention injustice is a recurring and pervasive phenomenon, reflecting broader structural inequalities in media representation. However, temperature-related news is not as well-known or popular as entertainment, politics, and news related to daily life, and related research is lacking. Therefore, more research and studies should be conducted in the future. Overall, the spatial injustice of news attention may be attributed to population distribution, the allocation of reporters and newsrooms, urbanization intensity, and the distribution of readers.
In addition, the role of social media and digital platforms has become increasingly significant in shaping public attention to news and climate-related issues. Unlike traditional media, where editorial decisions largely determine coverage, social media platforms rely heavily on algorithmic curation and engagement-driven visibility. This mechanism often amplifies topics such as politics, entertainment, or lifestyle, while climate-related and temperature-related issues remain relatively marginalized. At the same time, the higher digital activity concentrated in metropolitan regions tends to reinforce urban-centered narratives, thereby reproducing spatial inequalities in news attention. Although social media also provides opportunities for decentralized participation and grassroots climate advocacy, the structural dynamics of these platforms highlight that digital dissemination may both challenge and exacerbate existing patterns of media injustice.

4.3. Limitations and Suggestions

This study presented the UHI effect and uneven distribution of news attention in the five major cities in Taiwan, respectively. However, there are some limitations that should be discussed and enhanced in the future. First, the meteorological conditions of each city were observed based on the measurement points provided by CWA. The density of measurement points may not be enough to comprehensively present the microclimate conditions within cities. Therefore, measurement networks with high density should be considered in the future, which may increase the precision of the temperature map for UHI observations [64]. Moreover, the news attention was discussed based on the climate-related news that was searched with two keywords. However, more keywords should be further considered and applied in the future. In addition, although the above results presented the uneven distribution of news attention in Taiwan, the results only represent the news attention in climate-related fields, but not others. Finally, this study discussed the spatial injustice of news attention mainly according to the geographical distribution of news releases. However, spatial justice should be discussed in a wider context, including knowledge of critical environment, political theories, and even history [65]. More considerations can help comprehensively and justly create a sustainable environment to address the challenges of climate change and climate change in the future.

5. Conclusions

In summary, this study first investigated the urban climate conditions in the five major cities in Taiwan, including Taipei City, Taoyuan City, Taichung City, Tainan City, and Kaohsiung City. In general, Taipei City has the most serious problems of high temperature and UHI effect compared to other cities, which has a UHII that is 1.5 °C to 3 °C higher than the other four cities. However, UHI effects were still observed in other cities. Moreover, the increasing UHII can be clearly observed from 2021 to 2023, which may be caused by the higher number of human activities after the COVID-19 pandemic. Due to the increasing temperature and UHII, policies for mitigation and adaptation in the above cities should be discussed, analyzed, and implemented to reduce the impact of climate change on citizens. After that, this study employed web crawling to investigate climate-related news attention in the five cities mentioned above and conducted correlation analysis on the cities’ temperature, UHI, and UHII. The results showed that the news attention increased with the years from 2018 to 2023, indicating that the urban climate has become more crucial in recent years. Typically, Taipei City has the most news attention in Taiwan, with the highest number of climate-related news in each year. The number of climate-related news and UHII has a positive correlation in Taipei City, but this correlation is not significant in other cities. Moreover, the climate-related news mostly distributed from April to August increased with the rising temperature due to the seasonal changes in general. Overall, a spatial injustice in news attention distribution was observed, with a focus on Taipei City and an omission of other cities. The above injustice may be caused by the higher population, urbanization intensity, allocation of news resources, and target audience distribution. However, the injustice may not be beneficial for mitigating and adapting to high temperatures and UHI in other cities. The four major cities apart from Taipei City are facing a serious problem of uneven distribution of news attention, which may be more serious in other cities with lower populations and economic conditions. This study can serve as a reference for the government and policymakers in Taiwan, reminding them to pay attention to cities outside of Taipei City due to the serious climate issues they face. Globally, this study presented the inequality in temperature news attention within countries, which commonly occurs but is rarely discussed. By highlighting the imbalance between actual urban thermal risks and media coverage, the study contributes to a deeper understanding of how information inequality may reinforce spatial and social injustice. It also provides a new perspective for integrating climate communication into urban heat adaptation strategies. On the other hand, this study should be enhanced in the future by more comprehensively analyzing the news attention with richer keywords. Moreover, advanced techniques can be further applied, such as artificial intelligence and LLM, helping to filter out irrelevant news and employ human-like reasoning to evaluate analyses [66].

Author Contributions

Conceptualization, T.-K.L.; Data curation, T.-K.L.; Formal analysis, T.-K.L. and H.-C.H.; Funding acquisition, T.-K.L. and H.-C.H.; Investigation, T.-K.L. and H.-C.H.; Methodology, T.-K.L. and H.-C.H.; Project administration, T.-K.L.; Resources, T.-K.L.; Software, T.-K.L. and H.-C.H.; Supervision, T.-K.L. and H.-C.H.; Validation, T.-K.L.; Visualization, T.-K.L.; Writing—original draft, T.-K.L.; Writing—review and editing, H.-C.H. All authors will be updated at each stage of manuscript processing, including submission, revision, and revision reminder, via emails from our system or the assigned Assistant Editor. All authors have read and agreed to the published version of the manuscript.

Funding

This research received no external funding.

Data Availability Statement

In our use of Google News data, we only collect metadata such as keywords, headlines, and links, without retrieving or reproducing the full text of any articles. Furthermore, the collection is limited to open-access news sources, excluding any content behind paywalls or requiring subscription. The purpose of this collection is non-commercial and purely for research, and therefore it does not infringe copyright protection of the original publishers nor violate Google’s robots.txt restrictions, as no large-scale or unauthorized commercial redistribution of content is involved.

Acknowledgments

During the preparation of this study, the authors used QGIS software (version 3.28) and Python (version 3.9) for data processing, spatial analysis, and visualization. The authors have reviewed and edited all outputs generated by these tools and take full responsibility for the content of this publication.

Conflicts of Interest

The authors declare that they have no known competing financial interests or personal relationships that could have appeared to influence the work reported in this paper.

References

  1. Lin, P.; Lau, S.S.Y.; Qin, H.; Gou, Z. Effects of urban planning indicators on urban heat island: A case study of pocket parks in high-rise high-density environment. Landsc. Urban Plan. 2017, 168, 48–60. [Google Scholar] [CrossRef]
  2. Lau, T.K.; Lin, T.P. Investigating the relationship between air temperature and the intensity of urban development using on-site measurement, satellite imagery and machine learning. Sustain. Cities Soc. 2024, 100, 104982. [Google Scholar] [CrossRef]
  3. Lin, F.Y.; Huang, K.T.; Lin, T.P.; Hwang, R.L. Generating hourly local weather data with high spatially resolution and the applications in bioclimatic performance. Sci. Total Environ. 2019, 653, 1262–1271. [Google Scholar] [CrossRef]
  4. Singh, N.; Singh, S.; Mall, R.K. Urban ecology and human health: Implications of urban heat island, air pollution and climate change nexus. In Urban Ecology; Elsevier: Amsterdam, The Netherlands, 2020; pp. 317–334. [Google Scholar]
  5. Zhao, J.; Hu, C.; Li, Z.; Zhang, M.; Fan, H.; Li, K.; Yuan, R. Investigating the quantitative impact of the vegetation indices on the urban thermal comfort based on machine learning: A case study of the Qinhuai River Basin, China. Sustain. Cities Soc. 2025, 125, 106357. [Google Scholar] [CrossRef]
  6. Zhang, M.; Tan, S.; Zhang, C.; Chen, E. Machine learning in modelling the urban thermal field variance index and assessing the impacts of urban land expansion on seasonal thermal environment. Sustain. Cities Soc. 2024, 106, 105345. [Google Scholar] [CrossRef]
  7. Lin, C.Y.; Chen, F.; Huang, J.C.; Chen, W.C.; Liou, Y.A.; Chen, W.N.; Liu, S.C. Urban heat island effect and its impact on boundary layer development and land–sea circulation over northern Taiwan. Atmos. Environ. 2008, 42, 5635–5649. [Google Scholar] [CrossRef]
  8. Liu, B.; Guo, X.; Jiang, J. How urban morphology relates to the urban heat island effect: A multi-indicator study. Sustainability 2023, 15, 10787. [Google Scholar] [CrossRef]
  9. Lai, L.W.; Cheng, W.L. Air temperature change due to human activities in Taiwan for the past century. Int. J. Climatol. 2010, 30, 432–444. [Google Scholar] [CrossRef]
  10. Wong, N.H.; Tan, C.L.; Kolokotsa, D.D.; Takebayashi, H. Greenery as a mitigation and adaptation strategy to urban heat. Nat. Rev. Earth Environ. 2021, 2, 166–181. [Google Scholar] [CrossRef]
  11. Lau, T.K.; Tsai, P.C.; Ou, H.Y.; Lin, T.P. Efficient and cost-effective method for identifying urban ventilation corridors using a heuristic search algorithm. Sustain. Cities Soc. 2024, 101, 105144. [Google Scholar] [CrossRef]
  12. Tan, J.K.; Belcher, R.N.; Tan, H.T.; Menz, S.; Schroepfer, T. The urban heat island mitigation potential of vegetation depends on local surface type and shade. Urban For. Urban Green. 2021, 62, 127128. [Google Scholar] [CrossRef]
  13. Wang, C.H.; Lin, W.Z.; Peng, T.R.; Tsai, H.C. Temperature and hydrological variations of the urban environment in the Taipei metropolitan area, Taiwan. Sci. Total Environ. 2008, 404, 393–400. [Google Scholar] [CrossRef] [PubMed]
  14. Chen, Y.C.; Lo, T.W.; Shih, W.Y.; Lin, T.P. Interpreting air temperature generated from urban climatic map by urban morphology in Taipei. Theor. Appl. Climatol. 2019, 137, 2657–2662. [Google Scholar] [CrossRef]
  15. Mabon, L.; Shih, W.Y. Mapping the socio-political landscape of heat mitigation through urban greenspaces: The case of Taipei Metropolis. Environ. Urban. 2019, 31, 552–574. [Google Scholar] [CrossRef]
  16. Wu, C.D.; Lung, S.C.C.; Jan, J.F. Development of a 3-D urbanization index using digital terrain models for surface urban heat island effects. ISPRS J. Photogramm. 2013, 81, 1–11. [Google Scholar] [CrossRef]
  17. Chang, H.T. A temporal and spatial analysis of urban heat island in basin city utilizing remote sensing techniques. Int. Arch. Photogramm. Remote Sens. Spat. Inf. Sci. 2016, 41, 165–170. [Google Scholar] [CrossRef]
  18. Hwang, R.L.; Lin, C.Y.; Huang, K.T. Spatial and temporal analysis of urban heat island and climate change on residential thermal comfort and cooling energy in Taiwan. Energy Build. 2017, 152, 804–812. [Google Scholar] [CrossRef]
  19. Shih, W. Greenspace patterns and the mitigation of land surface temperature in Taipei metropolis. Habitat Int. 2017, 60, 69–80. [Google Scholar] [CrossRef]
  20. Hsieh, C.M.; Huang, H.C. Mitigating urban heat islands: A method to identify potential wind corridor for cooling and ventilation. Comput. Environ. Urban Syst. 2016, 57, 130–143. [Google Scholar] [CrossRef]
  21. Lin, Z.A.; Chang, C.; Lin, T.P. Designers’ Guided Site Shading Strategies: A Simplified Model for Radiative Cooling. Build. Environ. 2024, 259, 111824. [Google Scholar] [CrossRef]
  22. Lin, W.Z.; Tsai, H.C.; Wang, C.H.; Wu, K.Y. The subtropical urban heat island effect revealed in eight major cities of Taiwan. In Proceedings of the WSEAS International Conference on Environment, Ecosystems and Development, Venice, Italy, 2–4 November 2005; pp. 14–20. [Google Scholar]
  23. Chen, Y.C.; Yao, C.K.; Honjo, T.; Lin, T.P. The application of a high-density street-level air temperature observation network (HiSAN): Dynamic variation characteristics of urban heat island in Tainan, Taiwan. Sci. Total Environ. 2018, 626, 555–566. [Google Scholar] [CrossRef]
  24. Huang, J.M.; Chen, L.C. A numerical study on mitigation strategies of urban heat islands in a tropical megacity: A case study in Kaohsiung City, Taiwan. Sustainability 2020, 12, 3952. [Google Scholar] [CrossRef]
  25. Wijsman, K.; Berbés-Blázquez, M. What do we mean by justice in sustainability pathways? Commitments, dilemmas, and translations from theory to practice in nature-based solutions. Environ. Sci. Policy 2022, 136, 377–386. [Google Scholar] [CrossRef]
  26. Walker, G. Beyond distribution and proximity: Exploring the multiple spatialities of environmental justice. Antipode 2009, 41, 614–636. [Google Scholar] [CrossRef]
  27. Sultana, F. Critical climate justice. Geogr. J. 2022, 188, 118–124. [Google Scholar] [CrossRef]
  28. Dolšak, N.; Prakash, A. Three faces of climate justice. Annu. Rev. Political Sci. 2022, 25, 283–301. [Google Scholar] [CrossRef]
  29. Chen, C.C.; Wang, Y.R.; Wang, Y.C.; Lin, S.L.; Chen, C.T.; Lu, M.M.; Guo, Y.L.L. Projection of future temperature extremes, related mortality, and adaptation due to climate and population changes in Taiwan. Sci. Total Environ. 2021, 760, 143373. [Google Scholar] [CrossRef]
  30. Liou, C.S.; Chen, J.H.; Terng, C.T.; Wang, F.J.; Fong, C.T.; Rosmond, T.E.; Kuo, H.-C.; Shiao, C.-H.; Cheng, M.-D. The second–generation global forecast system at the central weather bureau in Taiwan. Weather Forecast. 1997, 12, 653–663. [Google Scholar] [CrossRef]
  31. Taheri-Shahraiyni, H.; Sodoudi, S. High-resolution air temperature mapping in urban areas: A review on different modelling techniques. Therm. Sci. 2017, 21 Pt A, 2267–2286. [Google Scholar] [CrossRef]
  32. Hsu, S.; Mavrogianni, A.; Hamilton, I. Comparing spatial interpolation techniques of local urban temperature for heat-related health risk estimation in a subtropical city. Procedia Eng. 2017, 198, 354–365. [Google Scholar] [CrossRef]
  33. Lau, T.K.; Chen, Y.C.; Lin, T.P. Application of local climate zones combined with machine learning to predict the impact of urban structure patterns on thermal environment. Urban Clim. 2023, 52, 101731. [Google Scholar] [CrossRef]
  34. Szymanowski, M.; Kryza, M. Local regression models for spatial interpolation of urban heat island—An example from Wrocław, SW Poland. Theor. Appl. Climatol. 2012, 108, 53–71. [Google Scholar] [CrossRef]
  35. Nistor, M.M.; Rahardjo, H.; Satyanaga, A.; Hao, K.Z.; Xiaosheng, Q.; Sham, A.W.L. Investigation of groundwater table distribution using borehole piezometer data interpolation: Case study of Singapore. Eng. Geol. 2020, 271, 105590. [Google Scholar] [CrossRef]
  36. Memon, R.A.; Leung, D.Y.; Liu, C.H. An investigation of urban heat island intensity (UHII) as an indicator of urban heating. Atmos. Res. 2009, 94, 491–500. [Google Scholar] [CrossRef]
  37. Lin, T.P.; Yang, S.R.; Chen, Y.C.; Matzarakis, A. The potential of a modified physiologically equivalent temperature (mPET) based on local thermal comfort perception in hot and humid regions. Theor. Appl. Climatol. 2019, 135, 873–876. [Google Scholar] [CrossRef]
  38. Cui, Y.; Yan, D.; Hong, T.; Ma, J. Temporal and spatial characteristics of the urban heat island in Beijing and the impact on building design and energy performance. Energy 2017, 130, 286–297. [Google Scholar] [CrossRef]
  39. Asp, K. Fairness, Informativeness and Scrutiny: The Role of News Media in Democracy. Nord. Rev. 2007, 28, 31–49. [Google Scholar]
  40. Hillebrand, C. The role of news media in intelligence oversight. In Secret Intelligence; Routledge: London, UK, 2019; pp. 396–412. [Google Scholar]
  41. Wlezien, C. News and public opinion: Which comes first? J. Politics 2024, 86, 1–17. [Google Scholar] [CrossRef]
  42. Wong, N.H.; Tan, C.L.; Nindyani, A.D.S.; Jusuf, S.K.; Tan, E. Influence of water bodies on outdoor air temperature in hot and humid climate. In Proceedings of the ICSDC 2011: Integrating Sustainability Practices in the Construction Industry, Kansas, MO, USA, 23–25 March 2011; pp. 81–89. [Google Scholar]
  43. Chen, Y.C.; Lin, T.P.; Lin, C.T. A simple approach for the development of urban climatic maps based on the urban characteristics in Tainan, Taiwan. Int. J. Biometeorol. 2017, 61, 1029–1041. [Google Scholar] [CrossRef]
  44. Doan, V.Q.; Kusaka, H.; Nguyen, T.M. Roles of past, present, and future land use and anthropogenic heat release changes on urban heat island effects in Hanoi, Vietnam: Numerical experiments with a regional climate model. Sustain. Cities Soc. 2019, 47, 101479. [Google Scholar] [CrossRef]
  45. Wang, W.; He, B.J. Co-occurrence of urban heat and the COVID-19: Impacts, drivers, methods, and implications for the post-pandemic era. Sustain. Cities Soc. 2023, 90, 104387. [Google Scholar] [CrossRef] [PubMed]
  46. Rahman, M.N.; Rony, M.R.H.; Jannat, F.A.; Chandra Pal, S.; Islam, M.S.; Alam, E.; Islam, A.R.M.T. Impact of urbanization on urban heat island intensity in major districts of Bangladesh using remote sensing and geo-spatial tools. Climate 2022, 10, 3. [Google Scholar] [CrossRef]
  47. Shih, W.Y.; Ahmad, S.; Chen, Y.C.; Lin, T.P.; Mabon, L. Spatial relationship between land development pattern and intra-urban thermal variations in Taipei. Sustain. Cities Soc. 2020, 62, 102415. [Google Scholar] [CrossRef] [PubMed]
  48. Shulman, H.C.; Markowitz, D.M.; Rogers, T. Reading dies in complexity: Online news consumers prefer simple writing. Sci. Adv. 2024, 10, eadn2555. [Google Scholar] [CrossRef]
  49. Levermore, G.; Parkinson, J.; Lee, K.; Laycock, P.; Lindley, S. The increasing trend of the urban heat island intensity. Urban Clim. 2018, 24, 360–368. [Google Scholar] [CrossRef]
  50. Yanovitzky, I. Effects of news coverage on policy attention and actions: A closer look into the media-policy connection. Commun. Res. 2002, 29, 422–451. [Google Scholar] [CrossRef]
  51. Jacobs, S.H.J. Media & Verantwoording over Incidenten: Gevolgen voor Publieke Organisaties. Ph.D. Dissertation, Utrecht University, Utrecht, The Netherlands, 2014. [Google Scholar]
  52. Figenschou, T.U.; Karlsen, R.; Kolltveit, K.; Schillemans, T. Mounting media pressure: Push and pull forces influencing agendas, resource allocation and decision-making in public bureaucracies. Eur. J. Commun. 2019, 34, 377–394. [Google Scholar] [CrossRef]
  53. Mavrodieva, A.V.; Rachman, O.K.; Harahap, V.B.; Shaw, R. Role of social media as a soft power tool in raising public awareness and engagement in addressing climate change. Climate 2019, 7, 122. [Google Scholar] [CrossRef]
  54. Brooker-Gross, S.R. Spatial aspects of newsworthiness. Geogr. Ann. B 1983, 65, 1–9. [Google Scholar] [CrossRef]
  55. Avraham, E. Cities and their news media images. Cities 2000, 17, 363–370. [Google Scholar] [CrossRef]
  56. Epstein, E.J. News from Nowhere; Broadview Press: Peterborough, ON, Canada, 1973. [Google Scholar]
  57. Avraham, E. Media and the Social Construction of Reality: The Coverage of Settlements in Marginal Areas in National Newspapers. Ph.D. Dissertation, Hebrew University of Jerusalem, Jerusalem, Israel, 1998. [Google Scholar]
  58. Joseph, J.P. Local vs. National: How Twitter Reflects News Coverage of Colin Kaepernick Protests. Master’s Thesis, Louisiana State University and Agricultural and Mechanical College, Baton Rouge, LA, USA, August 2018. [Google Scholar]
  59. Hoare, A.G. Making the news: Spatial and non-spatial biases in British parliamentary reports of the Rown-tree-Mackintosh takeover. Geogr. Ann. B 1991, 73, 95–109. [Google Scholar] [CrossRef]
  60. McCann, P. Perceptions of regional inequality and the geography of discontent: Insights from the UK. Reg. Stud. 2020, 54, 256–267. [Google Scholar] [CrossRef]
  61. Rafsky, S.G. Media mecca or news desert? Covering local news in New York City. Columbia Journalism Review, 7 January 2020. [Google Scholar]
  62. Kim, E.; Shepherd, M.E.; Clinton, J.D. The effect of big-city news on rural America during the COVID-19 pandemic. Proc. Natl. Acad. Sci. USA 2020, 117, 22009–22014. [Google Scholar] [CrossRef]
  63. Ohta, R.; Ryu, Y.; Sano, C. Fears related to COVID-19 among rural older people in Japan. Healthcare 2021, 9, 524. [Google Scholar] [CrossRef]
  64. Chen, Y.C.; Hou, K.S.; Liao, Y.J.; Honjo, T.; Cheng, F.Y.; Lin, T.P. The application of a high-density street-level air temperature observation network (HiSAN): Spatial and temporal variations of thermal and wind condition in different climatic condition types. Sustain. Cities Soc. 2024, 109, 105547. [Google Scholar] [CrossRef]
  65. Williams, J. Spatial Justice as Analytic Framework. Ph.D. Dissertation, University of Michigan, Ann Arbor, MI, USA, 2018. [Google Scholar]
  66. Wang, X.; Feng, M.; Qiu, J.; Gu, J.; Zhao, J. From news to forecast: Integrating event analysis in llm-based time series forecasting with reflection. Adv. Neural Inf. Process. Syst. 2024, 37, 58118–58153. [Google Scholar]
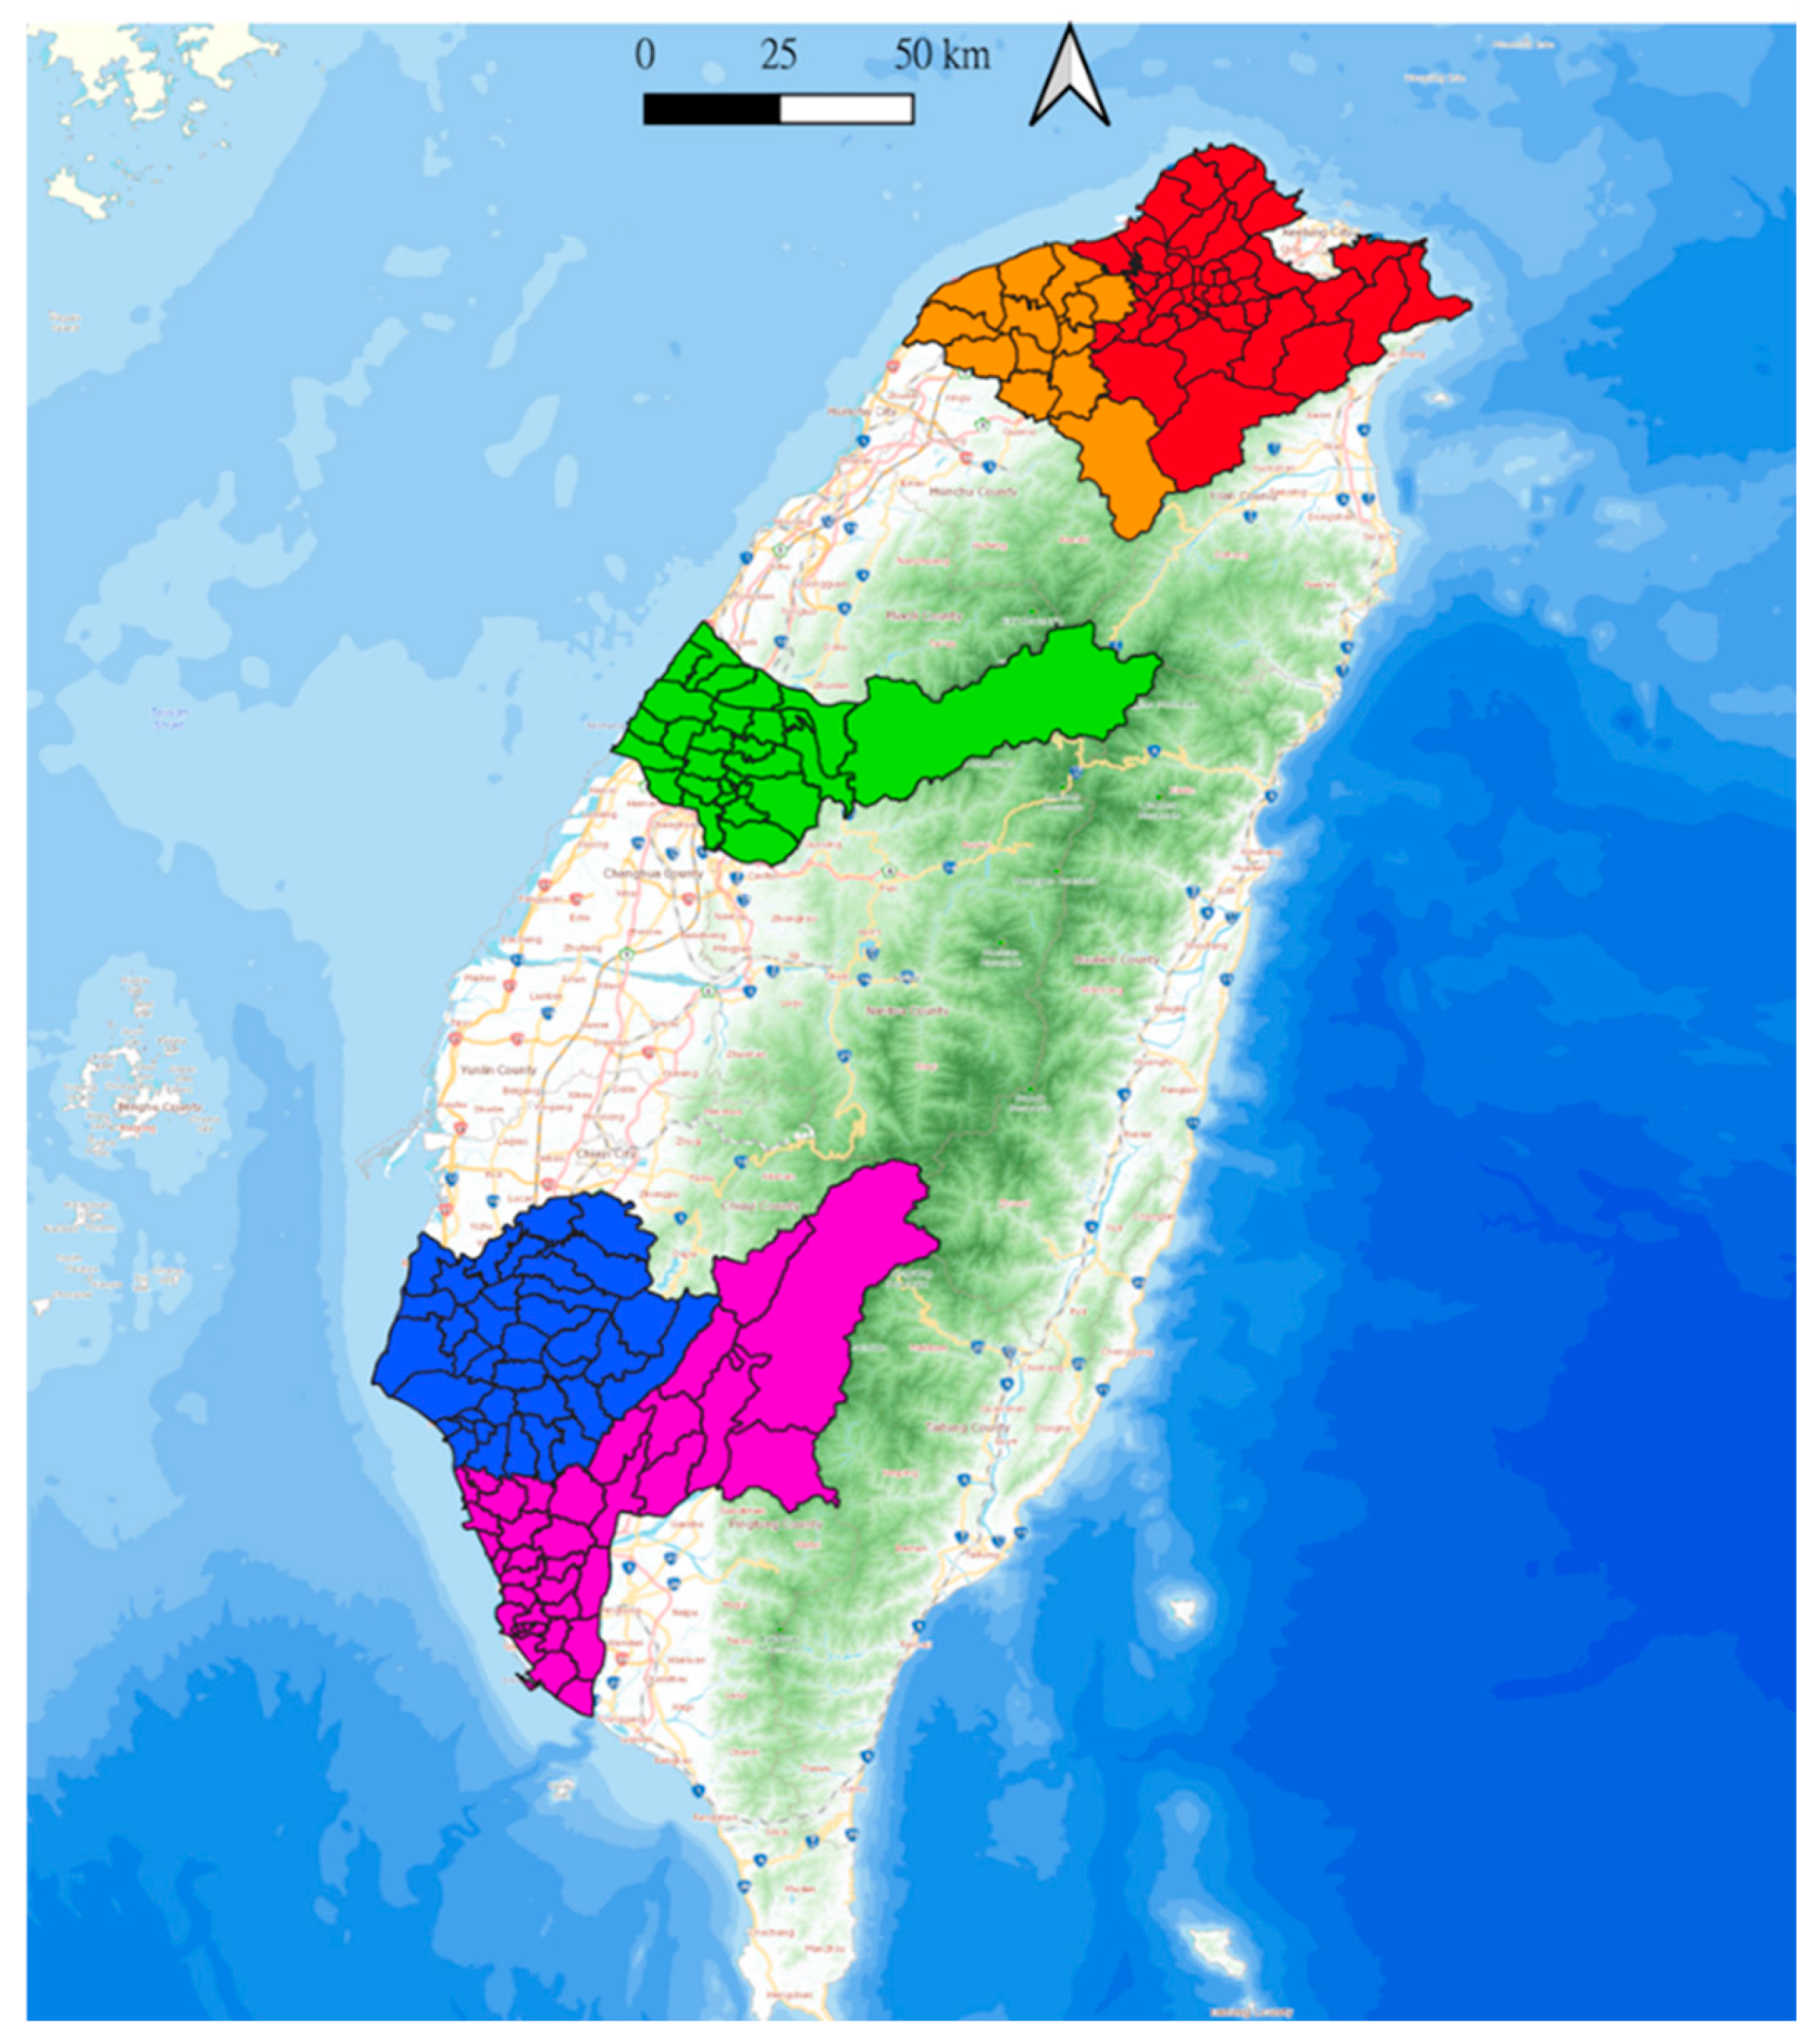
Figure 1. The 5 major cities in Taiwan, including Taipei City (Red), Taoyuan City (Orange), Taichung City (Green), Tainan City (Blue), and Kaohsiung City (Purple).
Urbansci 09 00417 g001
Figure 2. The strongest UHI effect in (a) TP, (b) TY, (c) TC, (d) TN, and (e) KH from 2018 to 2023.
Urbansci 09 00417 g002
Figure 3. Temporal changes in the UHII in five cities from 2018 to 2023.
Urbansci 09 00417 g003
Figure 4. Number of news related to high temperature and UHI in five cities from 2018 to 2023, which presents the spatial and temporal distribution of temperature-related news in the five cities.
Urbansci 09 00417 g004
Figure 5. Number of news related to high temperatures and UHI in different months, presenting the temporal changes in temperature-related news in different months.
Urbansci 09 00417 g005
Figure 6. Spatial distribution of UHII in 2024 and climate news attention of the five major cities in Taiwan in recent years.
Urbansci 09 00417 g006
Figure 7. Correlation analysis of UHI-related news, temperature-related news, and UHII across different cities.
Urbansci 09 00417 g007
Table 1. Measurement points used in this study.
CityNumber of Measurement PointsOther Information
TP47Air temperature resolution: 0.1 K
Update frequency: 1 h
TY17
TC22
TN39
KH37
Disclaimer/Publisher’s Note: The statements, opinions and data contained in all publications are solely those of the individual author(s) and contributor(s) and not of MDPI and/or the editor(s). MDPI and/or the editor(s) disclaim responsibility for any injury to people or property resulting from any ideas, methods, instructions or products referred to in the content.