1. Introduction
The fear of crime literature indicates, although the term suggests that crimes themselves trigger this phenomenon, that a decline in crime rates does not necessarily lead to a corresponding decrease in the fear of crime [
1,
2,
3,
4]. This fact has also led researchers to recognize that this phenomenon encompasses multiple underlying dimensions.
Fear of crime is a complex and multifaceted concept that has been approached from various perspectives by different scholars; therefore, this is one of the reasons why researchers have not yet reached a consensus on the definition of the phenomenon [
2,
5]. In 1987, Ferraro and LaGrange [
6] defined the concept as a negative emotional response to crime and crime-related phenomena. Liska et al. [
7] conceptualized this phenomenon as a social fact, establishing a relationship between fear of crime, specific locations, and local social conditions. By the 1990s, it became evident to researchers that space and the environment play a crucial role not only in criminal behavior [
8] but also in shaping the perception of fear [
9].
According to Rader [
10], fear of crime is one component of a broader phenomenon known as the “threat of victimization.” Specifically, it represents the emotional dimension alongside two other components: perceived risk and the behavioral component. Hale, in his extensive review of the literature on fear of crime [
11], suggested that theoretical attempts to explain this phenomenon can be categorized into four major groups. The first focuses on vulnerability, while another group of studies examines the experience of victimization. A third approach explores the relationship between environmental factors and feelings of uncertainty. Lastly, a smaller body of research emphasizes the role of psychological factors in the development of crime-related anxiety [
11,
12]. It is worth noting that a fundamental distinction exists between fear of crime and the perception of uncertainty. While fear is primarily tied to emotional responses, uncertainty is closely related to risk theories and cognitive processes [
13].
As there is no consensus among researchers not only regarding the definition of the phenomenon but also in its measurement, as the fear of crime itself is not clearly defined, it becomes challenging to establish appropriate measurement and examination methods. Researchers primarily use qualitative measurement methods to assess the phenomenon, most of which are based on surveys [
2] or semi-structured in-depth interviews [
14].
According to Rader [
4], it is evident that the number of crimes is not directly proportional to the feeling of perceived unsafety. Therefore, environmental factors and space may have explanatory power in determining the level of perceived fear. Focusing on environmental factors, it can be observed that various researchers have examined the impact of the environment on the sense of security from multiple perspectives.
At the detailed city scale level, the findings of Baran et al. [
15] suggest that less enclosed environments are perceived as safer than more enclosed ones. The highest level of enclosure was associated with the lowest perceived safety, whereas medium and low levels of enclosure were significantly linked to higher safety. The results of Barton et al. [
16] show that people living in or near areas where violent crime occurs are more fearful of violent crime compared to areas where this type of crime is not prevalent.
Breetzke and Pearson [
17] examined the spatial relationship between crime and perceived safety not only in the context of violent crimes but also more broadly. Their findings indicate that crimes committed within an individual’s own neighborhood significantly influenced their fear of crime, whereas crimes occurring in other neighborhoods had little to no impact on their sense of security. In contrast, Vallejo-Velázquez et al. [
18] conclude that the relationship between daily travel routes and areas perceived as safe or unsafe, locations closer to the respondent’s daily route were significantly more likely to be considered safe, whereas more distant areas were perceived as more fearful by respondents. Experience in this area is relatively limited, which may, in part, be attributed to the lack of adequate data on fear of crime and its environmental contexts [
19].
This disparity or difference between perceived and actual unsafety is known as the crime perception gap [
20]. The spatial crime perception gap (SCPG) adds the spatial dimension to this phenomenon. The term “accuracy or inaccuracy of crime perception” indicates a mismatch between what is perceived and the reality defined by objective measurements (e.g., recorded crime). As perception cannot be “right” or “wrong”, the concept of accuracy only relates it to the actual crime prevalence. An inaccurate perception of high crime may have repercussions on people’s lifestyle [
21], health due to anxiety [
22], social behavior, and the spatial and economic dynamics. It may also restrict or alter people’s daily activities to avoid perceived high crime areas, which could lead to a reorganization of the spatial activities. However, there is also the inaccurate perception of low crime in which people are not aware of the risk of victimization, which may reduce precautionary measures, increasing vulnerability to victimization.
In recent years, there has been a noticeable shift in research focus from macro-level analyses to micro-level investigations [
23,
24]. However, data collection methods remain inconsistent. Some researchers utilize open-ended surveys and geocode the responses [
23], while others employ mobile applications to detect locations perceived as fearful [
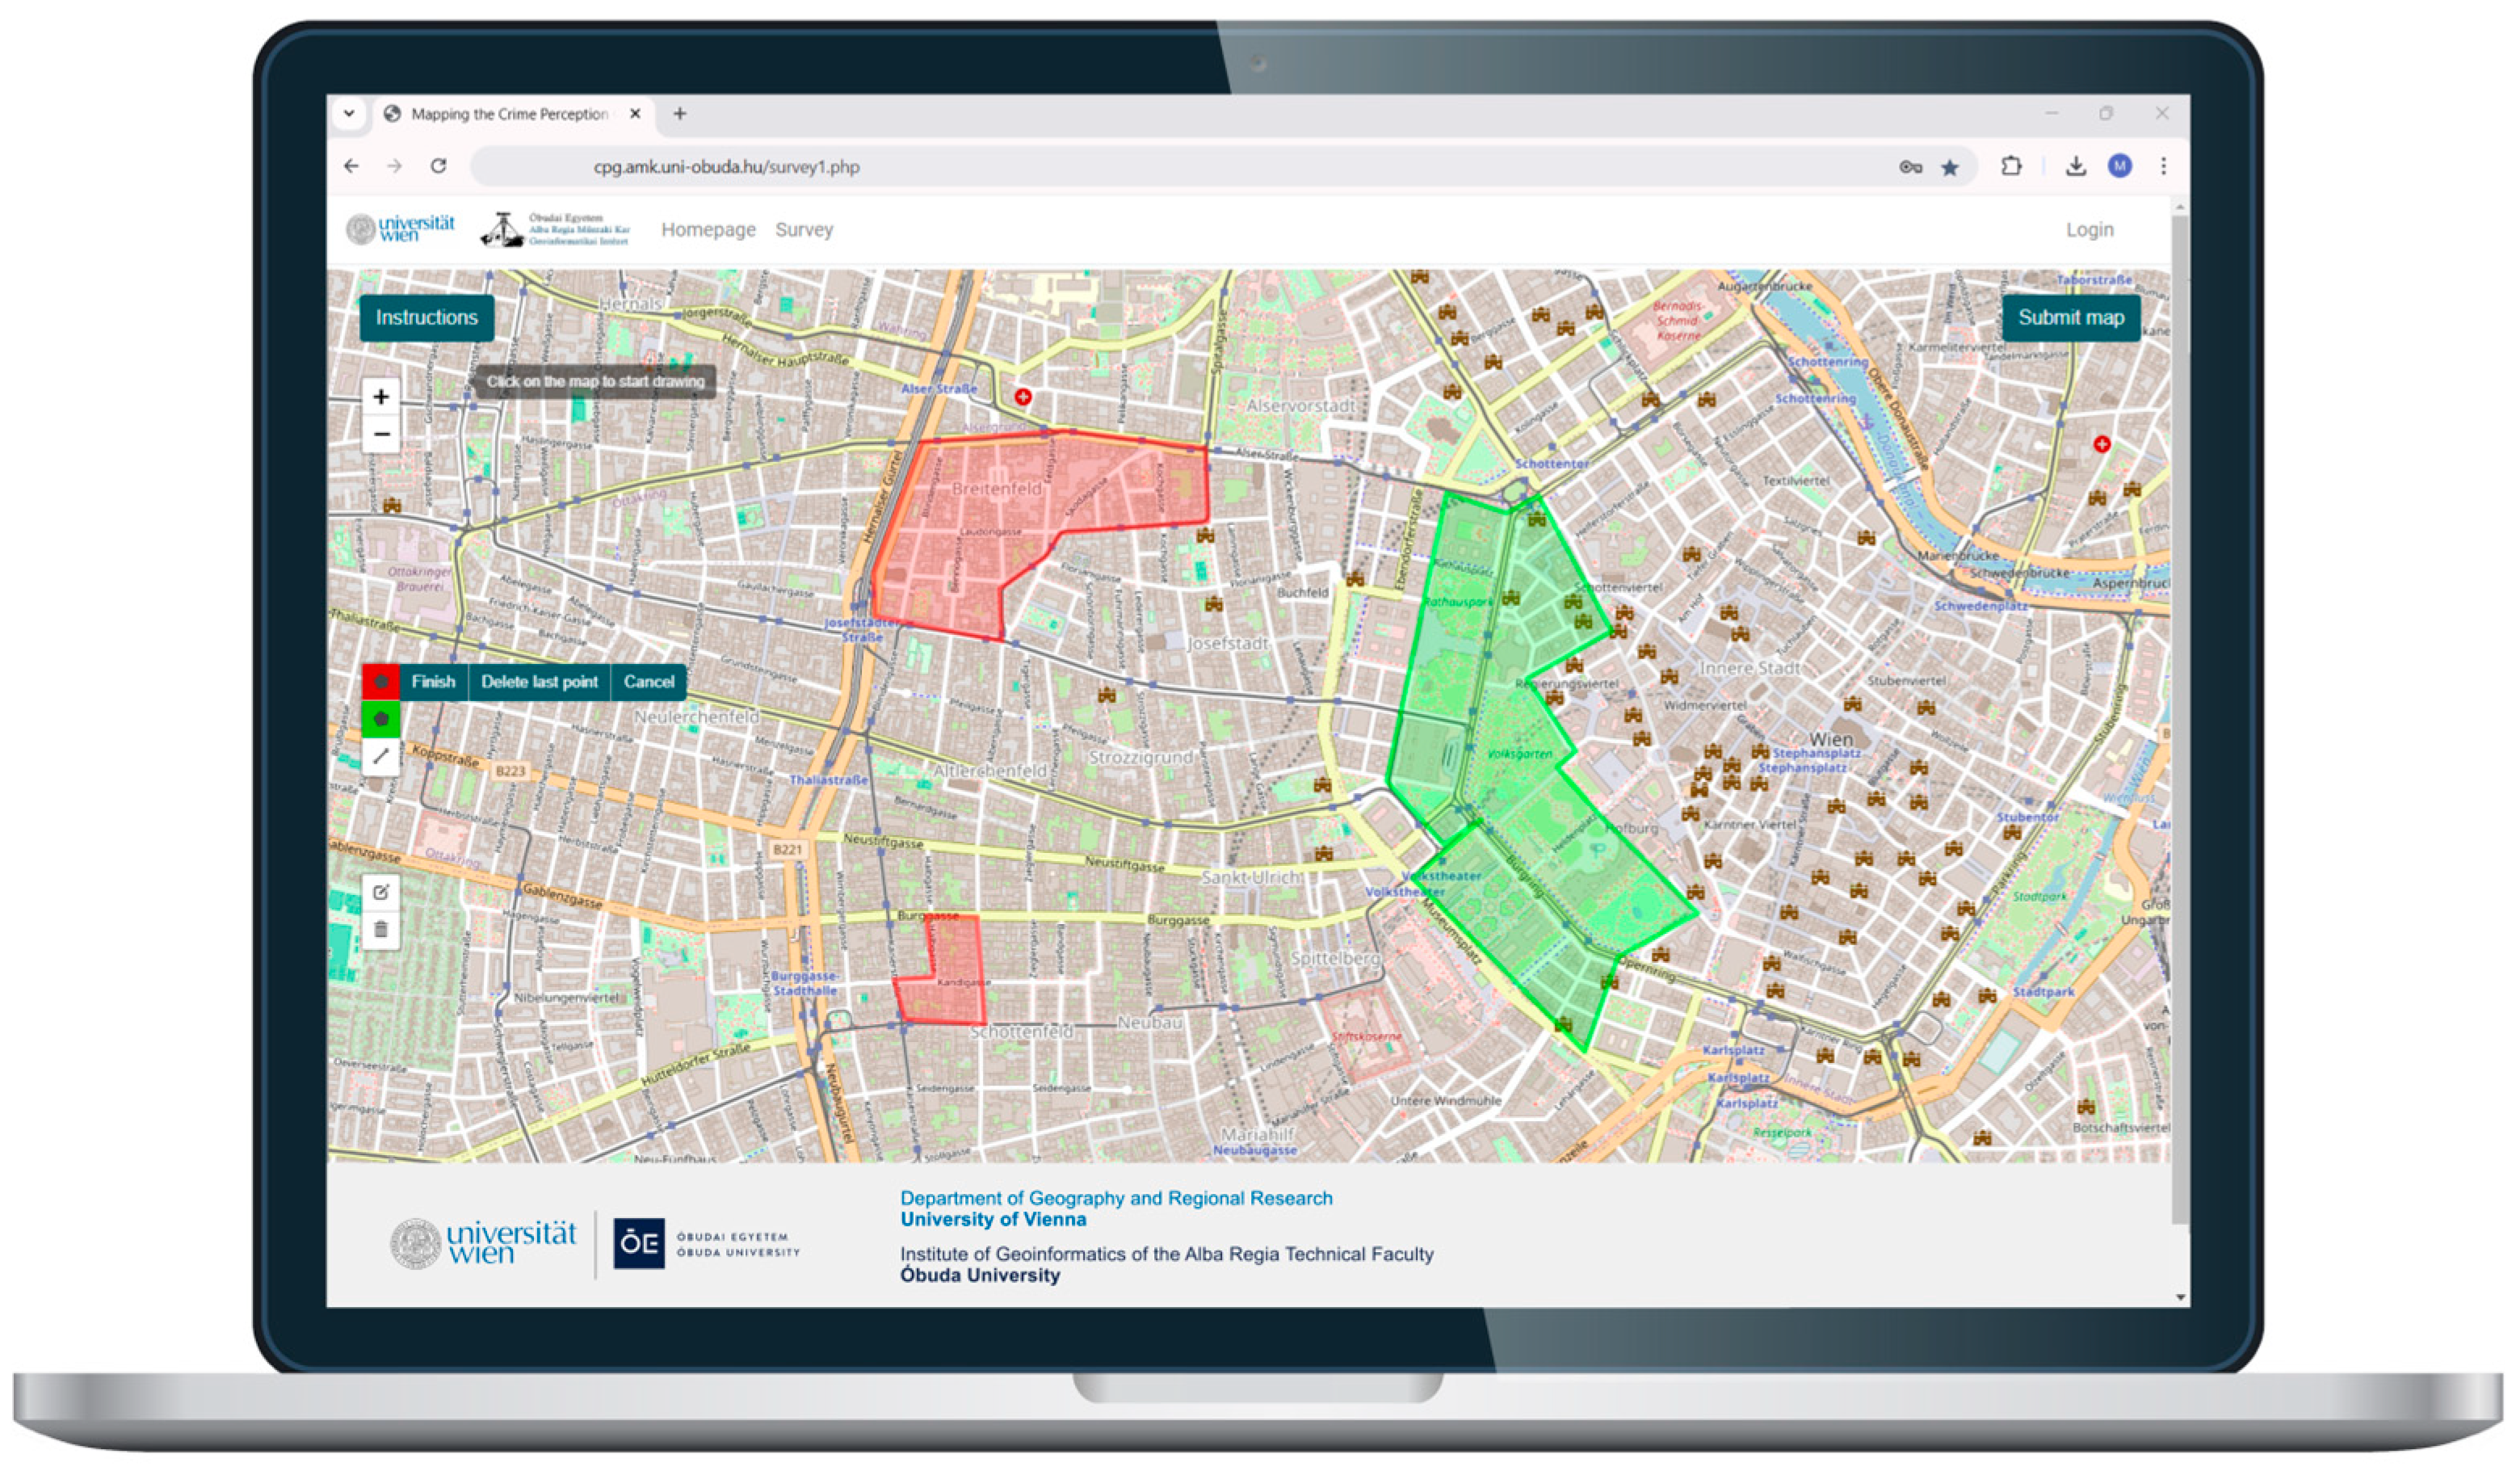
25]. Additionally, several studies adopt the sketch mapping method, where respondents mark the location themselves and in some of these studies, the responses are compared with crime statistics [
26,
27,
28,
29,
30,
31]. Even though scholars have discussed the crime perception gap phenomenon, it has not been spatially statistically delineated, compared across more than one study area, or examined in relation to people’s activity spaces.
When interpreting the obtained results, researchers consider sociodemographic factors (e.g., age, gender) and environmental characteristics [
23,
24] as explanatory variables. However, the role of sociodemographic variables as explanatory factors remains contested in the literature, often yielding contradictory findings. For instance, Gargiulo et al. [
32] emphasize the significance of gender in spatial fear perception, whereas other studies [
27] have found no significant correlation. In a comparative study of multiple cities, Jakobi and Pődör [
27] identified three coexisting patterns in the relationship between crime and perceived safety: parallel, inverse, and independent variations.
To adequately address whether certain areas are perceived in alignment with crime statistics, in opposition to them, or in an insignificant manner, a clear spatial delineation or mapping of these areas is essential. Without such a delineation, it is challenging to provide a well-founded response to this question. To the best of our knowledge, and based on the reviewed literature, no previous study has explicitly examined this issue.
Research Scope
The main objective of this study is to examine crime perception from a spatial perspective and to compare the collective truth of this perception with the actual spatial patterns of crime. Our objective is divided into two research questions (RQs):
RQ1: What are the spatial patterns of crime perception (collective truth) in Vienna and Budapest?
RQ2: To what extent do the spatial patterns of perceived crime correspond to the actual spatial distribution of crime in both cities?
Furthermore, we want to test the following three hypotheses.
Hypothesis 1. Violent crime or visible crime has a greater influence on people’s crime perception in space than other crime types.
Previous studies have examined and confirmed a positive association between the individual level of fear of crime and violent crime [
16,
33]. Related concepts to fear of crime, such as concern about crime and crime perception, may also be linked to certain crime types (such as violent crime) more or less than others. With this hypothesis, we aim to test whether violent crime has a greater influence or is more associated with people’s spatial crime perception as compared to other crime types. Furthermore, we examine whether this also applies to “visible crimes”. Although visible crimes are not an official crime type aggregation, visible crimes refer here to offenses that are more likely to be witnessed (also seen or heard) by others (e.g., they typically occur in public places). Thus, people will have higher awareness of such crime events, and the locations where they occurred, which may affect their spatial perception. An example of a visible crime is street robbery. Crime types that were not classified as “visible” are those that occur by default in private locations (e.g., residential burglary) or do not always occur in public places (e.g., homicide). This hypothesis will be tested by delineating the gaps between perception of safety and (a) violent crime, (b) visible crime, (c) property crime, and (d) all crime. To accept Hypothesis 1, the gap should be smaller with violent crime (or visible crime) as compared to property crime or all crime.
Hypothesis 2. Spatial diffusion effect: people mislabel areas as unsafe when they are in close proximity to unsafe areas.
Building on previous findings from a study conducted in Budapest by Vallejo-Velázquez et al. [
18], which showed that crime events in one area often influence perceptions in adjacent areas, indicating a diffusion effect on people’s perceptions. In geography, the diffusion effect refers to the spread of a phenomenon either through expansion or relocation across space and time [
34]. In this study, we refer to expansion diffusion, where the phenomenon remains present in the original location while simultaneously extending to neighboring areas.
We aim to examine this phenomenon again in Budapest as well as explore its occurrence in Vienna. To accept Hypothesis 2, perceived unsafe areas that do not overlap with crime hotspots (spatial gap areas) should be closer to hotspots than to areas with average or low crime rates.
Hypothesis 3. Spatial endowment effect: perception of unsafety in space is heightened in areas outside one’s activity space.
Vallejo-Velázquez et al. [
18] found that the likelihood of perceiving an area as unsafe increases significantly while moving away from the people’s daily route. This finding connects to the endowment effect that is mostly popular in the field of economics. The endowment effect describes people’s tendency to attach additional value to things they own simply because they belong to them, and it seems to be linked with the loss-aversion explanation [
35]. In the context of crime perception, this effect can be understood as a tendency to view one’s own neighborhood as safe, under the assumption that familiar or personally significant spaces offer better conditions than surrounding areas. This perceptual bias has been linked to feelings of attachment to one’s community or neighborhood [
36]. We argue that the effect may also extend to broader geographical entities (e.g., my neighborhood or my town), where people attach greater value across multiple dimensions, including perceived safety. Consequently, individuals may overlook crime prevalence in their own activity space, while perceiving greater risk in areas farther away.
To accept Hypothesis 3, perceived safe areas should be closer to the people’s activity space as compared to the perceived unsafe areas, even when their activity space overlaps with actual crime hotspots.
3. Methodology
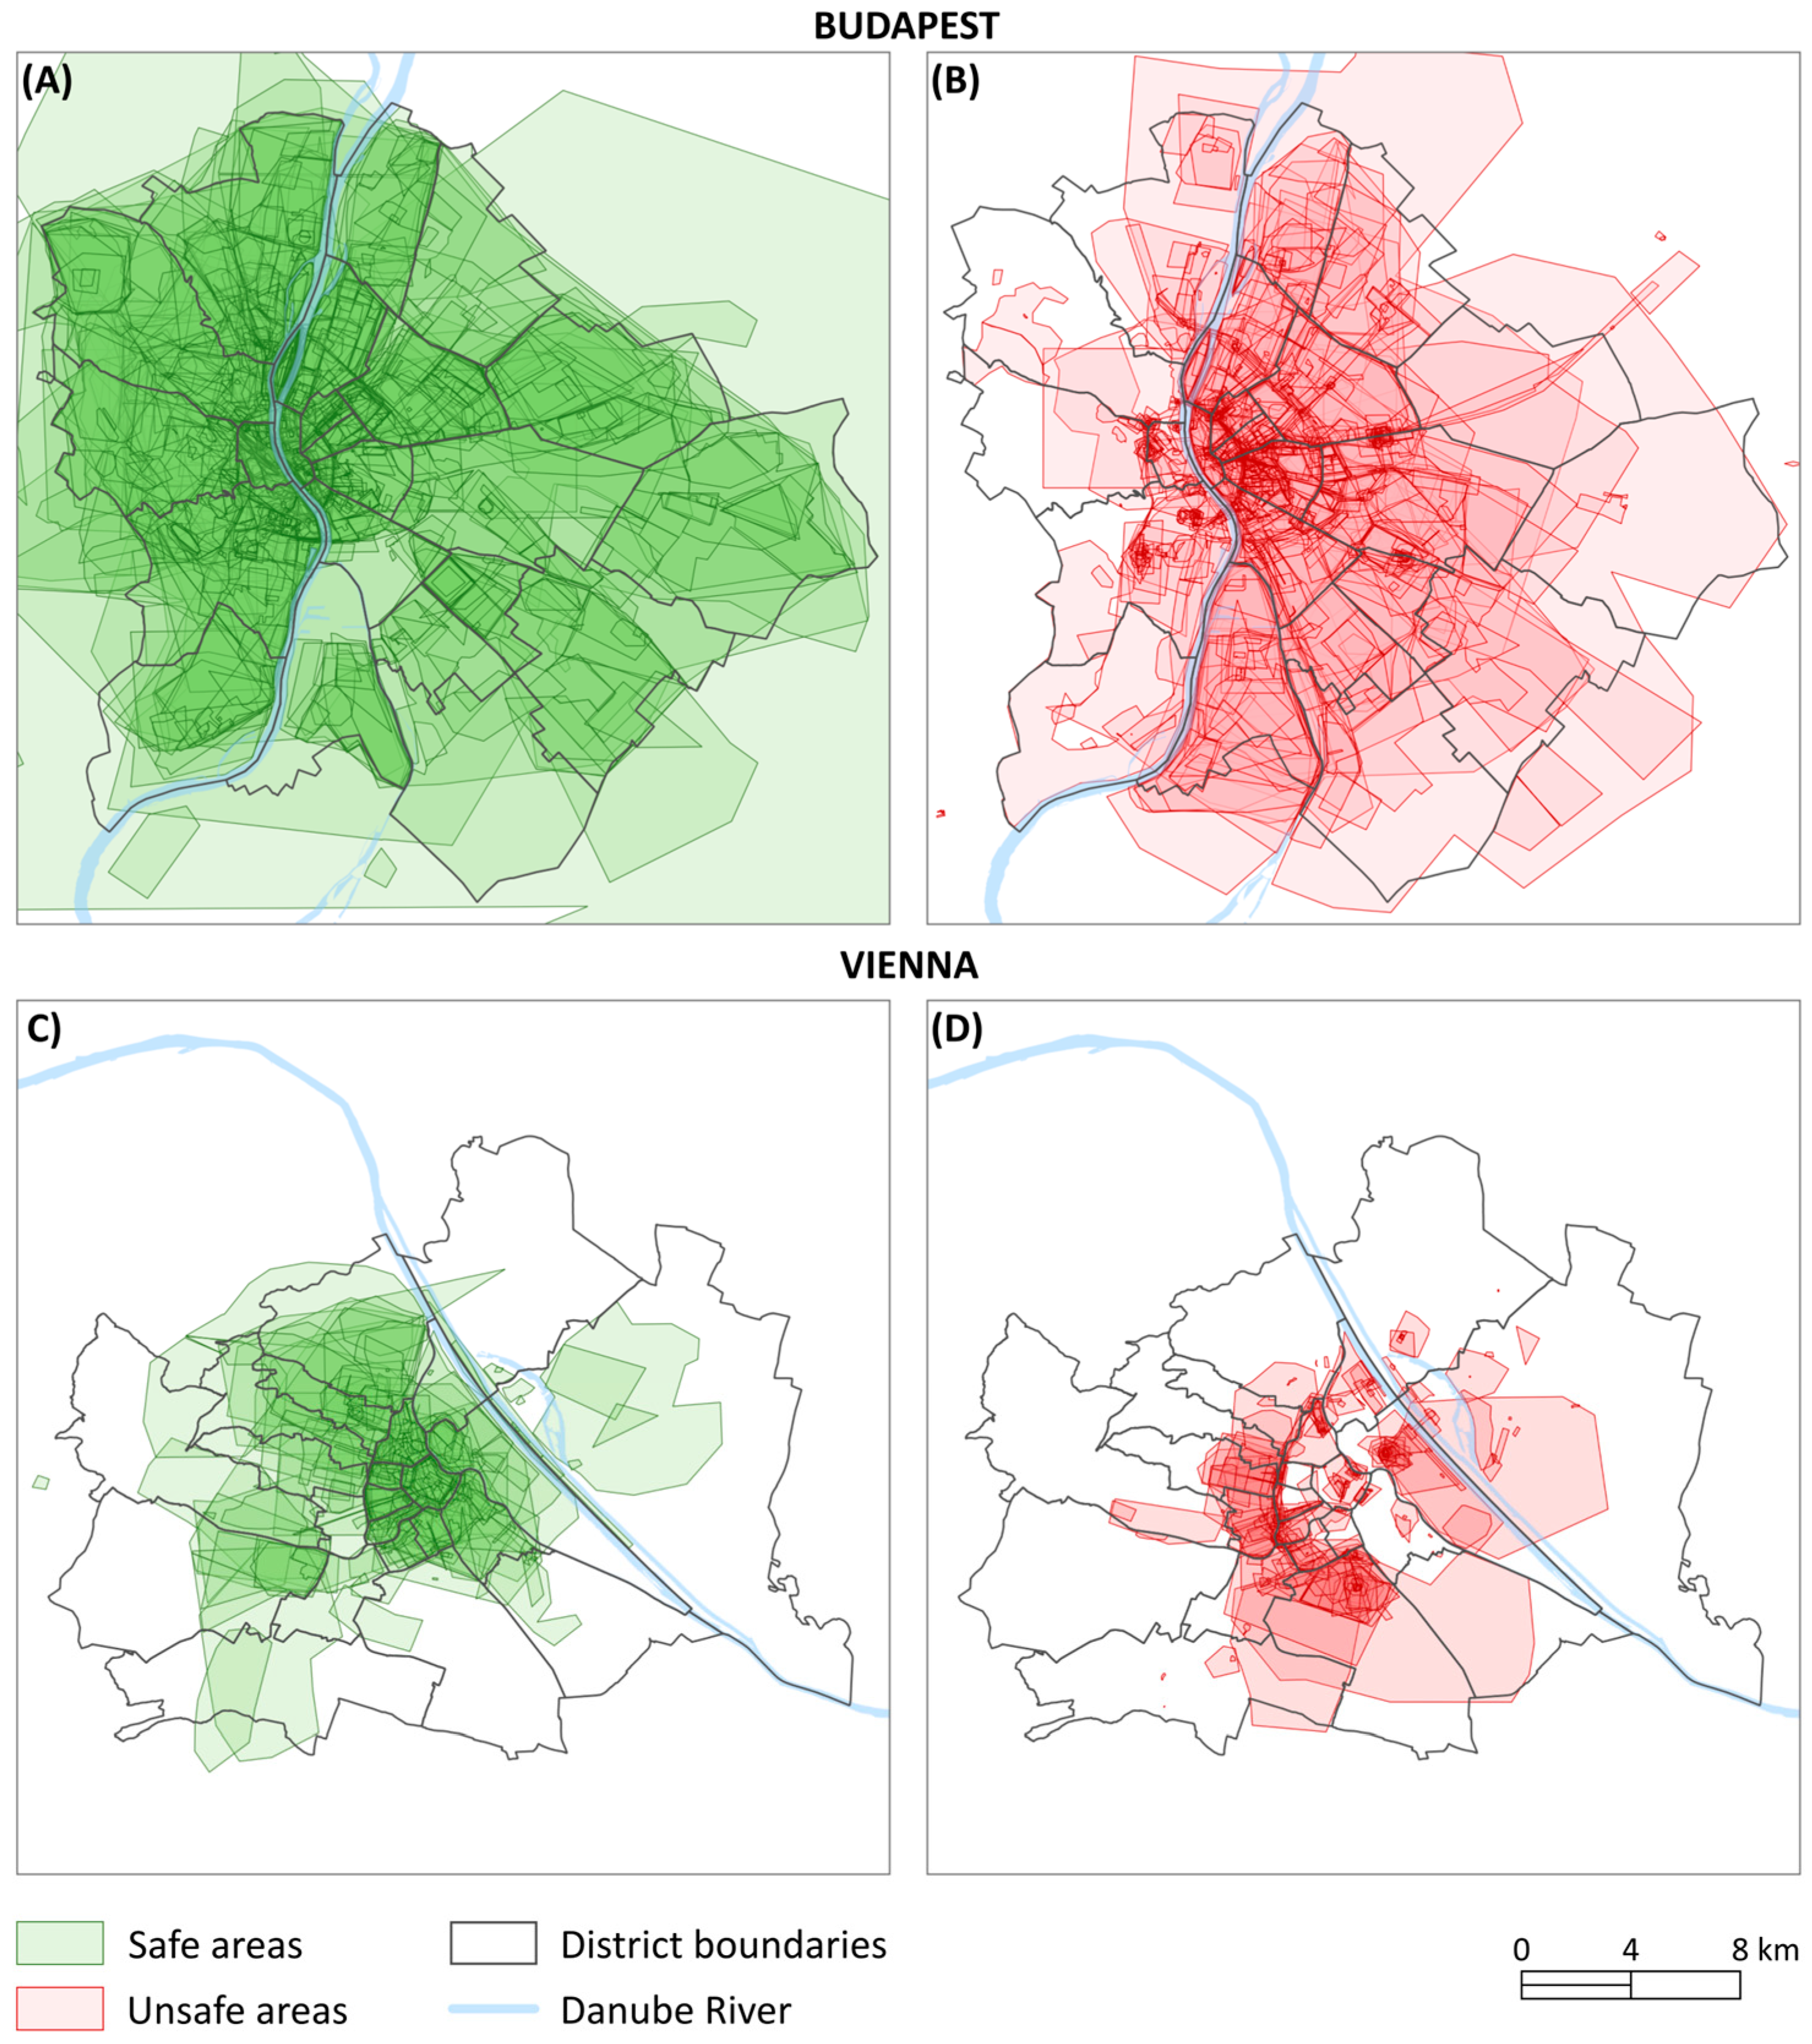
In this section, we describe the methodology employed to address the research questions and test the hypotheses. First, the sketched polygon responses were geoprocessed (
Section 3.1) to extract locations where many participants shared a similar perception of safety or unsafety, thus allowing us to extract the collective truth of spatial crime perception. Next, we conducted spatial statistical analysis of the crime data to extract areas with a statistically significant concentration of crimes, as well as areas with significantly low or insignificant numbers of crimes (
Section 3.2). To answer RQ1, RQ2, and test Hypothesis 1, these spatial crime clusters, disaggregated by crime types, were used as a reference to compare perceived safe and unsafe areas with actual crime patterns (
Section 3.3). Subsequently, distance-based analyses were performed to examine the spatial diffusion effect—Hypothesis 2 (
Section 3.4) and the spatial endowment effect—Hypothesis 3 (
Section 3.5). While this section describes the methodological process, the results are presented and discussed in
Section 4.
3.1. Geoprocessing of Crime Perception
To analyze the sketched polygons, hexagonal cell grids were created to spatially segment each city. Each hexagonal cell covered an area of approximately 0.15 km
2, comparable to the size of a neighborhood. Although there are no specific recommendations for the size of the spatial unit of analysis, previous similar studies have applied a range of grid sizes and geometries, from block level, neighborhood level, or zip code level [
31,
38,
39,
40,
41]. Given that crime concentration at micro-places is relatively stable and the researchers outline the relevance of focusing on small areas [
43], we opted for a small analytical size similar to a neighborhood scale.
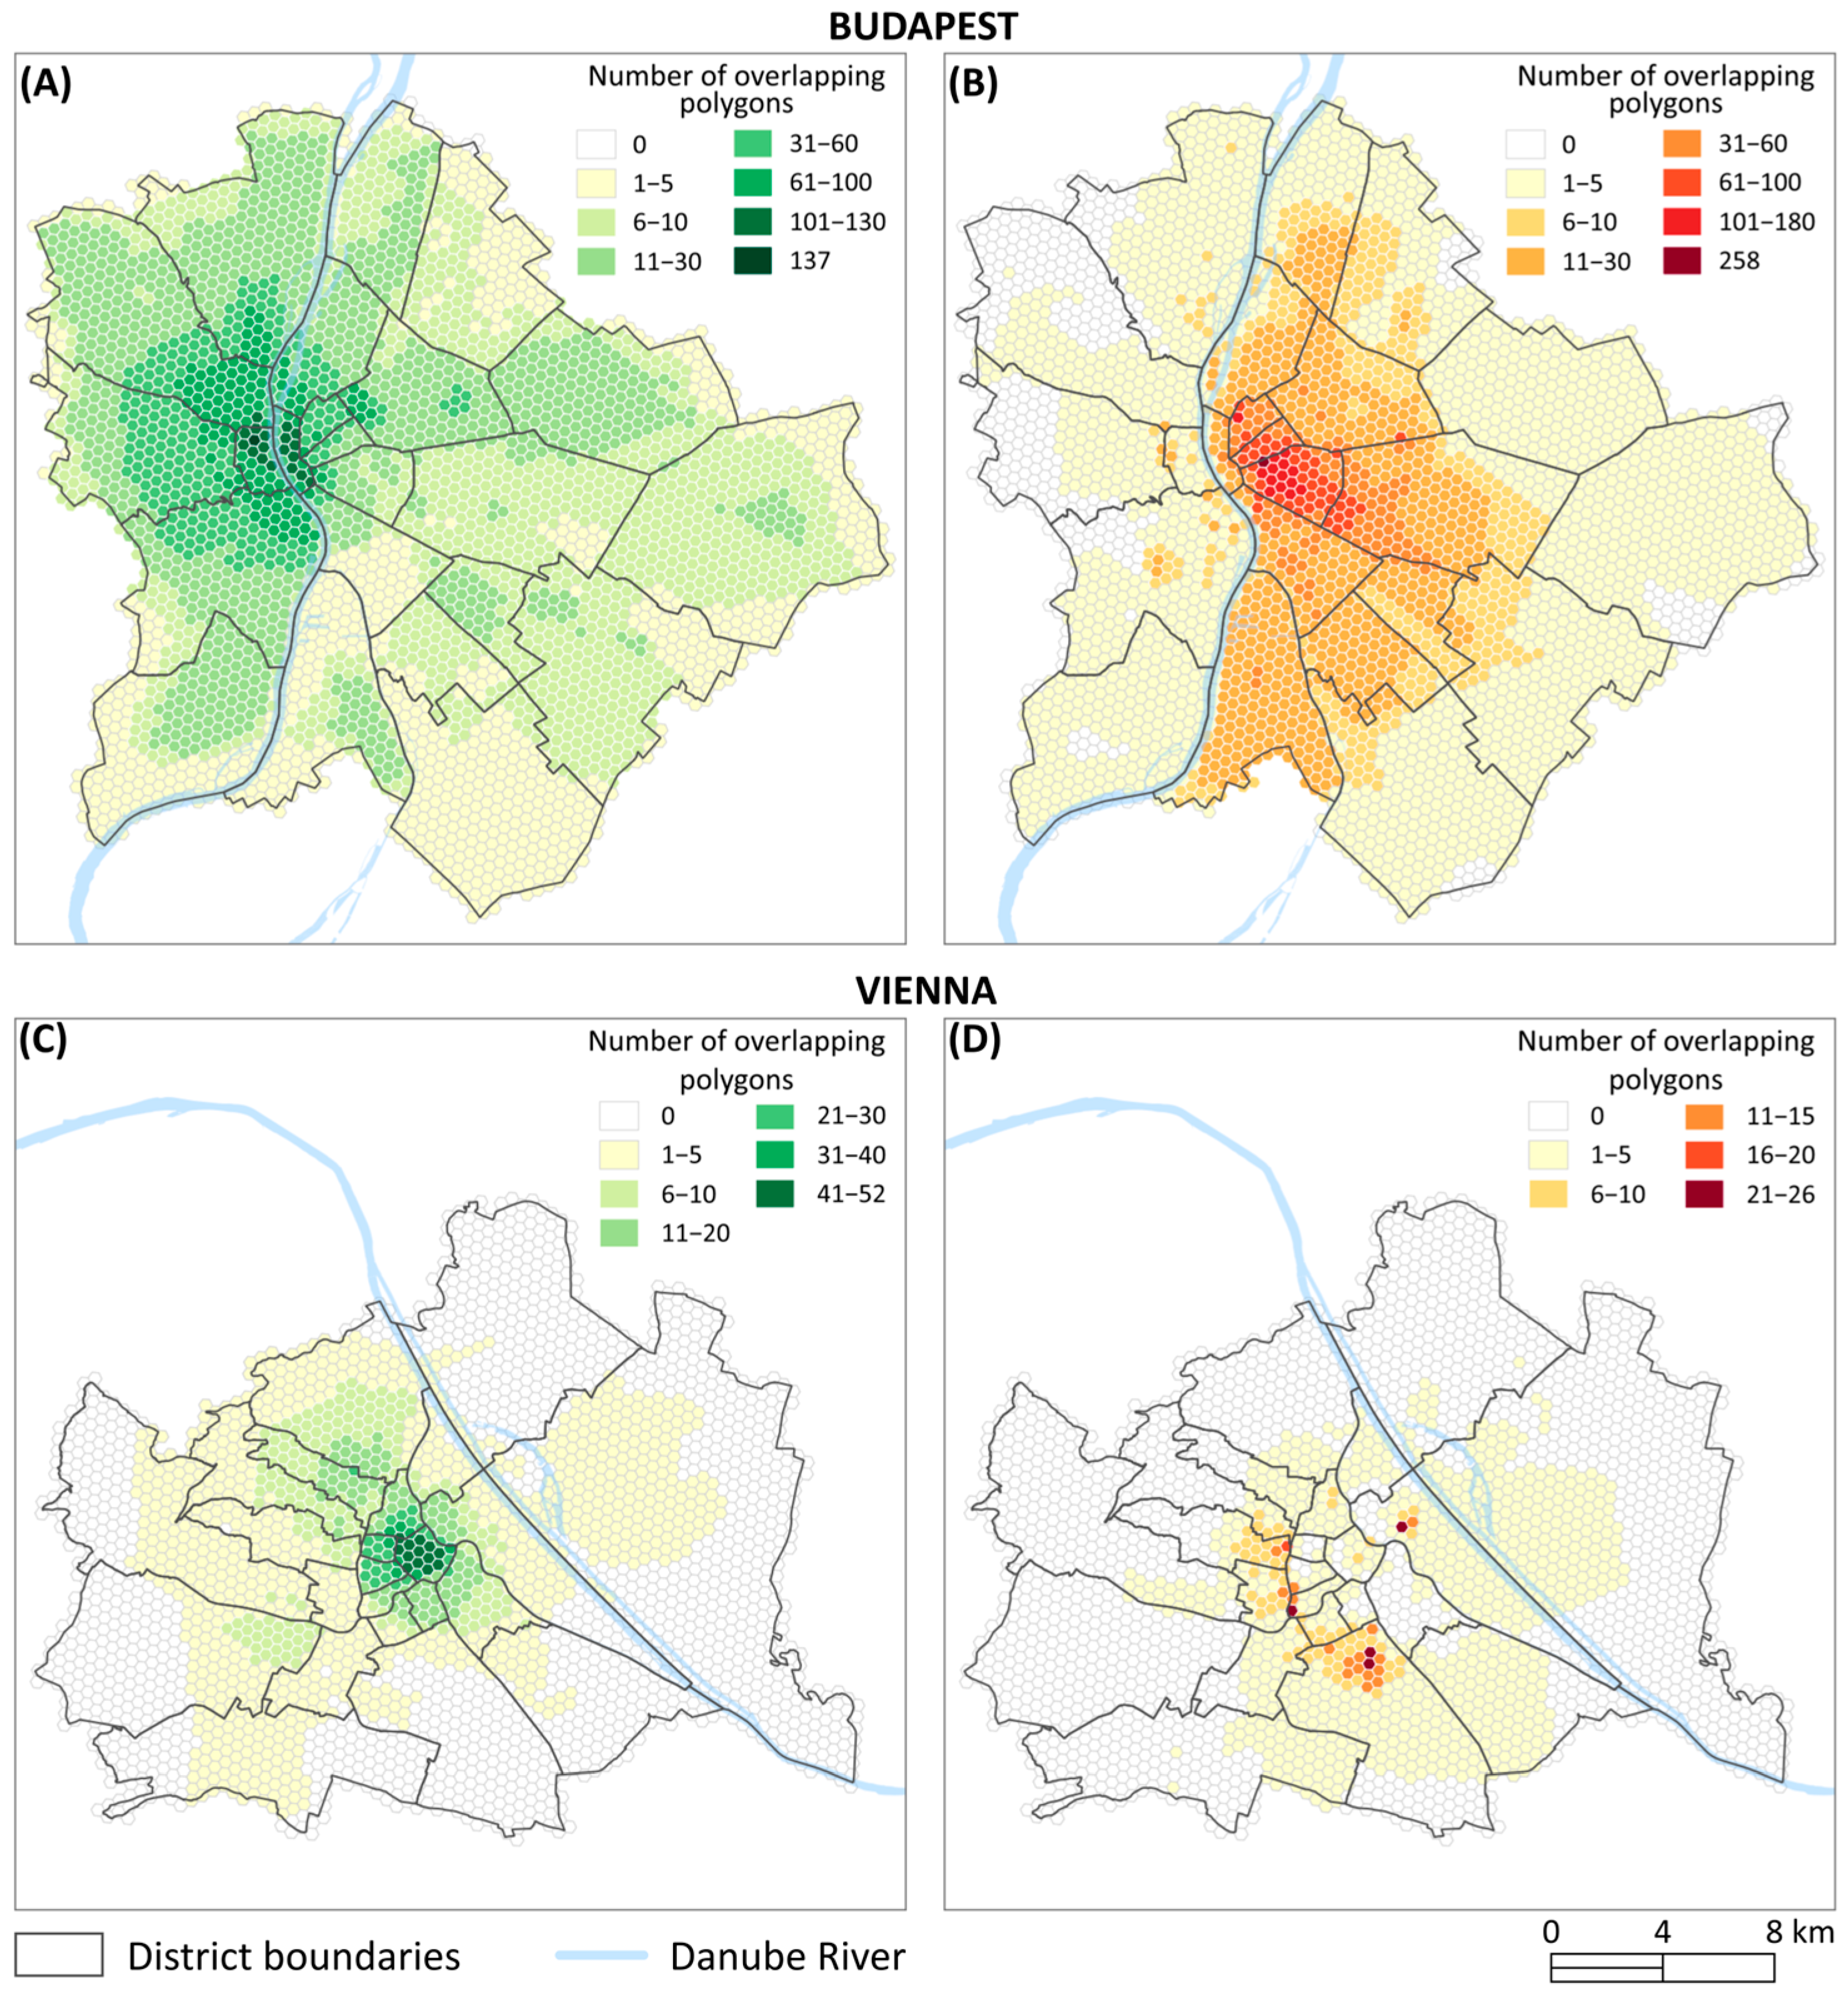
The centroids of the hexagonal cells were calculated to serve as reference points for the analysis. For sketched polygons larger than a single hexagonal cell, the number of polygons intersecting each cell’s centroid was counted to determine how many times each cell was marked as safe or unsafe. For smaller polygons, the centroid of each polygon was identified, and the count of safety markings from these smaller polygons was added to the corresponding hexagonal cell containing the polygon’s centroid (
Figure 3).
This geoprocessing step, which aggregated polygons into grid cells, revealed spatial patterns of perceived safe and unsafe areas. To identify statistically significant perception, a binomial test was applied using the scipy.stats library in Python 3.12.7. This statistical test assessed whether the number of safe or unsafe markings in a given hexagonal cell significantly deviated from the expected probability of 0.5 under the null hypothesis. The null hypothesis states that each hexagonal cell had an equal likelihood (p = 0.5) of being perceived as safe. The test inputs included the number of times a cell was marked as safe and the total number of markings (safe and unsafe) for that cell. A two-tailed test was performed to calculate the p-value for each hexagon. Cells with p < 0.05 were classified as statistically significant (perceived as either safe or unsafe), whereas cells with p ≥ 0.05 were considered not significant. Because the binomial test inherently accounts for sample size, the identification of significant perception remains valid even when the observations per cell vary.
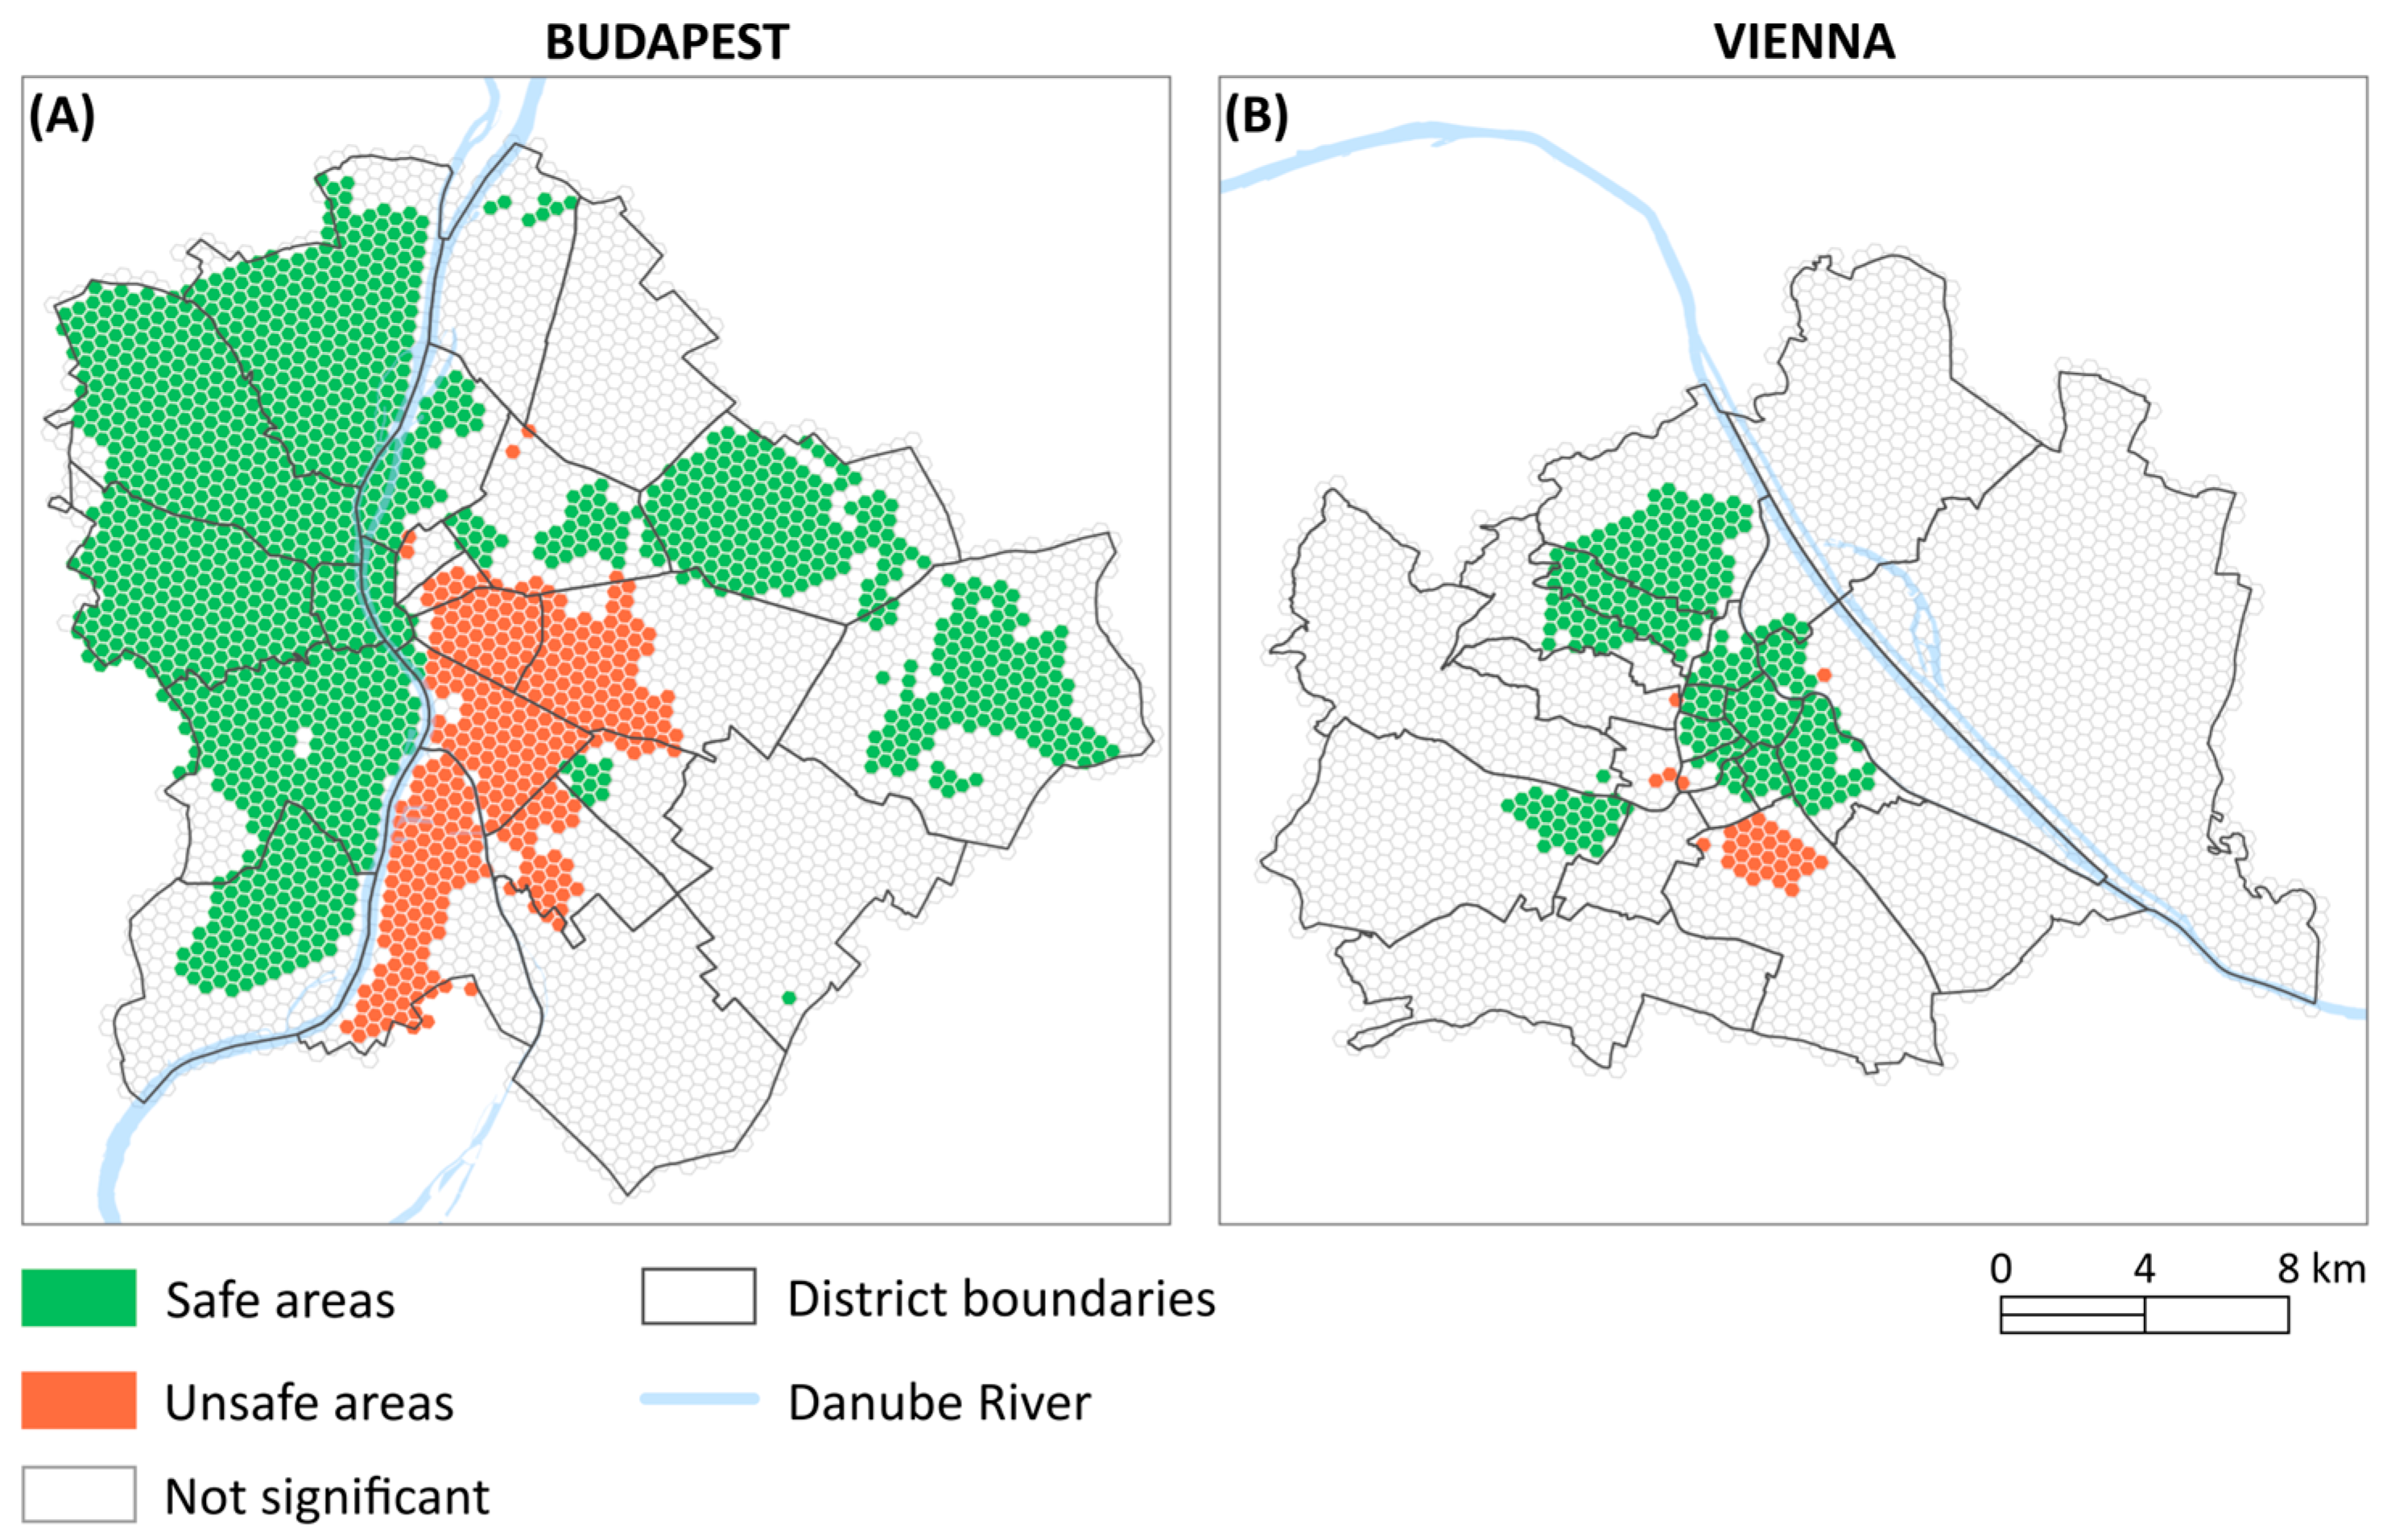
Based on the binomial test results, the hexagonal cells were classified into three categories. Statistically significant cells were further divided into perceived safe (more safe than unsafe markings) and perceived unsafe (more unsafe than safe markings). Cells that did not meet the threshold for statistical significance were classified as not significant.
In Budapest, out of a total of 3631 hexagonal cells, 1357 cells (37.4%) were classified as perceived safe and 356 (9.8%) as perceived unsafe. The remaining 1918 cells (52.8%) did not meet the statistical significance threshold of the binomial test and were classified as not significant. This suggests that in many areas, participants expressed contradictory perceptions of safety. To examine the collective truth, we focused on statistically significant cells, those where a large number of participants reported the same perception of safety or unsafety. The spatial distribution of perceived unsafe areas shows a concentration on the east side of the Danube River (Pest side), while the majority of the perceived safe areas are located on the west side (Buda side). This pattern reflects distinct perceptions of safety in the city’s two regions.
In Vienna, out of 2906 hexagonal cells, 277 cells (9.5%) were statistically classified as perceived safe, and 33 (1.2%) as perceived unsafe. The majority of cells, 2596 (89.3%), did not reach statistical significance in the binomial test and were therefore classified as non-significant. Perceived unsafe areas are primarily clustered in the northern part of the 10th district, whereas safe areas are concentrated in the city center and the central-northern region.
Figure 4 illustrates the spatial distribution of statistically significant perceived safe and unsafe areas in both cities.
3.2. Detection of Spatial Groupings of Crime
To delineate the spatial crime perception gap (RQ1 and RQ2) and to test Hypothesis 1 (Section Research Scope), we used the crime data (across the four crime type aggregations) to detect spatial crime patterns in Vienna and Budapest. These patterns were then compared with the significantly perceived safe and unsafe areas (derived in
Section 3.1) to delineate the gap (in
Section 3.3).
Spatial clusters of crime were defined using the Local Indicator of Spatial Association (LISA) measured with Local Moran’s I, a commonly used metric for spatial autocorrelation. This method was chosen because it allows the identification of four types of local spatial association: two clusters and two outliers. Clusters are formed when the attribute values of a feature are significantly similar to those of its neighbors (positive autocorrelation), either consistently high (High-High) or low (Low-Low) relative to the mean. In contrast, outliers occur when a feature’s value significantly differs from its neighbors (negative autocorrelation), categorized as High-Low or Low-High patterns.
The Local Moran’s I analysis was performed using the hexagonal grid cells, with the counts of crime events within each cell as input. The analysis was repeated for both cities, across the four crime categories (violent crimes, property crimes, visible crimes and all crimes), using three significance thresholds (
p = 0.05,
p = 0.01 and
p = 0.001), and both 1st and 2nd order spatial contiguity. This resulted in 24 LISA maps per city.
Figure 5 provides an example of the resulting hotspot maps.
3.3. Delineation of the Spatial Crime Perception Gap
To identify the spatial crime perception gap, perception data were represented by statistically significant cells classified as perceived safe or perceived unsafe based on the binomial test results. In contrast, the reference data was derived from the LISA maps, where High-High and High-Low clusters were considered crime hotspots and thus classified as unsafe, while Low-Low, Low-High and non-significant areas were classified as safe areas.
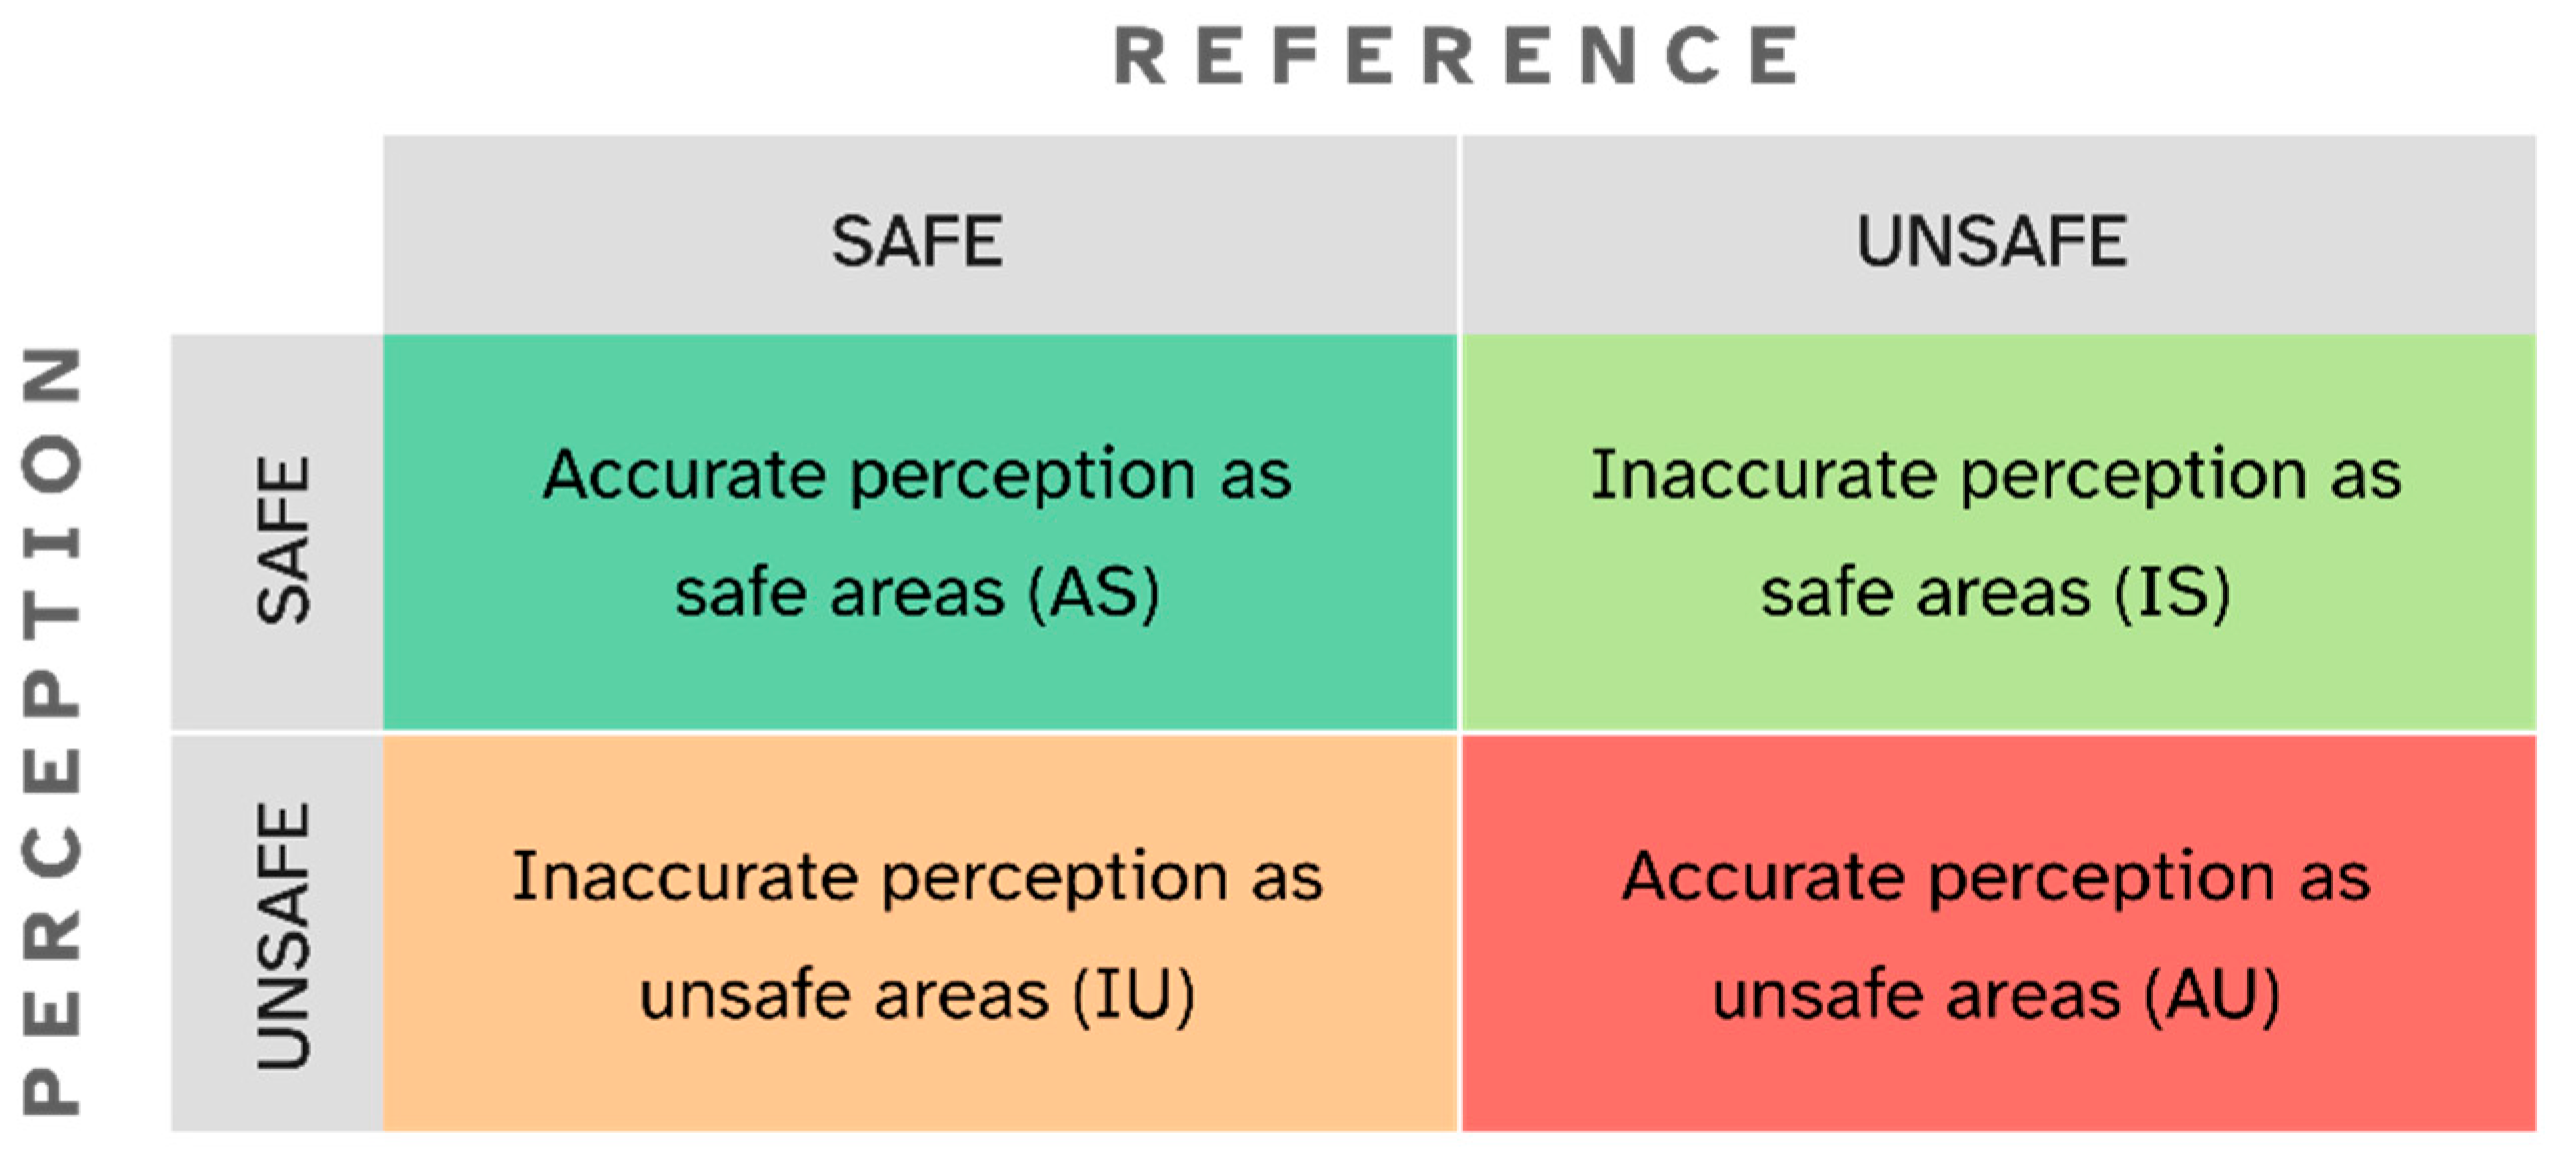
Using map algebra, the perception maps and the LISA maps were overlaid and analyzed. Each hexagonal cell was then classified into one of the categories of crime perception accuracy (
Figure 6), enabling the assessment of the alignment or mismatch between perceived safety and crime patterns. An alignment occurs when High-High and High-Low cells are perceived as unsafe (AU) and when Low-Low, Low-High, and not significant cells are perceived as safe (AS). Respectively, a mismatch (i.e., the SCPG) occurs when High-High and High-Low cells are perceived as safe (IS) and when Low-Low, Low-High, and not significant cells are perceived as unsafe (IU).
3.4. Distance Based Analysis of Gap Areas
To test Hypothesis 2, we calculated the distances from IU cells (inaccurately perceived as unsafe) to crime hotspots (classified as High-High or High-Low). Distance was measured as the shortest distance between the boundaries of the hexagonal cells. This approach enabled us to determine whether the cells overlapped, were adjacent, or were not contiguous, thereby providing insights into the spatial relationship between perception inaccuracies and crime clusters. The analysis focused on IU cells, as their frequency was considerably higher than that of IS cells (results by crime perception type, and frequency are reported in
Section 4.1).
3.5. Distance Based Analysis of the Daily Routes
In this part, we quantified the distance between the participants’ activity routes and both the perceived safe/unsafe and the spatial crime groupings. For this analysis, Euclidean distances were calculated to measure the spatial relationships. Specifically, the shortest distance between the perceived safe and unsafe areas and the participant’s daily activity route was determined by identifying the nearest point between the sketched line as their daily route and the respective polygons, safe or unsafe areas, drawn by the same participant. A similar approach was applied using the grid cells of the spatial crime groupings (i.e., hotspots being the High-High and High-Low groupings and coldspots being the Low-Low and Low-High groupings).
4. Results
4.1. The Spatial Crime Perception Gap (SCPG)
To analyze the results of the crime perception gap, first, a quantitative evaluation was conducted using standard metrics for classification tasks. In this context, classification metrics (e.g., accuracy) were applied to measure the level of agreement between perceived and actual crime patterns.
Table 2 summarizes the results of these metrics, and
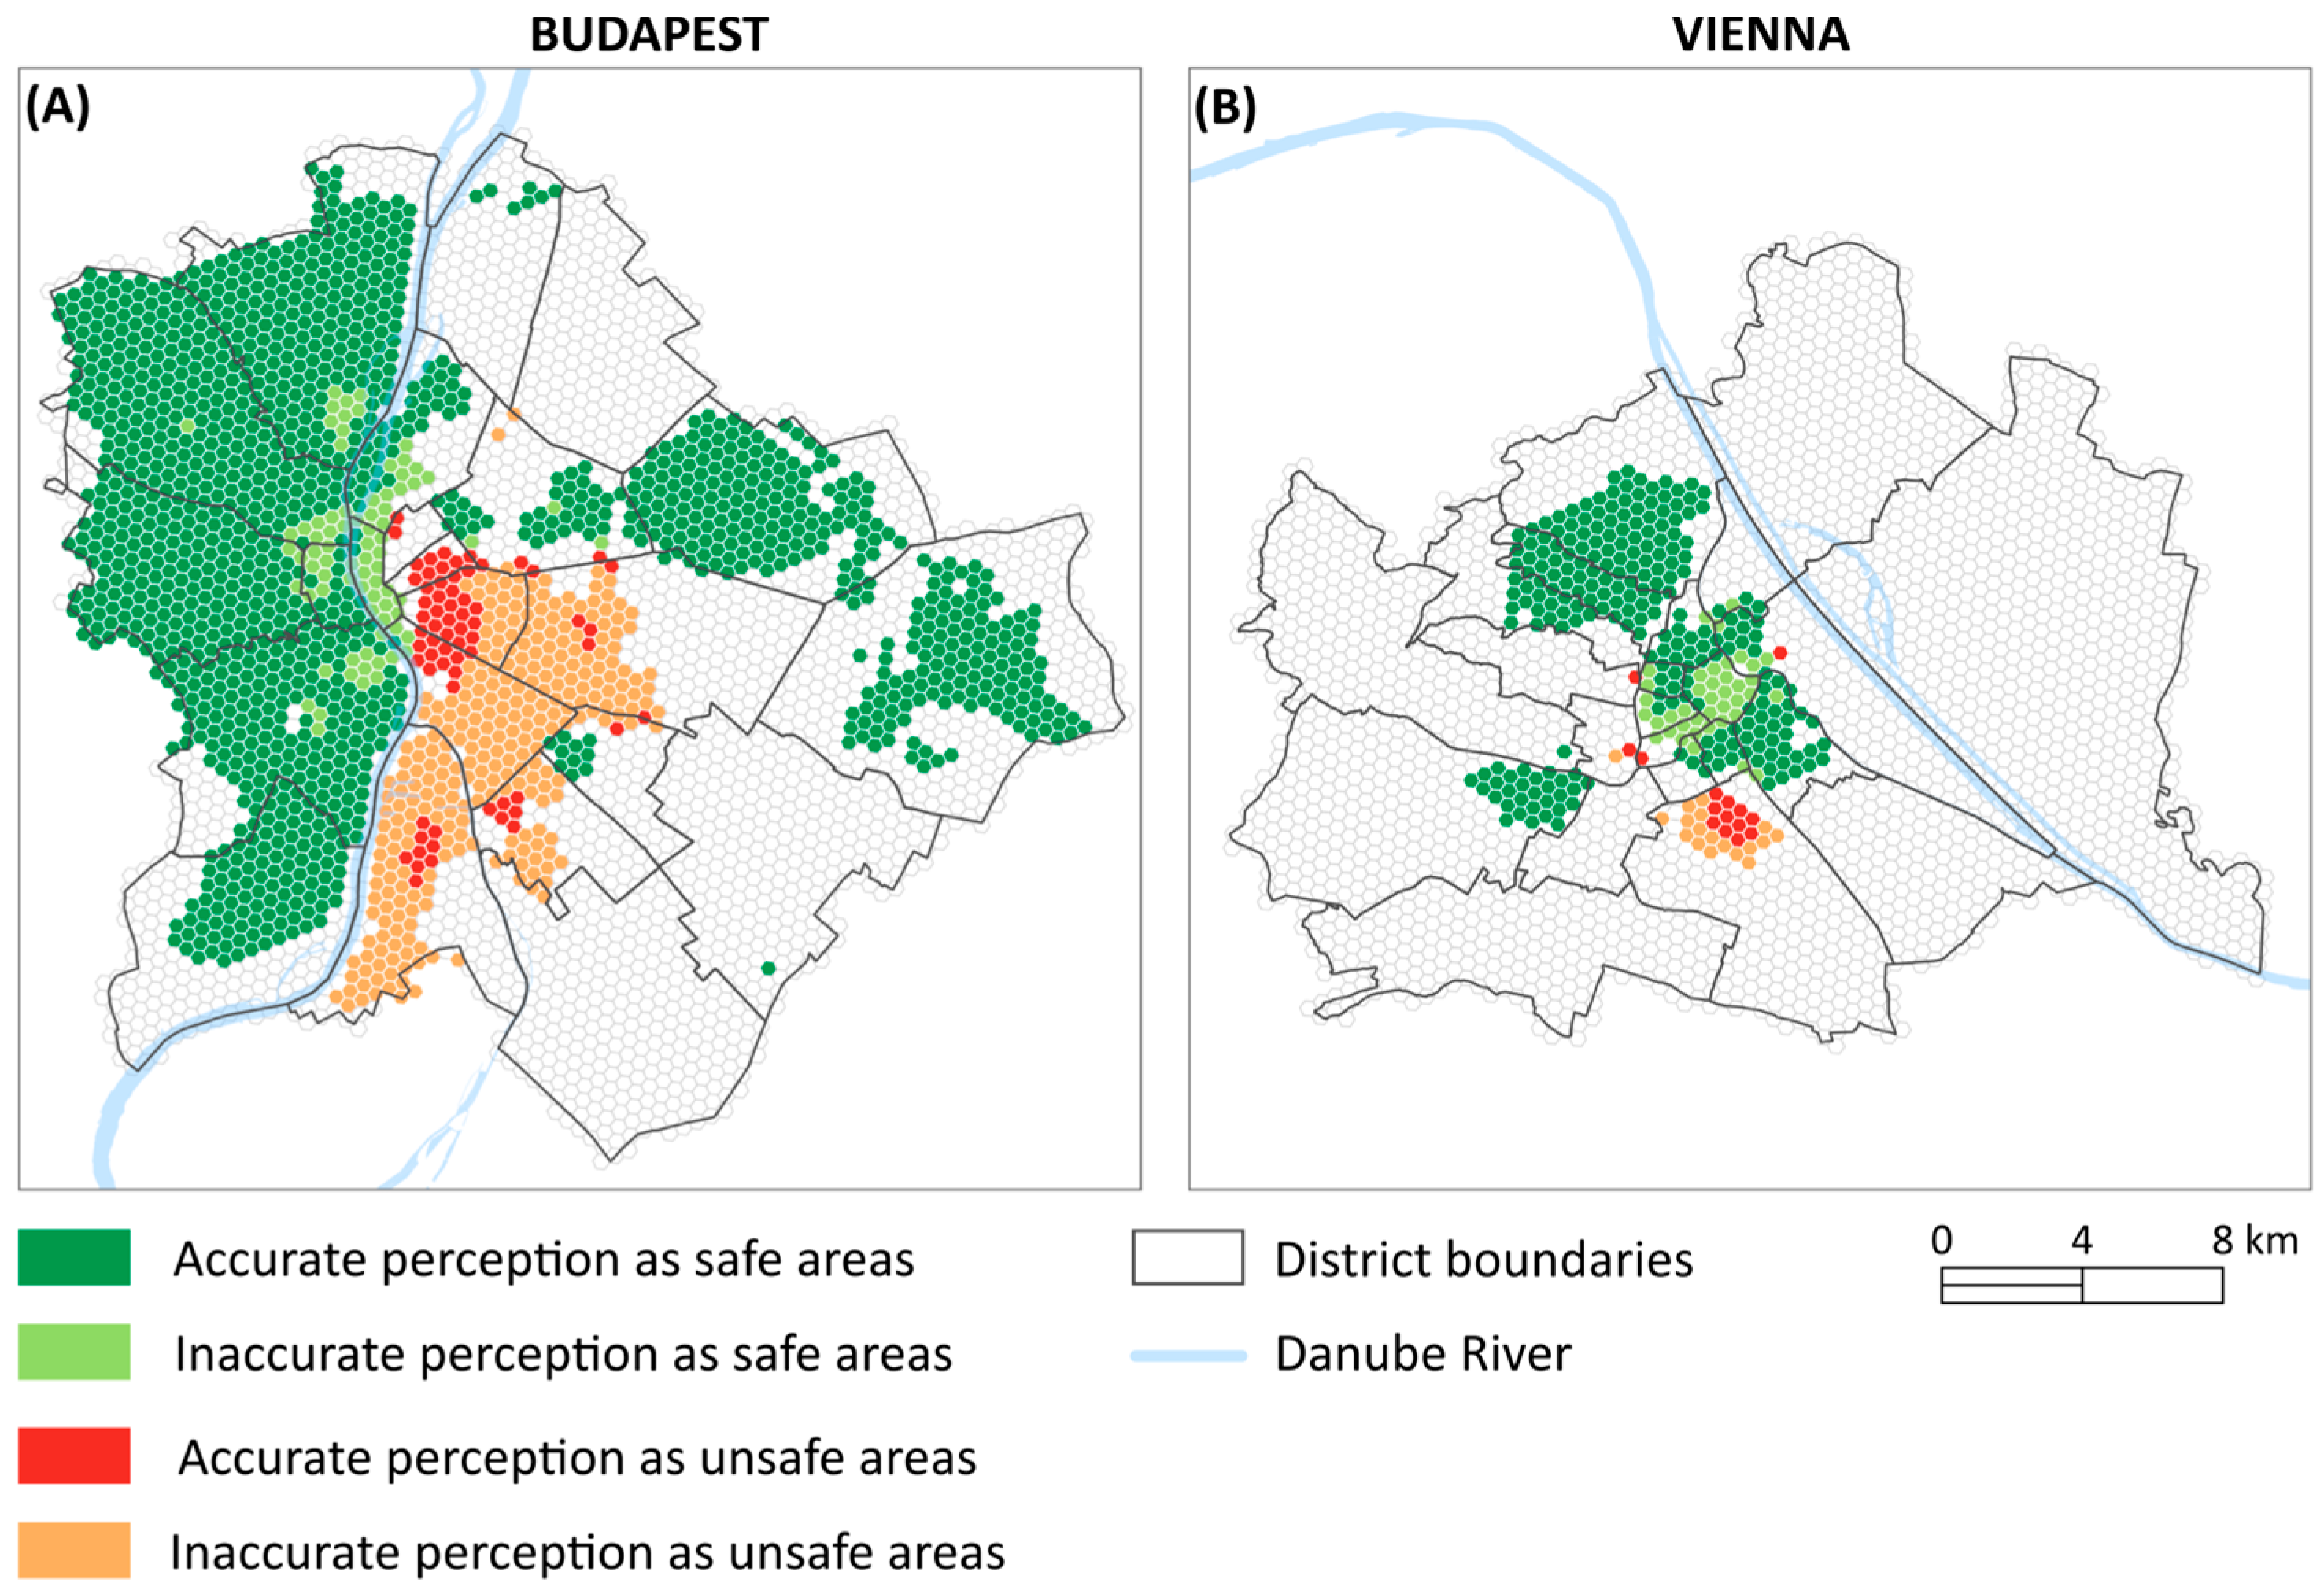
Figure 7 delineates the areas of the SCPG.
As a reminder, the reference data (actual crime patterns) consist of (a) the High-High or High-Low cells labelled as unsafe cells and (b) the Low-Low, Low-High, and not significant cells labelled as safe cells.
The following metrics are analyzed here:
Accuracy: the proportion of correctly classified cells (AU and AS) relative to the total number of cells.
Precision safe: the proportion of perceived safe cells that were actually safe.
Precision unsafe: the proportion of perceived unsafe cells that were actually unsafe.
Recall safe: the proportion of safe cells that were correctly identified as safe.
Recall unsafe: the proportion of unsafe cells that were correctly identified as unsafe.
Kappa statistic: the level of agreement between perceived and reference data, considering the possibility of agreement occurring by chance alone (ranges from 0 to 1).
These six metrics were calculated in each spatial grouping output (24 per city; see
Section 3.2), across crime type,
p-value, and contiguity order. Differences in the results across these combinations were relatively small; therefore, we report here the outputs with the highest Kappa statistic (level of agreement). A complete overview of all metric results can be found in the
Supplementary Material. Overall, the 1st order contiguity indicated a higher agreement between the perceived and the reference data. With regard to the
p-value, higher agreement was generally observed at
p = 0.05 and, in some cases, at
p = 0.01.
The overall accuracy is high (from 0.7 to 0.826) and remains relatively consistent. This initially suggests that public perception is reasonably accurate in identifying safe and unsafe areas when considered together. However, this metric is strongly biased by the imbalance between safe and unsafe classes. For example, in Budapest, reference safe areas account for 91.47% of the cells (all crime, p-value: 0.05, 1st order) and in Vienna for 82.26% (all crime, p-value: 0.01, 1st order). To address this limitation, the Kappa statistic is also considered. The Kappa results reveal that the agreement between perception and reference data is quite small and ranges between 0.165 for property crimes in Budapest and a highest at 0.37 for violent crimes in Vienna. Furthermore, the Kappa statistic confirms Hypothesis 1 with regard to violent crimes. For Budapest, the statistic is the highest for violent crimes (0.186) and lowest for property crimes (0.165). For Vienna, the statistic is the highest for violent crimes as well (0.37) and lowest for visible crimes (0.2). The visible crimes were the second highest for Budapest only. Nevertheless, we can confirm Hypothesis 1 as violent crimes seem to have a greater influence on people’s crime perception in space than other crime types.
When looking at the precision and recall results, we can confirm what was mentioned earlier. Perception of safety is more in line with reference safe areas, whereas there is a much larger mismatch (i.e., SCPG) between perception of unsafety and reference unsafe areas. This is consistent for both cities. However, while recall unsafe is higher than precision unsafe in Budapest, this is reversed in Vienna, where precision unsafe is higher than recall unsafe. This means that in Budapest, a larger proportion of unsafe areas were detected, but also many perceived unsafe areas were safe (IU SCPG). On the other hand, in Vienna the precision unsafe is higher than the recall unsafe. This means that a larger proportion of unsafe areas remained undetected as compared to Budapest, while the perceived unsafe areas were more accurate than in Budapest. In other words, while in Budapest participants captured a larger proportion of the crime hotspots as compared to participants in Vienna, they also perceived a larger area as being unsafe, although it is statistically safe.
The left map in
Figure 7 also visualizes the large area covering the IU SCPG in Budapest (marked with orange color) and a much smaller IU area for Vienna. The IS areas are shown on the maps with a light green color. In both cases IS areas are in the central districts of the two cities. Additionally, from the maps we can observe the spatial diffusion effect, which is analyzed quantitatively in the next section. Here we can see that IU areas are closer to AU (reference unsafe areas) as compared to AS (reference safe areas), and also that IS areas are closer to or enclosed by AS compared to AU. Also, note that grey areas on the maps are excluded from the analysis as they were classified as not significant regarding the agreement level and/or responses (
Section 3.1) to extract the collective perception.
When comparing the two cities, most of the observations made above are the same, with one significant exception. The crime perception in Vienna is more similar to the reference crime data as compared to the crime perception in Budapest. The reason for this seems to be a large area in the southern part of Budapest that is generally perceived as unsafe, although it is statistically safe.
4.2. The Spatial Diffusion Effect
The diffusion effect highlights how proximity to actual crime hotspots seems to influence people’s perceptions, leading them to extend these characteristics to adjacent areas, even when they do not align with the actual crime reality.
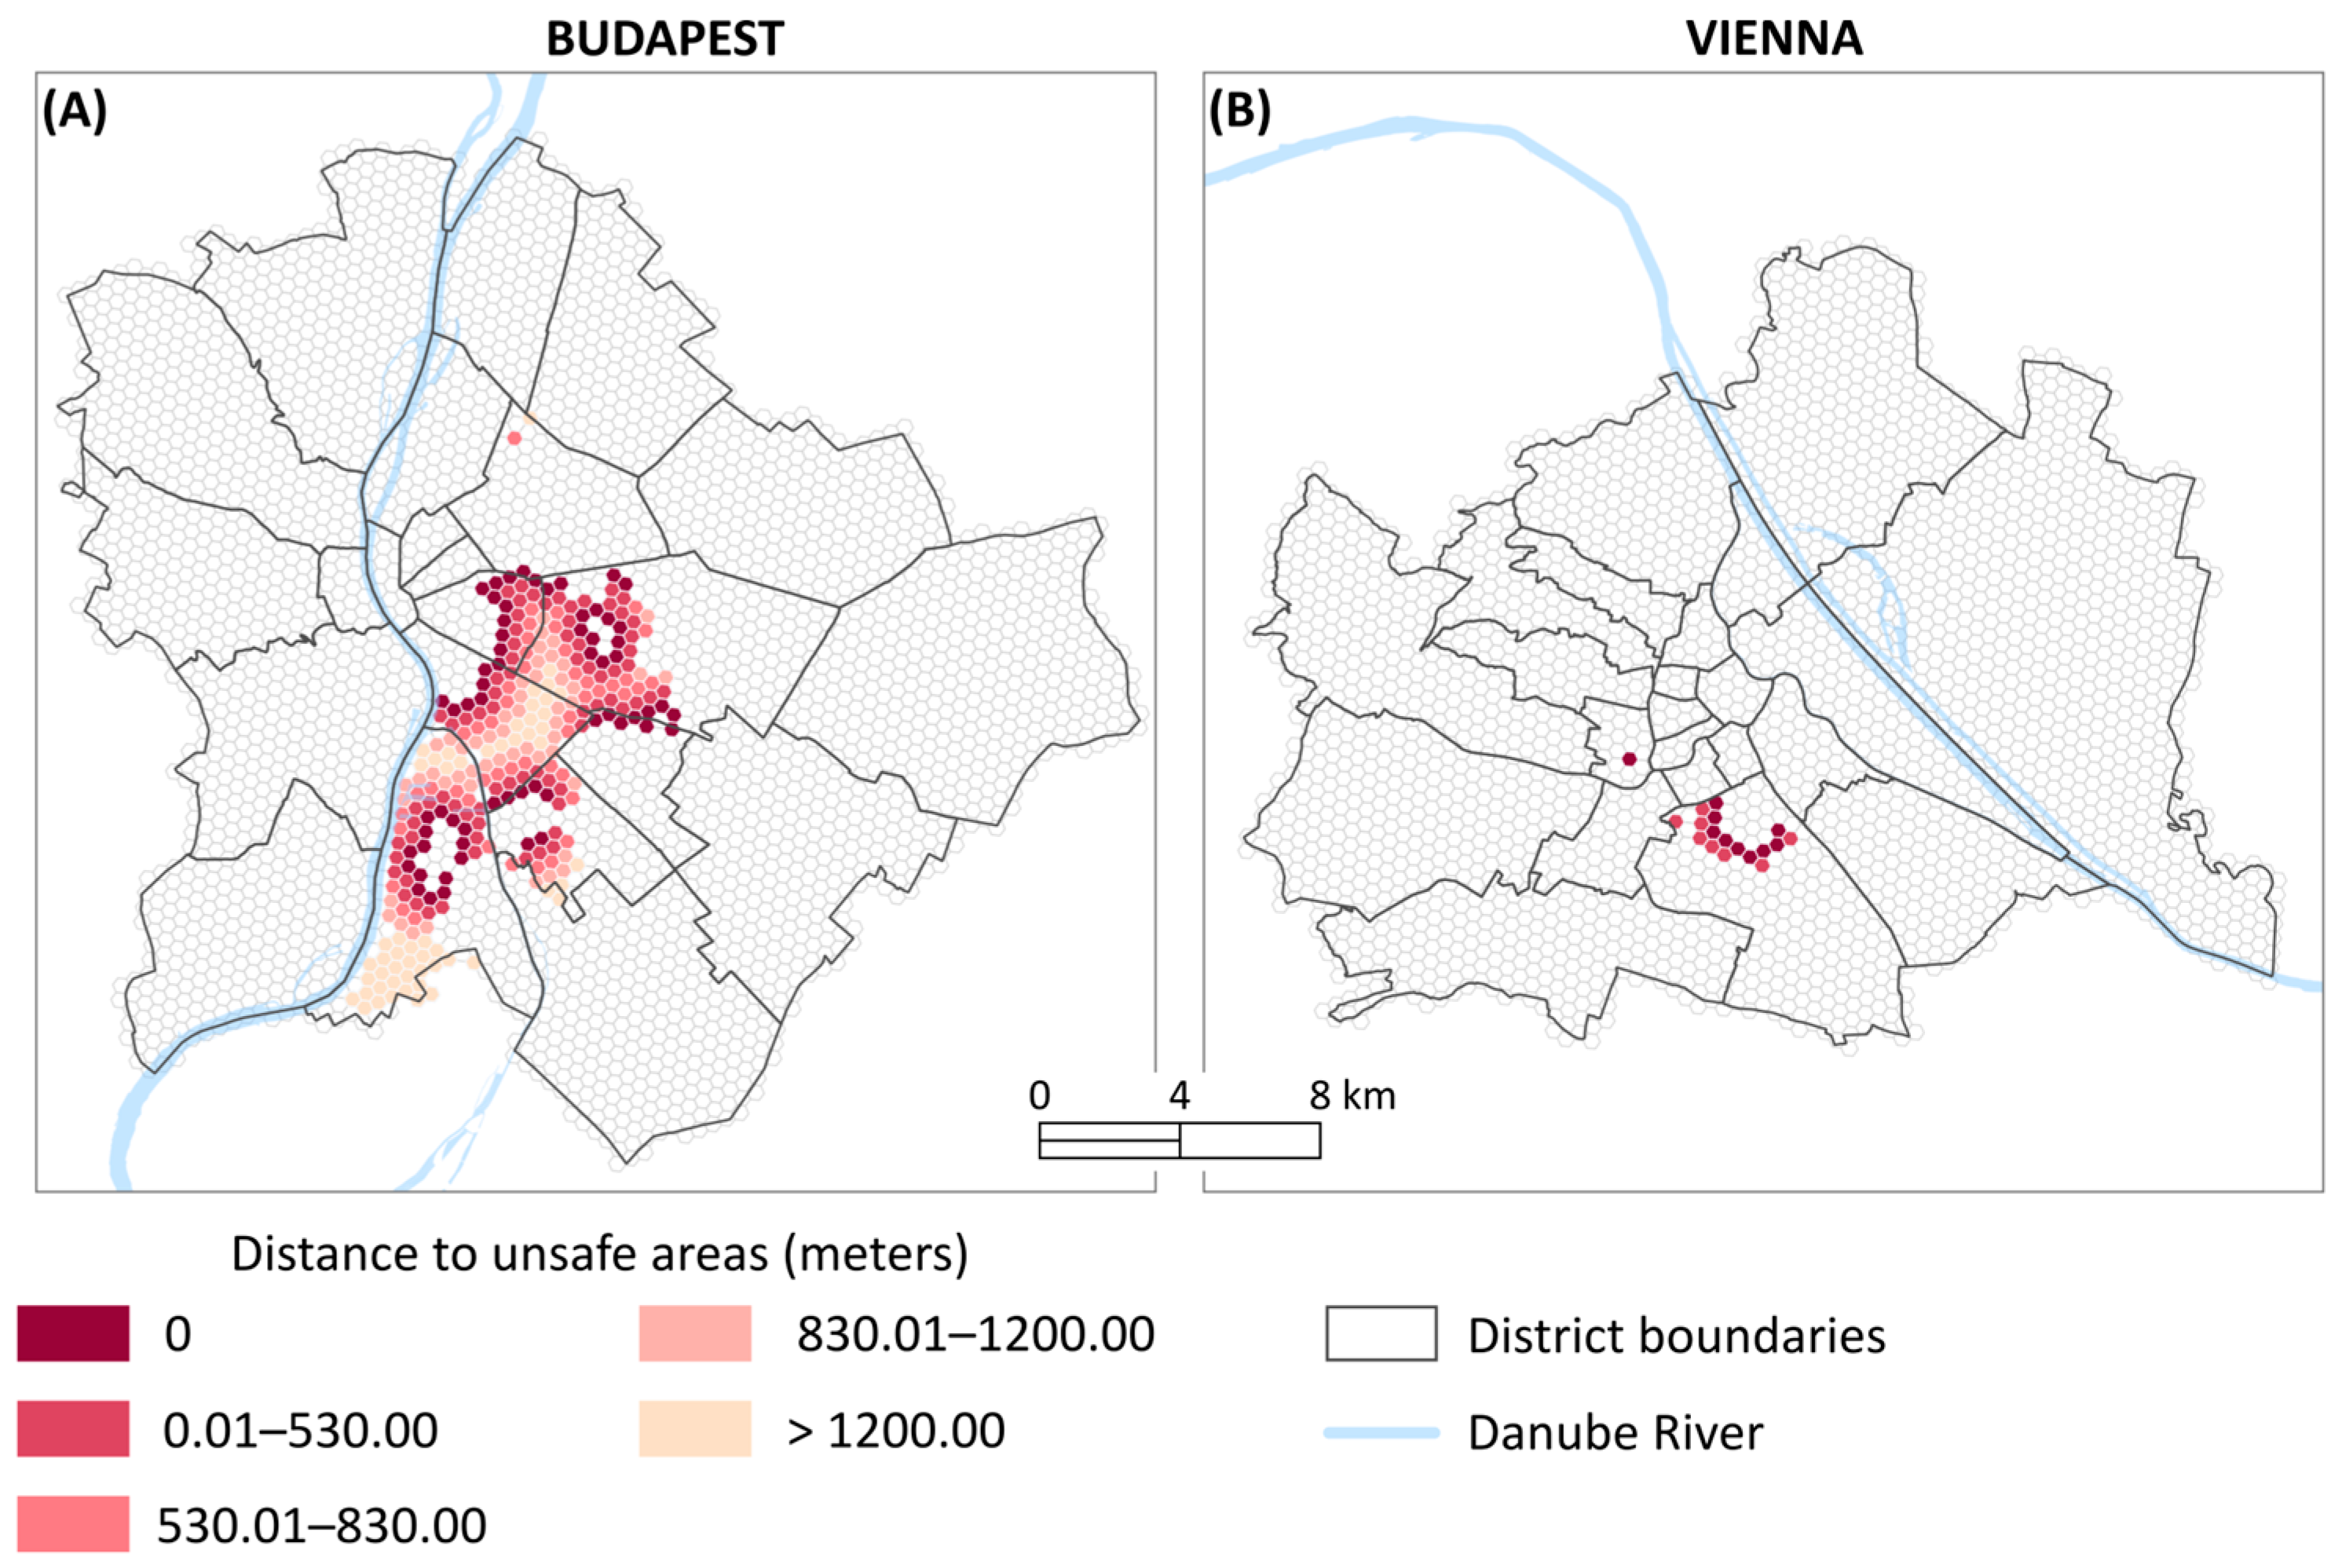
Figure 8 illustrates this spatial diffusion effect of inaccurate crime perception in Budapest and Vienna, focusing on areas inaccurately perceived as unsafe.
In Budapest, the diffusion effect is more pronounced due to the wider extent of the SCGP.
Figure 8 depicts the relationship between areas inaccurately perceived as unsafe and their proximity to actual crime hotspots, classified as High-High or High-Low areas. The spatial diffusion effect is evident in how the SCGP boundary is adjacent to actual crime hotspots, suggesting that perceptions of unsafety in these areas are likely influenced by their geographical closeness to real crime incidents. More specifically, cells with zero distance to crime hotspots (this means that they share a cell edge/are adjacent), are shown with dark red color on the map, which looks like they form an outline boundary, and all enclosed cells within this boundary are perceived as unsafe. For Vienna, the spatial extent of IU is more localized compared to Budapest. The gap is concentrated in specific areas rather than spread widely and is very close or adjacent (0 to 530 m) to the crime hotspots. This suggests that in Vienna, the diffusion effect is more concentrated in space yet still influenced by adjacency to actual crime hotspots.
4.3. The Spatial Endowment Effect
The distances here are calculated from the sketched daily routes to (a) the perceived safe polygons, (b) the perceived unsafe polygons, (c) the crime hotspots cells (High-High and High-Low), and (d) the crime coldspot cells (Low-Low and Low-High).
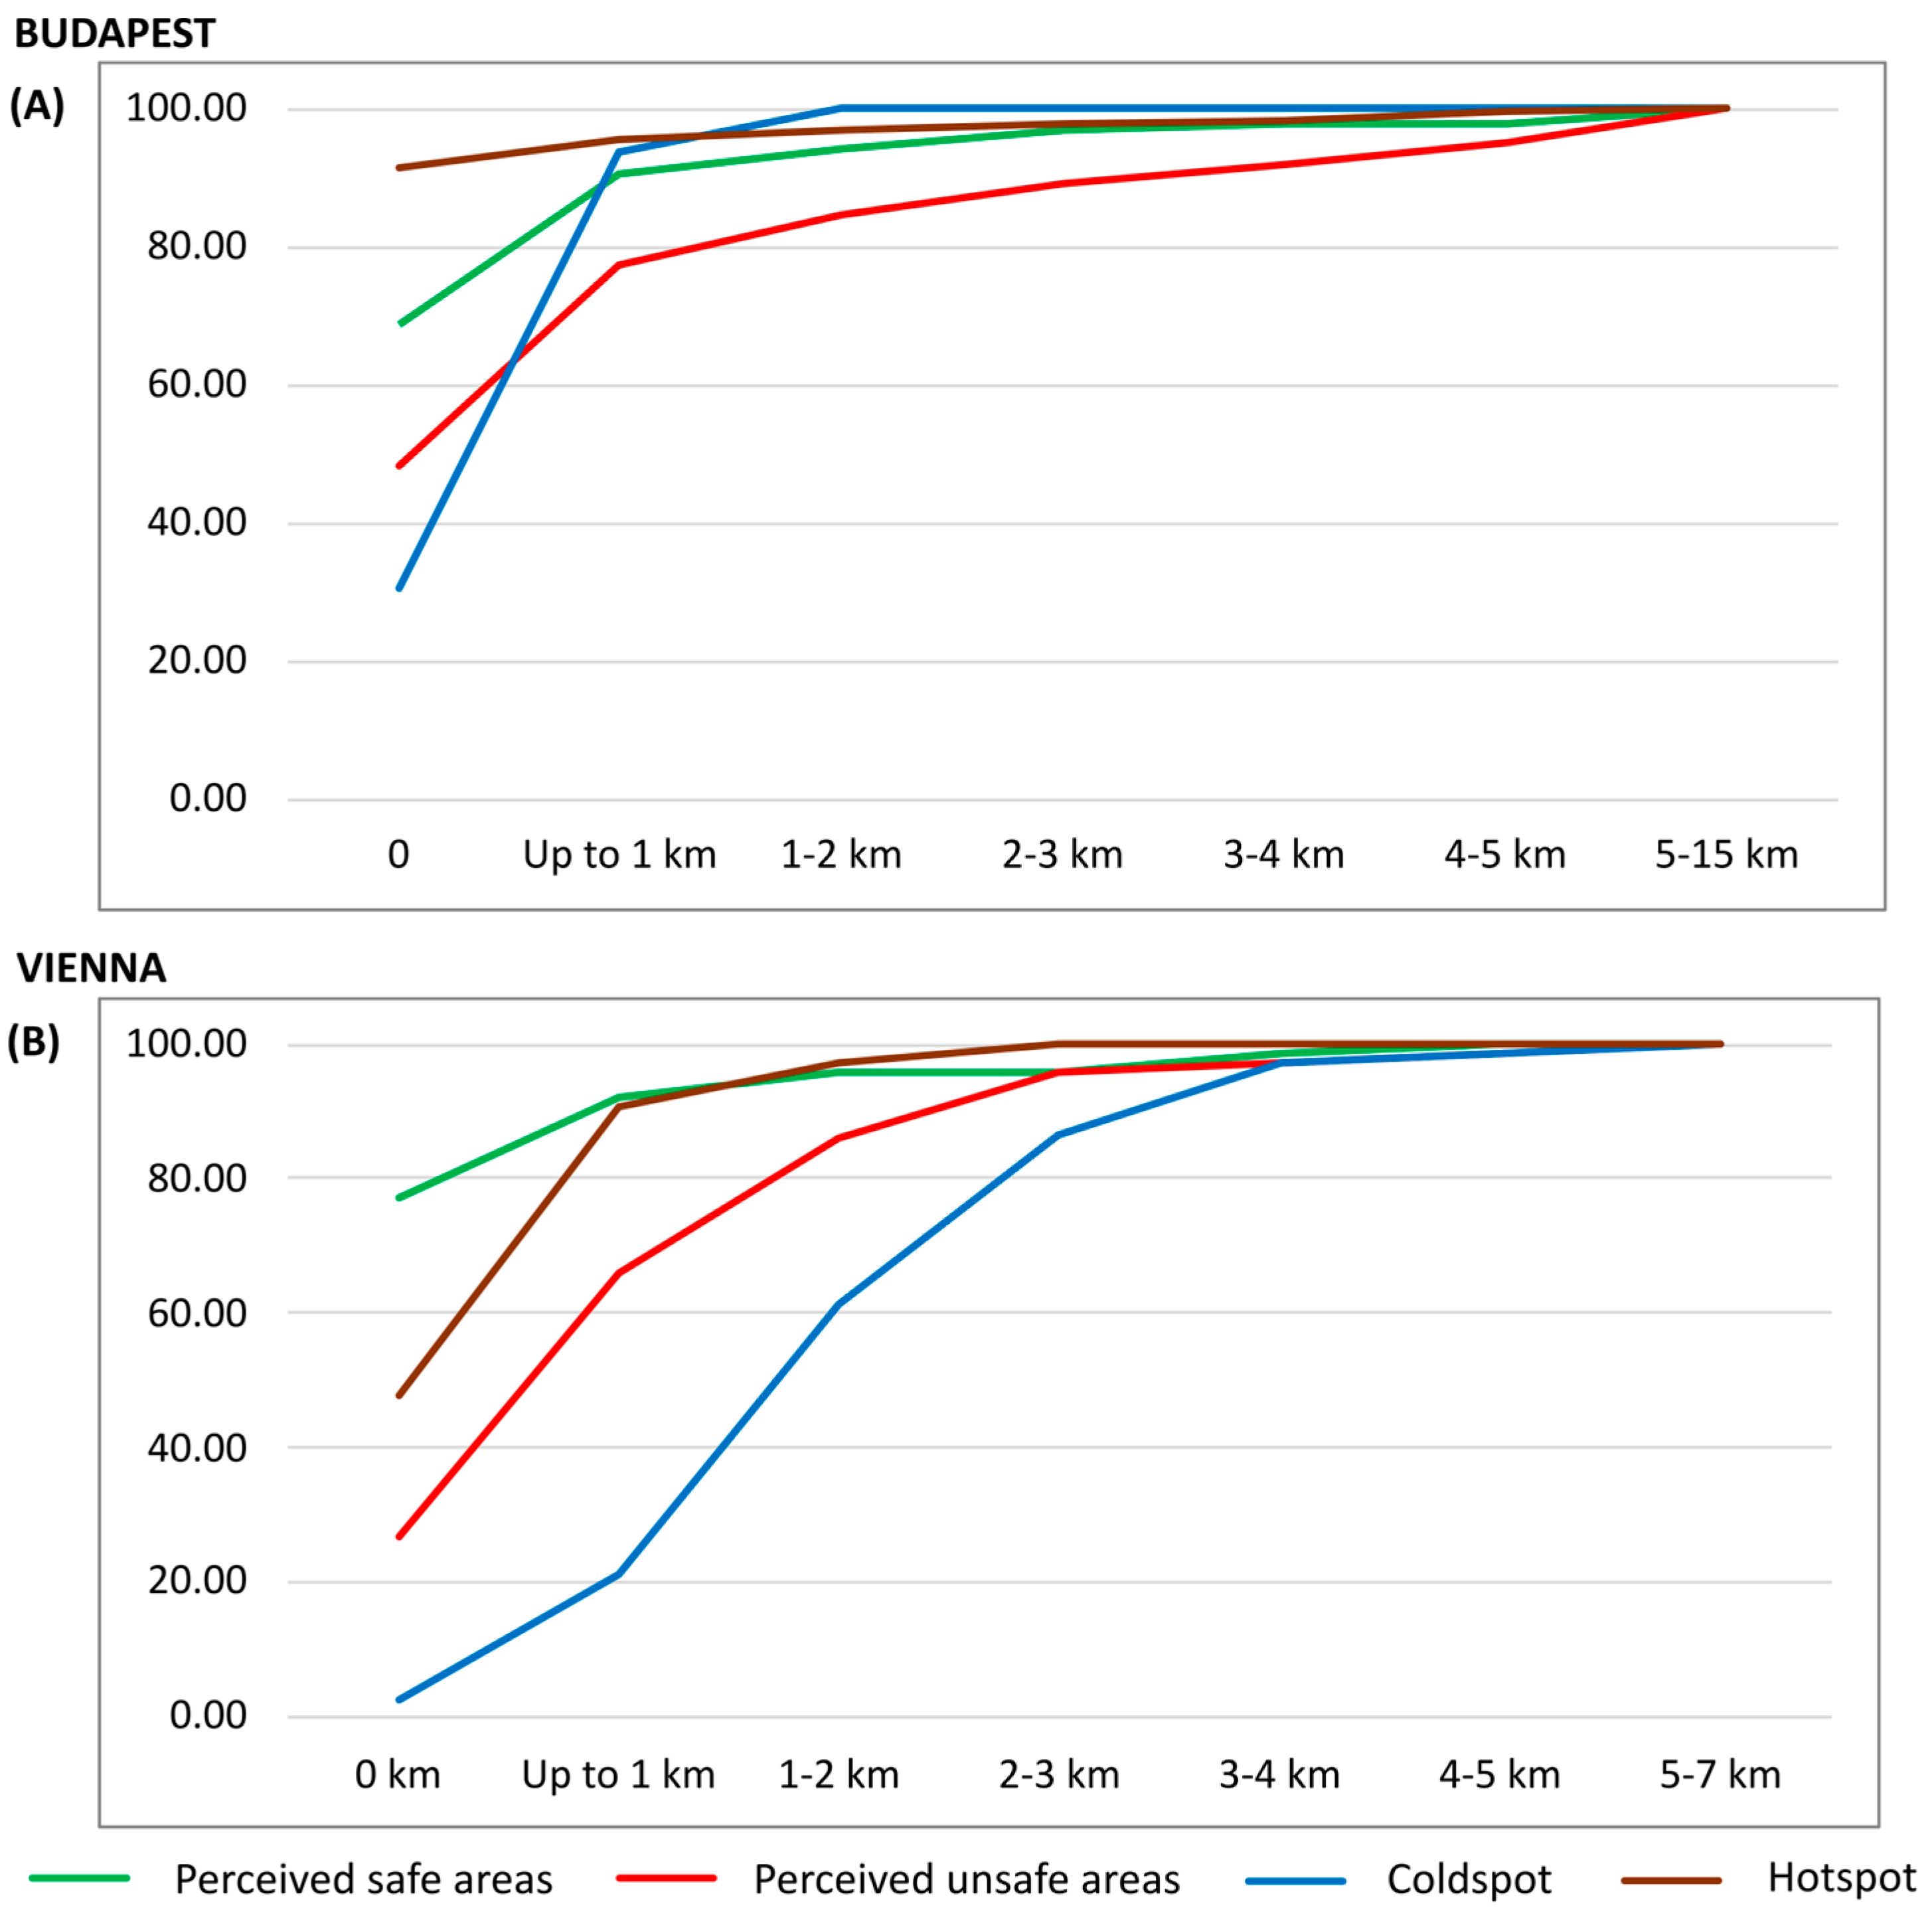
Figure 9 shows the cumulative frequency of distances a, b, c, and d at five distance intervals: 0 (intersection with the daily route), up to 1 km, 1 to 2 km, 2 to 3 km, 3 to 4 km, 4 to 5 km, and greater than 5 km.
For the case of Budapest and Vienna, a significant proportion (90.5% and 91.9%, respectively) of perceived safe areas is within close proximity (up to 1 km) of participants’ daily routes. This suggests that participants tend to perceive areas near their daily routes as safe, possibly reflecting familiarity with these areas or the endowment effect. Although a very high percentage of 91.41% of the hotspots intersect with the participants’ daily route in Budapest, only 48.25% of the unsafe sketched polygons intersect with their routes. Similarly, in Vienna, 48% of the hotspots intersect with the participants’ daily route, yet only 26.76% of the unsafe sketched polygons intersect with their routes. In general, the more bottom and right a line is depicted on the graph, the more this category is associated with larger distances. For both cities, the red line (perceived unsafe) is associated with larger distances to the daily routes as compared to the green line (perceived safe), and this pattern is even more prominent in Vienna. It seems that people are more likely to perceive an area as unsafe if it is further away from their activity space, as compared to areas that are close by or intersect with their activity space. The results of this analysis confirm the spatial endowment effect (Hypothesis 3) and suggest that people, regardless of the crime rates, feel safer in areas they are more familiar with.
5. Discussion
This study examines the spatial crime perception gap (SCPG), where areas perceived as unsafe are, spatially statistically, relatively safe, while objectively high-crime areas are considered safe. Although an increasing number of researchers have employed sketch mapping techniques combined with GIS to explore the underlying causes of fear of crime, SCPG has not yet been explicitly delineated in existing studies. Prior research has demonstrated that crime rates and perceived fear are correlated in some areas, whereas in others, no significant relationship has been found [
27]. However, to the best of our knowledge, no study has systematically delineated these spatial patterns as well as compared them between two cities of different countries. Using spatial analytical and statistical methods, our research identifies four distinct accuracy types of SCPG (AS—accurate safe, IS—inaccurate safe, IU—inaccurate unsafe, and AU—accurate unsafe) across two cities, Vienna and Budapest, offering a comparative perspective on the relationship between official crime statistics and perceived safety.
Quantifying the results of statistical analyses revealed that, in each city, the overall accuracy in identifying safe and unsafe places is relatively high concerning 1st order contiguity (0.785–0.797 in Budapest and 0.665–0.887 in Vienna), although a mismatch exists in both. Moreover, we identify controversial tendencies in the two cities. The precision for identifying safe areas is consistently high in Budapest; conversely, the precision for unsafe areas is notably lower. In contrast, in Vienna, the perceived unsafe areas were more accurate than in Budapest. The recall values show a similar trend in the two cities. The recall values for safe areas remain stable across different significance thresholds, implying that the respondents effectively captured most of the safe locations. Meanwhile, the recall for unsafe areas increases slightly (except for Vienna, p-value < 0.001) as the significance threshold becomes stricter (p-value decreases). This trend indicates that unsafe locations are more consistently identified under more stringent statistical conditions.
Kappa statistics resulted in relatively low values, suggesting that there may be significant variability in how individuals perceive safety or that the actual spatial distribution of crime does not align perfectly with perceived unsafety. However, Kappa statistics support Hypothesis 1 because the results in each city produced the highest Kappa values connected to violent crimes, similarly to Barton et al. [
16].
The level of perceived unsafety can be profoundly affected by crime-related media coverage [
44,
45]. Although in regions where such content is less frequently reported in newspapers and online platforms, residents generally experience a greater sense of security [
46]. This phenomenon is largely driven by trust, as the absence of alarming information reduces the perception of personal victimization risk.
In the case of Hypothesis 2, the phenomenon observed in Budapest—referred to as a spatial diffusion effect can be directly linked to the “public” perception of safety. Certain areas or entire districts, such as District VIII in Budapest, are commonly associated with danger or criminal activity in public discourse, despite the presence of universities and public institutions within these districts that are objectively considered safe environments. As illustrated in
Figure 5, areas with high crime incidence and the diffusion pattern depicted in
Figure 8 reveal that respondents often perceive spatially distinct locations as forming a contiguous zone of threat. This suggests that respondents are not able to delineate precise boundaries of perceived danger, a finding consistent with the observations of Curtis et al. [
47].
In contrast, in Vienna, participants likely possessed a more accurate understanding of actual crime distribution. Criminal incidents appeared to be more spatially concentrated, with fewer dispersed hotspots, whereas Budapest exhibited multiple clusters of perceived or reported criminality. This contrast may reflect differing levels of spatial awareness and the influence of local narratives on the mental mapping of urban safety.
Hypothesis 3 suggests that individuals perceive their own activity space as less fear-inducing compared to areas farther from their daily routes (i.e., the spatial endowment effect), aligning with the findings of Vallejo-Velázquez et al. [
18]. However, this assumption is somewhat contradicted by the findings of Breetzke and Pearson [
17], who demonstrated that higher crime rates within a neighborhood are associated with increased fear of crime. This suggests that individuals who perceive crime in their immediate surroundings tend to experience heightened fear. At the same time, their study also found that crime in the broader spatial context is negatively associated with fear, implying that individuals struggle to accurately delineate crime-related risks when they occur beyond their immediate vicinity. This result is in line with our findings, where we proved that respondents were more likely to designate areas located farther from their everyday activity spaces as threatening or fear-inducing. This finding can suggest that individuals consciously shape their daily activity spaces in ways that avoid areas perceived as dangerous [
48], indicating a behavioral pattern of spatial avoidance in response to perceived environmental risk.
The findings derived from the analysis of responses are encouraging and allowed for the confirmation of the presence of the SCPG phenomenon in both study locations.
Nevertheless, the research is not without potential limitations. One of the primary constraints stems from the snowball sampling approach and the online nature of the survey, which meant that the demographic composition of respondents could not be controlled. Although the gender distribution was balanced in both cities, the age distribution was not balanced. In Budapest, 47.3% of participants belonged to the 18–24 age group, while in Vienna, 49.6% were aged between 25 and 34 years. Consequently, the perspectives of older age groups are underrepresented in the dataset. Furthermore, a significant proportion of participants in both cities held a university degree—62.9% in Budapest and 87.8% in Vienna, which may be partially attributed to the use of an online sketch mapping tool as a data collection technique. However, this demographic overrepresentation may also reflect a broader trend: individuals belonging to higher-educated social groups tend to be more willing to express their views on urban environments and show greater interest in contributing to the improvement of their surroundings. While this engagement is valuable, it also introduces a potential bias into the results and limits the generalizability of the findings across broader segments of the urban population.
Another limitation relates to fewer responses (as compared to most items) to the option of sketching the daily routes, which was intended to robustly assess Hypothesis 3. This issue is likely related to privacy concerns, as participants may be reluctant to share sensitive or personally identifiable spatial information. In this study, such hesitation was observed despite the inclusion of a disclaimer at the beginning of the survey regarding data privacy.
Overall, geo-questionnaires, although widely adopted as part of the SoftGIS framework, a digital-based methodological approach designed to collect, analyze, and disseminate localized, subjective knowledge from individuals [
49], present inherent limitations as a form of volunteered geographic information (VGI) [
50,
51]. These include potential data biases related to low participation rates, limited user engagement, and high drop-off rates. Despite these challenges, geo-questionnaires remain a valuable tool for collecting spatial data, with the understanding that findings are sample-dependent and not necessarily generalizable.
6. Conclusions
Overall, the findings underscore the methodological value of combining volunteered geographic information with spatial statistical techniques. This approach offers a framework to examine the SCPG.
By disaggregating crime into categories (violent, property, visible, and all crimes), we observed that perception is not aligned with crime patterns. Furthermore, violent crime exhibits a stronger spatial correspondence with perceived unsafety as compared to property and visible crimes, which revealed a wider perception gap. This differentiation suggests that public perception of safety is shaped more by the salience of violent events than by the prevalence of other crime types.
The cross-city comparison highlights the importance of geographical context. For example, Budapest exhibits a larger crime perception gap, while Vienna shows a stronger spatial endowment effect. These findings indicate that social and spatial structural conditions affect how individuals interpret urban safety. The differences not only advance theoretical understanding of the spatial crime perception gap but also hold practical relevance. By identifying areas where perception diverges most strongly from crime statistics, urban planners and stakeholders can design targeted interventions, such as enhancing certain urban features, introducing communication strategies, or initiating community-based safety initiatives, to mitigate unfounded fear while reinforcing confidence in low-crime areas. At the same time, recognizing where low perceived risk overlooks actual crime hotspots can help redirect attention to areas where increased vigilance and preventive measures are warranted.
Retrospectively, knowledge of safety perceptual gaps can also be used as a measure to test and validate initiatives or prevention campaigns on the fear of crime. In a recent study [
52], it was shown that successful city-level interventions to eradicate a drug-use hotspot in Budapest were clearly captured and reflected by the measurement of fear of crime in space. After the interventions, the hotspot area was not perceived as unsafe as it was reported to be before the interventions.
Follow-up fieldwork is warranted to further investigate the urban features in both cities, particularly within areas identified as IU and IS (gap places), which will be coupled with the additional items of the survey. Respondents also provided supplementary qualitative information, the analysis of which could offer a more nuanced understanding of urban fear dynamics. This highlights the untapped potential of the survey’s responses and points toward future research directions. On-site assessments of these zones could provide deeper insight into the contextual and environmental factors (e.g., absence of lighting or presence of litter) contributing to perceived unsafety and the formation of SCPG clusters. Furthermore, individual (non-spatial) questions on safety and crime will offer more insights into the hidden layers behind crime perception and the gap to crime prevalence.
Expanding the scope of analysis to include additional cities could contribute to a more comprehensive understanding of the mechanisms behind perceived unsafety and the factors that enhance residents’ sense of security. Another aspect that should be taken into consideration is how the crime perception gap phenomenon can be communicated effectively without harming and stigmatizing communities and neighborhoods. On the one hand, highlighting IS places may unavoidably lead to a bad reputation in a place that has been (inaccurately) perceived as safe. On the other hand, highlighting IU places could help in reframing an unfair labeling of safe places that were (inaccurately) perceived as dangerous. This issue is complicated to envisage, similar to the discussion of the advantages and disadvantages of publishing spatial crime statistics. On the positive side, the publication of both spatial crime statistics and spatial crime perception contributes to the efforts to foster informed citizens and may encourage local authorities to act and publicize the impact of effective crime prevention policies.
