Article

Tourism-Induced Land Use Transformations, Urbanisation, and Habitat Degradation in the Phu Quoc Special Economic Zone

1
Environment Centre, Charles University, 16000 Prague, Czech Republic
2
College of Environment and Natural Resources, Can Tho University, Can Tho 92000, Vietnam
3
Department of Geography, Faculty of Social Science, Srinakharinwirot University, 114 Sukhumvit 23, Wattana District, Bangkok 10110, Thailand
*
Author to whom correspondence should be addressed.
Urban Sci. 2025, 9(1), 11; https://doi.org/10.3390/urbansci9010011
Submission received: 21 October 2024 / Revised: 13 December 2024 / Accepted: 2 January 2025 / Published: 6 January 2025

Abstract

:
Dynamic development of tourism activities and rapid urbanisation in Special Economic Zones (SEZs) can lead to significant land use and land cover changes (LULCCs) and environmental degradation, particularly in ecologically sensitive areas. This study examines the transformation of land use and its associated impacts on habitat quality and thermal environment in Phu Quoc Island (Vietnam) over a 20-year period (2003–2023). Using multi-temporal Landsat satellite imagery and random forest classification, we quantify LULCCs and assess the environmental consequences of urban expansion on habitat degradation and intensification of the island’s thermal environment, focusing on land surface temperature (LST) changes. Our analysis reveals that rapid urbanisation, driven by large-scale tourism and infrastructure developments, has led to a significant loss of forest and farmland, leading to a 5.6% decline in habitat quality and a marked increase in LST. The study also highlights the uneven distribution of urban growth, with the majority of expansion occurring in the southern and central regions of the island. By applying the InVEST Habitat Quality Model, we identify key zones of habitat degradation and offer insights into the spatial patterns of environmental sensitivity and changes. Our findings underscore the need for integrated land use planning and sustainable development strategies to mitigate the negative environmental impacts of SEZ-driven urbanisation on island ecosystems. This research provides critical guidance for policymakers, planners, and environmental managers to balance economic growth with environmental conservation in fragile island environments.

1. Introduction

Urbanisation transforms landscapes and ecosystems, particularly in developing regions, where rapid economic growth and industrialisation often drive extensive changes in land cover and land use (LULC) [1,2]. In recent decades, a growing number of nations have adopted Special Economic Zones (SEZs) as a means to boost economic advancement, attract foreign investments, and encourage industrialisation [3,4]. SEZs are geographically defined areas that offer regulatory, tax, and trade incentives to encourage business activities and drive investment and economic growth [5,6,7]. While these zones have been instrumental in spurring economic transformation, their creation often results in significant environmental challenges, particularly in areas with ecologically sensitive landscapes [8].
Vietnam, a nation with a long coastline of over 3200 kilometres and more than 3000 islands and archipelagos, has embraced SEZs as a critical component of its economic modernization strategy. Since the early 2000s, the Vietnamese government has prioritised the establishment of SEZs to attract foreign direct investment (FDI), diversify the economy, and position itself as a competitive player in global markets [9]. The development of SEZs has been a part of Vietnam’s broader economic reforms known as “Đổi Mới”, which began in the late 1980s and transitioned the country from a centrally planned economy to a socialist-oriented market economy [10,11]. Through SEZs, Vietnam aims to create hubs of industrialisation, foster innovation, and boost sectors such as manufacturing, tourism, and services, while also positioning itself as a competitive player in the global economy, addressing regional disparities, and promoting long-term economic sustainability. Unlike previous studies focusing on mainland urbanisation, this research uniquely addresses the rapid transformation of a SEZ on an island, where ecosystems are particularly vulnerable to unregulated urbanisation and tourism expansion.
Phu Quoc Island stands as a prime example of Vietnam’s SEZ strategy. It is the largest island in Vietnam, which is famous for its diverse wildlife, beautiful beaches, and marine life, attracting tourists from all over the world [12,13]. Phu Quoc officially became a city on 1 January 2021, following the passage of Resolution No. 1109/NQ-UBTVQH14 by the Standing Committee of the National Assembly on 9 December 2020. This marked its transition from a district-level administrative unit to a city under Kien Giang Province, making it Vietnam’s first island city [14]. Recognising its strategic location and potential for tourism and economic development, the Vietnamese government had aimed to designate Phu Quoc as a SEZ in 2020, intending to transform the island into a hub for tourism, trade, and investment. Although the SEZ status was not formalised, the city upgrade was a key step in supporting Phu Quoc as a special administrative–economic zone, combining tailored regulations to drive economic growth and promote sustainable practices in tourism and real estate investments [15].
Since the 2000s, major investments have flowed into Phu Quoc, leading to the construction of resorts, hotels, commercial centres, and residential areas. By the mid-2010s, the island had attracted significant investment from major domestic companies like Vingroup, Sun Group, and BIM Group, which developed luxury resorts, amusement parks, and other large-scale tourism projects, including the world’s longest cable car [13,16]. The growing number of domestic and international tourists has in turn fuelled demand for land, infrastructures, accommodation, and services, solidifying the island’s position as a key tourism and investment hub in Vietnam [16,17]. However, while these developments and increased visitors’ numbers have accelerated economic growth, they also have triggered widespread land use and land cover changes (LULCCs) and disturbed ecological environments by human interventions.
The consequences of rapid LULCCs and urbanisation on island ecosystems put more pressure on them than on mainland areas [18]. Islands are well known to be particularly vulnerable to environmental degradation due to their geographic isolation, limited arable land and resources, and fragile ecosystems with high levels of endemism [19,20]. The conversion of natural habitats into urban areas disrupts ecosystem services, reduces biodiversity, and affects the island’s capacity for climate regulation and disaster mitigation. Moreover, the intensification of land use in coastal zones and forests increases the exposure to climate-related risks, such as coastal erosion, flooding, drought, and extreme heat [21,22]. These transitions can even lead to irreversible consequences because, unlike mainland areas, islands lack expansive buffers to mitigate environmental disruptions. For example, urban surfaces increase flooding risks and disrupt groundwater recharge, a vital resource on any island. Deforestation on islands magnifies threats and local climate changes (e.g., urban heat islands). With little space for retreat and adaptation, islands are more constrained in managing these risks, making their challenges distinct and more acute than those faced by mainland regions.
Numerous studies have clearly documented LULCCs and urbanisation across many islands worldwide, such as Penang (Malaysia), Muharraq (Bahrain), Moheshkhali (Bangladesh), and Rameshwaram (India) [23,24,25,26]. Yet they solely monitored LULCCs without insightful assessments of how these changes further harm the environment and ecosystems. There is growing recognition of the environmental impacts of rapid urbanisation in SEZs, with limited empirical investigations [27,28,29]. SEZs established on islands are also common in many countries (e.g., China, Malaysia, Indonesia, and Korea). Yet there is currently limited research into how these transformations specifically affect ecologically sensitive ecosystems on SEZ islands like Phu Quoc Island, as vast inflows of investments due to a SEZ may considerably induce environmental degradation. For Vietnam, previous studies have primarily focused on mainland urbanisation and generalised environmental degradation patterns, leaving a gap in the understanding of spatially detailed impacts on habitat quality and thermal environments in island SEZs [10,30,31,32]. Additionally, the effects of unplanned urban growth on ecosystem services and biodiversity in rapidly developing regions are often overlooked in existing research [33,34]. This study addresses these knowledge gaps by providing a multi-temporal analysis of LULCCs and habitat degradation on Phu Quoc Island, quantifying urban expansion, and assessing its thermal environment consequences.
This study aims to provide a comprehensive analysis of the land use transformations and habitat degradation in Phu Quoc Island for the 20-year period 2003–2023. Utilising multi-temporal satellite imagery from the Landsat programme, we quantify the extent of LULCCs and assess the environmental impacts associated with urban expansion. Specifically, this study focuses on evaluating the degradation of habitat quality and the intensification of the island’s thermal environment as a result of rapid urbanisation. This study highlights the thermal environment as a crucial indicator of environmental decline, especially on this well-known tourist island renowned for its varied outdoor activities. Unfavourable temperatures can impact visitors’ health and reduce their overall satisfaction. To achieve this overall goal, the random forest algorithm was used to classify land use patterns, while the Integrated Valuation of Ecosystem Services and Tradeoffs (InVEST)—Habitat Quality Model was applied to assess changes in habitat quality. By examining the drivers and consequences of land use transformation in Phu Quoc, this research provides critical insights into the broader implications of SEZ-driven urbanisation in island ecosystems. The findings of this study are intended to inform policymakers, planners, and environmental managers on how to balance economic growth with environmental conservation in Phu Quoc Island and other island economies facing similar pressures. In doing so, the study contributes to the ongoing discourse on sustainable development in fragile environments, highlighting the need for integrated land use planning that considers both the ecological and economic dimensions of development.

2. Materials and Methods
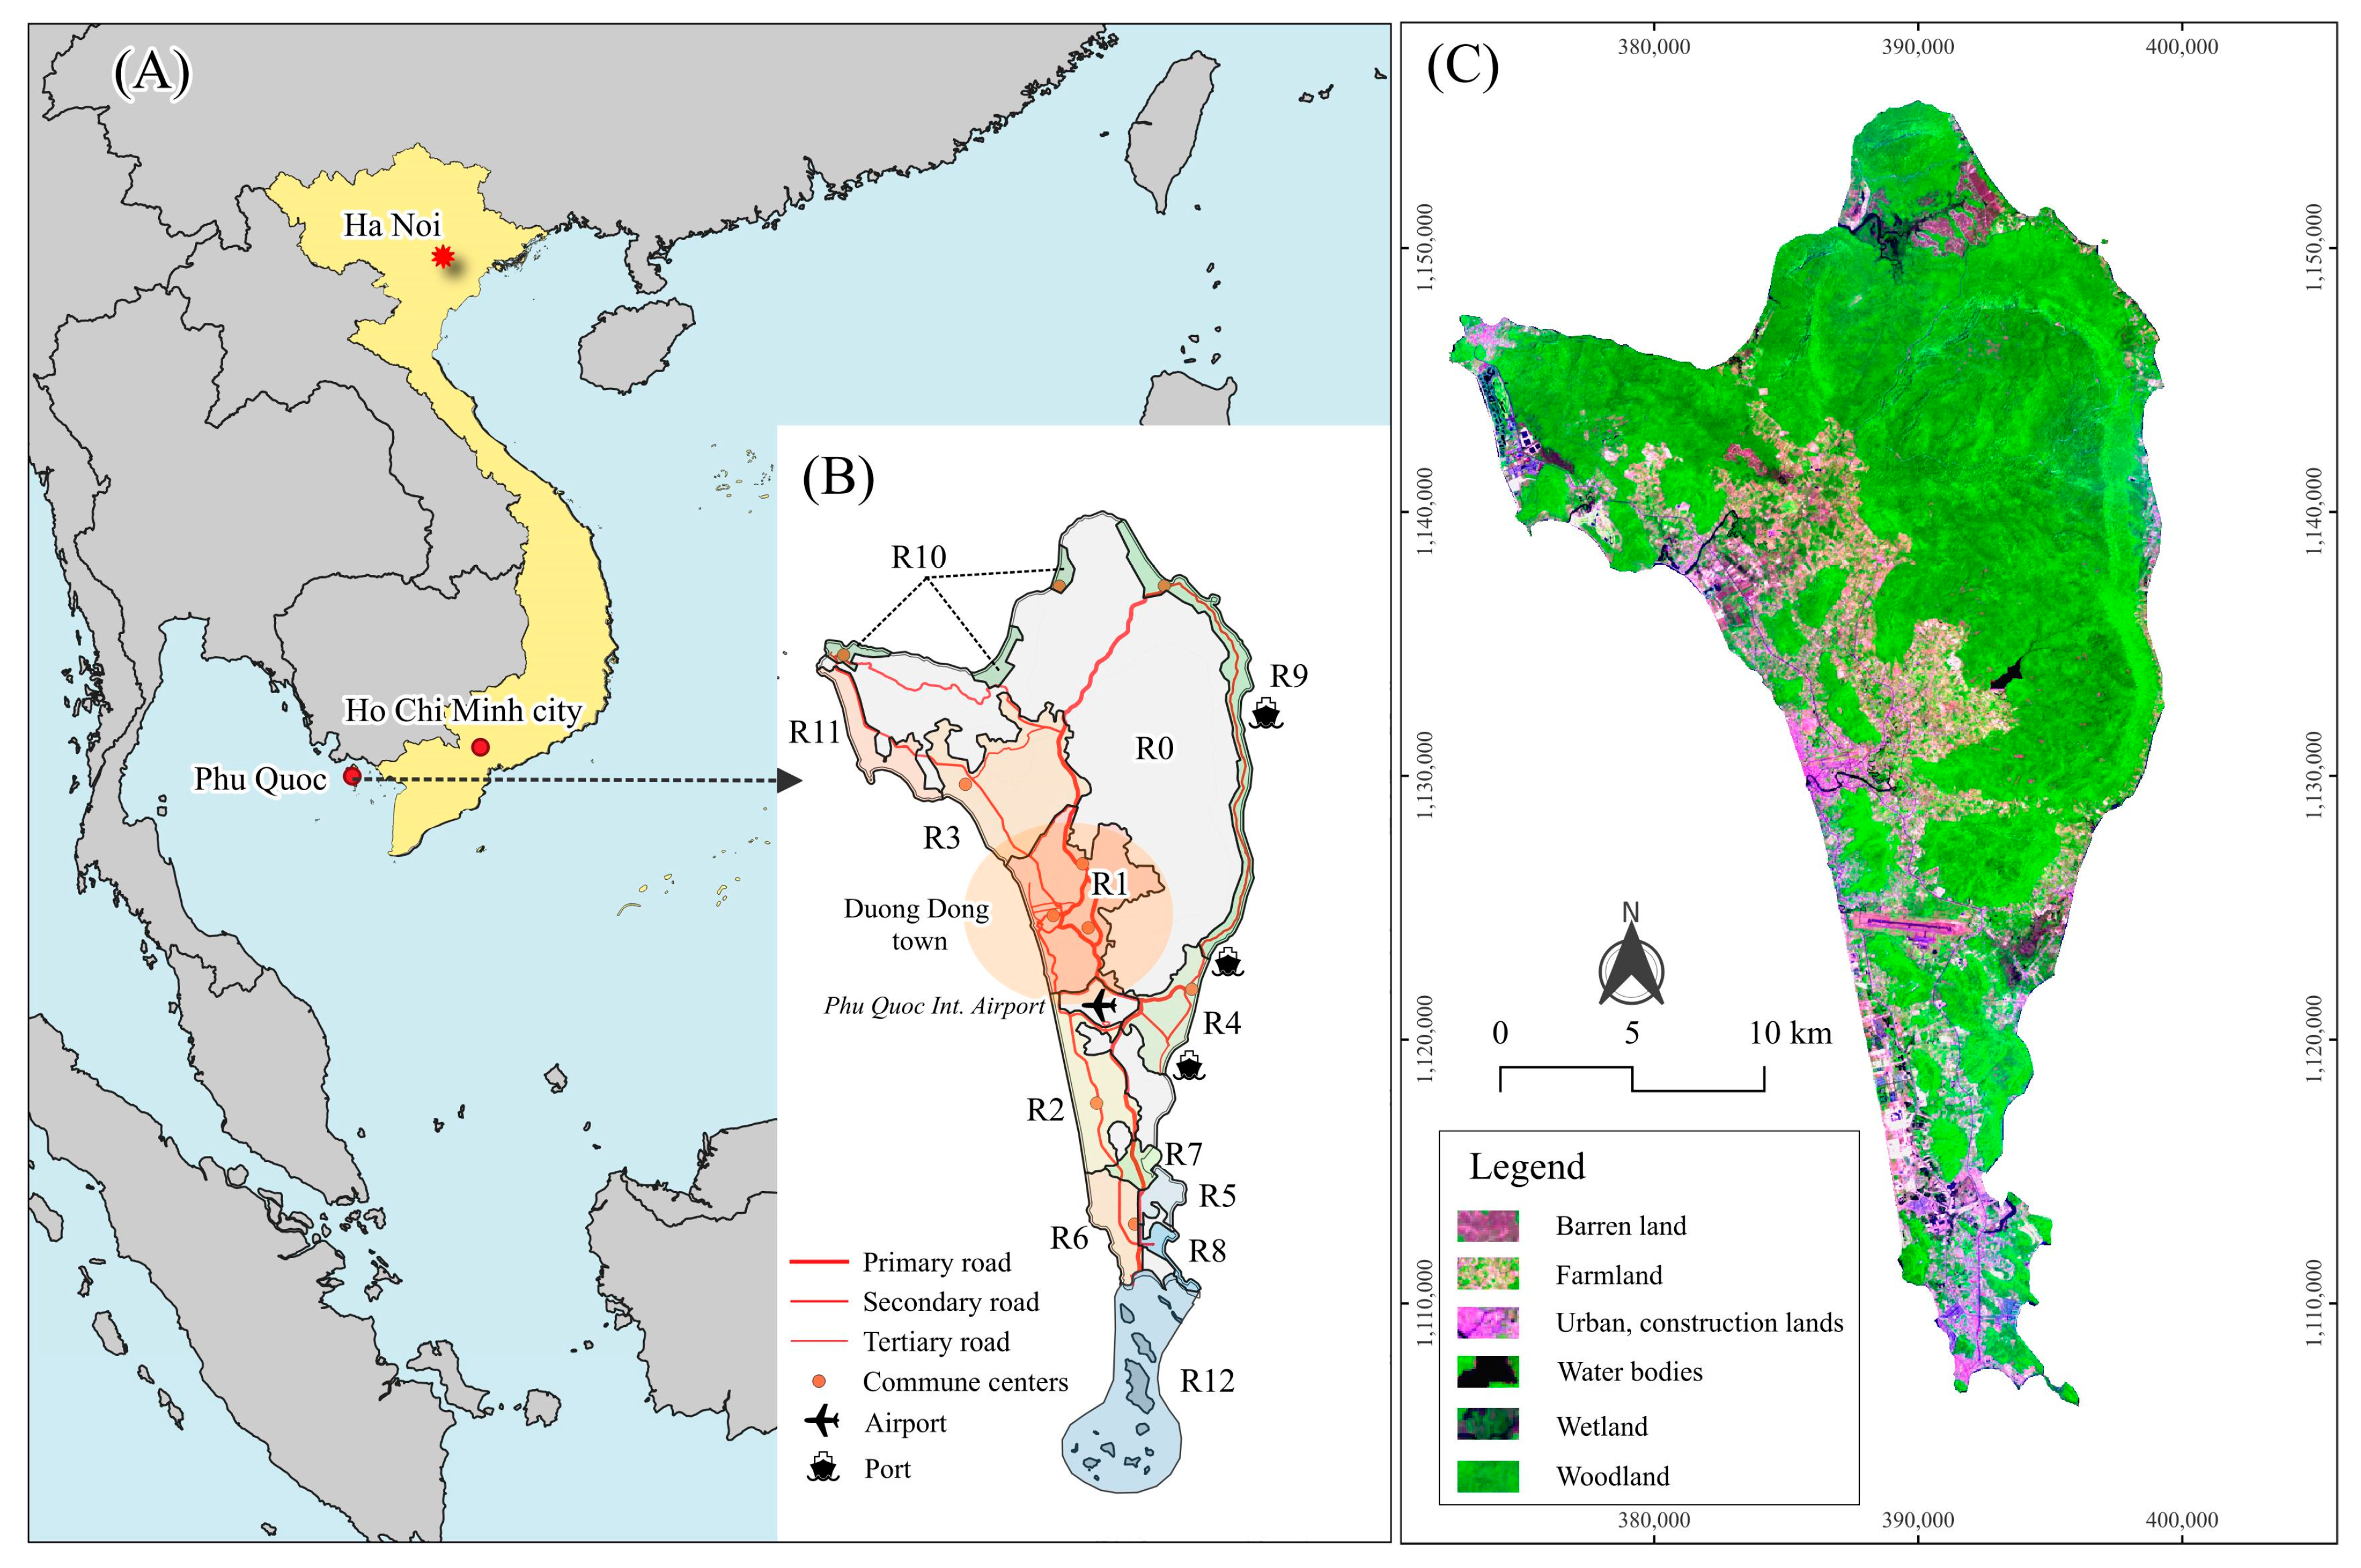
2.1. Study Area

Phu Quoc (10.2899° N, 103.9840° E), the largest island in Vietnam, spans an area of approximately 573 km2. It is situated in the southwestern part of the country, within the Gulf of Thailand (West Sea in Vietnamese) (Figure 1A). Situated in Kien Giang province, Phu Quoc consists of the mainland and numerous islets, mainly around the south. This study solely focused on the Phu Quoc mainland, as urban development, investments, and LULCC have predominantly occurred on the mainland rather than on the surrounding islets (Figure 1B) [35,36]. The island is mainly characterised by low mountains and narrow plains [37]. The terrain gradually decreases from north to south and from east to west, which facilitates the concentration of the population in residential areas and urban centres primarily located to the west and south of the island (Figure 1C). The island’s climate is influenced by the tropical monsoon system, with annual average temperatures of around 22–32 °C. The season can be divided into two distinct seasons, a dry season from November to April, characterised by warm air and abundant sunshine, and the rainy season, from May to October, which brings substantial rainfall [38]. Phu Quoc has unique and diverse terrestrial and marine ecosystems, including tropical rainforests, mangroves, coral reefs, and seagrass beds, all of which support a wide range of biodiversity, including endemic species (Figure 1C) [36].
Both the natural and ecological advantages of Phu Quoc have played a pivotal role in driving its economic development, especially the marine economy and tourism. The first effort was promoted in 2004 and revised in 2007, which has been supported by the government at all levels, such as investment attractions and open land lease policies [39]. The development of Phu Quoc Island had a turning point in 2020 when the Prime Minister approved the strategy to develop the island into a special administrative–economic zone [40]. More explicitly, the island will be divided into 12 subdivisions, considering distinct characteristics of terrain, natural resources, and socioeconomic factors to develop based on the advantages of each region (Figure 1B and Table 1). The significant development in both economy and tourism has considerably transformed LULC for domestic residential areas, accommodation facilities, tourist attractions, and other infrastructures [41]. These transformations have caused significant habitat fragmentation and degradation. Moreover, the island also receives approximately 5–6 million visitors annually (2023). Forecasts indicate that while Phu Quoc’s tourism economy is expected to continue growing in the future, it faces several challenges, including environmental pollution, uneven investment, and a lack of diverse services that fail to fully align with the island’s requirements [13,39,42].

2.2. Landsat Satellite Images and Processing

The Landsat satellite programme, initiated in 1972, is the longest-running earth observation initiative, covering over five decades of continuous time series data that support LULCC and earth system monitoring [43]. Therefore, Landsat imagery is frequently one of the first data options for the long-term monitoring of environments and human activities. This study used Landsat Collection 2 (Level 2) data for urban development and environmental monitoring. Collection 2 data have been available since 2021, which improve data quality and consistency using upgraded software, algorithms, and additional auxiliary data (e.g., Sentinel-2 Global Reflectance Image–GRI, NASADEM, and Ground Control Points–GCPs). Level 2 data are surface reflectance unitless, measuring the fraction between incoming solar radiation and reflected energy from the Earth’s surfaces back to the sensor. The surface reflectance values are generated to limit scattering and absorbing effects, thereby characterising the actual Earth’s surface features and limiting atmospheric effects. The level 2 data also generate surface temperature (degree Kelvin), which is useful for energy balance, vegetation health, and urban thermal environment studies. This study utilised Landsat 7 (ETM), Landsat 8 (OLI/TIRS), and Landsat 9 (OLI2/TIRS2) for LULCC monitoring in 2003, 2013, and 2023, respectively, corresponding to the island’s policy transition milestones.
Due to its archipelago nature and tropical monsoon climate, satellite images taken in this region often have high cloud cover, particularly during the rainy season. Therefore, we applied filter rules to select quality scenes. More specifically, we only collected images within a three-year period around the target year, captured from January to May with less than 50% of the cloud cover rate to limit atmospheric effects. It returned a collection of 26, 29, and 36 single images for Landsat 7, Landsat 8, and Landsat 9, respectively. The band quality bitmask was subsequently used to create a cloud mask for removing cloud pixels. A median operation then composited the collections to generate a single image for each period, including three visible bands (RGB), near-infrared (NIR), two bands of shortwave infrared (SWIRs), and thermal infrared (TIR) bands.
Satellite images are significantly affected by terrain, particularly in the high mountainous regions of the northeast and eastern parts of the island. To address these terrain-induced distortions, we applied the C-model to correct for terrain effects based on the sun azimuth, sun elevation, and digital elevation model (DEM) from ASTER data [44]. The sun azimuth and sun elevation were acquired from metadata information.

2.3. Land Use, Land Cover Classification

Land use, land cover (LULC) maps are essential for assessing LULC changes. These LULC maps were classified by Landsat optical bands and spectral indices using random forest classifier (RF)—a machine learning-based algorithm widely applied to LULC classification with high accuracy [45]. Although optical bands reflect surface properties, spectral indices can also add critical information to more accurately identify LULC features on satellite images [46]. This study utilised seven spectral indices to characterise different LULC properties, including NDVI (Normalised Difference Vegetation Index), MSAVI (Modified Soil Adjusted Vegetation Index), EVI (Enhanced Vegetation Index), NDMI (Normalised Difference Moisture Index), Modified Bare-soil Index (MBI), NDBI (Normalised Difference Built-up Index), and UI (Urban Index) (Equations (1)–(7)) [47,48,49,50,51,52,53].
N D V I = N I R R e d N I R + R e d
M S A V I = 2 N I R + 1 ( 2 N I R + 1 ) 2 8 ( N I R R e d ) 2
E V I = 2.5 ( N I R R e d ) N I R + 6 R e d 7.5 B l u e + 1
N D M I = N I R S W I R 1 N I R + S W I R 1
M B I = 0.5 + ( S W I R 1 S W I R 2 N I R ) ( S W I R 1 + S W I R 2 + N I R )
N D B I = S W I R 1 N I R S W I R 1 + N I R
U I = S W I R 2 N I R S W I R 2 + N I R
where Red and Blue are the red wavelength (0.63–0.69 µm) and blue (0.45–0.52 µm) wavelength in the visible spectrum; NIR is the near-infrared wavelength (0.77–0.90 µm); and SWIR1 and SWIR2 are shortwave infrared wavelengths in 1.55–1.75 µm and 2.09–2.35 µm, respectively.
Values of optical bands and spectral indices were extracted at reference ground truth points, which were randomly selected using a sampling selection framework that integrated image visualisation, very high-resolution images, and Google Earth images. The extracted data were then used to train (70%) and validate (30%) the random forest model for LULC mapping. A random forest classifier requires two main parameters: mtry (number of variables for each split) and ntree (number of trees for classification). The first parameter was automatically tuned using tuneRF function to figure out the best mtry parameter for classification [54]. The ntree parameter was set based on the empirical literature, recommending a sufficiently large value (ntree = 500) to minimise overfitting and improve model robustness. The trained model was adopted to classify a six-class LULC map for each target year. The six LULC categories include farmland (FARM), forest/woodland (FOR), urban and construction lands (URBN), bare land (BAR), wetland (WET), and water bodies (WAT) (Table 2). These classified maps were subsequently evaluated using the remaining 30% of data from ground truth points to estimate overall accuracy through confusion matrices, which should achieve a minimum level of 75% to ensure adequate quality for further LULCC and related analysis.

2.4. Assessment of Land Use and Land Cover Changes and Urban Expansion

Land use and land cover changes (LULCCs) were analysed using a conversion matrix to identify the prominent dynamics for each period. In addition to the overall analysis of the entire study area, an assessment was also conducted for the 12 development regions specified in Section 2.1, rather than relying on administrative districts. The use of development regions allows for a more focused analysis, as nearly all administrative districts are dominated by extensive forest and woodland areas, which may overshadow the impacts of other LULCC processes, such as urban expansion and agricultural intensification. Urban expansion was evaluated by two metrics: urban density and the urban expansion rate (UER, Equation (8)). Urban density refers to the proportion of the urban and construction area relative and the total area, which highlights the degree of urban intensification and agglomeration [55,56]. Meanwhile, the UER reflects the speed of urban development over a given period [57]. A higher UER indicates more rapid urbanisation.
U E R = S t 2 S t 1 1 / T 1 × 100 %
where UER is the urban expansion rate (%), and St1 and St2 are urban and construction areas at the beginning and end of period T.

2.5. Land Surface Temperature Retrieval and Analysis

Land surface temperature (LST) was adopted as a key indicator to assess thermal environment changes because LST provides absolute values to better reflect the thermal environment compared to other relative indicators (e.g., Urban Heat Islands and Urban Thermal Field Variance Index). Although a single cloud-free scene of LST is a widely used method in urban heat studies, it introduces uncertainties when comparing LST between different years. This is because the LST on the observed date can be significantly reduced by prior rainfall events, which might remarkably reduce the measured LST. To overcome this potential uncertainty and high cloud cover, an annual aggregation of the thermal infrared band (TIR) from all high-quality scenes was adopted at each target year for thermal environment analysis in the dry season. More specifically, LST was derived using the thermal infrared bands Band 6L (Low-gain, 10.40–12.50 μm) from Landsat 7 imagery and Band 10 (TIR1, 10.6–11.19 μm) from Landsat 8 and 9 imageries. The brightness temperature (TB) estimated from thermal bands was calibrated using land emissivity (ε), obtained from the Normalised Difference Vegetation Index (NDVI, Equation (1)). The detailed procedures of LST estimation are described in [58]. It should be noted that there are potential invalid pixels on single LST images, which were removed before being used for further analysis. LST spatial data at three target years (2003, 2013, and 2023) was then collated at each ten-year period to estimate LST difference at each specific location and figure out whether or not there was thermal deterioration along with LULCCs.

2.6. Habitat Quality Modelling

Habitat provision is a crucial regulating ecosystem service. Although regulating services receive less attention than other categories because of indirect values, they play a vital role in maintaining the flow of ecosystem services by connecting the supply and demand sides [59]. An ecosystem of high habitat quality provides favourable conditions for organisms to survive, grow, and perform their ecological functions effectively. The InVEST (Integrated Valuation of Ecosystem Services and Tradeoffs) Habitat Quality Model (HQM) enables the quantification of relative habitat quality based on human interventions, particularly LULCCs and other pressures. It was selected for this study due to its ability to effectively assess the impacts of human activities on ecosystems, especially in data-limited island contexts like Phu Quoc. The resulting habitat quality index (HQI) is a continuous value ranging from 0 to 1, where higher values indicate fewer impacts of human activities and land use intensity. An ecosystem with habitat quality approaching one (1.0) means that this ecosystem is of high quality and more intact. In the InVEST-HQM, the habitat quality for a specific raster grid is calculated by Equation (9) below [60]:
Q x j = H j 1 D x j z D x j z + k z       w i t h       Q x j 0 , 1
where Hj is the habitat suitability of habitat j, Dxj is the impact of habitat degradation on habitat j caused by the threat source contained in the grid x, z is the default constant (z = 2.5), and k is the half-saturation constant.
More specifically, the impacts of habitat degradation induced by the threat source (Dxj) on habitat j in the grid x is estimated by Equation (10) [60].
D x j = r = 1 R y = 1 Y r w r r = 1 R w r r y i r x y β x S j r
i r x y = 1 d x y d r , m a x ,     i f   l i n e a r   d e c a y
i r x y = e x p 2.99 d r , m a x d x y ,     i f   e x p o n e n t i a l   d e c a y
where R is the number of threats, wr is the weight of threat r, ry is the number of threats in grid y, βx is the accessibility of raster x, and Sjr is the sensitivity of land cover of habitat j to threat r. The distance decay function (irxy) presents impacts of threat r in grid cell y on habitat grid cell x, quantified by two parameters of dxy (linear distance between n grid cells x and y) and dr,max (maximum effective distance of threat r). The linear and exponential decay effects are characterised by Equations (11a) and (11b), respectively [60].
The InVEST-HQM uses LULC data as the primary data source to characterise human interventions affecting habitat changes. An understanding of habitat threats is also necessary for quantifying habitat quality. This study identifies five threats based on a literature review of coastal areas and islands, including major road networks, urban and construction lands, farmland, and bare soil. Four out of five threats were extracted from LULC maps and encoded as binary values (0/1), with 0 being the background objects. Road networks consisting of primary, secondary, and tertiary roads were sourced from the Open Street Map for this analysis. In addition to the identified threats, the HQM requires a set of parameters to guide model calculations. These parameters include the maximum effect distance, threat weights, decay functions, and a matrix that defines the relative sensitivity between threats and land use habitats. Here, we combined the InVEST-HQM user guidelines and a comprehensive literature review on HQM for comparable islands and coastal regions to determine appropriate threats and their corresponding parameters (Table 3 and Table 4) [61,62,63,64].
The simulated relative habitat quality raster outputs were reclassified into five categories, each with a value range of 0.2, corresponding to poor quality (0–0.2), fair quality (0.2–0.4), moderate quality (0.4–0.6), good quality (0.6–0.8), and excellent quality (0.8–1.0) [65]. The habitat quality dynamics were determined by comparing habitat quality between two years, resulting in three possible outcomes: no change (−0.1 < ΔHQI < 0.1), degradation (ΔHQI ≤ −0.1), and improvement (ΔHQI ≥ 0.1) [66].

2.7. Analysis of Driving Forces Behind Habitat and Thermal Environment Changes

We investigated the impact of urban development, LULCCs, and population growth on habitat quality and LST changes. Urban development was quantified by the concentration of urban and construction lands (represented by urban density, unit: %) and the urban expansion rate (UER, %). However, in certain areas, the dominant LULCC processes may involve factors other than urban expansion, such as agricultural intensification and reforestation. In such cases, only urban development parameters may not fully capture the extent of these changes. To address this, we estimated a composite indicator for all land use types—land use intensity (LUI), which incorporated contributions from all land use categories (Equation (12)).
L U I = 100 × i = 1 n A i P i A
where LUI is land use intensity (unitless), Ai and A are area of land use type i and total area, and n is the number of land use classes. Pi is the land use intensity coefficient of land use i, which receives values of 0.11, 0.55, 0.94, 0.12, and 0.06 for forest, farmland, urban and construction lands, water bodies, and unused land/barren land, respectively [65].
The impact of population growth on habitat and LST changes was considered through changes in population density (people/km2). Population data were acquired from WorldPop data and used to estimate trends within the designated development zones.
These four abovementioned factors served as independent variables, and their impacts on habitat and LST changes (dependent variables) were analysed using linear regression. These effects were considered for each ten-year interval and the entire assessment period, presenting short-term and long-term periods, respectively, to explore how the driving factors influence habitat and LST changes. The results were evaluated using the coefficient of determination (R2) with higher R2 values indicating greater influence of the independent variable on the dependent variable.

3. Results

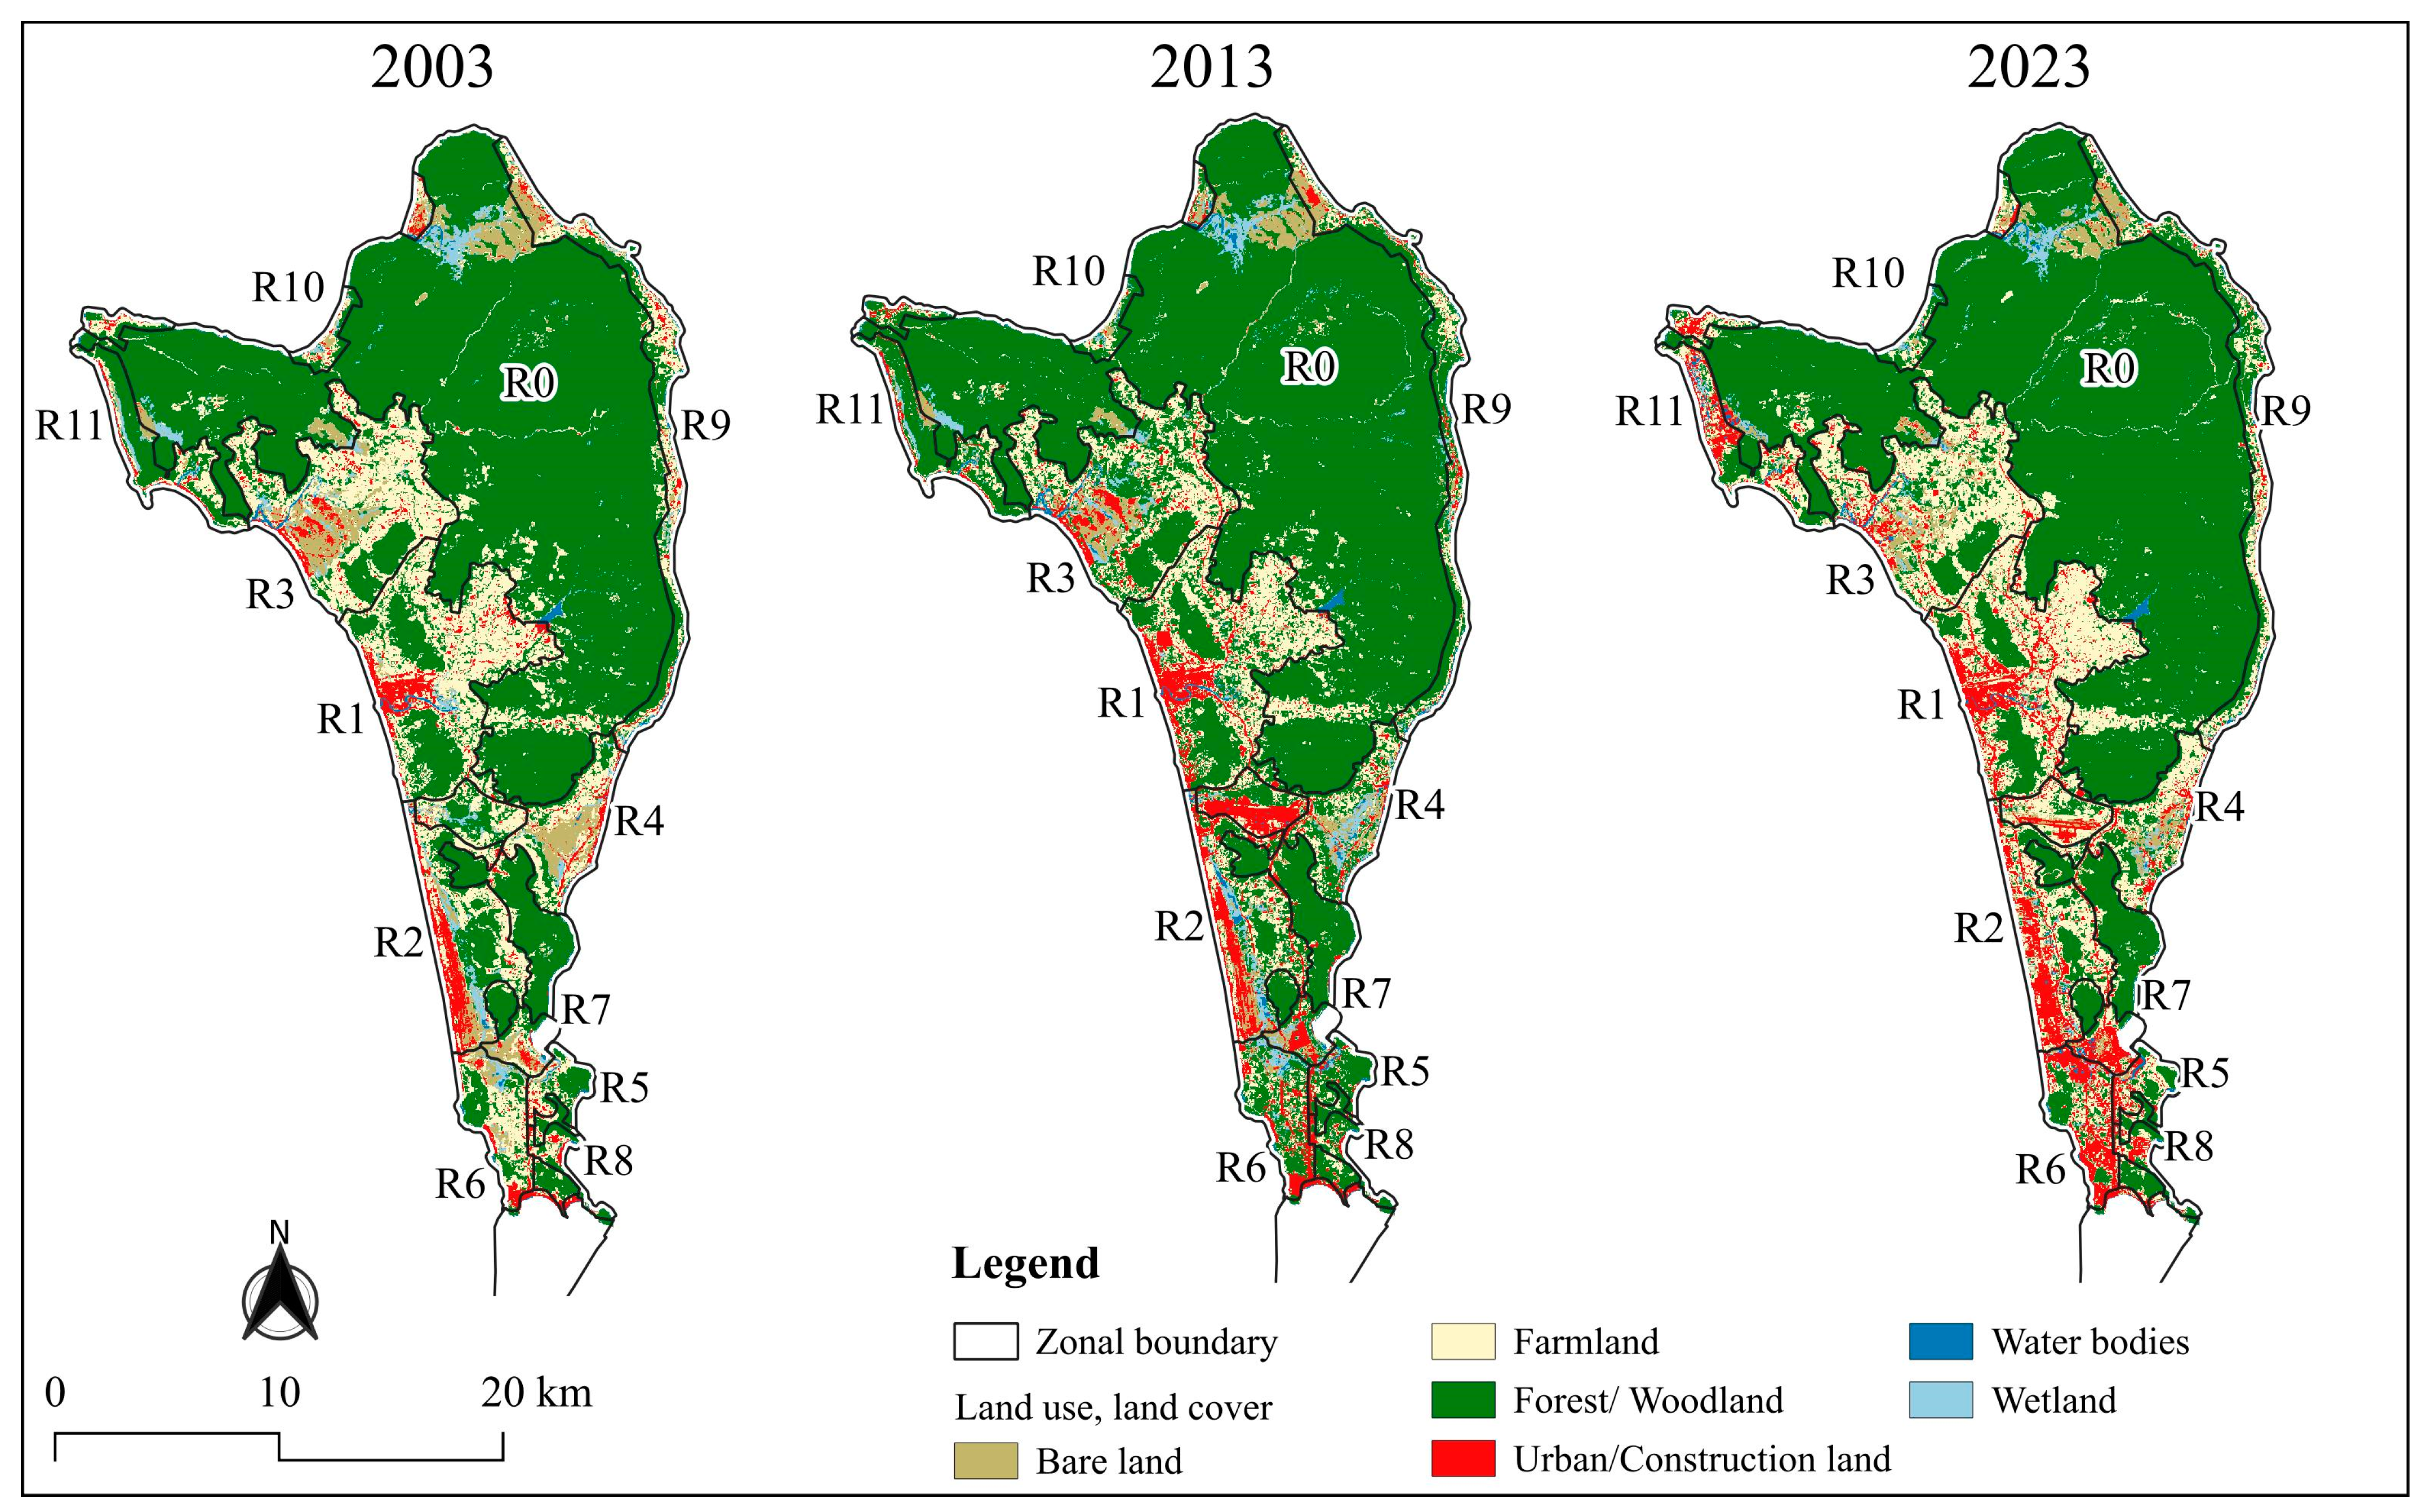
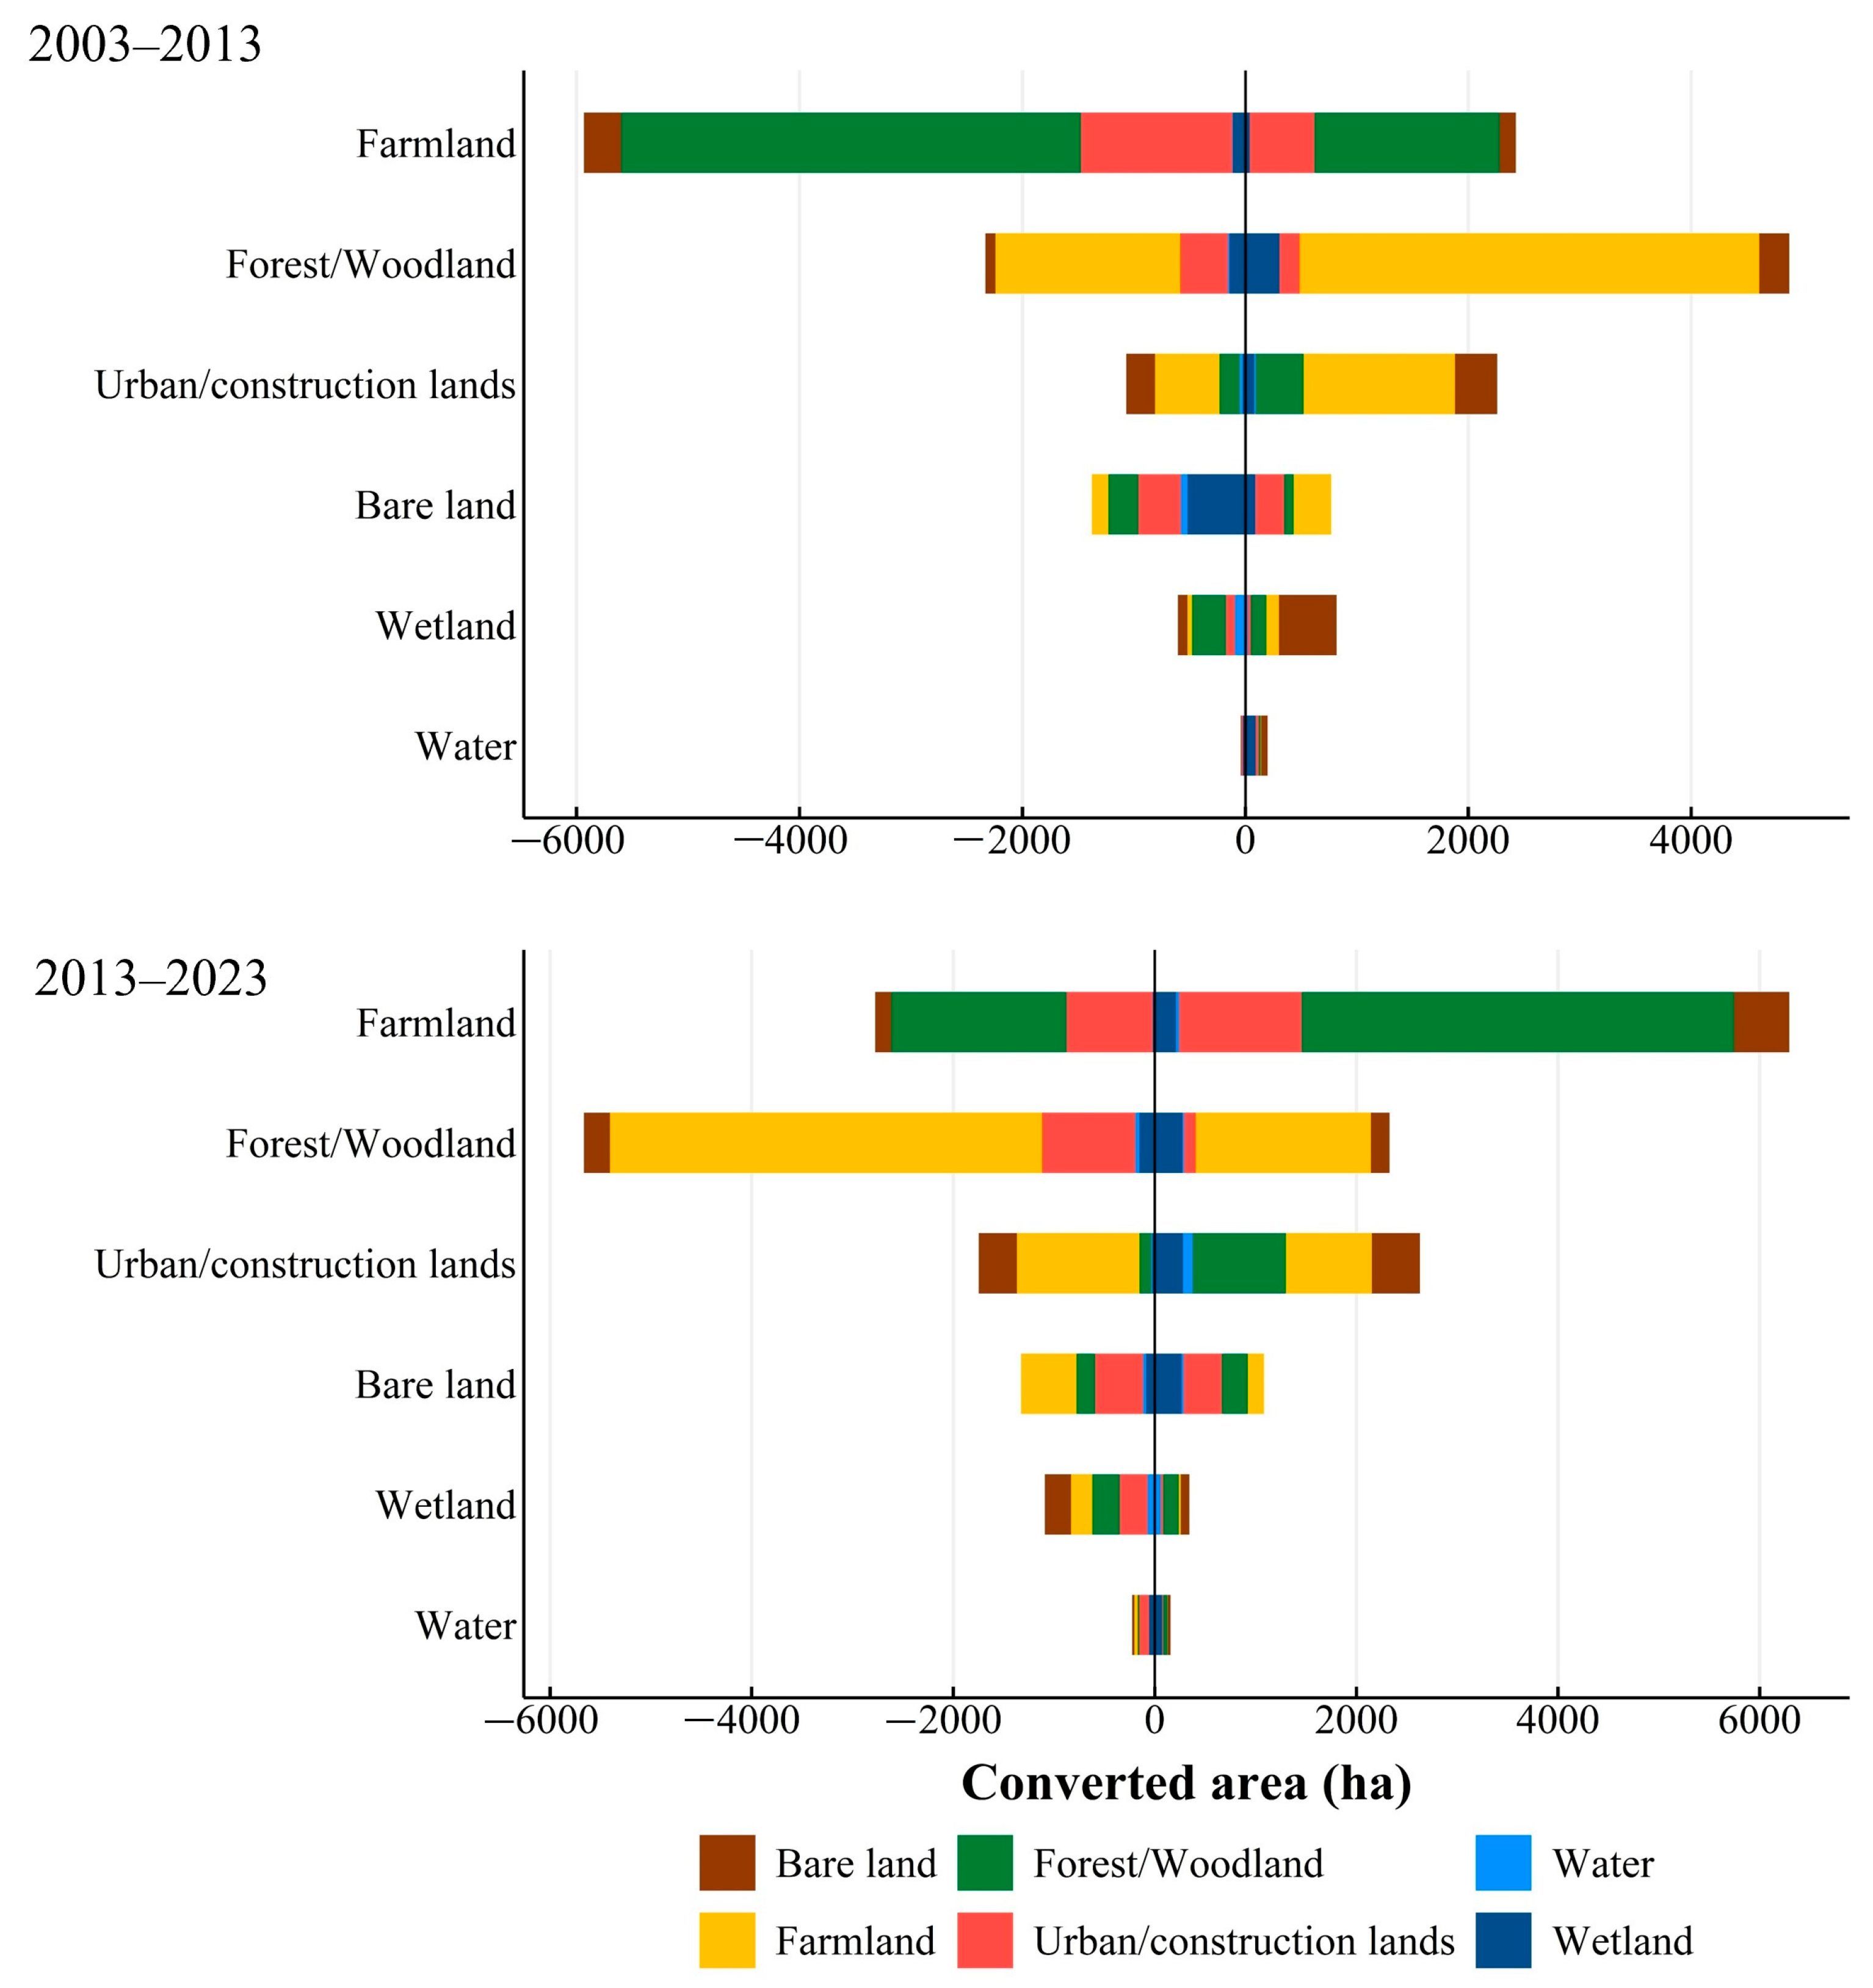
3.1. Land Use and Land Cover Changes

The LULC maps classified from optical bands and spectral indices achieved consistently high accuracy for all target years (Figure 2). The accuracy of LULC maps reaches 99.18%, 98.93%, and 99.16% in 2003, 2013, and 2023, respectively. More explicitly, classification accuracy is mainly contributed by NIR, MSAVI, SWIR2, and SWIR1. The highest decreased accuracy constituted by each individual contributor can be obtained at 30–45%.
The LULC maps depict the spatial distribution of six LULC categories, with forest and woodland dominating (approximately 65–71%). These forests are primarily located in the north and northeast conservation zones (R0), which account for nearly 80% of total forest and woodland areas. The total forest and woodland areas range from 36.6 to 40 thousand hectares, varying within the period. About one-fifth of the total area was occupied by farmland, making it the second-largest LULC category. Around 74–79% of these farmlands were located in zone R0 and the western plains (R1–R3), which serve as transitional areas between forest/woodland and artificial land use. Urban and construction lands were mainly concentrated in the west and southwest plains, specifically within zones R1–R8. Notably, the coastal west urban strip in zones R1–R3 and R6 accounted for 62–65% of the total identified urban and construction areas, with zone R1 alone accounting for approximately a quarter of the total urban and construction areas.
The transitional diagrams in Figure 3 highlight that LULCCs were more dynamic during the period of 2013–2023 compared to earlier years. In the period 2003–2013, approximately 20% of the total area (11,356.7 ha) underwent transitions, primarily involving the conversion from forest/woodland to farmland. As part of reforestation efforts and plantation expansion, around 4122.5 ha of farmland was converted to forest and woodland, while 1659 ha of forest and woodland were converted to farmland. During this period, urbanisation accounted for 20% of the total converted areas. The most notable trend was the conversion of farmland to urban/construction lands (1358.2 ha), forest/woodland to urban/construction lands (428.5 ha), and bare land to urban/construction lands (380.2 ha).
A slightly more dynamic transition is seen during the period 2013–2023, involving 12,830.3 ha (22.7% of total areas). This period was marked by significant deforestation for agricultural purposes, amounting to 4287.3 ha (32.24%), and rapid urban expansion, which increased by 2629.6 ha. Specifically, the expansion of urban and construction lands developed at the expense of forest/woodland (35.2%), farmland (32.4%), and bare land (18.1%). The LULCCs appear to be continuing, as the transition to bare land—a transitional LULC category preceding construction activities and urban development—accounts for a significant proportion of converted land, mainly from wetland (262 ha), forest/woodland (257.4 ha), and farmland (161.7 ha).

3.2. Urban Expansion

Our results show that urban development, specified as the expansion of built-up and construction lands, occurred with an average UER of approximately 6.28% across the entire island from 2003 to 2023. However, urban development in the first period was significantly higher than in the later period, with a UER of 4.03% compared to 2.16%. The rapid urban expansion compared to the overall trend in the first period was concentrated in southern zones (R5–R7), with a UER about 4.91–9.41%. It was followed by relatively high development in the central urban zone R1 (UER = 3.96%). The fast urban expansion in the southern zones persisted into the later period, characterised by a significantly higher UER than that in the first period, i.e., UERR5 = 6.48% and UERR6 = 8.02%. It even expanded the trend to zone R8 (UER = 5.54%). The urban development in the city centre (R1) has remained relatively stable at a rate of 2.28%. This expansion has shown a tendency to spread into an adjacent zone of R2 with a corresponding rate of UER = 1.82%. In addition to central and southern development, this period also encountered rapid urban development in the northern zones of R10 (UER = 5.18%) and R11 (UER = 13.89%). It should be noted that, in addition to occurring in the urban planned zones, urban development also emerged outside the urban planned zone (R0), especially higher in the first period. This unplanned expansion poses potential negative impacts on the ecosystem and ecological environment.

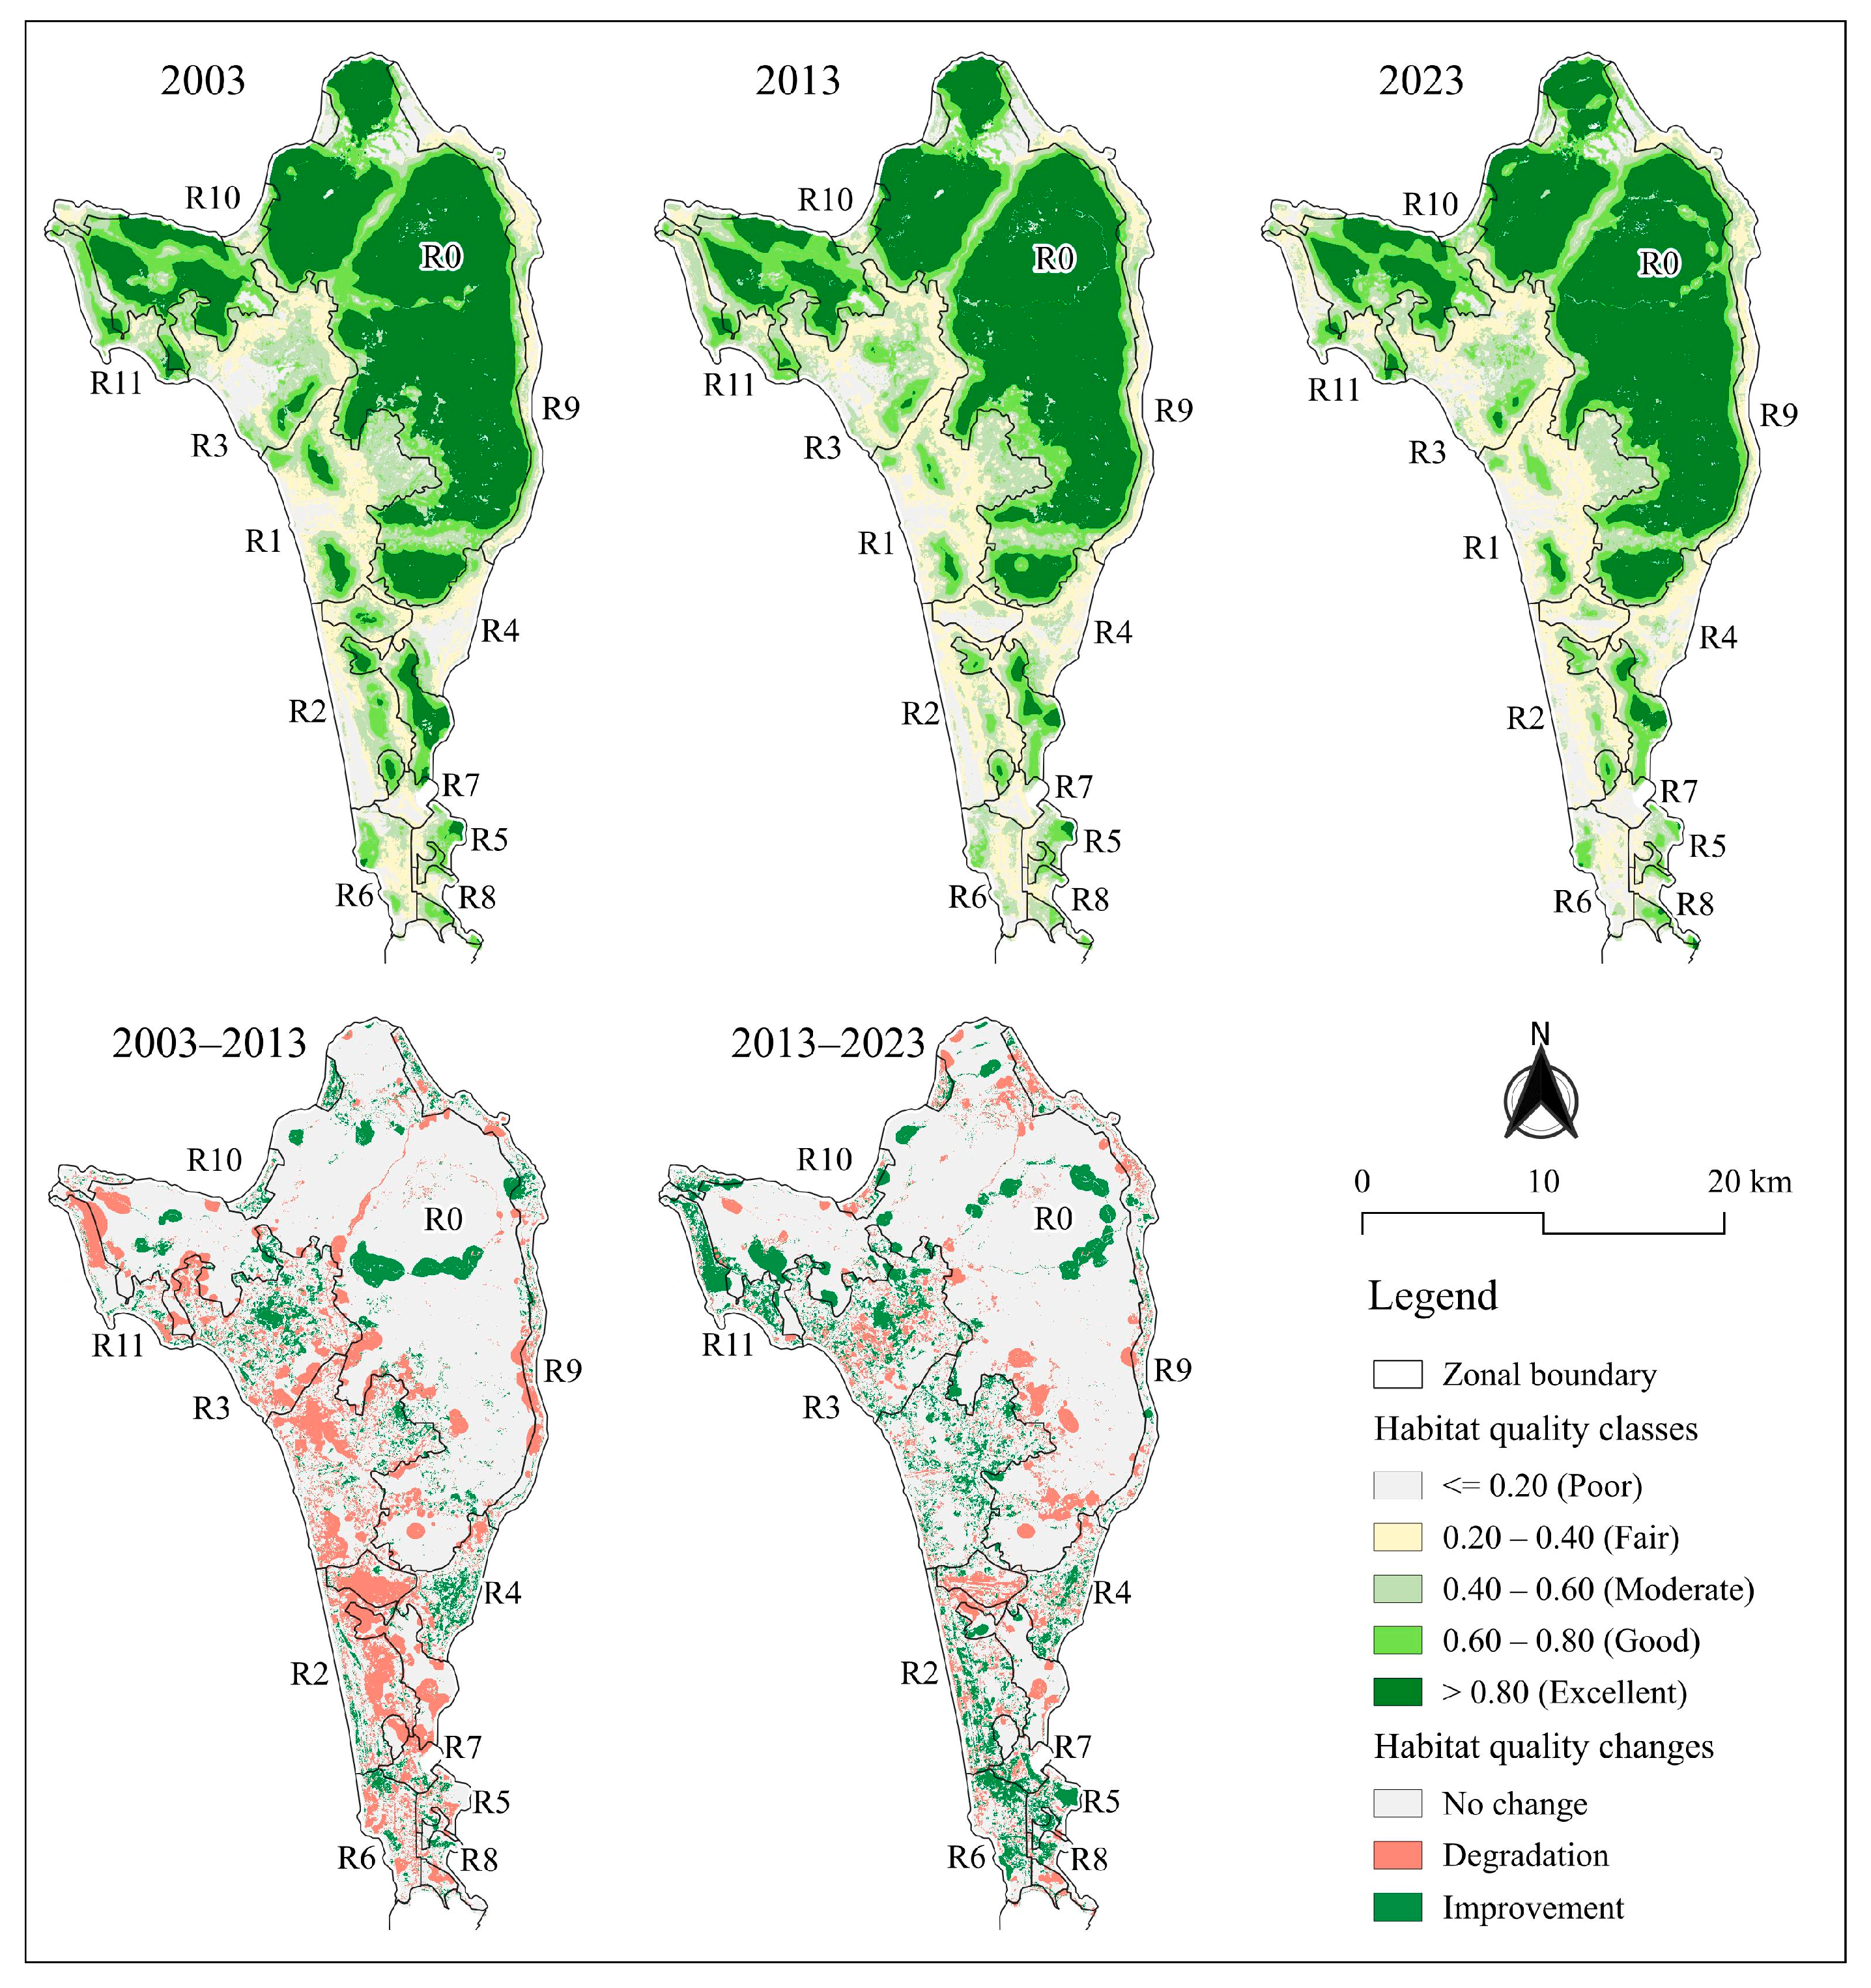
3.3. Habitat Quality Degradation

The rapid urban expansion described above has had profound effects on habitat quality. The simulated habitat quality from 2003 to 2023 is seen in Figure 4, which categorises habitat quality into five classes ranging from poor to excellent quality. The habitat quality distribution aligns closely with LULC patterns, with lower quality levels concentrated along the west coast and southern areas. By contrast, excellent habitat quality is predominantly found in the northern and northeastern regions, which are characterised by forest and woodland. The findings indicate that while habitat quality on the island has remained relatively good, it has gradually declined, dropping from 0.639 in 2003 to 0.610 in 2013, and further to 0.603 in 2023, marking an overall decrease of 5.6%. All development zones have a fair level of habitat quality except for zone R7, which has poor habitat quality (HQ = 0.168) at the end of the period. Degradation was observed across almost all zones to different extents, except for R9 and R10, which showed slight improvement. The most severe degradation was concentrated in three key regions: the southern areas (R5–R7), with zone R7 experiencing a sharp decline of up to 44.2%; the northwest centre of R11, which saw a decrease of 32.8%; and the central urban hubs of R1 and R2, where degradation rates reached approximately 21.5% and 27.7%, respectively.
Over the assessment period, approximately one-quarter of the total area was identified as having variable habitat quality, covering an estimated area from 13,000 to 15,000 ha. Most of these areas showed ecological degradation, 68.25% (2003–2013) and 56.79% (2013–2023). Of these areas, more than a third were concentrated in the urban strips R1–R3. The most severe degradation during the 2003–2013 period occurred in the central urban areas (R1–R2), the northwest urban centre (R11), and the southern urban centre (R7), where habitat quality declined by 30.7% to 37.9%, with an average annual degradation rate ranging from 3.07% to 3.79%. Although the ratio of improved to degraded habitat areas during 2013–2023 showed significant progress compared to the previous period (0.76 versus 0.47), the overall trend across individual zones still indicated a decline in habitat quality. Degradation in the central urban centres was intensified, while it continued at a high rate in the northwest centre (R11), at 4.2% per year. Meanwhile, habitat quality in the southern urban centres experienced a sharp decline, which spread to adjacent zones (R5–R7). The most severe deterioration occurred in R5, with a degradation rate of 4.25% per year.

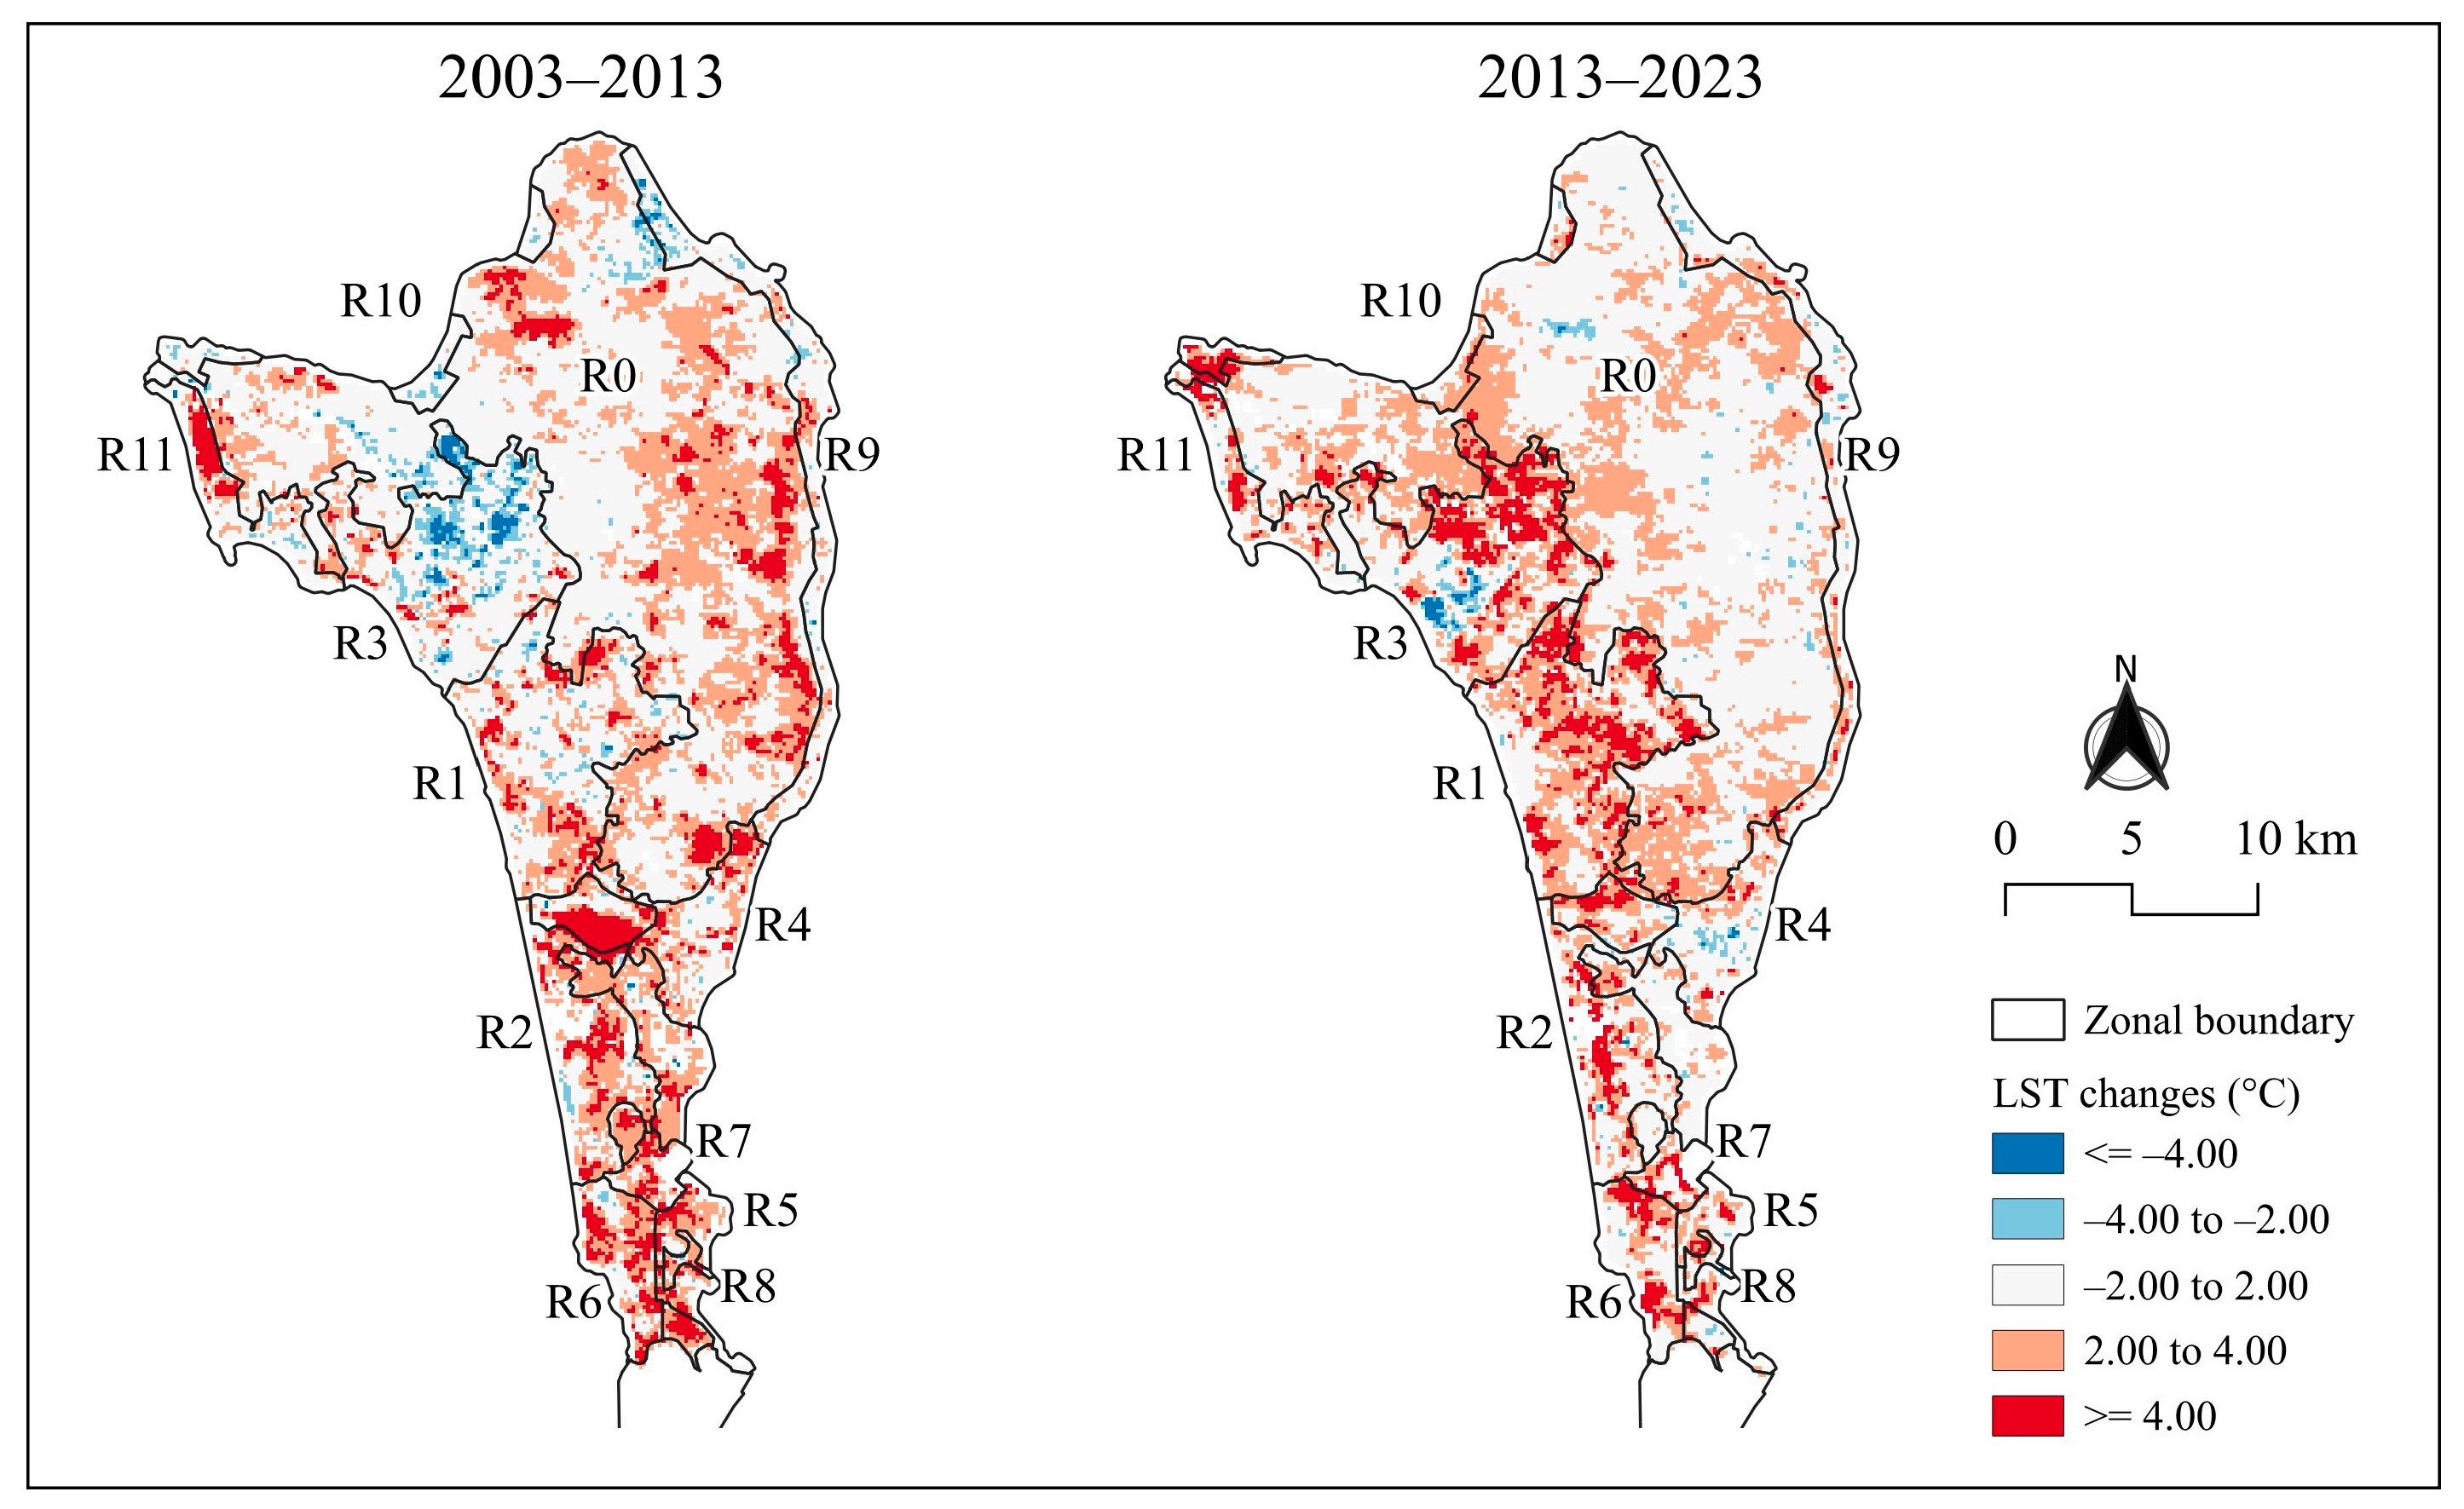
3.4. Changes in Thermal Environment

The thermal environment, as indicated by the land surface temperature (LST), reveals a marked deterioration over the study period. LST increased by 1.58 °C from 2003 to 2013 and by a further 1.72 °C between 2013 and 2023 (Figure 5). The most rapid thermal deterioration during the first period was observed exclusively in the southern urban centres (R5–R8 in An Thoi townlet and southern Duong To commune at R2), where the average temperature increased by approximately 0.3 °C per year. However, the thermal environment in the second period exhibited greater severity compared to the previous one, despite a more stable warming rate (approximately 0.23–0.28 °C per year) across the urban centres. The most significant thermal deterioration during this period was observed in the central urban area (R1, 0.275 °C per year), the southern urban strips (R6–R7, 0.262–0.268 °C per year), and the northern urban regions (R10 and R11, 0.288 °C per year).
More specifically, approximately 20–25% of the total area has experienced significant thermal changes, characterised by an increase in LST over 2 °C. This deterioration was predominantly seen in the eastern and southern urban strips, accounting for 30% of the total area in the first ten-year period, especially in the southern urban centres. This trend persisted in the subsequent period; however, it was marked by emerging thermal deterioration in R10 and significant aggravation in the central urban areas (R1–R3). Notably, in the R3 zone, high and very high levels of thermal deterioration affected 45.8% of the total area between 2013 and 2023.

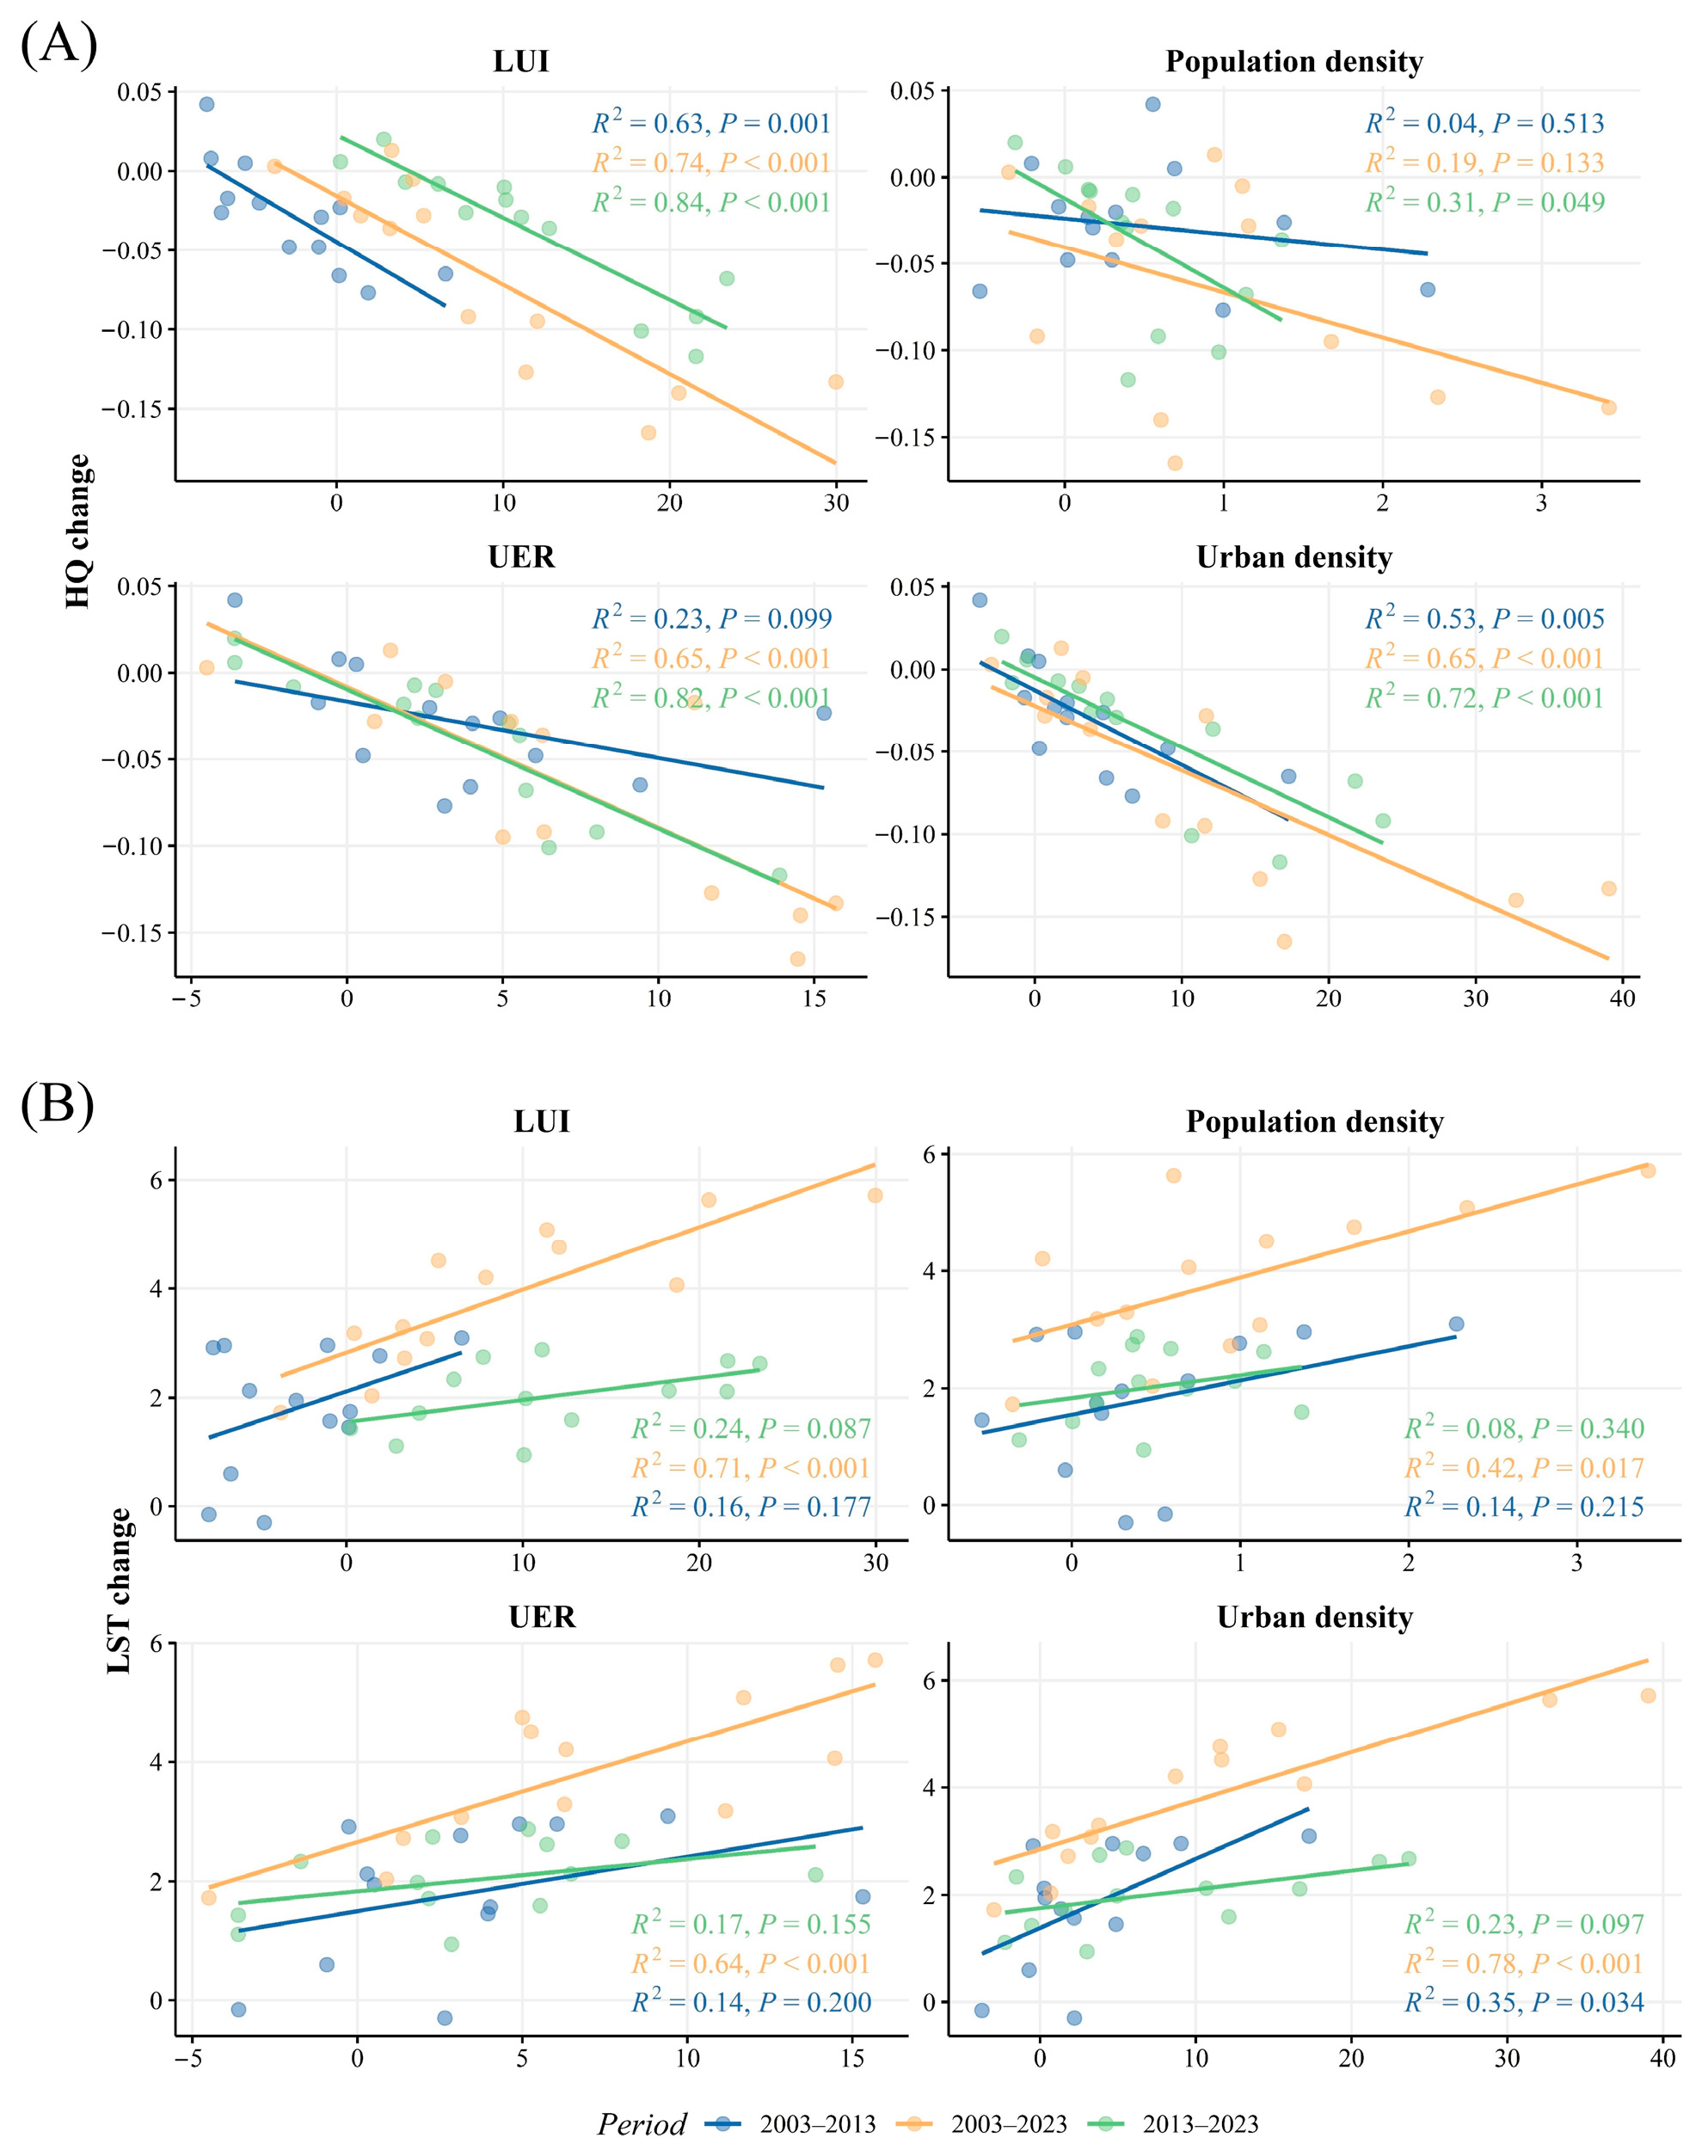
3.5. Key Drivers of Habitat Quality and Thermal Environment Changes

The deterioration in habitat quality and an increase in thermal extremes on the island are driven by LULCC dynamics, urban expansion, and various social elements at different levels (Figure 6). Habitat quality degradation was found to be inversely correlated with LUI, urban density, UER, and population density (Figure 6A). While both LUI and urban density exert significant impacts on habitat quality, the influence of LUI—characterised by changes across multiple LULC categories rather than solely urban expansion—has the most pronounced effect relative to the other factors. The highest determination coefficient of LUI reached for the whole period (2013–2023) is R2 = 0.84 (p < 0.001). Yet population density only shows a modest influence on habitat quality during 2013–2023 (R2 = 0.31, p < 0.05), while it has non-significant effects on other periods. Here, the impacts of driving forces on habitat changes tend to be more sensitive in the immediate and short-term periods. For instance, the higher determination coefficients were identified in the period 2013–2023, which experienced more dynamic LULCC and urban expansion processes than the whole period.
It holds similarities with the increase in LST, as the controlling factors also showed strong relationships with the deterioration of the thermal environment. The intensification of surface temperatures was primarily driven by factors associated with urban development, such as UER and urban density. The pivotal role in temperature regulation belongs to urban density instead of UER, with R2 of 0.78 versus 0.64 in 2003–2023 (p < 0.001). In contrast to habitat quality, the effects of LULCCs and urban expansion on thermal environments are considered to have long-term impacts. Specifically, the R2 coefficients of the whole period returned significantly higher values than those of the individual periods with more statistically significant p-values (Figure 6B).

4. Discussions

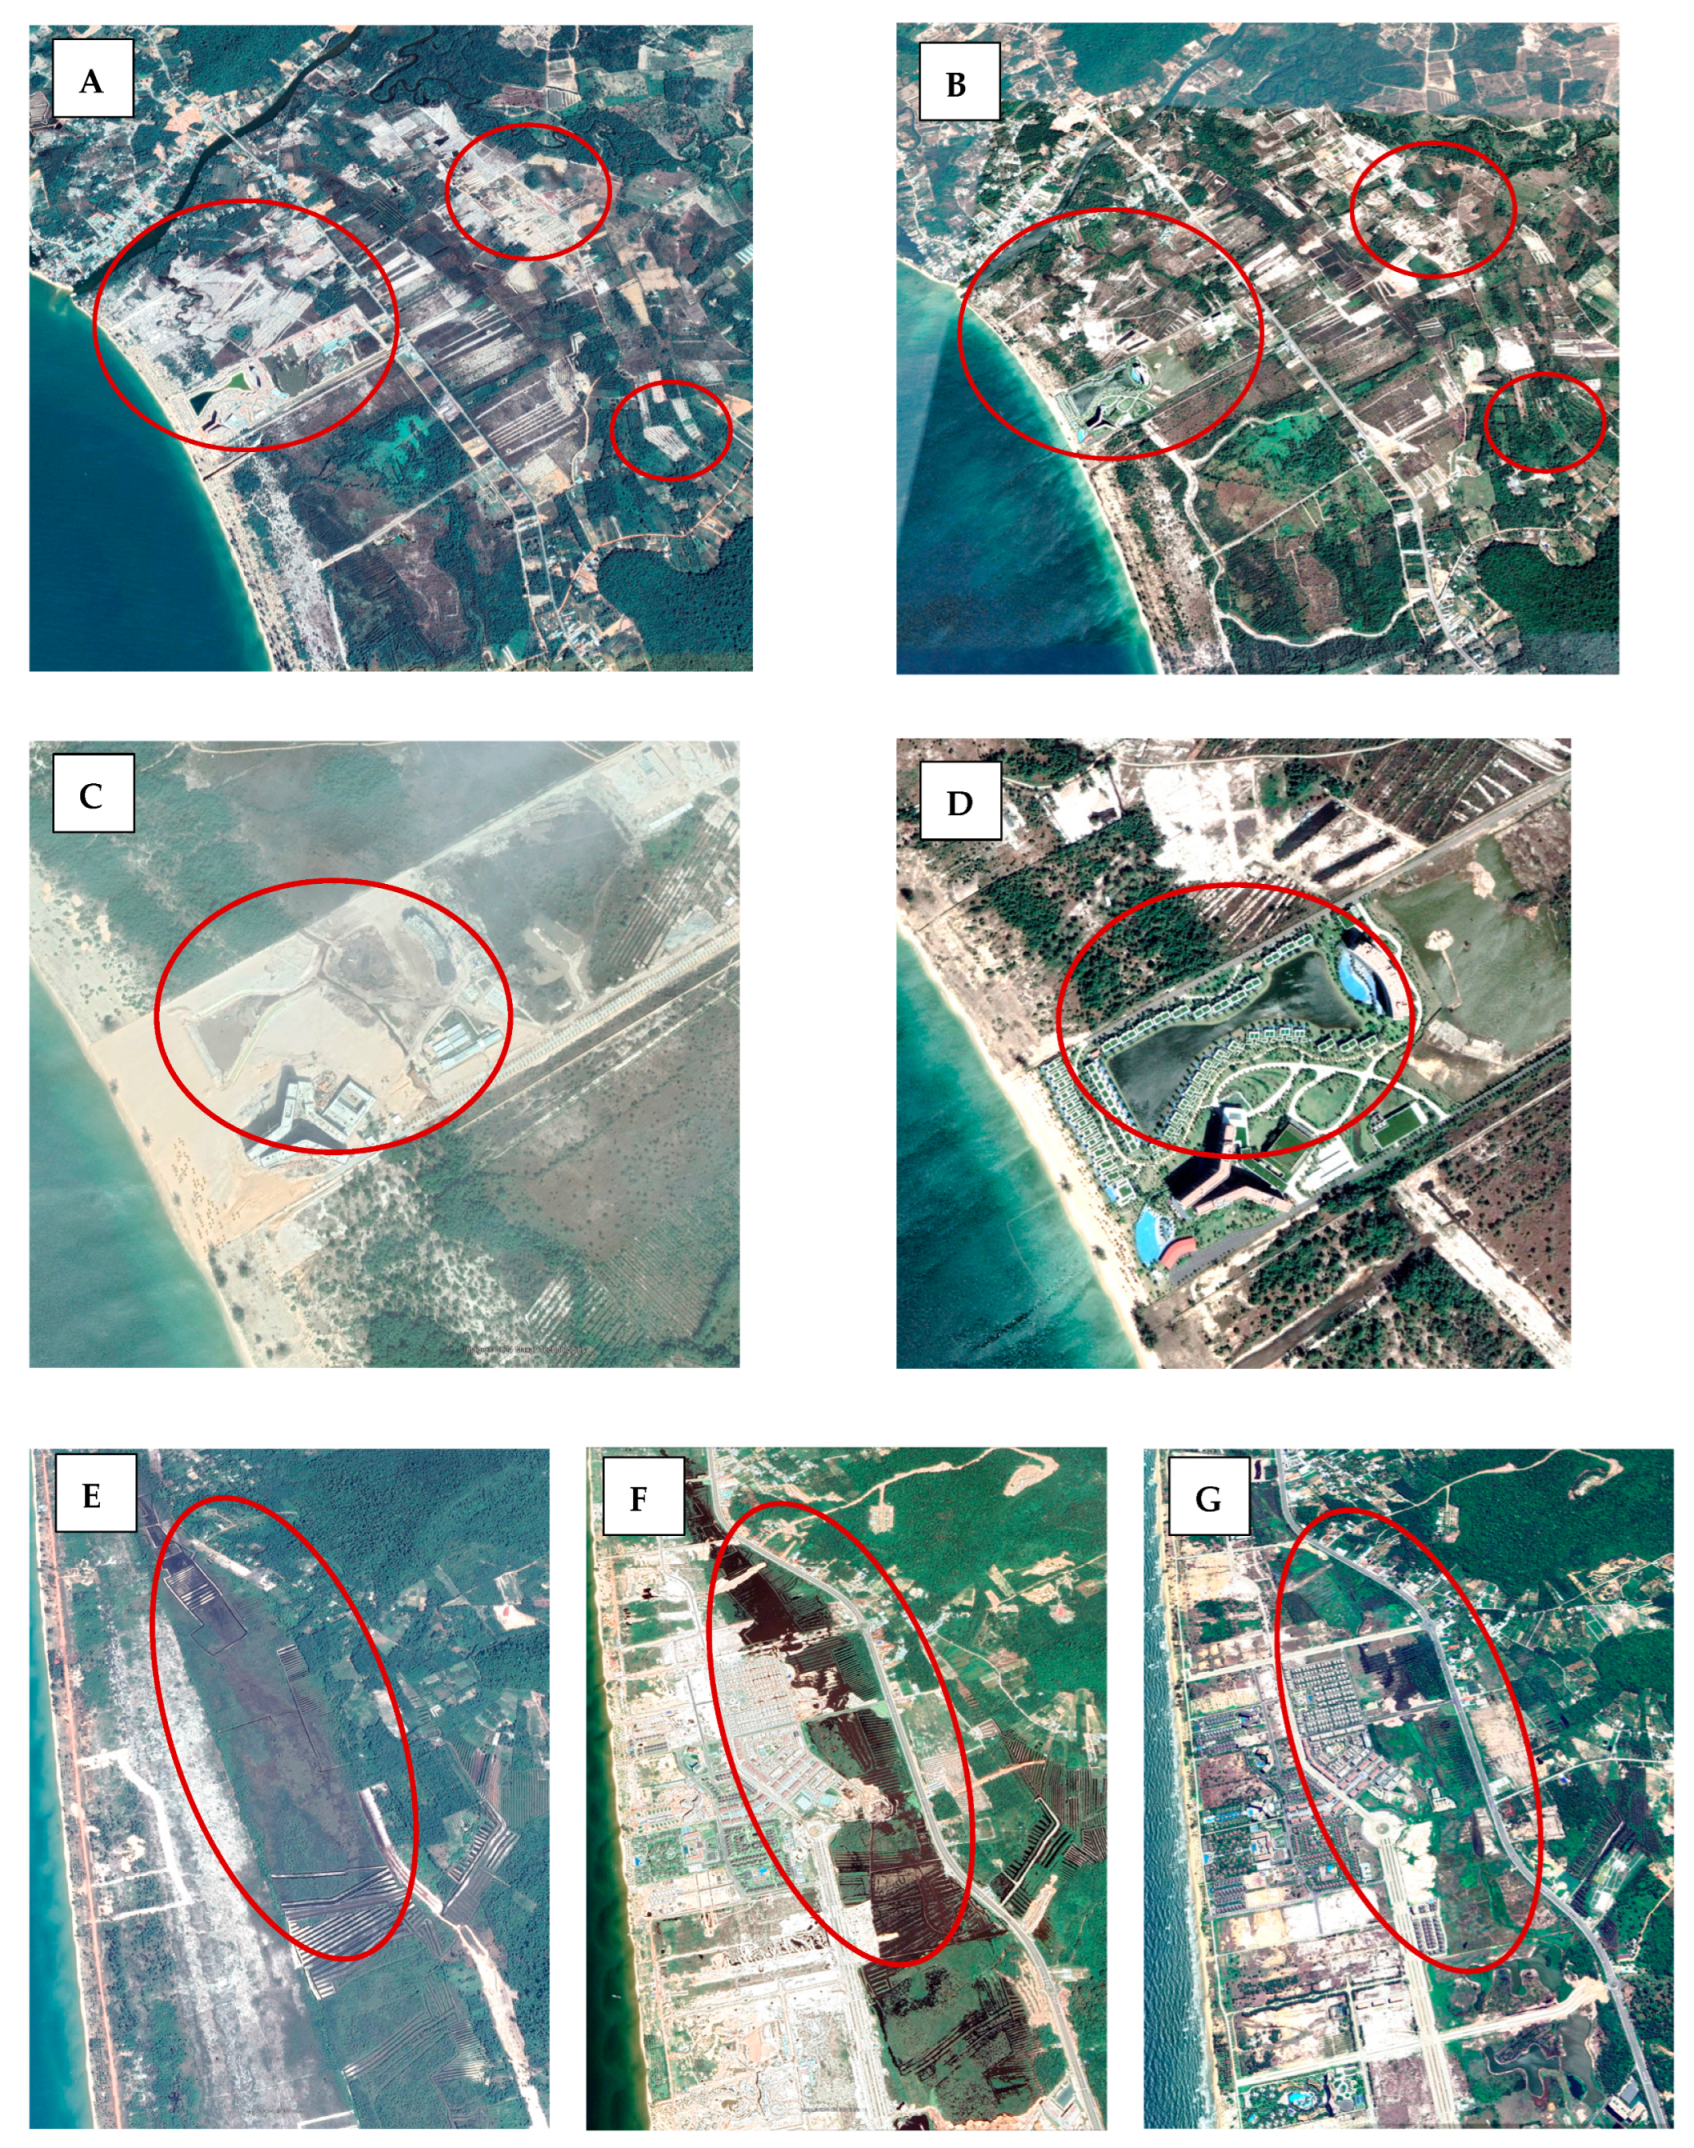
4.1. Characteristics of LULCCs and Urban Expansion in Island City

The isolation of Phu Quoc combined with its limited land availability results in topographical constraints that influence both LULC distribution and LULCCs [8,67]. The mountainous regions are predominantly covered by minimally used forests. Furthermore, the establishment of Phu Quoc National Park in 2001, encompassing approximately 32,000 ha, has been accompanied by active ecological restoration initiatives. As a result, reforestation was the most prominent LULCC process in the first period that also contributed to improving the thermal environment of the eastern R0 forest (Figure 5). However, the island has experienced relatively dynamic LULCCs, with approximately 20% of the total area affected, mostly in the urban planned zones R1–R11 rather than R0. Notably, LULCCs on the west coast were significantly higher than in other areas, even for urban expansion or agricultural intensification.
There was a high rate of interconversions between farmland and forest land, and urban encroachment on forest land, particularly during the most recent periods (Figure 3). Urban and construction lands were occasionally observed in zone R0, an area not designated for urban development. Additionally, there were interconversions between forest and agricultural lands and urban/construction lands, which emphasises a very dynamic trend of LULCCs in Phu Quoc Island caused by land levelling and regreening in eco-resorts (Appendix A). These trends reflect underlying land management challenges on the island, such as the illegal conversion of forest land for agriculture and construction activities occurring outside designated planning zones. A renowned tourist destination with extensive investment projects, Phu Quoc has become a hotspot for land management violations [68,69,70]. Timely detection and enforcement against such land violations would benefit local authorities in addressing these challenges.
Urban sprawl was predominantly seen concentrated along the west coast. However, clear regional hotspots are evident in three key centres of the central city in Duong Dong townlet, the north centre in Cua Can commune, and the south urban agglomeration in An Thoi townlet. As a developing urban area with narrow land, constraining total new residential areas, development is mainly based on outward extension. This results in urban encroachment onto agricultural and forest lands, which increases the risk of illegal land use conversion and encroachment on public land. Consequently, heightened attention should be given to land management in areas experiencing rapid growth, particularly those adjacent to public forest lands, such as R11, R1, and R5–R7.

4.2. Environmental Degradation and Implications

While the island’s unique ecological environment, shaped by its geographical isolation, provides distinct advantages, it also renders the region more vulnerable to the impacts of rapid development and transformation. Although habitat quality within the core area of R0 has remained stable, other zones experiencing dynamic LULC transformations have seen a decline in habitat quality, accompanied by a rapid deterioration in both ecological conditions and the thermal environment. This degradation is particularly pronounced in buffer zones and key development centres. Maintaining high habitat quality is essential for sustaining ecosystem service flows to provide a wide range of benefits to the island’s residents, including climate regulation, disaster prevention, and water regulation. These services are particularly crucial for an island, where ecological stability directly supports the resilience of both the environment and local communities.
The ecological environment and habitat quality are highly sensitive to human interventions, including LULCCs, urban development, and infrastructure projects. These activities often result in short-term impacts that can significantly affect the ecological balance [8]. Several transportation projects were observed during the first period that induced considerable aggravation in habitat quality. While urban development driven by a significant rise in immigration, tourism, and enhanced regional connectivity is essential, large-scale projects that disrupt ecosystems should be carefully evaluated and constrained to safeguard the already fragile environment, of which only half remains in good condition. Strengthening land management practices is also imperative to limit land conversion, which negatively impacts the ecological environment, particularly in buffer zones and transitional areas between urban–forest and farmland–forest interfaces. Additionally, maintaining and improving habitat quality is a key strategy for promoting and developing sustainable tourism.
Our results showed that the thermal environment has dramatically deteriorated, with the greatest changes along the city chains on the west coast (Figure 5). Although the urban degree on the island is relatively small and the impacts of LULC transformations on the thermal environment tend to be long-term effects, deterioration has already been observed, coinciding with changes in habitat quality. Rapid urban expansion and compactness gradually increased in mature urban centres, which are expected to exacerbate these negative impacts in the future. These areas have a highly concentrated population, and they are attractive tourist destinations (Figure 7). The deterioration of the thermal environment can affect overall tourism and human health, especially in the summer when the negative impacts are multiplied. Extreme heat can deter visitors and degrade the ecosystems that attract tourists [71,72]. Therefore, in addition to focusing on tourism development and functional areas, planning needs to have a long-term vision that integrates the changes in the thermal environment into spatial planning. This integration is necessary to limit the long-term impact of urbanisation on thermal deterioration and urban heat islands. Local tourism should plan to establish protocols to address the negative impacts of extreme heat on tourists, ensuring they are well prepared for extreme cases in the future.

4.3. Broader Implications for LULCCs in Island SEZs

Phu Quoc’s transition from a largely undeveloped island to a key SEZ illustrates the challenges of unplanned or poorly regulated urban growth and tourism development. Islands like those in Southeast Asia, the Caribbean, and the Pacific, which rely heavily on tourism and foreign investment, are similarly at risk of environmental degradation due to rapid, unregulated urban expansion. Similar to other island regions such as Hawaii, the Maldives, Bali, Santorini, Seychelles, Boracay, and Mauritius, Phu Quoc’s unique ecosystems are highly vulnerable to environmental degradation driven by urbanisation and tourism expansion [73,74,75]. These islands, often marketed for their natural beauty, face an inherent conflict between preserving ecological integrity and accommodating mass tourism and industrial development [76].
Similar to other fast-growing areas in Vietnam, the outcomes underscore the pressing need for coordinated land use planning and stronger enforcement of environmental regulations in Phu Quoc’s SEZ. Current land management practices, which have allowed for unplanned urban expansion into protected areas, highlight continued gaps in regulatory frameworks [77,78,79]. Moving forward, local authorities must adopt a more proactive approach to controlling urban sprawl, ensuring that urban development is concentrated within planned zones, while enforcing penalties for illegal land use conversion. Moreover, adopting approaches that integrate ecological considerations—such as the preservation of buffer zones, coastal ecosystems, and green spaces into urban planning—will be critical for balancing the island’s economic and environmental priorities.

4.4. Future Directions

In contrast to previous studies, this research applied the InVEST Habitat Quality Model to a data-limited island context, with specific parameterizations tailored to Phu Quoc. By integrating multi-temporal analysis of LULC changes with assessments of habitat degradation and thermal environment impacts, this study provides novel insights into the compounded effects of tourism-driven urbanisation. These findings establish a foundation for understanding the environmental consequences of LULCCs on Phu Quoc. However, further research is essential to strengthen both theoretical frameworks and practical applications.
Future studies should aim to develop specific theories addressing tourism-driven urbanisation on islands, particularly focusing on the interplay between rapid urban growth, environmental degradation, and economic development. Expanding the temporal scope of analysis would enable the exploration of ecosystem resilience to urbanisation and climate change over extended time scales. Additionally, integrating socio-ecological systems into future research could illuminate the impacts of habitat changes on community livelihoods, governance, and tourism dynamics.
Comparative studies across SEZs in different regions could also identify shared challenges and context-specific strategies, contributing to the development of universal principles for sustainable island development. Moreover, policy-oriented research should be prioritised to translate scientific findings into actionable frameworks, with a particular emphasis on adaptive governance and the implementation of nature-based solutions.

5. Conclusions and Outlook

This study offers a comprehensive analysis of the environmental impacts of rapid urban development on Phu Quoc Island, with a particular focus on LULCCs and habitat degradation between 2003 and 2023. The results show a significant transformation of natural ecosystems, driven by SEZ-related urbanisation, tourism, and infrastructure development. This study provides critical evidence of how tourism driven urbanisation exacerbates habitat degradation and thermal environment changes, contributing to the limited body of knowledge on sustainable development in island contexts. The findings highlight that large-scale urban expansion, particularly in the southern and central regions of the island, has resulted in substantial deforestation, farmland conversion, and a reduction in habitat quality, with a 5.6% overall decline. Additionally, the intensification of the thermal environment, marked by a significant rise in LST, underscores the long-term implications of unregulated urban growth for the island’s ecological stability.
The spatial patterns of degradation reveal the vulnerability of coastal and forested areas to human-induced disturbances, especially in unplanned development zones. This study demonstrates the importance of integrated land use planning and the need to enforce land management regulations to curb illegal land conversion and habitat fragmentation. It also underscores the importance of considering both ecological and social dimensions when promoting economic growth in island SEZs.
To mitigate future environmental damage, it is crucial that policymakers adopt sustainable development strategies that balance economic goals with the preservation of critical ecosystems. Nature-based solutions, the restoration of degraded areas, and green infrastructure could protect Phu Quoc’s natural habitats and enhance climate resilience. By balancing economic interests and environmental preservation, Phu Quoc Island can sustain its appeal as a tourist destination while preserving its one-of-a-kind ecosystems for future generations. This research offers valuable insights that can help other island economies dealing with the pressures of SEZ-driven urbanisation.
Future research should focus on long-term monitoring of LULCCs and habitat quality, using more granular data and advanced spatial analysis techniques. Additionally, the social impacts of habitat degradation on the livelihoods of local communities, particularly those relying on agriculture, should be explored in more detail. Investigating the intersection of climate change and urban expansion will also be crucial, especially in terms of sea level rise, coastal erosion, and increased frequency of extreme weather events, which could compound the challenges already identified in this study. This study not only quantifies the environmental impacts of urbanisation on Phu Quoc but also underscores the urgent need for integrated land use planning to mitigate such changes in similar fragile island ecosystems.

Author Contributions

C.T.N.: conceptualization, methodology, formal analysis, visualisation, result interpretation, writing—original draft preparation and review and editing; N.K.D.: result interpretation, writing—original draft preparation and review and editing; A.S.: writing—original draft preparation and review and editing; C.L.: writing—original draft preparation and review and editing. All authors have read and agreed to the published version of the manuscript.

Funding

This research received no external funding.

Data Availability Statement

Data are contained within the article.

Acknowledgments

We thank Sanwit Iabchoon for his comments, which have helped improve the quality of this manuscript.

Conflicts of Interest

The authors declare no conflicts of interest.

Appendix A

Figure A1. Examples from Google Earth: high-resolution images highlight the dynamics of LULCC and interconversion between LULC categories—(AD) urban development and regreening on barren/construction lands and (EG) wetland changes on Phu Quoc Island during the study period.
Urbansci 09 00011 g0a1

References

  1. Su, S.; Xiao, R.; Jiang, Z.; Zhang, Y. Characterizing Landscape Pattern and Ecosystem Service Value Changes for Urbanization Impacts at an Eco-Regional Scale. Appl. Geogr. 2012, 34, 295–305. [Google Scholar] [CrossRef]
  2. Follmann, A.; Kennedy, L.; Pfeffer, K.; Wu, F. Peri-Urban Transformation in the Global South: A Comparative Socio-Spatial Analytics Approach. Reg. Stud. 2023, 57, 447–461. [Google Scholar] [CrossRef]
  3. Tang, K. The Political Economy of Special Economic Zones: The Cases of Ethiopia and Vietnam. Rev. Int. Polit. Econ. 2023, 30, 1957–1983. [Google Scholar] [CrossRef]
  4. Nguyen, C.T.; Ton-That, L.; Pham, T.D. Land Use, Land Cover Changes and Expansion of Artificial Reservoirs in Eastern Thailand: Implications for Agriculture and Vegetation Drought Reduction. Environ. Monit. Assess. 2024, 196, 1009. [Google Scholar] [CrossRef]
  5. Weggel, O. Vietnam’s Policy of Economic Zoning. J. Curr. Southeast Asian Aff. 2007, 26, 79–98. [Google Scholar]
  6. Nguyen, H.Q.; Tien, D.N. Special Economic Zones and FDI Attraction to Districts in Vietnam: A Non-Parametric Approach. Singap. Econ. Rev. 2021, 66, 1027–1053. [Google Scholar] [CrossRef]
  7. Zappa, M. “Greening” Speculative Urbanism? Space Politics and Model Circulation in South Korea and Vietnam’s Special Economic Zones. Nuovi Aut. Democr. Dirit. Ist. Soc. 2022, 4, 68–86. [Google Scholar] [CrossRef]
  8. Nguyen, C.T.; Kaewthongrach, R.; Channumsin, S.; Chongcheawchamnan, M.; Phan, T.N.; Niammuad, D. A Regional Assessment of Ecological Environment Quality in Thailand Special Economic Zone: Spatial Heterogeneous Influences and Future Prediction. Land Degrad. Dev. 2023, 34, 5770–5787. [Google Scholar] [CrossRef]
  9. Hoa, P.N.; Khai, T.Q. Establishing Three Special Zones in Vietnam: Opportunities and Challenges for Socio-Economic Development. Soc. Sci. Inf. Rev. 2018, 12, 12–20. [Google Scholar]
  10. Hong, N.; Kim, S. Beyond Desakota: The Urbanization Process and Spatial Restructuring in Contemporary Vietnam. Urban Res. Pract. 2023, 16, 582–604. [Google Scholar] [CrossRef]
  11. Fan, P.; Ouyang, Z.; Nguyen, D.D.; Nguyen, T.T.H.; Park, H.; Chen, J. Urbanization, Economic Development, Environmental and Social Changes in Transitional Economies: Vietnam after Doimoi. Landsc. Urban Plan. 2019, 187, 145–155. [Google Scholar] [CrossRef]
  12. Hieu, V.; Vu, N.; Nwachukwu, C. Exploring Human Resources, Marketing and Promotion Activities towards the Sustainable Tourism Development in Phu Quoc Islands, Vietnam. Management 2020, 24, 39–55. [Google Scholar] [CrossRef]
  13. Quyet, L.V.; Duy, P.T.; Toan, V.P. Sustainable Development of Tourism Economy in Phu Quoc Island, Kien Giang Province, Vietnam: Current Situation and Prospects. IOP Conf. Ser. Earth Environ. Sci. 2022, 1028, 012005. [Google Scholar] [CrossRef]
  14. Ngan, N.T.K. Resolution No. 1109/NQ-UBTVQH14: Establishment of Phu Quoc City and Wards of Phu Quoc City, Kien Giang Province, Ha Noi, 2020; The Standing Committee of the National Assembly: Hanoi, Vietnam, 2020. [Google Scholar]
  15. Ha, T.H. Decision No. 150/QĐ-TTg: Decision Approving the Master Plan of Phu Quoc City, Kien Giang Province to 2040, Ha Noi, 2024; Prime Minister: Hanoi, Vietnam, 2024. [Google Scholar]
  16. Government News Phu Quoc Transforms to Become Top Growth Pole of Kien Giang. Available online: https://en.baochinhphu.vn/phu-quoc-transforms-to-become-top-growth-pole-of-kien-giang-111240331204729209.htm (accessed on 18 October 2024).
  17. Thao, N.D.L. Attracting Investments for the Development of Smart City Phu Quoc–Kien Giang Province. Int. J. Adv. Econ. 2022, 4, 63–77. [Google Scholar] [CrossRef]
  18. Sanchez-Ortiz, K.; Gonzalez, R.E.; de Palma, A.; Newbold, T.; Hill, S.L.L.; Tylianakis, J.M.; Börger, L.; Lysenko, I.; Purvis, A. Land-Use and Related Pressures Have Reduced Biotic Integrity More on Islands than on Mainlands. bioRxiv 2019. [Google Scholar] [CrossRef]
  19. Li, G.; Yang, X.; Liu, Q.; Zheng, F. Destination Island Effects: A Theoretical Framework for the Environmental Impact Assessment of Human Tourism Activities. Tour. Manag. Perspect. 2014, 10, 11–18. [Google Scholar] [CrossRef]
  20. Matias, T.P.; Leonel, J.; Imperador, A.M. A Systemic Environmental Impact Assessment on Tourism in Island and Coastal Ecosystems. Environ. Dev. 2022, 44, 100765. [Google Scholar] [CrossRef]
  21. Storch, H.; Downes, N.; Rujner, H. A Scenario-Based Approach to Assessing the Exposure and Flood Risk of Ho Chi Minh City’s Urban Development Strategy in Times of Climate Change. In The EnviroInfo 2011: Innovations in Sharing Environmental Observation and Information, Proceedings of the 25th International Conference on Informatics for Environmental Protection, Ispra, Italy, 5–7 September 2011; Shaker Verlag: Maastricht, Germany; Herzogenrath, Germany; pp. 270–279.
  22. Dao, M.T. Assessing the Vulnerability of Phu Quoc Island’s Natural and Socio-Economic Systems to Climate Change. IOP Conf. Ser. Earth Environ. Sci. 2024, 1395, 012037. [Google Scholar] [CrossRef]
  23. Tan, K.C.; Lim, H.S.; MatJafri, M.Z.; Abdullah, K. Landsat Data to Evaluate Urban Expansion and Determine Land Use/Land Cover Changes in Penang Island, Malaysia. Environ. Earth Sci. 2010, 60, 1509–1521. [Google Scholar] [CrossRef]
  24. Aljenaid, S.S.; Kadhem, G.R.; AlKhuzaei, M.F.; Alam, J.B. Detecting and Assessing the Spatio-Temporal Land Use Land Cover Changes of Bahrain Island During 1986–2020 Using Remote Sensing and GIS. Earth Syst. Environ. 2022, 6, 787–802. [Google Scholar] [CrossRef]
  25. Newase, S.; Acharjee, M.R.; Talukder, A.; Nishi, S.Q. Temporal Evolution of Land Use-Land Cover Changes, Focusing on Present Mariculture Sites along the Moheshkhali Island, Bangladesh. GeoJournal 2024, 89, 54. [Google Scholar] [CrossRef]
  26. Gowthaman, R.; Dwarakish, G.S.; Sanilkumar, V. Land Use/Land Cover Changes around Rameshwaram Island, East Coast of India. Indian J. Geo-Mar. Sci. 2014, 43, 1183–1186. [Google Scholar]
  27. Jenkins, R.; Kennedy, L.; Mukhopadhyay, P.; Pradhan, K.C. Special Economic Zones in India: Interrogating the Nexus of Land, Development and Urbanization. Environ. Urban. ASIA 2015, 6, 1–17. [Google Scholar] [CrossRef]
  28. Zeng, D.Z. The Past, Present, and Future of Special Economic Zones and Their Impact. J. Int. Econ. Law 2021, 24, 259–275. [Google Scholar] [CrossRef]
  29. Xu, J.; Wang, X. Reversing Uncontrolled and Unprofitable Urban Expansion in Africa through Special Economic Zones: An Evaluation of Ethiopian and Zambian Cases. Sustainability 2020, 12, 9246. [Google Scholar] [CrossRef]
  30. de Wit, J. Land Governance of Suburban Areas of Vietnam: Dynamics and Contestations of Planning, Housing and the Environment. ISS Work. Pap. Ser. 2013, 561, 1–37. [Google Scholar]
  31. Miatto, A.; Dawson, D.; Nguyen, P.D.; Kanaoka, K.S.; Tanikawa, H. The Urbanisation-Environment Conflict: Insights from Material Stock and Productivity of Transport Infrastructure in Hanoi, Vietnam. J. Environ. Manag. 2021, 294, 113007. [Google Scholar] [CrossRef] [PubMed]
  32. Thinh, N.K.; Kamalipour, H. Mapping Informal/Formal Morphologies over Time: Exploring Urban Transformations in Vietnam. Cities 2024, 152, 105168. [Google Scholar] [CrossRef]
  33. Mohammadyari, F.; Zarandian, A.; Mirsanjari, M.M.; Suziedelyte Visockiene, J.; Tumeliene, E. Modelling Impact of Urban Expansion on Ecosystem Services: A Scenario-Based Approach in a Mixed Natural/Urbanised Landscape. Land 2023, 12, 291. [Google Scholar] [CrossRef]
  34. Wang, J.; Zhou, W.; Pickett, S.T.A.; Yu, W.; Li, W. A Multiscale Analysis of Urbanization Effects on Ecosystem Services Supply in an Urban Megaregion. Sci. Total Environ. 2019, 662, 824–833. [Google Scholar] [CrossRef] [PubMed]
  35. Nguyen, D.T.H.; Tripathi, N.K.; Gallardo, W.G.; Tipdecho, T. Coastal and Marine Ecological Changes and Fish Cage Culture Development in Phu Quoc, Vietnam (2001 to 2011). Geocarto Int. 2014, 29, 486–506. [Google Scholar] [CrossRef]
  36. Tin, H.C.; Uyen, N.T.; Tu, N.H.C.; Binh, N.H.; Ni, T.N.K. Dynamics of Seagrass Beds and Land Use–Land Cover Characteristics in Vietnamese Marine Protected Areas. Reg. Stud. Mar. Sci. 2023, 59, 102794. [Google Scholar] [CrossRef]
  37. Nang, L.N.; Hieu, P.T.; Phat, L.V.; Tien, P.M.; Man, H.N.T.; Hang, H.T. Characteristics of Newly Discovered Amber From Phu Quoc, Vietnam. Gems Gemol. 2022, 58, 184–194. [Google Scholar] [CrossRef]
  38. Minh, H.V.T.; van Ty, T.; Nam, N.D.G.; Lien, B.T.B.; Thanh, N.T.; Cong, N.P.; Meraj, G.; Kumar, P.; van Thinh, L.; van Duy, D.; et al. Modelling and Predicting Annual Rainfall over the Vietnamese Mekong Delta (VMD) Using SARIMA. Discov. Geosci. 2024, 2, 19. [Google Scholar] [CrossRef]
  39. Phong, N.T.; van Tien, H. Water Resource Management and Island Tourism Development: Insights from Phu Quoc, Kien Giang, Vietnam. Environ. Dev. Sustain. 2021, 23, 17835–17856. [Google Scholar] [CrossRef]
  40. Huan, V.D.; Ngoc, P.T.B. Evaluation of Site Selections for Solid Waste Landfill by Using GIS in Phu Quoc Island, Kien Giang Province, Vietnam. IOP Conf. Ser. Earth Environ. Sci. 2023, 1247, 012015. [Google Scholar] [CrossRef]
  41. Thien, B.B.; Kuznetsov, A.N.; Phuong, V.T. Monitoring Land Use/Land Cover Change Using Remote Sensing and GIS Techniques in Phu Quoc Island, Kien Giang Province, Vietnam. Nexo Sci. J. 2024, 37, 83–98. [Google Scholar] [CrossRef]
  42. Pham, V.P.Q.; Thirumaran, K. Managing Development of Resort Destinations in Southeast Asia: Emerging and Peripheral Phu Quoc Island. In Development of Tourism and the Hospitality Industry in Southeast Asia; Mandal, J.V.P., Ed.; Springer: Singapore, 2016; pp. 83–95. [Google Scholar]
  43. Wulder, M.A.; Loveland, T.R.; Roy, D.P.; Crawford, C.J.; Masek, J.G.; Woodcock, C.E.; Allen, R.G.; Anderson, M.C.; Belward, A.S.; Cohen, W.B.; et al. Current Status of Landsat Program, Science, and Applications. Remote Sens. Environ. 2019, 225, 127–147. [Google Scholar] [CrossRef]
  44. Zhang, Y.; Ai, Y.; Su, F.; Su, H.; He, Z.; Wang, C.; Ying, J.; Zhou, M. A Comparative Analysis of Different Terrain Correction Methods Based on Landsat-8 OLI Data. IOP Conf. Ser. Earth Environ. Sci. 2021, 671, 012003. [Google Scholar] [CrossRef]
  45. Talukdar, S.; Singha, P.; Mahato, S.; Pal, S.; Liou, Y.-A.; Rahman, A. Land-Use Land-Cover Classification by Machine Learning Classifiers for Satellite Observations—A Review. Remote Sens. 2020, 12, 1135. [Google Scholar] [CrossRef]
  46. Teffera, Z.L.; Li, J.; Debsu, T.M.; Menegesha, B.Y. Assessing Land Use and Land Cover Dynamics Using Composites of Spectral Indices and Principal Component Analysis: A Case Study in Middle Awash Subbasin, Ethiopia. Appl. Geogr. 2018, 96, 109–129. [Google Scholar] [CrossRef]
  47. Tucker, C.J. Red and Photographic Infrared Linear Combinations for Monitoring Vegetation. Remote Sens. Environ. 1979, 8, 127–150. [Google Scholar] [CrossRef]
  48. Can, T.N.; Chidthaisong, A.; Diem, P.K.; Huo, L.Z. A Modified Bare Soil Index to Identify Bare Land Features during Agricultural Fallow-Period in Southeast Asia Using Landsat 8. Land 2021, 10, 231. [Google Scholar] [CrossRef]
  49. Qi, J.; Chehbouni, A.; Huete, A.R.; Kerr, Y.H.; Sorooshian, S. A Modified Soil Adjusted Vegetation Index. Remote Sens. Environ. 1994, 48, 119–126. [Google Scholar] [CrossRef]
  50. Gao, X.; Huete, A.R.; Ni, W.; Miura, T. Optical-Biophysical Relationships of Vegetation Spectra without Background Contamination. Remote Sens. Environ. 2000, 74, 609–620. [Google Scholar] [CrossRef]
  51. Jin, S.; Sader, S.A. Comparison of Time Series Tasseled Cap Wetness and the Normalized Difference Moisture Index in Detecting Forest Disturbances. Remote Sens. Environ. 2005, 94, 364–372. [Google Scholar] [CrossRef]
  52. Zha, Y.; Gao, J.; Ni, S. Use of Normalized Difference Built-up Index in Automatically Mapping Urban Areas from TM Imagery. Int. J. Remote Sens. 2003, 24, 583–594. [Google Scholar] [CrossRef]
  53. Kawamura, M.; Jayamanna, S.; Tsujiko, Y. Relation between Social and Environmental Conditions in Colombo Sri Lanka and the Urban Index Estimated by Satellite Remote Sensing Data. Int. Arch. Photogramm. Remote Sens. 1996, 31, 321–326. [Google Scholar]
  54. Breiman, L. Random Forests. Mach. Learn. 2001, 45, 5–32. [Google Scholar] [CrossRef]
  55. Nguyen, C.T.; Diep, N.T.H.; Iabchoon, S. Direction of Urban Expansion in the Bangkok Metropolitan Area, Thailand under the Impacts of a National Strategy. Vietnam J. Earth Sci. 2021, 43, 380–398. [Google Scholar] [CrossRef]
  56. Nguyen, C.T.; Nguyen, H.; Sakti, A.D. Seasonal Characteristics of Outdoor Thermal Comfort and Residential Electricity Consumption: A Snapshot in Bangkok Metropolitan Area. Remote Sens. Appl. Soc. Environ. 2024, 33, 101106. [Google Scholar] [CrossRef]
  57. Deng, X.; Xu, X.; Cai, H.; Li, J. Assessment the Impact of Urban Expansion on Cropland Net Primary Productivity in Northeast China. Ecol. Indic. 2024, 159, 111698. [Google Scholar] [CrossRef]
  58. Son, N.T.; Chen, C.F.; Chen, C.R.; Thanh, B.X.; Vuong, T.H. Assessment of Urbanization and Urban Heat Islands in Ho Chi Minh City, Vietnam Using Landsat Data. Sustain. Cities Soc. 2017, 30, 150–161. [Google Scholar] [CrossRef]
  59. Nguyen, C.T.; Chidthaisong, A. Ecosystem Services Provided by Urban Green Spaces in Bangkok Metropolis: Public Awareness and Planning Implications. Urban Ecosyst. 2023, 27, 855–868. [Google Scholar] [CrossRef]
  60. Natural Capital Project InVEST User Guide. Habitat Quality. 2024. Available online: http://releases.naturalcapitalproject.org/invest-userguide/latest/en/habitat_quality.html (accessed on 19 September 2024).
  61. Huang, H.; Xiao, Y.; Ding, G.; Liao, L.; Yan, C.; Liu, Q.; Gao, Y.; Xie, X. Comprehensive Evaluation of Island Habitat Quality Based on the Invest Model and Terrain Diversity: A Case Study of Haitan Island, China. Sustainability 2023, 15, 11293. [Google Scholar] [CrossRef]
  62. Hu, Y.; Xu, E.; Kim, G.; Liu, C.; Tian, G. Response of Spatio-Temporal Differentiation Characteristics of Habitat Quality to Land Surface Temperature in a Fast Urbanized City. Forests 2021, 12, 1668. [Google Scholar] [CrossRef]
  63. Vu, T.T.; Shen, Y.; Lai, H.Y. Strategies to Mitigate the Deteriorating Habitat Quality in Dong Trieu District, Vietnam. Land 2022, 11, 305. [Google Scholar] [CrossRef]
  64. Xie, Z.X.; Zhang, B.; Shi, Y.T.; Zhang, X.Y.; Sun, Z.X. Changes and Protections of Urban Habitat Quality in Shanghai of China. Sci. Rep. 2023, 13, 10976. [Google Scholar] [CrossRef]
  65. Zhao, L.; Yu, W.; Meng, P.; Zhang, J.; Zhang, J. InVEST Model Analysis of the Impacts of Land Use Change on Landscape Pattern and Habitat Quality in the Xiaolangdi Reservoir Area of the Yellow River Basin, China. Land Degrad. Dev. 2022, 33, 2870–2884. [Google Scholar] [CrossRef]
  66. Wang, J.; Ding, J.; Ge, X.; Qin, S.; Zhang, Z. Assessment of Ecological Quality in Northwest China (2000–2020) Using the Google Earth Engine Platform: Climate Factors and Land Use/Land Cover Contribute to Ecological Quality. J. Arid Land 2022, 14, 1196–1211. [Google Scholar] [CrossRef]
  67. Qasim, M.; Hubacek, K.; Termansen, M.; Fleskens, L. Modelling Land Use Change across Elevation Gradients in District Swat, Pakistan. Reg. Environ. Chang. 2013, 13, 567–581. [Google Scholar] [CrossRef]
  68. LDN. Enforced Eviction of Households Occupying Phu Quoc Special-Use Forest Land to Build Houses. Available online: https://laodong.vn/xa-hoi/cuong-che-ho-dan-chiem-dat-rung-dac-dung-phu-quoc-xay-nha-1376620.ldo (accessed on 24 September 2024).
  69. CPVN. Strengthening the Handling of Violations of Forest Land and Construction in Phu Quoc. Available online: https://dangcongsan.vn/phap-luat/tang-cuong-xu-ly-vi-pham-ve-dat-rung-va-xay-dung-o-phu-quoc-667385.html (accessed on 24 September 2024).
  70. TTO. Caught 2 People Burning and Encroaching on Phu Quoc Forest Land. Available online: https://tuoitre.vn/bat-qua-tang-2-nguoi-dot-pha-lan-chiem-dat-rung-phu-quoc-1266553.htm (accessed on 24 September 2024).
  71. Ciscar, J.C.; Szabó, L.; van Regemorter, D.; Soria, A. The Integration of PESETA Sectoral Economic Impacts into the GEM-E3 Europe Model: Methodology and Results. Clim. Change 2012, 112, 127–142. [Google Scholar] [CrossRef]
  72. Scott, D. Climate Change Implications for Tourism. In The Wiley Blackwell Companion to Tourism, 2nd ed.; Hall, C.M.C., Ed.; John Wiley & Sons: Hoboken, NJ, USA, 2024; pp. 548–562. [Google Scholar]
  73. Gössling, S.; Lindén, O.; Helmersson, J.; Liljenberg, J.; Quarm, S. Diving and Global Environmental Change: A Mauritius Case Study. In New Frontiers in Marine Tourism: Diving Experiences, Sustainability, Management; Routledge: Oxfordshire, UK, 2007; pp. 67–92. [Google Scholar]
  74. Assante, L.M.; Wen, H.I.; Lottig, K.J. Conceptualization of Modeling Resident Attitudes on the Environmental Impacts of Tourism: A Case Study of Oahu, Hawaii. Tour. Plan. Dev. 2012, 9, 101–118. [Google Scholar] [CrossRef]
  75. Kundur, S.; Murthy, K. Environmental Impacts of Tourism and Management in Maldives. Int. J. Environ. Sci. 2013, 2, 44–50. [Google Scholar]
  76. Vainikka, V. Rethinking Mass Tourism. Tour. Stud. 2013, 13, 268–286. [Google Scholar] [CrossRef]
  77. Sudmeier-Rieux, K.; Paleo, U.F.; Garschagen, M.; Estrella, M.; Renaud, F.G.; Jaboyedoff, M. Opportunities, Incentives and Challenges to Risk Sensitive Land Use Planning: Lessons from Nepal, Spain and Vietnam. Int. J. Disaster Risk Reduct. 2015, 14, 205–224. [Google Scholar] [CrossRef]
  78. Nha, D.V. The Role of Land-Use Planning on Socioeconomic Development in Mai Chau District, Vietnam; Elsevier Inc.: Amsterdam, The Netherlands, 2017; Volume 2, ISBN 9780128104729. [Google Scholar]
  79. Nguyen, T.P.; Parnell, K.E. Coastal Land Use Planning in Ben Tre, Vietnam: Constraints and Recommendations. Heliyon 2019, 5, e01487. [Google Scholar] [CrossRef] [PubMed]
Figure 1. Maps illustrating the characteristics of Phu Quoc Island. (A) Phu Quoc is located in southwest Vietnam within the Gulf of Thailand. (B) Zoning development map of Phu Quoc defining twelve subdivision zones and highlighting the main urban centre of Duong Dong town and key supporting infrastructures. (C) Cloud-free composite image from Landsat 9 in 2023 of the entire Phu Quoc mainland (false colour composite: SWIR/NIR/Blue). R0–R12 are subdivisions in Table 1.
Urbansci 09 00011 g001
Figure 2. Spatial distribution of LULC categories in Phu Quoc from 2003 to 2023. R0–R11 are subdivisions in Table 1.
Urbansci 09 00011 g002
Figure 3. Converted areas between LULC categories for the periods 2003–2013 and 2013–2023. Vertical LULC categories are current LULC at the end of the period. Negative converted area and positive converted area are LUCC loss and gain, respectively.
Urbansci 09 00011 g003
Figure 4. Simulated habitat quality in Phu Quoc in each year (top panel) and habitat quality changes over each ten-year period (bottom panel). R0–R11 are subdivisions in Table 1.
Urbansci 09 00011 g004
Figure 5. LST changes in Phu Quoc for each ten-year period classified in major intervals. R0–R11 are subdivisions in Table 1.
Urbansci 09 00011 g005
Figure 6. Relationships between (A) habitat quality and (B) thermal environment changes (LST, °C) and potential controlling factors. Vertical axes are HQ changes and LST changes, and horizontal axes are values of corresponding variables.
Urbansci 09 00011 g006
Figure 7. Heatmap of tourist and attractive locations with colour shades from blue to red represents low to high density of tourist locations ((left), locations were extracted from Open Street Map) compared to current thermal environment changes (middle) and habitat quality (right). Current conditions of thermal environment in 2013–2023 and habitat quality in 2023 extracted from Figure 4 and Figure 5.
Urbansci 09 00011 g007
Table 1. Subdivision orientation of the twelve development zones on Phu Quoc Island by 2040 [15].
SubdivisionFocused AreaDevelopment Orientation
R0–Subdivision 0Remaining areasThe areas are not planned for urban and tourist development and are used for ecological conservation purposes and have minimal impact.
R1–Subdivision 1Duong Dong townletIt is a general administrative, political, cultural, and sports centre for the island. This is also a main urban and commercial centres for mixed tourist activities.
R2–Subdivision 2Bai Truong regionOne of the main integrated tourist centres that comprises shopping malls, tourist services, and entertainment.
R3–Subdivision 3Bai Ong Lang Beach—Cua Can communeIt is the northern mixed urban–tourist centre, which concentrates commercial centres, tourist services, professional education, and high-tech centres.
R4–Subdivision 4Bai Vong BeachIt is intended to be a mixed tourist service area, combining high-quality resorts with golf courses.
R5–Subdivision 5Bai Sao BeachIt is planned to be a high-class tourist area with open structures, eco-resorts, and sea sports.
R6–Subdivision 6An Thoi townletA mixed urban–tourist area combining seaport and residential areas, trade, tourist services, and cultural centres with typical historical values.
R7–Subdivision 7The Dam BayAn integrated area for residential purposes and tourists. This area also supports small-scale industrial activities and seaport logistics services.
R8–Subdivision 8Bai Khem and Bai Ong Doi BeachesTourist service areas serving as high-class eco-resorts and sea sports.
R9–Subdivision 9Eastern coastal areasAn eastern centre of mixed urban–tourism areas, including eco-resorts, sea sports, entertainment, and golf courses.
R10–Subdivision 10Northern coastal areasThis region consists of component areas for urban–tourism purposes. It mainly includes high-class eco-resorts combined with forest sightseeing and marine conservation areas.
R11–Subdivision 11Northwest coastal areasA mixed urban–tourist area consists of high-class resorts and resorts combined with golf courses, sea sports, and entertainment.
R12–Subdivision 12Nam An Thoi islandsIt is planned for southern islets, which mainly stand on tourist services and activities in islets and marine conservation areas.
Table 2. Description of LULC categories interpreted from satellite images in Phu Quoc Island.
LULC CategoryDescription
Bare soilRefers to exposed soil (loam soil) without or with less vegetation cover during observation time due to natural processes or human activities, such as idle agricultural land, sparse grassland, and deforested lands.
FarmlandAgricultural land is located in flat plains, where annual crops such as rice, beans, peanuts, vegetables, pepper plantations, and other annual crops are cultivated.
Forest/WoodlandIt describes overgrowth and dense tree landscapes, which embrace natural forests, plantations, perennial plants, green spaces, and orchards.
Urban and construction landsLand is occupied by dense human settlements in cities and towns with intensive domination of impervious surfaces and high-reflectance materials, such as buildings, houses, roads, and utilities. It also includes construction land, which is specifically allocated for construction and urban/infrastructure development projects. This land is typically barren due to the land levelling process using sand (especially in coastal regions) before the projects are initiated, resulting in high reflectivity and surface temperature.
Water bodiesNatural and artificial water surfaces are used for water transport, irrigation, and domestic consumption, such as ponds, lakes, rivers, and canals.
WetlandIt describes a transitional ecosystem between terrestrial and aquatic environments, where there is the presence of both vegetation and water, either permanently or seasonally. The primary wetland landscapes in Phu Quoc include mangroves in estuaries, melaleuca swamps, and man-made floodplains.
Table 3. Characteristics of identified threats and corresponding decay functions.
Threat SourceMaximum Distance
(km)
Threat WeightDecay Function
Major roads (ROAD)1.01.0Linear
Urban/construction lands (URBN)3.01.0Exponential
Farmland (FARM)1.20.7Linear
Bare soil (BAR)1.00.5Exponential
Table 4. Coefficients of habitat suitability of LULC categories and relative sensitivity of landscape habitats to threat sources.
HabitatHabitat SuitabilityThreat Sources
ROADURBANFARMBAR
Water bodies (WAT)0.80.60.80.70.3
Wetland (WET)0.90.70.90.70.4
Bare soil (BAR)0.20.10.200
Urban/construction lands (URBN)00000
Forest/Woodland (FOR)10.80.90.60.5
Farmland (FARM)0.60.80.900.5
Disclaimer/Publisher’s Note: The statements, opinions and data contained in all publications are solely those of the individual author(s) and contributor(s) and not of MDPI and/or the editor(s). MDPI and/or the editor(s) disclaim responsibility for any injury to people or property resulting from any ideas, methods, instructions or products referred to in the content.

