Article

Urban Parks in Novi Sad (Serbia)—Insights from Landscape Architecture Students

1
Faculty of Agriculture, University of Novi Sad, Trg D. Obradovica 8, 21000 Novi Sad, Serbia
2
ALGORITMI Research Center/Associate Laboratory for Intelligent Systems, University of Minho, 4710-057 Braga, Portugal
3
Corvallis Forestry Sciences Laboratory, Pacific Northwest Research Station, US Department of Agriculture, Forest Service, 3200 SW Jefferson Way, Corvallis, OR 97331, USA
*
Author to whom correspondence should be addressed.
Urban Sci. 2024, 8(3), 99; https://doi.org/10.3390/urbansci8030099
Submission received: 25 June 2024 / Revised: 18 July 2024 / Accepted: 19 July 2024 / Published: 26 July 2024
(This article belongs to the Topic Spatial Decision Support Systems for Urban Sustainability)

Abstract

:
Urban parks are vital components of city ecosystems, enhancing biodiversity, climate resilience, air and water quality, health, socialization, and economic benefits for citizens in urban areas. This paper examines urban parks in Novi Sad by gathering opinions on their qualities and functions through a questionnaire. The respondents were students enrolled in the landscape architecture course at the University of Novi Sad. To analyze their responses, multivariate statistical analysis techniques, including ANOVA, MANOVA, and contingency tables, were applied. The results highlight the primary reasons for visiting urban parks in general, as well as specific parks in Novi Sad. The paper offers insights into visitor behavior, including the frequency and length of their stays, etc., and provides an assessment of the parks’ educational functions, which were expected to be highly relevant for the respondent group. The results can be relevant for further urban park development and serve as a starting point for applying multi-criteria (MC) analysis. Specifically, the results can be used to define a set of criteria, goals, and other essential elements necessary for conducting Analytic Hierarchy Processes or similar MC analysis methods.

1. Introduction

Urban parks play a crucial role in enhancing the quality of life and sustainability of urban environments in numerous ways. Some urban park functions related to this research can be grouped as follows:
  • Biodiversity Conservation: Urban parks serve as important habitats for diverse plant and animal species, contributing to urban biodiversity conservation [1,2,3]. By providing refuge for native flora and fauna, parks help maintain ecological balance, support pollinators, and preserve genetic diversity [4,5,6,7,8].
  • Climate Resilience and Urban Sustainability: Urban parks play a vital role in enhancing the resilience of cities to climate change impacts such as extreme heat, floods, and droughts [9]. They provide cooling effects, reduce urban heat island effects, and help mitigate climate-related risks [10,11]. Furthermore, parks contribute to urban sustainability by conserving natural resources, promoting biodiversity, and supporting ecosystem services essential for human well-being [12,13,14,15,16].
  • Air and Water Quality Improvement: Vegetation in urban parks helps mitigate air pollution by absorbing pollutants such as carbon dioxide, nitrogen oxides, and particulate matter [17,18]. Trees and other plants also act as natural filters, improving air quality and reducing the urban heat island effect [19,20,21]. Moreover, parks play a role in stormwater management by absorbing and filtering rainwater, reducing runoff, and preventing flooding [4,21,22,23,24].
  • Promotion of Physical and Mental Health: Urban parks provide accessible spaces for physical activities such as walking, jogging, cycling, and recreational sports. Regular exercise in green spaces helps reduce the risk of obesity, heart disease, and other chronic illnesses [25,26,27,28,29]. Additionally, exposure to nature in urban parks has been linked to improved mental health, stress reduction, and enhanced well-being [30,31,32,33].
  • Social Cohesion and Community Engagement: Urban parks serve as gathering places where people from diverse backgrounds can interact, socialize, and engage in community activities [33,34,35,36,37]. They contribute to social cohesion by providing spaces for cultural events, festivals, markets, and recreational programs [38,39]. Parks also foster a sense of belonging and pride among residents, strengthening community bonds and social capital [40,41,42,43].
  • Economic Benefits: Well-designed and well-maintained urban parks enhance property values and attract businesses, tourists, and investors to surrounding areas [44,45]. They create opportunities for tourism, outdoor recreation, and cultural events, generating revenue and stimulating local economies [46]. Additionally, parks can contribute to job creation and support small businesses such as cafes, vendors, and recreational facilities [44,45,46,47].
In summary, urban parks are essential components of sustainable urban development, contributing to the physical, mental, social, and environmental health of urban populations [48]. Recognizing the importance of parks and investing in their creation, maintenance, and accessibility is crucial for building livable, resilient, and inclusive cities.
When selecting urban parks to visit, people can have various criteria. Some of them are: proximity to the park, park size, park maintenance and equipment, events, recreation facilities, but also perceived safety and security [48,49]. Perceptions of safety and security within the park, including concerns about crime, vandalism, or personal safety, can impact visitation rates [50,51]. Parks that are perceived as unsafe and insecure are more likely to be avoided by visitors. It has been noted that the frequency of visits to and length of stay in a park depend also on season and seasonal variations, i.e., visits to urban parks may fluctuate depending on the season, weather conditions, and time of year [52]. Usually, parks may experience higher visitation rates during the spring and summer months when the weather is favorable for outdoor activities. Proximity to the park also tends to be one of main criteria for selecting a park to visit—individuals who live closer to urban parks are more likely to visit them frequently, especially if the park is within walking distance or easily accessible by public transportation [53,54]. In addition, parks situated in the city center or in the neighboring area usually have higher visitation rates [54,55,56].
When exploring the relationship between urban parks and urban inhabitants, various aspects come into play, including health and well-being, social interaction, environmental sustainability, and community cohesion [57]. By prioritizing the development and maintenance of parks, policymakers, planners, and community stakeholders can promote the health, well-being, and quality of life of urban residents while fostering environmental stewardship and social cohesion [58,59]. Approaches to systematically explore relationships and prioritize specific decision-making and policy aspects can be grouped generally into the following categories: qualitative methods (e.g., questionnaire surveys), quantitative methods (e.g., geographic information systems and remote sensing), and mixed methods (e.g., choice modelling). When analyzing the relationship between urban parks and urban inhabitants, it is useful to create different types of questionnaires. Creating a questionnaire about urban parks can be beneficial for various purposes, such as understanding community preferences, evaluating park amenities, or gathering feedback for improvements. These questionnaires should include demographic questions (such as age, gender, education level, etc.) and questions related to urban parks that can be in the form of open-ended or close-ended questions, multiple choice or Likert scale questions, ranking questions, etc. Therefore, it is important to have a properly suited questionnaire to obtain useful and insightful feedback from respondents [57,58].
By engaging diverse respondent groups for a questionnaire, one can gather comprehensive feedback, identify stakeholders’ needs and priorities, and foster inclusive decision-making processes that reflect the interests of the community at large. Some of the most important groups that need to be interviewed for understanding park functioning are: local residents, park visitors and tourists, government offices and agencies, NGOs, community groups, park professionals and experts, local businesses, stakeholders and partners, etc. [60]. In these terms, questionnaires can be more general or focused on specific groups of respondents. The selection of a general or more detailed questionnaire depends on the aim of the research.
This research focuses on urban parks in Novi Sad, selecting six major parks for the study. The respondent group consisted of second- and fourth-year landscape architecture students from the University of Novi Sad. The survey collected data on their park usage behaviors, including visitation frequency, duration of stay, and reasons for choosing particular parks. The results provide insights into the functions of urban parks in Novi Sad and suggest ways for their further improvement.

2. Materials and Methods

2.1. Urban Parks in Novi Sad

The paper focuses on six major urban parks in Novi Sad (Serbia): Danube, Liman, Futog, Railway, Kamenica, and University Parks, and their spatial disposition is shown by Figure 1. Novi Sad is the second largest city in Serbia, representative on a national level, and featuring prominent urban parks (from various historical periods), and therefore was found as a suitable case study for this research. A brief description of each park based on [61] is provided in the following text.
Danube Park is located in the center of Novi Sad and covers an area of 3.9 hectares (Figure 2). The park was established in 1895, and has since been renovated in several stages. Its current design was established in 1958, following a reconstruction project by Ratibor Đorđević. Since 1998, it has been protected as a natural monument, under the regime of second-degree protection. The park is a habitat for over 600 trees, including notable species such as English oak (Quercus robur L.), swamp cypress (Taxodium distichum (L.) Rich.), horse chestnut (Aesculus hippocastanum L.), etc. An artificial lake was constructed at the lowest point in the park (76 m). An additional water feature in the park is the fountain “Nymph” or “Swimming Girl”, sculpted by Đorđe Jovanović and erected in 1912. The park also hosts significant sculptures, including a monument to poet and painter Đura Jakšić, a monument to the Russian saint Sergius of Radonezh, as well as busts of the poets Branko Radičević and Mika Antić. The central point coordinates are 45.25416 north latitude and 19.85063 east longitude.
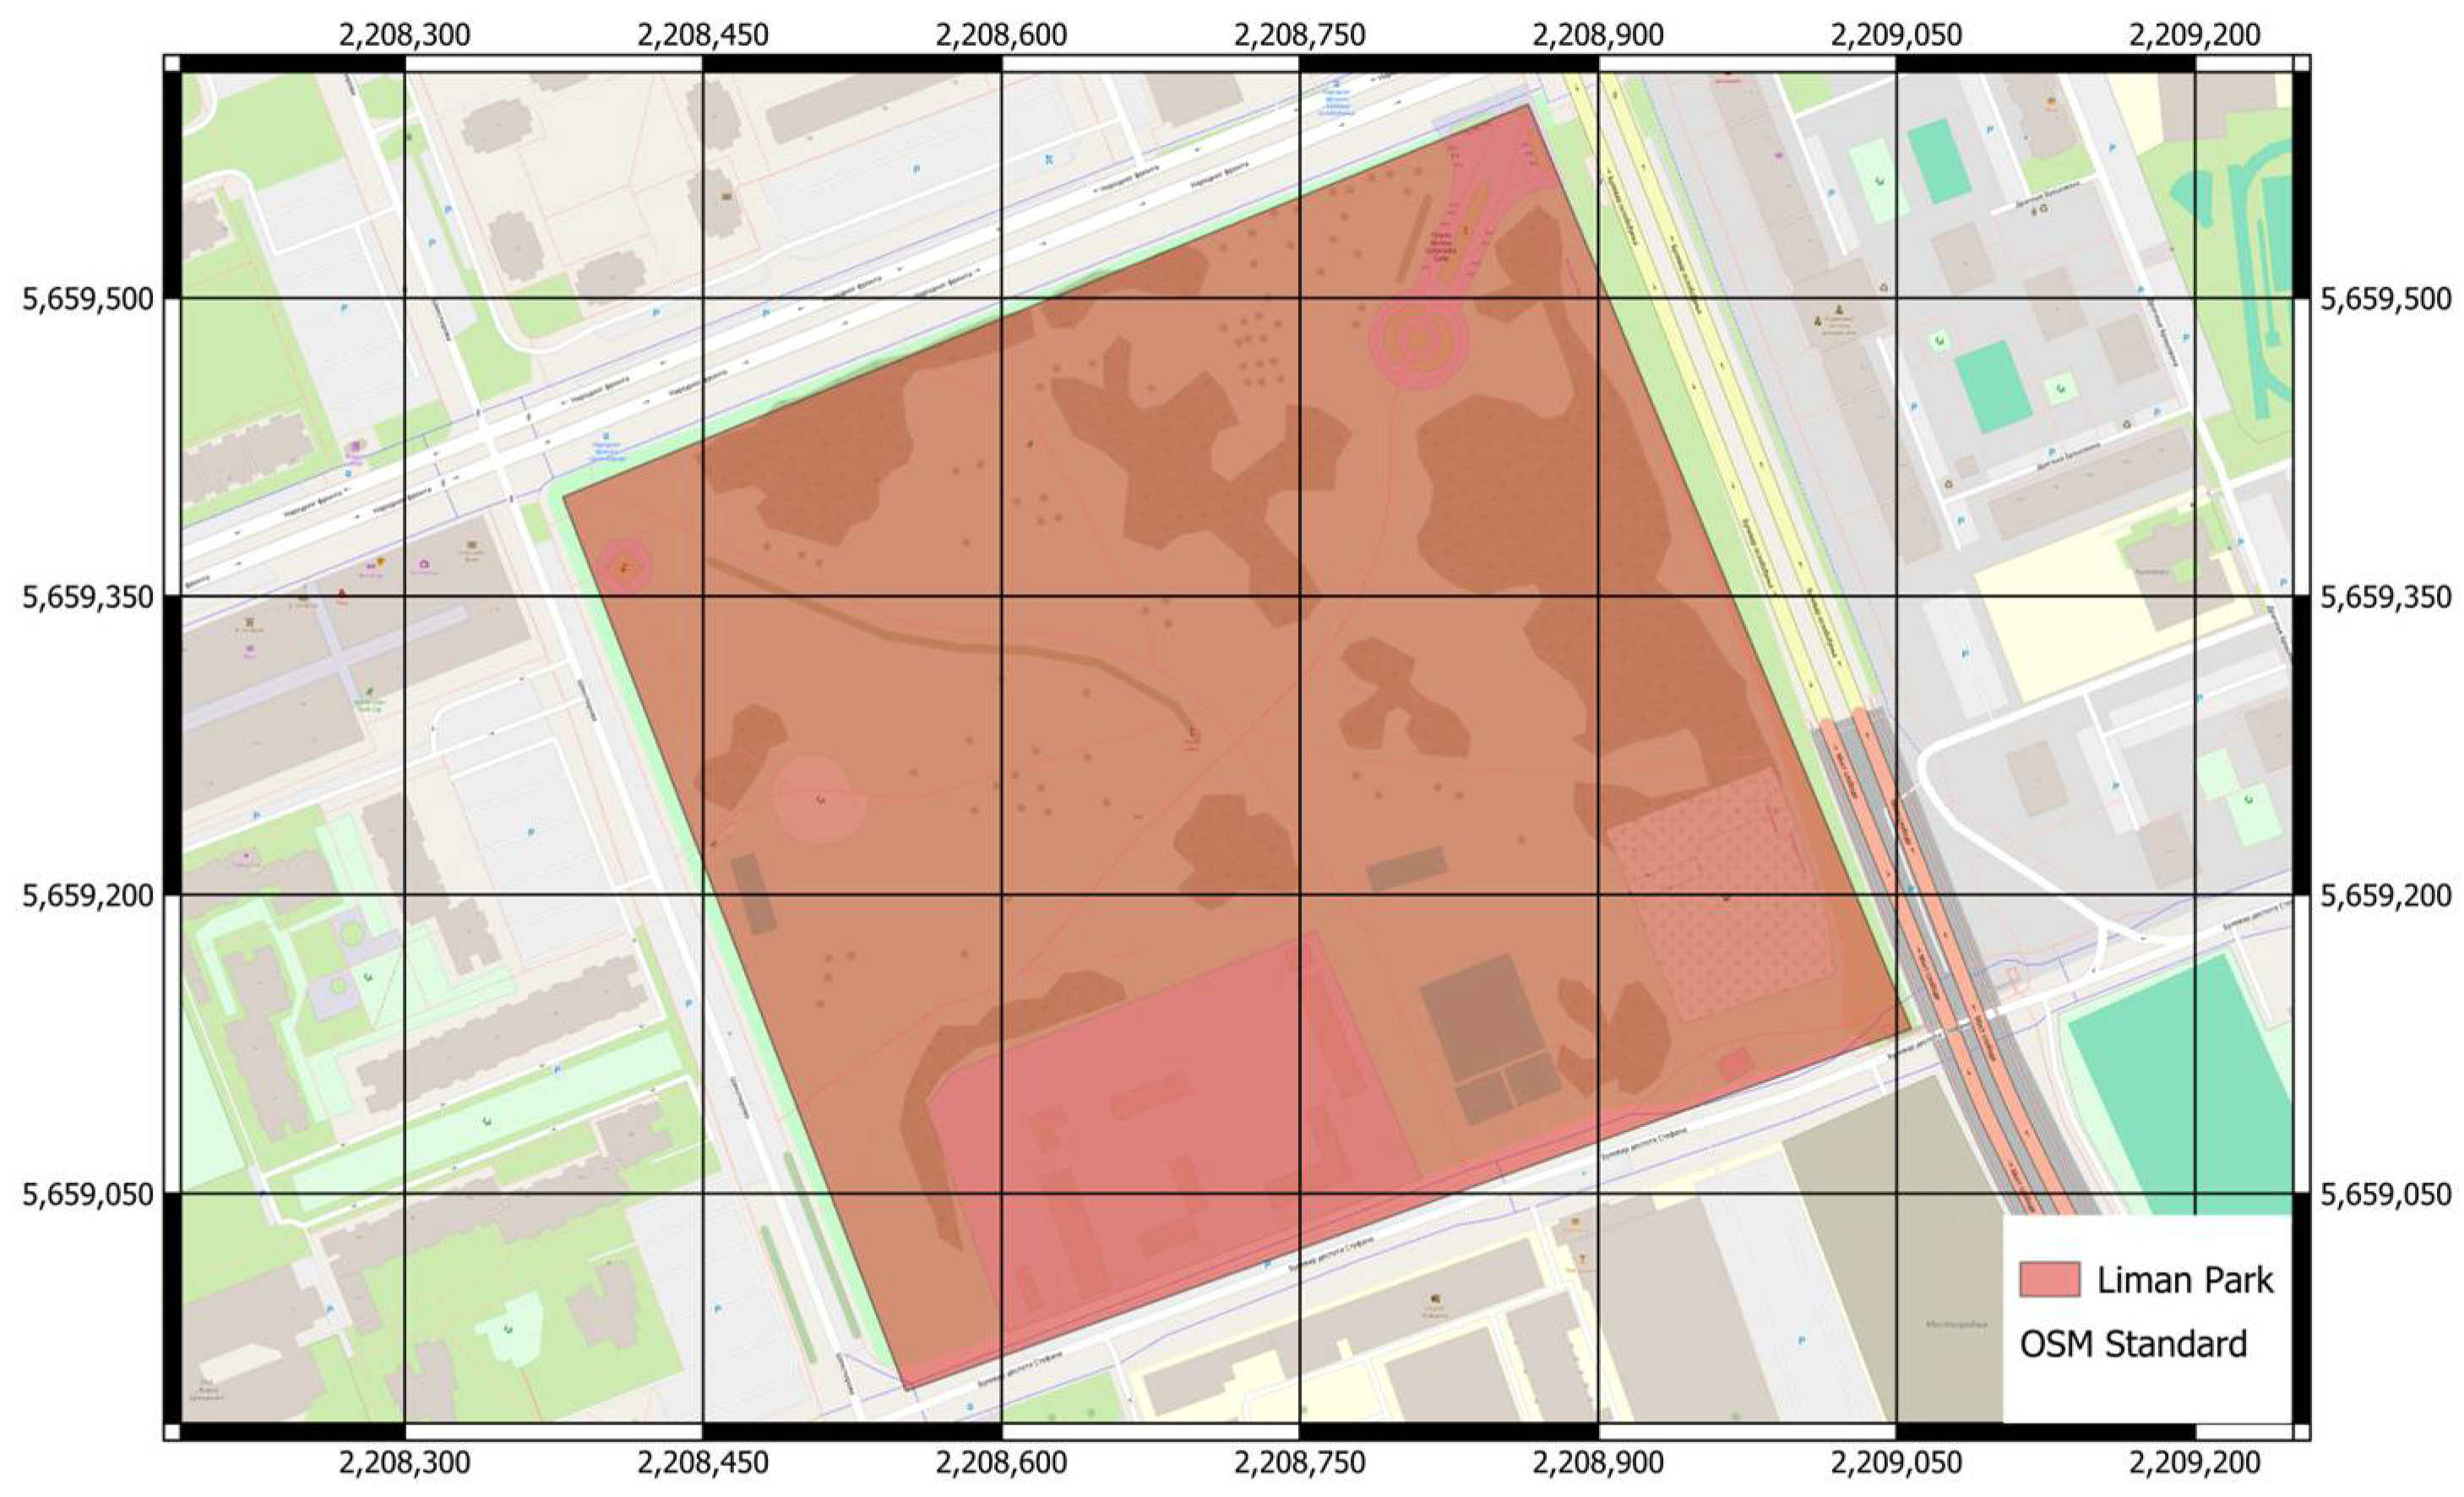
Liman Park is situated in the neighborhood of the same name in Novi Sad, near the Danube River and the Štrand beach, covering an area of 12.9 hectares (Figure 3). After the construction of residential blocks in this area in the 1950s, the surrounding area was arranged by planting willows and poplars as dominant species. Today, the park features a more complex composition, including a diverse dendroflora, a central promenade with a circular plaza, and a decorative rose garden. The promenade is lined with linear greenery—a tree-lined avenue consisting of species such as red oak (Quercus rubra L.) and Japanese pagoda (Sophora japonica L.) trees. The park also includes clusters of hackberry (Celtis australis L.), Norway maple (Acer platanoides L.), and Austrian pine (Pinus nigra Arnold). The central point coordinates are 45.23928 north latitude and 19.84121 east longitude.
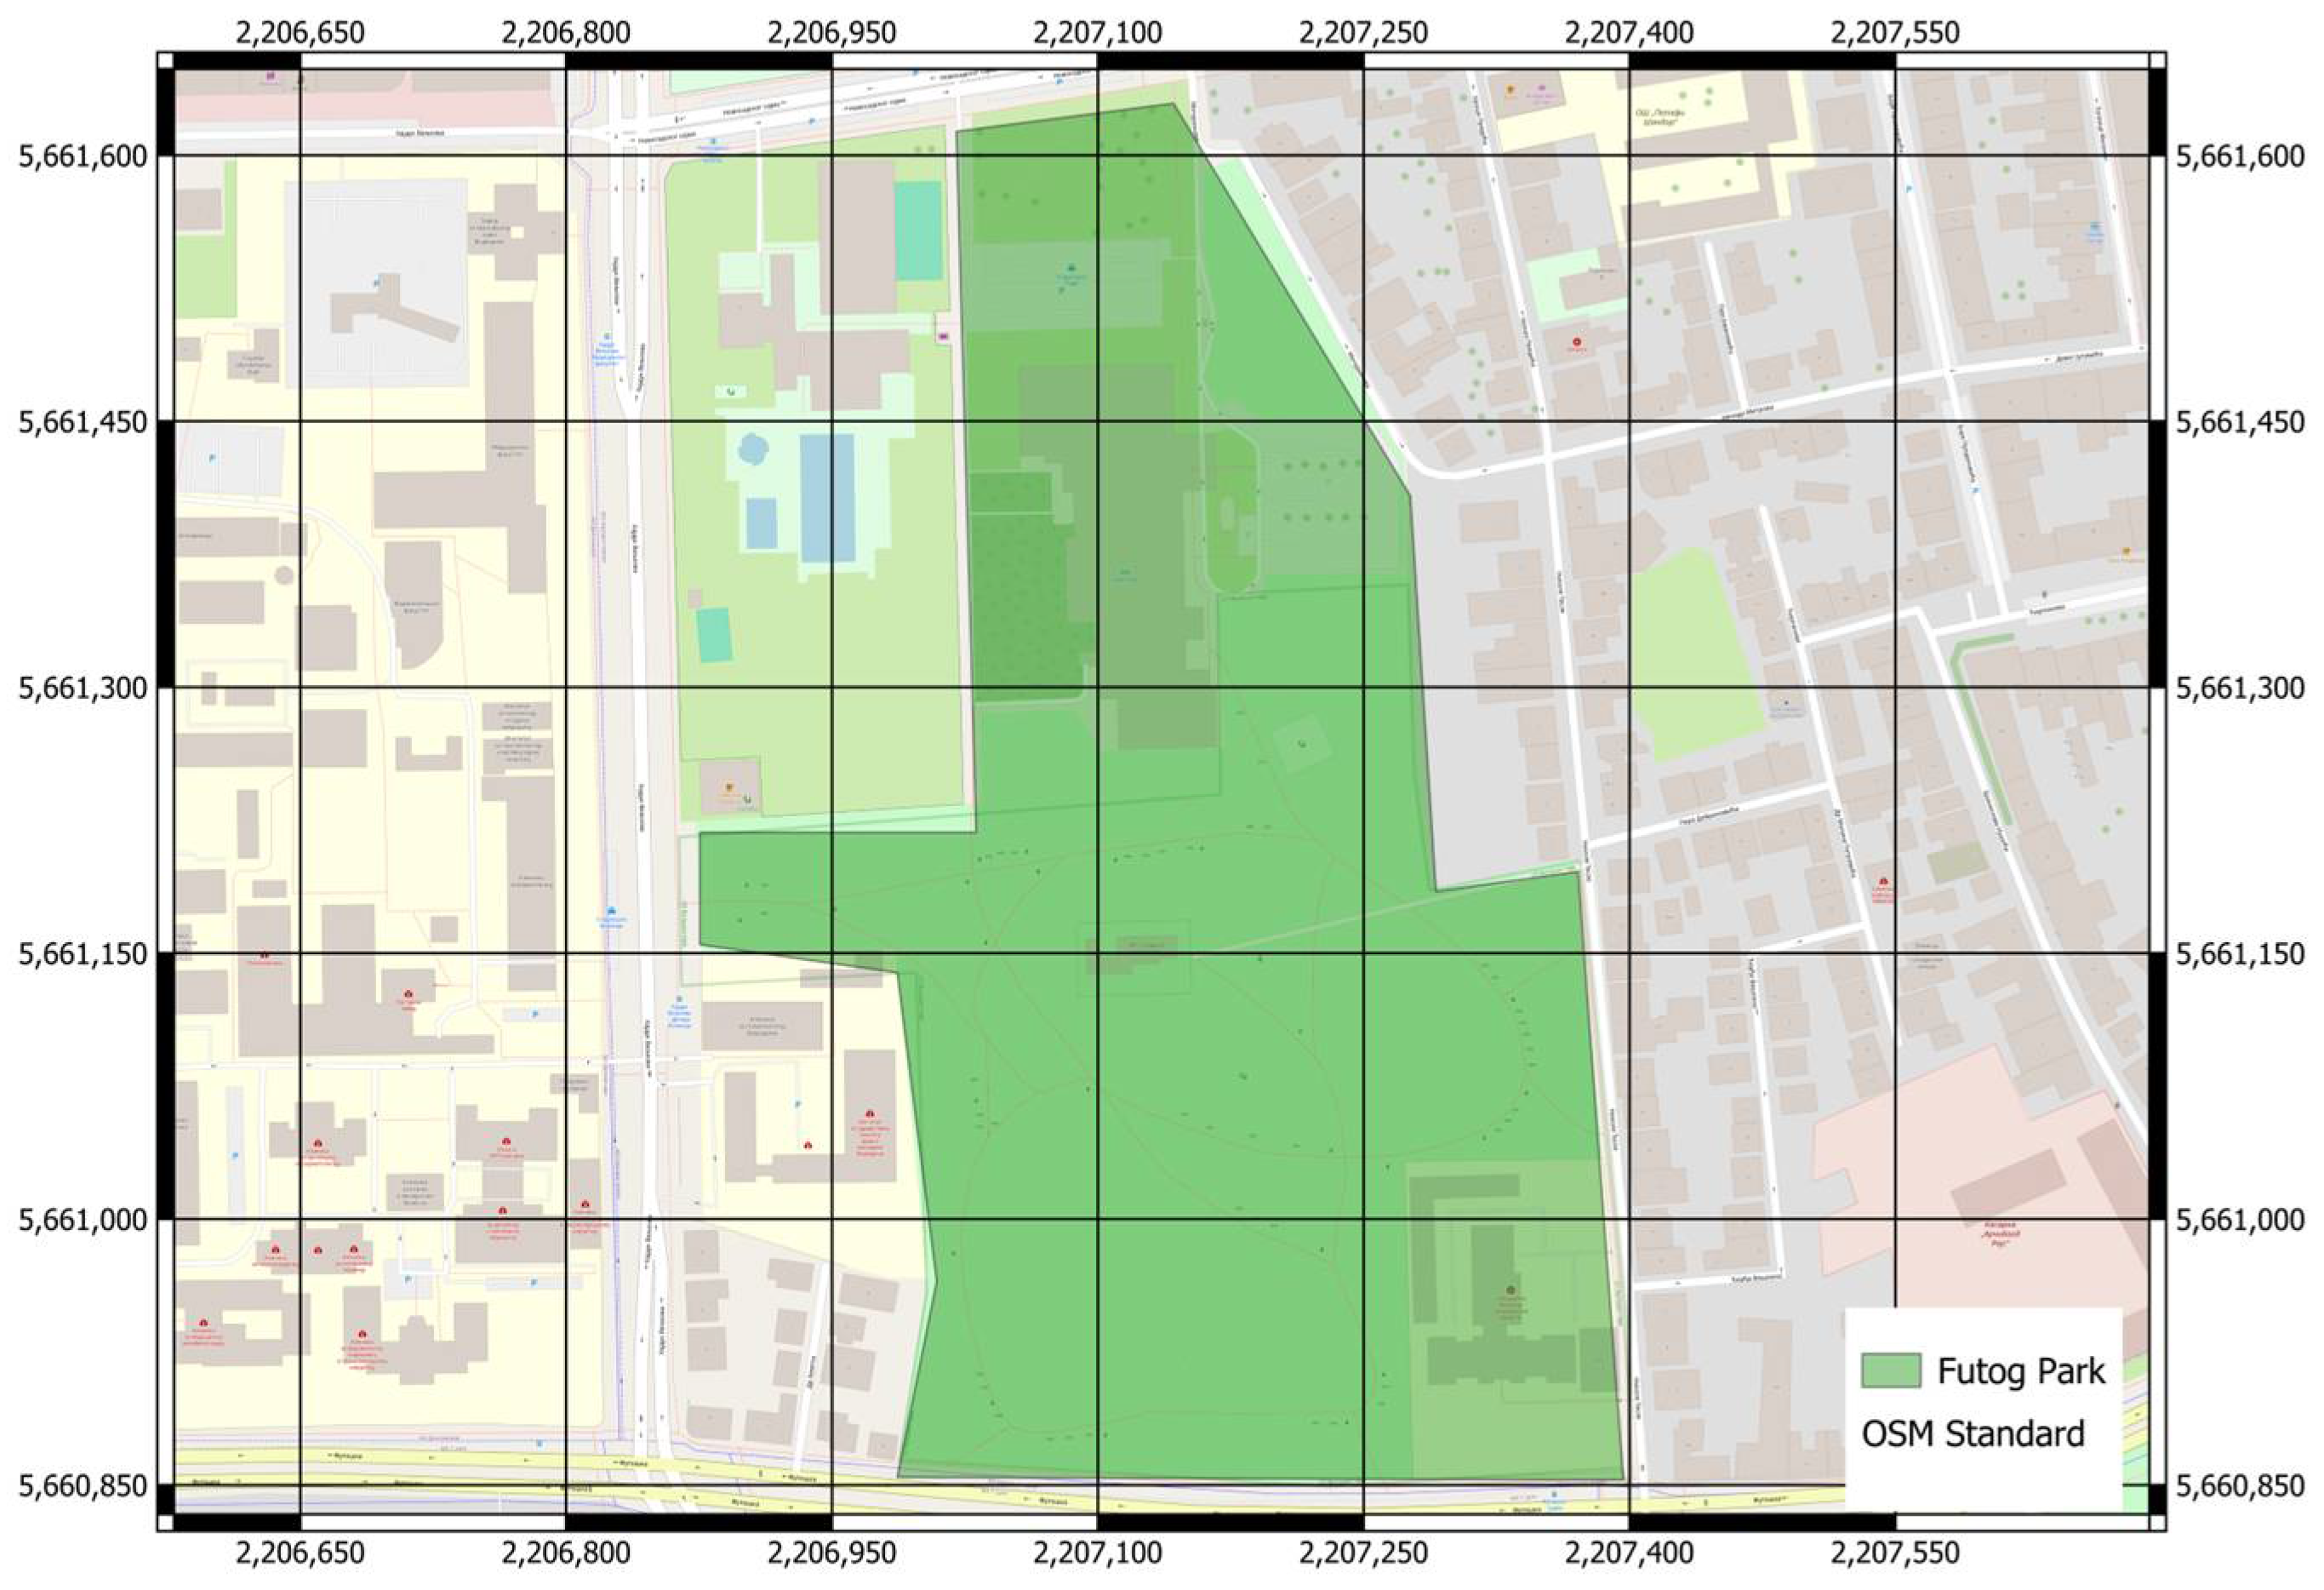
Futog Park is located near the Clinical Center of Vojvodina, covering an area of 12 hectares (Figure 4). The construction of the park was completed in 1910 (concurrently with the completion of the construction of the Jodna Spa), with a reconstruction taking place in 1964. The initial garden design was conceived by Armin Pec Junior, while Ratibor Đorđević was responsible for its reconstruction. The park is protected as a natural monument and hosts over 100 species and lower taxonomic units of woody species (varieties and forms). The park is home to specimens of Serbian spruce (Picea omorika Panč.)—a tertiary relic and endemic species of the Balkan Peninsula. Additionally, the park features specimens of exotic species such as ginkgo (Ginko biloba L.) and Californian cedar (Libocedrus decurrens Torr.). A lake, with accompanying walking paths and park furniture, is planned in the park. Along with Danube Park, Futog Park received the highest rating in a public opinion analysis conducted in the Study of Green and Recreational Spaces of Novi Sad. The central point coordinates are 45.2515 north latitude and 19.82676 east longitude.
Railway Park is located near the central railway and bus station, and it separates the residential area from public transport, serves for isolation, and provides space for walking and relaxation, covering an area of 4.2 hectares (Figure 5). According to a public opinion survey conducted in 2009, the park was rated as the worst green space in the city. Insufficient equipment and perceived lack of safety for visitors were highlighted as particular drawbacks. The park features spacious lawns and a dendroflora dominated by species such as Eurasian poplar (Populus euramericana (Dode) Guinier), Turkish hazel (Corylus colurna L.), horse chestnut (Aesculus hippocastanum L.), and silver birch (Betula pendula Roth.). The central point coordinates are 45.2647 north latitude and 19.824 east longitude.
Kamenica Park is located on the right bank of the Danube in Sremska Kamenica (Figure 6). It covers a total area of 42 hectares and is the largest park in Novi Sad. It was established during the period from 1834 to 1836 as part of the exterior landscaping around the Marcibanji and Karačonji family villas. The villa has been preserved to this day and constitutes one of the representative parts of the park complex. Valuable sculptures called the “Five Heads” date back to the time of park construction. They represent characters of Roman soldiers, and are located at the main viewpoint known as “Rose Hill.” Additionally, remains of the sculptures “Sphinxes” and “Reclining Girl” are preserved in the park zone. Deciduous species dominate the park, accounting for 94% of the total tree component. Two oak trees, over 200 years old, dominate the central part of the park. The park is protected as a natural monument. The central point coordinates are 45.22659 north latitude and east 19.8473 longitude.
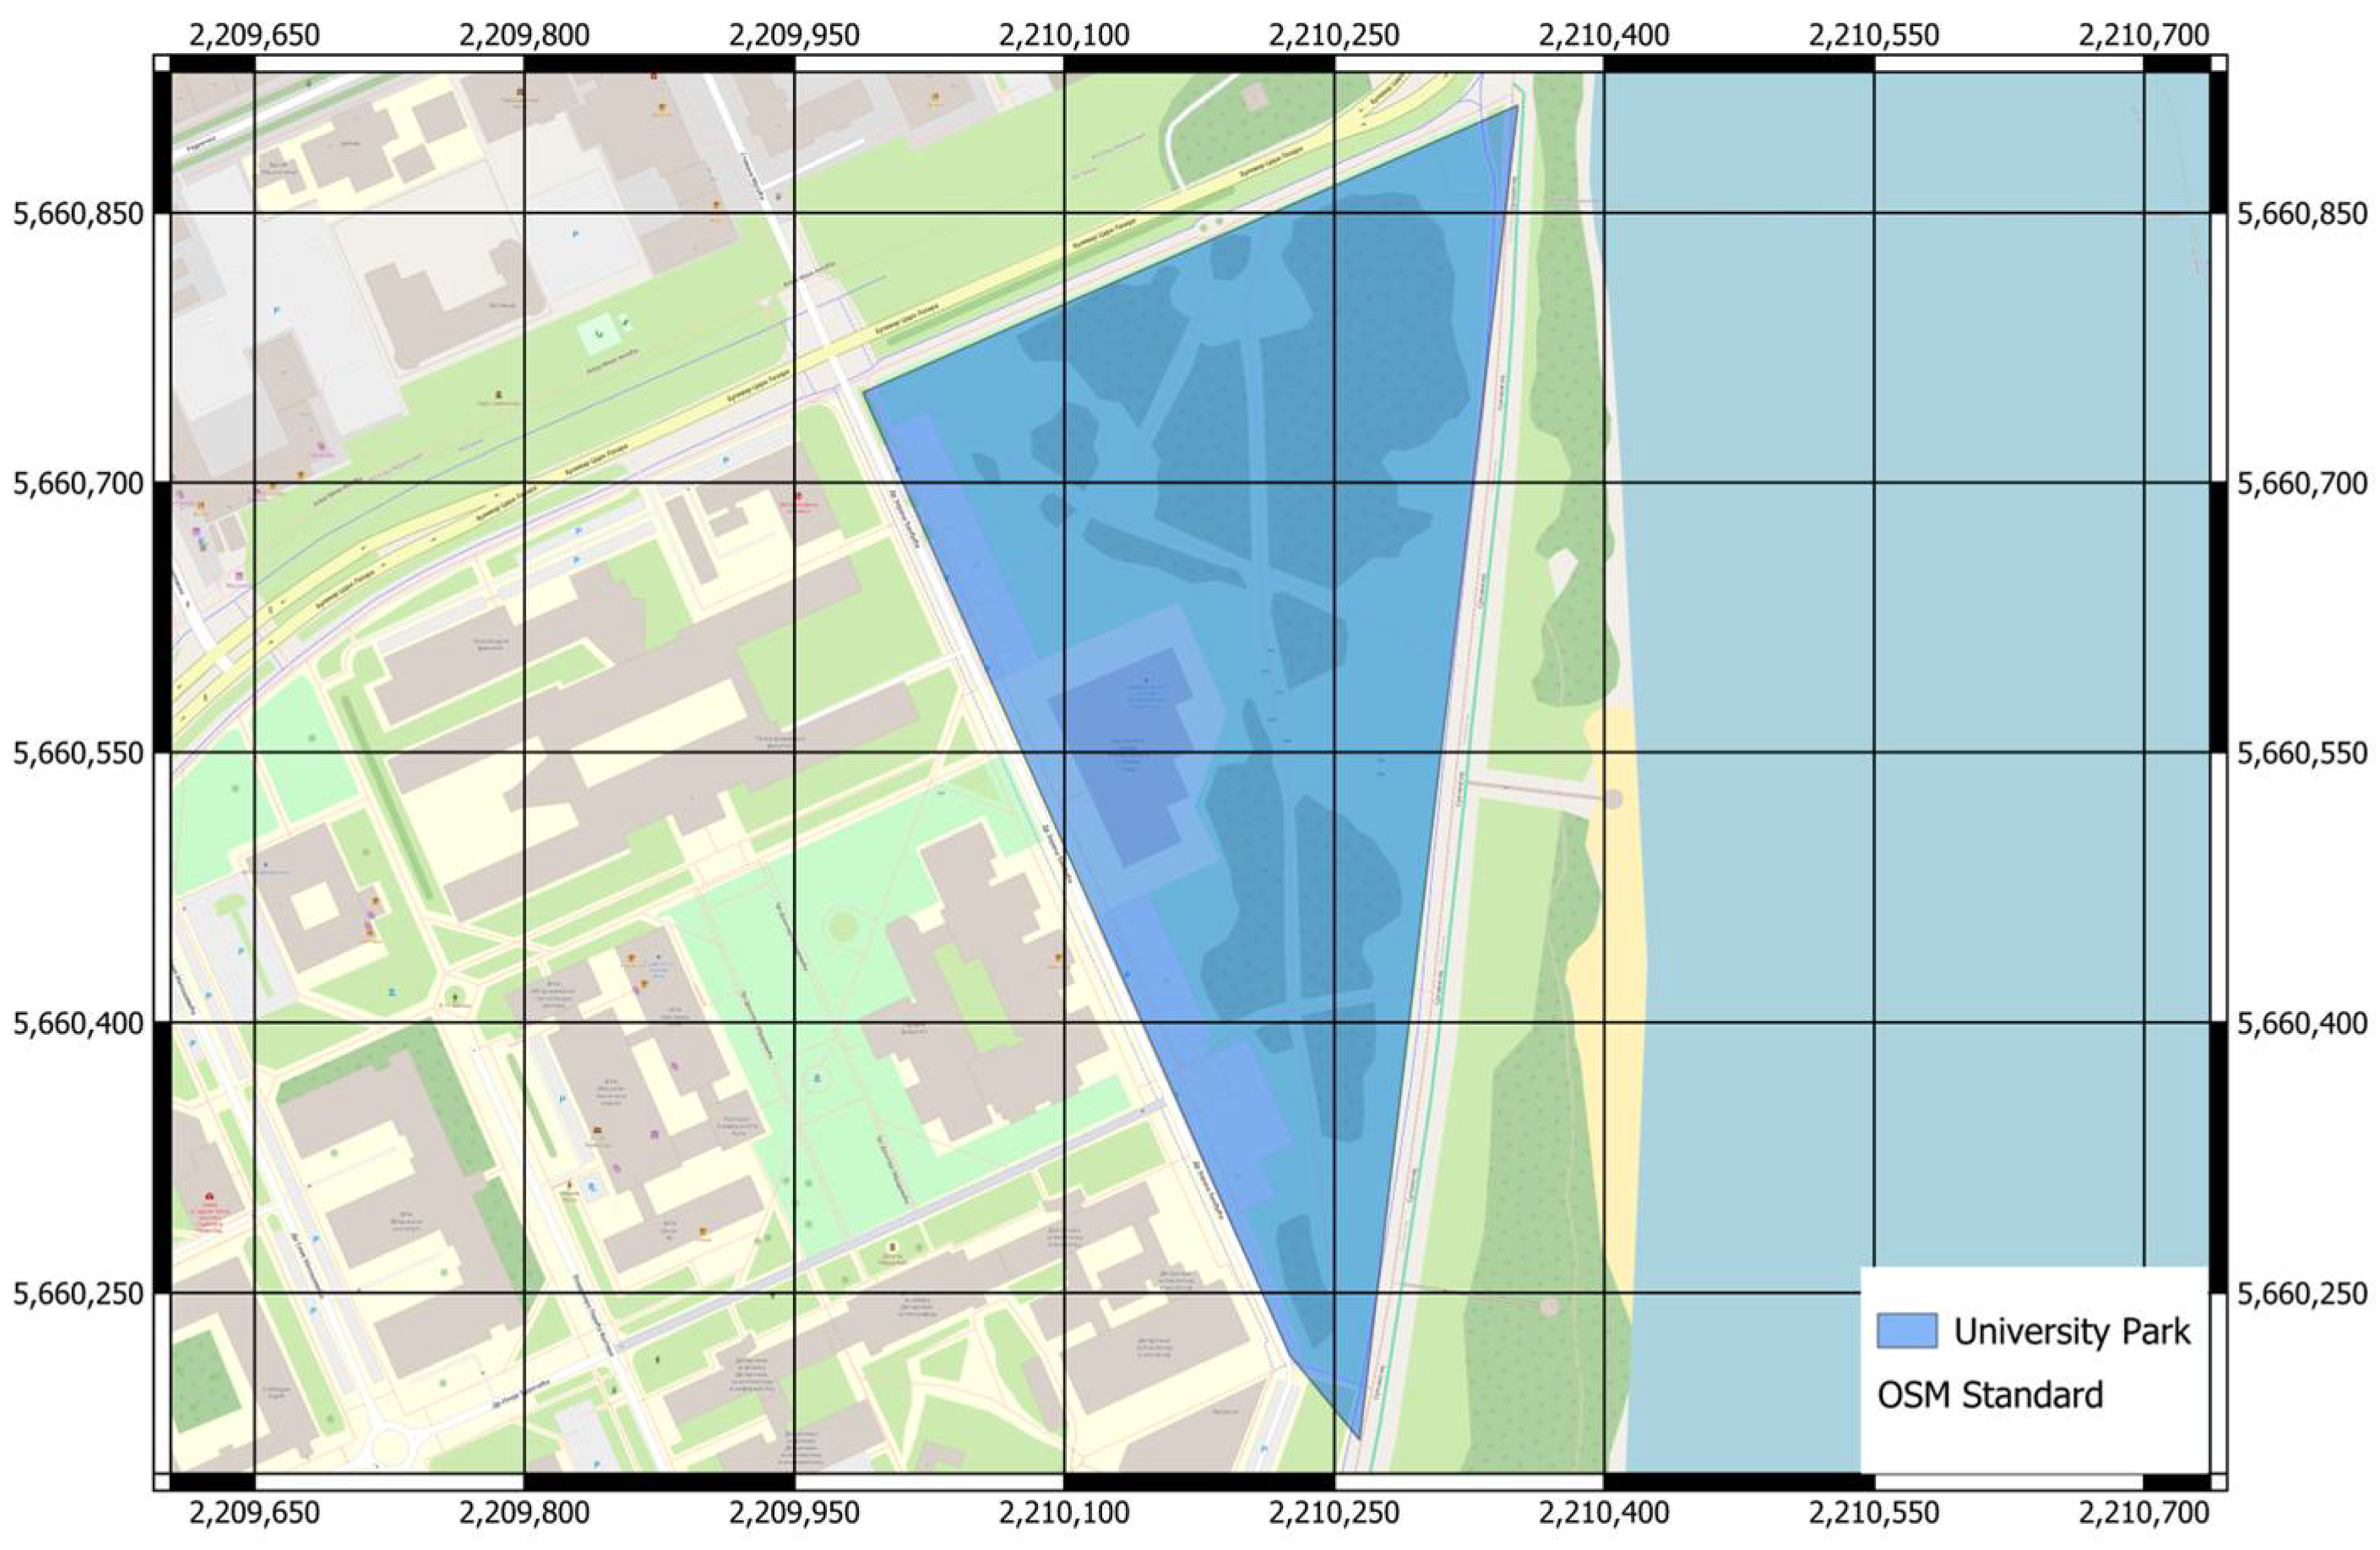
University Park is located near the Danube, in the eastern part of Novi Sad. The Rectorate building was erected in the park in 2013. It covers a total area of 5.9 hectares and has an elongated triangular shape (Figure 7). The park was part of the urban planning design for the university campus in 1954. Two major reconstructions were carried out in the park—the first reconstruction was related to repair of the consequences of park flooding that occurred in 1965. As a bio-engineering measure, deep planting on refilled sand was applied, and clones of poplar were used for planting; and these works were completed in 1969. The second reconstruction took place during 1980–1981 as part of the quay landscaping, providing a direct connection between the park and the Danube River. A total of 13 species of dendroflora are registered in the park, all belonging to the division Angiospermae. The park contains approximately 300 specimens of trees and shrubs. The most represented species are European–American poplar (Populus × - euramericana (Dode) Guinier), hackberry (Celtis occidentalis L.), and hornbeam (Carpinus betulus L.). The central point coordinates are 45.24713 north latitude and 19.85463 east longitude.

2.2. Questionnaire

The questionnaire was distributed electronically in January 2024 to two groups of students enrolled in the course of landscape architecture at the University of Novi Sad (Serbia); these were second- and fourth-year students. The idea behind choosing second- and fourth-year students was to test possible differences between attitudes of students at the early stage of studying and students completing their undergraduate studies. The total number of respondents was 68 (46 female and 22 male), of which 40 are second- year students and the remaining 28 are fourth-year students. This number of students is equal to the total number enrolled in the corresponding years of study at the University of Novi Sad.
The questions were defined as both closed and open-ended questions, and this is elaborated in Table 1.
The results were processed using different statistical tests. Chi-square test was used to test whether there are statistically significant differences between the distributions of empirical (observed) frequencies of categorical variables. Pearson’s coefficient of contingency ( C = χ 2 / ( χ 2 + N ) ) describes the degree of correlation of the variables. Analysis of variance (ANOVA) and multivariate analysis of variance (MANOVA) with Tukey’s HSD was performed to simultaneously test the relationships between dependent and categorical variables. The significance for all tests was p < 0.05. All results were analyzed using Statistica software (v. 14.1) [62].

3. Results

3.1. Frequency of Visit and Year of Study

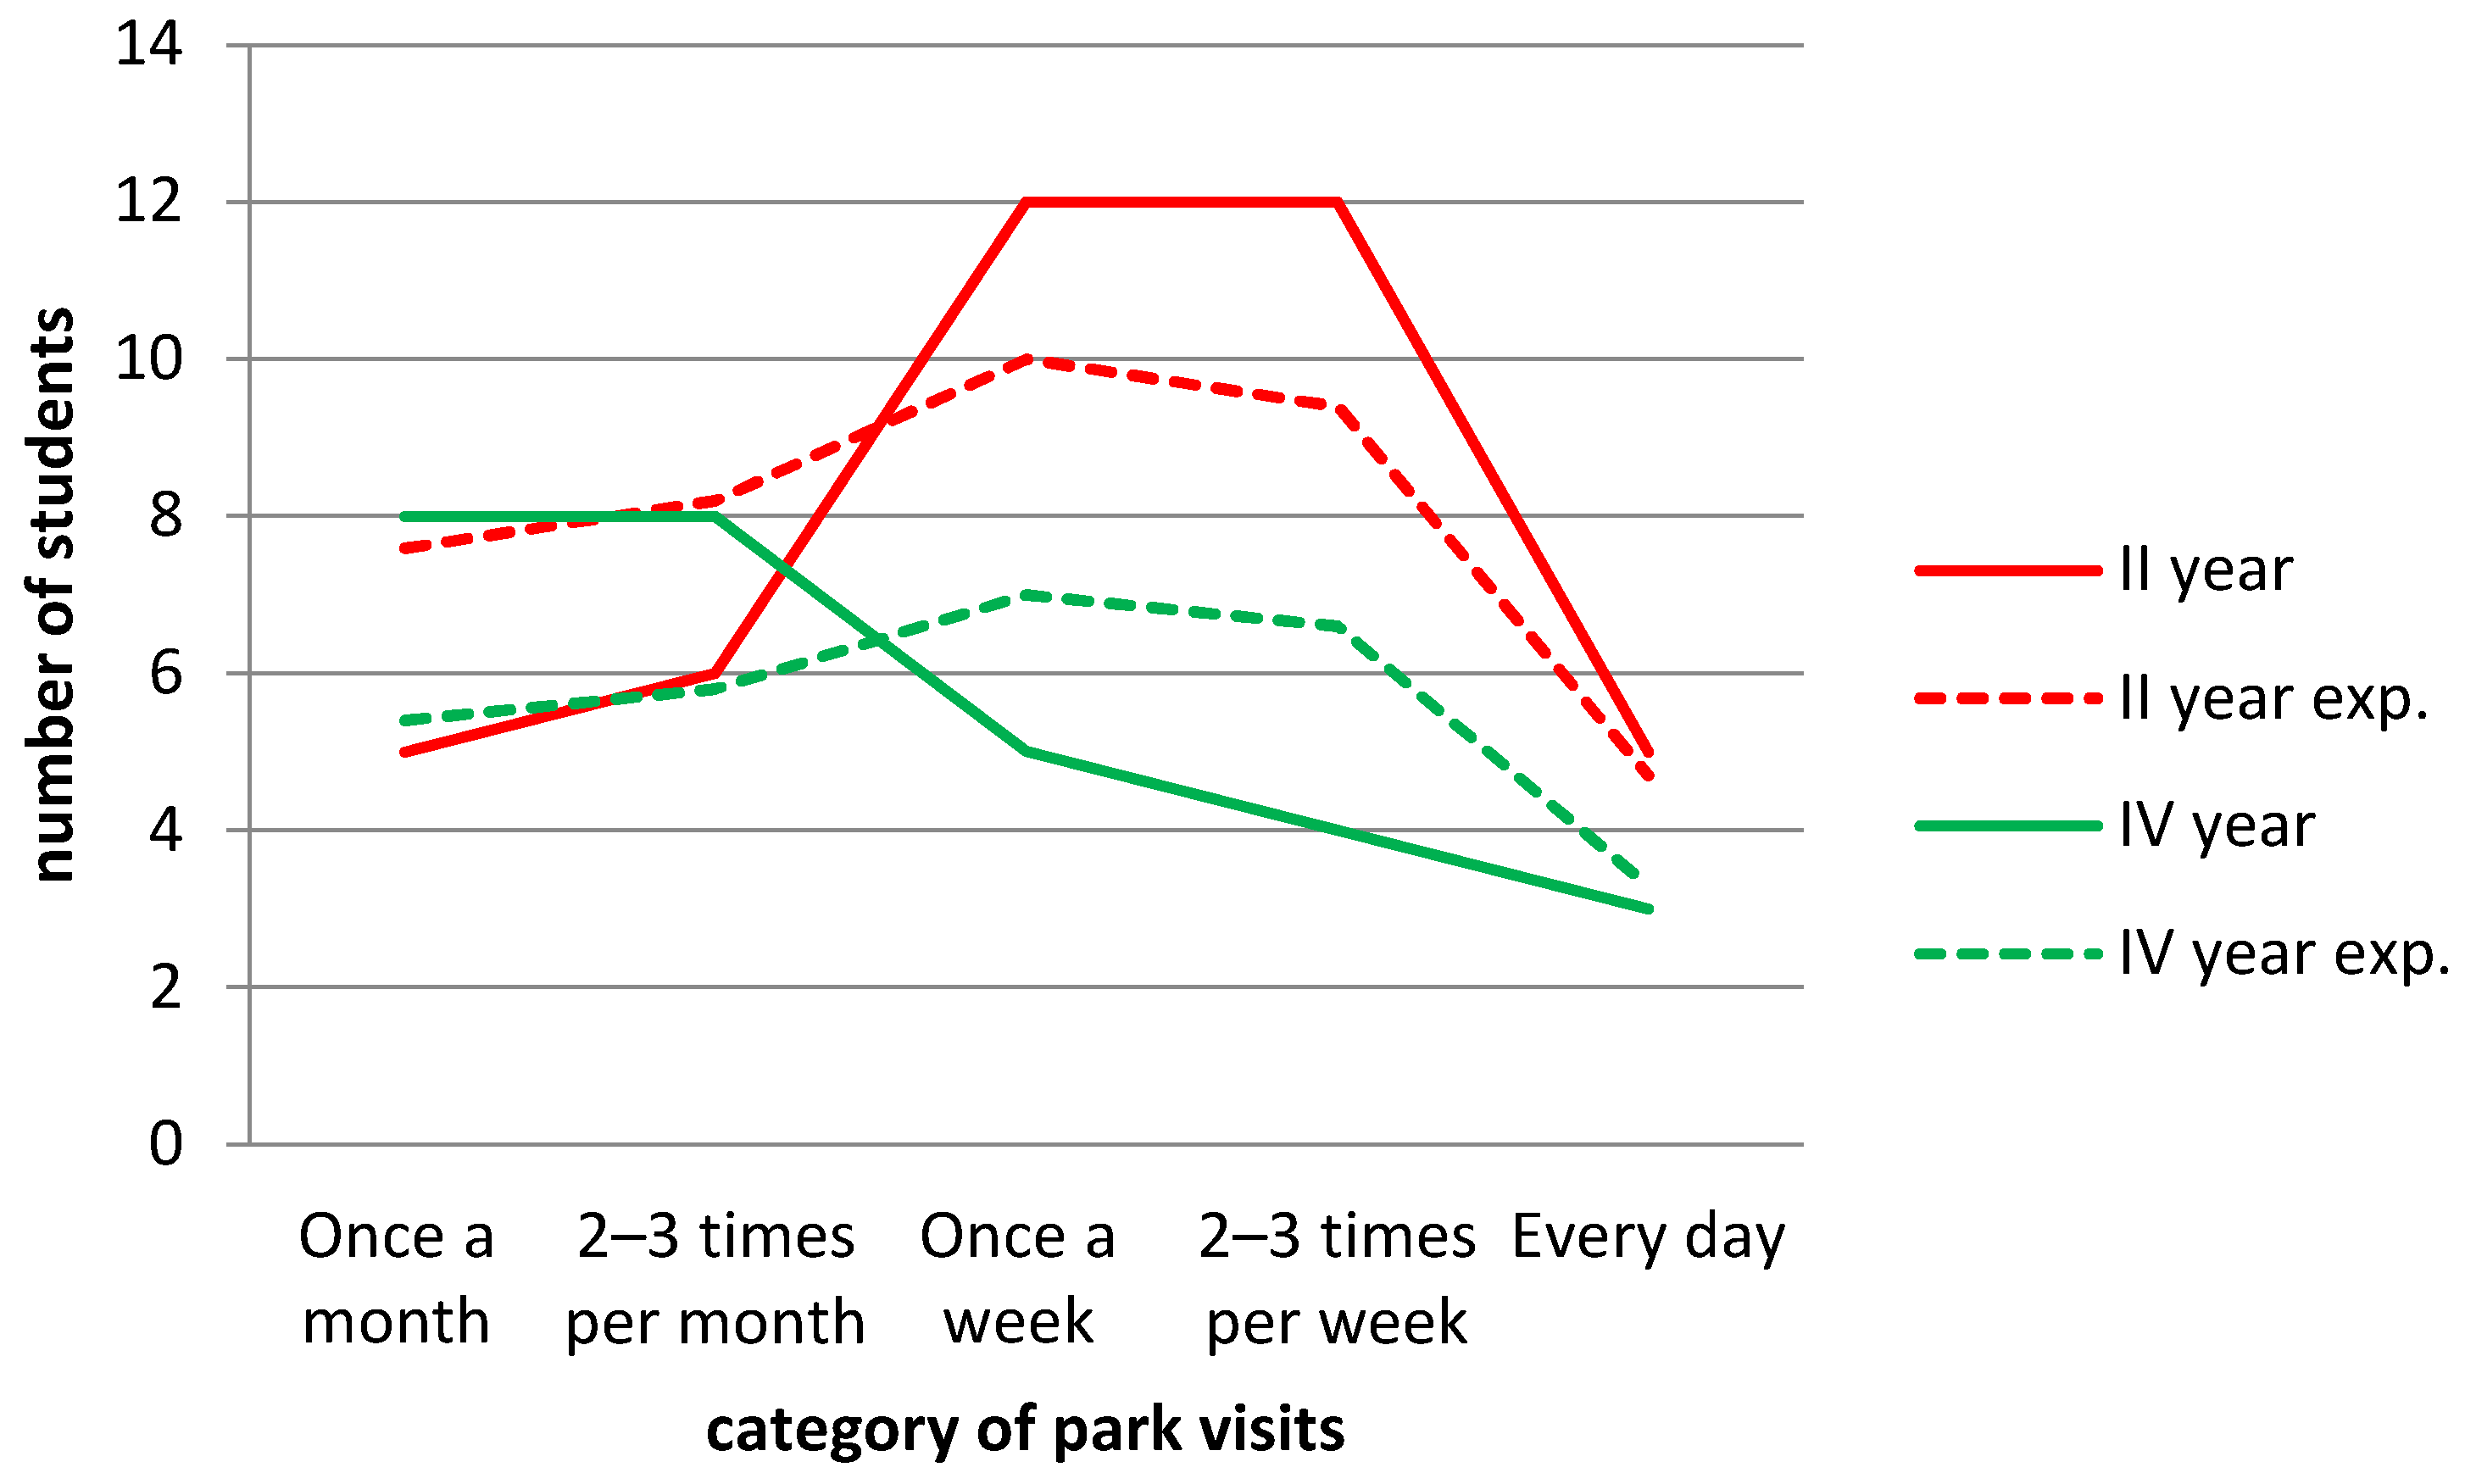
We divided visits to the parks into five categories and assigned a numerical rating from 1 to 5 to each category as follows: visits once a month are valued with a rating of 1, visits two to three times a month with a rating of 2, visits once a week with a rating of 3, visits two to three times a week with a rating of 4, and daily visits with a rating of 5. We denote the actual number of students visiting the park, depending on the category of visit, with f o , while we denote the expected number of students in each category with f t (Figure 8 and Table A1).
The null hypothesis, H 0 , is that the distribution of the number of students by category of visits does not depend on the year of study (i.e., the frequency of visits and the year of study are independent variables). The alternative hypothesis, H 1 , is that there is a dependency between year of study and number of visits. For the data presented in Table 2, the χ 2 test yielded χ 2 4,68 = 6.4434 , p = 0.16839, so the null hypothesis is not rejected. The Pearson contingency coefficient (C), which describes the degree of correlation between the mentioned variables, was C = χ 2 / ( χ 2 + N ) = 6.4434 / ( 6.4434 + 68 ) = 0.294 , indicating a slight correlation between the variables, but one that is not statistically significant. However, it should be noted that the number of second-year students who visit parks once a month and 2–3 times a month is lower than the expected number, while the number of second-year students who visit parks once a week, 2–3 times a week, and daily is higher than the expected number. For fourth-year students, the situation is reversed.
There was a statistically significant difference in the frequency of park visits according to the year of study (Table 2). Second-year students visit parks more frequently compared to fourth-year students (on average, slightly more than once a week).

3.2. Frequency of Visits and Gender of Students

The number of students who visit parks in the specified five categories and relative to gender is given in Figure 9 (Table A2). The expected number is provided in parentheses. The null hypothesis, H 0 , is that the distribution of the number of students by category of visits does not depend on gender (i.e., the frequency of visits and the gender of the participants are independent variables). The alternative hypothesis H 1 , is that there is a dependency between gender and number of visits.
For the data presented in Figure 9, the χ 2 test yielded χ 2 4,68 = 10.5005 , p = 0.03279 , so the null hypothesis is rejected. Therefore, there is a statistically significant difference in the distributions of the number of students by categories of park visits relative to gender. The Pearson contingency coefficient is now C = 10.5005 / ( 10.5005 + 68 ) = 0.366 . It is noticeable that no males visit parks on a daily basis, while more females visit parks daily than theoretically expected. Women most commonly visit parks once a week, while men visit 2–3 times a week.
Slightly more females visit parks on average (close to once a week), but this difference is not statistically significant compared to males (Table 3).

3.3. Length of Stay in Park and Year of Study

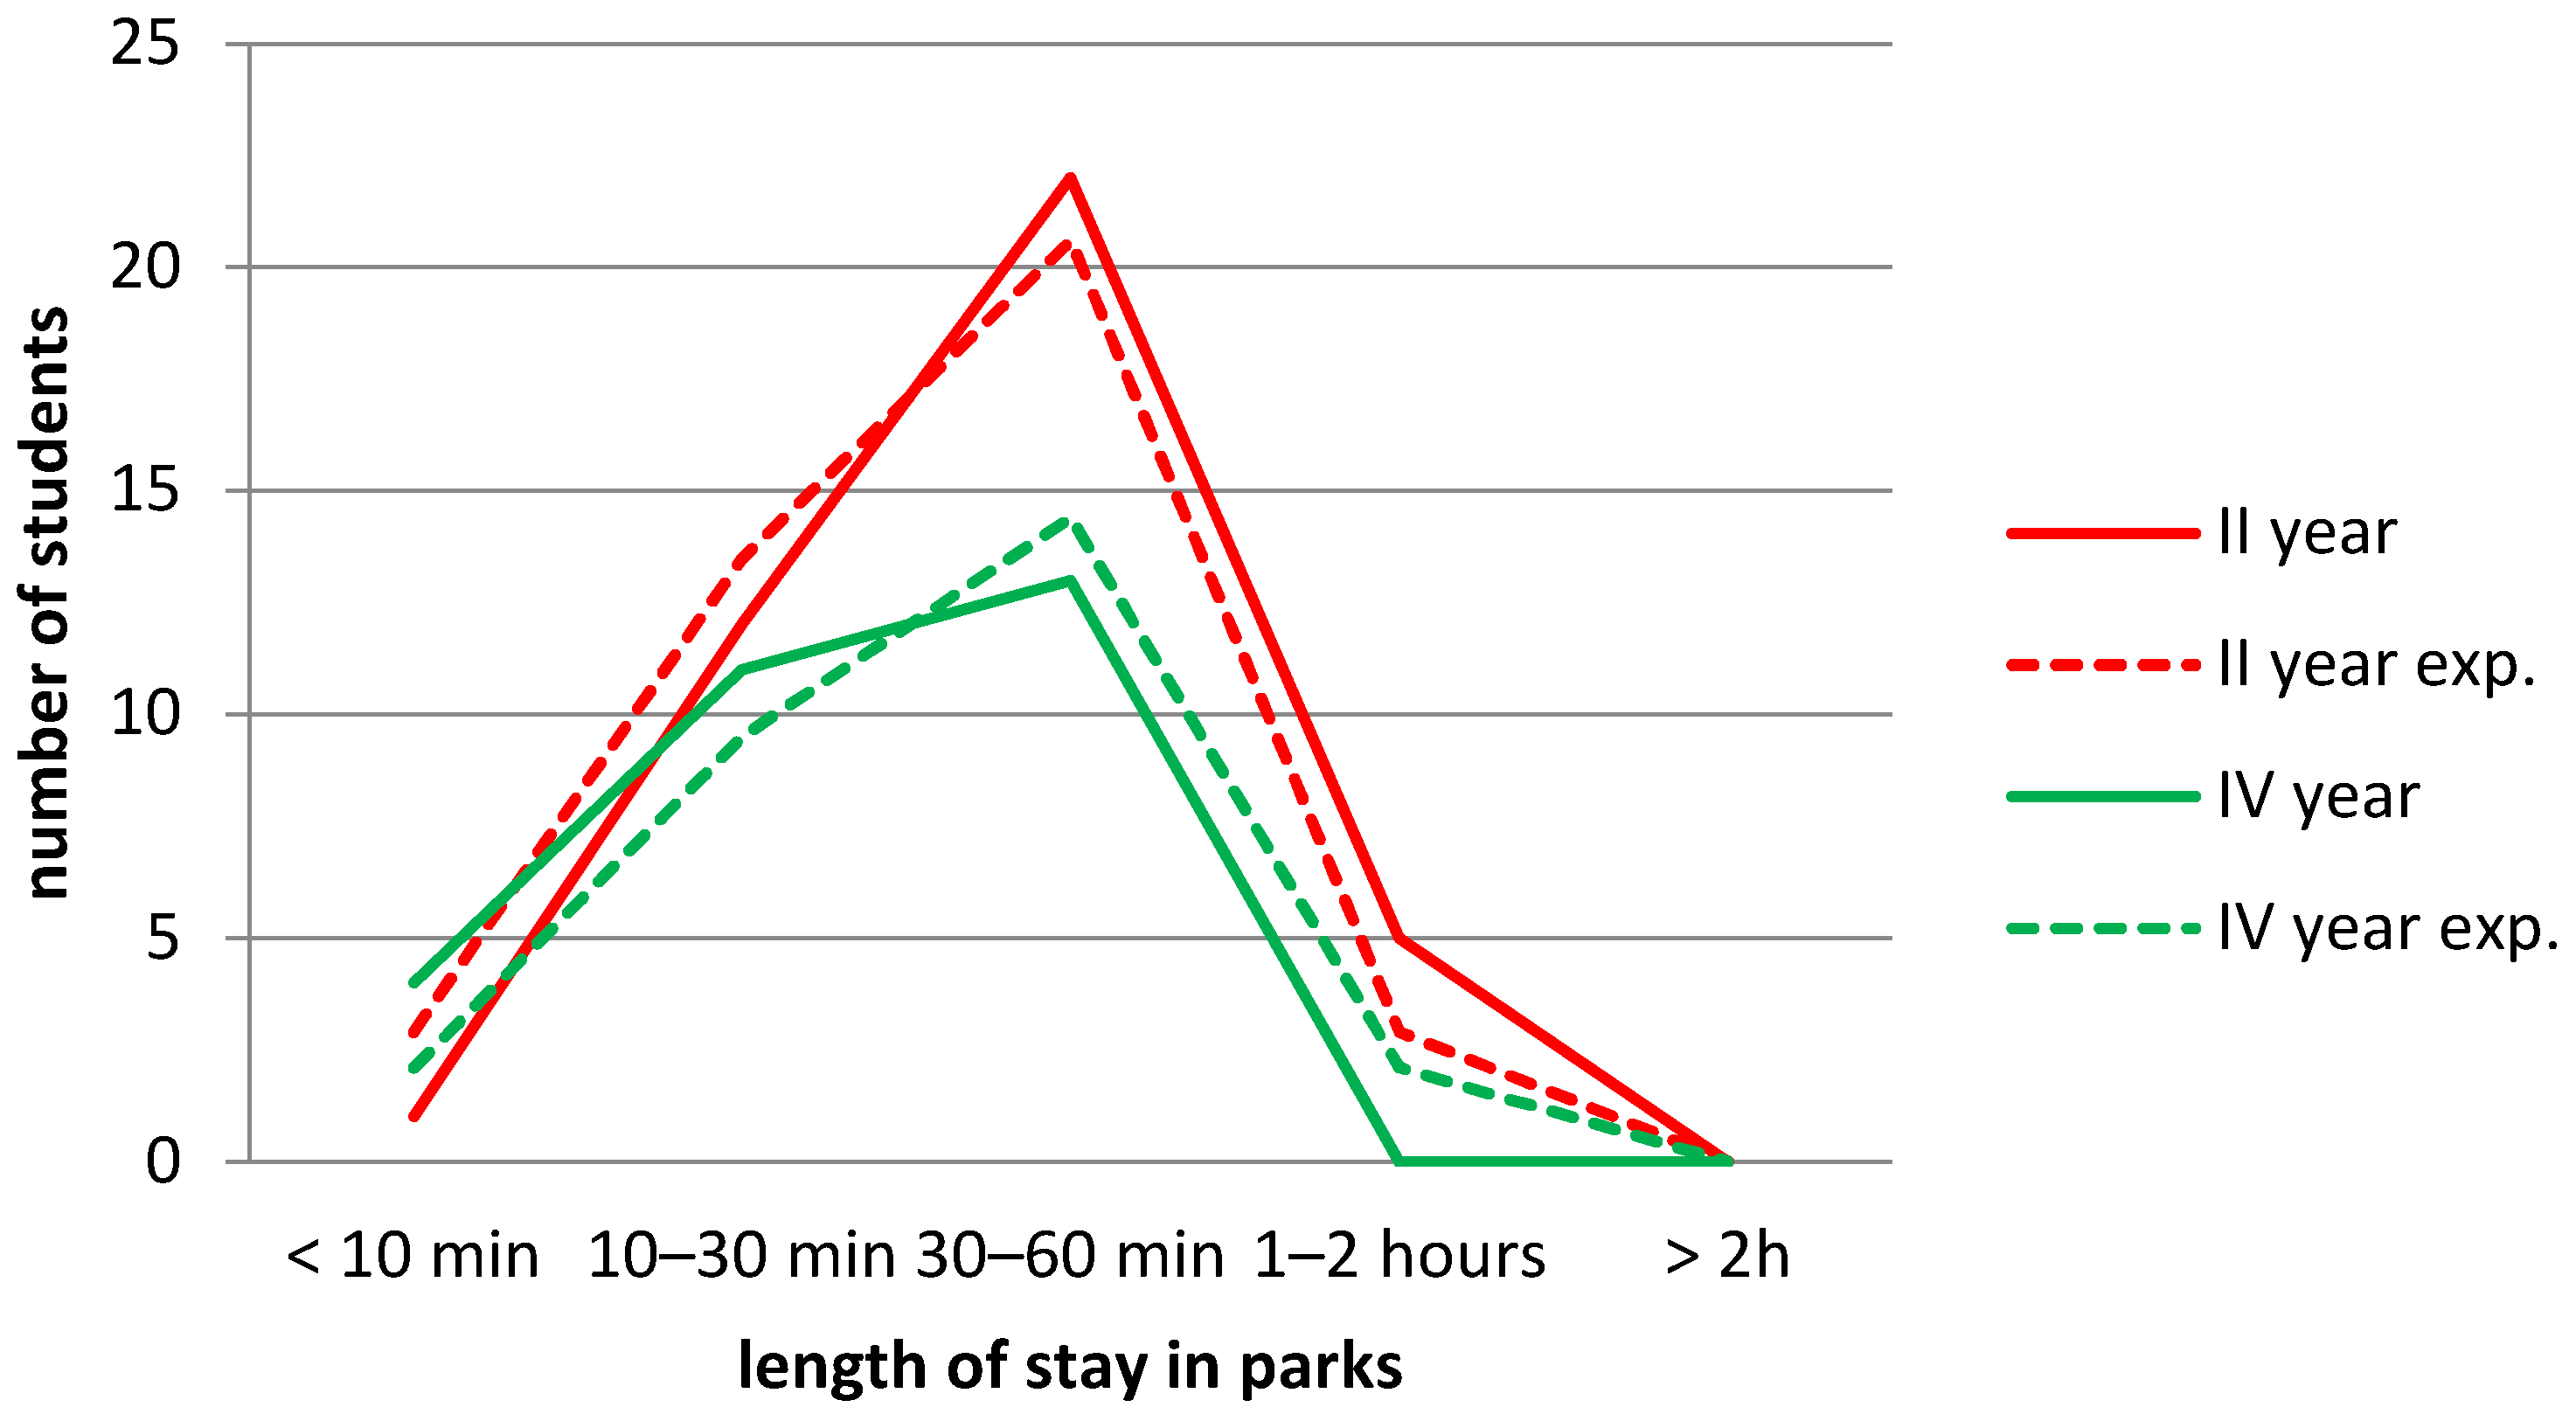
We also divided the length of stay in the park into five categories and assigned a numerical rating from 1 to 5 to each category as follows: a stay of less than 10 min was assigned a rating of 1, a stay between 10 and 30 min a rating of 2, a stay of 30 to 60 min a rating of 3, a stay of 1 to 2 h a rating of 4, and a stay longer than two hours a rating of 5. We denote the actual number of students staying in parks depending on the stay category as f o , while we denote the expected number of students in each category as f t  (Figure 10 and Table A3).
The null hypothesis, H 0 , is that the distribution of the number of students by category of park stay length does not depend on the year of study. The alternative hypothesis H 1 , is that there is a dependency between year of study and park stay length. For the data presented in Figure 10, the χ 2 test yielded χ 2 3,68 = 7.2661 , p = 0.06387 , indicating that the null hypothesis is not rejected. The Pearson contingency coefficient is now C = 7.2661 / ( 7.2661 + 68 ) = 0.311 . None of the students spend more than two hours in parks, and fourth-year students stay for up to 1 h in parks.
There is a statistically significant difference in the length of park stays between second- and fourth-year students (Table 4). Second-year students stay longer in the park, staying around 25 min more on average.

3.4. Length of Stay in Park and Gender of Students

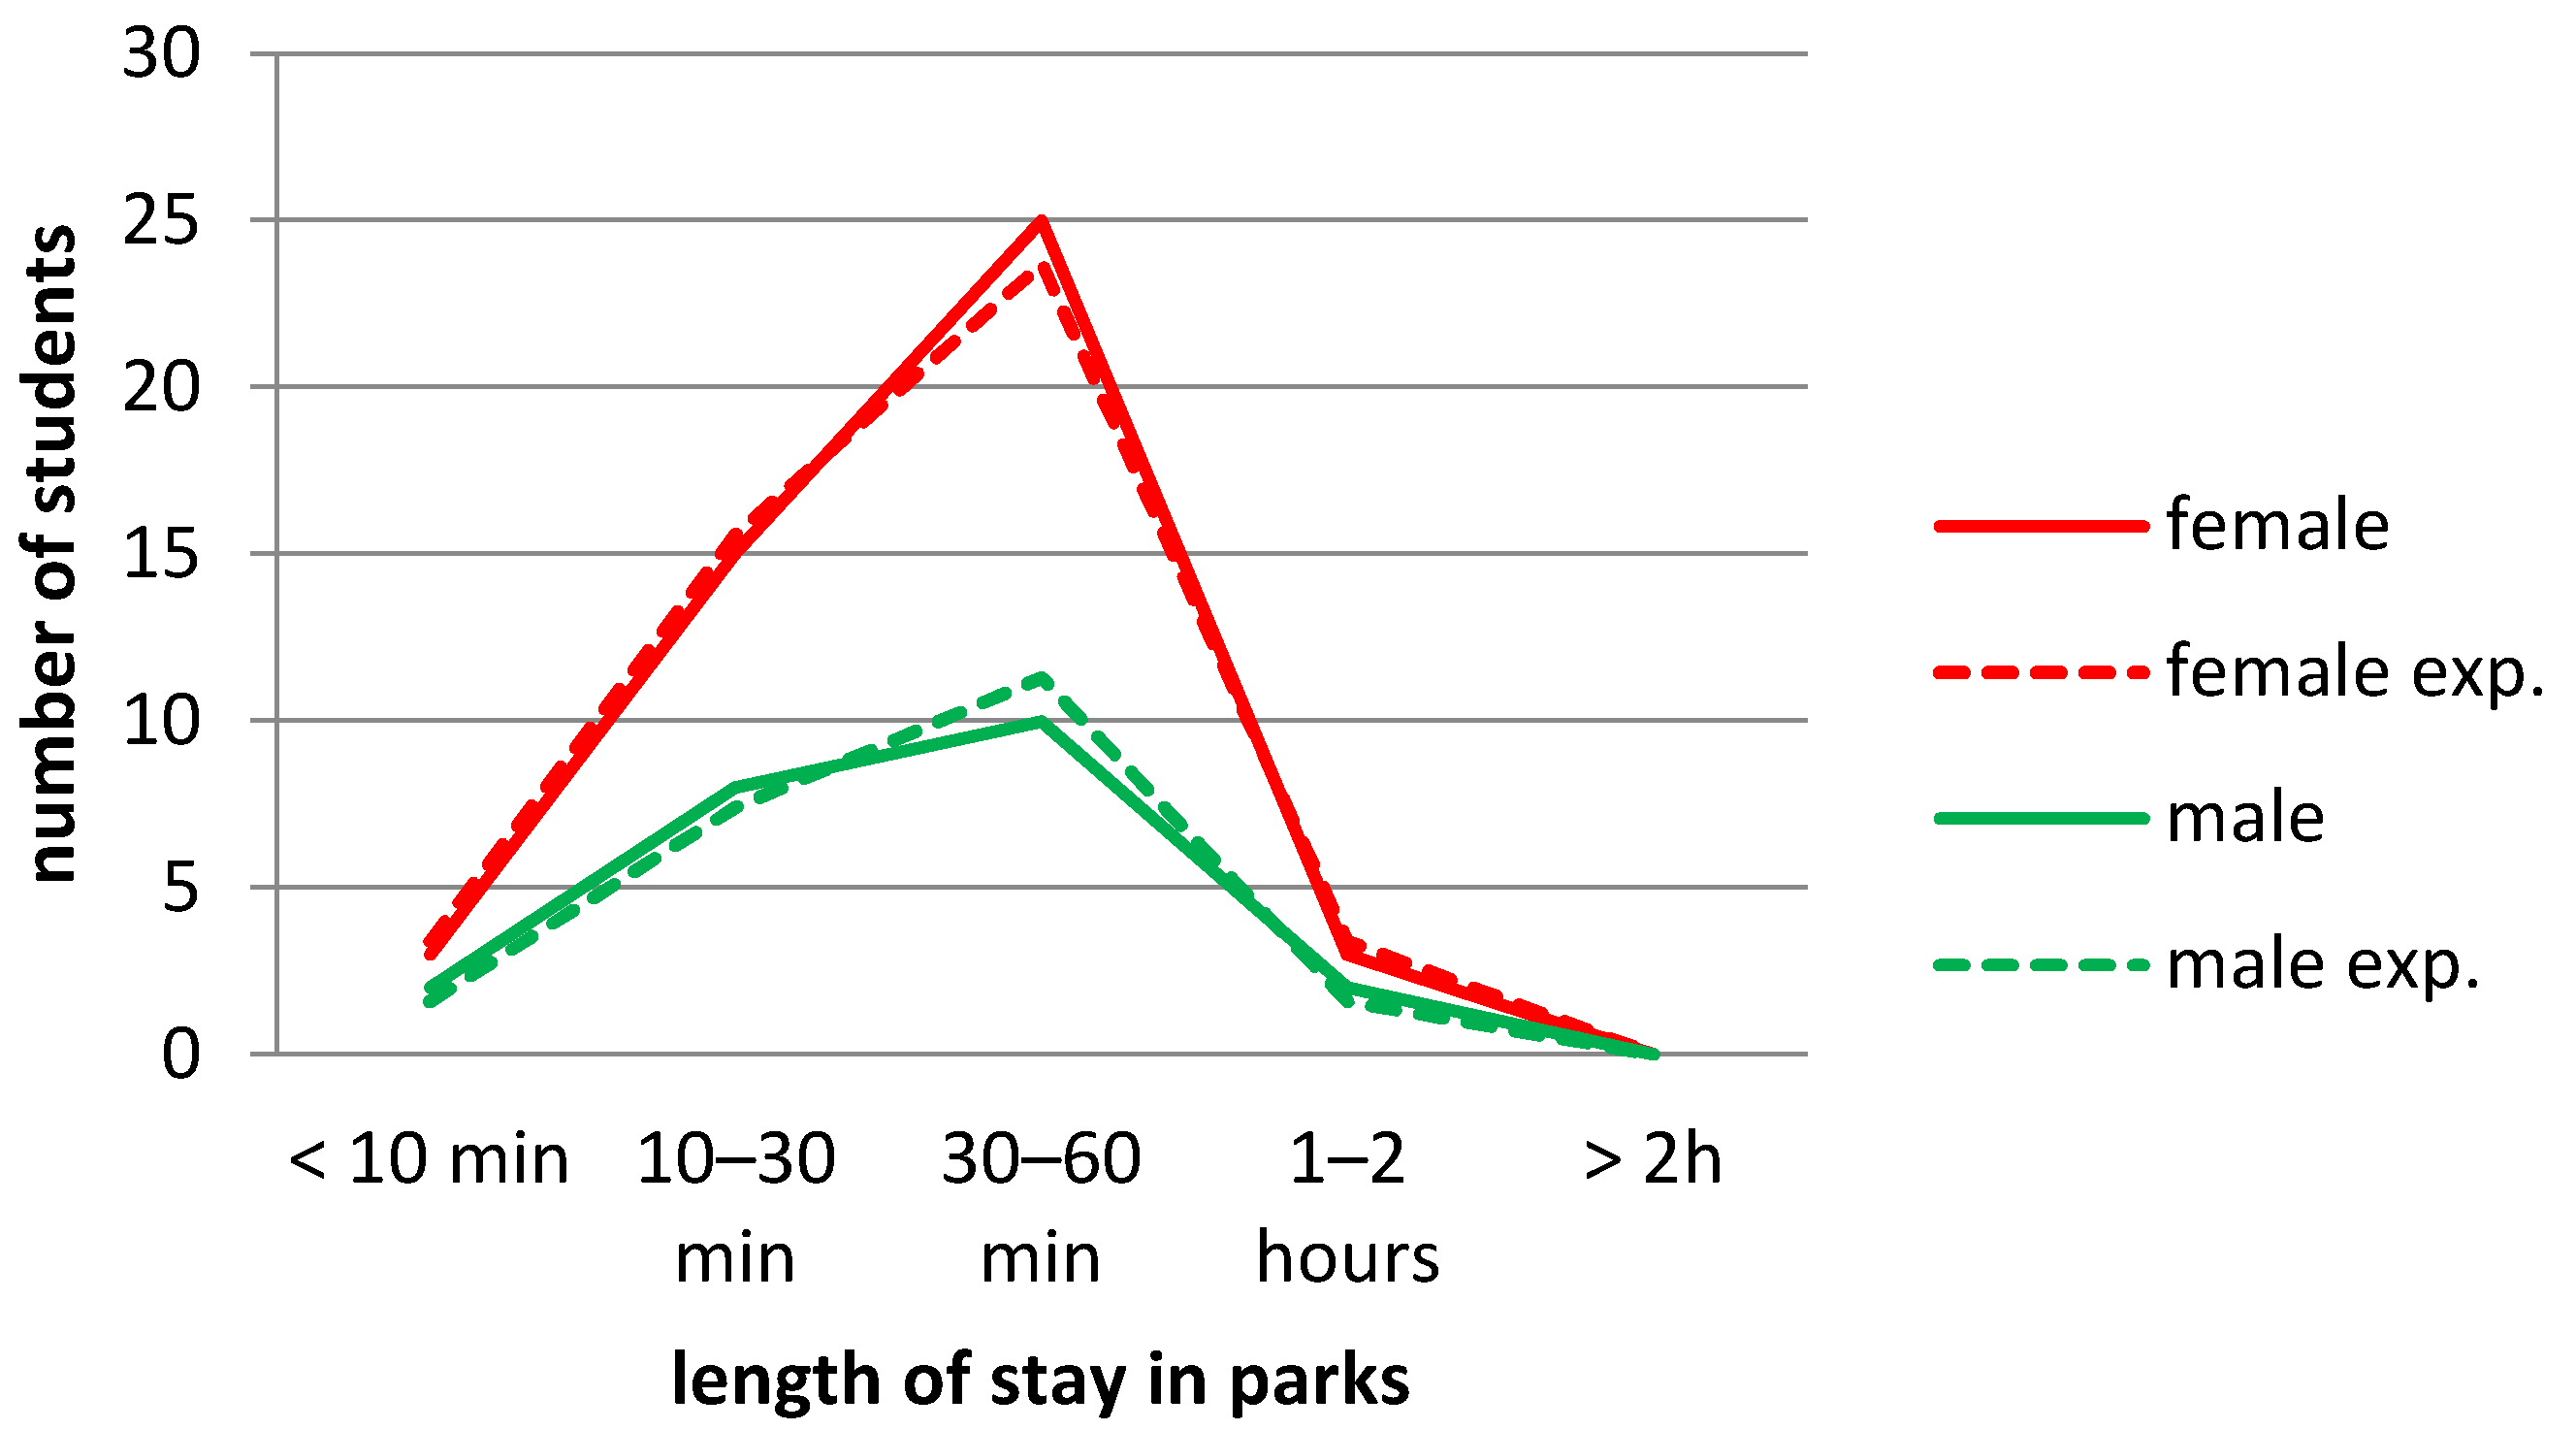
The number of students is provided for five categories of park stay length relative to their gender (Figure 11 and Table A4). The expected number is given in parentheses. The null hypothesis, H 0 , is that the distribution of the number of students does not depend on the gender of the participants in these five categories of park stay length. The alternative hypothesis, H 1 , is that there is a dependency between gender and park stay length.
For the data presented in Figure 11, the χ 2 test yielded χ 2 3,68 = 0.5579 , p = 0.90600 , indicating that the null hypothesis is not rejected. The Pearson contingency coefficient is now C = 0.5579 / ( 0.5579 + 68 ) = 0.090 , indicating high independence between the variables. Additionally, the theoretical distribution values are very close to the observed frequencies, meaning that the categories of gender and park stay length are independent, or in other words, the distributions of obtained park stay ratings do not statistically differ relative to gender.
Park stay length is not dependent on gender, with women spending slightly longer in the park on average, around 20 min (Table 5).

3.5. The Most Visited Parks in Novi Sad and Year of Study

The null hypothesis, H 0 , is that the distribution of the number of students by park is independent of the year of study. The alternative hypothesis, H 1 , is that there is a dependency between year of study and the indicated park that the student visits. We denote the actual number of students who chose which parks they most frequently visit as f o , while we denote the expected number of students as f t . For example, one can see that 27 second-year students visited University Park, while the expected number of second-year students visiting that park is 23.3 (Table A5).
For the data presented in Figure 12, the χ 2 test yielded χ 2 5,156 = 7.1297 , p = 0.2112 , indicating that the null hypothesis cannot be rejected. Therefore, there is no statistically significant difference in the distribution of visited parks relative to the year of study. The Pearson contingency coefficient, C = 7.1297 / ( 7.1297 + 156 ) = 0.209 , indicating a weak correlation. And Danube Park is the most visited, while Railway Park is the least visited (students in their fourth year do not visit it at all).

3.6. The Most Visited Parks in Novi Sad and Gender of Students

The null hypothesis, H 0 , is that the distribution of the number of students by park is independent of gender. The alternative hypothesis H 1 is that there is a dependency between gender and visits to indicated parks. We see, for example, that 20 male students visited Danube Park, while the expected number of male students visiting that park was 22.7 (Table A6).
For the data presented in Figure 13, the χ 2 test yielded χ 2 5,156 = 3.1732 , p = 0.67330 , indicating that the null hypothesis cannot be rejected. Therefore, there is no statistically significant difference in the distribution of visited parks relative to gender. The Pearson contingency coefficient is C = 3.1732 / ( 3.1732 + 156 ) = 0.141 , confirming the null hypothesis. Students of both genders visit Railway and Kamenica Parks the least.

3.7. Length of Stay and Frequency of Park Visits

Now, the categorical variable “length of stay in the park” is considered, while the dependent variable “frequency of park visits” has been transformed into numerical values from 1 to 5 according to the previously mentioned categories. The mean values of park visit frequency, standard errors, and confidence intervals are provided in Table 6.
We observe that students who spend less than 10 min in parks also have the lowest frequency of park visits, while the highest frequency is among students who stay in parks for 10 to 30 min (visiting parks once a week).
From the Tukey HSD test (Table 7), it can be observed that there was a statistically significant difference in the frequency of visits between students spending less than 10 min in parks compared to those spending 10–30 min (p = 0.016729) and 30–60 min (p = 0.026427).

3.8. Frequency of Park Visits and Length of Stay in Parks

Now, the categorical variable “frequency of park visits” is considered, while the dependent variable “length of stay in parks” has been transformed into numerical values from 1 to 5. The mean values of the length of stay in parks, standard errors, and confidence intervals are provided in Table 8.
From Table 8, one can observe that students who visit parks once a month spend the shortest amount of time in them, while the longest stays are among students who visit parks 2–3 times a week. It was determined that there is no statistically significant difference in the length of stay in parks relative to the frequency of park visits. On average, the stay lasts from 20 to 30 min.

3.9. Reasons for Park Visits and Year of Study

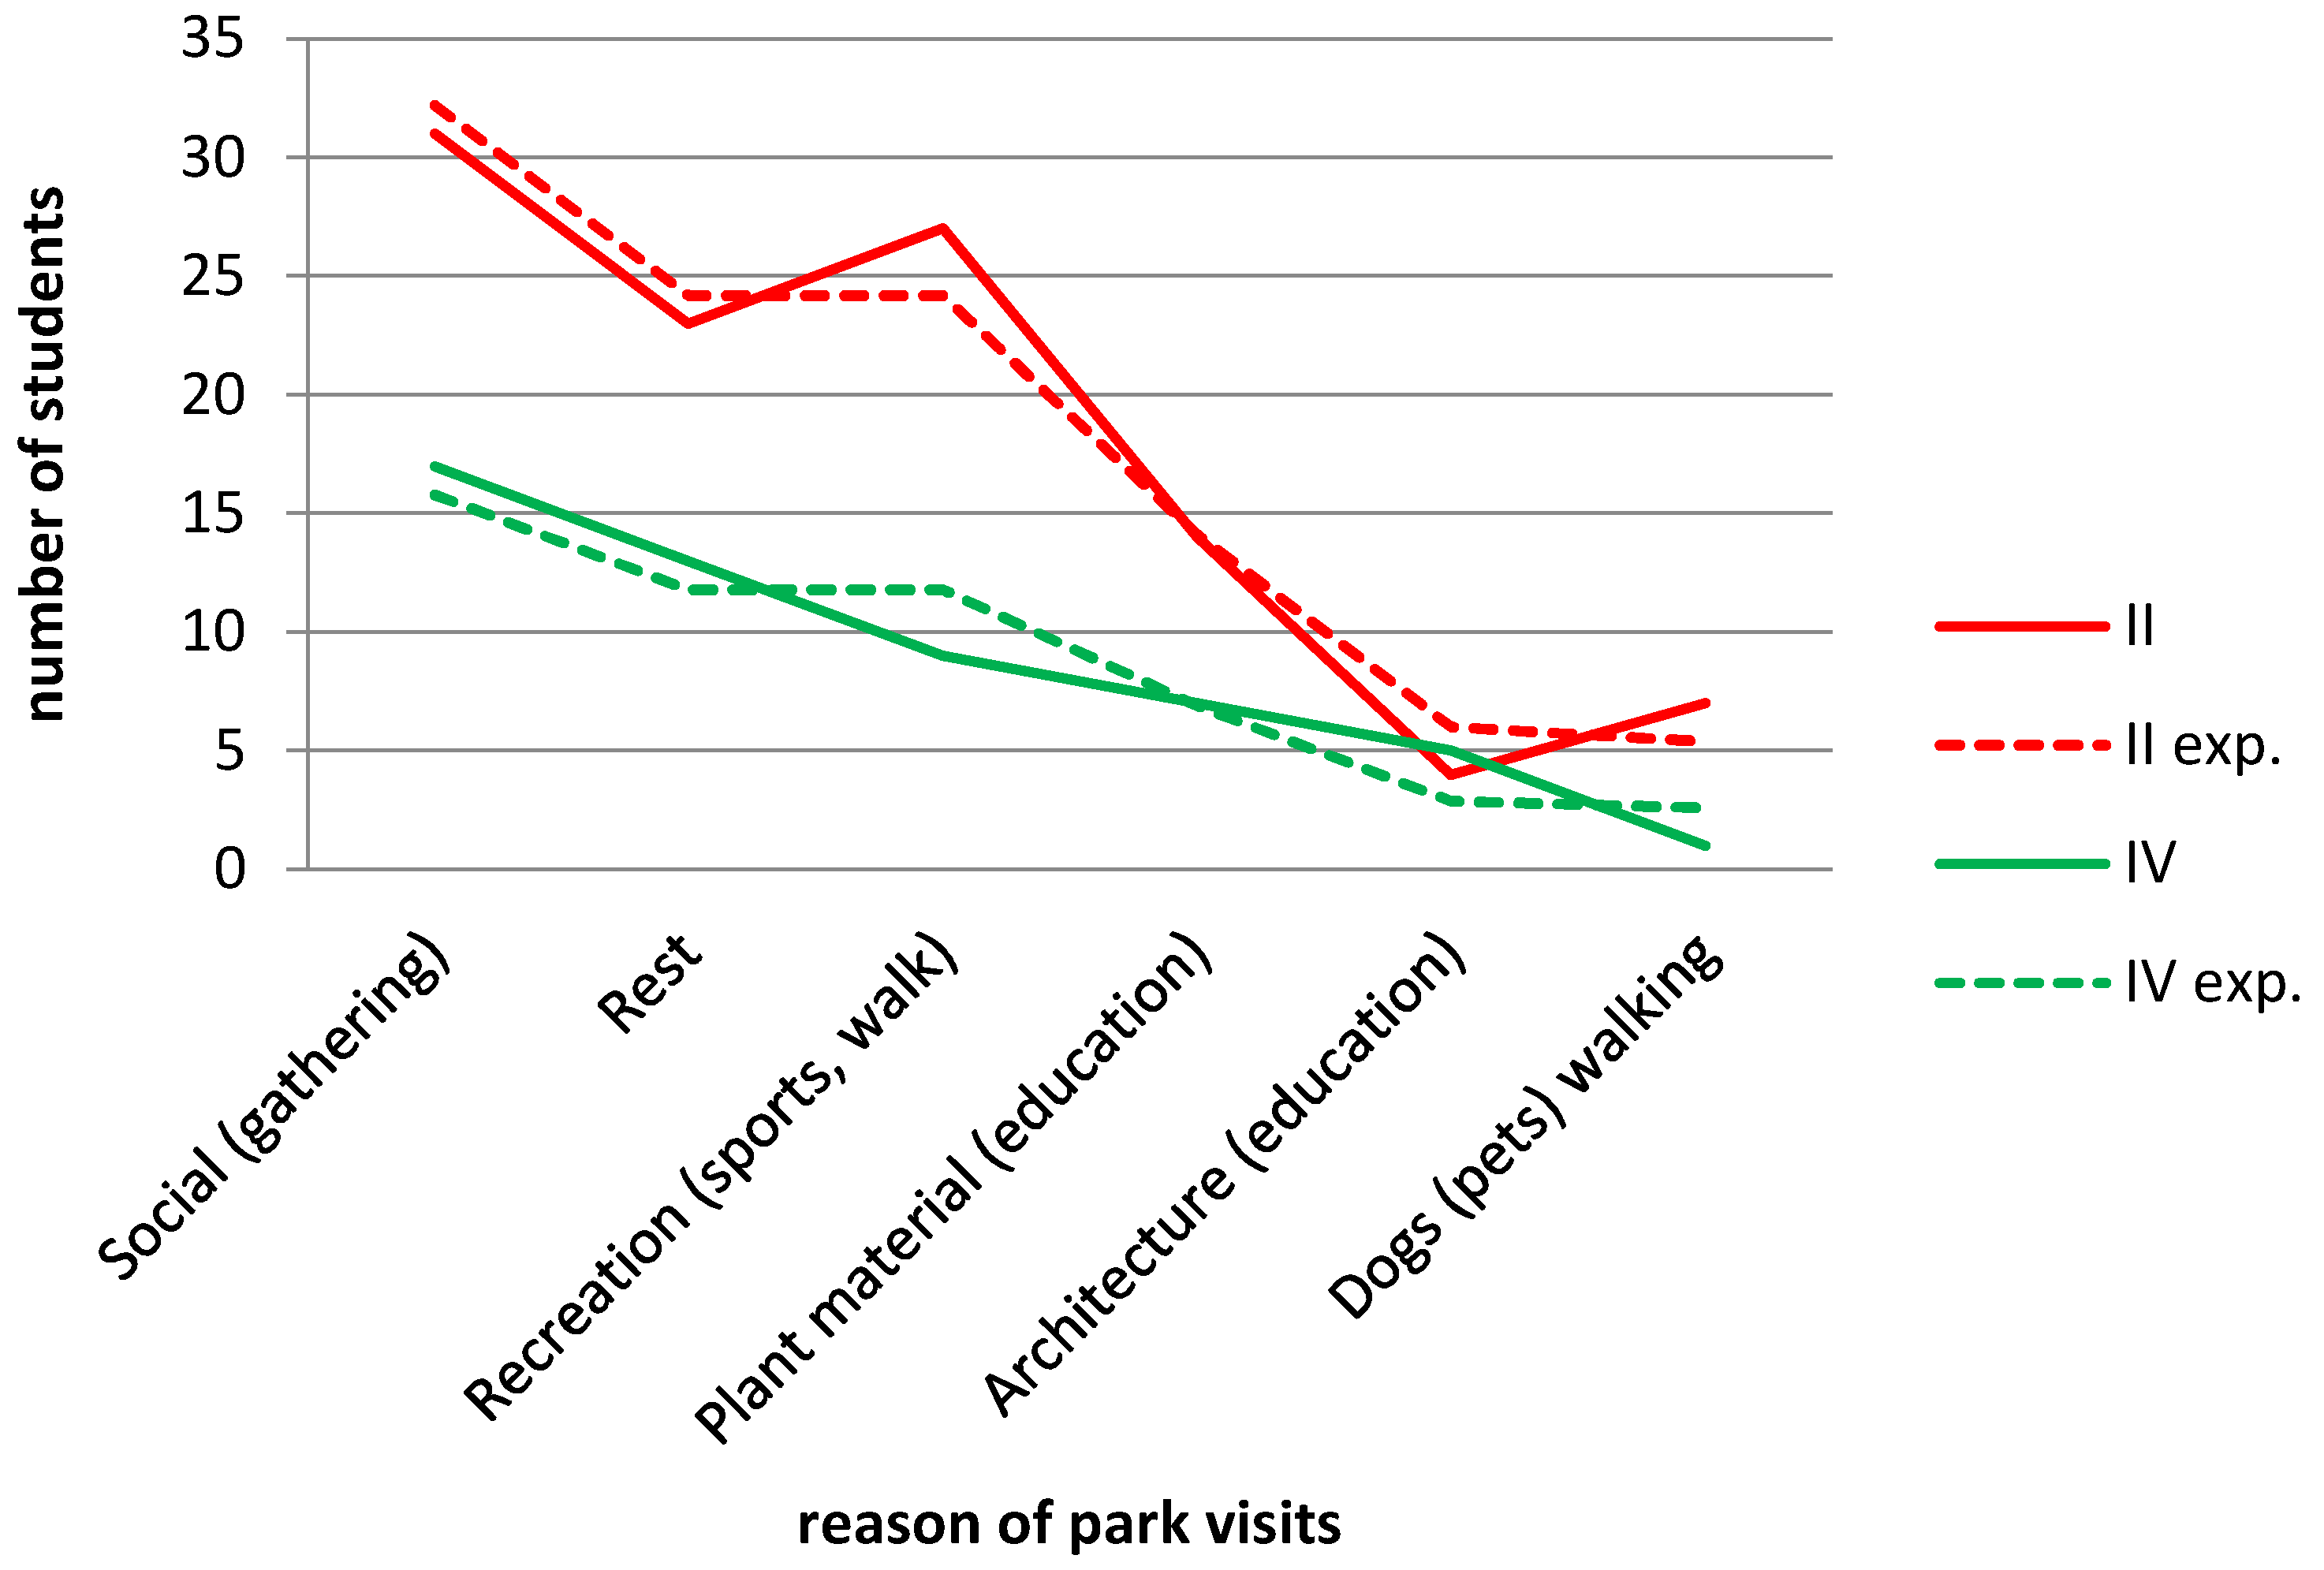
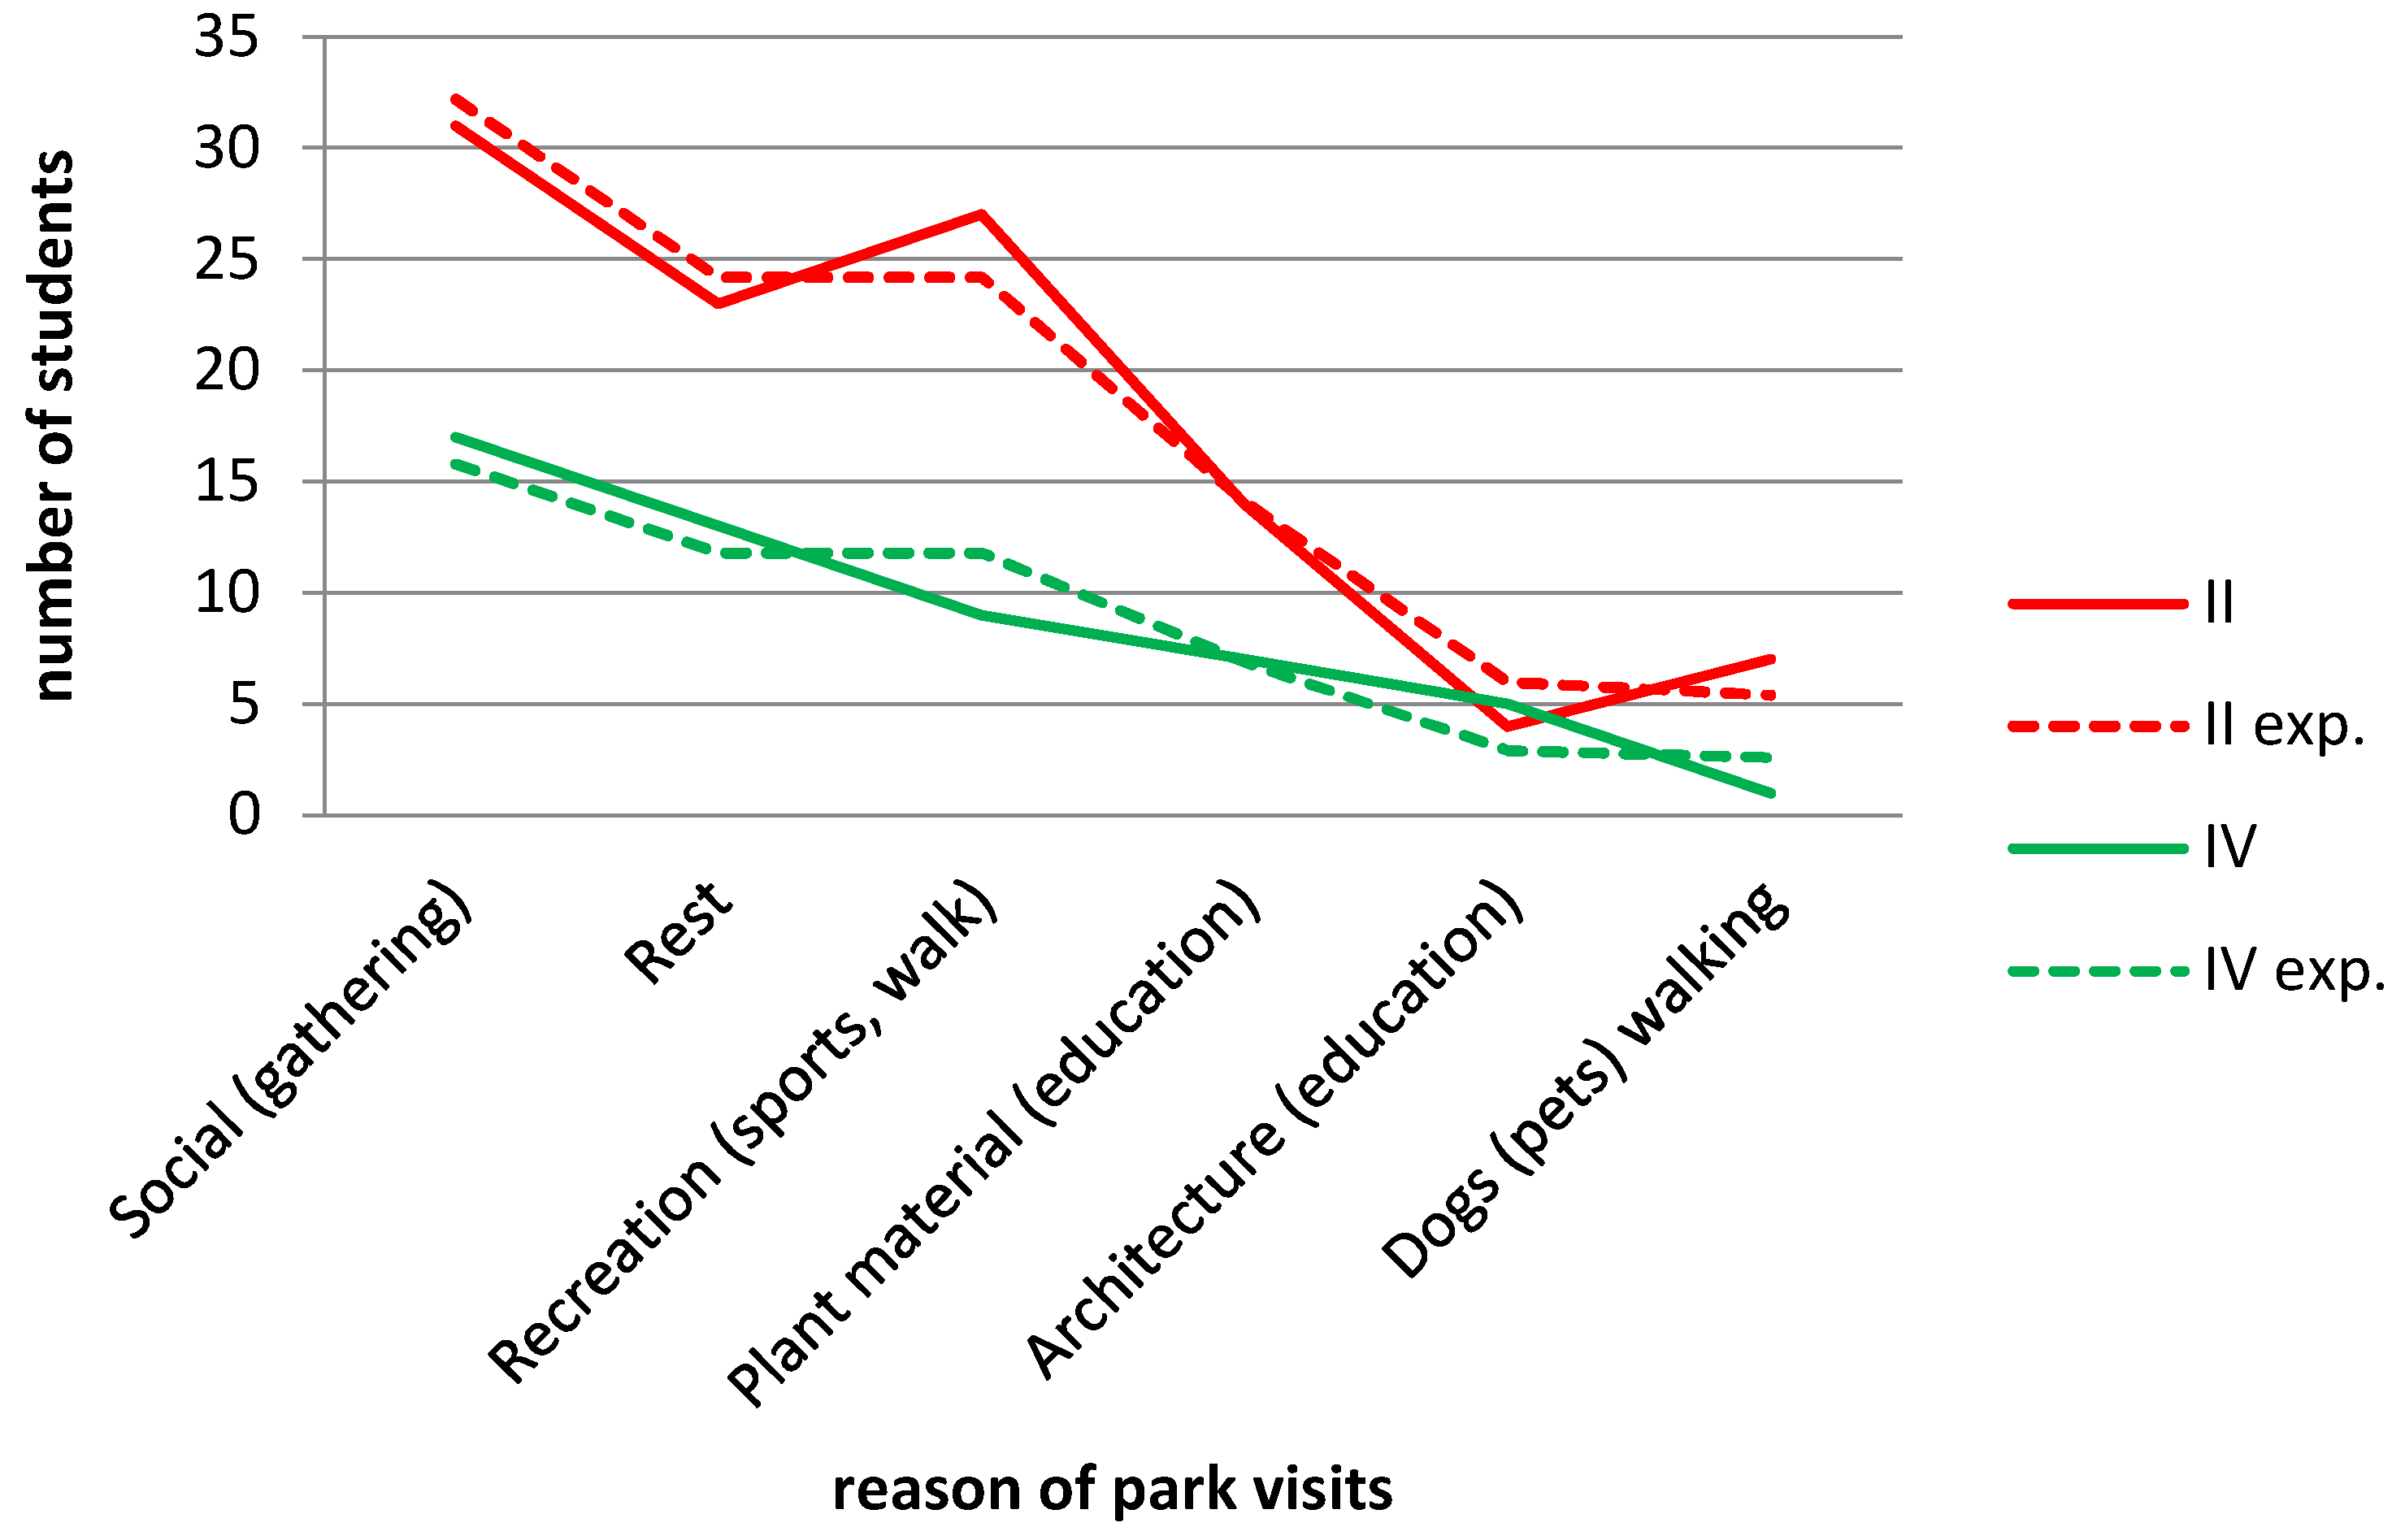
The null hypothesis H 0 states that years of study and reasons for visiting parks are independent variables. The alternative hypothesis H 1 is that there is a dependency between year of study and reasons for visiting parks. In total, 27 students in their second year listed recreation, sports, and walking as reasons for visiting parks, while the expected number was 24.2 (Figure 14 and Table A7).
For the data presented in Figure 14, the χ 2 test yielded χ 2 5,158 = 4.92516 , p = 0.42508 , indicating that the null hypothesis that reasons for visiting parks and years of study are independent is not rejected. Furthermore, we conclude that there is no statistically significant difference in the distribution of reasons for visiting parks relative to years of study, with C = 4.92516 / ( 4.92516 + 158 ) = 0.174 . The parks are primarily visited for socializing.
The reasons for park visits listed in Figure 14 can be integrated into the multi-criteria analysis to enhance previous research findings [63,64]. Social gathering, rest, and recreation stand out as the main reasons for park visits, and these results can be included in the further planning of urban park development.

3.10. The Most Important Qualities of Parks in Novi Sad and Year of Study

The null hypothesis, H 0 , states that years of study and the most important qualities of parks in Novi Sad are independent variables. The alternative hypothesis H 1 is that there is a dependency between year of study and the most important qualities of parks. We can see, for example, that seven students in their second year cite maintenance as the most important quality of parks, while the expected number is 6.1 (Table A8).
For the data presented in Figure 15 (Table A8), the χ 2 test yielded χ 2 6,100 = 2.48655 , p = 0.86997 , indicating that the null hypothesis that park qualities and years of study are independent is not rejected. Furthermore, we conclude that there is no statistically significant difference in the distribution of votes for park qualities relative to years of study, with C = 2.48655 / ( 2.48655 + 100 ) = 0.156 . The least important qualities of parks listed are size, monuments, and architectural elements. The most important quality is plant diversity.
The results can be seen as the input data for further applying of MC methods. Namely, qualities that have a score over 5%, as suggested in [65], can be considered as criteria in the MC analysis environment. These are plant diversity, maintenance, location, park equipment, and place for providing rest, and these can be processed using the procedures described in [66] or [67] at the next stage of analysis.

3.11. The Most Notable Flaws of Parks in Novi Sad and Year of Study

The null hypothesis H 0 is that the year of study and park deficiencies are independent variables. The alternative hypothesis H 1 is that there is a dependency between year of study and the most notable flaws. For example, we see that 26 second-year students listed poor park facilities as a notable flaw, while the expected number is 27.7 (Table A9).
For the data presented in Figure 16, the χ 2 test yielded χ 2 4,90 = 10.10678 , p = 0.03867 , indicating that the null hypothesis that park deficiencies and years of study are independent can be rejected, with C = 10.10678 / ( 10.10678 + 90 ) = 0.318 . Furthermore, we conclude that there is a statistically significant difference in the distribution of park deficiencies relative to years of study. Students in their second year marked fewer deficiencies in the first three categories compared to expected values and more in the remaining two. For students in their fourth year, the situation is the opposite. Students from both years of study stated that the biggest drawback of parks is poor equipment.

3.12. The Most Frequently Visited Parks and Proximity to Parks

Table A10 lists the nearest parks to students’ place of living (proximity), grouped based on their year of study, as shown in Figure 14.
The null hypothesis, H 0 , is that the year of study and the response to the question of whether among the most visited parks is the closest park are independent variables. The alternative hypothesis H 1 is that there is a dependency between the year of study and the most visited parks. For example (Table A11), we see that 15 second-year students answered “no”, while the expected number is 17.6. Most students from both observed years indicated that the University and Kamenica Parks are the farthest from their place of residence. Futog Park (for 2nd-year students) and Railway Park (for 4th-year students) are the closest.
For the data presented in Table A11, the χ 2 test yielded χ 2 1,68 = 1.72556 , p = 0.18898 , so the null hypothesis that the reasons for visiting parks and year of study are independent cannot be rejected. The Pearson contingency coefficient is C = 1.72556 / ( 1.72556 + 68 ) = 0.157 . We also conclude that there is no statistically significant difference in the distribution of reasons for visiting parks relative to the year of study. Overall, more students frequently visit the park closest to their place of living (55.6%).

3.13. Parks as a Transition Zone

Some parks in Novi Sad operate as a transition zone; namely, visitors just pass through them, without visiting. In this subsection we analyzed the relationship between the least representative parks and parks where students do not stay.
The parks that respondents consider the least representative and whether there are parks that students simply pass through without staying are represented in Table A12. Out of 50 students who consider Railway Park the least representative, 42 pass through the park without staying. In the case of University Park, almost four times fewer students gave the same answer compared to Railway Park (10 students just pass through it). In total, there are 10 students who do not use a park as a transition zone, but stay and visit.
In total, 85.3% of respondents stated that there are parks they simply pass through. Among those students, 72.4% chose Railway Park as the least representative. The χ 2 test value ( χ 2 5,68 = 1.13802 , p = 0.95068 ) suggests that there are no statistically significant differences among groups or distributions of students’ responses of “yes” and “no”.
When comparing each respondent’s answers regarding the least representative park in Novi Sad and the parks they do not pass through, it was found that, out of 58 respondents who stated that there are parks they simply pass through, 29 included the least representative park among them, while 29 did not. It is evident that the least representative park and parks students simply pass through are independent variables.

3.14. Elements That Represent the Identity of Parks in Novi Sad

The questionnaire included an open-ended question (“What element represents the identity of each park in Novi Sad?”), and the students provided their answers in the form of open-ended responses. The responses were grouped into different categories, as presented by Figure 15.
The results show that Danube Park’s identity is mainly recognized by its water elements, Futog Park by plant material, Kamenica Park by its architectural elements, etc. The results also show that Danube, Futog, and Kamenica Parks have several elements that are recognized as their “identity”, while Liman, University, and Railway Parks have a limited number of elements for which they are recognized. The latter should be considered relevant information for planning reconstruction of these parks, and planners should consider introducing elements that can be recognizable features for different categories of users. Figure 15 shows the elements that are “missing” in each park, and this can be a useful guideline for future planning.

3.15. Educational Functions of Parks in Novi Sad

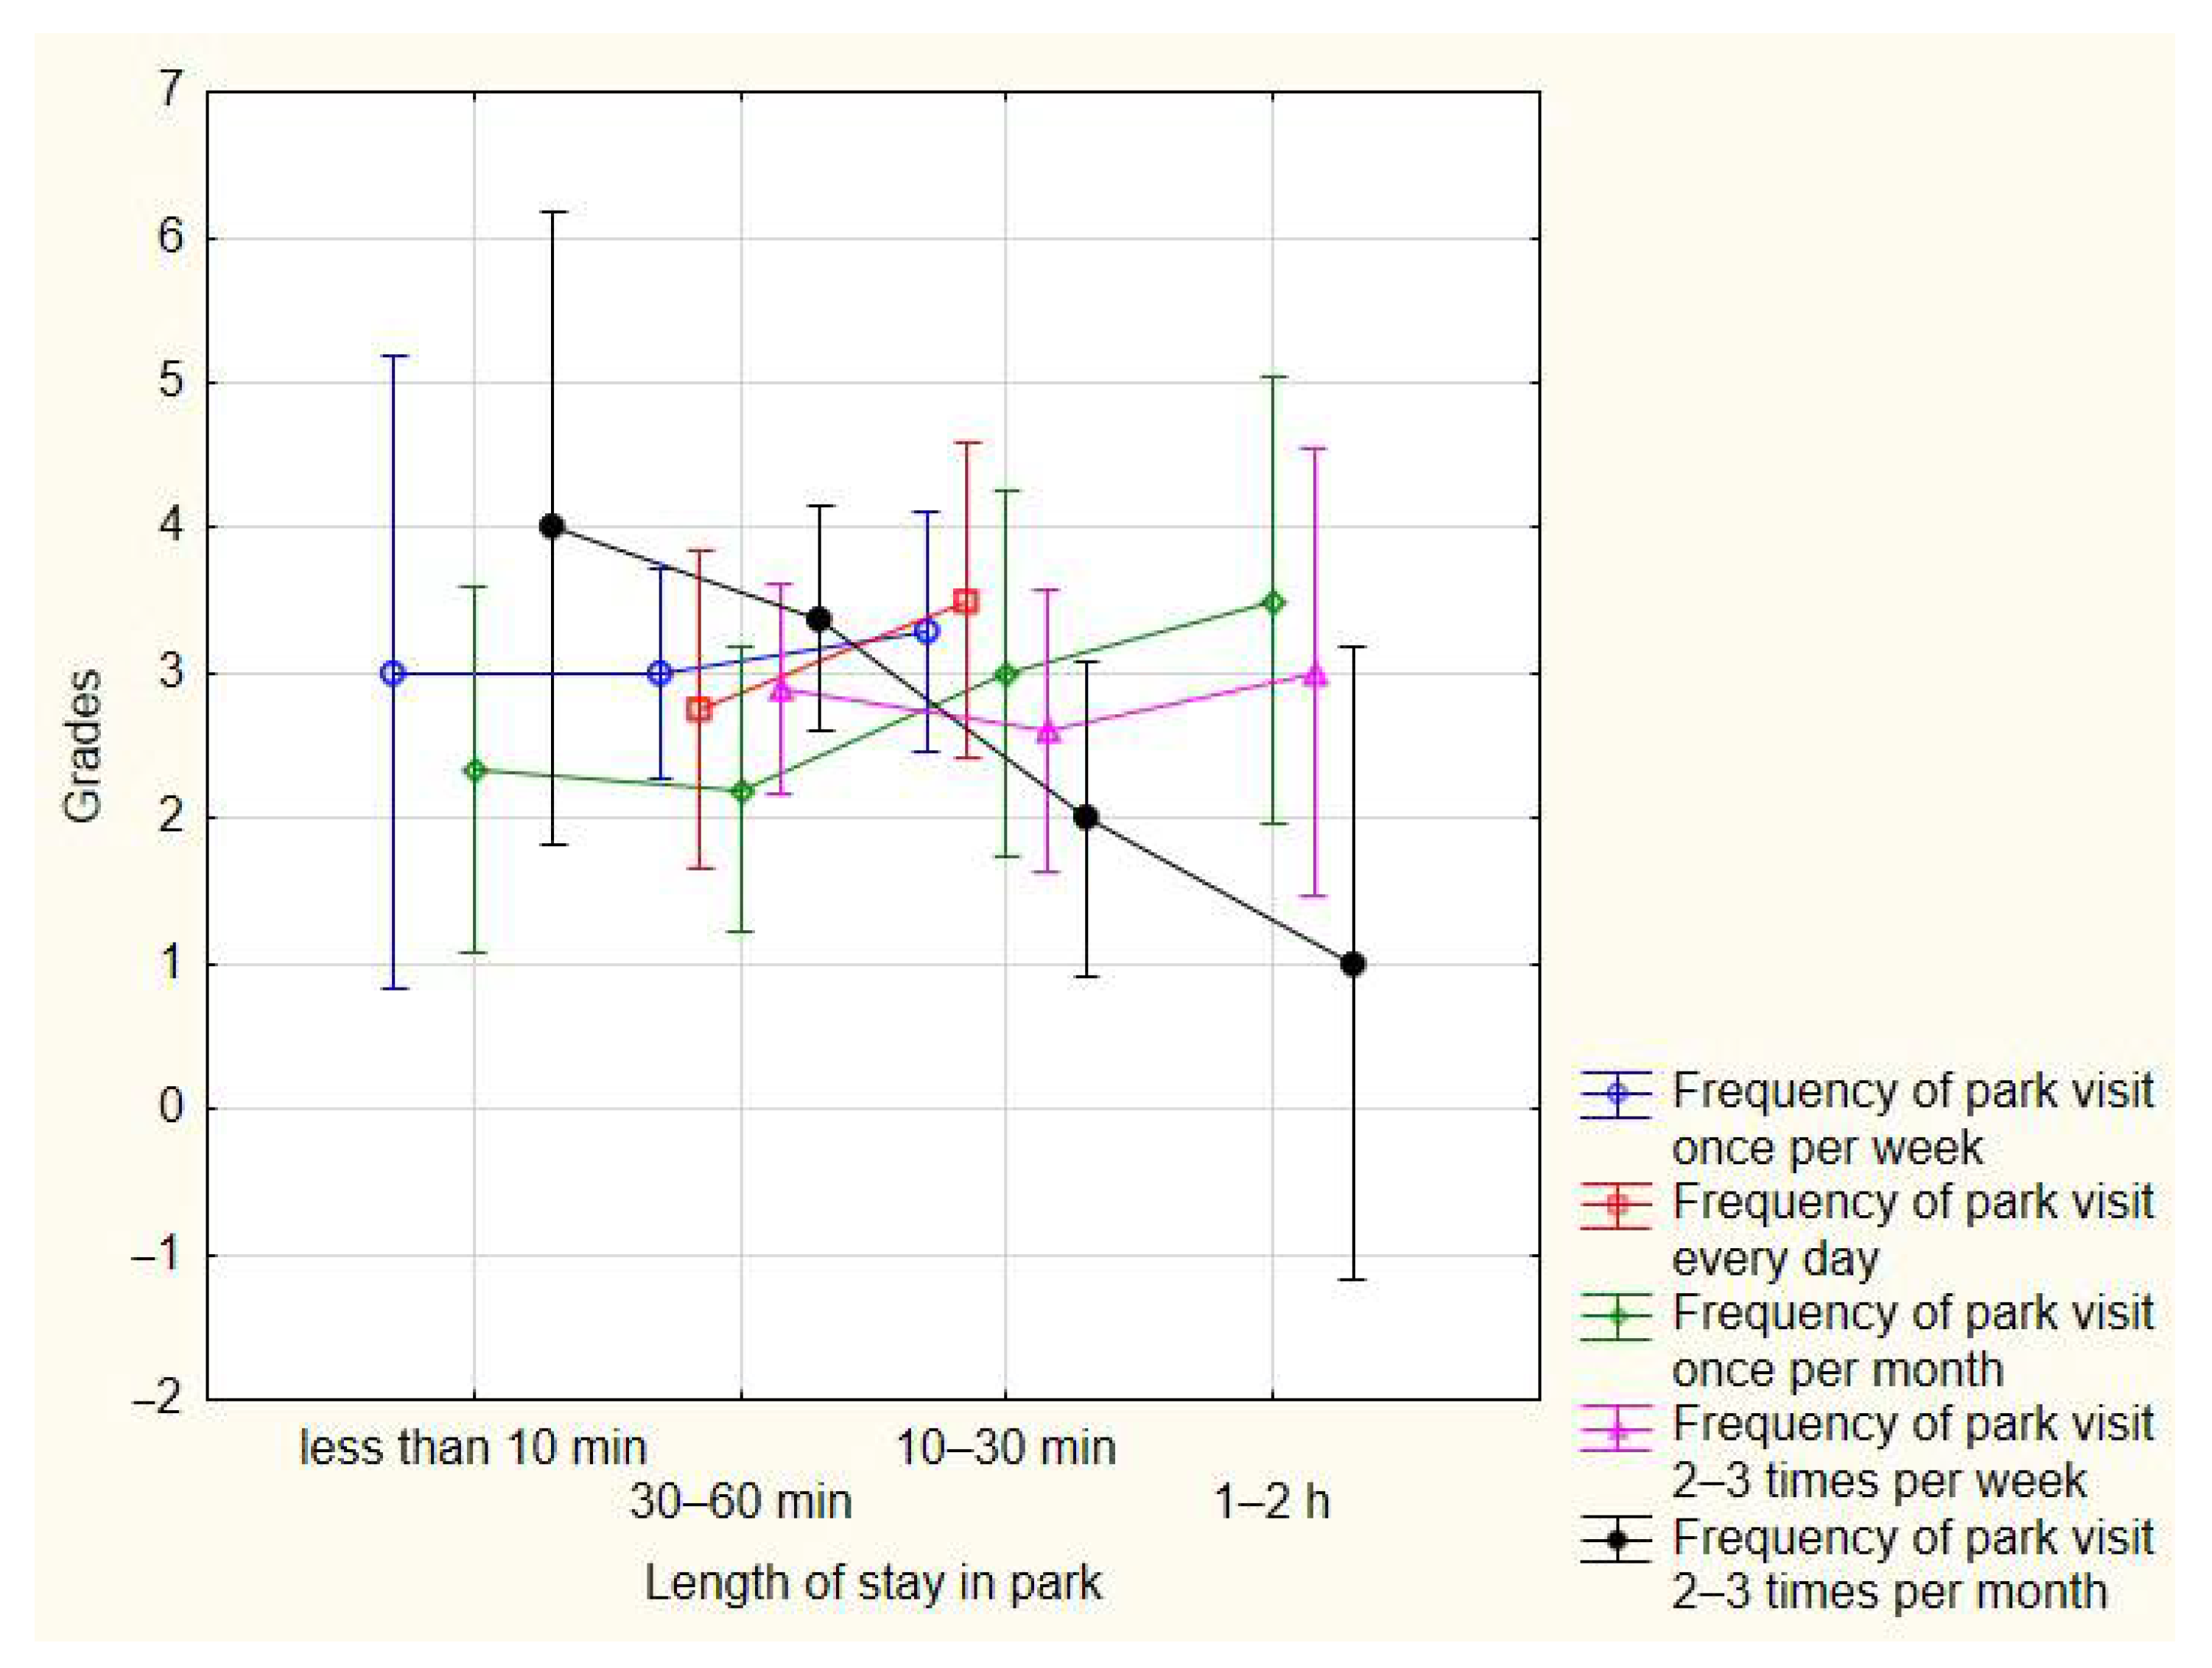
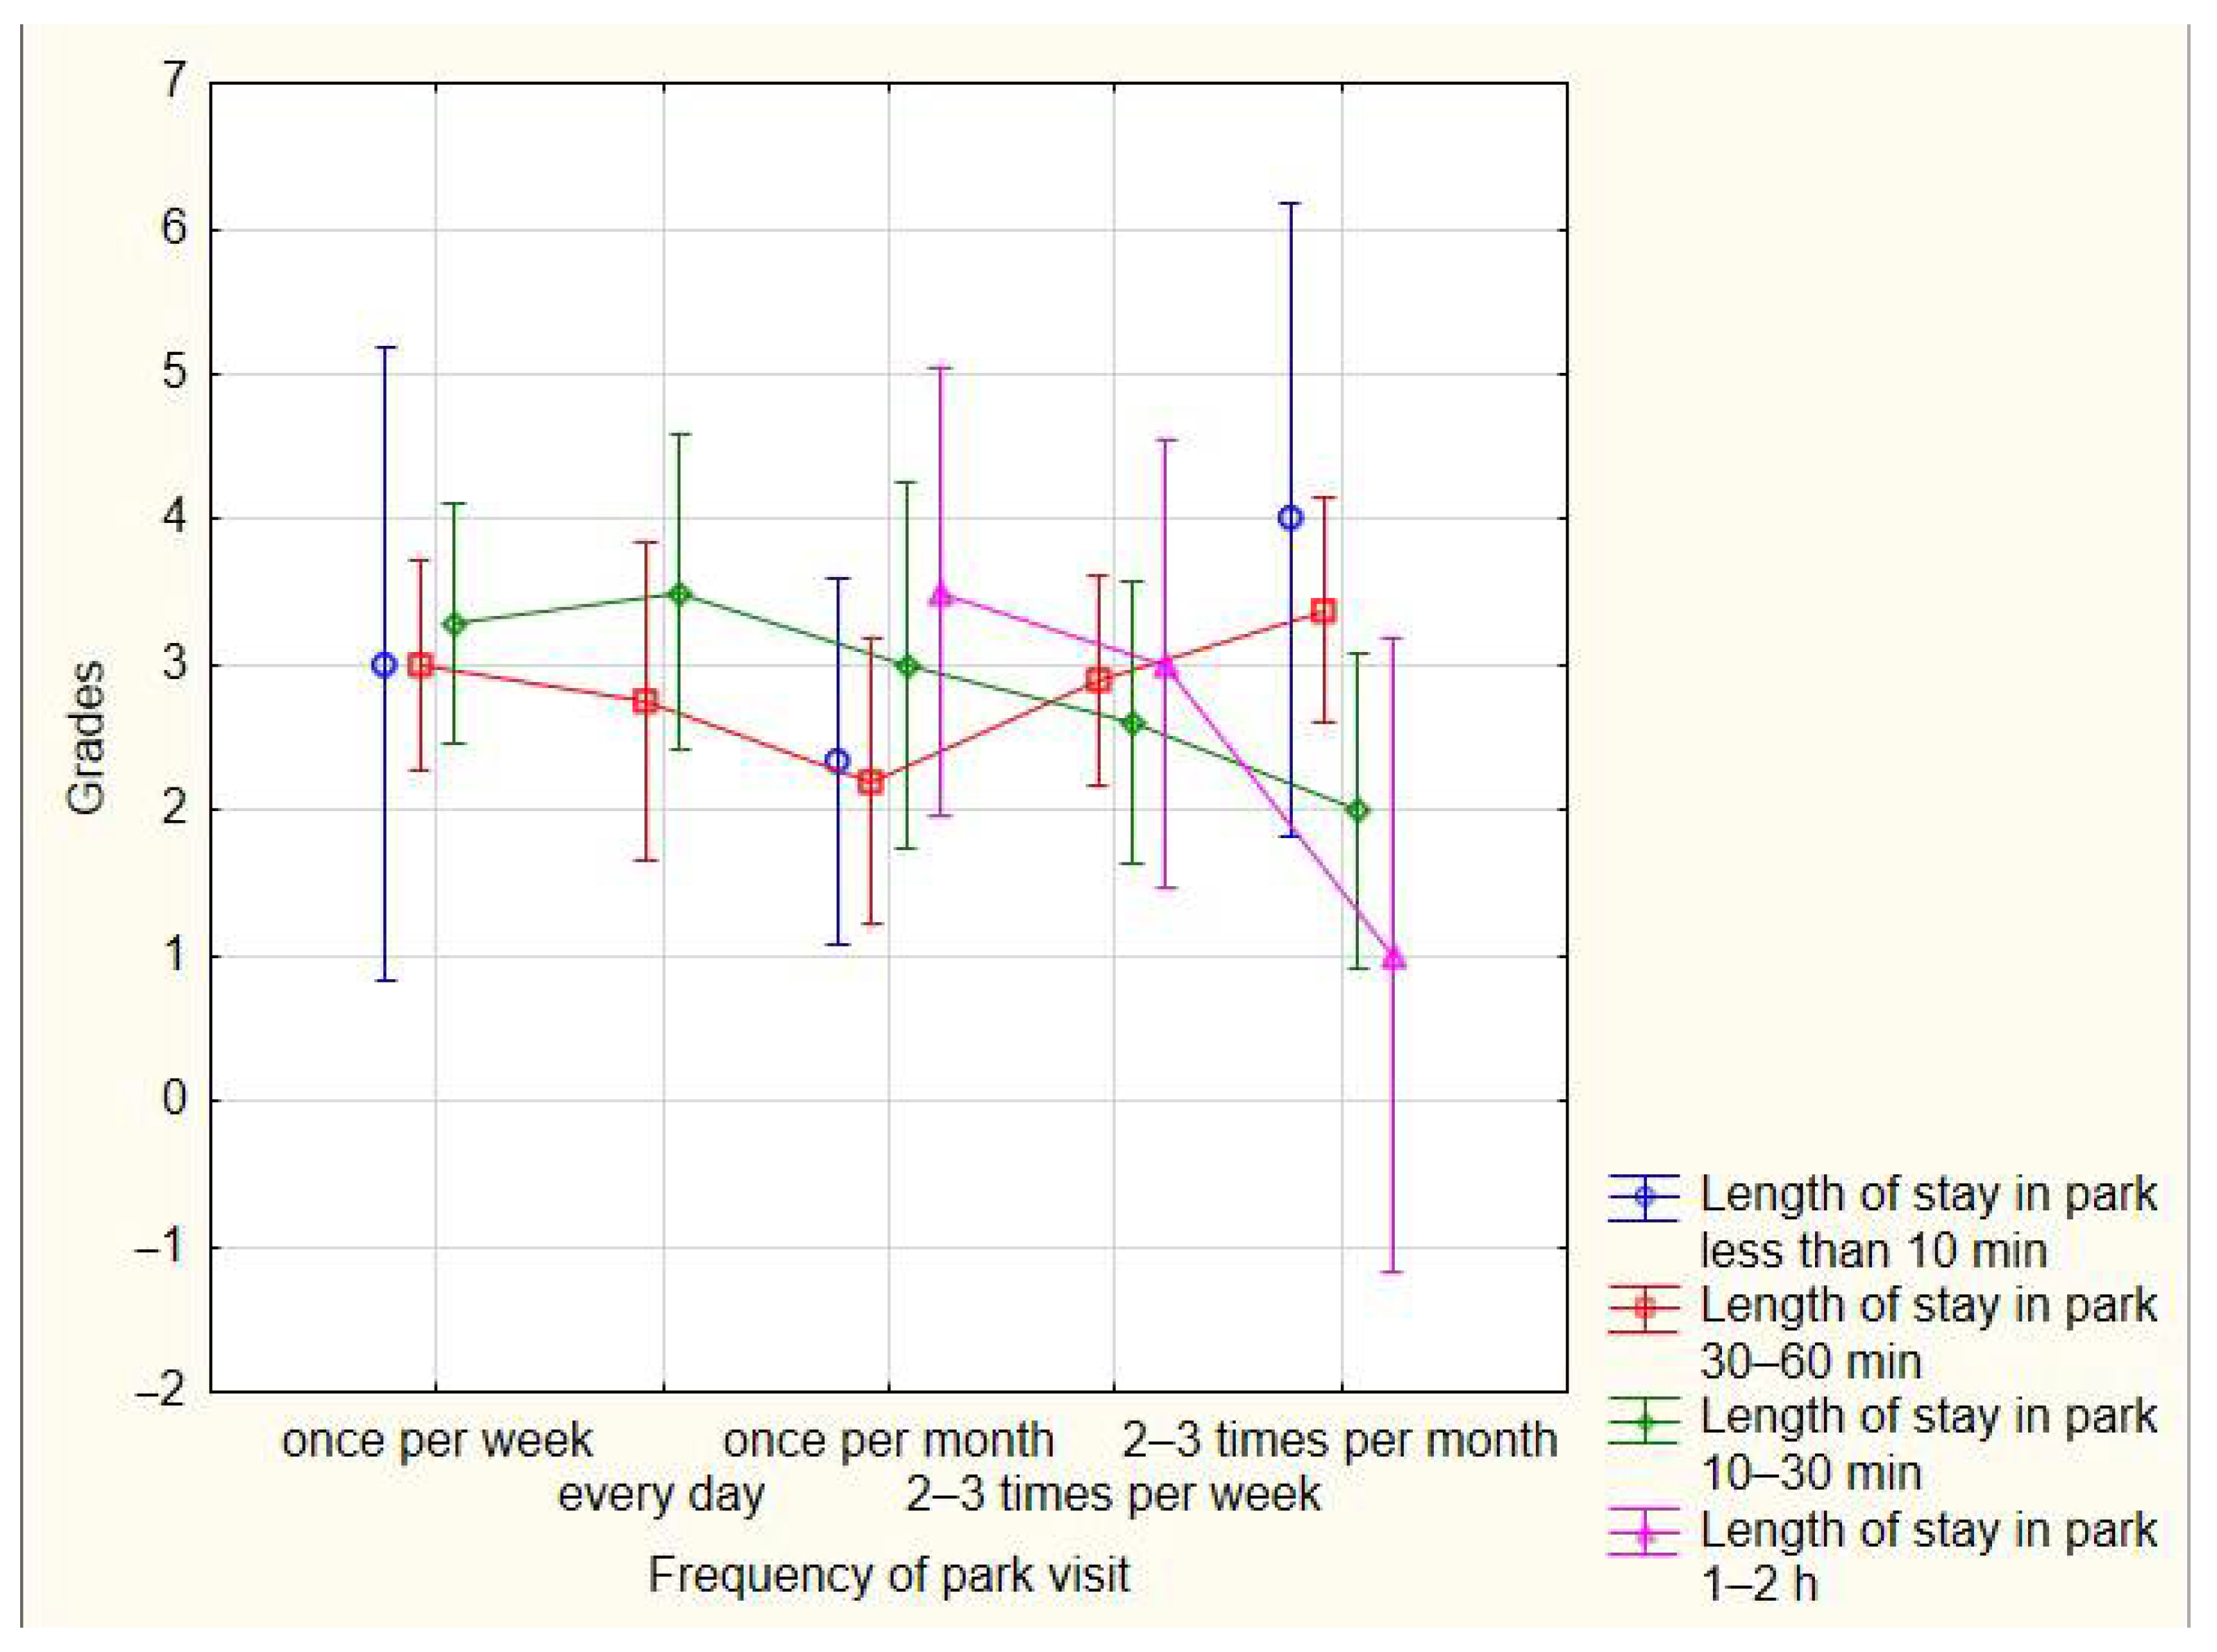
For the analysis of educational functions of parks in Novi Sad, categorical variables are the frequency of park visits and the length of stay in parks, with the dependent variable being the scores of the educational functions of parks by students of all years (Table 9).
After post hoc analysis, the Tukey HSD test (Figure 16 and Figure 17) confirmed that there are no statistically significant differences in ratings (scores) of the educational functions of the park depending on the length of stay in the park and frequency of visit.
Now, we test if there are statistically significant differences in the given ratings (scores) based on the selection of the most representative park. The categorical variable is the most representative park, and the dependent variable is the rating of ecological functions. The mean scores are provided according to the park the students have chosen (Table 10).
The highest mean score of ecological functions of parks was obtained from students who chose Kamenica Park as the most representative park in Novi Sad, while the lowest was from students who chose Liman Park. Through post hoc analysis, i.e., Tukey HSD test, it was confirmed that there are no statistically significant differences between students’ ratings and their selection of the most representative park.
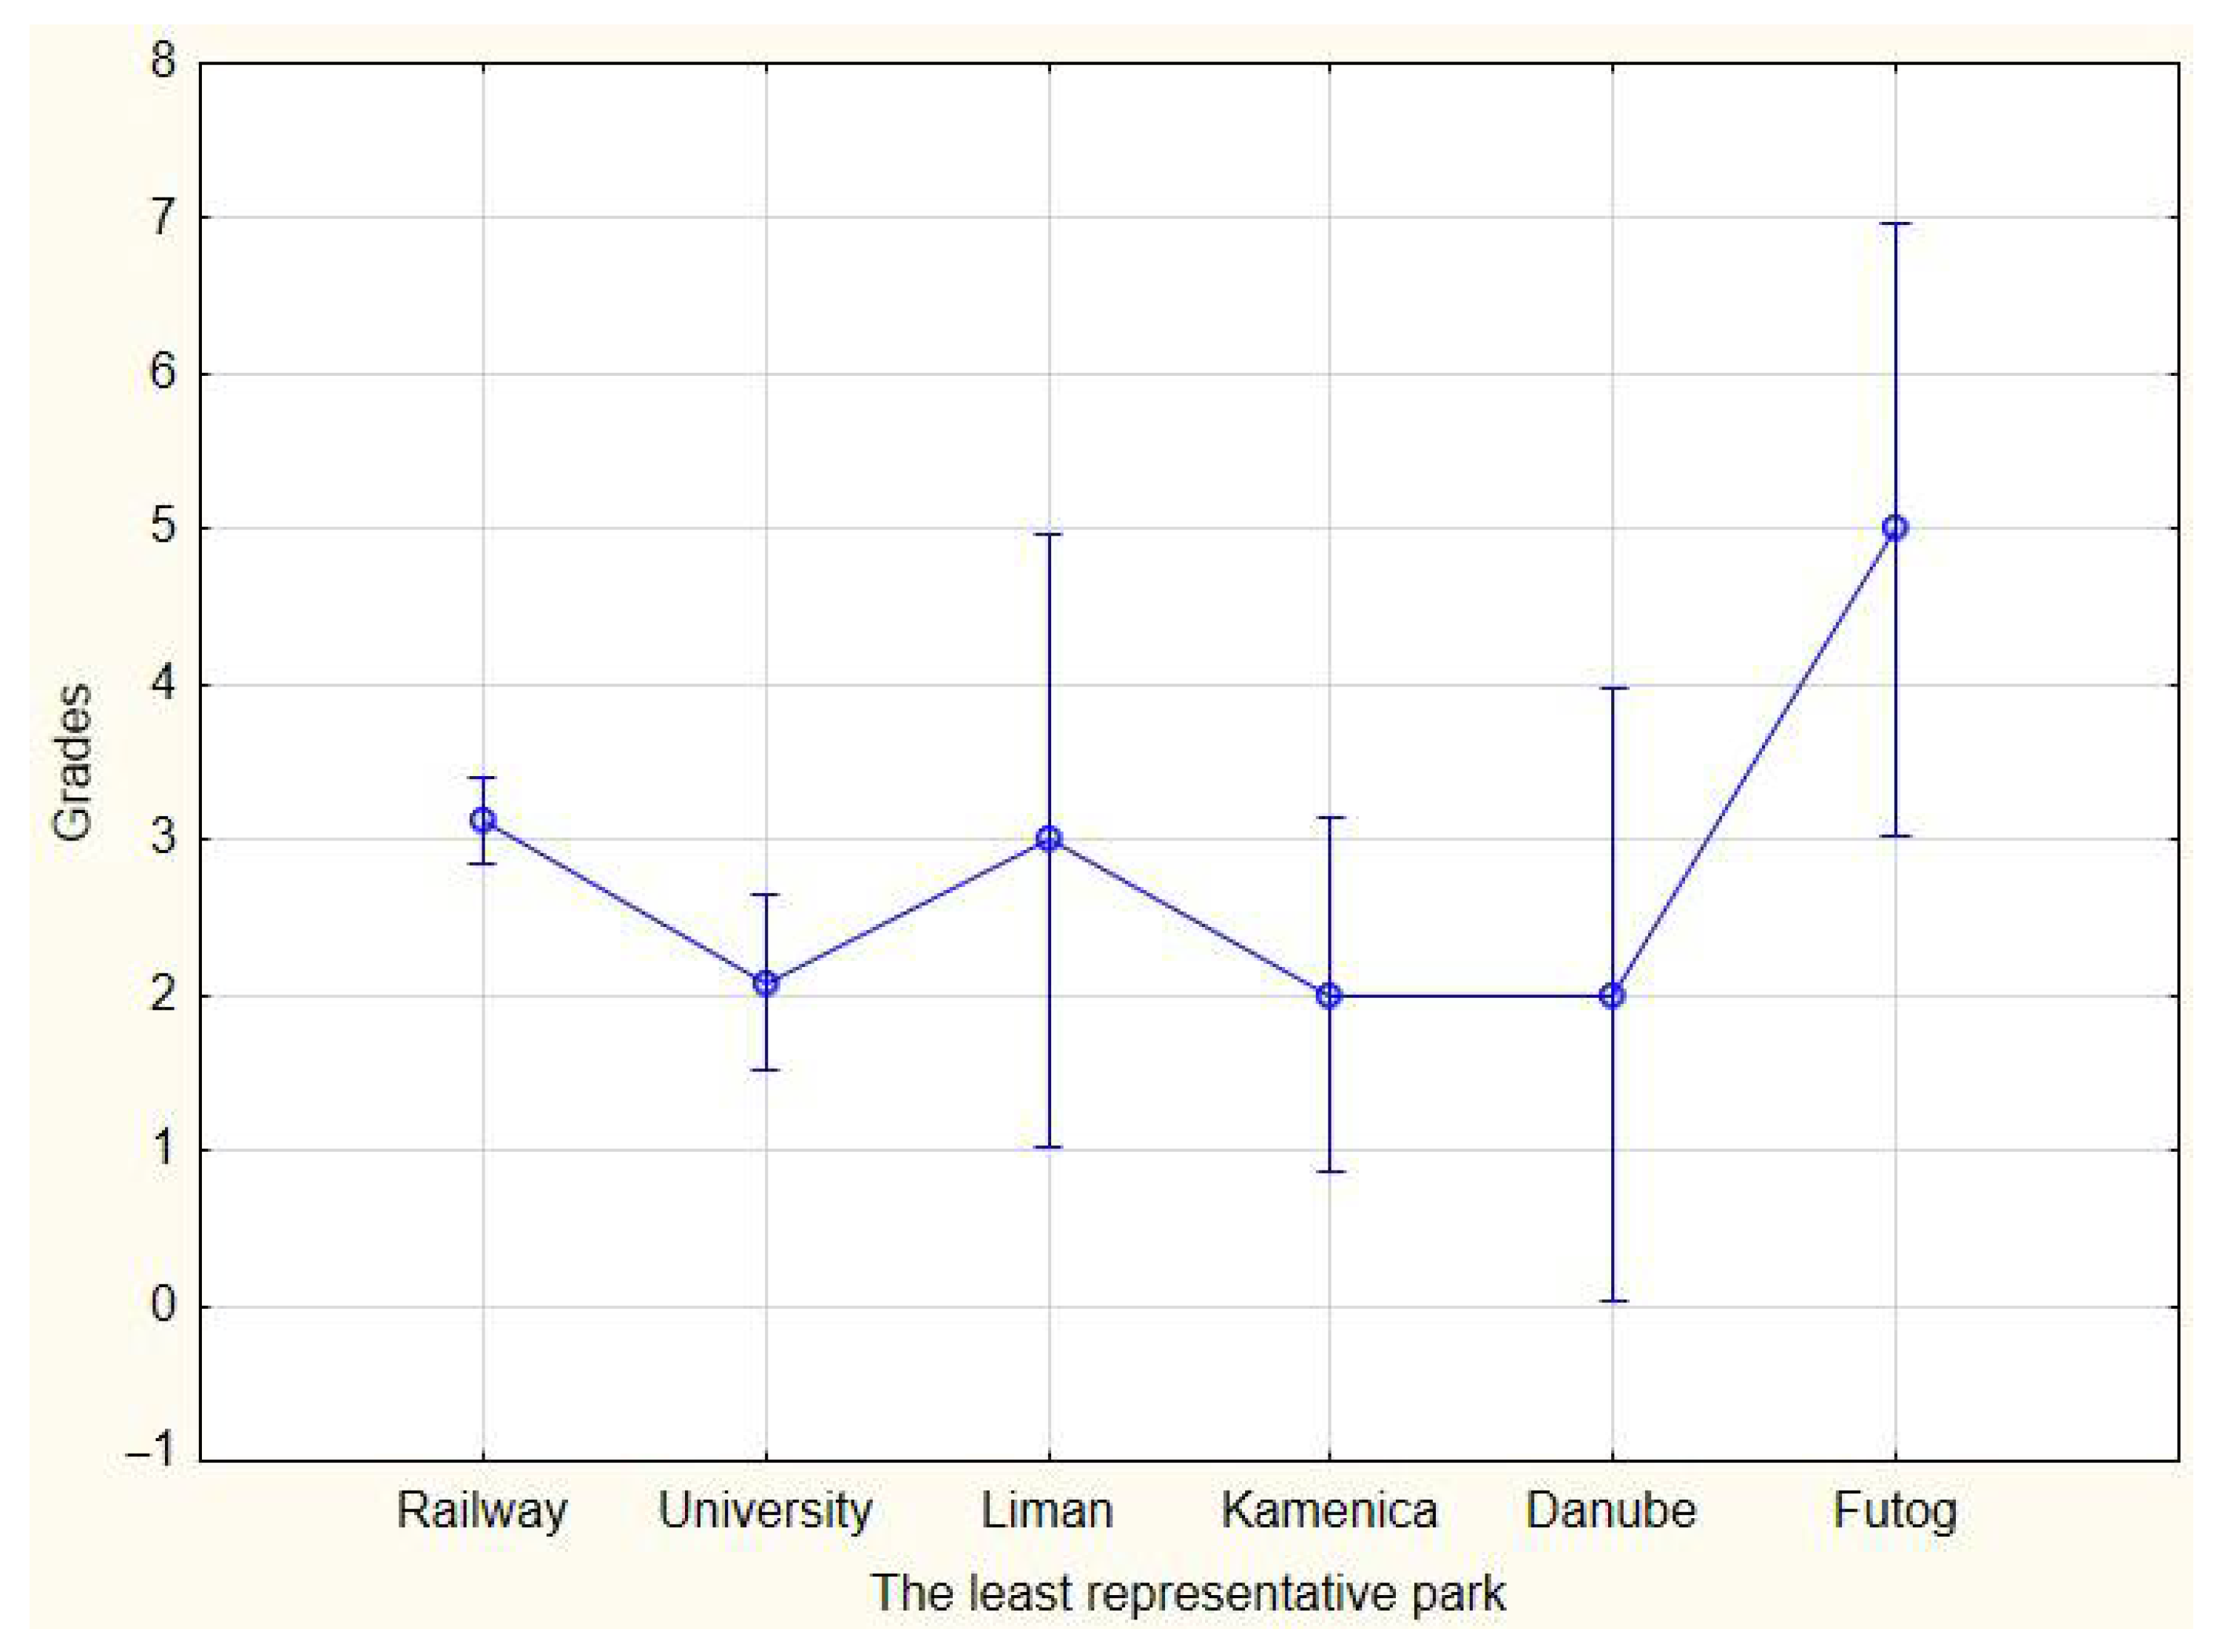
Now, we test if there are statistically significant differences in the given ratings (scores) based on the selection of the least representative park (Table 11). The categorical variable is the least representative park, and the dependent variable is the rating of ecological functions.
Through post hoc analysis, i.e., Tukey HSD test, it was found that there is a statistically significant difference ( p = 0.02071 ) in the ratings given by students who chose University Park (2.083) and Railway Park (3.120) as the least representative parks (Figure 18).
Mean ratings are provided according to the park they have chosen as the least representative one (Table 11). The highest mean rating of ecological functions of parks was obtained from students who chose Futog Park as the least representative park in Novi Sad, while the lowest was from students who chose Kamenica and Danube Parks as the least representative.
The educational function of all parks can be enhanced by introducing various workshops (focused on recognizing plant species, landscape architecture styles, park furniture design, etc.) and by posting informational tables about the park’s history and elements.

4. Discussion

This research focused on assessment of six major urban parks in Novi Sad, involving second- and fourth-year landscape architecture students from the University of Novi Sad. The survey collected data on their park visit frequency, park visit duration, and reasons for park selection. The results provide insights into the functions of these parks and suggest potential opportunities for their improvement, as the primary goal.
We found that students in Novi Sad visit parks slightly more than once a week, and the average length of their stay is 20 to 30 min. A similar finding was published in [66], showing that the 15–24 age group was underrepresented in “Every day” visits but had increased visits “Once a week”. The same study reported that “once a week stayers” typically spend between 15 and 60 min, which partially aligns with our results (of 20 to 30 min).
Overall, most students visit the park closest to where they live. Therefore, our study supports the hypothesis that people are more likely to visit urban green areas if they are within walking distance from their home—a recent study reported that 83% of visitors either walk or cycle to the green area they visit [67].
The results also indicate that some parks are used as pass-through zones, with no correlation between a park’s “representativeness” and its use as a transition area; that is, the location of a park determines whether it will primarily be used for transitioning. Location is frequently cited as a key feature of a park that influences the intensity of its use, the category of users [68], and even the price of housing in the surrounding area [69].
The educational function of the parks is assessed as average, and this can be further improved by including educational tables, as well as by introducing educational workshops, etc. A recent study details the educational function of urban parks, finding that youngsters are receptive to environmental education, which combines aesthetics, botany, pedagogy, and communication [70]. We recommend organizing workshops on protected trees, like oaks, as Novi Sad’s urban parks have many old and fully mature trees that are worth visiting.
According to this research, the main functions that parks in Novi Sad are expected to provide (to our student subjects) are social gathering, rest, and recreation. Many papers provided similar reasons for park visits; for example [71]. However, in research conducted during and right after pandemics, the ergonomic and ecological characteristics were assessed as the most important [72].
This paper also addresses the question of park identity, which is not commonly analyzed in the literature. An example of a paper that does is [73]. This paper examines parks from the perspective of keywords, exploring the identity of parks from visitors’ viewpoints. Some of the main keywords in that research are: “walk”, “beautiful”, “fishing”, “fountain”, and “space”. In this research, the identity of parks is described by “water elements”, “architectural elements”, “plant material”, “lawns”, etc. Analyzing the keywords (identity) of parks helps uncover the genius loci and should be included in similar analyses and surveys.
The secondary aim of the paper was to consider the results as a starting point for applying multi-criteria decision analysis [74] to support park management decisions. The main criteria for a multi-criteria assessment of urban parks could be the ones considered in this research: plant diversity, maintenance, location, park equipment, and place for providing rest. These criteria could be incorporated within a multi-criteria analysis, for example by combining AHP and SMART, as suggested by [75], or by combining the DEMATEL (Decision Making Trial and Evaluation Laboratory), OWA (Ordered Weighted Average), and BW (Best Worst) methods [76]. The suggestion for further research is to apply criteria listed in this paper for upcoming urban park evaluation and management.
Another suggestion for future research is to incorporate GIS technologies into the planning of urban green areas. Linking park visitor survey results with GIS technologies can significantly enhance park planning and management [77]. By geo-referencing survey data, planners can map visitor demographics and travel patterns [78], and this is essential for proper city planning. Reference [78] analyzes spatial variations in travel behavior and built environment interactions using Geographically Weighted Logistic Regression (GWLR), while considering individual attributes (e.g., demographic and socioeconomic characteristics), and a similar procedure can be repeated by integrating survey results. Geographic Information Systems (GIS) paired with satellite data provides a powerful tool for analyzing the spatiotemporal distribution of Urban Heat Islands (UHIs) [79], and mitigating UHIs is recognized as one of the priorities among recently published public survey [80] that needs to be carefully considered in urban planning. GIS and survey results can be paired for promoting suitable tourism in cities, by including visitor preferences (along with standards for carrying capacity and intensity of exploiting resources), and further integrated into zoning procedures by applying the sustainable tourism infrastructure planning (STIP) framework described in [81]. Overall, combining survey results with GIS provides deeper insights into visitor behaviors and preferences, leading to more effective and responsive park planning.
In addition to employing various information technologies, future research could consider including different respondent groups. This study focused on a specific group—landscape architecture students from the University of Novi Sad—because it aligned with the research agenda and goals. In these terms, this research is somewhat limited, as it focuses on one specific group without considering the needs and behavior of other citizens of Novi Sad on a larger scale. Instead, it analyzed responses of one group in detail, which is also insightful for city planners. However, if the next study aims to focus on city development, diverse respondent groups could be included, such as environmentalists, architects, NGOs, local residents, markets, etc. The choice of respondent groups in future research should align with the research objectives.

5. Conclusions

Urban parks play multiple roles, and urban planners face a significant challenge in managing them effectively. Various aspects need consideration from both environmental and social perspectives. This research focuses on the behavior of urban park users, specifically students of landscape architecture, who represent a young demographic with a strong affinity for nature and outdoor activities. Their responses, similar to recent studies by other authors, reflect their age and inclination towards nature. Similar analyses can be conducted with other stakeholder groups such as landscape architects, environmentalists, architects, NGOs, local residents, and markets. Comparing their responses can lead to broader conclusions. Given the multifunctionality of urban parks, we recommend using multi-criteria analysis and decision support methods as integral tools in urban park management. This approach ensures that green areas meet the demands of different user perspectives and categories effectively.

Author Contributions

Conceptualization, M.L.; methodology, M.L. and N.D.; software, N.D.; validation, M.L., N.D., M.M. and K.M.R.; formal analysis, M.L.; investigation, M.L., N.D., M.M. and K.M.R.; data curation, M.L., N.D., M.M. and K.M.R.; writing—original draft preparation, M.L., N.D., M.M. and K.M.R.; writing—review and editing, M.L., N.D., M.M. and K.M.R.; visualization, M.L. and N.D.; supervision, K.M.R.; project administration, M.L.; funding acquisition, M.L. All authors have read and agreed to the published version of the manuscript.

Funding

This research was funded by the Ministry of Science, Technological Development and Innovation of the Republic of Serbia, grant number 451-03-65/2024-03/200117.

Data Availability Statement

The data that support the findings of this study are available from the first author upon request.

Acknowledgments

The authors acknowledge the Ministry of Science, Technological Development, and Innovation of the Republic of Serbia for funding this research.

Conflicts of Interest

The authors declare no conflicts of interest.

Appendix

Table A1. Frequency f o ( f t ) of student visits per category relative to the year of study.
Year of Study/
Frequency of Visits
Once a Month
(1)
2–3 Times per Month
(2)
Once a Week
(3)
2–3 Times per Week
(4)
Everyday
(5)
II5 (7.6)6 (8.2)12 (10.0)12 (9.4)5 (4.7)40
IV8 (5.4)8 (5.8)5 (7.0)4 (6.6)3 (3.3)28
13141716868
Table A2. Frequency f o ( f t ) of student visits per category relative to the gender of the students.
Gender/
Frequency of Visits
Once a Month
(1)
2–3 Times per Month
(2)
Once a Week
(3)
2–3 Times per Week
(4)
Everyday
(5)
female7 (8.8)11 (9.5)13 (11.5)7 (10.8)8 (5.4)46
male6 (4.2)3 (4.5)4 (5.5)9 (5.2)0 (2.6)22
13141716868
Table A3. Frequencies f o ( f t ) of student length of stay in parks per category relative to the year of study.
Year of Study/
Length of Stay
Less Than 10 min
(1)
In between 10–30 min
(2)
In between 30–60 min
(3)
In between 1–2 h
(4)
Longer Than 2 h
(5)
II1 (2.9)12 (13.5)22 (20.6)5 (2.9)040
IV4 (2.1)11 (9.5)13 (14.4)0 (2.1)028
523355068
Table A4. Frequency f o ( f t ) of students per category of length of stay in park relative to the gender of the student.
Year of Study/
Length of Visit
Less Than 10 min
(1)
In between 10–30 min
(2)
In between 30–60 min
(3)
In between 1–2 h
(4)
Longer Than 2 h
(5)
female3 (3.4)15 (15.6)25 (23.7)3 (3.4)046
male2 (1.6)8 (7.4)10 (11.3)2 (1.6)022
523355068
Table A5. Frequency f o f t ) of of student visits to the indicated park relative to the year of study.
Year of Study/ParkDanubeLimanRailwayUniversityFutogKamenica
II35 (40.1)19 (20.7)4 (2.6)27 (23.3)11 (10.4)5 (3.9)101
IV27 (21.9)13 (11.3)0 (1.4)9 (12.7)5 (5.6)1 (2.1)55
6232436166156
Table A6. Frequency f o f t ) of student visits to the indicated park relative to the gender of the student.
Year of Study/ParkDanubeLimanRailwayUniversityFutogKamenica
female42 (39.3)20 (20.3)1 (2.5)22 (22.8)10 (10.2)4 (3.8)99
male20 (22.7)12 (11.7)3 (1.5)14 (13.2)6 (5.8)2 (2.2)57
6232436166156
Table A7. Frequency f o ( f t ) of reasons for park visits and year of study.
Year of Study/
Reason
Social (Gathering)RestRecreation
(Sports, Walk)
Plant Material
(Education)
Architecture (Education)Dogs (Pets) Walking
II31 (32.2)23 (24.2)27 (24.2)14 (14.1)4 (6.0)7 (5.4)106
IV17 (15.8)13 (11.8)9 (11.8)7 (6.9)5 (2.9)1 (2.6)52
4836362198158
Table A8. Frequency f o ( f t ) of the most important quality of parks relative to the year of study.
Year of Study/
Quality
Plant DiversityMaintenanceLocationPark EquipmentProviding Place for RestingMonuments, Architectural ElementsSize of the Park
II25 (26.2)7 (6.1)8 (7.3)5 (5.5)11 (11.0)4 (3.1)1 (1.8)61
IV18 (16.8)3 (3.9)4 (4.7)4 (3.5)7 (7.0)1 (1.9)2 (1.2)39
43101291853100
Table A9. Frequency f o ( f t ) of the most notable flaws of parks in Novi Sad relative to the year of study.
Year of Study/
Flaw
Low-Quality MaintenanceLow-Quality EquipmentLow
Safety
Low Plant DiversityWater Elements–Missing
II13 (14.4)26 (27.7)2 (3.5)6 (3.5)5 (2.9)52
IV12 (10.6)22 (20.3)4 (2.5)0 (2.5)0 (2.1)38
254866590
Table A10. Frequency f o ( f t ) of the nearest parks to students’ place of living and year of study.
Year of Study/ParkDanubeLimanRailwayUniversityFutogKamenica
II11 (8.2)7 (8.8)12 (10.0)2 (1.2)6 (10.0)2 (1.8)40
IV3 (5.8)8 (6.2)5 (7.0)0 (0.8)11 (7.0)1 (1.2)28
141517217368
Table A11. Frequency f o ( f t ) of “yes” and “no” answers for the question—do you visit the most the park that is closest to your place of living?
Year of Study/AnswerYesNo
II15 (17.6)25 (22.4)40
IV15 (12.4)13 (15.6)28
303868
Table A12. The least representative park and passing through (without staying in).
Passing ThroughDanubeLimanRailwayUniversityFutogKamenica
yes1 (0.9)1 (0.9)42 (42.6)10 (10.2)1 (0.9)3 (2.6)58
no0 (0.1)0 (0.1)8 (7.4)2 (1.8)0 (0.1)0 (0.4)10
1150121368

References

  1. Chen, R.Q.; Cheng, S.T. Detecting nestedness in city parks for urban biodiversity conservation. Urban Ecosyst. 2022, 25, 1839–1850. [Google Scholar] [CrossRef]
  2. Villaseñor, N.R.; Escobar, M.A.H. Cemeteries and biodiversity conservation in cities: How do landscape and patch-level attributes influence bird diversity in urban park cemeteries? Urban Ecosyst. 2019, 22, 1037–1046. [Google Scholar] [CrossRef]
  3. Santos, M.N.; Delabie, J.H.C.; Queiroz, J.M. Biodiversity conservation in urban parks: A study of ground-dwelling ants (Hymenoptera: Formicidae) in Rio de Janeiro City. Urban Ecosyst. 2019, 22, 927–942. [Google Scholar] [CrossRef]
  4. Sadeghian, M.M.; Vardanyan, Z. The benefits of urban parks, a review of urban research. J. Nov. Appl. Sci. 2013, 2, 231–237. [Google Scholar]
  5. Palliwoda, J.; Kowarik, I.; von der Lippe, M. Human-biodiversity interactions in urban parks: The species level matters. Landsc. Urban Plan. 2017, 157, 394–406. [Google Scholar] [CrossRef]
  6. Villaseñor, N.R.; Chiang, L.A.; Hernández, H.J.; Escobar, M.A.H. Vacant lands as refuges for native birds: An opportunity for biodiversity conservation in cities. Urban For. Urban Green. 2020, 49, 126632. [Google Scholar] [CrossRef]
  7. Lepczyk, C.A.; Aronson, M.F.J.; Evans, K.L.; Goddard, M.A.; Lerman, S.B.; MacIvor, J.S. Biodiversity in the city: Fundamental questions for understanding the ecology of urban green spaces for biodiversity conservation. BioScience 2017, 67, 799–807. [Google Scholar] [CrossRef]
  8. Nielsen, A.B.; van den Bosch, M.; Maruthaveeran, S.; Bosch, C.K.V.D. Species richness in urban parks and its drivers: A review of empirical evidence. Urban Ecosyst. 2014, 17, 305–327. [Google Scholar] [CrossRef]
  9. Leichenko, R. Climate change and urban resilience. Curr. Opin. Environ. Sustain. 2011, 3, 164–168. [Google Scholar] [CrossRef]
  10. Meerow, S.; Stults, M. Comparing Conceptualizations of Urban Climate Resilience in Theory and Practice. Sustainability 2016, 8, 701. [Google Scholar] [CrossRef]
  11. Tyler, S.; Moench, M. A Framework for Urban Climate Resilience. Clim. Dev. 2012, 4, 311–326. [Google Scholar] [CrossRef]
  12. Wardekker, A. Contrasting the framing of urban climate resilience. Sustain. Cities Soc. 2021, 75, 103258. [Google Scholar] [CrossRef]
  13. Allam, Z.; Jones, D.; Thondoo, M. Cities and Climate Change: Climate Policy, Economic Resilience and Urban Sustainability; Springer Nature: Cham, Switzerland, 2020. [Google Scholar] [CrossRef]
  14. Zeng, X.; Yu, Y.; Yang, S.; Lv, Y.; Sarker, M.N.I. Urban Resilience for Urban Sustainability: Concepts, Dimensions, and Perspectives. Sustainability 2022, 14, 2481. [Google Scholar] [CrossRef]
  15. Baldwin, C.; King, R. Social Sustainability, Climate Resilience and Community-Based Urban Development: What About the People? Taylor & Francis: London, UK, 2018. [Google Scholar] [CrossRef]
  16. Zhang, X.; Li, H. Urban resilience and urban sustainability: What we know and what do not know? Cities 2018, 72, 141–148. [Google Scholar] [CrossRef]
  17. Jim, C. Soil Characteristics and Management in an Urban Park in Hong Kong. Environ. Manag. 1998, 22, 683–695. [Google Scholar] [CrossRef] [PubMed]
  18. Lam, K.C.; Ng, S.L.; Hui, W.C.; Chan, P.K. Environmental Quality of Urban Parks and Open Spaces in Hong Kong. Environ. Monit. Assess. 2005, 111, 55–73. [Google Scholar] [CrossRef] [PubMed]
  19. Su, T.H.; Lin, C.S.; Lu, S.Y.; Lin, J.C.; Wang, H.H.; Liu, C.P. Effect of air quality improvement by urban parks on mitigating PM2. 5 and its associated heavy metals: A mobile-monitoring field study. J. Environ. Manag. 2022, 323, 116283. [Google Scholar] [CrossRef] [PubMed]
  20. Yin, S.; Shen, Z.; Zhou, P.; Zou, X.; Che, S.; Wang, W. Quantifying air pollution attenuation within urban parks: An experimental approach in Shanghai, China. Environ. Pollut. 2011, 159, 2155–2163. [Google Scholar] [CrossRef] [PubMed]
  21. Xie, Q.; Yue, Y.; Sun, Q.; Chen, S.; Lee, S.-B.; Kim, S.W. Assessment of Ecosystem Service Values of Urban Parks in Improving Air Quality: A Case Study of Wuhan, China. Sustainability 2019, 11, 6519. [Google Scholar] [CrossRef]
  22. Llorens, E.; Matamoros, V.; Domingo, V.; Bayona, J.M.; García, J. Water quality improvement in a full-scale tertiary constructed wetland: Effects on conventional and specific organic contaminants. Sci. Total Environ. 2009, 407, 2517–2524. [Google Scholar] [CrossRef]
  23. Zhao, S.; Da, L.; Tang, Z.; Fang, H.; Song, K.; Fang, J. Ecological consequences of rapid urban expansion: Shanghai, China. Front. Ecol. Environ. 2006, 4, 341–346. [Google Scholar] [CrossRef]
  24. Srdjevic, B.; Srdjevic, Z.; Lakicevic, M. Validating the Importance of Criteria for Assessing Climate Change Scenarios. J. Water Clim. Change 2018, 9, 570–583. [Google Scholar] [CrossRef]
  25. Liu, H.; Li, F.; Li, J.; Zhang, Y. The relationships between urban parks, residents’ physical activity, and mental health benefits: A case study from Beijing, China. J. Environ. Manag. 2017, 190, 223–230. [Google Scholar] [CrossRef] [PubMed]
  26. Zhang, C.; Su, Q.; Zhu, Y. Urban park system on public health: Underlying driving mechanism and planning thinking. Front. Public Health 2023, 11, 1193604. [Google Scholar] [CrossRef]
  27. Jennings, V.; Bamkole, O. The Relationship between Social Cohesion and Urban Green Space: An Avenue for Health Promotion. Int. J. Environ. Res. Public Health 2019, 16, 452. [Google Scholar] [CrossRef]
  28. Deng, L.; Li, X.; Luo, H.; Fu, E.K.; Ma, J.; Sun, L.X.; Huang, Z.; Cai, S.Z.; Jia, Y. Empirical study of landscape types, landscape elements and landscape components of the urban park promoting physiological and psychological restoration. Urban For. Urban Green. 2020, 48, 126488. [Google Scholar] [CrossRef]
  29. Niu, J.; Xiong, J.; Qin, H.; Hu, J.; Deng, J.; Han, G.; Yan, J. Influence of thermal comfort of green spaces on physical activity: Empirical study in an urban park in Chongqing, China. Build. Environ. 2022, 219, 109168. [Google Scholar] [CrossRef]
  30. Brown, G.; Schebella, M.F.; Weber, D. Using participatory GIS to measure physical activity and urban park benefits. Landsc. Urban Plan. 2014, 121, 34–44. [Google Scholar] [CrossRef]
  31. Song, C.; Ikei, H.; Igarashi, M.; Miwa, M.; Takagaki, M.; Miyazaki, Y. Physiological and psychological responses of young males during spring-time walks in urban parks. J. Physiol. Anthr. 2014, 33, 8. [Google Scholar] [CrossRef]
  32. Zhang, T.; Liu, J.; Li, H. Restorative Effects of Multi-Sensory Perception in Urban Green Space: A Case Study of Urban Park in Guangzhou, China. Int. J. Environ. Res. Public Health 2019, 16, 4943. [Google Scholar] [CrossRef]
  33. Stodolska, M.; Shinew, K.J.; Acevedo, J.C.; Izenstark, D. Perceptions of urban parks as havens and contested terrains by Mexican-Americans in Chicago neighborhoods. Leis. Sci. 2011, 33, 103–126. [Google Scholar] [CrossRef]
  34. Srdjevic, B.; Srdjevic, Z.; Lakicevic, M. Urban greening and provisioning of ecosystem services within hesitant decision making framework. Urban For. Urban Green. 2019, 43, 126371. [Google Scholar] [CrossRef]
  35. Peters, K.; Elands, B.; Buijs, A. Social interactions in urban parks: Stimulating social cohesion? Urban For. Urban Green. 2010, 9, 93–100. [Google Scholar] [CrossRef]
  36. Clarke, M.; Cadaval, S.; Wallace, C.; Anderson, E.; Egerer, M.; Dinkins, L.; Platero, R. Factors that enhance or hinder social cohesion in urban greenspaces: A literature review. Urban For. Urban Green. 2023, 84, 127936. [Google Scholar] [CrossRef]
  37. Chen, S.; Sleipness, O.; Christensen, K.; Yang, B.; Park, K.; Knowles, R.; Yang, Z.; Wang, H. Exploring Associations between Social Interaction and Urban Park Attributes: Design Guideline for Both Overall and Separate Park Quality Enhancement. Cities 2024, 145, 104714. [Google Scholar] [CrossRef]
  38. Qanazi, S.; Hijazi, I.H.; Shahrour, I.; Meouche, R.E. Exploring Urban Service Location Suitability: Mapping Social Behavior Dynamics with Space Syntax Theory. Land 2024, 13, 609. [Google Scholar] [CrossRef]
  39. Mullenbach, L.E.; Baker, B.L.; Benfield, J.; Hickerson, B.; Mowen, A.J. Assessing the relationship between community engagement and perceived ownership of an urban park in Philadelphia. J. Leis. Res. 2019, 50, 201–219. [Google Scholar] [CrossRef]
  40. Elands, B.; Ambrose-Oji, B.; Haase, A.; Peters, K. Urban realities of engaging with nature in Europe: Increasing diversity and consequences for wellbeing and social cohesion. In Urban Nature; Taylor & Francis: London, UK, 2020; pp. 199–218. [Google Scholar] [CrossRef]
  41. Wan, C.; Shen, G.Q.; Choi, S. Underlying relationships between public urban green spaces and social cohesion: A systematic literature review. City Cult. Soc. 2021, 24, 100383. [Google Scholar] [CrossRef]
  42. Burrage, H. Green hubs, social inclusion and community engagement. In Proceedings of the Institution of Civil Engineers-Municipal Engineer; Thomas Telford Ltd.: London, UK, 2011; p. 164. [Google Scholar] [CrossRef]
  43. Bhandari, R. Building Social Cohesion Through Urban Design: The Efficacy of Public Space Design to Promote Place Attachment and Social Connections Among Culturally Diverse Users Within Urban Parks; North Carolina State University: Raleigh, NC, USA, 2023. [Google Scholar]
  44. Sherer, P.M. Why America needs more city parks and open space. Trust Public Land 2003, 1, 31. [Google Scholar]
  45. Park, J.H.; Oh, C.S. The utilization of urban park for the activation of rural area-focus on the Baelyeonje nearby tourism resources development, Gulye-gun. J. Korean Soc. Rural Plan. 2018, 24, 105–115. [Google Scholar] [CrossRef]
  46. Frederick, M. Rural tourism and economic development. Econ. Dev. Q. 1993, 7, 215–224. [Google Scholar] [CrossRef]
  47. Loures, L.; Santos, R.; Panagopoulos, T. Urban parks and sustainable city planning-The case of Portimão, Portugal. Population 2007, 15, 171–180. [Google Scholar]
  48. Dinda, S.; Ghosh, S. Perceived benefits, aesthetic preferences and willingness to pay for visiting urban parks: A case study in Kolkata, India. Int. J. Geoheritage Parks 2021, 9, 36–50. [Google Scholar] [CrossRef]
  49. Wang, P.; Zhou, B.; Han, L.; Mei, R. The motivation and factors influencing visits to small urban parks in Shanghai, China. Urban For. Urban Green. 2021, 60, 127086. [Google Scholar] [CrossRef]
  50. Mak, B.K.L.; Jim, C.Y. Linking park users’ socio-demographic characteristics and visit-related preferences to improve urban parks. Cities 2019, 92, 97–111. [Google Scholar] [CrossRef]
  51. Chiesura, A. The role of urban parks for the sustainable city. Landsc. Urban Plan. 2004, 68, 129–138. [Google Scholar] [CrossRef]
  52. Bahriny, F.; Bell, S. Patterns of Urban Park Use and Their Relationship to Factors of Quality: A Case Study of Tehran, Iran. Sustainability 2020, 12, 1560. [Google Scholar] [CrossRef]
  53. Veitch, J.; Ball, K.; Rivera, E.; Loh, V.; Deforche, B.; Best, K.; Timperio, A. What entices older adults to parks? Identification of park features that encourage park visitation, physical activity, and social interaction. Landsc. Urban Plan. 2022, 217, 104254. [Google Scholar] [CrossRef]
  54. McCormack, G.R.; Rock, M.; Toohey, A.M.; Hignell, D. Characteristics of urban parks associated with park use and physical activity: A review of qualitative research. Health Place 2010, 16, 712–726. [Google Scholar] [CrossRef]
  55. Jiang, Y.; Huang, G.; Fisher, B. Air quality, human behavior and urban park visit: A case study in Beijing. J. Clean. Prod. 2019, 240, 118000. [Google Scholar] [CrossRef]
  56. Taylor, L.; Leckey, E.H.; Lead, P.J.; Hochuli, D.F. What visitors want from urban parks: Diversity, utility, serendipity. Front. Environ. Sci. 2020, 8, 595620. [Google Scholar] [CrossRef]
  57. Bavdaz, M.; Giesen, D.; Moore, D.L.; Smith, P.A.; Jones, J. Qualitative testing for official establishment survey questionnaires. Surv. Res. Methods 2019, 13, 267–288. [Google Scholar] [CrossRef]
  58. Li, C.L. Quality of life: The perspective of urban park recreation in three Asian cities. J. Outdoor Recreat. Tour. 2020, 29, 100260. [Google Scholar] [CrossRef]
  59. Srdjevic, Z.; Lakicevic, M.; Srdjevic, B. Approach of decision making based on the analytic hierarchy process for urban landscape management. Environ. Manag. 2013, 51, 777–785. [Google Scholar] [CrossRef] [PubMed]
  60. Lakicevic, M.; Srdjevic, Z.; Srdjevic, B.; Zlatic, M. Decision Making in Urban Forestry by Using Approval Voting and Multicriteria Approval Method (Case Study: Zvezdarska Forest, Belgrade, Serbia). Urban For. Urban Green. 2014, 13, 114–120. [Google Scholar] [CrossRef]
  61. Lakicevic, M.; Reynolds, K.M.; Orlovic, S.; Kolarov, R. Measuring Dendrofloristic Diversity in Urban Parks in Novi Sad (Serbia). Trees For. People 2022, 8, 100239. [Google Scholar] [CrossRef]
  62. Cloud Software Group, Inc. Data Science Workbench, Version 14.1. 2023. Available online: http://tibco.com (accessed on 1 May 2024).
  63. Srdjevic, B.; Lakicevic, M.; Srdjevic, Z. Fuzzy AHP Assessment of Urban Parks Quality and Importance in Novi Sad City, Serbia. Forests 2023, 14, 1227. [Google Scholar] [CrossRef]
  64. Srdjevic, B.; Srdjevic, Z.; Reynolds, K.M.; Lakicevic, M.; Zdero, S. Using Analytic Hierarchy Process and Best–Worst Method in Group Evaluation of Urban Park Quality. Forests 2022, 13, 290. [Google Scholar] [CrossRef]
  65. Lakićević, M.D.; Reynolds, K.M.; Gawryszewska, B.J. An integrated application of AHP and PROMETHEE in decision making for landscape management. Austrian J. For. Sci. 2021, 138, 167–182. [Google Scholar]
  66. Lahoti, S.A.; Lahoti, A.; Dhyani, S.; Saito, O. Preferences and Perception Influencing Usage of Neighborhood Public Urban Green Spaces in Fast Urbanizing Indian City. Land 2023, 12, 1664. [Google Scholar] [CrossRef]
  67. Wendelboe-Nelson, C.; Wang, Y.; Bell, S.; McDougall, C.W.; Ward Thompson, C. Your Favourite Park Is Not My Favourite Park: A Participatory Geographic Information System Approach to Improving Urban Green and Blue Spaces—A Case Study in Edinburgh, Scotland. Land 2024, 13, 395. [Google Scholar] [CrossRef]
  68. Mitchell, A.; Larson, K.L.; Pfeiffer, D.; Rosales Chavez, J.-B. Planning for Urban Sustainability through Residents’ Wellbeing: The Effects of Nature Interactions, Social Capital, and Socio-Demographic Factors. Sustainability 2024, 16, 4160. [Google Scholar] [CrossRef]
  69. Tian, D.; Wang, J.; Xia, C.; Zhang, J.; Zhou, J.; Tian, Z.; Zhao, J.; Li, B.; Zhou, C. The Relationship between Green Space Accessibility by Multiple Travel Modes and Housing Prices: A Case Study of Beijing. Cities 2024, 145, 104694. [Google Scholar] [CrossRef]
  70. Kang, P.; Huang, K.; Zhao, Y. A Study of Environmental Education Requirements in Urban Theme Parks from the Perspective of Adolescents. Sustainability 2024, 16, 505. [Google Scholar] [CrossRef]
  71. Ma, Y.; Brindley, P.; Lange, E. The Influence of Socio-Demographic Factors on Preference and Park Usage in Guangzhou, China. Land 2022, 11, 1219. [Google Scholar] [CrossRef]
  72. Misiune, I. Do We Need Different Urban Green Spaces Now? A Case Study of Preferences during Pandemics. Land 2023, 12, 2106. [Google Scholar] [CrossRef]
  73. Huang, Y.; Li, Z.; Huang, Y. User Perception of Public Parks: A Pilot Study Integrating Spatial Social Media Data with Park Management in the City of Chicago. Land 2022, 11, 211. [Google Scholar] [CrossRef]
  74. Kangas, A.; Kurttila, M.; Hujala, T.; Eyvindson, K.; Kangas, J. Decision Support for Forest Management; Springer International Publishing: Cham, Switzerland, 2015. [Google Scholar] [CrossRef]
  75. Lakicevic, M.; Srdjevic, B.; Velichkov, I. Combining AHP and Smarter in Forestry Decision Making. Balt. For. 2018, 24, 42–49. [Google Scholar]
  76. Lakicevic, M.; Srdjevic, B. An Approach to Developing the Multicriteria Optimal Forest Management Plan: The “Fruska Gora” National Park Case Study. Land 2022, 11, 1671. [Google Scholar] [CrossRef]
  77. Wang, H.; Shen, Q.; Tang, B. GIS-Based Framework for Supporting Land Use Planning in Urban Renewal: Case Study in Hong Kong. J. Urban Plan. Dev. 2015, 141, 05014015. [Google Scholar] [CrossRef]
  78. Nkeki, F.N.; Asikhia, M.O. Geographically Weighted Logistic Regression Approach to Explore the Spatial Variability in Travel Behaviour and Built Environment Interactions: Accounting Simultaneously for Demographic and Socioeconomic Characteristics. Appl. Geogr. 2019, 108, 47–63. [Google Scholar] [CrossRef]
  79. Todeschi, V.; Pappalardo, S.E.; Zanetti, C.; Peroni, F.; De Marchi, M. Climate Justice in the City: Mapping Heat-Related Risk for Climate Change Mitigation of the Urban and Peri-Urban Area of Padua (Italy). ISPRS Int. J. Geo-Inf. 2022, 11, 490. [Google Scholar] [CrossRef]
  80. Wang, C.; Wang, Z.-H.; Kaloush, K.E.; Shacat, J. Perceptions of Urban Heat Island Mitigation and Implementation Strategies: Survey and Gap Analysis. Sustain. Cities Soc. 2021, 66, 102687. [Google Scholar] [CrossRef]
  81. Boers, B.; Cottrell, S. Sustainable Tourism Infrastructure Planning: A GIS-Supported Approach. Tour. Geogr. 2007, 9, 1–21. [Google Scholar] [CrossRef]
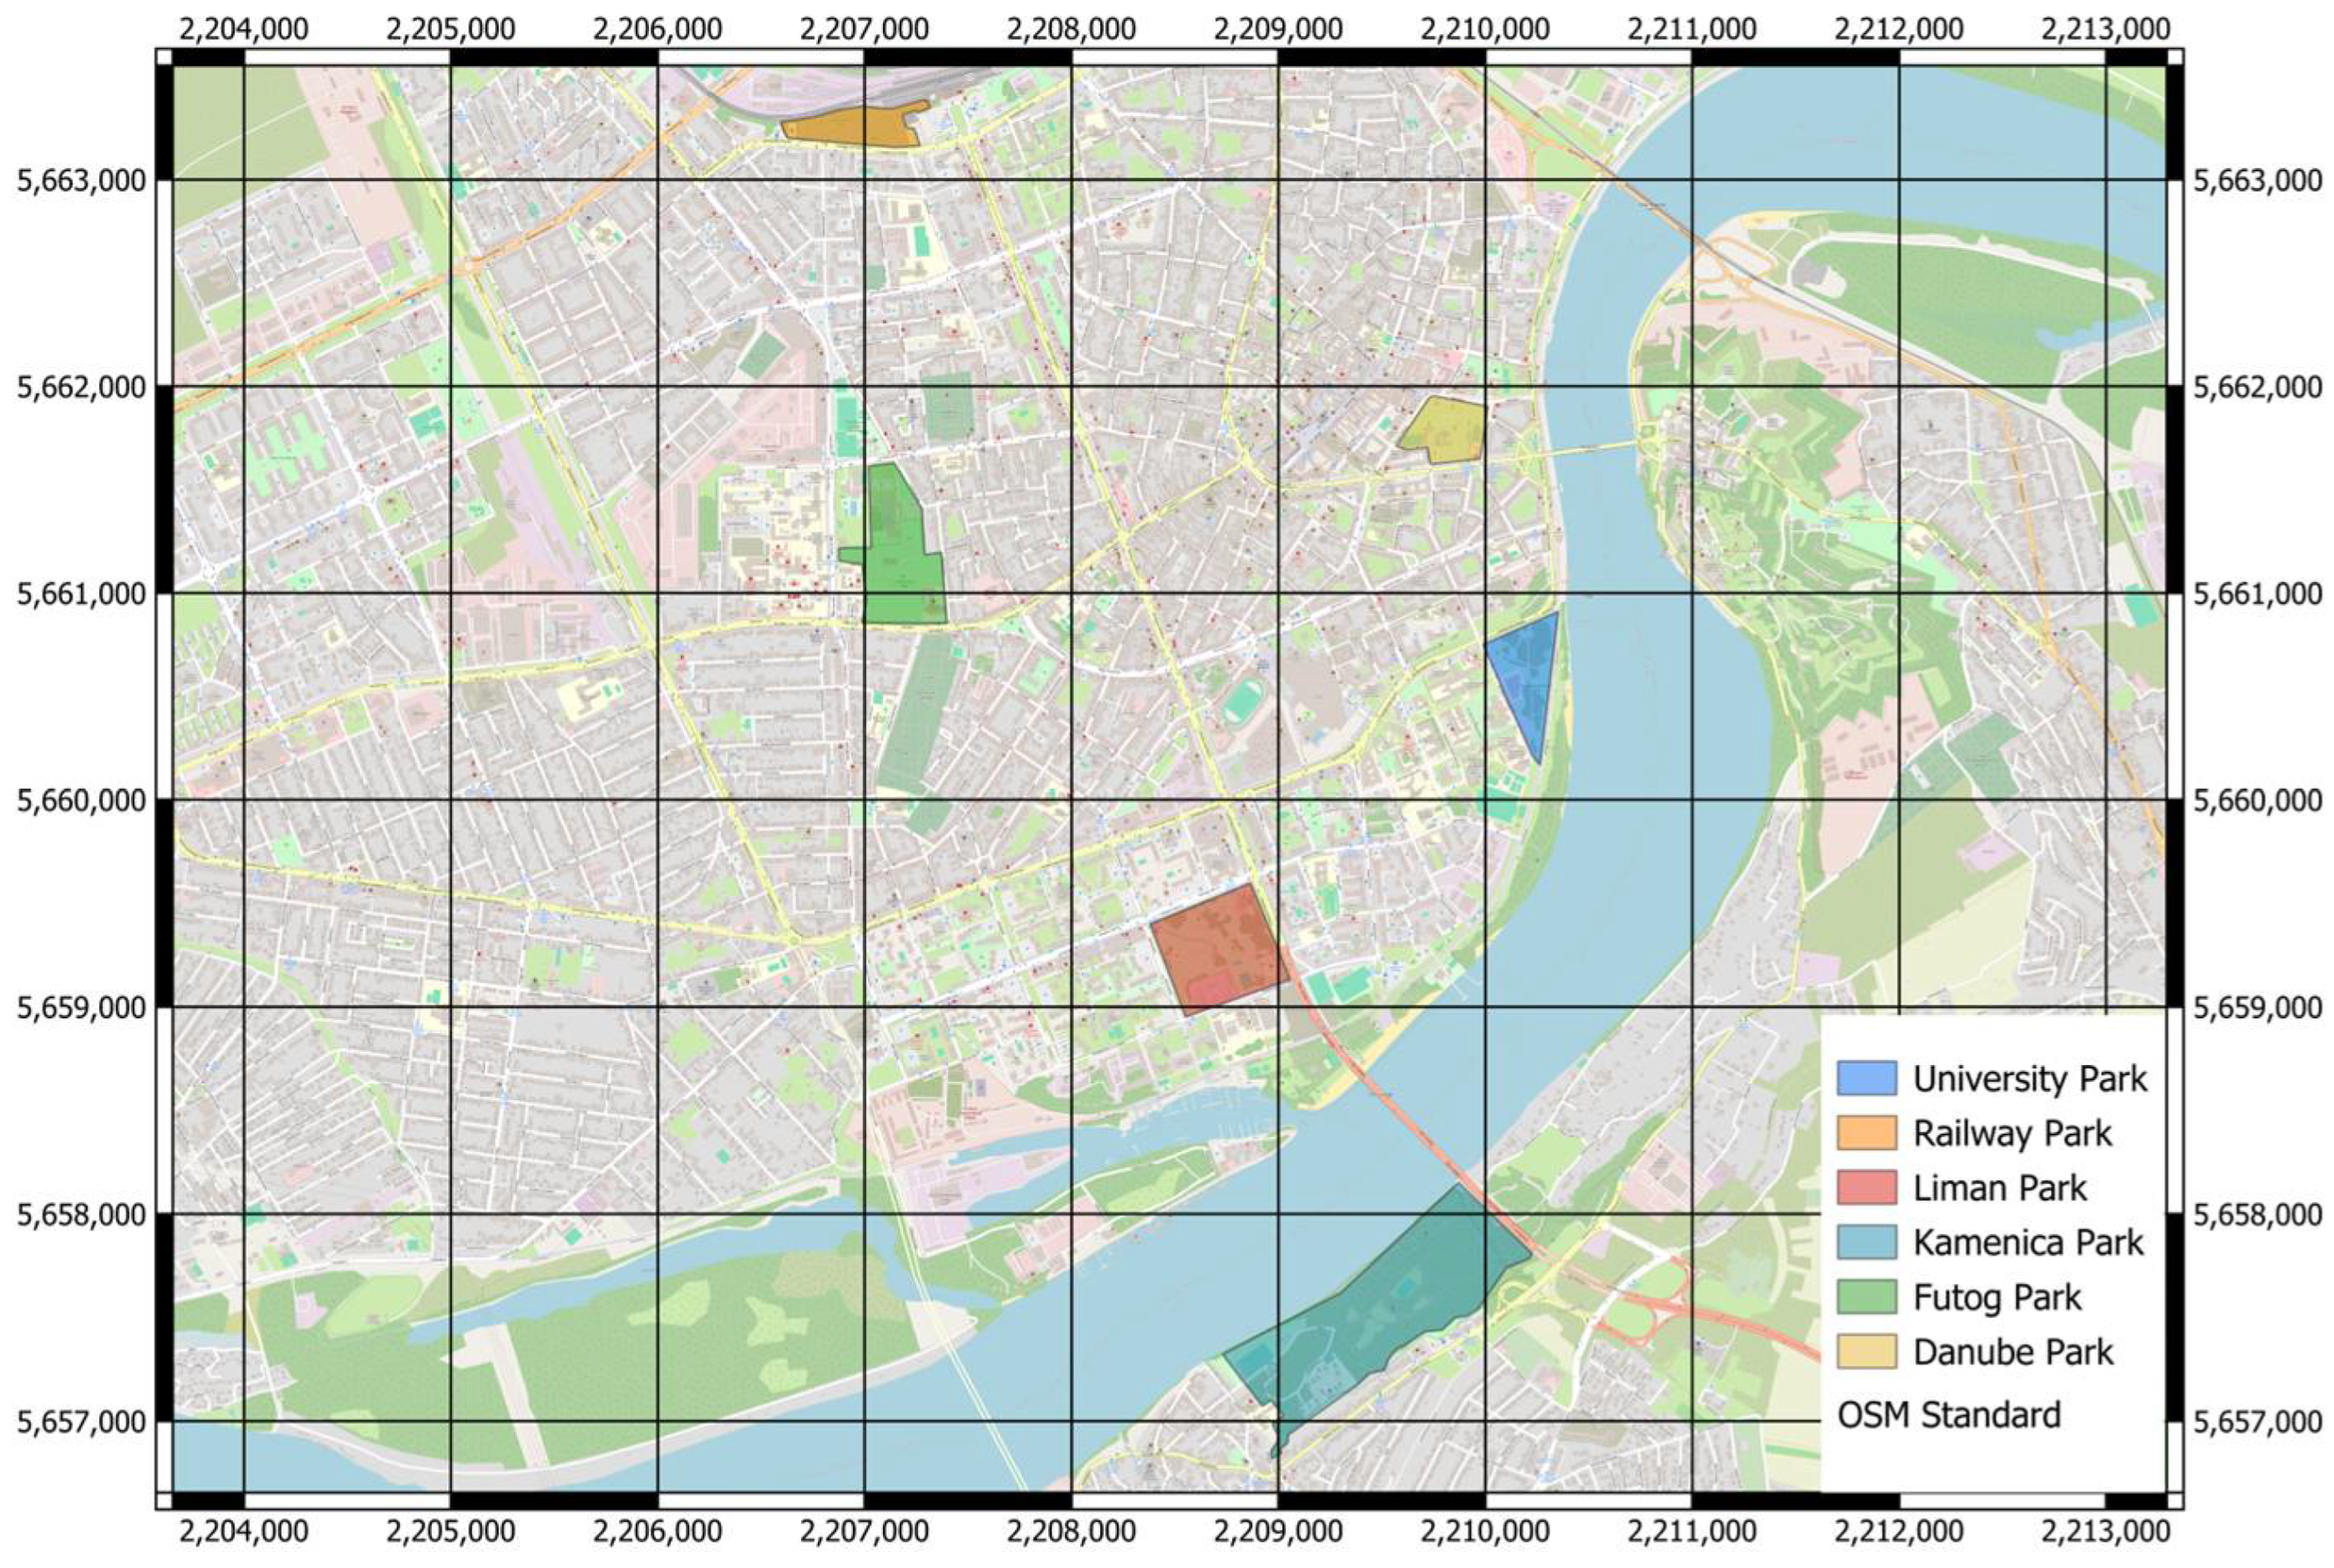
Figure 1. Parks in Novi Sad (Serbia; EPSG:3857).
Urbansci 08 00099 g001
Figure 2. Danube Park, Novi Sad (EPSG:3857).
Urbansci 08 00099 g002
Figure 3. Liman Park, Novi Sad (EPSG:3857).
Urbansci 08 00099 g003
Figure 4. Futog Park, Novi Sad (EPSG:3857).
Urbansci 08 00099 g004
Figure 5. Railway Park, Novi Sad (EPSG:3857).
Urbansci 08 00099 g005
Figure 6. Kamenica Park, Novi Sad (EPSG:3857).
Urbansci 08 00099 g006
Figure 7. University Park, Novi Sad (EPSG:3857).
Urbansci 08 00099 g007
Figure 8. Frequency of student visits per category relative to the year of study (exp. is short for expected).
Urbansci 08 00099 g008
Figure 9. Frequency of student visits per category relative to the gender of the students (exp. is short for expected).
Urbansci 08 00099 g009
Figure 10. Frequencies of student length of stay in parks per category relative to the year of study (exp. is short for expected).
Urbansci 08 00099 g010
Figure 11. Frequency of students per category of length of stay in park relative to gender of the students (exp. is short for expected).
Urbansci 08 00099 g011
Figure 12. Frequency of reasons for park visits and year of study (exp. is short for expected).
Urbansci 08 00099 g012
Figure 13. Frequency of the most notable flaws of parks in Novi Sad relative to gender of the students (exp. is short for expected).
Urbansci 08 00099 g013
Figure 14. Frequency of the nearest parks to the student’s place of living and year of study (exp. is short for expected).
Urbansci 08 00099 g014
Figure 15. Identities of parks in Novi Sad.
Urbansci 08 00099 g015
Figure 16. Least Square Means, F 8,52 = 1.5649 , p = 0.15836 .
Urbansci 08 00099 g016
Figure 17. Least Square Means, F 8,52 = 1.5649 , p = 0.15836 .
Urbansci 08 00099 g017
Figure 18. Least Square Means, F 5,62 = 3.7249 , p = 0.00518 .
Urbansci 08 00099 g018
Table 1. Questionnaire distributed among students of landscape architecture (Novi Sad, Serbia).
QuestionType of QuestionAnswers
1. How often do you visit parks in Novi Sad?single choice(a) Once a month
(b) 2–3 times per month
(c) Once a week
(d) 2–3 times per week
(e) Every day
2. How long does your park visit last? single choice(a) Less than 10 min
(b) In between 10 and 30 min
(c) In between 30 and 60 min
(d) In between 1 and 2 h
(e) Longer than 2 h
3. Which parks do you visit the most? multiple choice(a) Danube
(b) Liman
(c) Railway
(d) University
(e) Futog
(f) Kamenica
4. What are the reasons for your park visits? open-endedNA
5. List the most important qualities of parks in Novi Sadopen-endedNA
6. List the most notable flaws of parks in Novi Sadopen-endedNA
7. Which park is the closest to your place of living? single choice(a) Danube
(b) Liman
(c) Railway
(d) University
(e) Futog
(f) Kamenica
8. Are there parks in Novi Sad which you pass through (without visiting)? single choice(a) yes
(b) no
8a. If the previous answer is “yes” list the park(s) multiple choice(a) Danube
(b) Liman
(c) Railway
(d) University
(e) Futog
(f) Kamenica
9. What element represents the identity of each park in Novi Sad? open-endedNA
10. Evaluate the educational function of each park in Novi Sad single choice(a) 1 (bad)
(b) 2 (poor)
(c) 3 (good)
(d) 4 (very good)
(e) 5 (excellent)
Table 2. One-way ANOVA test: year of study and frequency of park visits.
F(1,66) = 4.3288, MS Error = 1.6076, p = 0.04136
Year of StudyMean Value of Visit FrequencyStandard ErrorConfidence Interval
II3.1500.2005(2.7497, 3.5503)
IV2.5000.2396(2.0216, 2.9784)
Table 3. One-way ANOVA test: gender of students and frequency of park visits.
F(1,66) = 0.4598, MS Error = 1.7012, p = 0.50012
GenderMean Value of Visit FrequencyStandard ErrorConfidence Interval
female2.9570.1923(2.5726, 3.3405)
male2.7270.2781(2.1721, 3.2825)
Table 4. One-way ANOVA test: year of study and length of stay in parks.
F(1,66) = 6.7601, MS Error = 0.5012, p = 0.01149
Year of StudyMean Value of Visit FrequencyStandard ErrorConfidence Interval
II2.7750.1119(2.5515, 2.9985)
IV2.3210.1338(2.0543, 2.5886)
Table 5. One-way ANOVA test: gender of students and length of stay in park.
F(1,66) = 0.10789, MS Error = 0.55168, p = 0.7436
GenderMean Value of Visit FrequencyStandard ErrorConfidence Interval
female2.6090.1095(2.3900, 2.8273)
male2.5450.1584(2.2293, 2.8616)
Table 6. One-way ANOVA: length of stay in park and frequency of visits.
F(3,64) = 2.3176, p = 0.08389
Length of StayMean Value of Visit FrequencyStandard ErrorConfidence Interval
Less than 10 min1.6000.5645(0.4722, 2.7278)
In between 10 and 30 min3.1300.2632(2.6046, 3.6563)
In between 30 and 60 min2.9710.2134(2.5452, 3.3977)
In between 1 and 2 h2.4000.5645(1.2722, 3.5278)
Table 7. One-way ANOVA test, post-hoc test: length of stay in park and frequency of visits.
MS Error = 1.5934
Length of Stay{1}{2}{3}{4}
Less than 10 min
In between 10 and 30 min0.016729
In between 30 and 60 min0.0264270.640466
In between 1 and 2 h0.3200900.2452660.347274
Table 8. One-way ANOVA: frequency of visits and length of stay in park.
F(4,63) = 0.60669, MS Error = 0.55743, p = 0.65927
Frequency of VisitsMean Value of Length of StayStandard ErrorConfidence Interval
Once a month2.4620.2071(2.0477, 2.8753)
2–3 times per month2.6430.1995(2.2441, 3.0416)
Once a week2.4710.1811(2.1087, 2.8324)
2–3 times per week2.8120.1867(2.4395, 3.1855)
Everyday2.5000.2640(1.9725, 3.0275)
Table 9. MANOVA test: frequency of visits, length of stay, and scores for educational function of parks.
VariablenEducational Function
(Score) 1
Confidence Interval
Frequency of park visit p = 0.75481 F 1,52 = 0.09857
Once a month132.758 ± 0.3168 a(2.1226, 3.3941)
2–3 times per month142.594 ± 0.4177 a(1.7557, 3.4319)
Once a week173.095 ± 0.4046 a(2.2833, 3.9072)
2–3 times per week162.830 ± 0.3254 a(2.1766, 3.4827)
Everyday83.125 ± 0.3833 a(2.3559, 3.8941)
Length of stay in park p = 0.91060 F 1,52 = 0.01273
Less than 10 min53.111 ± 0.5520 a(2.0035, 4.2187)
10–30 min232.877 ± 0.2351 a(2.4053, 3.3490)
30–60 min352.843 ± 0.1936 a(2.4543, 3.2312)
1–2 h52.500 ± 0.5110 a(1.4746, 3.5255)
Data set average682.897 ± 0.1311(0.9248, 1.3008)
1 Results are expressed as mean ± standard error. Values represented with the same letters are not statistically different at p 0.05 .
Table 10. One-Way ANOVA test: the most representative parks and scores for educational function.
F(3,64) = 1.5924, MS Error = 1.1382, p = 0.19989
The Most Representative ParknEducational Function
(Score) 1
Confidence Interval
Danube532.867 ± 0.1465 a(2.5752, 3.1607)
Kamenica33.333 ± 0.6159 a(2.1028, 4.5638)
Futog103.200 ± 0.3374 a(2.5260, 3.8740)
Liman21.500 ± 0.7544 a(-0.0070, 3.0070)
1 Results are expressed as mean ± standard error. Values represented with the same letters are not statistically significantly different at p 0.05 .
Table 11. One-Way ANOVA test: the least representative parks and scores for educational function.
F(5,62) = 3.7249, MS Error = 0.97091, p = 0.00518
The Least Representative ParknEducational Function
(Score) 1
Confidence Interval
Railway503.120 ± 0.1393 a(2.8414, 3.3986)
University122.083 ± 0.2844 b(1.5147, 2.6519)
Liman13.000 ± 0.9854 a,b(1.0303, 4.9697)
Kamenica32.000 ± 0.5689 a,b(0.8628, 3.1372)
Danube12.000 ± 0.9854 a,b(0.0303, 3.9697)
Futog15.000 ± 0.9854 a,b(3.0303, 6.9697)
1 Results are expressed as mean ± standard error. Values represented with different letters are statistically significantly different at p < 0.05 .
Disclaimer/Publisher’s Note: The statements, opinions and data contained in all publications are solely those of the individual author(s) and contributor(s) and not of MDPI and/or the editor(s). MDPI and/or the editor(s) disclaim responsibility for any injury to people or property resulting from any ideas, methods, instructions or products referred to in the content.