Promoting Urban Farming for Creating Sustainable Cities in Nepal
Abstract
1. Introduction
“… the production of food for personal consumption, education, donation, or sale and includes associated physical and organizational infrastructure, policies, and programs within urban, suburban, and rural built environments. From community and school gardens in small rural towns and commercial farms in first-ring suburbs to rooftop gardens and bee-keeping operations in built-out cities, urban agriculture exists in multiple forms and for multiple purposes (p. 2).”
2. Theory of Urban Farming
3. Materials and Methods
3.1. Materials
3.2. Methods
3.3. Study Focus: USA and Nepal
3.4. Urban Agriculture in the USA
3.5. Urban Agricultural in Nepal: Study Area
4. Food and Human Health
4.1. The Mounting Food Waste
4.2. Public-Private Partnership (PPP)
5. Empirical Analysis
| Crops | Production (kg. per sq. Meter per Cycle) | |
|---|---|---|
| Urban Farm | Traditional Farm | |
| Tomato | 8.7 | 3.7 |
| Chilly | 4.2 | 1.4 |
| Peeper | 5.5 | 1.8 |
| Lettuce and chicory | ||
| Beans | 1.5 | 1.2 |
| Cabbages | 3.6 | 2.9 |
| Cauliflowers | 0.57 | 0.55 |
| Broccoli | 0.61 | 0.46 |
| Maize | 2.5 | 2.22 |
| Paddy | 0.44 | 0.35 |
| Roots and tubers | 3.8 | 1.3 |
| Oil crops | 0.85 | 0.34 |
| Vegetables | 4.6 | 1.9 |
| Primary fruits | 2.2 | 1.4 |
| Cereals | 0.62 | 0.40 |
| Sugar | 5.3 | 6.9 |
| Fiber crops | 0.42 | 0.01 |
| Average production in kg per sq. meter | 2.84 | 1.68 |
| Average production in kg per hectare | 28,400 | 16,800 |
5.1. Results: Linear Regression Models
5.2. Estimated Avoidance of Greenhouse Gases by Urban Agriculture in Nepal
- (a)
- Total urban population in Nepal is approximately 19 million (66% of 29 m) (CBS, 2021).
- (b)
- As an average household consists of 4.32 individuals, total no. of urban households is 19/4.32 = 4.4 million.
- (c)
- Around 10% of households may be doubling up in the dwellings; thus, the estimated urban number of dwelling units = 3.96 m.
- (d)
- Assuming 25% of the households live in multiunit complexes with limited balcony, rooftop, and ground spaces for farming, the total number of dwellings where urban farming is possible = 2.97 m (representing 12.8 m people) [50].
- (e)
- Reference: 205 kg CO2e per person avoidance due to urban agriculture in Madrid [50].
- (f)
- In Nepal, let us assume 20.5 kg CO2e per person avoidance (per capita/yr. emissions. This is based on the per-capita annual emission of 4.5 tons in Spain (2019), and for Nepal, 0.47 T (approx. 10% of Spain) (2019).
- (g)
- If all urban residents practiced urban agriculture in Nepal, the total annual CO2e avoidance = 262,400 T/yr.
5.3. Estimated Urban Food Production, and Contributions to Household Income
- (a)
- The total number of dwelling units (DU) 3.96. Section 5.2 c.
- (b)
- Typical size of dwelling units = 90–150 square meters (average 120 square meters); 30 m2 can be assigned to a dwelling unit (DU).
- (c)
- Area available for urban farming on flat roofs (assuming half of the buildings have flat roofs) and that, on average, buildings are two stories and have balconies (typically 5 m2/DU) and front/back/side yards (typically 5 m2/DU) = 30 + 5 + 5 = 40 m2.
- (d)
- Assuming half of the available area is used for urban farming, each DU can use 20 m2 for farming.
- (e)
- (f)
- The production per household = 778 kg/yr. It will be monetarily equivalent to approximately Rs 46,680/yr./household, assuming the average price of the typical vegetables to be Rs 60/kg in 2022. The prices are based on the price list published in major newspapers in Kathmandu. According to the 2022 exchange rate, this is approximately equal to USD 360 per year).
- (g)
- Annual food expenditure per household in Nepal is Rs 144,330 (45% of 322,730)/yr.
- (h)
- (USD 1206 in 2017) [49].
- (i)
- Assuming a similar expenditure in 2022 and assuming any growth in expenditure and the rise of the dollar against Nepali Rupees can wash each other out, urban agriculture can provide 27% of a household’s food expenditure.
- (j)
- With the above assumptions, we can conservatively assume that urban agriculture can save a household 25% of its food expenditure.
6. Conclusions and Recommendations
Author Contributions
Funding
Data Availability Statement
Acknowledgments
Conflicts of Interest
Appendix A
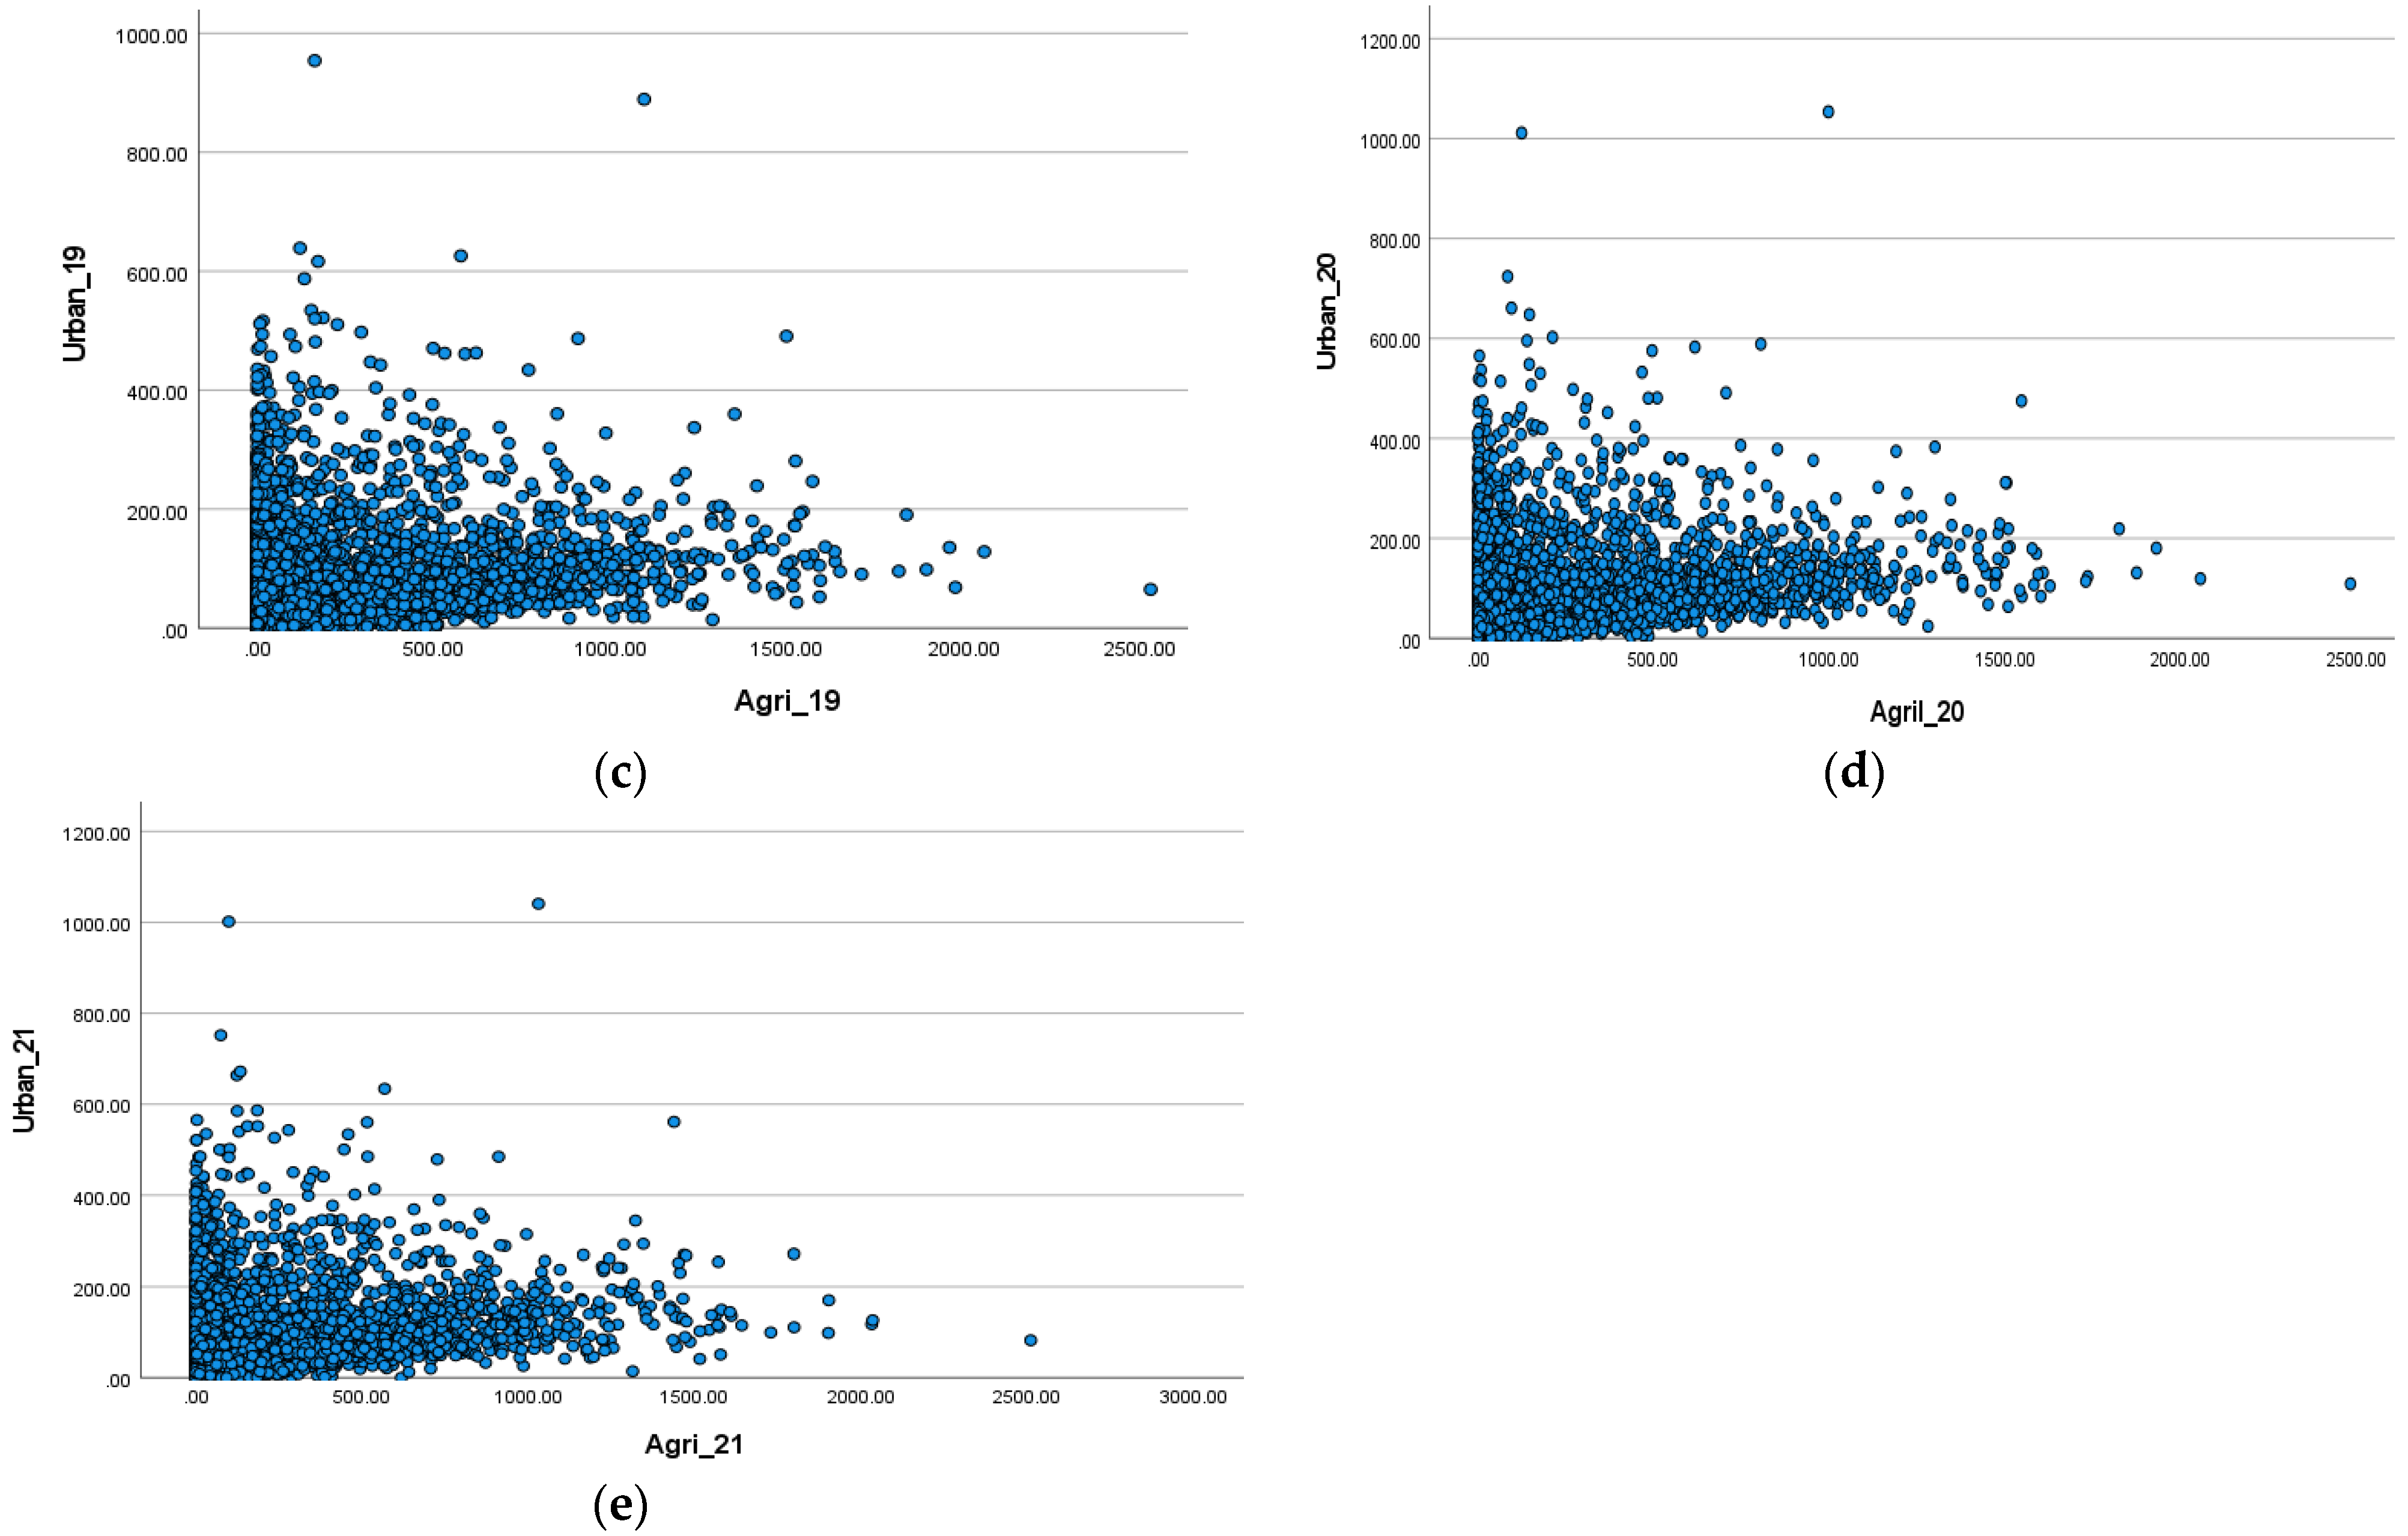
- Urban_17, Urban_18, Urban_19, Urban_20, and Urban_2021: This represents the urban built-up area with impervious surface, buildings of various types, and built-up areas in and around houses.Independent variables include the following:
- Agri_17, Agri_18, Agri_19, Agri_20, and Agri_21: Agricultural areas used to grow various crops. These areas are located within the urban territories in hectares.
- Forest_17, Forest_18, Forest_19, Forest_20, and Forest_21: Forest areas located within the urban territories in hectares. These are the forested areas where the crown cover is over 25%. This area contains forest trees with boles and dense crowns.
- Shrub_17, Shrub_18, Shrub_19, Shrub_20, and Shrub_21: Shrublands are areas located within the urban territories in hectares. These include forested areas where the canopy cover is less than 20% and most of the vegetation is in the form of shrubs and bushes.
| Regression Statistics | ||||||||
| Multiple R | 0.278981 | |||||||
| R Square | 0.07783 | |||||||
| Adjusted R Square | 0.077043 | |||||||
| Standard Error | 76.70347 | |||||||
| Observations | 3519 | |||||||
| ANOVA | ||||||||
| df | SS | MS | F | Significance F | ||||
| Regression | 3 | 1,745,391 | 581,797.1 | 98.88753 | 1.89 × 10−61 | |||
| Residual | 3515 | 20,680,230 | 5883.423 | |||||
| Total | 3518 | 22,425,622 | ||||||
| Coefficients | Standard Error | t Stat | p-Value | Lower 95% | Upper 95% | Lower 95.0% | Upper 95.0% | |
| Intercept | 70.26339 | 1.927585 | 36.45152 | 4.7 × 10−247 | 66.4841 | 74.04269 | 66.4841 | 74.04269 |
| Forest_17 | −0.00503 | 0.001335 | −3.76468 | 0.000169 | −0.00764 | −0.00241 | −0.00764 | −0.00241 |
| Agri_17 | 0.031981 | 0.003947 | 8.101709 | 7.4 × 10⁻¹⁶ | 0.024242 | 0.039721 | 0.024242 | 0.039721 |
| Shrub_17 | −0.02359 | 0.002356 | −10.014 | 2.71 × 10⁻²³ | −0.02821 | −0.01897 | −0.02821 | −0.01897 |
| Regression Statistics | ||||||||
| Multiple R | 0.303474 | |||||||
| R Square | 0.092097 | |||||||
| Adjusted R Square | 0.091322 | |||||||
| Standard Error | 81.10883 | |||||||
| Observations | 3519 | |||||||
| ANOVA | ||||||||
| df | SS | MS | F | Significance F | ||||
| Regression | 3 | 2,345,666 | 781,888.7 | 118.8526 | 2.59 × 10−73 | |||
| Residual | 3515 | 23,123,929 | 6578.643 | |||||
| Total | 3518 | 25,469,595 | ||||||
| Coefficients | Standard Error | t Stat | p-Value | Lower 95% | Upper 95% | Lower 95.0% | Upper 95.0% | |
| Intercept | 74.1408 | 2.030604 | 36.51171 | 9.5 × 10−248 | 70.15952 | 78.12208 | 70.15952 | 78.12208 |
| Forest_18 | −0.00371 | 0.001439 | −2.57671 | 0.010015 | −0.00653 | −0.00089 | −0.00653 | −0.00089 |
| Agri_18 | 0.039802 | 0.004162 | 9.563283 | 2.07 × 10⁻²¹ | 0.031642 | 0.047962 | 0.031642 | 0.047962 |
| Shrub_18 | −0.02717 | 0.002424 | −11.2104 | 1.11 × 10⁻²⁸ | −0.03193 | −0.02242 | −0.03193 | −0.02242 |
| Regression Statistics | ||||||||
| Multiple R | 0.289235 | |||||||
| R Square | 0.083657 | |||||||
| Adjusted R Square | 0.082875 | |||||||
| Standard Error | 86.1838 | |||||||
| Observations | 3519 | |||||||
| ANOVA | ||||||||
| df | SS | MS | F | Significance F | ||||
| Regression | 3 | 2,383,528 | 794,509.2 | 106.9665 | 2.85 × 10−66 | |||
| Residual | 3515 | 26,108,183 | 7427.648 | |||||
| Total | 3518 | 28,491,711 | ||||||
| Coefficients | Standard Error | t Stat | p-Value | Lower 95% | Upper 95% | Lower 95.0% | Upper 95.0% | |
| Intercept | 79.5192 | 2.152556 | 36.94176 | 1 × 10−252 | 75.29882 | 83.73959 | 75.29882 | 83.73959 |
| Forest_19 | −0.00204 | 0.00163 | −1.24904 | 0.211732 | −0.00523 | 0.00116 | −0.00523 | 0.00116 |
| Agri_19 | 0.03904 | 0.004404 | 8.864118 | 1.2 × 10⁻¹⁸ | 0.030404 | 0.047675 | 0.030404 | 0.047675 |
| Shrub_19 | −0.02981 | 0.002714 | −10.986 | 1.25 × 10⁻²⁷ | −0.03513 | −0.02449 | −0.03513 | −0.02449 |
| Regression Statistics | ||||||||
| Multiple R | 0.296757 | |||||||
| R Square | 0.088065 | |||||||
| Adjusted R Square | 0.087286 | |||||||
| Standard Error | 91.96224 | |||||||
| Observations | 3519 | |||||||
| ANOVA | ||||||||
| df | SS | MS | F | Significance F | ||||
| Regression | 3 | 2,870,657 | 956,885.6 | 113.1464 | 6.1 × 10−70 | |||
| Residual | 3515 | 29,726,545 | 8457.054 | |||||
| Total | 3518 | 32,597,201 | ||||||
| Coefficients | Standard Error | t Stat | p-Value | Lower 95% | Upper 95% | Lower 95.0% | Upper 95.0% | |
| Intercept | 85.74272 | 2.289378 | 37.45241 | 1.2 × 10−258 | 81.25408 | 90.23137 | 81.25408 | 90.23137 |
| Forest_20 | −0.00206 | 0.001562 | −1.31951 | 0.187085 | −0.00512 | 0.001001 | −0.00512 | 0.001001 |
| Agril_20 | 0.052424 | 0.00484 | 10.83071 | 6.52 × 10⁻²⁷ | 0.042934 | 0.061914 | 0.042934 | 0.061914 |
| Shrub_20 | −0.0306 | 0.002895 | −10.5701 | 9.93 × 10⁻²⁶ | −0.03628 | −0.02493 | −0.03628 | −0.02493 |
| Regression Statistics | ||||||||
| Multiple R | 0.334757 | |||||||
| R Square | 0.112062 | |||||||
| Adjusted R Square | 0.111304 | |||||||
| Standard Error | 92.26975 | |||||||
| Observations | 3519 | |||||||
| ANOVA | ||||||||
| df | SS | MS | F | Significance F | ||||
| Regression | 3 | 3,776,762 | 1,258,921 | 147.8699 | 3.04 × 10−90 | |||
| Residual | 3515 | 29,925,676 | 8513.706 | |||||
| Total | 3518 | 33,702,438 | ||||||
| Coefficients | Standard Error | t Stat | p-Value | Lower 95% | Upper 95% | Lower 95.0% | Upper 95.0% | |
| Intercept | 84.84215 | 2.286997 | 37.09761 | 1.6 × 10−254 | 80.35817 | 89.32612 | 80.35817 | 89.32612 |
| Forest_21 | −0.00303 | 0.001611 | −1.88285 | 0.059804 | −0.00619 | 0.000125 | −0.00619 | 0.000125 |
| Agri_21 | 0.059594 | 0.004865 | 12.24934 | 8.21 × 10⁻³⁴ | 0.050055 | 0.069133 | 0.050055 | 0.069133 |
| Shrub_21 | −0.03217 | 0.002725 | −11.8081 | 1.39 × 10⁻³¹ | −0.03751 | −0.02683 | −0.03751 | −0.02683 |
References
- Henne, B. How Far Did Your Food Travel to Get to You? Michigan State University, MSU Extension. 2012. Available online: https://www.canr.msu.edu/news/how_far_did_your_food_travel_to_get_to_you (accessed on 10 March 2021).
- Jaggarnath, G. The Transforming City: Exploring the Potential for Smart Cities and Urban Agriculture in Africa. Orient. Anthropol. 2021, 22, 24–40. [Google Scholar] [CrossRef]
- De Preneuf, F. Agriculture and Food. 2021. Available online: https://www.worldbank.org/en/topic/agriculture/ (accessed on 21 December 2022).
- Monaco, T.J.; Weller, S.C.; Ashton, F.M. Weed Science: Principles and Practices, 4th ed.; Pests Diseases & Weeds; Wiley-Blackwell: Hoboken, NJ, USA, 2002; p. 1359. ISBN 978-0-471-37051-2. [Google Scholar]
- Fennimore, S.A.; Bell, C. Principles of Weed Control, 4th ed.; California Weed Science Society: West Sacramento, CA, USA, 2014. [Google Scholar]
- Mishra, A. Weed Management: (Agriculture Research Associates), 2nd ed.; Kalyani: New Delhi, India, 2020. [Google Scholar]
- IPS (International Phytotechnology Society). Book of Abstract. In Proceedings of the 11th International Phytotechnologies Conference, Heraklion, Greece, 30 September–3 October 2014; Kalogerakis, N., Manois, T., Eds.; International Phytotechnology Society: Cincinnati, OH, USA, 2014. [Google Scholar]
- Hodgson, K.; Campbell, M.C.; Bailkey, M. Urban Agriculture: Growing Healthy, Sustainable Places; Planning Advisory Service; Report Number 563; American Planning Association: Chicago, IL, USA, 2011. [Google Scholar]
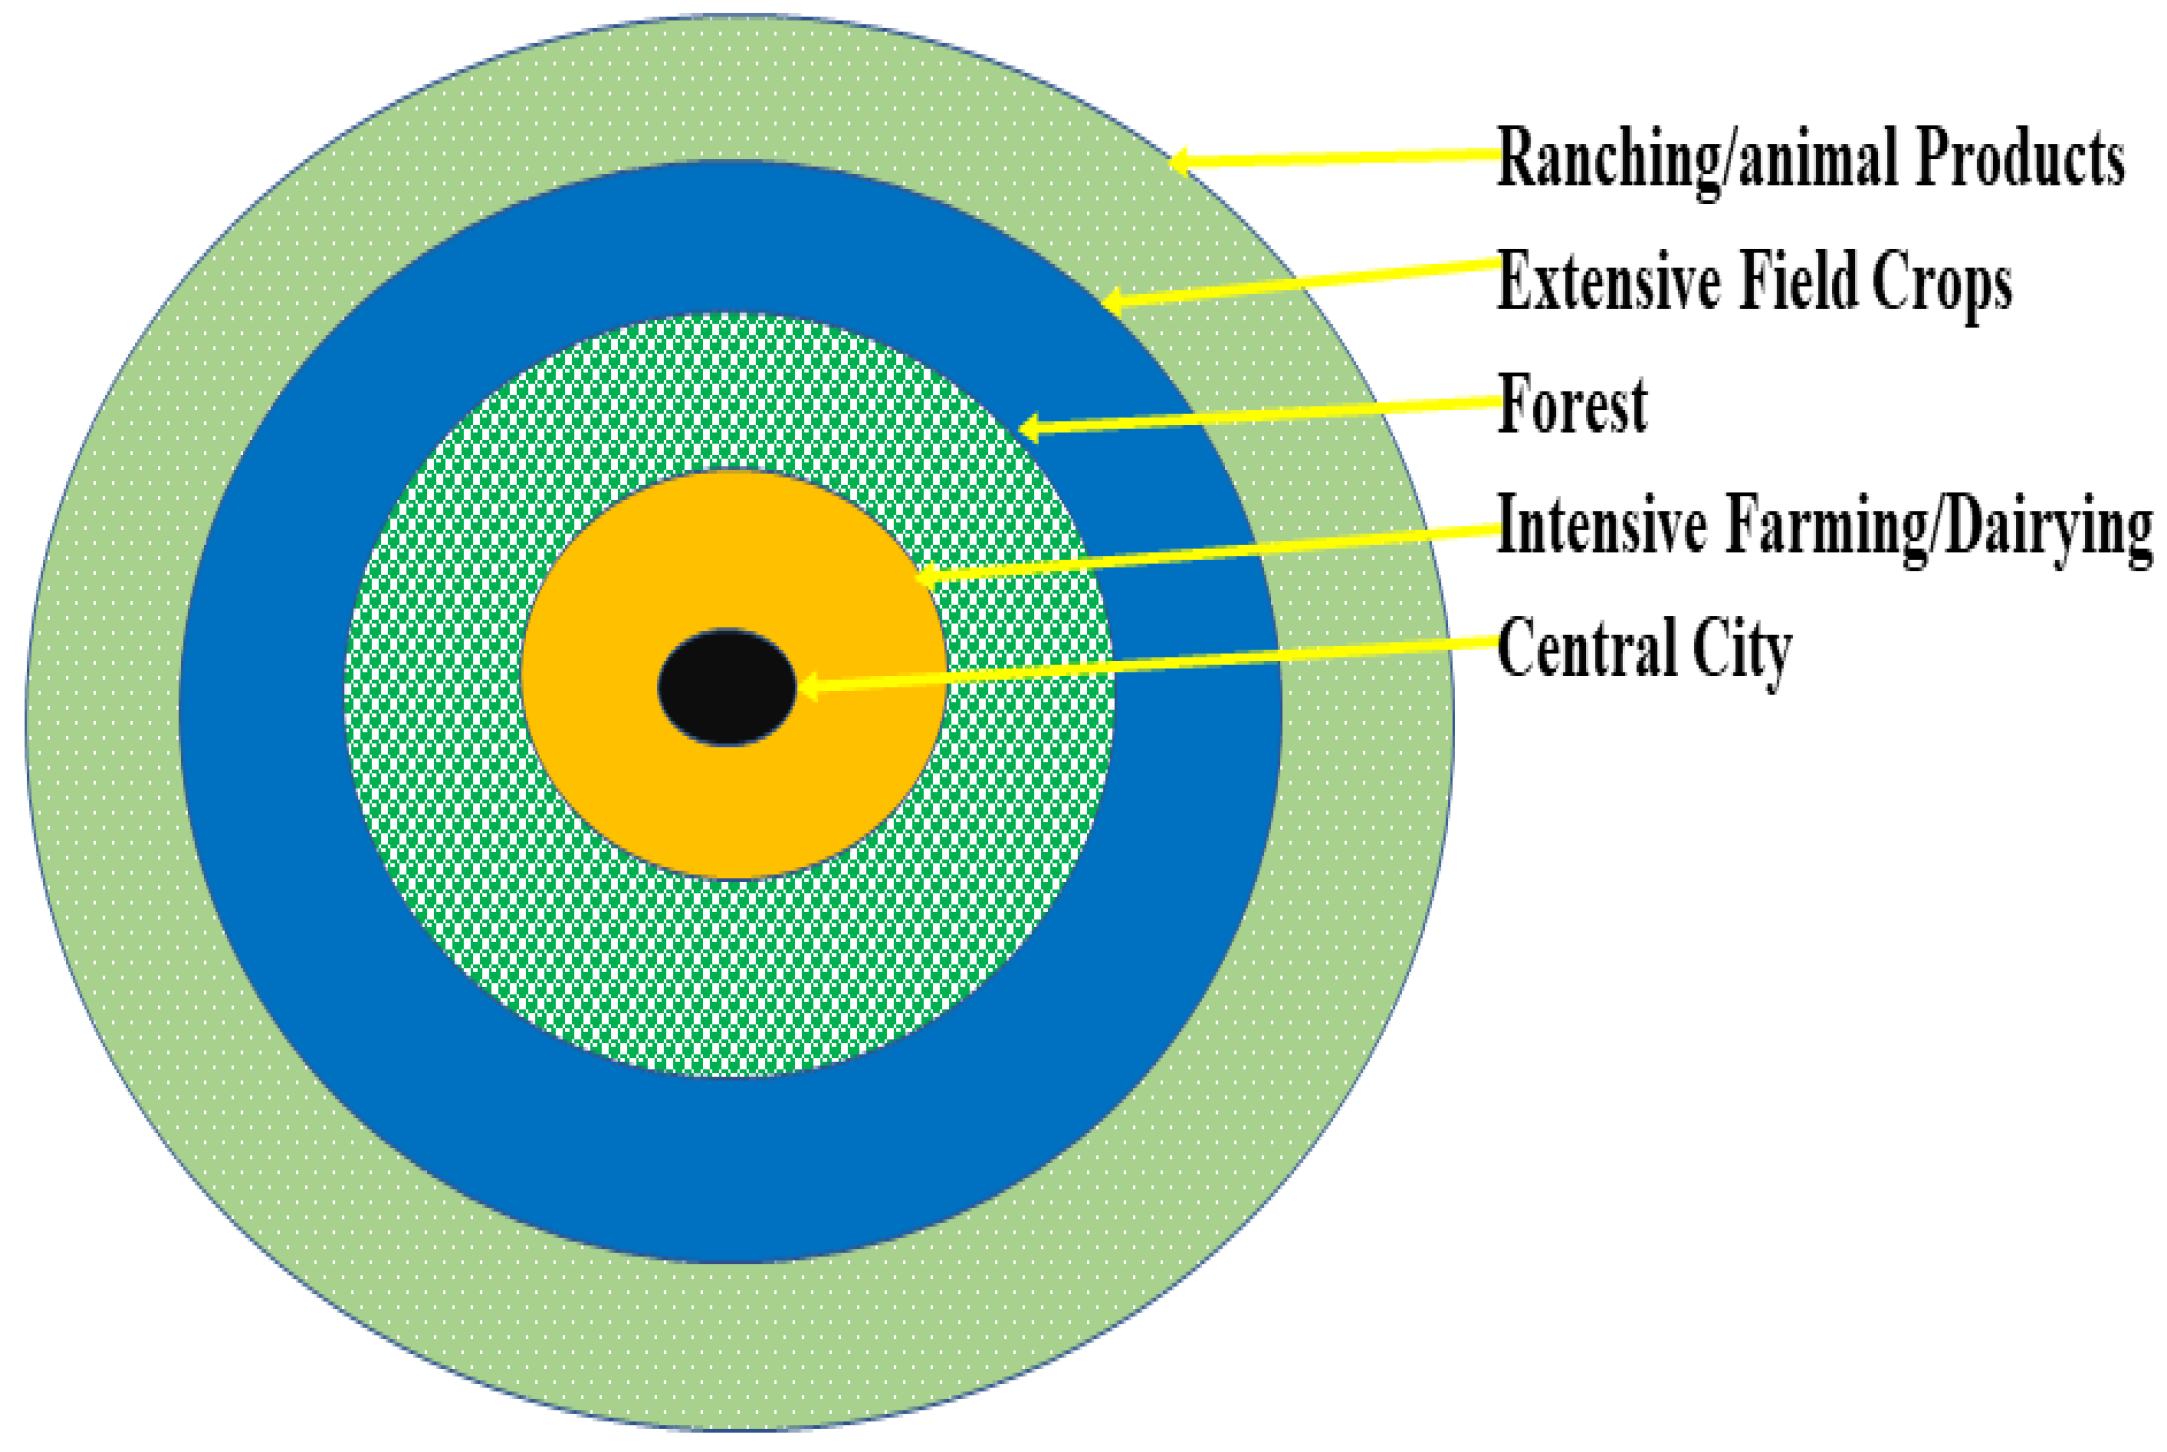
- O’Kelly, M.; Bryan, D. Agricultural location theory: Von Thunen’s contribution to economic geography. Prog. Hum. Geogr. 1996, 20, 457–475. [Google Scholar] [CrossRef]
- Maraseni, T.N.; Qu, J. An international comparison of agricultural nitrous oxide emissions. J. Clean. Prod. 2016, 135, 1256–1266. Available online: https://www.elsevier.com/locate/jclepro (accessed on 21 December 2022). [CrossRef]
- Vermuelen, S.J.; Campbell, B.M.; Ingram, J.S.L. Climate change and food systems. Ann. Rev. Environ. Resour. 2012, 37, 195–222. [Google Scholar] [CrossRef]
- Quinton, A. Why Is One-Third of Our Food Wasted Worldwide? Study Examines Causes of Food Waste and Potential Solutions. UC Davis. 1 October 2019. Available online: https://www.ucdavis.edu/food/news/why-is-one-third-of-food-wasted-worldwide (accessed on 22 December 2022).
- WHO. Food Safety. World Health Organization. 19 May 2022. Available online: https://www.who.int/news-room/fact-sheets/detail/food-safety (accessed on 22 December 2022).
- De Lucia, E.H.; Drake, J.E.; Thomas, R.B.; Gonzalez-Meler, M. Forest carbon use efficiency: Is respiration a constant fraction of gross primary production? Glob. Change Biol. 2007, 13, 1157–1167. [Google Scholar] [CrossRef]
- Bradford, M.A.; Crowther, T.W. Carbon use efficiency and storage in terrestrial ecosystems. New Phytol. 2013, 199, 7–9. [Google Scholar] [CrossRef]
- Roxburgh, S.H.; Berry, S.L.; Buckley, T.N.; Barnes, B.; Roderick, M.L. What is NPP? Inconsistent accounting of respiratory fluxes in the definition of net primary production. Funct. Ecol. 2005, 19, 378–382. [Google Scholar] [CrossRef]
- Ballantyne, A.Á.; Alden, C.Á.; Miller, J.Á.; Tans, P.Á.; White, J.W.C. Increase in observed net carbon dioxide uptake by land and oceans during the past 50 years. Nature 2012, 488, 70–72. [Google Scholar] [CrossRef]
- Elias, S.A. Reference Module in Earth Systems and Environmental Sciences; Elsevier: Amsterdam, The Netherlands, 2021; ISBN 0124095488/978012409595489. [Google Scholar]
- FAO. The State of the World’s Land and Water Resources for Food and Agriculture. Managing System at Risk; Food and Agriculture Organization (FAO): Rome, Italy, 2011. [Google Scholar]
- Ritchie, H.; Roser, M. Urbanization. Our World in Data. 2018. Available online: https://ourworldindata.org/urbanization (accessed on 22 March 2023).
- Food and Agriculture Organization of the United Nations (FAO). FAOSTAT—Crops and Livestock Products. 2022. Available online: https://www.fao.org/faostat/en/#data/QCL (accessed on 15 December 2022).
- Esri. Sentinel-2 10 m Land Use/Land Cover Timeseries Downloader. 2022. Available online: https://www.arcgis.com/apps/instant/media/index.html?appid=fc92d38533d440078f17678ebc20e8e2 (accessed on 2 January 2023).
- Arizona Three Rural Definitions on Census of Urban Areas. 2023. Available online: https://www.ers.usda.gov/webdocs/DataFiles/53180/25557_AZ.pdf?v=0 (accessed on 8 January 2023).
- CBS. Preliminary Report of National Census 2021, Nepal. 2022. Available online: https://censusnepal.cbs.gov.np/Home/Details?tpid=1&dcid=0f011f13-7ef6-42dd-9f03-c7d309d4fca3 (accessed on 1 March 2023).
- UN Habitat and EU. Training Manual on Roof Top Gardening. 2015. Available online: https://www.unhabitat.org.np/recent_publish_detail/training-manual-on-rooftop-gardening (accessed on 25 January 2022).
- UNFCCC. Promotion of Rooftop Farming as Part of Kathmandu’s Climate Change Strategy. Available online: https://unfccc.int/climate-action/un-global-climate-action-awards/winning-projects/activity-database/promotion-of-rooftop-farming-as-part-of-kathmandu-s-climate-change-strategy (accessed on 5 March 2022).
- Clark, M.; Tilman, D. Comparative analysis of environmental impacts of agricultural production systems, agricultural input efficiency, and food choice. Environ. Res. Lett. 2017, 12, 064016. [Google Scholar] [CrossRef]
- Davis, K.F.; D’Odorico, P.; Rulli, M.C. Moderating diets to feed the future. Earth’s Future 2014, 2, 559–565. [Google Scholar] [CrossRef]
- Payen, S.; Basset-Mens, C.; Perret, S. LCA of local and imported tomato: An energy and water trade-off. J. Clean. Prod. 2015, 87, 139–148. [Google Scholar] [CrossRef]
- Midmore, D.J.; Jansen, H.G. Supplying vegetables to Asian cities: Is there a case for peri urban production? Food Policy 2003, 28, 13–27. [Google Scholar] [CrossRef]
- KrASIA. The Future of Agri-Food Tech in Southeast Asia: Agriculture in the Digital Decade. Written by Deloitte Southeast Asia Inno-Vation Team. 19 April 2022. Available online: https://kr-asia.com/the-future-of-agrifood-tech-in-southeast-asia-agriculture-in-the-digital-decade (accessed on 5 October 2022).
- Barioni, L.G.; Benton, T.G.; Herrero, M.; Krishnapilla, M.; Liwenga, E.; Pradhan, P.; Rivera-Ferre, M.G.; Sapkota, T.; Tubiello, F.N.; Xu, Y. Food Security. Spatial Report: Special Report on Climate Change. 2017. Available online: https://www.ipcc.ch/srccl/chapter/chapter-5/ (accessed on 5 March 2023).
- Intergovernmental Panel on Climate Change (IPCC). Summary for policymakers. In Climate Change and Land: An IPCC Special Report on Climate Change, Desertification, Land Degradation, Sustainable Land Management, Food Security, and Greenhouse Gas Fluxes in Terrestrial Ecosystems; Masson-Delmotte, V., Zhai, P., Pörtner, H.-O., Roberts, D., Skea, J., Buendía, E.C., Shukla, P.R., Slade, R., Connors, S., van Dieme, R., et al., Eds.; Cambridge University Press: Cambridge, UK, 2019; pp. 1–36. Available online: https://www.ipcc.ch/srccl/chapter/summary-for-policymakers/ (accessed on 2 January 2023).
- Leh, O.L.H.; Abdullah, W.M.Y.; Omar, D.; Marzukhi, M.A.; Barghchi, M.; Fong, T.S. Urban farming: Utilisation of infrastructure or utility reserved lands. In Proceedings of the 2011 IEEE Symposium on Business, Engineering and Industrial Applications (ISBEIA), Langkawi, Malaysia, 25–28 September 2011. [Google Scholar]
- USDA. U.S. Department of Agriculture. USDA’s Office of Urban Agriculture and Innovative Production. Available online: https://www.usda.gov/topics/urban (accessed on 22 November 2022).
- Payen, F.T.; Evans, D.L.; Falagán, N.; Hardman, C.A.; Kourmpetli, S.; Liu, L.; Marshall, R.; Mead, B.R.; Davies, J.A. How much food can we grow in urban areas? Food production and crop yields of urban agriculture: A meta-analysis. Earth’s Future 2022, 10, e2022EF002748. [Google Scholar] [CrossRef] [PubMed]
- Mintorogo, D.S.; Widigdo, W.K.; Juniwati, A. Remarkable 3-in-1 Pakis-Stem Green Roofs for Saving Thermal Flat Rooftop. Adv. Sci. Lett. 2017, 23, 6173–6178. [Google Scholar] [CrossRef]
- Thomaier, S.; Specht, K.; Henckel, D.; Dierich, A.; Siebert, R.; Freisinger, U.B.; Sawicka, M. Farming in and on urban buildings: Present practice and specific novelties of zero-acreage farming (ZFarming). Renew. Agric. Food Syst. 2014, 30, 43–54. [Google Scholar] [CrossRef]
- Taufani, B. Urban Farming Construction Model on the Vertical Building Envelope to Support the Green Buildings Development in Sleman, Indonesia. Procedia Eng. 2017, 171, 258–264. [Google Scholar]
- Clinton, N.; Stuhlmacher, M.; Miles, A.; Uludere Aragon, N.; Wagner, M.; Georgescu, M.; Herwig, C.; Gong, P. A global geospatial ecosystem services estimate of urban agriculture. Earth’s Future 2018, 6, 40–60. [Google Scholar] [CrossRef]
- Abdulkadir, A.; Dossa, L.H.; Lompo, D.J.P.; Abdu, N.; van Keulen, H. Characterization of urban and peri-urban agroecosystems in three West African cities. Int. J. Agric. Sustain. 2012, 10, 289–314. [Google Scholar] [CrossRef]
- Kriewald, S.; Pradhan, P.; Costa, L.; García Cantú Ros, A.; Kropp, J.P. Hungry cities: How local food self-sufficiency relates to climate change, diets, and urbanisation. Environ. Res. Lett. 2019, 14, 094007. [Google Scholar] [CrossRef]
- Yoshida, S.; Yagi, H. Long-term development of urban agriculture: Resilience and sustainability of farmers facing the COVID-19 pandemic in Japan. Sustainability 2021, 13, 4316. [Google Scholar] [CrossRef]
- Ferroni, M.; Castle, P. Public-Private Partnerships and Sustainable Agricultural Development. Sustainability 2011, 3, 1064–1073. [Google Scholar] [CrossRef]
- The G-20 Toronto Summit Declaration. 26–27 June 2010. Available online: https://www.oecd.org/g20/summits/toronto/g20-declaration.pdf (accessed on 22 March 2023).
- Rabbi, M.F.; Ben Hassen, T.; El Bilali, H.; Raheem, D.; Raposo, A. Food Security challenges in Europe in the Context of the Prolonged Russia-Ukrainian Conflict. Sustainability 2023, 15, 4745. [Google Scholar] [CrossRef]
- Food and Agriculture Organization of the United Nations. FAOSTAT. 2022. Available online: https://www.fao.org/faostat/en/#home (accessed on 5 October 2022).
- Grebitus, C. Small-scale urban agriculture: Drivers of growing produce at home and in community gardens in Detroit. PLoS ONE 2021, 16, e0256913. [Google Scholar] [CrossRef] [PubMed]
- CBS. Nepali Household Spending Up 9 Pc. The Kathmandu Post. 2017. Available online: https://kathmandupost.com/money/2017/04/07/nepalis-household-spending-up-9pc (accessed on 15 March 2023).
- Puigdueta, I.; Aguilera, E.; Cruz, J.L.; Iglesias, A.; Sanz-Cobena, A. Urban agriculture may change food consumption towards low carbon diets. Glob. Food Secur. 2021, 28, 100507. Available online: https://www.sciencedirect.com/science/article/pii/S2211912421000171 (accessed on 15 January 2023). [CrossRef]
- The World Bank. Projection of Urban Population in Nepal for 2021. 2018. Available online: https://data.worldbank.org/indicator/SP.URB.TOTL.IN.ZS?locations=NP (accessed on 15 January 2021.).
- Van Bel, A.J.E.; Offler, C.E.; Patrick, J.W. Photosynthesis and Partitioning/Sources and Sinks. Encycl. Appl. Plant Sci. 2003, 724–734. Available online: https://www.sciencedirect.com/science/article/pii/B0122270509000892?via%3Dihub (accessed on 23 December 2022).
- Meyer, V. How We Measure the Carbon Capture Potential of Forest. Terraformation. 2022. Available online: https://www.terraformation.com/blog/how-to-measure-carbon-capture-potential-forests (accessed on 23 December 2022).
- Araki, K.S.; Nagano, A.J.; Nakano, R.T.; Kitazume, T.; Yamaguchi, K.; Hara-Nishimura, I.; Shigenobu, S.; Kudoh, H. Characterization of rhizome transcriptome and identification of a rhizomatous ER body in the clonal plant Cardamine leucantha. Sci. Rep. 2020, 10, 13291. [Google Scholar] [CrossRef]




| Province | Land Areas in Hectares in Various Provinces Occupied by Urban Agriculture and Urban Built-In Areas | |||||||||
|---|---|---|---|---|---|---|---|---|---|---|
| Y2017 | Y2018 | Y2019 | Y2020 | Y2021 | ||||||
| Agri | Urban | Agri | Urban | Agri | Urban | Agri | Urban | Agri | Urban | |
| Koshi | 1662.39 | 480.35 | 1681.63 | 512.43 | 1672.53 | 546.01 | 1598.54 | 613.38 | 1593.52 | 577.07 |
| Madhesh | 3431.91 | 508.75 | 3382.89 | 567.56 | 3455.33 | 558.83 | 3335.22 | 618.48 | 3253.35 | 671.21 |
| Bagmati | 688.95 | 680.11 | 680.29 | 710.26 | 661.21 | 777.65 | 639.10 | 836.62 | 605.07 | 795.92 |
| Gandaki | 332.74 | 199.98 | 317.37 | 210.07 | 319.42 | 232.93 | 320.02 | 260.56 | 288.87 | 228.23 |
| Lumbini | 2080.54 | 385.29 | 2067.81 | 413.51 | 2052.55 | 442.18 | 1996.69 | 515.45 | 1999.27 | 513.26 |
| Karnali | 225.12 | 54.91 | 193.78 | 57.41 | 201.49 | 70.77 | 179.79 | 97.36 | 151.29 | 74.59 |
| Sudur Paschim | 1147.67 | 149.34 | 1132.58 | 172.81 | 1108.77 | 205.42 | 1072.49 | 251.84 | 1027.11 | 263.78 |
| Total | 8387.28 | 3640.77 | 9456.35 | 2644.05 | 9471.3 | 2833.79 | 9141.85 | 3193.69 | 8918.48 | 3124.06 |
| Year | Land Area (Hectares) | |
|---|---|---|
| Agriculture Area | Urban Built-Up Area | |
| 2017 | 1236.97 | 566.23 |
| 2018 | 1227.43 | 590.87 |
| 2019 | 1202.38 | 631.73 |
| 2020 | 1161.66 | 674.72 |
| 2021 | 1152.56 | 682.69 |
| Total | 5981.00 | 3146.24 |
| Stage of Urbanization | Typical Characteristics and Examples | Typical Locations and Types for Urban Agriculture |
|---|---|---|
| High-density urban core | High-rise, mid-rise, high-density areas Kathmandu and Lalitpur central core | Rooftops, balconies, indoor plants, hydroponics, and plants in vases |
| Suburban | Single family and low-density multifamily Outer ring road settlements in the Kathmandu Valley | Front, back, and side yards; porches; balconies; and rooftops |
| Peri-urban | Agricultural areas being converted into urban ones Immediate boundaries of cities and towns | Front, back, and side yards; and community parks and gardens |
| Newly urbanizing | Newly defined as urban, transitioning from agriculture to urban Itaharti, Tokha, and Lekhanath | Front, back, and side yards; and adjoining and interior vacant lands |
| Description | 2017 | 2018 | 2019 | 2020 | 2021 |
|---|---|---|---|---|---|
| Household | 3,179,501 | 3,223,011 | 3,269,769 | 3,317,878 | 3,568,461 |
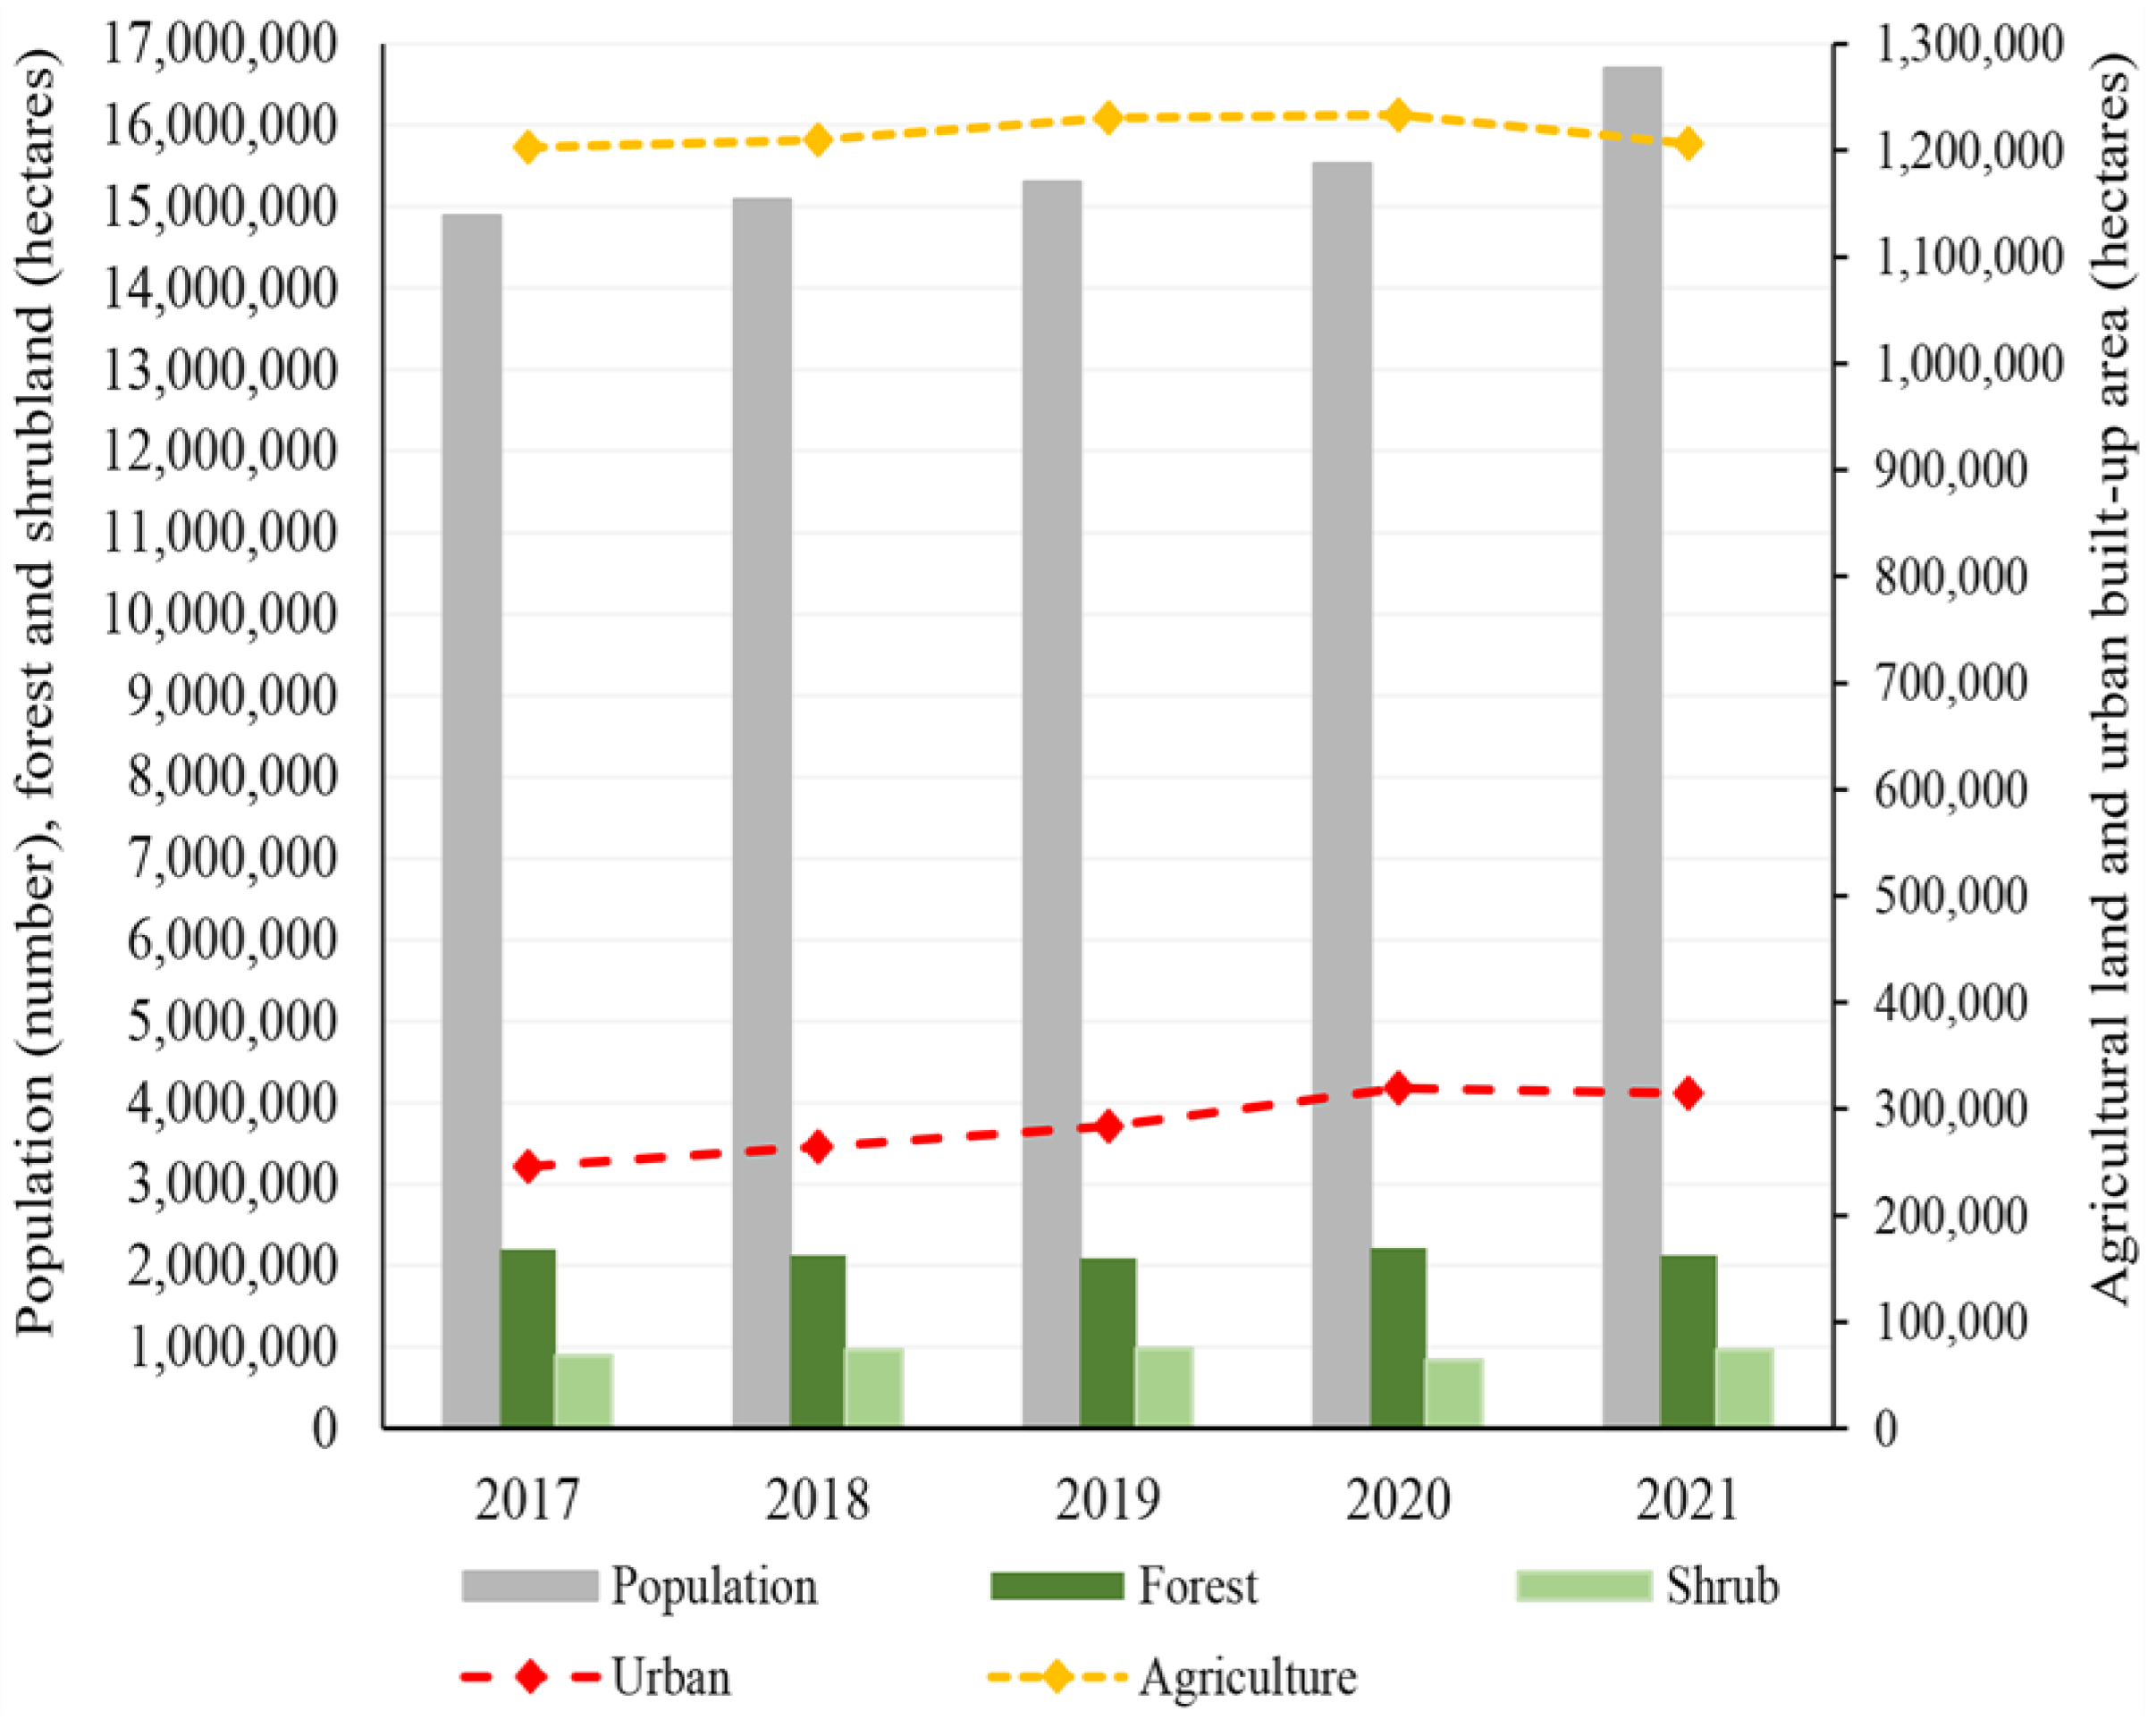
| Population | 14,885,696 | 15,081,759 | 15,300,557 | 15,525,679 | 16,698,585 |
| Urban | 245,862 | 264,399 | 283,380 | 319,366 | 314,403 |
| Agriculture | 956,929 | 945,631 | 947,128 | 914,173 | 891,844 |
| Forest | 2,198,796 | 2,124,194 | 2,086,774 | 2,211,531 | 2,122,948 |
| Shrub | 887,922 | 966,543 | 978,629 | 840,674 | 959,362 |
| Water | 37,317 | 33,195 | 33,376 | 38,715 | 38,027 |
| Plant Types | Aboveground Biomass (Tons) | Belowground Biomass (Tons) | Fruit Production (Tons) | ||
|---|---|---|---|---|---|
| Minimum CUE | Maximum CUE | Minimum CUE | Maximum CUE | ||
| Rhizome | 209,920 | 223,040 | 52,480 | 55,760 | 104,960 |
| Tuberous | 183,680 | 196,800 | 49,920 | 49,200 | 12,300 |
Disclaimer/Publisher’s Note: The statements, opinions and data contained in all publications are solely those of the individual author(s) and contributor(s) and not of MDPI and/or the editor(s). MDPI and/or the editor(s) disclaim responsibility for any injury to people or property resulting from any ideas, methods, instructions or products referred to in the content. |
© 2023 by the authors. Licensee MDPI, Basel, Switzerland. This article is an open access article distributed under the terms and conditions of the Creative Commons Attribution (CC BY) license (https://creativecommons.org/licenses/by/4.0/).
Share and Cite
Bhattarai, K.; Adhikari, A.P. Promoting Urban Farming for Creating Sustainable Cities in Nepal. Urban Sci. 2023, 7, 54. https://doi.org/10.3390/urbansci7020054
Bhattarai K, Adhikari AP. Promoting Urban Farming for Creating Sustainable Cities in Nepal. Urban Science. 2023; 7(2):54. https://doi.org/10.3390/urbansci7020054
Chicago/Turabian StyleBhattarai, Keshav, and Ambika P. Adhikari. 2023. "Promoting Urban Farming for Creating Sustainable Cities in Nepal" Urban Science 7, no. 2: 54. https://doi.org/10.3390/urbansci7020054
APA StyleBhattarai, K., & Adhikari, A. P. (2023). Promoting Urban Farming for Creating Sustainable Cities in Nepal. Urban Science, 7(2), 54. https://doi.org/10.3390/urbansci7020054


