Article

Evaluating the Accuracy of Gridded Population Estimates in Slums: A Case Study in Nigeria and Kenya

1
Faculty of Geo-Information Science & Earth Observation, University of Twente, 7514 AE Enschede, The Netherlands
2
Department of Social Statistics & Demography, University of Southampton, Southampton SO17 1BJ, UK
3
Department of Geography & Geosciences, University of Louisville, Louisville, KY 40208, USA
4
Center for International Earth Science Information Network (CIESIN), Columbia University, New York, NY 10964, USA
5
Department of Geography, University of Lagos, Lagos 101017, Nigeria
*
Author to whom correspondence should be addressed.
Urban Sci. 2021, 5(2), 48; https://doi.org/10.3390/urbansci5020048
Submission received: 16 May 2021 / Revised: 16 June 2021 / Accepted: 17 June 2021 / Published: 20 June 2021

Abstract

:
Low- and middle-income country cities face unprecedented urbanization and growth in slums. Gridded population data (e.g., ~100 × 100 m) derived from demographic and spatial data are a promising source of population estimates, but face limitations in slums due to the dynamic nature of this population as well as modelling assumptions. In this study, we compared field-referenced boundaries and population counts from Slum Dwellers International in Lagos (Nigeria), Port Harcourt (Nigeria), and Nairobi (Kenya) with nine gridded population datasets to assess their statistical accuracy in slums. We found that all gridded population estimates vastly underestimated population in slums (RMSE: 4958 to 14,422, Bias: −2853 to −7638), with the most accurate dataset (HRSL) estimating just 39 per cent of slum residents. Using a modelled map of all slums in Lagos to compare gridded population datasets in terms of SDG 11.1.1 (percent of population living in deprived areas), all gridded population datasets estimated this indicator at just 1–3 per cent compared to 56 per cent using UN-Habitat’s approach. We outline steps that might improve that accuracy of each gridded population dataset in deprived urban areas. While gridded population estimates are not yet sufficiently accurate to estimate SDG 11.1.1, we are optimistic that some could be used in the future following updates to their modelling approaches.

Graphical Abstract

1. Introduction

Over the next 30 years, 90 per cent of global population growth is expected to take place in African and Asian cities alone, with a majority of those people added in slums, informal settlements, and other deprived urban areas [1]. While the rates of population growth in many low- and middle-income countries (LMICs) are similar to the rates of high-income countries (HIC) a century ago [2], the absolute numbers of people being added to LMIC cities today are unprecedented in human history [3]. Over the next decade, Kinshasa (D.R. Congo) is expected to add 757,000 people per year, Lagos (Nigeria) 623,000 per year, Cairo (Egypt) 462,000 per year, and Dar es Salaam (Tanzania) 409,000 people per year [1]. Massive population inflows have left city institutions grappling to respond to housing, transportation, services, and basic environmental needs, with citizens living in increasingly unequal, dynamic, and precarious circumstances [3]. Major housing crises across LMIC cities have left millions of low-income people with no choice but to live in slums, informal tenancies, hostels, at their place of work (e.g., shop), or other short-term or non-traditional arrangement [4]. With limited updated information about how many people live where, local and national leaders are handicapped in their ability to monitor indicators such as local Sustainable Development Goals (SDGs), and respond effectively to compounding challenges [3].
Rapid urbanization in LMIC cities means that traditional modes of population data collection such as government administrative records, censuses (conducted roughly every 10 years), and routine household surveys (conducted roughly every five years) are increasingly inaccurate, especially with respect to the urban poorest [5]. LMIC government data systems such as civil registrations and vital statistics have been consistently deprioritized over the last half century by governments and international donors which means that only a handful of LMICs today have a reasonably complete and updated count of births, deaths, and marriages, with the rural and urban poorest most likely to be unregistered [6]. In slums and informal settlements, censuses tend to either omit populations or count them in rural family homes [7], and one in ten LMICs has not held a census in the last 15 years [8]. These sources of population data can also be inherently political. In Nigeria, all modern censuses—1962/3, 1973, 1991, and 2006—have been contentious with accusations of undercounts of rural populations and women, and over-counts in the north of the country [9,10,11]. In Nairobi, Kibera slum is widely cited as among the most populous in the world [12], yet there is no agreement on how many people live there. Although Kibera’s population was estimated to be 200,000 in 2009 by official and scientific sources [13,14], local and international advocacy groups estimated the population to be between 500,000 and 1 million people or more [12,15].
In the absence of reliable administrative and census data, governments and donors have invested heavily in routine household surveys to generate official statistics. Surveys, however, are almost always sampled from the last census which means that informal and newly settled areas are likely to be under-represented, and survey field methods designed 40 years ago for majority rural settings tend to miss urban households living in short-term or atypical accommodation [5]. The dearth of data about the location and number of urban poorest in LMICs is of growing concern to governments, civil society, development organizations, and others working to address housing crises, mitigate the effect of natural disasters, meet basic education and health needs, and ensure humane conditions for people to pursue a dignified existence [16].
In the context of these data challenges, another potential source of population information is modelled gridded population datasets [17]. New technologies, data, and methods have enabled innovate approaches to estimate populations in LMICs. In the last 20 years, very high resolution satellite imagery and other Earth Observation data have become widely and freely available [18], massive increases in computing power now enable low-cost and free big data processing [19], and large-scale investments have been made into volunteered geographic data initiatives such as OpenStreetMap [20]. These technologies and datasets along with traditional population data sources, such as censuses, provide the building blocks to model population counts at fine geographic scale. Modelled gridded population datasets with estimates of residents in areas smaller than a city block have proven to be a flexible type of data because it can easily be aggregated into any larger geographic unit to provide policy relevant knowledge, for example, as denominators to estimate and improve vaccination campaign coverage [21], to identify and fill local gaps in maternal health services [22], to respond to and recover from disasters [23], or as a survey sample frame in the absence of up-to-date census data [24]. As data and technologies improve, so does the accuracy and detail of modelled gridded population datasets [25]. However, given that many gridded population datasets are derived from censuses, it is unclear if these gains apply equally to all sub-areas and sub-populations, particularly vulnerable and mobile populations living in slums and informal settlements.
In this paper, we address the question: “How accurate are gridded population datasets in slums and informal settlements in three LMIC cities?”, and assess the strengths and weaknesses of each dataset for measuring SDG 11.1.1, the percent of population living in slums, informal settlements, and other deprived areas [26]. We answer the research question by comparing gridded population estimates in a selection of field-referenced slums for which population counts were reported by slum dwellers in Lagos (Nigeria), Port Harcourt (Nigeria), and Nairobi (Kenya), and assess the fitness of gridded population datasets for SDG 11 monitoring in Lagos where we had access to a modelled surface of all slum areas. The paper is structured as follows. Section 2 introduces the three study cities; dataset of slum areas and population counts, modelled slums across Lagos, and nine gridded population datasets; and methodological details of our two analyses. Section 3 summarizes results of both analyses to, first, answer the research question and, second, to assesses fitness of gridded population data for SDG 11 monitoring. In Section 4, we discuss the specific strengths and weaknesses of each gridded population dataset evaluated, and offer suggestions to improve the accuracy of these datasets in urban deprived areas. Finally, in Section 5, we offer concluding remarks on the accuracy of gridded population estimates in LMIC slums and informal settlements.

2. Materials and Methods
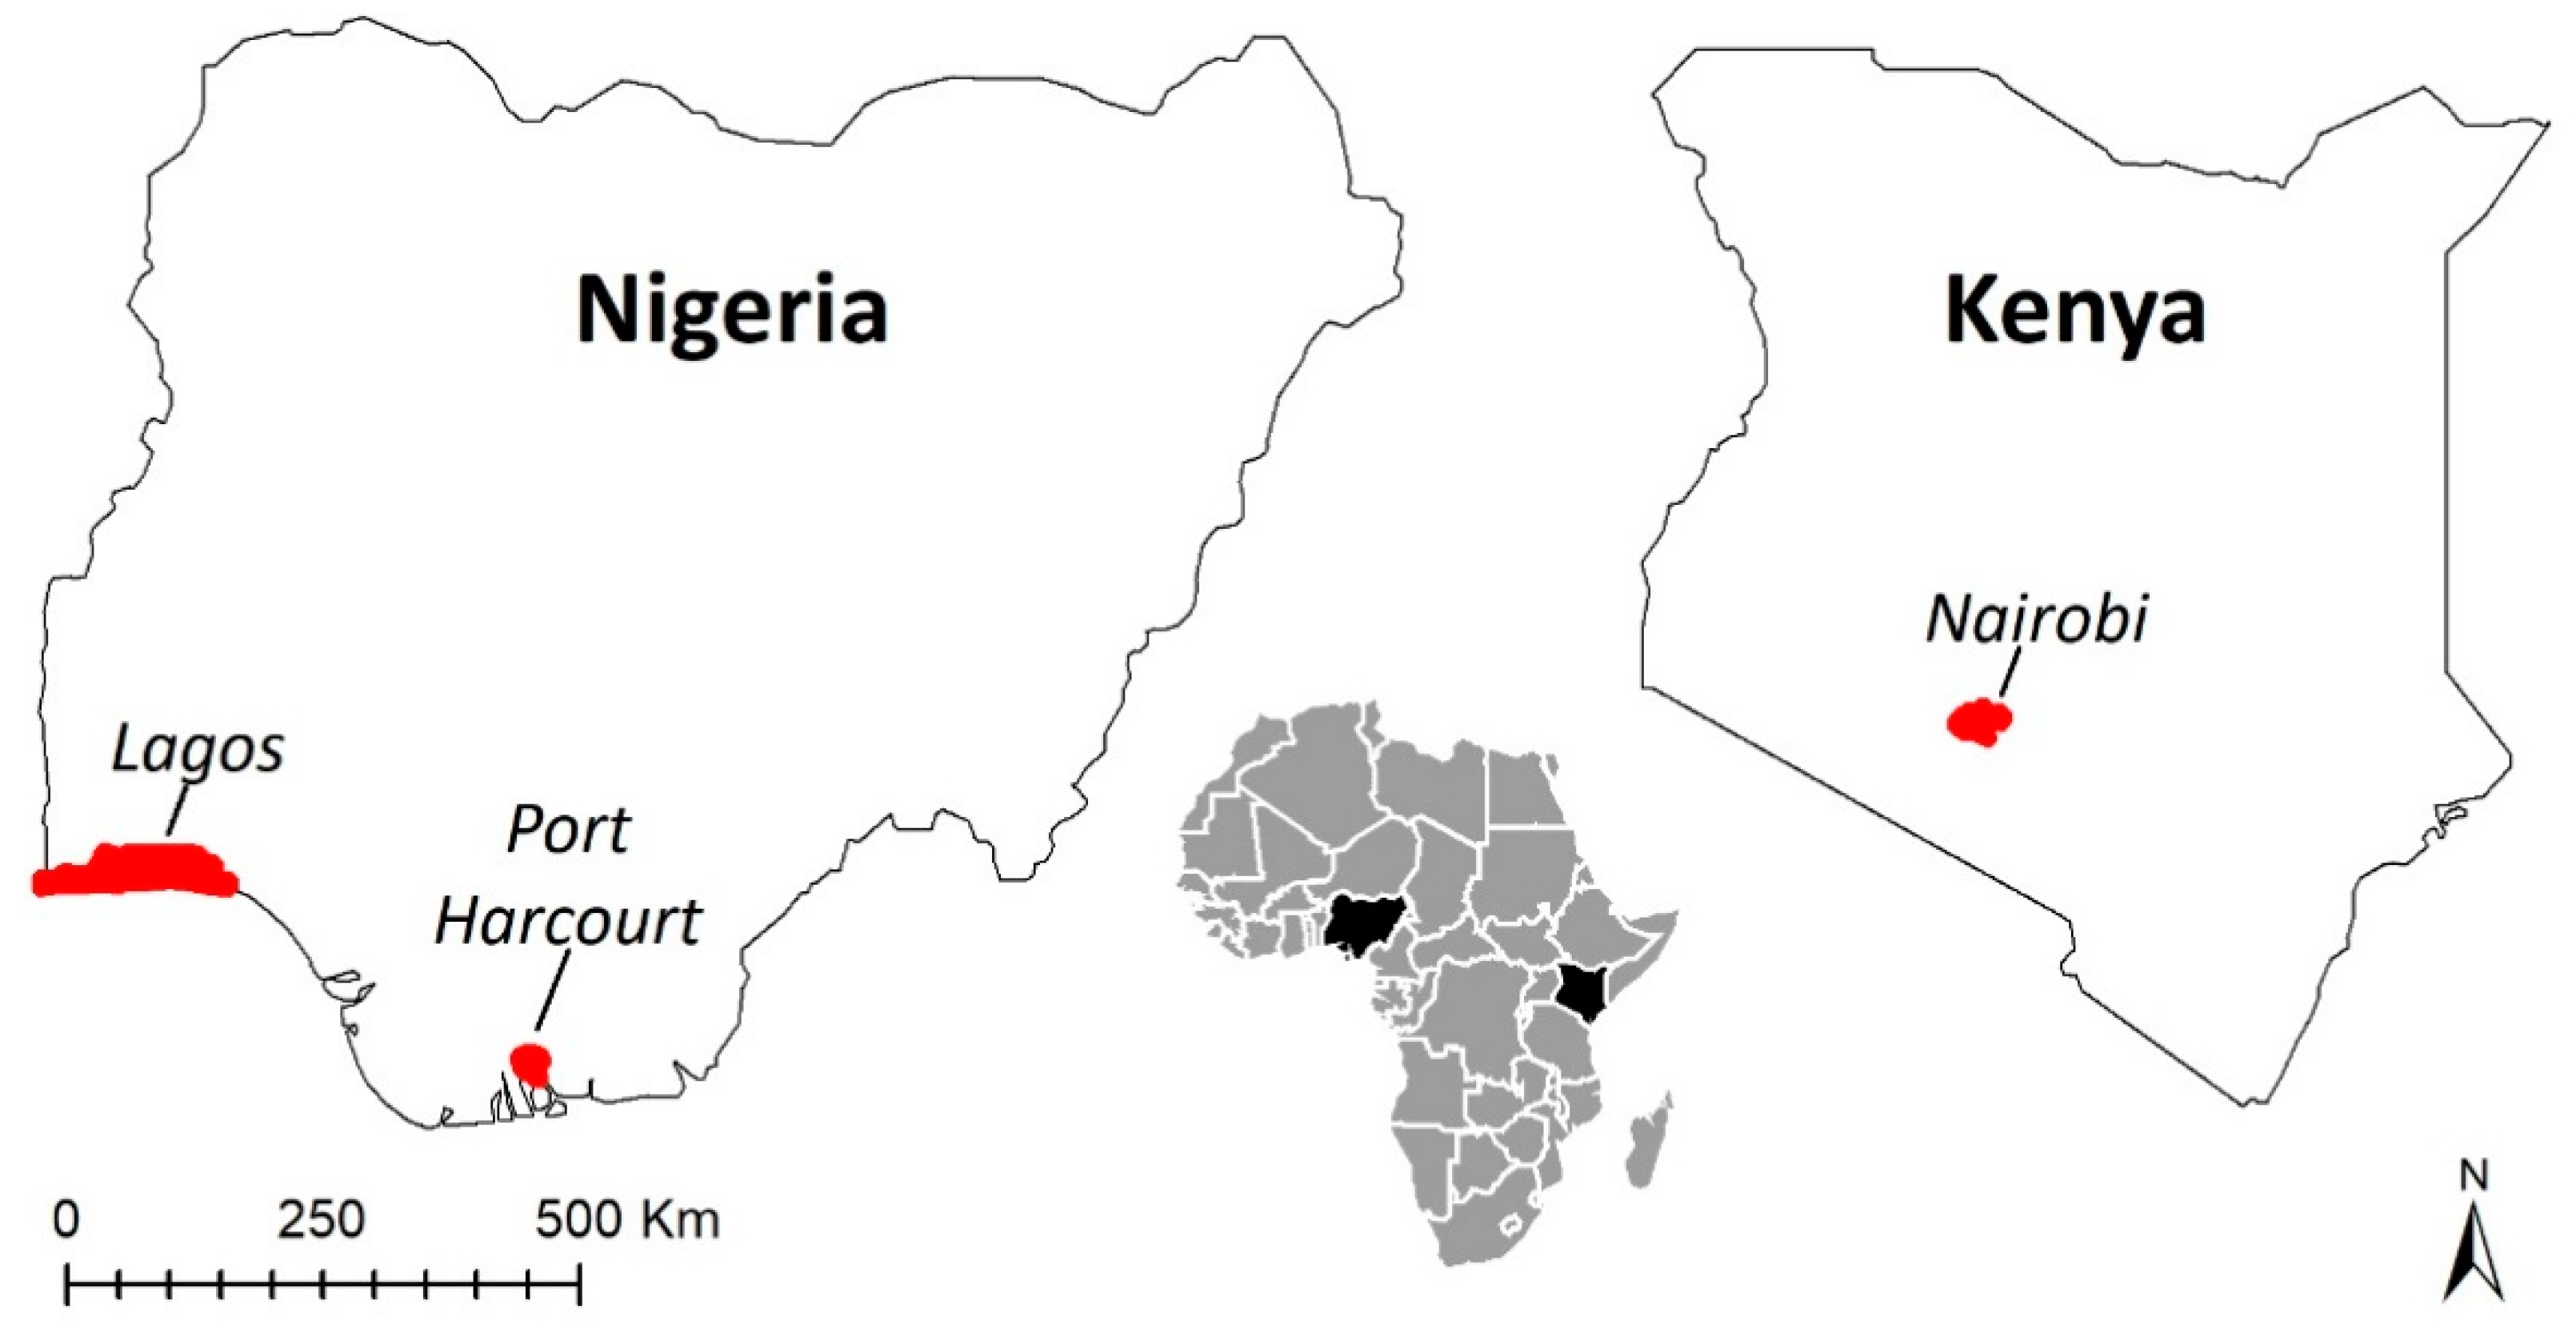
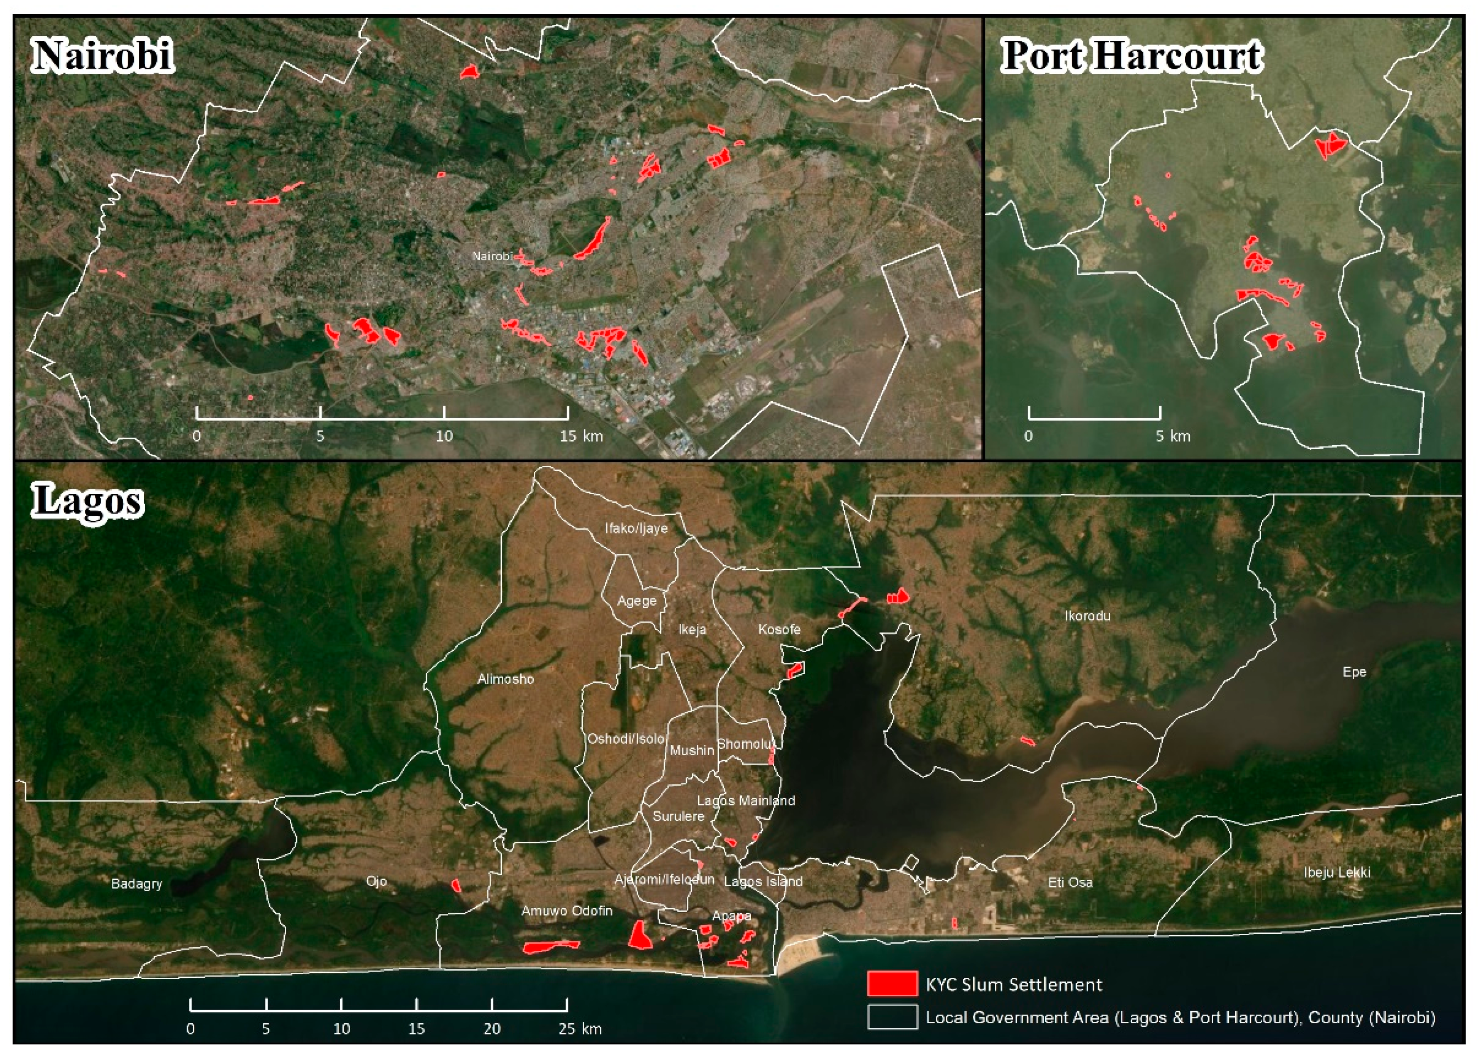
2.1. Setting

For this study, we selected three diverse cities with which we were already familiar and which have unique slum area characteristics: Lagos (Nigeria), Port Harcourt (Nigeria), and Nairobi (Kenya) (Figure 1). Lagos is the most populous city in Africa with 14.3 million residents projected in 2020 and an annual population growth rate of 3.3 per cent [27]. Constrained by its location on the coast, the city footprint has expanded north, west, and east, subsuming formerly rural and peri-urban villages [28]. Millions of in-migrants from rural areas as well as newly incorporated residents have been forced into slums and slum-like conditions due to a decades-long housing crisis which has left a deficit of at least five million housing units in the city [28] and forced-up housing costs [29]. Slum clearance and relocation campaigns by authorities over the last two decades have attempted to move the poorest out of sight [28]. However, routine slum clearance along with rapid population growth has had the effect of fragmenting the urban poorest into many small “pocket slums” throughout the city [30]. Millions more seek residency on water in “floating slums” proximate to the city center in the Lagos Lagoon and surrounding marshlands [31].
Port Harcourt, a secondary city braided by rivers that comprise the Niger Delta, has 3 million residents and an annual population growth rate of 5.1 per cent [27]. Like Lagos, the city has expanded rapidly in recent decades, subsumed surrounding settlements, and tens of thousands of slum residents along the waterfront are displaced each year by government demolitions [32]. The slums in Port Harcourt, however, are more consolidated than in Lagos, and these areas have active and powerful gangs that both challenge authorities—in some cases halting evictions—but also harass and threaten residents [32].
Nairobi, located in Kenya’s central plateau, is a city of 4.7 million people with an annual population growth rate of 3.9 per cent [27]. Many of the city’s more than 100 slums are notoriously dense and sprawling [33]. Large deprived areas like Kibera are often thought of as a single slum by outsiders, but are considered to be multiple distinct, and contiguous, settlements by residents [34]. With so many well-established and large slums, Nairobi has produced many strong and effective community-led initiatives that have succeeded at planning and implementing their own community upgrading initiatives, and worked effectively with local government on joint upgrading projects [35]. However, the relationships between slum communities and the local government remains fickle; in a push for citywide development and without a national land registry, the government commonly forcibly evicts residents to make way for roads and industry [36]. In May 2020, city officials made international headlines when they forcibly evicted between 5000 and 8000 residents with no support during Nairobi’s initial COVID-19 curfews and travel restrictions [37,38].

2.2. Data

Three types of data were used: boundaries and population counts of field-referenced slums in three cities (Section 2.2.1), boundaries of all slum-like settlements in Lagos (Section 2.2.2), and multiple gridded population datasets (Section 2.2.3).

2.2.1. Know Your City Deprived Area Boundaries and Population Counts

Boundaries and field-referenced population estimates in deprived areas were adapted from the Know Your City (KYC) Campaign website [39]. The website was launched in 2016 by Slum Dwellers International (SDI), a federation of hundreds of slum community advocacy groups across Africa and Asia, with support from the United Cities and Local Governments of Africa, Cities Alliance, and other partners [40]. At the time of this writing, more than 7700 settlements in over 220 cities had been profiled. Each profile is created by community members themselves and includes a visual of the settlement boundary; a brief history; estimated population and structure counts; legal status of the settlement; a ranking of community-defined priorities; and summary statistics about sanitation, water, infrastructure, community leadership, healthcare, and commercial assets.
Community profiling serves multiple purposes, foremost, as a vehicle for marginalized people in deprived settlements to self-organize and crystallize a community identity, self-worth, needs, priorities, and aspirations. The profiling activity, secondarily, results in quantitative and spatial data that can be used by community members to plan and upgrade their settlement, as well as to lobby civil society and local government for support toward their goals. The compilation of settlement profiles on the KYC Campaign website builds strength and awareness across communities within the SDI federation, while presenting a unified case for respect and investment from city, national, and global power-holders [40].
Although the KYC Campaign website provides a trove of field-referenced data about the world’s most deprived communities, the data pose some challenges for research: (1) community profiles are presented separately, and cannot be accessed as a single database; (2) many profiles are incomplete; (3) community-generated geographic boundaries and population estimates have not been verified for accuracy; and (4) spatial boundaries are only visualized over a roads base layer, and are not directly downloadable. Settlement boundaries are mapped by collecting GPS coordinates around the settlement perimeter. Population estimates are generally derived by physically marking and counting all front doors in the settlement, sampling every nth household to estimate average household size, and then multiplying number of front doors by the average household size in the settlement; this estimated number is then discussed and agreed by consensus in an open community forum (personal communication, Andrew Maki, 9 November 2020).
To prepare data for this analysis, each settlement boundary was retraced in ArcGIS 10.5 by taking screenshots from the KYC Campaign website, aligning it was OpenStreetMap roads, and manually adjusting boundaries over satellite imagery, sometimes introducing assumptions based on landscape patterns about community data collectors’ intended boundaries (Appendix A Figure A1). The settlement name, date of profile creation, and reported population estimate, structure count, and area in acres were copied from KYC Campaign profiles into an excel table, and joined to settlement boundaries in ArcGIS based on a unique settlement ID created for this study. This resulted in 134 digitized slum settlements (32 Lagos, 39 Port Harcourt, 63 Nairobi) with field population estimates collected between 2013 and 2020 (Figure 2).

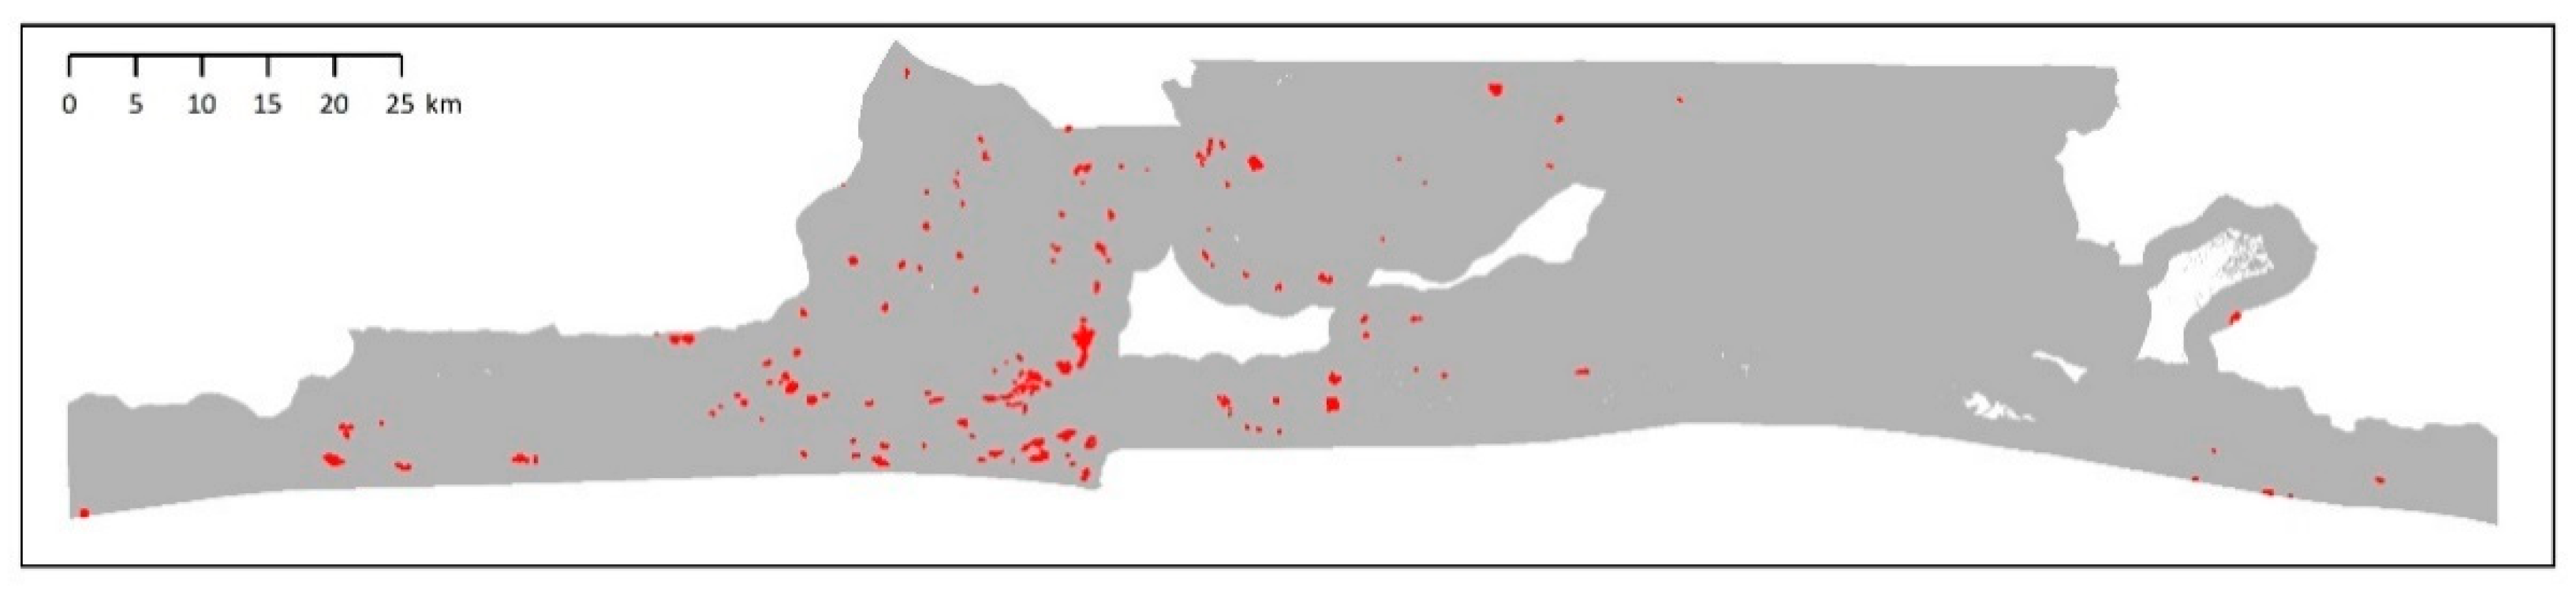
2.2.2. Lagos Slum Map

A modelled layer of slum settlement locations across Lagos State was obtained from Badmos and colleagues (2019) as a proxy for actual slum boundaries [41]. This modelled output was derived using object-based image analysis (OBIA) with logistic regression, and datasets derived from RapidEye and Sentinel-2 satellite imagery, a digital elevation and slope model, and Lagos State Government spatial data of water bodies, roads, and land use types [41,42]. The model was trained and validated on a dataset of 242 community locations ranked by neighborhood income level as defined by local experts, with 83 percent accuracy in slums and 79 per cent overall accuracy [41]. The output roughly represents the year 2015 and classifies approximately 10 × 10 m cells as either slum or non-slum (Figure 3). In ArcGIS 10.5, we aggregated this output to approximately 50 × 50 m cells, and then reclassified non-slum cells surrounded on four sides by slum cells as “slum” so as to create contiguous slum areas. Only 24 of the 32 (75 per cent) KYC Campaign slum boundaries in Lagos intersected the contiguous slum areas defined from the Badmos data, suggesting that this map is a conservative representation of Lagos’ slums.

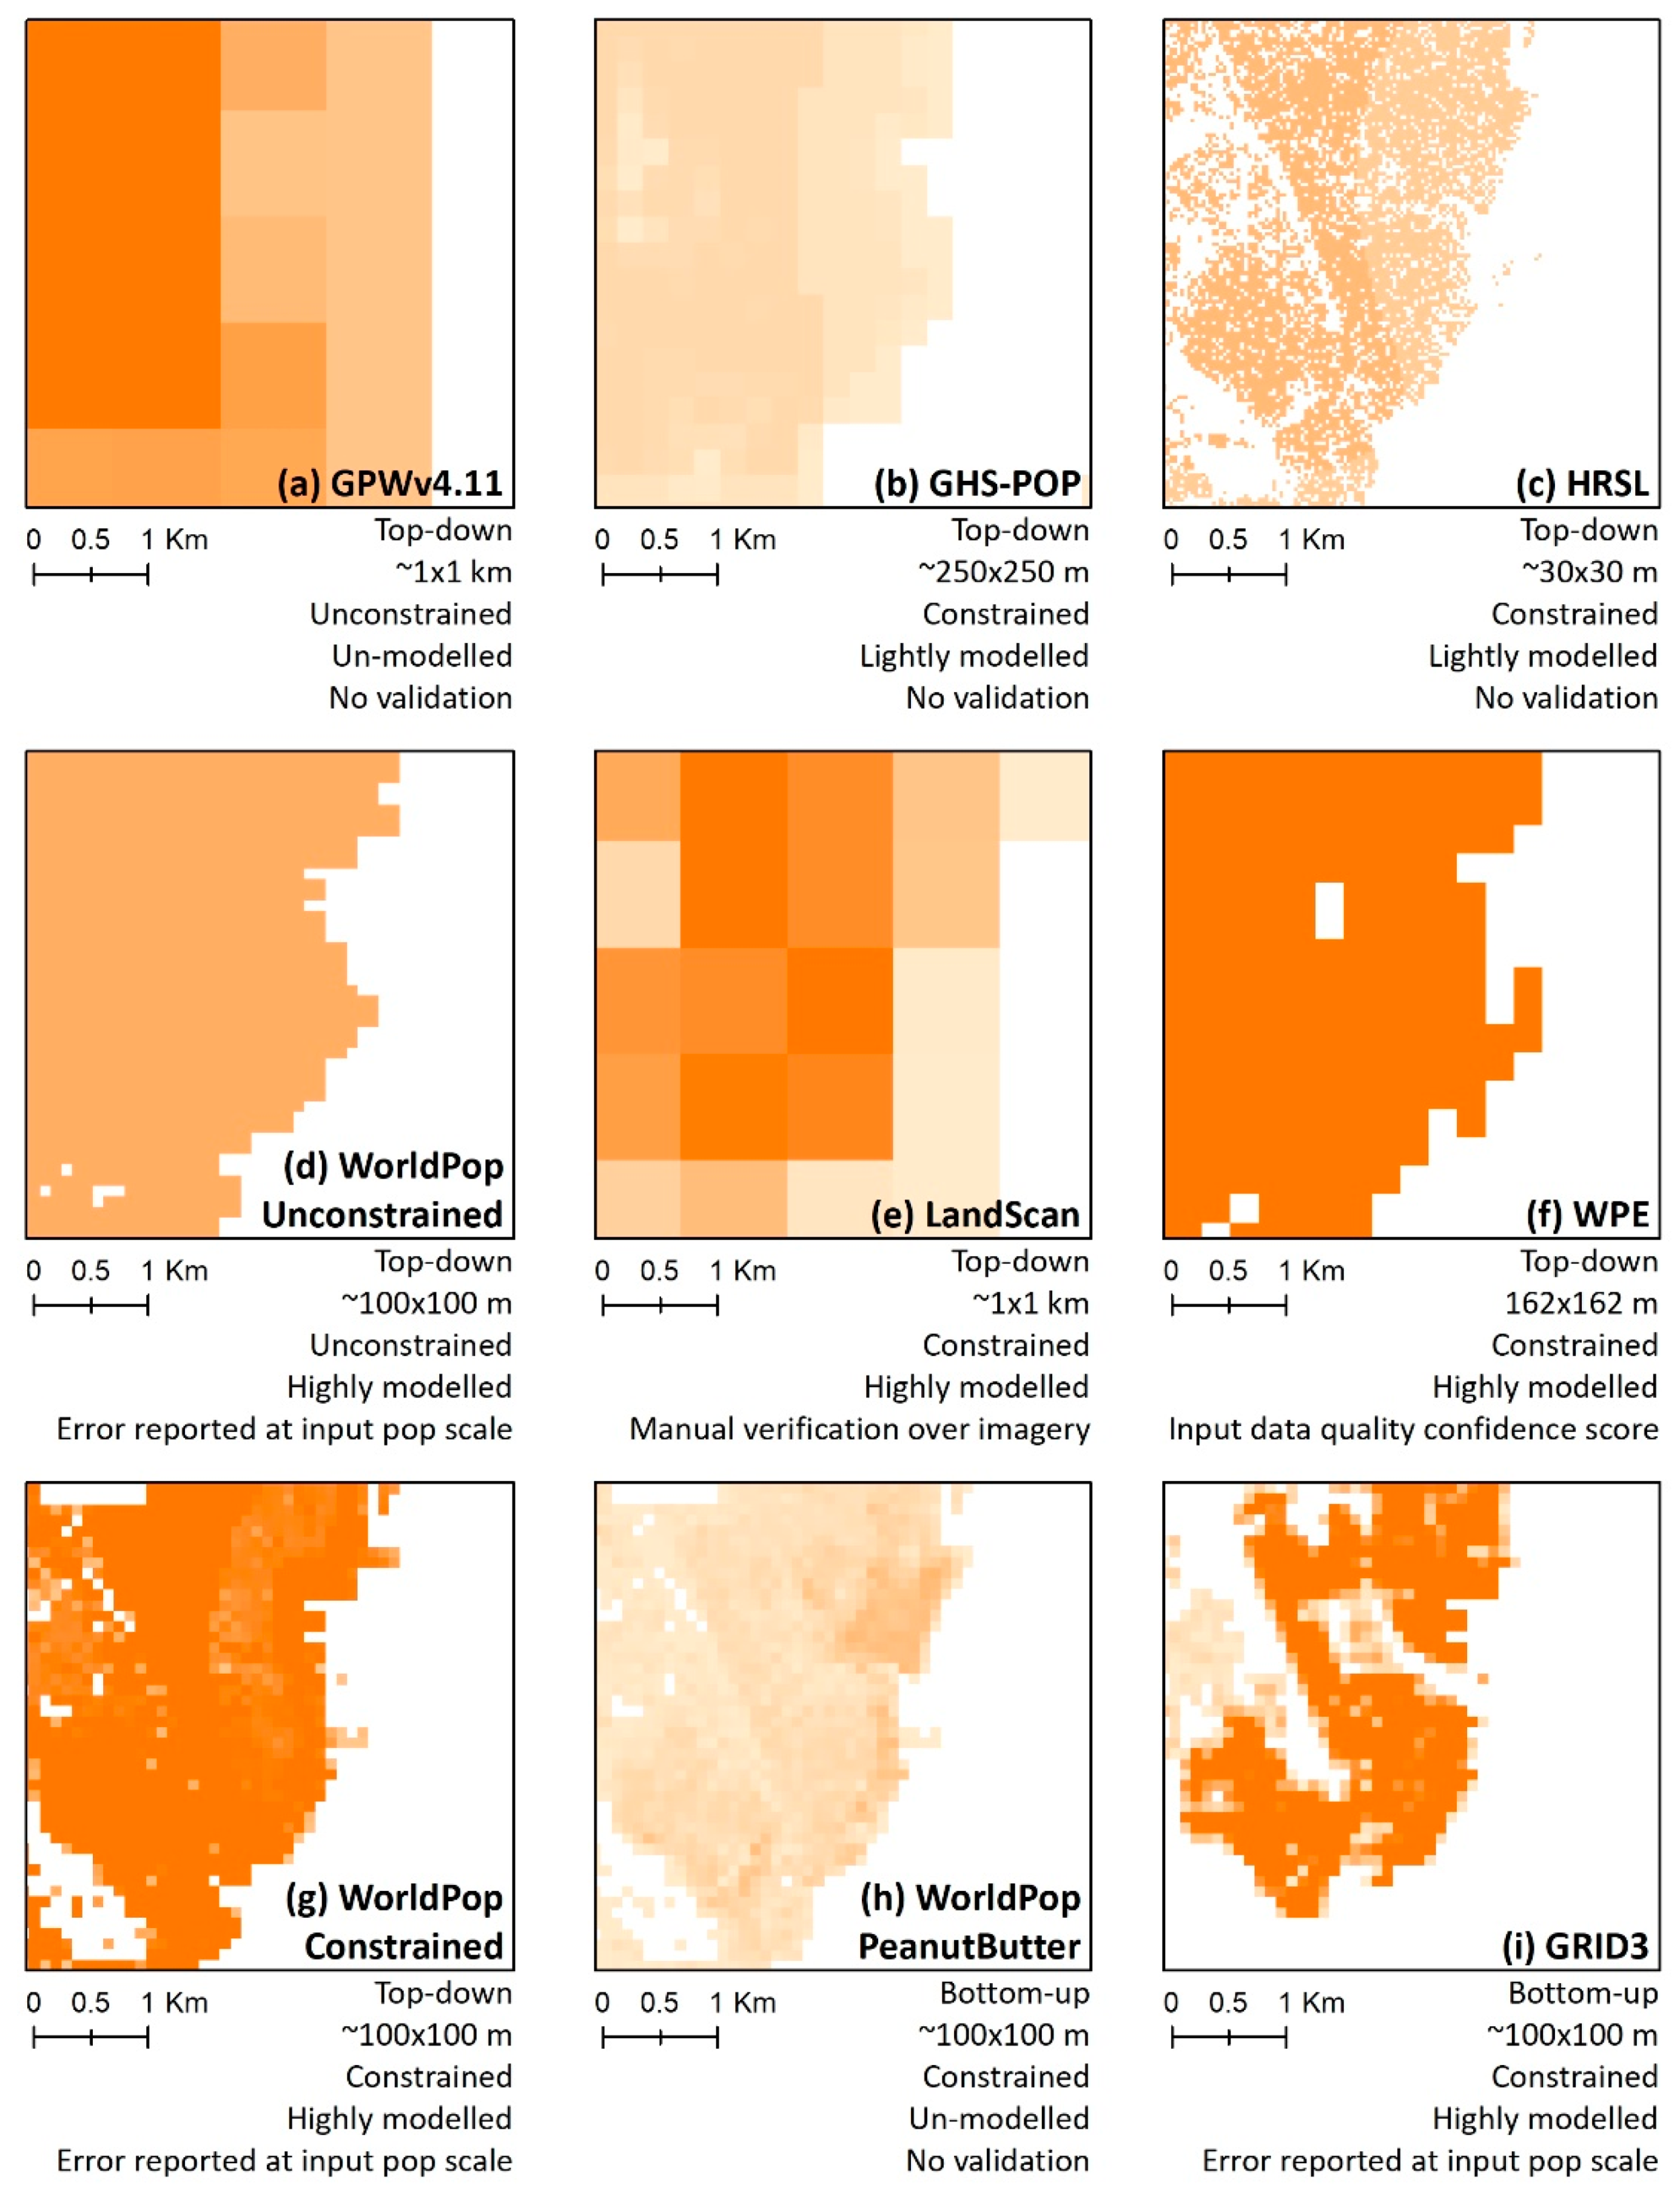
2.2.3. Gridded Population Estimates

Nine gridded population datasets in Nigeria and eight datasets in Kenya derived with diverse methods were available for analysis, including seven “top-down” and two “bottom-up” datasets (Table 1). Top-town gridded population models are based on population counts in census enumeration area (EA) or other geographic units that cover the entire population. Generally, top-down datasets are dasymetric, meaning that population disaggregation is informed by covariate datasets, and that estimates in grid cells sum to the population counts of input geographic units [43]. Bottom-up models use micro-census counts of the population in a selection of small areas, or assumptions about household size, to estimate population in each grid cell directly [24]. Gridded population datasets can be further classified by the complexity of their modelling approach (e.g., direct disaggregation versus statistical weighting), by whether the outputs are constrained to settled areas, and by the size of the grid cell in which population is estimated [25]. Figure 4 visually compares all nine datasets in a small area of Lagos along the lagoon where many informal settlements exist. Most of these datasets aim to represent the residential (night-time) population with the exception of LandScan, and most are openly available.
The main un-modelled top-down gridded population dataset is Gridded Population of the World (GPW) by Columbia University’s Center for International Earth Science Information Network (CIESIN). The current version of this dataset, GPW4v.11, uses the most spatially-detailed, recent census data available, and produces estimates of the population in approximately 1 × 1 km grid cells for 5-year increments including 2015 and 2020 by directly disaggregating the population based on areal weights [44,45]. The age and scale of the input census data varies substantially by country; Nigeria’s gridded estimates are derived from 2006 2nd-level administrative units (Local Government Areas—LGAs) while Kenya’s gridded estimates are derived from 2009 5th-level administrative units (sublocations) [44]. Only water bodies and protected areas (e.g., game parks) are excluded before population disaggregation, and no validation exercise is undertaken. Two versions are available which do, and do not, adjust for UN population projections; we use the UN-adjusted version in this analysis. While GPWv4.11 is not expected to be highly accurate at the grid-cell level because populations are not evenly distributed in space, this dataset is useful for multi-country and global analyses, and the harmonized census boundaries and population counts behind this dataset serve as the population input to all other top-down gridded population datasets except LandScan and WPE (discussed below).
Similarly, lightly modelled datasets disaggregate population counts equally among cells; however, disaggregation is constrained to populated places first, as defined by settlement extents or building footprints [46,47,48,49]. The Global Human Settlement Population Layer (GHS-POP) by the European Commission Joint Research Centre (EC-JRC) defines settlements coarsely from publicly available 30 × 30 m Landsat imagery, and produces population estimates in approximately 250 × 250 m grid cells for 1975, 1990, 2000, and 2015 [46,47]. The High Resolution Settlement Layer (HRSL) by the Facebook Connectively Lab and CIESIN constrains population estimates to approximately 30 × 30 m grid cells that contained any building extracted from 0.5 × 0.5 m Digital Global imagery for the year 2018 [48,49] (Table 1). Neither of these data producers validate the accuracy of disaggregated estimates, and both are currently working on updates based on more refined settlement layers.
Highly modelled datasets are based on a statistical or geographic algorithm which varies population disaggregation based on the presence of human activity as measured with multiple spatial covariates. Top-down highly modelled gridded population datasets include LandScan Global estimates from the US Government Oak Ridge National Laboratory, World Population Estimates from ESRI, the producer of the ArcGIS software, and WorldPop estimates from the WorldPop team at University of Southampton (Table 1).
LandScan Global is an approximately 1 × 1 km gridded population dataset representing ambient population, the 24-h average of day-time commuter and night-time residential populations, and it is updated annually. The probability weights matrix created for population disaggregation is generated with co-kriging, a multivariable geographic model, using US Census global population estimates and four covariates: roads, slope, land cover, and night-time lights [50]. To account for economic, physical, and cultural differences that affect the relationship between covariates and population density locally, LandScan Global analysts assign weights by location to manually adjust population disaggregation. Depending on the available of resources, more or less manual spot checks for a particular country or region are made over high resolution satellite imagery to inform manual adjustments [51]. Non-settled areas as defined by a land cover layer are set to zero, resulting in constrained estimates. LandScan Global is a commercial dataset that is made free to US Government agencies, humanitarian, and educational organizations [51].
World Population Estimates (WPE) is another commercial dataset available to registered ArcGIS users, with gridded population estimates in 162 × 162 m grid cells for 2016. Before disaggregating population estimates to grid cells, settled areas are identified from a land cover model called BaseVue 2013 which is based on 30 × 30 m Landsat data. Cells classified as settled are then apportioned census population counts collated by ESRI using a geographic algorithm based on BaseVue 2013 land cover type, road intersection locations, and settlement point locations [52]. Population estimates are not assessed directly for accuracy, but the dataset is provided with a confidence score layer based on the quality of data inputs available for a given grid cell.
WorldPop is an approximately 100 × 100 m dataset of gridded population estimates derived with country-specific models using a Random Forest machine-learning approach, coupled with GPWv4.11 census-derived inputs, and more than a dozen country-specific spatial covariates including land cover, roads, intersections, slope, night-time lights, temperature, and precipitation [53]. All WorldPop datasets—including its predecessors AfriPop, AsiaPop, and AmeriPop—were unconstrained [54], meaning that population estimates were made in all land areas with tiny fractions of a person predicted to live in deserts, forests, and other unsettled grid cells. In 2019, WorldPop created global datasets of unconstrained estimates for each year between 2000 and 2020 which provided a data product with consistent covariates for all countries [55]. In 2020, WorldPop also released a single-year version of the global dataset in which population counts were constrained to settled areas. In most African countries, settlement boundaries were defined with the highly detailed Ecopia building footprints dataset [56], while the Built-Settlement Growth Model was used to constrain estimates in other countries [57]. Both of WorldPop’s constrained and unconstrained datasets are released with and without UN population adjustments, and assess for accuracy at the scale of the input population data [53]. Only WorldPop’s UN-adjusted population estimates were considered for this analysis for both constrained and unconstrained datasets.
Recently, the WorldPop team released an R algorithm and beta web-tool which can be considered an un-modelled bottom-up estimate of population. The peanutButter tool applies three parameters—average household size, average number of households per building, and percent of buildings that are residential—to the Ecopia building footprint layer to estimate total population counts in approximately 100 × 100 m grid cells [58]. Ecopia building footprints were extracted from 2015 through 2019 imagery, with most footprints representing 2018 buildings [58]. The tool provides default average parameter values based on household survey data, which the user can modify, and thus the model outputs are not verifiable. The WorldPop-Peanut Butter datasets downloaded for this analysis used default values in Nigeria (4.9 people per urban household, 1.1 households per building, and 71 per cent of buildings are residential) and Kenya (3.6 people per urban household, 1.1 households per building, and 63 per cent of buildings are residential) [58].
The Geo-Referenced Infrastructure and Demographic Data for Development (GRID3) project produces census-independent bottom-up population estimates in select countries while addressing barriers to government acceptance and use of gridded population data. The project is managed by CIESIN in close collaboration with WorldPop, Flowminder Foundation, and UN Population Fund (UNFPA) with support from the Bill & Melinda Gates Foundation (BMGF) and UK Department for International Development (DFID), and has released approximately 100 × 100 m gridded population estimates in five countries including Nigeria, but not Kenya [59]. GRID3 models are based on a sample of micro-census population counts in small areas (e.g., 3 hectares), as well as two covariates related to the settlement type and existing top-down population estimates. In Nigeria, most microcensus counts were collected in 2016, and WorldPop-unconstrained 100 × 100 m estimates were used as the top-down population covariate. A hierarchical Bayesian model is then used to quantify a relationship between microcensus population densities and covariates, which the model uses to predict population density in each cell outside of the microcensus units [60]. Cells classified as unsettled in the settlement layer are set to zero, resulting in a constrained estimate of the population. Like the WorldPop-Constrained and Unconstrained models, the GRID3 model reserves a portion of the input population data to estimate model errors at the scale of the input population [60].
The differing approaches to modelling results in varied outputs across the nine gridded population datasets, especially at a local level (Figure 4). Other gridded population datasets not evaluated here because they were unavailable to the study team or outdated, including the forthcoming “bottom-up” LandScan-HD dataset by Oak Ridge National Laboratory [61], History Database of the Global Environment (HYDE) population, and Global Rural Urban Mapping Project (GRUMP) [62].
Table 1. Summary of gridded population datasets evaluated including their producer, year of estimate, native resolution, type of population covered by the estimate, and modelling method.
DatasetProducerYearResolutionCoverageMethodCitation
Top-down: Un-modelled: Unconstrained
GPWv4.11CIESIN, Columbia University2015, 202030 arc sec (~1 km2)ResidentialEqual allocation of population to cells within census unit (areal weighting on edge cells)[44,45]
Top-down: Lightly modelled: Constrained
GHS-POPEuropean Commission, Joint Research Centre (JRC)20159 arc sec (~250 m2)ResidentialBinary dasymetric, proportional allocation to built-up areas extracted from 30 m Landsat imagery[46,47]
HRSLFacebook Connectivity Lab and CIESIN20181 arc sec (~30 m2)ResidentialBinary dasymetric, proportional to houses/settlements extracted from 0.5 m Digital Globe imagery[49]
Top-down: Highly modelled: Unconstrained
WorldPop-
Unconstrained
WorldPop, Univ. of Southampton2015, 20183 arc sec (~100 m2)ResidentialRandom Forrest model with 24 covariates and dasymetric redistribution[53,63]
Top-down: Highly modelled: Constrained
LandScanOak Ridge National Laboratory2015, 201830 arc sec (~1 km2)Ambient (24-h average)Multivariable dasymetric model with 4 covariate types and bespoke weight layer[50,51]
WPEESRI2016162 mResidentialDasymetric algorithm with 16 inputs[52]
World-Pop-ConstrainedWorldPop, Univ. of Southampton20203 arc sec (~100 m2)ResidentialRandom Forrest model with 24 covariates and dasymetric redistribution constrained to cells with buildings in Africa and urban extents elsewhere[64,65]
Bottom-up: Un-modelled: Constrained
WorldPop-PeanutButterWorldPop, Univ. of Southampton~20183 arc sec (~100 m2)ResidentialBased on Ecopia building footprints, average household size, and 2 building parameters[58]
Bottom-up: Highly modelled: Constrained
GRID3
(Nigeria v1.2)
CIESIN, WorldPop, Flowminder, UNFPA, BMGF, DFID20163 arc sec (~100 m2)ResidentialHierarchical Bayesian model with 6 covariates and trained on a sample of 3-hectare microcensus population counts[60,66]

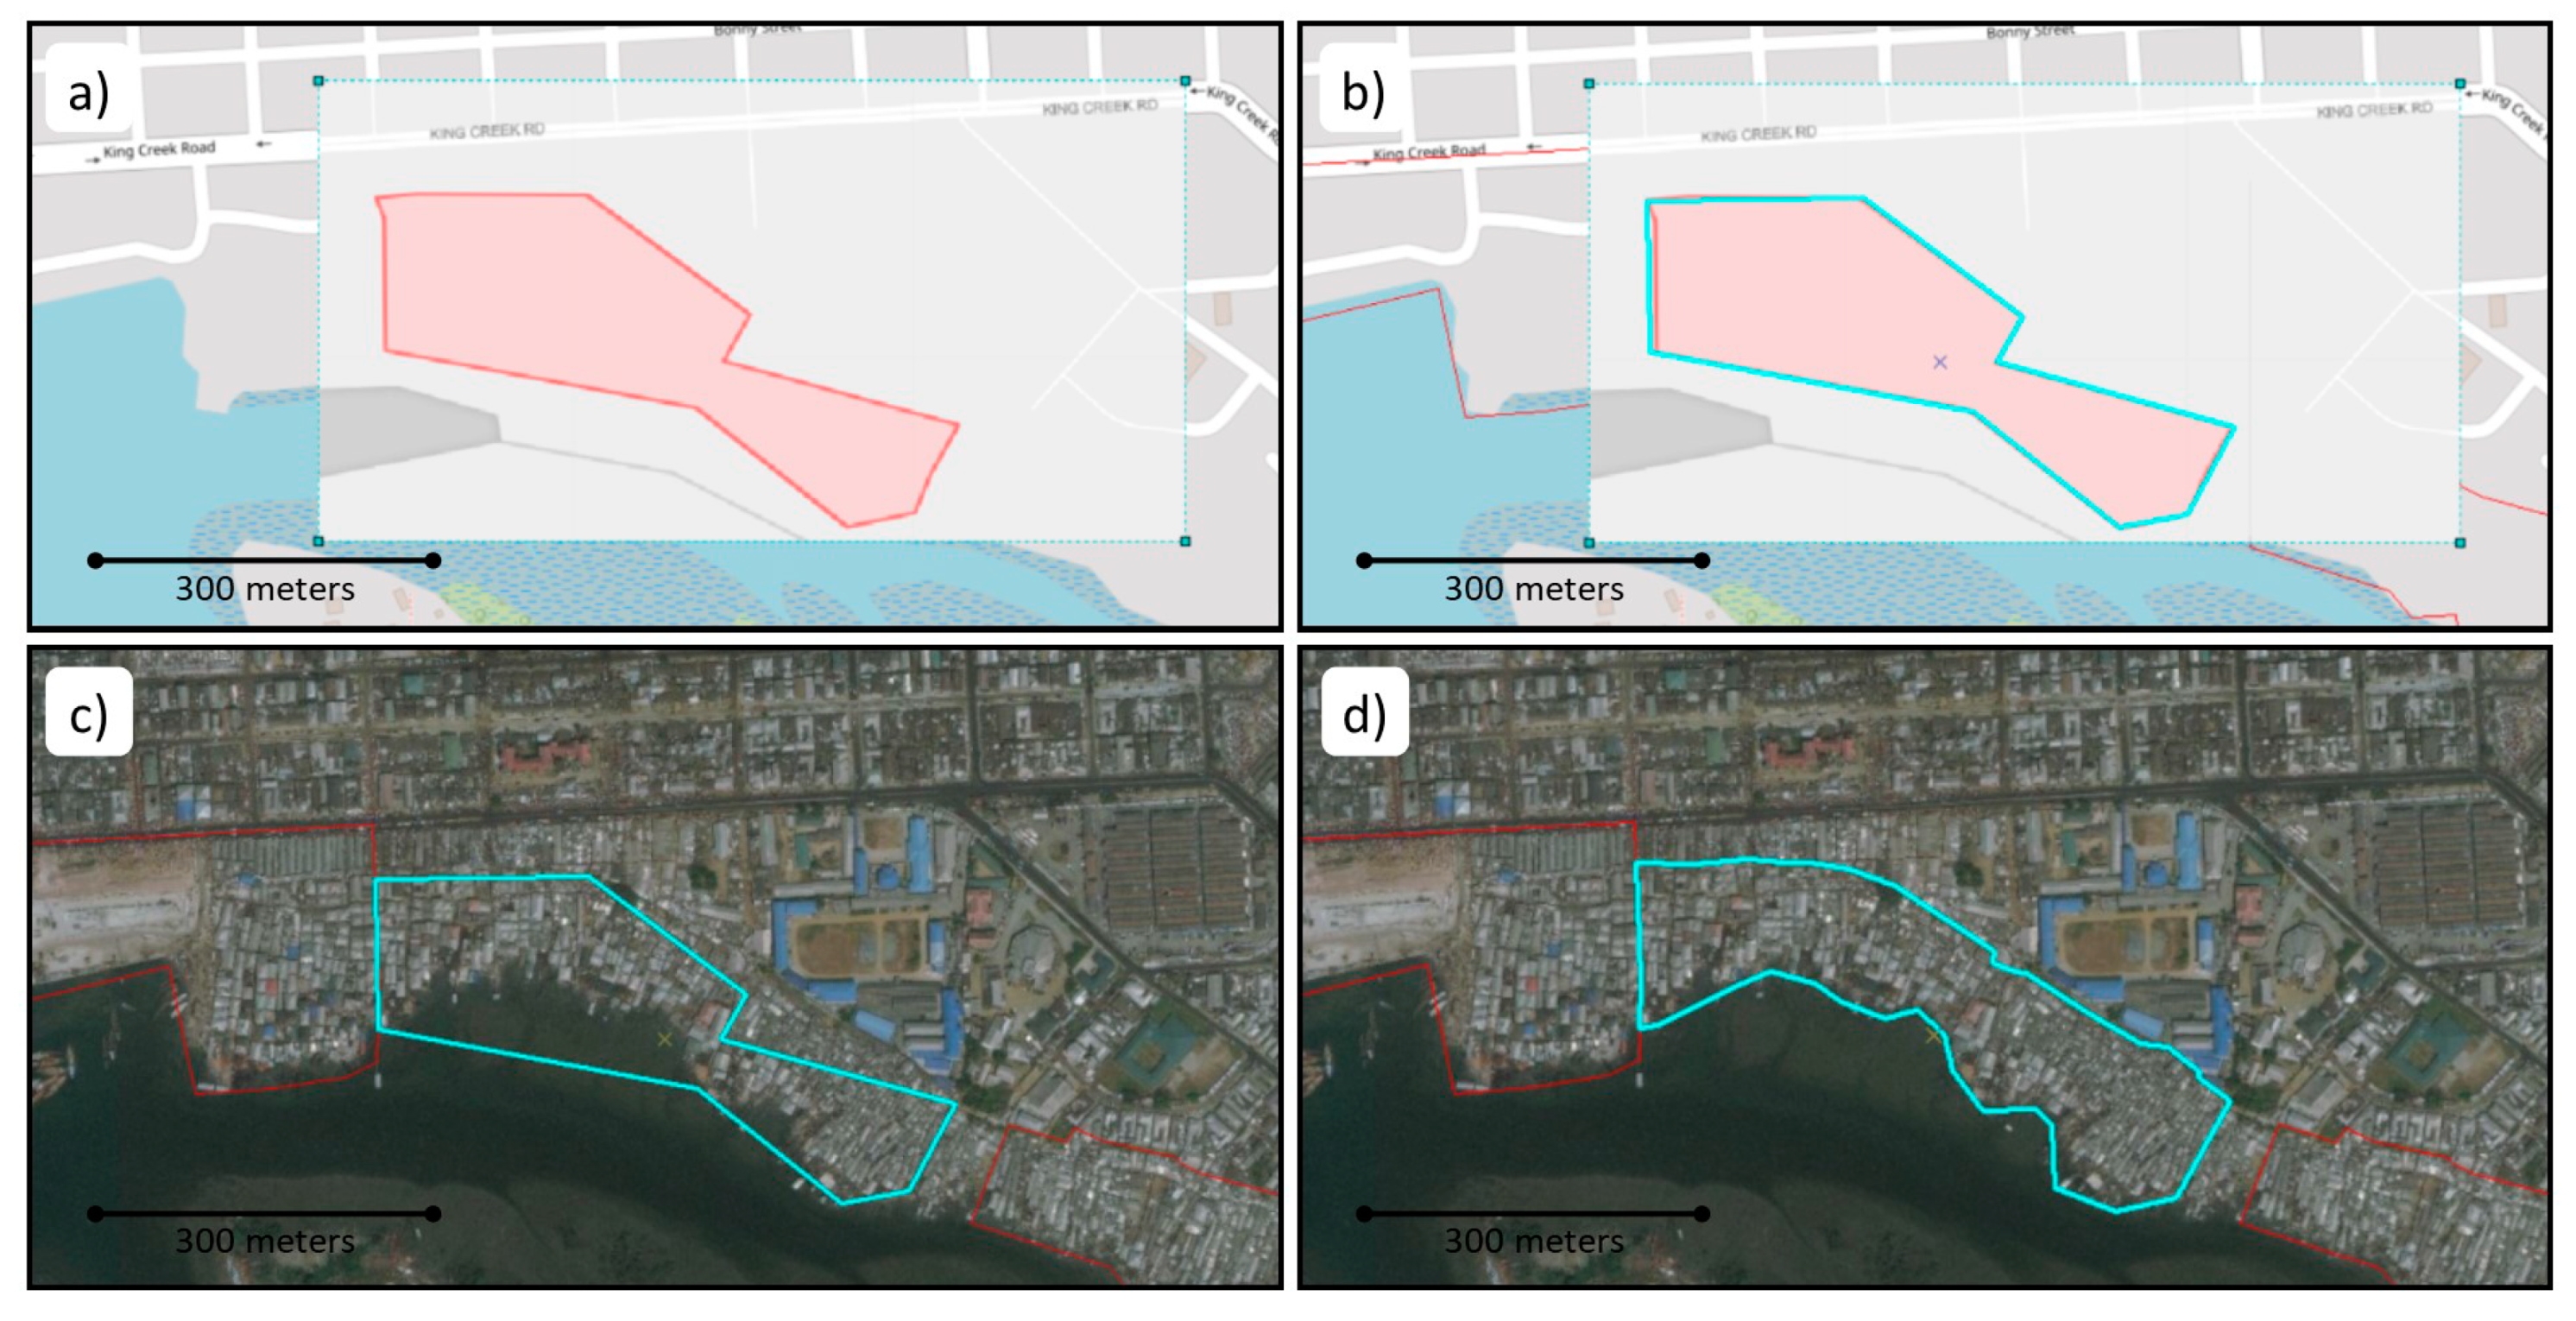
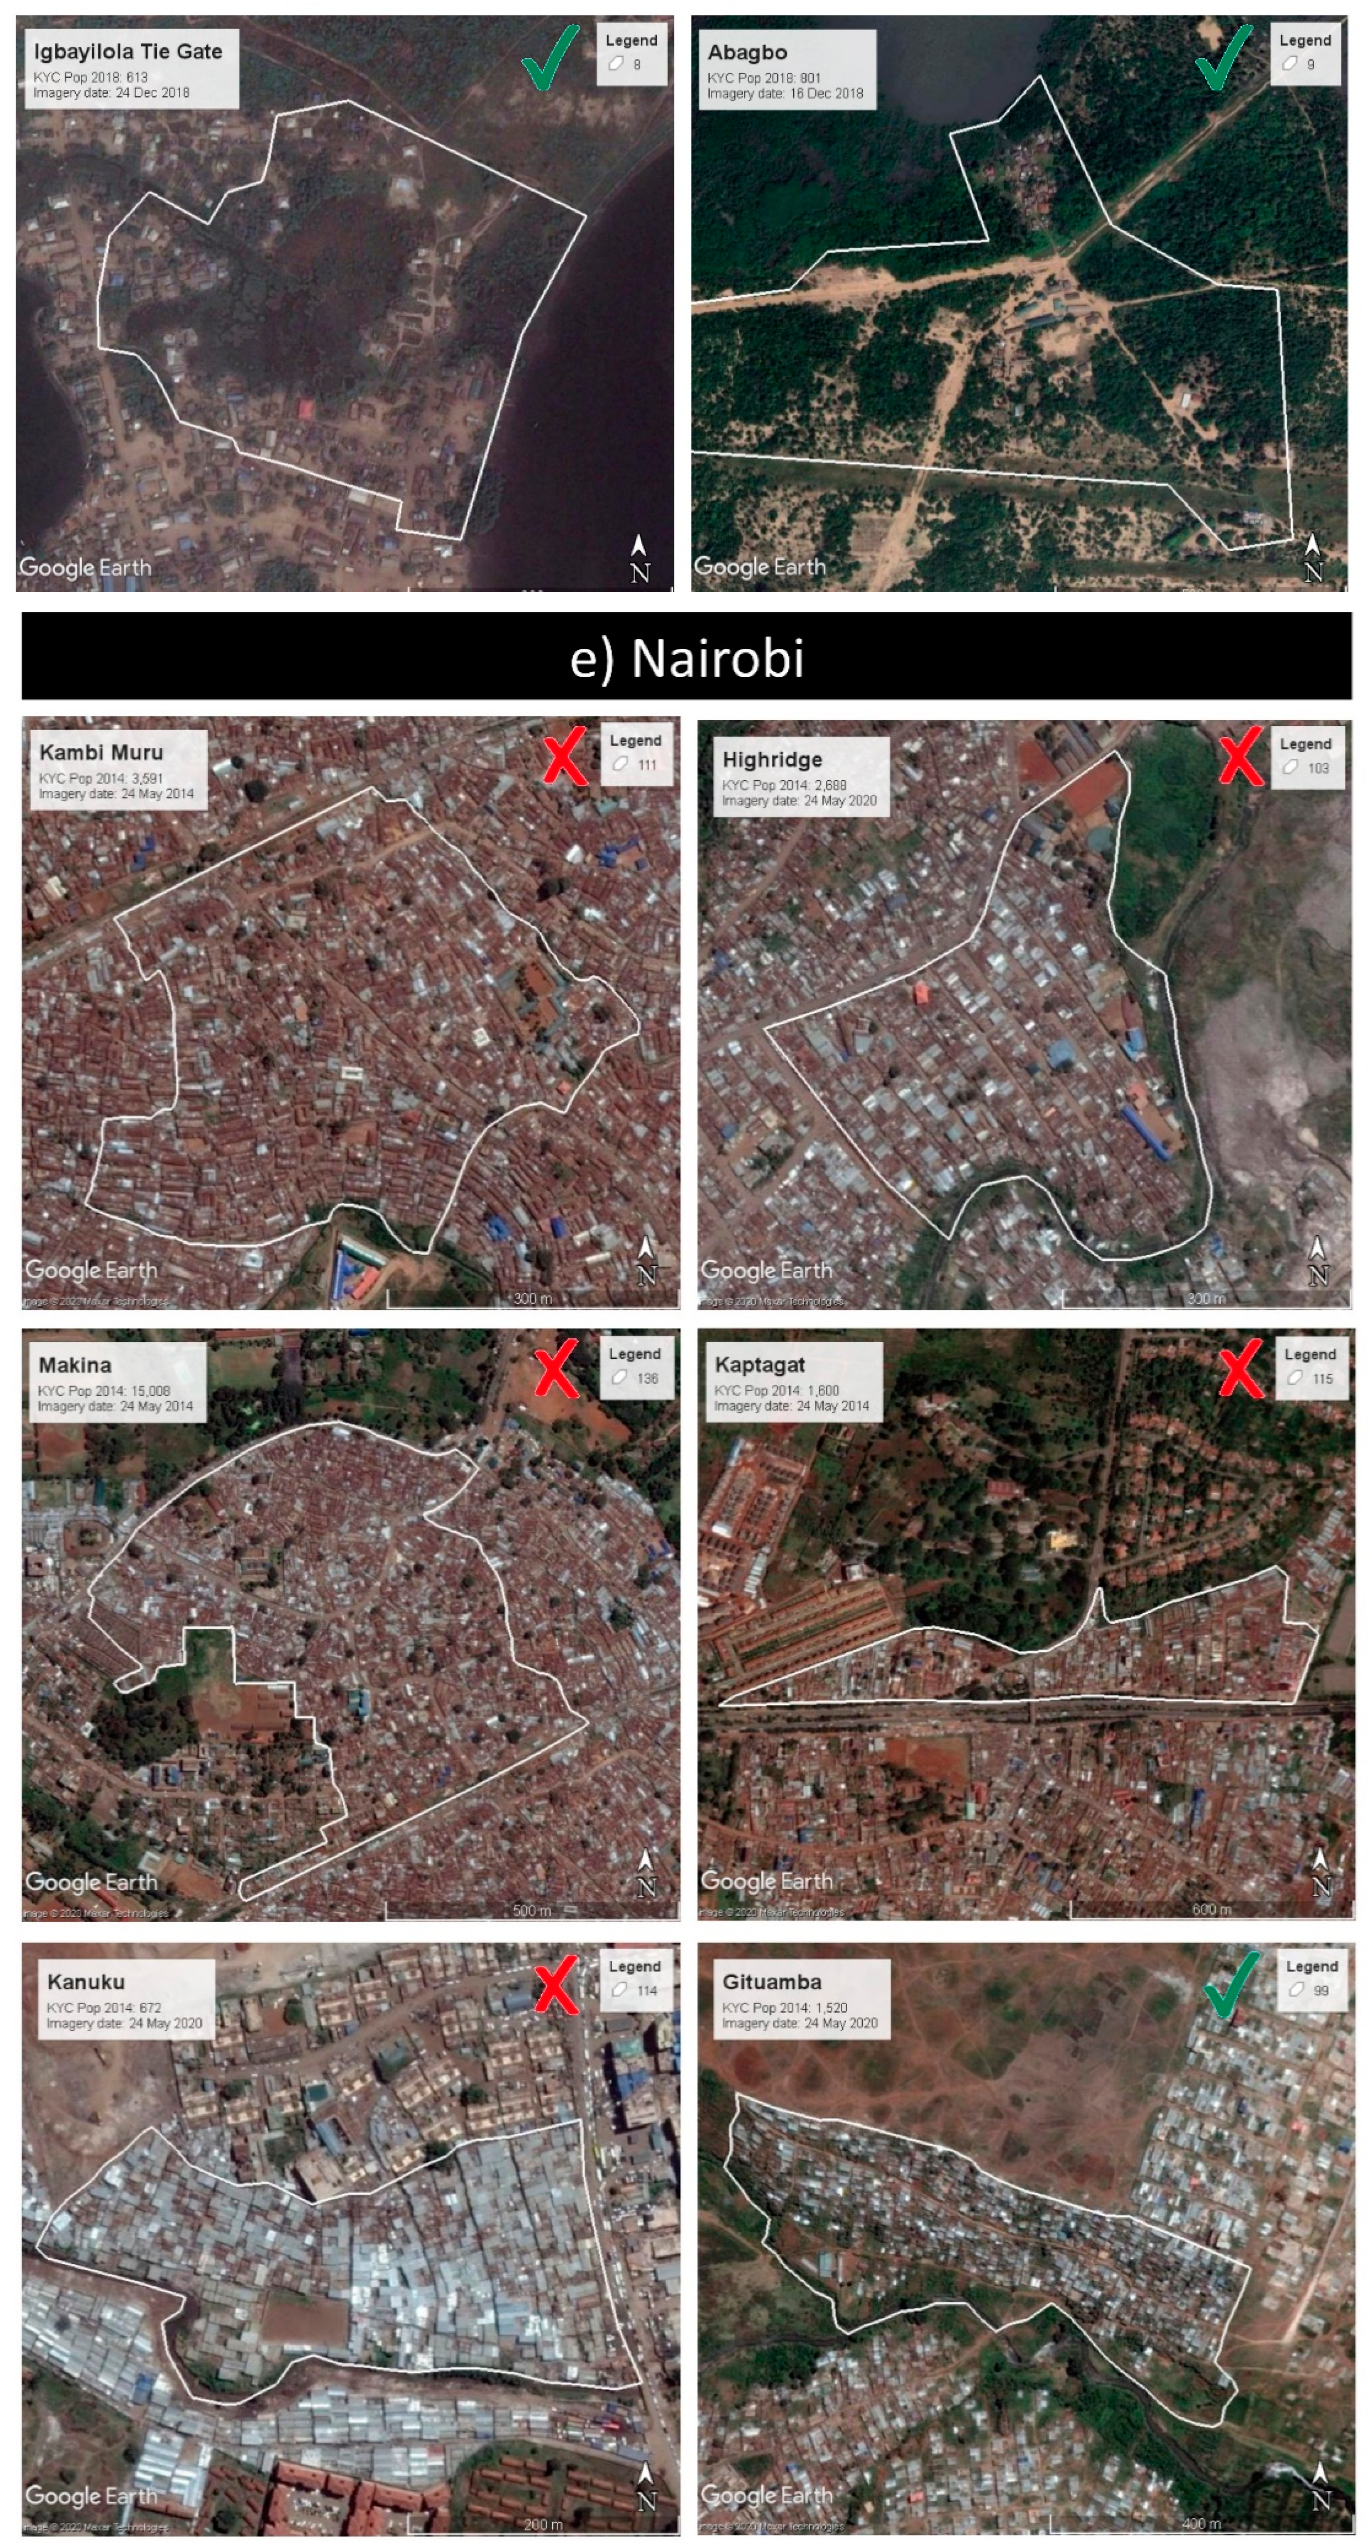
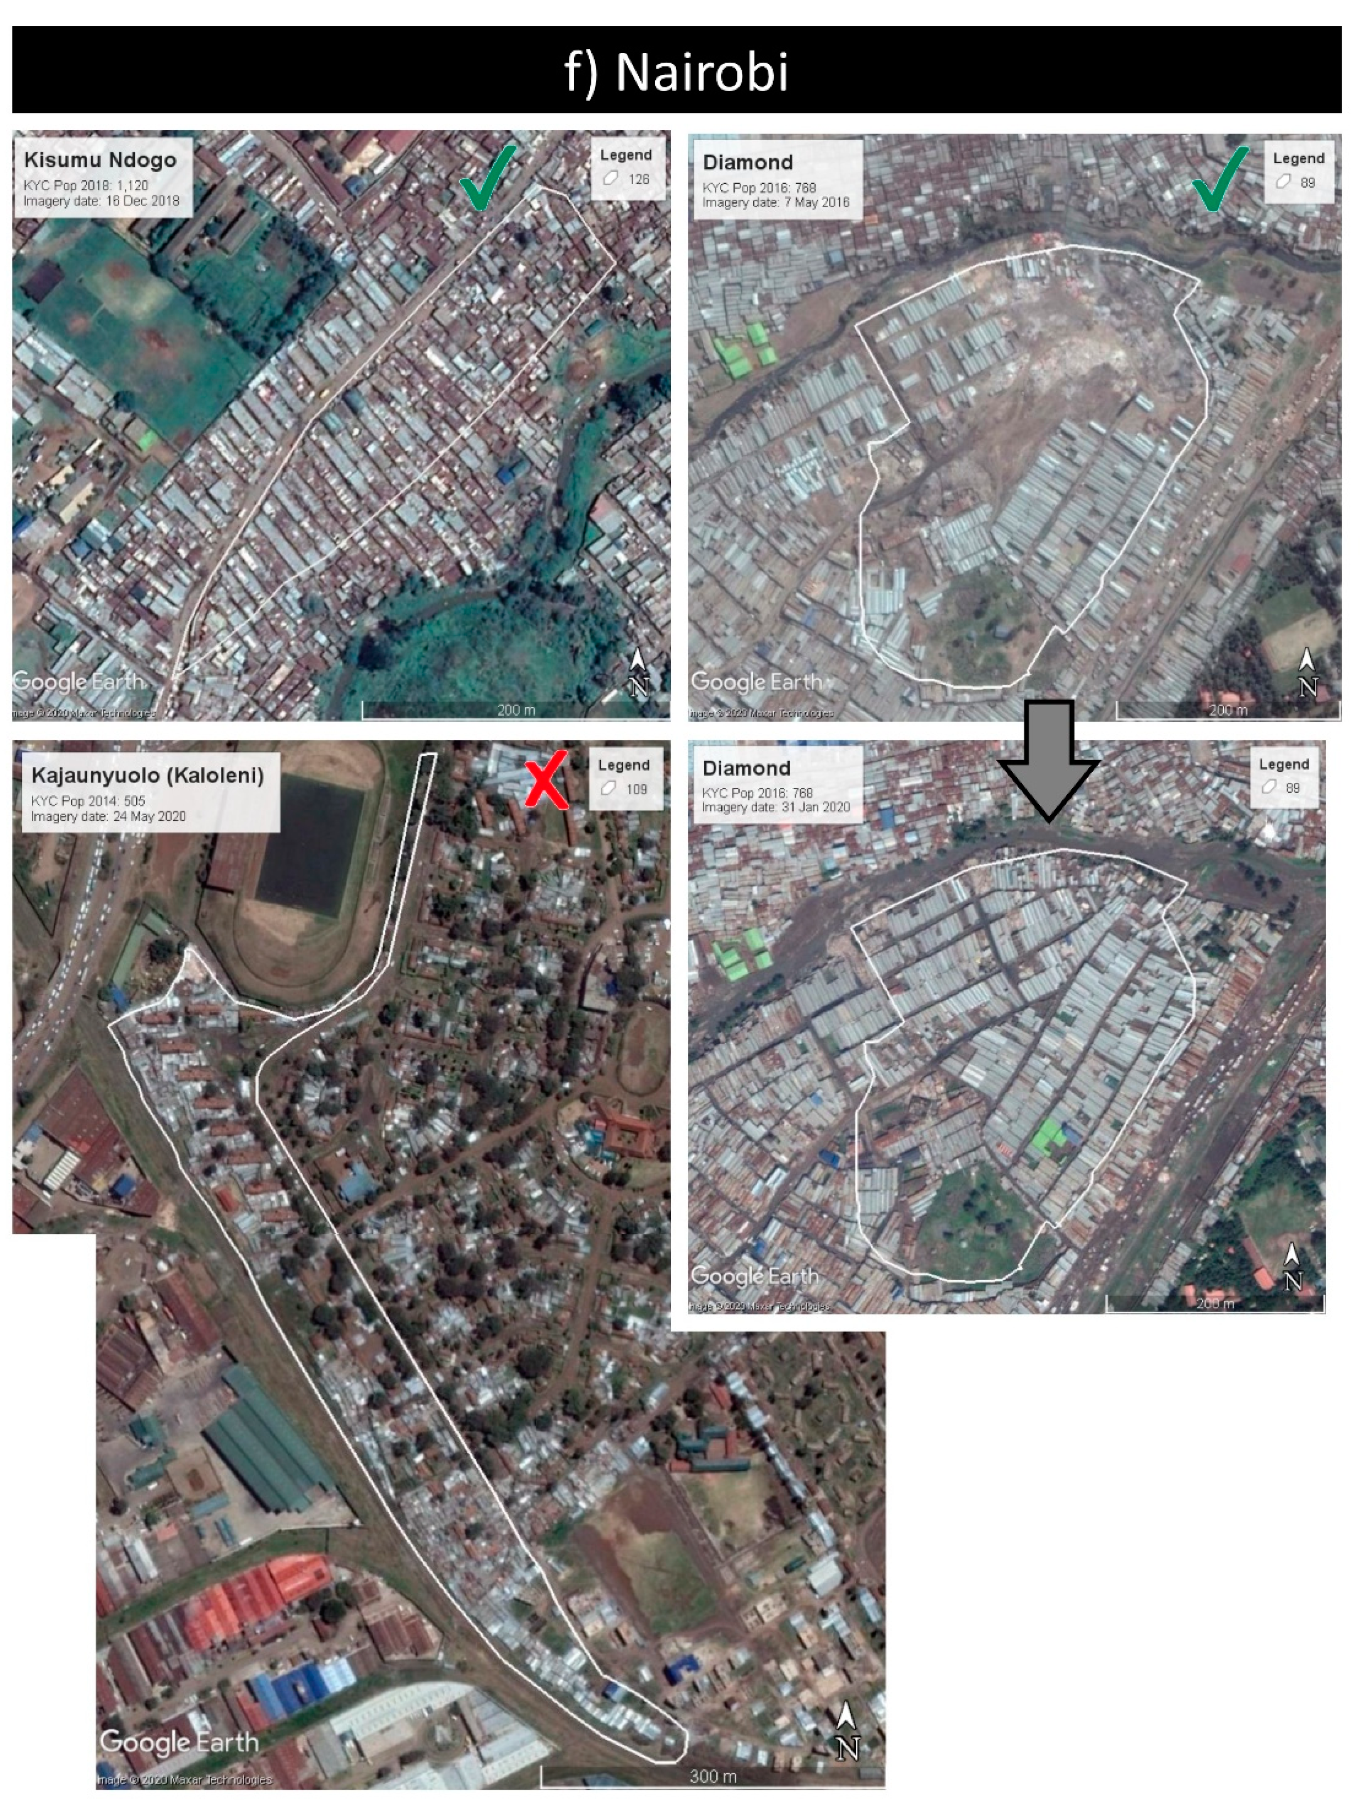
2.3. Data Checks and Processing

Given the incongruent years of population estimates in the KYC Campaign dataset, as well as among gridded population estimates, we aligned data in two time periods: 2013 through 2016, and 2017 through 2020. Each of the gridded population datasets were downloaded and projected to UTM 31 in Lagos, UTM 32 in Port Harcourt, and UTM 37 in Kenya. This meant that we downloaded two estimates from GWPv4.11, WorldPop-Unconstrained, and LandScan Global which included estimates for multiple years. Gridded population estimates were then summed within each settlement boundary such that population values from partially covered grid cells were weighted by the fraction of area covered by the settlement. As a result, smaller settlements (e.g., settlement 20 in Figure 4) were only attributed a portion of a cell’s population from gridded population estimates that had a coarse spatial resolution (e.g., 1 × 1 km). A comparison of the three gridded population datasets with multiple estimates showed substantial differences in population estimates over just a few years in study settlements, underscoring the importance of aligning years (Appendix A Figure A2).
Data checks were then performed to gauge the quality of KYC Campaign data and our retraced settlement boundaries. Settlements with the largest reported populations by KYC were visualized over current and historical satellite imagery in Google Earth to evaluate whether the reported population estimate seemed plausible. We also checked settlements in which the median gridded population estimate was larger than KYC. Settlements judged to have questionable field-referenced population estimates were excluded from the analysis (documented in Appendix A Figure A3). In settlements for which KYC reported the settlement area, the KYC area and area of digitized boundaries were compared (Appendix A Table A1), and we spot checked our digitized boundaries that differed substantially from KYC reports. After all data checks, 118 KYC settlements were retained for analysis (26 in Lagos, 39 in Port Harcourt, and 53 in Nairobi).

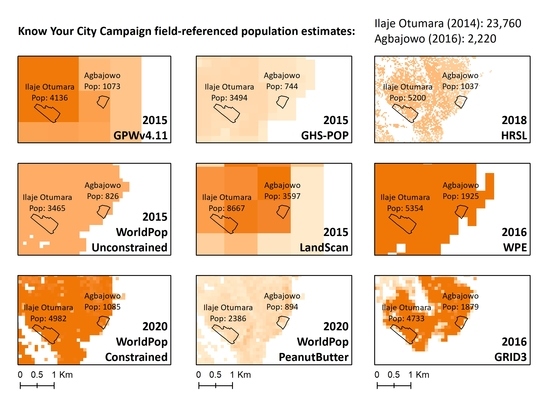
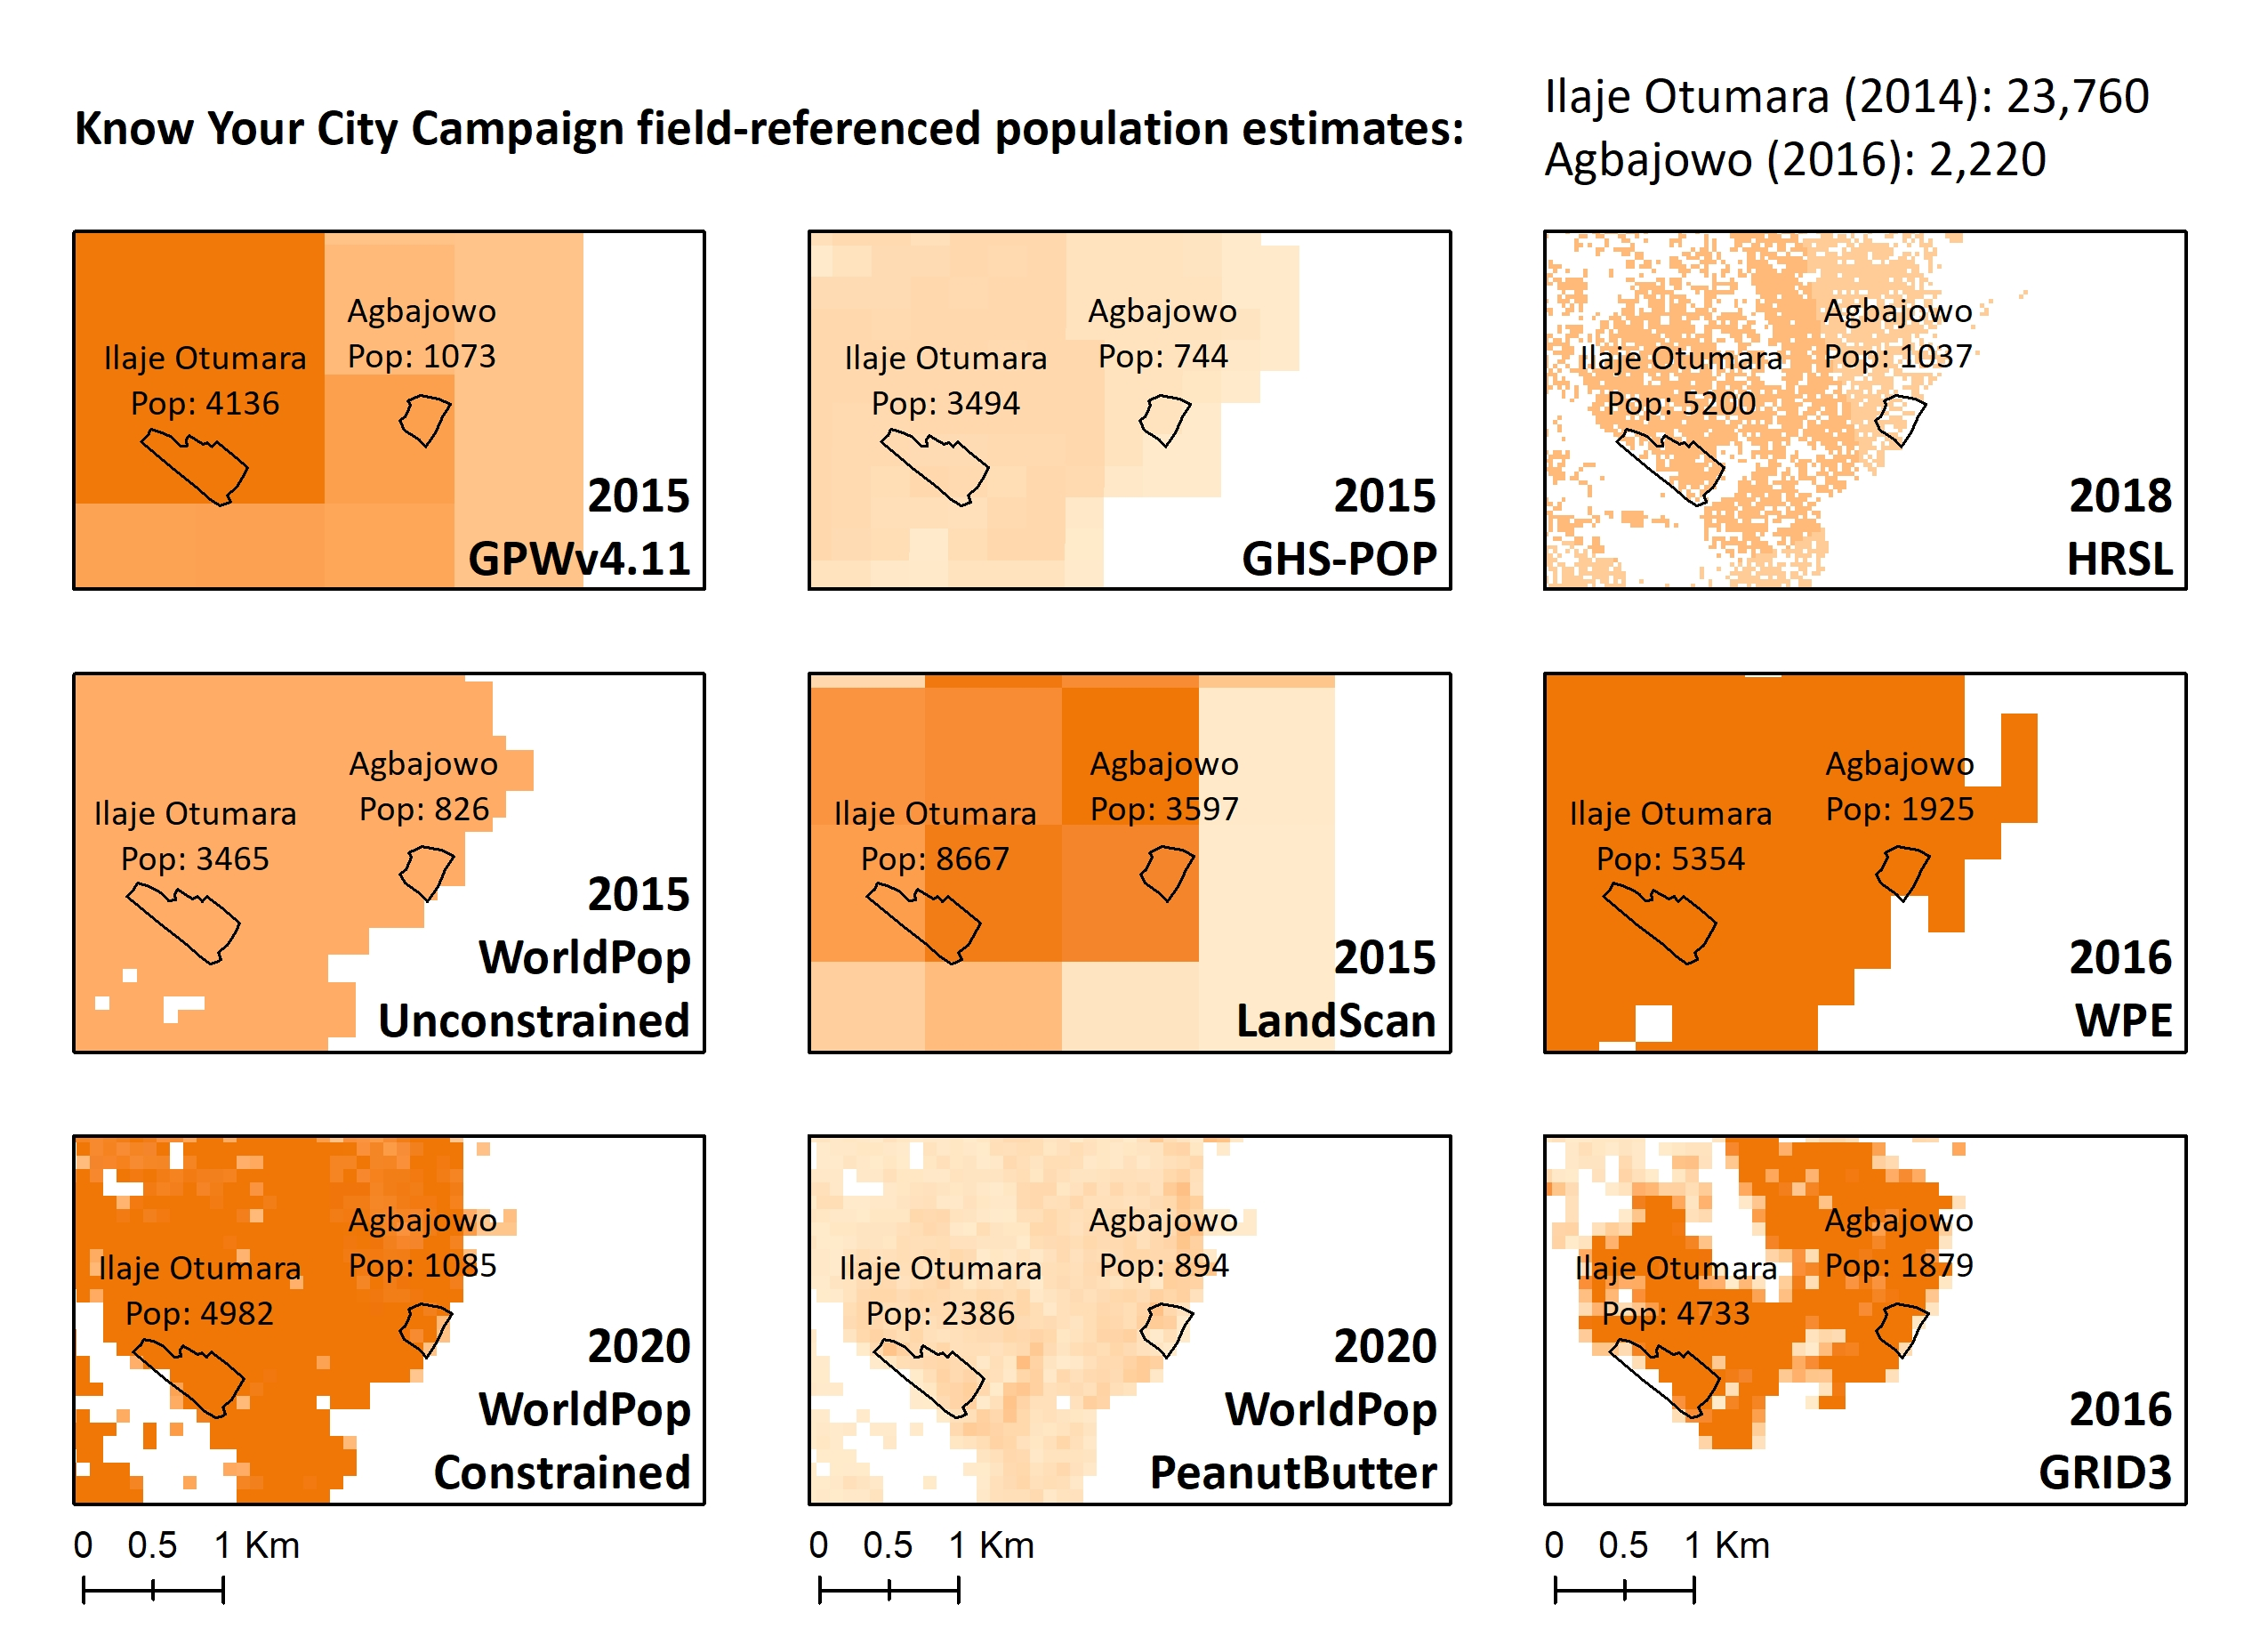
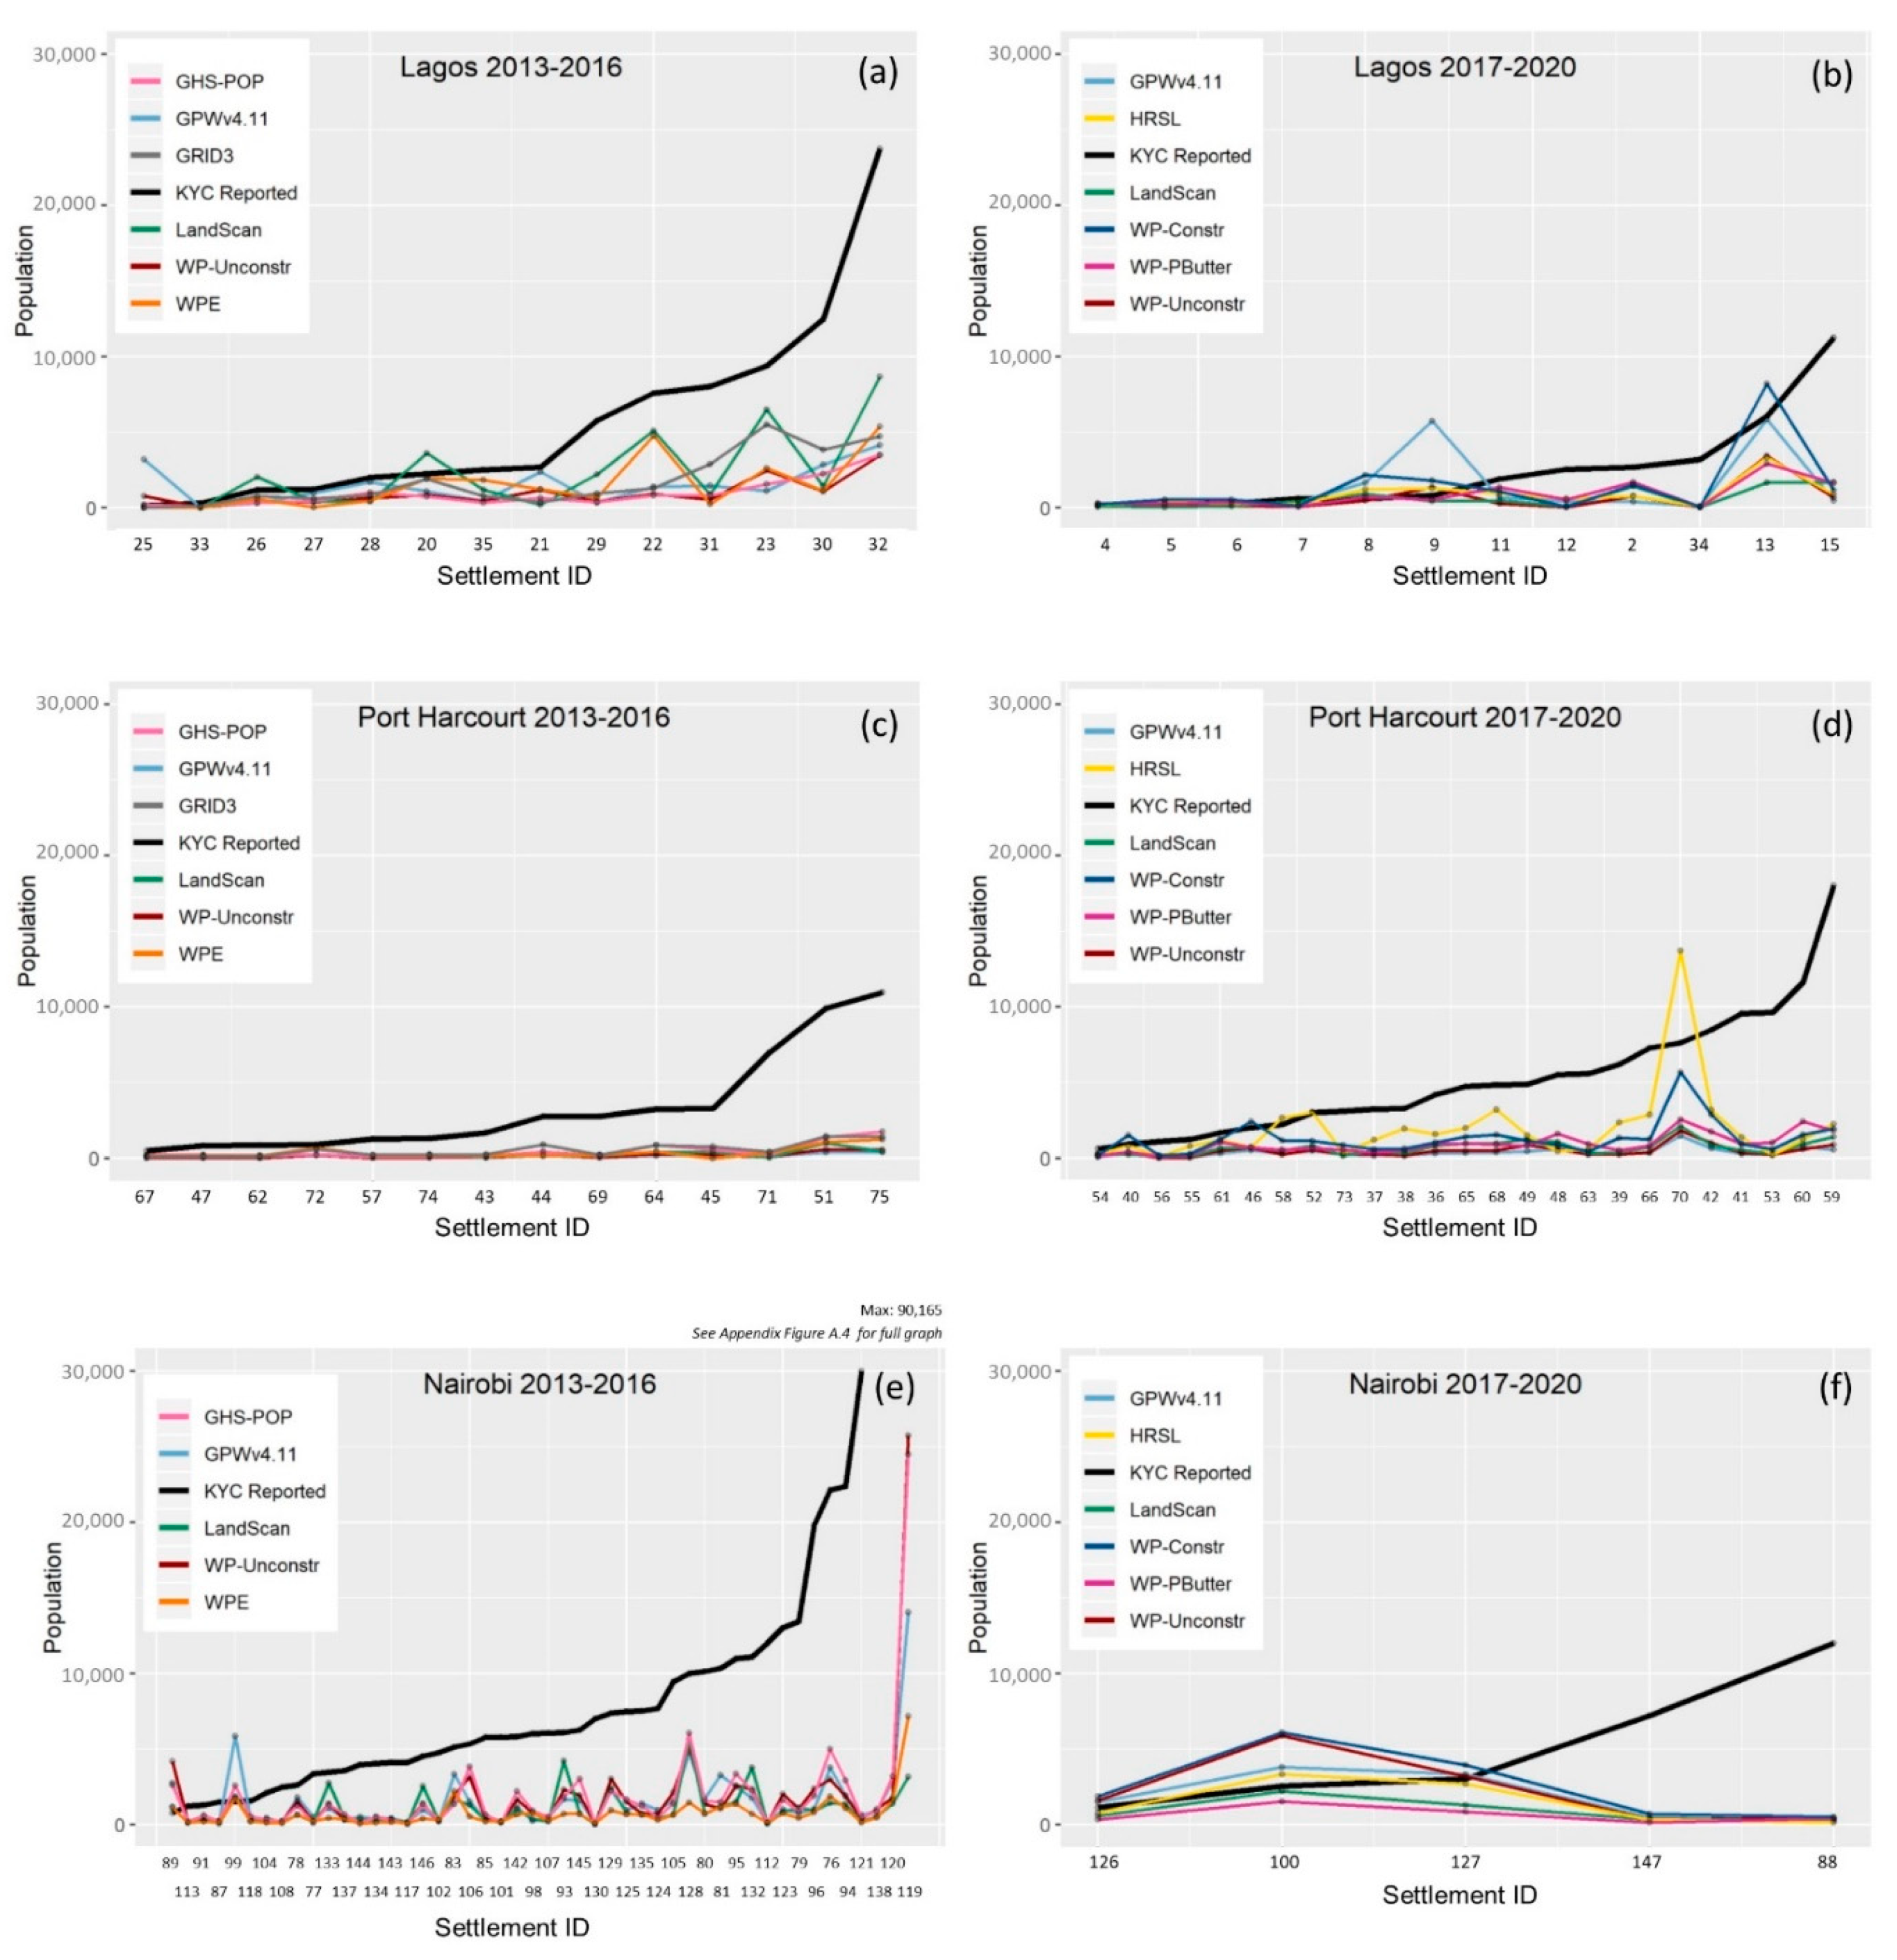
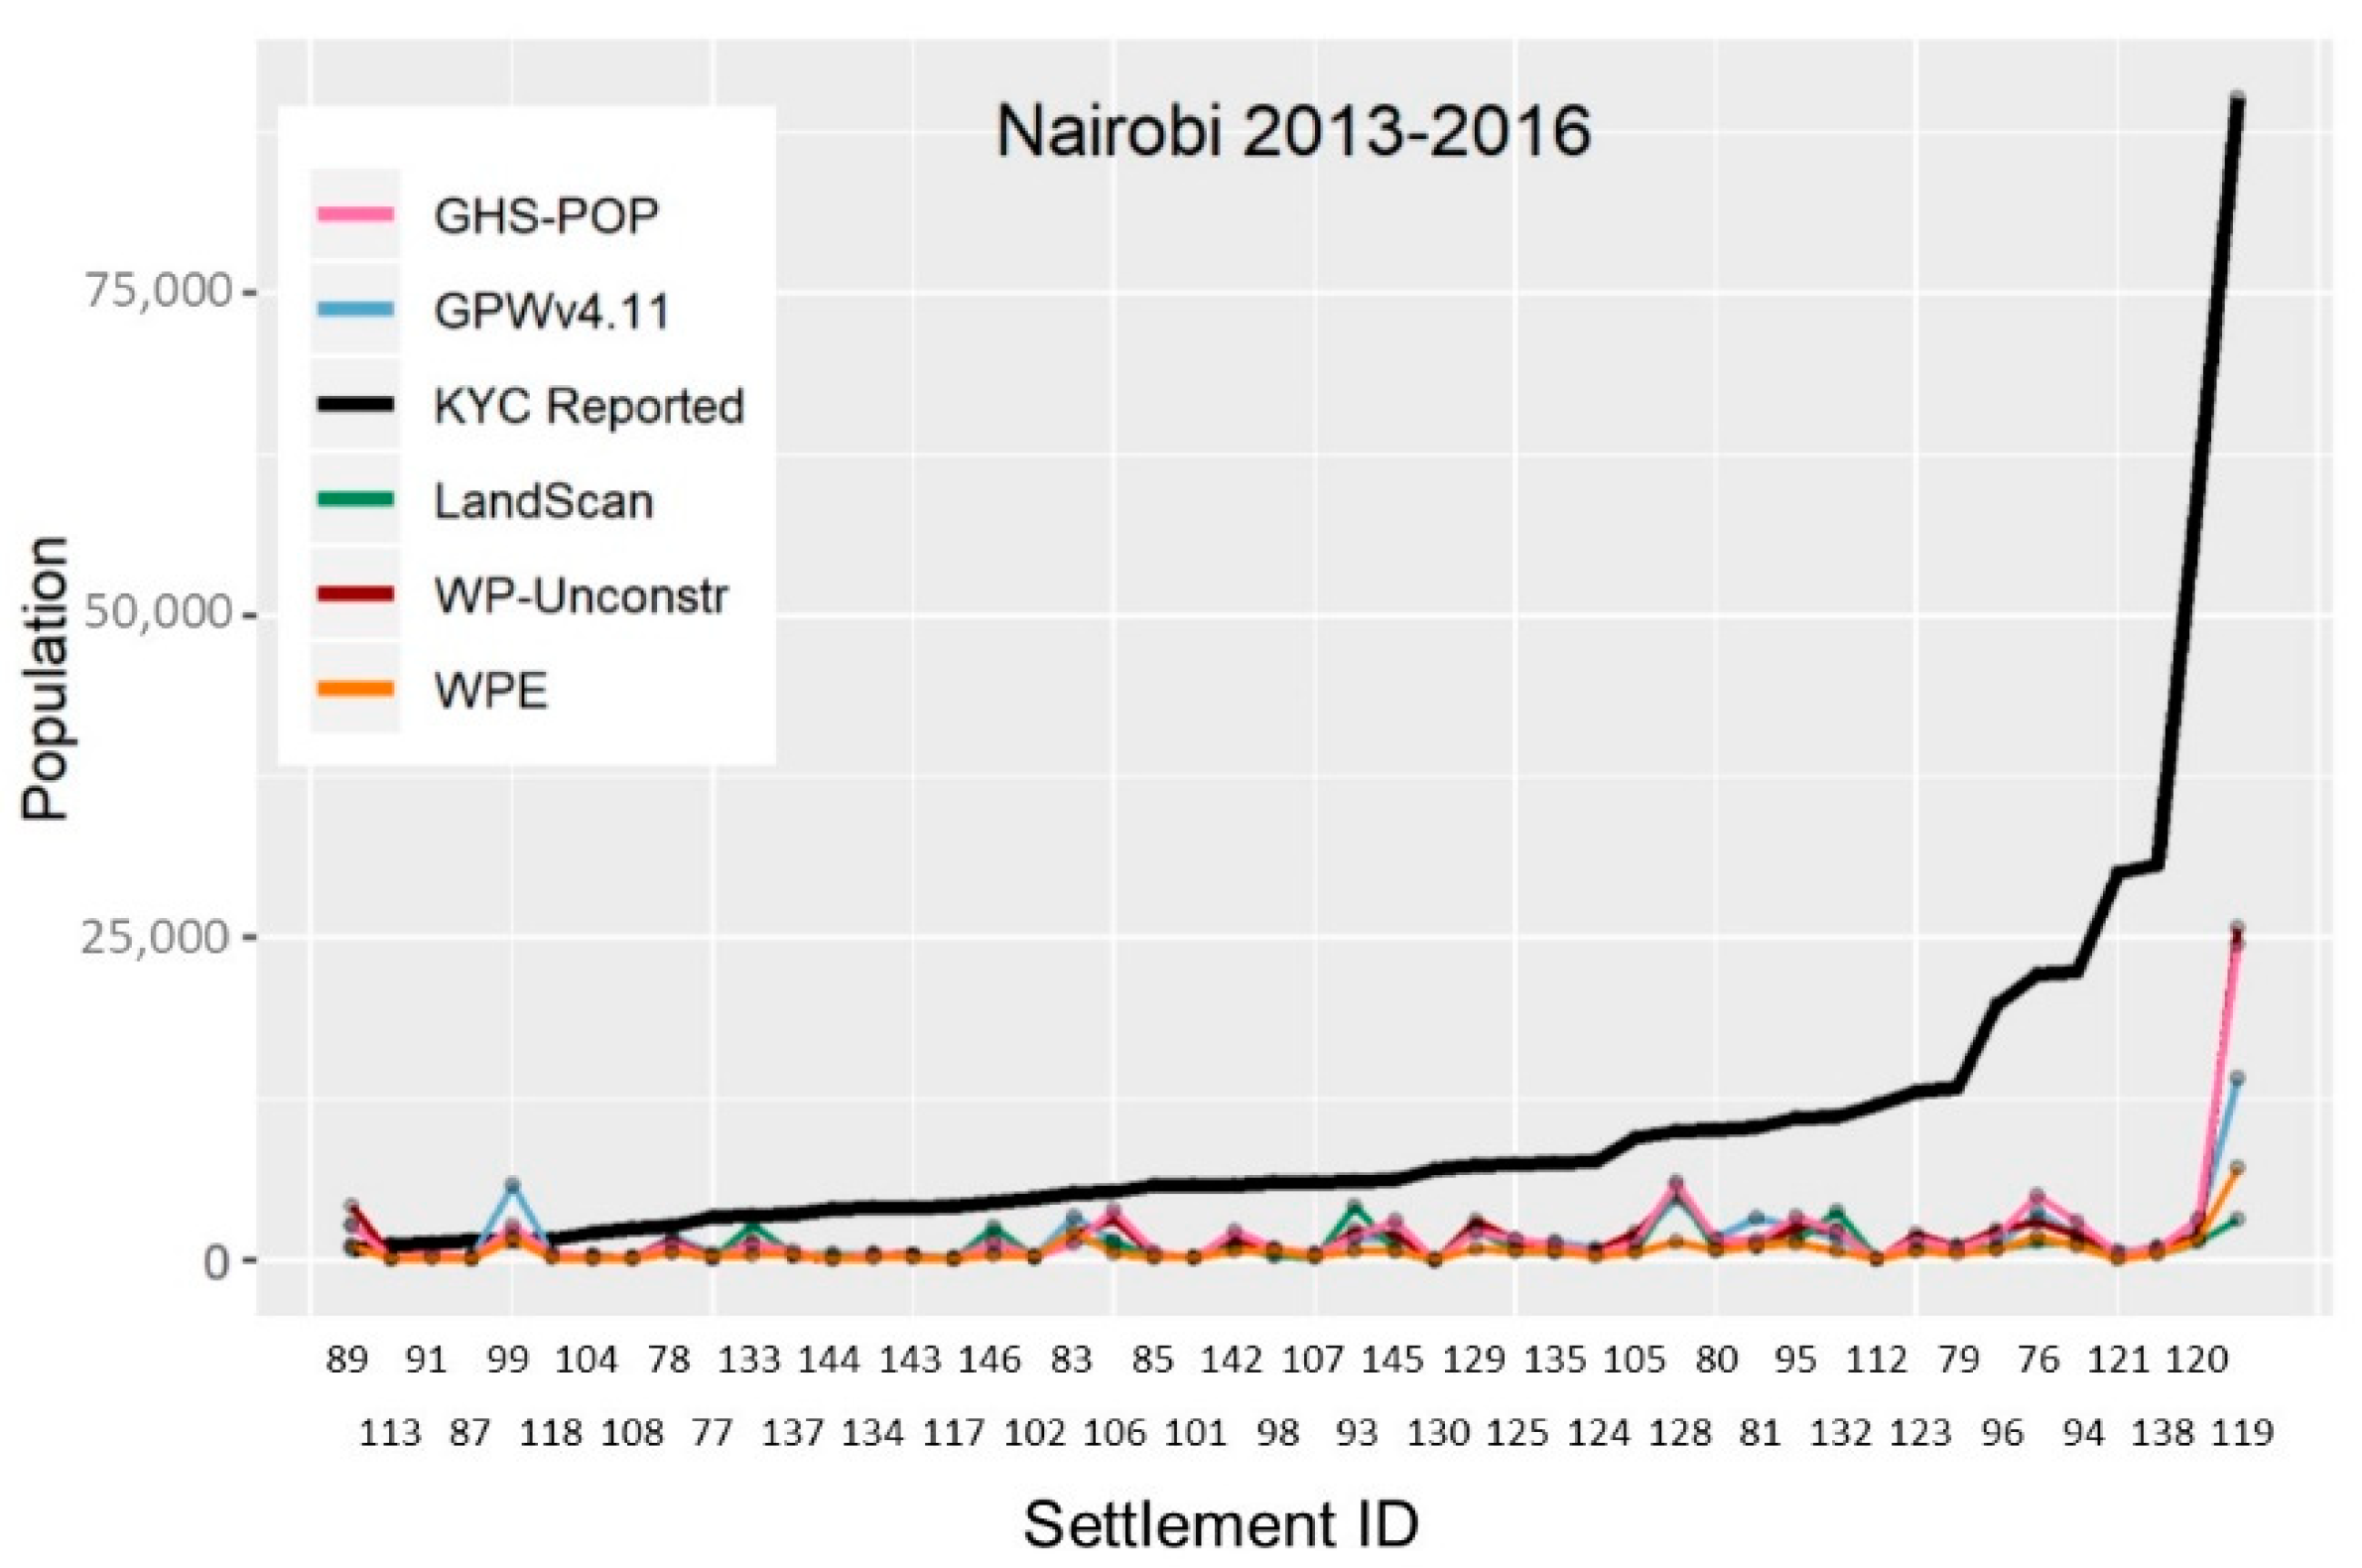
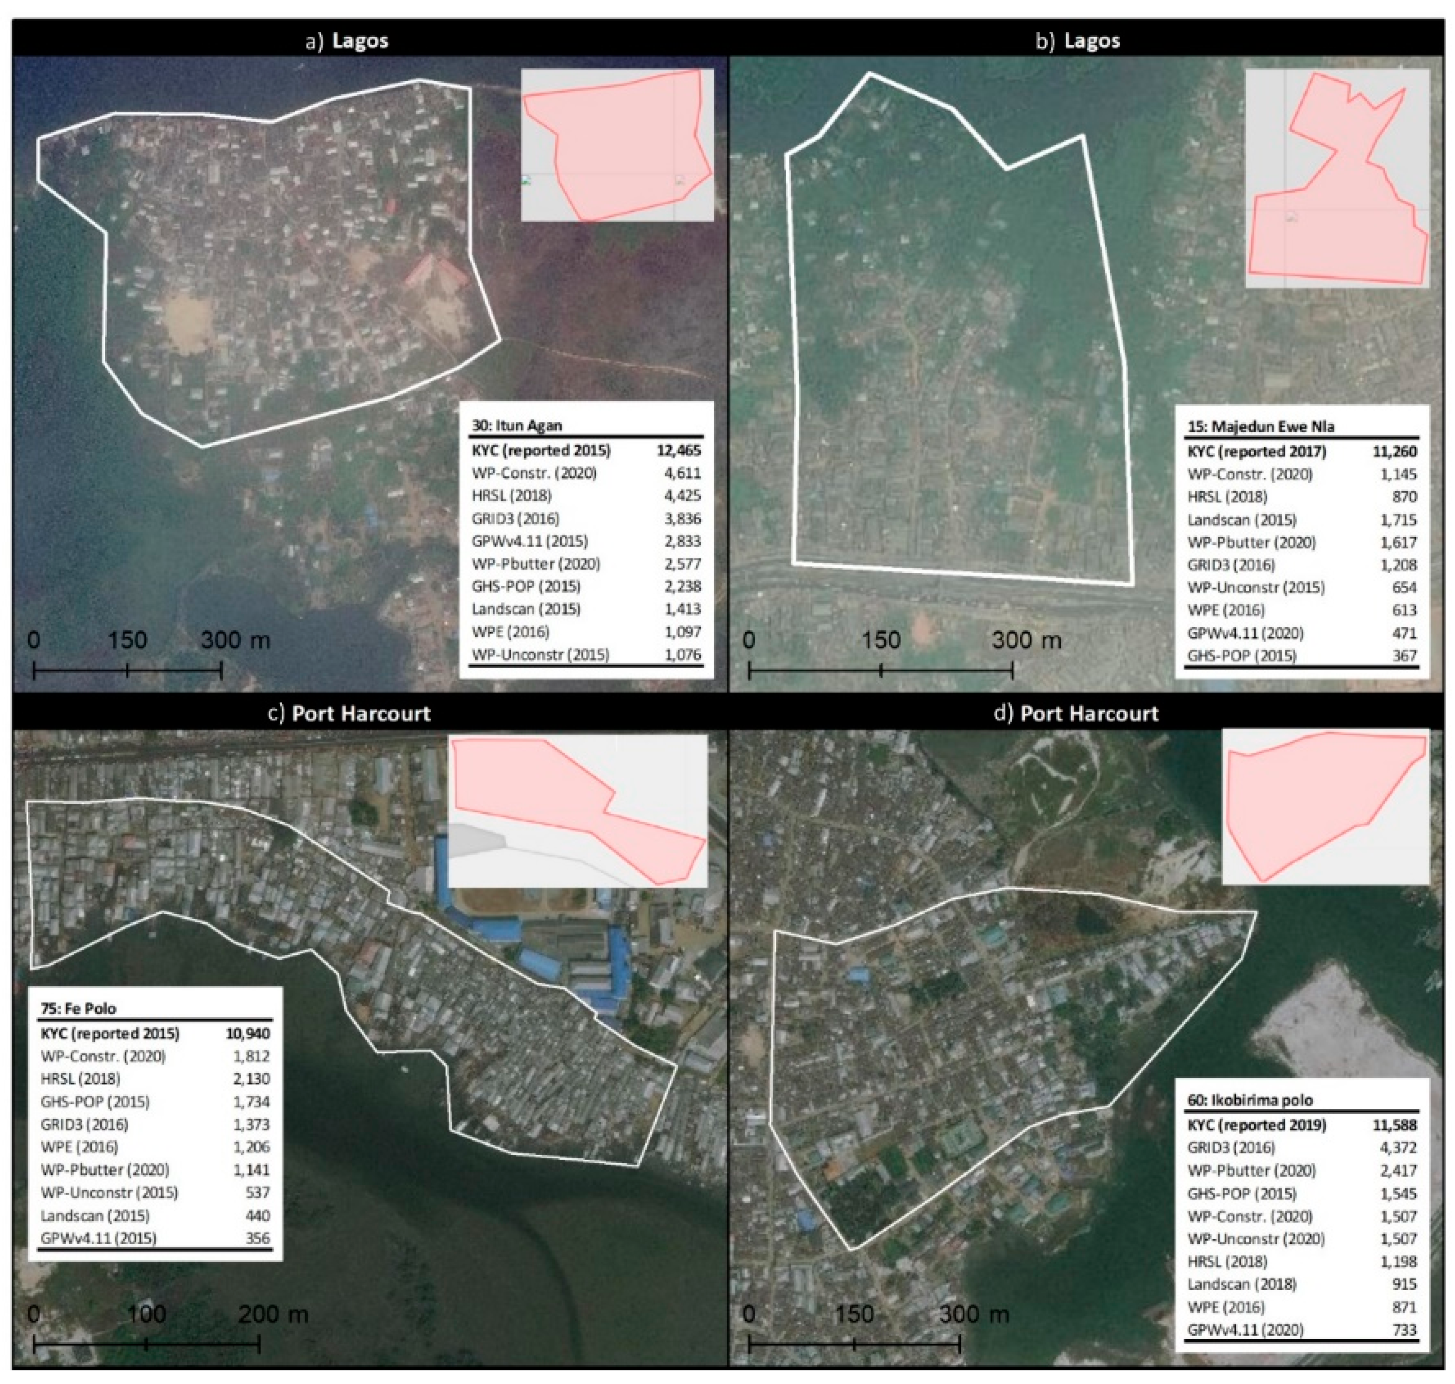
2.4. Analysis One: Comparison of Gridded Population Estimates and KYC Field Reports

Differences in KYC reported population and each gridded population estimate were then calculated. Only comparisons that fell within the same time period were evaluated. Visual comparisons were made using line graphs, and the following accuracy statistics: mean absolute error (MAE), root mean square error (RMSE), bias, and median fraction (MF) of the KYC population estimated by each gridded population dataset. MAE is a measure of overall precision, RMSE is a measure of overall error magnitude which penalizes large errors, and bias and MF indicate the degree of over/under estimation by gridded population datasets. These statistics are calculated as follows, where y i is the reported KYC population in settlement i, y ^ i is the gridded population estimate in settlement i, and n is the count of settlements:
M A E = i = 1 n | y ^ i y i | n ,
R M S E = i = 1 n ( y ^ i y i ) 2 n ,
B i a s = i = 1 n y ^ i y i n ,
M F = M e d i a n ( y ^ i y i ) .
Finally, a descriptive comparison was made of the mean and maximum population densities per 200 × 200 m area (roughly the average area of KYC slum settlements assessed across the three cities). We found KYC population densities by calculating the mean population density per sq. m in each settlement, then multiplied by 40,000. To calculate population densities for each gridded population dataset, we created a 200 × 200 m grid over each city, selected only those grid cells located entirely within the city boundary, and then summed the gridded population estimate within each 200 × 200 m unit, applying areal weighting.

2.5. Analysis Two: Comparison of Gridded Population Estimates for SDG 11 Monitoring in Lagos

In the second analysis, we used the modelled slum/non-slum boundaries in Lagos State derived from Badmos and team [41] to calculate the percent of population living in slums according to each gridded population dataset. As in Section 2.3, modelled slum boundaries that only partially covered a gridded population cell were weighted on the fraction of area covered. For GPWv4.11, WorldPop-Unconstrained, and LandScan, only the 2015 estimates were evaluated.
Although we had no “true” slum population measurement for comparison in this analysis, we used the 2018 Nigeria Demographic and Health Survey (DHS) [67] as a reference by calculating the percent of households considered to be “slum households” according to UN-Habitat [68]. According to UN-Habitat, a “slum household” lacks any of the following: adequate water, adequate sanitation, durable floors (and walls and roof), or less than four people per sleeping room; and this definition is used widely to estimate SDG 11.1.1 and other slum indicators [3]. Note that durable wall and roof materials are not collected in all DHS surveys, so durable floor material alone tends to be used as a proxy (e.g., [69]). Furthermore, the UN-Habitat definition defines households without secure tenure to be “slum households”, but tenure status is rarely measured in censuses or surveys, and thus this part of the definition is omitted in practice (e.g., [70]). To identify Nigeria DHS households in Lagos State, we subset all Lagos households as defined in the survey, calculated whether each household was considered a “slum household”, and summarized household slum status across Lagos by applying household sampling weights. All analyses were performed in R 3.6.0.

2.6. Ethics

As a secondary analysis of open, aggregated datasets, ethics approval was unnecessary and not sought. The original data sources, including nine gridded population datasets [44,45,46,47,49,50,51,52,53,58,60,63,64,65,66], KYC slum boundaries with population counts [39], and Lagos’ modelled slum layer [41,42], are cited. For transparency and to gather feedback, we presented and discussed our methods and results with members of the Profiling team at SDI in Lagos.

3. Results

3.1. Analysis One: Comparison of Gridded Population Estimates and KYC Field Reports

Across all three cities and both time periods, gridded population datasets tended to vastly underestimate the total population in populous settlements relative to KYC reported population counts (Figure 5). No particular gridded population dataset stands out as consistently producing more accurate estimates than the rest. HRSL estimates in Port Harcourt were consistently closer to the reported KYC population than other datasets, LandScan had the largest estimate for the largest reported slum settlement in Lagos; and GHS-POP and WorldPop-Unconstrained had the largest estimates for Nairobi’s most populous reported slum settlement, though all were still substantially underestimated (Figure 5). In a handful of settlements, gridded population estimates were substantially larger than the reported KYC population (e.g., GPWv4.11 in one Lagos and one Nairobi settlement, and HRSL in one Port Harcourt settlement), though no clear pattern in overestimates emerged (Figure 5).
Table 2 presents the overall MAE, RMSE, Bias, and MF for each dataset in the 118 slum settlements, and datasets are ordered from most-to-least accurate. More accurate datasets included HRSL (MAE: 3265; RMSE: 4958), WorldPop-Constrained (MAE: 3491; RMSE: 5001), GRID3 (MAE: 3366; RMSE: 5296), and WorldPop-Peanut Butter (MAE: 3586; RMSE: 5073) (Table 2). The remaining datasets were nearly twice as inaccurate in slum settlements across the three study cities, including WorldPop-Unconstrained (MAE: 6048; RMSE: 10,889), GPWv4.11 (MAE: 6189; RMSE: 10,889), LandScan (MAE: 6087; RMSE: 12,121), GHS-POP (MAE: 7079; RMSE: 12,854), and WPE (MAE: 7653; RMSE: 14,422) (Table 2). All datasets were severely biased, underestimating thousands (range: −2853 to −7638) of people per settlement on average (Table 2). The best performing dataset, HRSL, only estimated 39 per cent of the KYC field-referenced population, on average (Table 2).
Several gridded population datasets were likely to underperform in high-density slum settlements due to the use of average population densities in input units which limits the highest density value that can be assigned to a cell (e.g., GPWv4.11, GHS-POP, WorldPop, WPE). To explore this further, Appendix A Table A2 summarizes citywide gridded population estimates in 200 × 200 m grid cells, as well as average reported KYC population density per 200 × 200 m area. The maximum reported KYC population 200 × 200 m density in Lagos (12,123), Port Harcourt (13,885), and Nairobi (34,760) were well above the maximum citywide estimate of any gridded population dataset (5007, 4175, and 14,771, respectively) (Table A2). In the discussion, we deduce potential reasons for these underestimates and offer suggestions that might improve gridded population estimates in slum areas.

3.2. Analysis Two: Comparison of Gridded Population Estimates for SDG 11 Monitoring in Lagos

In the second analysis in which we calculated the total slum population in Lagos from a modelled slum layer, underestimates in each of the gridded population datasets for slum settlements compounded to produce extremely low overall estimates of the population living in slums (1.02–2.96 per cent of the overall population) (Table 3). For reference, the survey-based UN-Habitat method for estimating slum populations puts 56.0 per cent of the Lagos population living in slum-like conditions (Table 3). Some of this underestimation might be attributed to a modelled slum map that did not include all slum areas in Lagos (e.g., omission of small “pocket” slums). The two gridded population estimates that produced the largest percentage of slum population (GRID3: 2.96 per cent and WorldPop-Peanut Butter: 2.91 per cent) were both “bottom-up” estimates that vastly underestimated the overall population of Lagos State compared to census-based “top-down” gridded population estimates, which might explain the larger percentages (Table 3). On a whole, it is clear that all gridded population datasets vastly underestimate population counts in slum areas in Lagos.

4. Discussion

Gridded population data are increasingly used to make consistent comparisons of population and demographic data across settings, especially in LMICs where lack of timely, accurate census data is a challenge. In this study, we compare nine multi-country gridded population datasets to KYC Campaign population estimates reported by slum community profiling teams and to a survey-based estimate of the percent of population living in slums in Lagos. We found that all of the gridded population datasets evaluated in this analysis severely underestimated population counts in slums and informal settlements across three diverse African cities (Section 3.1). Underestimates were particularly severe in the most populous—and often densest—slums which might indicate wider accuracy problems for gridded population datasets in other high-density areas (e.g., areas with multi-story apartment buildings). The analysis in Section 3.2 highlighted sharp discrepancies between gridded population estimates in slum-like areas compared with the 2018 Nigerian Demographic and Health Survey “slum household” measure; gridded population estimates of people living in slums were impossibly low in Lagos. A study of WorldPop-Unconstrained accuracy against field-referenced population counts in São Paulo, Brazil, similarly found underestimates in slums but to a lesser degree, underestimating the total slum population in that city by six per cent [72]. More studies are needed to assess the accuracy of gridded population at fine geographic scale, particularly in deprived urban areas. In the meantime, gridded population data should be used with caution to calculate urban poverty indicators such as SDG 11.1.1. In this section, we discuss potential sources of underestimation in each of the gridded population datasets, and offer suggestions that might improve their accuracy.
A challenge that all gridded population datasets face, regardless of method, inputs, or output resolution, is that there are currently no global datasets that classify heterogeneous urban areas by settlement type (e.g., slum/non-slum) [16]. If (or when) such a dataset becomes available, producers of gridded population datasets would have the option of tailoring their methods and inputs in sub-sections of cities to reflect what are often very different patterns in building and population density. Until then, however, there are several other potential steps that gridded population producers might take to improve the accuracy of their datasets in LMIC city slums.

4.1. Recommendations for Un-Modelled and Lightly Modelled Gridded Population Datasets

The key strength of un-modelled and lightly modelled gridded population datasets is that their methods are relatively easy to implement, and gridded population outputs are transparent to communicate and understand.

4.1.1. GPWv4.11

Given that GPWv4.11 is an un-modelled dataset with equal distribution of population across input units, we cannot suggest any methods to improve its accuracy aside from continuing to pursue access to more detailed and updated census data from national census agencies. This dataset is not designed to be accurate at fine geographic scales, and thus is not recommended for estimating populations in slums and informal settlements.

4.1.2. WorldPop-Peanut Butter

Likewise, the WorldPop-Peanut Butter datasets is not derived from a model, and it only has a few parameters. One challenge is that slum and non-slum households vary in terms of average household size, average number of households per building, and percent of buildings that are residential [73,74]. If city-, district-, or urban-wide average values are used to create this dataset, it is no surprise that within household crowding and high-density buildings would be masked and underestimated in slums. Another challenge is the building footprints themselves. Contiguous rooftops are sometimes identified as a single building in feature extraction algorithms [75]. Many of the slum settlements in this study were characterized by high-density and contiguous buildings, especially Nairobi where buildings containing multiple one-room dwellings are common [76]. A likely challenge was that too few buildings were detected in slums which limited the population allocated to slums. Building feature extraction algorithms might require further development to improve accuracy of building density maps in slums. If, or when, routine maps of deprived urban area boundaries become available, then the WP-Peanut Butter tool could enable urban slum- and non-slum-specific parameters to improve gridded population estimates in slum areas.

4.1.3. GHS-POP

GHS-POP uniformly distributes population within built-up areas of input units defined by their GHS-BUILT dataset. While the current GHS-BUILT layer is based on older freely available 30 × 30 m Landsat imagery, new free building footprint layers such as Ecopia are becoming available. In the near future, the producers of GHS-BUILT might refine the definition of built area boundaries with new building footprint data, though like GPWv4.11, this dataset is not designed for fine-scale accuracy at the grid cell-level, and is not recommended for estimating slum populations.

4.1.4. HRSL

The HRSL dataset was more accurate in many settlements compared to the other gridded population datasets likely because it allocates population to smaller grid cells, preventing population from being spread across unsettled parks, yards, roads, and other areas without buildings. The underestimation of population in slums by HRSL, however, was still substantial because population was spread evenly across 30 × 30 m cells containing buildings. In the future, producers of this dataset might consider a highly modelled approach, using covariates and a statistical or geographic model, to more accurately allocate population with varying density to cells.

4.2. Recommendations for Highly Modelled Gridded Population Datasets

Highly modelled gridded population datasets use statistical or geographic models with multiple covariates to vary the disaggregation (“top-down”) or aggregation (“bottom-up”) of population counts. The complex methods and multiple input datasets in these datasets provide several opportunities to tweak and improve local accuracy of estimates.

4.2.1. Cross-Cutting: Fine-Scale Urban Covariates

A challenge faced by all producers of highly modelled gridded population estimates (i.e., WorldPop, LandScan, WPE, and GRID3) is the lack of availability of spatially detailed datasets that correlate with the variation of population density across small areas within cities. While covariates such as roads, elevation, slope, and night-time lights broadly correlate with the presence or absence of people [77], none of these datasets are especially informative about the location of, for example, high-density slum neighborhoods versus less-dense middle-class neighborhoods. Arguably night-time lights could differentiate areas by population density and/or wealth status, but the resolution of this dataset is approximately 1 × 1 km [78,79], which might perform well in LandScan models (~1 × 1 km resolution), but leads to a “halo” effect with population allocated near, and not within, high density areas in finer-scale WPE (162 × 162 m), WorldPop (~100 × 100 m), and GRID3 (~100 × 100 m) estimates. One might imagine use of OpenStreetMap, an ever improving reservoir of open data on building footprints, points of interest, multiple types of roads, and many other characteristics, to be a good source of high-resolution covariate data; however, OpenStreetMap still remains incomplete in many LMIC cities and towns around the world [80], reducing the statistical power and even increasing noise in models. For this reason, LandScan and WPE rely on government or propriety data for these covariates, and WorldPop uses a limited number of covariates from OpenStreetMap with better coverage (e.g., roads, and not building footprints).
The new Ecopia building footprint layer for Africa [56] or Bing building footprints for Tanzania and Uganda [81] are among the first multi-country fine-scale, complete datasets available that are likely to correlate with population density at fine scale. While Ecopia building footprint layers are normally a paid commercial product for three years before becoming freely available, the Africa building footprints were made available to all BMGF funded projects, and then released publicly during the COVID-19 pandemic to support response [56]. As additional Ecopia building footprint datasets become available, the WorldPop team (partially funded by BMGF) will publish derived building metrics in approximately 100 × 100 m cells including number of buildings, total area covered by buildings, average size of buildings, and more [82]. All of the highly modelled population producers would likely improve the accuracy of their output in cities, especially in slums and informal settlements, if covariates derived from a complete and accurate building footprints layer were incorporated (Table 4). These covariates might include information about the buildings within a given cell (e.g., average size of buildings), as well as building characteristics in surrounding cells reflecting the area environment (e.g., average size of buildings in a 300 m buffer around the cell). For those gridded population dataset producers with access to raw building footprints, they might consider either disaggregating directly to building footprints, and/or further processing the building footprints to classify non-residential buildings such as airport, government, university, or industrial buildings to prevent population being allocated to non-residential buildings [5].

4.2.2. WorldPop-Unconstrained

While WorldPop-Unconstrained data producers have demonstrated that their modelling approach is more accurate than some other gridded population methods, their model training and accuracy assessments are performed at a much more aggregated scale (e.g., census EA) than the output cells (~100 × 100 m) [53]. In the WorldPop workflow, accuracy assessments are performed within the Random Forest model by retaining some of the input population data for validation, while the rest of the population data are used to train the model. The input data are typically census population counts in EAs, wards, or sub-districts, adjusted by UN population growth rates, and thus cannot estimate accuracy within the model at finer geographic scales [53]. Furthermore, because the input population data are aggregated, the average population density for each input unit can mask enormous spatial variability in population density at the scale of output grid cells. The Random Forest model is only able to allocate population density values to cells which appear in the training dataset, and will thus always underperform in the densest cells when training data are highly aggregated. This problem is highlighted in Table 3 from Analysis One, and in Appendix A Figure A5 and Figure A6, showing maximum WorldPop-Unconstrained population estimates well below KYC reported populations.
One way to address both of these challenges is to incorporate smaller, high-density slum settlements into the model training and validation datasets (Table 4). Slum population counts might come from the KYC Campaign website [39], or other sources such as government slum censuses [73]. The additional slum training data might overlap with the census data, or be located in cities outside the country which share characteristics with cities in the country of interest [53]. However, in the case of incomplete slum datasets, such as KYC Campaign, consideration should be given to how to choose (sample) a representative set of slums, as spatial correlation within the training dataset can increase variance in model residuals [83]. With finer-scale, high-density training data, the model will be able to allocate larger population values to 100 × 100 m grid cells, and the finer-scale input data will result in finer-scale accuracy statistics during the modelling process. However, to explicitly assess cell-level accuracy, additional datasets with population counts in small areas should be used after modelling, for example, population enumerations taken as part of routine household surveys [24] (Table 4). Simulated household-level datasets geo-located in a real-world setting provide another approach to evaluate the general accuracy of a modelling approach [84].
It may seem logical that a source of error in WorldPop-Unconstrained datasets is that population which should be allocated to settled cells is misallocated to unsettled cells, thus reducing population estimates in settlements. While this does occur, the magnitude of the problem is minimal. In an analysis of the WorldPop-Unconstrained model in Khomas Namibia, a region characterized by vast unsettled areas and the capital city of Windhoek, more than 99 per cent of the population was allocated to cells within 300 m of populated places [84]. The reason for misallocation to cells just beyond populated places was likely a consequence of the “halo” effect due to coarse covariate data (e.g., 1 × 1 km resolution night-time lights), rather than misallocation to unsettled cells.

4.2.3. WorldPop-Constrained

Despite the limited effect of misallocation of population to unsettled cells in the WorldPop-Unconstrained dataset, the WorldPop-Constrained dataset overcomes this potential challenge. In this analysis, WorldPop-Constrained estimates were more accurate of slum populations across the three cities than WorldPop-Unconstrained estimates because the input population densities were calculated from smaller constrained areas.

4.2.4. LandScan Global

We offer similar recommendations to the producers of LandScan Global as producers of WorldPop: incorporate building footprint covariate(s) into the model (Section 4.2.1), and if (or when) a global datasets of deprived areas is developed [16], update the bespoke weights layer to allocate larger portions of the population to slums and informal settlements (Table 4).

4.2.5. WPE

WPE produced the least accurate estimates of slum populations within this study; only nine per cent of the KYC reported population was predicted by this dataset (Table 2). A key challenge might derive from the BaseVue 2013 dataset used to distinguish types of settled and unsettled areas [52]. BaseVue land cover classifications were developed in the United States, and the land cover classification method was not updated when the process was applied globally, possibly leading to misclassification of land cover types that are not well represented in the United States such as dense informal settlements. WPE addresses some challenges of the BaseVue dataset by incorporating information from other sources such as the global GeoNames.org dataset, improving coverage of small cities and towns; however, the BaseVue model remained prone to classifying peri-urban settlements as unsettled [52].
A second challenge in the WPE model is that it does not include datasets that help to distinguish high and low population density; the BaseVue land cover model includes only “high-dense urban” and “medium-dense urban”, and the only other potential covariate that might distinguish within-city densities is road intersections, which are likely absent and/or under mapped in slums and informal settlements. To improve cell-level accuracy, we suggest that WPE producers include a number of other covariates in their model including building footprints (Section 4.1.2), as well as slope, elevation, temperature heat islands, and more [53,77] (Table 4).

4.3. Limitations

There were a number of limitations to this study. First, analysis one was limited both in terms of the number of cities and countries evaluated, and the number and distribution of slums evaluated for accuracy in each city. The settlements reported on KYC website reflect where local Slum Dwellers International Federations are active, and thus may not have represented all types and sizes of slums across the cities. Compounding this, we chose to exclude many of the settlements with largest reported populations due to apparent inaccuracies. Many of the largest slum settlements in the study cities, for example, those settlements that comprise Kibera in Nairobi, were not included in the KYC Campaign website. As a result of all of these issues, we are cautious about generalizing about gridded population accuracy in different types of slums, or by city. The KYC Campaign data was also limited in its precision of population counts because most population estimates were derived from an undocumented household sampling process, and a simple estimation process of multiplying average household size by number of front doors, rather than a complete census.
Analysis two faced fewer limitations, though the dataset of slum areas was modelled and not field-referenced, thus subjecting our analysis to possible misclassification of slum versus non-slum areas and under-representation of small “pocket slums”. Despite these limitations, the evidence suggest that gridded population estimates tend to severely underestimate population estimates in LMIC slums and informal settlements. The suggestions that we offer for model improvement are based on hypotheses; we did not evaluate any of the gridded population methods, models, or input datasets directly.

4.4. Broadening Accuracy Assessments of Gridded Population Estimates in Slums

Although imperfect, the KYC website proved to be a valuable dataset to assess the accuracy of gridded population datasets, and could be used for such purposes in dozens of other cities where SDI affiliates profile slums. Furthermore, these data might be used to create training data that improve the accuracy of gridded population estimates in slums and informal settlements. The SDI Federation is adamant that data remain the property of communities (which is why a single database and shapefiles are not downloadable from the website), though these type of data can often be purchased from SDI Federations to support their work, and collaborations that expand community capacity to collect and use data will be appreciated. Research teams might support SDI Federation slum profiling teams directly with training and resources for fieldwork which might improve the quality and coverage of slum boundaries and population data on the KYC Campaign website.

5. Conclusions

This study is among the first to assess the accuracy of gridded population datasets in deprived urban areas in LMICs. We found that all gridded population datasets need to be improved before they can serve as reliable inputs for local SDG 11 and other slum monitoring efforts. The recent release of several building footprint layers provide an opportunity to improve the accuracy of gridded population data by providing an extremely fine-scale dataset that likely corresponds with population density distributions within cities. Any improvements to the accuracy of building feature extraction algorithms in high-density informal settlements will only add accuracy for gridded population modelling. Further integration of new model training datasets, such as community-generated slum maps like KYC, can improve fine-scale accuracy assessments of population estimates in highly modelled datasets. Ultimately, gridded population data that is accurate at fine-scale is needed, particularly in deprived areas of cities, for these very promising datasets to be useful in policy and practice.

Author Contributions

Conceptualization: D.R.T., A.E.G., F.R.S., G.Y. and R.C. Methodology: D.R.T. Data curation: D.R.T. Formal analysis: D.R.T. Resources: R.C. Validation: F.R.S. Supervision: A.E.G., F.R.S., G.Y., P.E. and R.C. Writing—original draft: D.R.T. Writing—review and editing: D.R.T., A.E.G., F.R.S., G.Y., P.E. and R.C. All authors have read and agreed to the published version of the manuscript.

Funding

This work was supported by the Bill & Melinda Gates Foundation, Seattle, WA, USA [grant INV-008144].

Institutional Review Board Statement

Not applicable.

Informed Consent Statement

Not applicable.

Data Availability Statement

All gridded population datasets are available in publicly accessible repositories and cited with links throughout the article. Restrictions apply to the availability of the modelled map of slum areas in Lagos from Badmos and colleagues (2019); please contact the authors directly for data access. The data we compiled from the KYC Campaign website of slum community boundaries and population estimates are restricted to protect vulnerable communities, but available upon request from the corresponding author.

Acknowledgments

Special thanks to Olabisi Obaitor (formally Badmos) and team for sharing their modelled map of slum areas in Lagos. Moreover, thanks to Andrew Maki from Justice Empowerment Initiative and the entire Profiling team at the Nigerian Slum/Informal Settlement Federation (SDI affiliate) for illuminating and verifying SDI data collection processes, and providing feedback on our first analysis. Finally, thanks to Monika Kuffer for the feedback on an early draft of this paper.

Conflicts of Interest

The authors declare no conflict of interest.

Appendix A. Visuals of Data Cleaning and Data Checks

Figure A1. Process to digitize Know Your City Campaign slum settlement boundaries. Steps were (a) copy and situate the KYC screenshot in ArcGIS over the OpenStreetMap base layer, (b) digitize the KYC boundary, (c) switch the ArcGIS base layer to satellite imagery, and (d) adjust KYC boundaries to match physical features and the boundaries of contiguous KYC settlements.
Urbansci 05 00048 g0a1
Figure A2. Difference in multiple-time point gridded population estimates in 134 slum settlements for (a) GPWv4.11 between 2015 and 2020, (b) WorldPop-Unconstrained between 2015 and 2018, and (c) LandScan between 2015 and 2018.
Urbansci 05 00048 g0a2
Figure A3. Visuals of the largest KYC reported populations in (a) Lagos, (b) Port Harcourt, and (c) Nairobi, and settlements with larger median gridded population estimates than KYC populations in (d) Lagos, and (e,f) Nairobi.
Urbansci 05 00048 g0a3aUrbansci 05 00048 g0a3bUrbansci 05 00048 g0a3cUrbansci 05 00048 g0a3dUrbansci 05 00048 g0a3e
Figure A4. Full graph of gridded population estimates versus KYC reported populations in Nairobi slum settlements 2013–2016.
Urbansci 05 00048 g0a4
Table A1. Reported versus digitized boundary area for settlements in which area was reported.
Community IDCityKYC Reported Area (m2)Digitized Area (m2)Percent Differences
25Lagos33,872330,010−89.7
17Lagos121,403198,646−38.9
5Lagos28,32744,746−36.7
23Lagos327,789498,470−34.2
26Lagos27,67238,420−28.0
4Lagos19,89826,625−25.3
12Lagos28,32737,590−24.6
24Lagos92,509118,020−21.6
35Lagos32,37439,431−17.9
28Lagos137,591165,710−17.0
29Lagos28,32732,712−13.4
6Lagos52,60860,694−13.3
8Lagos153,778163,400−5.9
30Lagos291,368298,186−2.3
32Lagos190,199189,8490.2
33Lagos28,32726,0428.8
31Lagos153,778141,3658.8
9Lagos586,783503,45816.6
21Lagos352,070250,46340.6
27Lagos145,68496,50951.0
71Port Harcourt13,79520,051−31.2
69Port Harcourt704910,194−30.8
62Port Harcourt46215941−22.2
43Port Harcourt74919356−19.9
45Port Harcourt27,32032,139−15.0
44Port Harcourt29,11733,625−13.4
75Port Harcourt62,61670,861−11.6
36Port Harcourt44,51549,549−10.2
67Port Harcourt65487144−8.3
72Port Harcourt37,57040,358−6.9
64Port Harcourt30,92533,172−6.8
56Port Harcourt71107171−0.8
51Port Harcourt72,84268,5716.2
117Nairobi4741149,083−96.8
121Nairobi53,529586,783−90.9
91Nairobi743948,157−84.6
110Nairobi49,193182,105−73.0
106Nairobi32,81260,702−45.9
128Nairobi89,081153,778−42.1
145Nairobi65,136105,216−38.1
126Nairobi57,58789,758−35.8
147Nairobi876512,140−27.8
108Nairobi891512,140−26.6
119Nairobi423,363526,608−19.6
88Nairobi35,12440,468−13.2
77Nairobi15,60217,280−9.7
132Nairobi76,64083,849−8.6
105Nairobi64,00169,605−8.0
90Nairobi30,99932,374−4.2
81Nairobi96,13799,199−3.1
83Nairobi159,054161,871−1.7
135Nairobi55,93356,655−1.3
78Nairobi52,03252,608−1.1
137Nairobi30,44330,756−1.0
146Nairobi43,38143,705−0.7
93Nairobi72,43472,842−0.6
111Nairobi173,058174,012−0.5
136Nairobi305,970307,555−0.5
129Nairobi93,44793,885−0.5
100Nairobi80,56880,936−0.5
120Nairobi173,564174,012−0.3
124Nairobi20,27420,2340.2
112Nairobi16,24616,1870.4
144Nairobi42,35040,4684.7
95Nairobi116,941109,6686.6
103Nairobi129,265116,58810.9
104Nairobi6010522015.1
143Nairobi8224700117.5
79Nairobi44,31936,42121.7
87Nairobi29,72624,28122.4
142Nairobi39,99431,64626.4
107Nairobi16,16912,14033.2
138Nairobi37,01727,11336.5
99Nairobi124,88689,02940.3
134Nairobi5689404740.6
113Nairobi18,63812,14053.5
96Nairobi76,18448,56156.9
127Nairobi53,74332,90063.4
130Nairobi13,301793267.7
80Nairobi47,75928,32768.6
76Nairobi148,88584,98275.2
98Nairobi222,377121,40383.2
85Nairobi16,8498094108.2
86Nairobi32,81812,140170.3
109Nairobi66,20616,187309.0
114Nairobi59,61911,048439.6
94Nairobi92,36212,140660.8
123Nairobi77,8888094862.3
133Nairobi47,05640471062.8
Table A2. Population densities in 200 × 200 m areas across 118 KYC slum settlements as well as 200 × 200 m cells citywide in Lagos (Nigeria), Port Harcourt (Nigeria), and Nairobi (Kenya).
200 × 200 m UnitsLagos MaximumPort Harcourt MaximumNairobi Maximum
KYC Slum Settlements12,12313,88534,760
Citywide
HRSL (2018)4874417514,771
WP-Constrained (2020)498312208905
WP-Unconstrained (2018)44356569519
WP-Unconstrained (2015)39745829088
GHS-POP (2015)303515309403
GPWv4.11 (2020)40102266632
GPWv4.11 (2015)35371995718
LandScan (2015)500711652782
LandScan (2018)470912301846
GRID3 (2016)36851128n/a
WPE (2016)26198151311
WP-PeanutButter (2020)1424992866
Figure A5. Comparison of gridded population estimates and KYC reported population in select settlements with severe gridded population underestimates for (a,b) Lagos, (c,d) Port Harcourt, and (e,f) Nairobi.
Urbansci 05 00048 g0a5aUrbansci 05 00048 g0a5b
Figure A6. Comparison of gridded population estimates and KYC reported population in select settlements with at least one sizable gridded population overestimate for (a,b) Lagos, (c) Port Harcourt, and (df) Nairobi.
Urbansci 05 00048 g0a6aUrbansci 05 00048 g0a6b

References

  1. UN Department of Economic and Social Affairs (UN-DESA). World Urbanization Prospects: The 2018 Revision. Available online: https://population.un.org/wup/DataQuery/ (accessed on 13 June 2021).
  2. Satterthwaite, D. Working Paper No. 2010/28 Urban Myths and the Misuse of Data That Underpin Them; United Nations University World Institute for Development Economics Research: Helsinki Finland, 2010; ISBN 9789292302634. [Google Scholar]
  3. UN Human Settlements Programme (UN-Habitat). World Cities Report 2020: The Value of Sustainable Urbanization; UN-Habitat: Nairobi, Kenya, 2020; ISBN 9788578110796. [Google Scholar]
  4. Potts, D. Broken Cities: Inside the Global Housing Crisis; Zed Press: London UK, 2020; ISBN 9781786990549. [Google Scholar]
  5. Thomson, D.R.; Bhattarai, R.; Khanal, S.; Manandhar, S.; Dhungel, R.; Gajurel, S.; Hicks, J.P.; Duc, D.M.; Ferdoush, J.; Ferdous, T.; et al. Addressing unintentional exclusion of vulnerable and mobile households in traditional surveys in Kathmandu, Dhaka, and Hanoi: A mixed-methods feasibility study. J. Urban Health 2021, 98, 111–129. [Google Scholar] [CrossRef] [PubMed]
  6. Mahapatra, P.; Shibuya, K.; Lopez, A.D.; Coullare, F.; Notzon, F.C.; Rao, C.; Szreter, S. Civil registration systems and vital statistics: Successes and missed opportunities. Lancet 2007, 370, 1653–1663. [Google Scholar] [CrossRef]
  7. Lucci, P.; Bhatkal, T.; Khan, A. Are we underestimating urban poverty? World Dev. 2018, 103, 297–310. [Google Scholar] [CrossRef]
  8. United Nations Statistics Division (UNSD). 2020 World Population and Housing Census Programme. Available online: https://unstats.un.org/unsd/demographic-social/census/censusdates/ (accessed on 13 June 2021).
  9. Ahonsi, B.A. Deliberate falsification and census-data in Nigeria. Afr. Aff. 1988, 87, 553–562. [Google Scholar] [CrossRef]
  10. Okolo, A. The Nigerian Census: Problems and prospects. Am. Stat. 1999, 53, 321–325. [Google Scholar]
  11. Yin, S. Objections Surface over Nigerian Census Results. Available online: www.prb.org/resources/objections-surface-over-nigerian-census-results/ (accessed on 13 June 2021).
  12. Habitat for Humanity Great Britain the World’s largest slums: Dharavi, Kibera, Khayelitsha & Neza. Available online: www.habitatforhumanity.org.uk/blog/2017/12/the-worlds-largest-slums-dharavi-kibera-khayelitsha-neza/ (accessed on 13 June 2021).
  13. Kenya National Bureau of Statistics (KNBS). The 2009 Kenya Population and Housing Census—Volume I A; Kenya National Bureau of Statistics (KNBS): Nairobi, Kenya, 2010; ISBN 9789966767202. [Google Scholar]
  14. Desgroppes, A.; Taupin, S. Kibera: The biggest slum in Africa? East Afr. Rev. 2011, 44, 23–33. [Google Scholar]
  15. Erulkar, A.S.; Matheka, J.K. Adolescence in the Kibera Slums of Nairobi Kenya. Available online: https://knowledgecommons.popcouncil.org/departments_sbsr-pgy/1212/ (accessed on 13 June 2021).
  16. Thomson, D.R.; Kuffer, M.; Boo, G.; Hati, B.; Grippa, T.; Elsey, H.; Linard, C.; Mahabir, R.; Kyobutungi, C.; Maviti, J.; et al. Need for an integrated deprived area “slum” mapping system (IDEAMAPS) in low- and middle-income countries (LMICs). Soc. Sci. 2020, 9, 80. [Google Scholar] [CrossRef]
  17. POPGRID. Data Collaborative POPGRID. Available online: www.popgrid.org (accessed on 13 June 2021).
  18. Lang, S.; Füreder, P.; Riedler, B.; Wendt, L.; Braun, A.; Tiede, D.; Schoepfer, E.; Zeil, P.; Spröhnle, K.; Kulessa, K.; et al. Earth observation tools and services to increase the effectiveness of humanitarian assistance. Eur. J. Remote Sens. 2020, 53, 67–85. [Google Scholar] [CrossRef] [Green Version]
  19. Ramadan, R.A. Big Data Tools-An Overview. Int. J. Comput. Softw. Eng. 2017, 2, 125. [Google Scholar] [CrossRef] [Green Version]
  20. Yan, Y.; Feng, C.C.; Huang, W.; Fan, H.; Wang, Y.C.; Zipf, A. Volunteered geographic information research in the first decade: A narrative review of selected journal articles in GIScience. Int. J. Geogr. Inf. Sci. 2020, 34, 1765–1791. [Google Scholar] [CrossRef]
  21. Utazi, C.E.; Wagai, J.; Pannell, O.; Cutts, F.T.; Rhoda, D.A.; Ferrari, M.J.; Dieng, B.; Oteri, J.; Danovaro-Holliday, M.C.; Adeniran, A.; et al. Geospatial variation in measles vaccine coverage through routine and campaign strategies in Nigeria: Analysis of recent household surveys. Vaccine 2020, 38, 3062–3071. [Google Scholar] [CrossRef] [PubMed]
  22. Wigley, A.S.; Tejedor-Garavito, N.; Alegana, V.; Carioli, A.; Ruktanonchai, C.W.; Pezzulo, C.; Matthews, Z.; Tatem, A.J.; Nilsen, K. Measuring the availability and geographical accessibility of maternal health services across sub-Saharan Africa. BMC Med. 2020, 18, 1–10. [Google Scholar] [CrossRef]
  23. De Bono, A.; Mora, M.G. A global exposure model for disaster risk assessment. Int. J. Disaster Risk Reduct. 2014, 10, 442–451. [Google Scholar] [CrossRef]
  24. Thomson, D.R.; Rhoda, D.A.; Tatem, A.J.; Castro, M.C. Gridded population survey sampling: A systematic scoping review of the field and strategic research agenda. Int. J. Health Geogr. 2020, 19, 34. [Google Scholar] [CrossRef]
  25. Leyk, S.; Gaughan, A.E.; Adamo, S.B.; de Sherbinin, A.; Balk, D.; Freire, S.; Rose, A.; Stevens, F.R.; Blankespoor, B.; Frye, C.; et al. Allocating people to pixels: A review of large-scale gridded population data products and their fitness for use. Earth Syst. Sci. Data Discuss. 2019, 11, 1385–1409. [Google Scholar] [CrossRef] [Green Version]
  26. United Nations Department of Economic and Social Affairs (UN-DESA). Sustainable Development Goals. Available online: https://sustainabledevelopment.un.org/sdgs (accessed on 13 June 2021).
  27. World Population Review (WPR). World Cities. Available online: https://worldpopulationreview.com/world-cities (accessed on 13 June 2021).
  28. Badmos, O.S.; Callo-Concha, D.; Agbola, B.; Rienow, A.; Badmos, B.; Greve, K.; Jürgens, C. Determinants of residential location choices by slum dwellers in Lagos megacity. Cities 2020, 98, 102589. [Google Scholar] [CrossRef]
  29. Opoko, A.P.; Oluwatayo, A. Trends in urbanisation: Implication for planning and low-income housing delivery in Lagos, Nigeria. Archit. Res. 2014, 4, 15–26. [Google Scholar]
  30. Emordi, E.; Osiki, O. Lagos: The ‘villagized’ city. Inf. Soc. Justice J. 2008, 2, 95–109. [Google Scholar]
  31. Jones, M. Nigeria Housing: “I Live in a Floating Slum” in Lagos. BBC News, 5 March 2020. [Google Scholar]
  32. Obafemi, A.A.; Odubo, T. V Waterfronts redevelopments in Port Harcourt metropolis: Issues and socio-economic implications for urban environmental management. Int. J. Eng. Sci. 2013, 2, 1–14. [Google Scholar]
  33. African Population and Health Research Center (APHRC). Population and Health Dynamics in Nairobi’s Informal Settlements: Report of the Nairobi Cross-Sectional Slums Survey (NCSS). 2012. Available online: https://assets.publishing.service.gov.uk/media/57a089f240f0b64974000338/NCSS2-FINAL-Report.pdf (accessed on 13 June 2021).
  34. Panek, J.; Sobotova, L. Community mapping in urban informal settlements: Examples from Nairobi, Kenya. Electron. J. Inf. Syst. Dev. Ctries. 2015, 68, 1–13. [Google Scholar] [CrossRef]
  35. Meredith, T.; MacDonald, M.; Kwach, H.; Waikuru, E.; Alabaster, G. Partnerships for successes in slum upgrading: Local governance and social change in Kibera, Nairobi. In Land Issues for Urban Governance in Sub-Saharan Africa; Home, R., Ed.; Springer International Publishing: Chelmsford UK, 2021; pp. 237–255. ISBN 978-3-030-52504-0. [Google Scholar]
  36. Otiso, K.M. Evictions in Nairobi: Why the City Has a Problem and What Can Be Done to Fix It. Available online: https://theconversation.com/evictions-in-nairobi-why-the-city-has-a-problem-and-what-can-be-done-to-fix-it-100255 (accessed on 13 June 2021).
  37. Nnoko-Mewanu, J.; Abdi, N. Nairobi Evicts 8000 People amidst a Pandemic and Curfew. Available online: www.hrw.org/news/2020/06/10/nairobi-evicts-8000-people-amidst-pandemic-and-curfew (accessed on 13 June 2021).
  38. Bhalla, N. Forced Evictions Leave 5000 Kenyan Slum Dwellers at Risk of Coronavirus. Available online: https://uk.reuters.com/article/us-health-coronavirus-kenya-homelessness/forced-evictions-leave-5000-kenyan-slum-dwellers-at-risk-of-coronavirus-idUSKBN22I1VC (accessed on 13 June 2021).
  39. Slum/Shack Dwellers International (SDI) Know Your City. Available online: http://knowyourcity.info/explore-our-data/ (accessed on 13 June 2021).
  40. Slum/Shack Dwellers International (SDI) Know Your City: Slum Dwellers Count. Available online: https://sdinet.org/wp-content/uploads/2018/02/SDI_StateofSlums_LOW_FINAL.pdf (accessed on 13 June 2021).
  41. Badmos, O.; Rienow, A.; Callo-Concha, D.; Greve, K.; Jürgens, C. Simulating slum growth in Lagos: An integration of rule based and empirical based model. Comput. Environ. Urban Syst. 2019, 77, 101369. [Google Scholar] [CrossRef]
  42. Badmos, O.S.; Rienow, A.; Callo-Concha, D.; Greve, K.; Jürgens, C. Urban development in West Africa-monitoring and intensity analysis of slum growth in Lagos: Linking pattern and process. Remote Sens. 2018, 10, 1044. [Google Scholar] [CrossRef] [Green Version]
  43. Mennis, J. Generating surface models of population using dasymetric mapping. Prof. Geogr. 2003, 55, 31–42. [Google Scholar]
  44. Center for International Earth Science Information Network—CIESIN—Columbia University Gridded Population of the World, Version 4.11 (GPWv4.11). Available online: https://doi.org/10.7927/H4F47M65 (accessed on 13 June 2021).
  45. Doxsey-Whitfield, E.; MacManus, K.; Adamo, S.B.; Pistolesi, L.; Squires, J.; Borkovska, O.; Baptista, S.R. Taking advantage of the improved availability of census data: A first look at the Gridded Population of the World, Version 4. Pap. Appl. Geogr. 2015, 1, 226–234. [Google Scholar] [CrossRef]
  46. European Commission Joint Research Centre (EC-JRC). Global Human Settlement Population Model (GHS-POP). Available online: https://ghsl.jrc.ec.europa.eu/data.php (accessed on 13 June 2021).
  47. Pesaresi, M.; Ehrlich, D.; Florczyk, A.J.; Freire, S.; Julea, A.; Kemper, T.; Soille, P.; Syrris, V. Operating Procedure for the Production of the Global Human Settlement Layer from Landsat Data of the Epochs 1975, 1990, 2000, and 2014; European Commission Joint Research Centre: Ispra, Italy, 2016; ISBN 9789279550126. [Google Scholar]
  48. Tiecke, T.G.; Liu, X.; Zhang, A.; Gros, A.; Li, N.; Yetman, G.; Kilic, T.; Murray, S.; Blankespoor, B.; Prydz, E.B.; et al. Mapping the World Population One Building at a Time. arxiv 2017, arXiv:1712.05839. [Google Scholar]
  49. Facebook Connectivity Lab; CIESIN—Columbia University High Resolution Settlement Layer (HRSL). Available online: https://data.humdata.org/dataset/highresolutionpopulationdensitymaps (accessed on 13 June 2021).
  50. Dobson, J.E.; Brlght, E.A.; Coleman, P.R.; Worley, B.A.; Bright, E.A.; Coleman, P.R.; Durfee, R.C.; Worley, B.A. LandScan: A global population database for estimating populations at risk. Photogramm. Eng. Remote Sens. 2000, 66, 849–857. [Google Scholar]
  51. Oak Ridge National Laboratories (ORNL). LandScan. Available online: https://landscan.ornl.gov/landscan-data-availability (accessed on 13 June 2021).
  52. Frye, C.; Nordstrand, E.; Wright, D.J.; Terborgh, C.; Foust, J. Using classified and unclassified land cover data to estimate the footprint of human settlement. Data Sci. J. 2018, 17, 1–12. [Google Scholar] [CrossRef]
  53. Stevens, F.R.; Gaughan, A.E.; Linard, C.; Tatem, A.J. Disaggregating census data for population mapping using random forests with remotely-sensed and ancillary data. PLoS ONE 2015, 10, e0107042. [Google Scholar] [CrossRef] [Green Version]
  54. Linard, C.; Gilbert, M.; Tatem, A.J. Assessing the use of global land cover data for guiding large area population distribution modelling. GeoJournal 2011, 76, 525–538. [Google Scholar] [CrossRef] [Green Version]
  55. Lloyd, C.T.; Chamberlain, H.; Kerr, D.; Yetman, G.; Pistolesi, L.; Stevens, F.R.; Gaughan, A.E.; Nieves, J.J.; Hornby, G.; MacManus, K.; et al. Global spatio-temporally harmonised datasets for producing high-resolution gridded population distribution datasets. Big Earth Data 2019, 3, 108–139. [Google Scholar] [CrossRef] [Green Version]
  56. Maxar Satellite Imagery. Available online: www.maxar.com/products/satellite-imagery (accessed on 13 June 2021).
  57. Nieves, J.J.; Bondarenko, M.; Sorichetta, A.; Steele, J.E.; Kerr, D.; Carioli, A.; Stevens, F.R.; Gaughan, A.E.; Tatem, A.J. Predicting near-future built-settlement expansion using relative changes in small area populations. Remote Sens. 2020, 12, 1545. [Google Scholar] [CrossRef]
  58. Leasure, D.R.; Dooley, C.A.; Bondarenko, M.; Tatem, A.J. peanutButter: An R Package to Produce Rapid-Response Gridded Population Estimates from Building Footprints, Version 0.3.0. Available online: https://apps.worldpop.org/peanutButter/ (accessed on 13 June 2021).
  59. CIESIN; UNFPA; WorldPop; Flowminder. Geo-Referenced Infrastructure and Demographic Data for Development (GRID3). Available online: www.grid3.org (accessed on 13 June 2021).
  60. Leasure, D.R.; Jochem, W.C.; Weber, E.M.; Seaman, V.; Tatem, A.J. National population mapping from sparse survey data: A hierarchical Bayesian modeling framework to account for uncertainty. Proc. Natl. Acad. Sci. USA 2020, 117, 24173–24179. [Google Scholar] [CrossRef] [PubMed]
  61. Oak Ridge National Laboratories (ORNL). LandScan HD: Human Settlement Mapping at Global Scale. Available online: www.youtube.com/watch?v=P84vxTT9Vos (accessed on 13 June 2021).
  62. POPGRID. Global Population Grids: Summary Characteristics. Available online: www.popgrid.org/data-docs-table1 (accessed on 13 June 2021).
  63. WorldPop. Population Counts 2000–2020 UN-Adjusted Unconstrained 100 m. Available online: www.worldpop.org/geodata/listing?id=69 (accessed on 13 June 2021).
  64. WorldPop. Population Counts 2020 UN-Adjusted Constrained 100 m. Available online: www.worldpop.org/geodata/listing?id=79 (accessed on 13 June 2021).
  65. WorldPop. Top-Down Estimation Modelling: Constrained vs. Unconstrained. Available online: www.worldpop.org/methods/top_down_constrained_vs_unconstrained (accessed on 13 June 2021).
  66. GRID3 [Nigeria]. National Population Estimates v1.2. Available online: https://grid3.org/resources/data (accessed on 13 June 2021).
  67. National Population Commission (NPC); ICF. International Nigeria Demographic and Health Survey. 2013. Available online: https://dhsprogram.com/pubs/pdf/fr293/fr293.pdf (accessed on 13 June 2021).
  68. UN Human Settlements Programme (UN-Habitat). Slums: Some Definitions. Available online: http://mirror.unhabitat.org/documents/media_centre/sowcr2006/SOWCR5.pdf (accessed on 13 June 2021).
  69. Fink, G.; Günther, I.; Hill, K. Slum residence and child health in developing countries. Demography 2014, 51, 1175–1197. [Google Scholar] [CrossRef] [PubMed]
  70. Nolan, L.B. Slum definitions in urban India: Implications for the measurement of health inequalities. Popul. Dev. Rev. 2015, 41, 59–84. [Google Scholar] [CrossRef] [Green Version]
  71. ICF International Available Datasets. Available online: https://dhsprogram.com/data/available-datasets.cfm (accessed on 13 June 2021).
  72. Hennigen de Mattos, A.C.; McArdle, G.; Bertolotto, M. Assessing the quality of gridded population data for quantifying the population living in deprived communities. In Proceedings of the 34th Conference on Neural Information Processing Systems, Vancouver, BC, Canada, 6–12 December 2020; pp. 4–9. [Google Scholar]
  73. Bangladesh Bureau of Statistics (BBS). Census of Slum Areas and Floating Population Programe 2014; Bangladesh Bureau of Statistics (BBS): Dhaka, Bangladesh, 2015; ISBN 978-984-33-9608-2. [Google Scholar]
  74. Sen, S.; Hobson, J.; Joshi, P. The Pune Slum Census: Creating a socio-economic and spatial information base on a GIS for integrated and inclusive city development. Habitat Int. 2003, 27, 595–611. [Google Scholar] [CrossRef]
  75. Mahabir, R.; Croitoru, A.; Crooks, A.; Agouris, P.; Stefanidis, A. A critical review of high and very high-resolution remote sensing approaches for detecting and mapping slums: Trends, challenges and emerging opportunities. Urban Sci. 2018, 2, 8. [Google Scholar] [CrossRef] [Green Version]
  76. Bird, J.; Montebruno, P.; Regan, T. Life in a slum: Understanding living conditions in Nairobi’s slums across time and space. Oxford Rev. Econ. Policy 2017, 33, 496–520. [Google Scholar] [CrossRef]
  77. Nieves, J.J.; Stevens, F.R.; Gaughan, A.E.; Linard, C.; Sorichetta, A.; Hornby, G.; Patel, N.N.; Tatem, A.J. Examining the correlates and drivers of human population distributions across low- and middle-income countries. J. R. Soc. Interface 2017, 14, 20170401. [Google Scholar] [CrossRef] [Green Version]
  78. USA National Oceanic and Atmospheric Administration (NOAA). Version 4 DMSP-OLS Nighttime Lights Time Series. Available online: www.ngdc.noaa.gov/eog/dmsp/downloadV4composites.html (accessed on 13 June 2021).
  79. Zhang, Q.; Pandey, B.; Seto, K.C. A robust method to generate a consistent time series from DMSP/OLS nighttime light data. IEEE Trans. Geosci. Remote Sens. 2016, 54, 5821–5831. [Google Scholar] [CrossRef]
  80. Kim-Blanco, P.; Cîrlugea, B.-M.; Sherbinin, A. De Working Paper. Quality assessment of crowd-sourced data: OpenStreetMap roads validation in the developing countries of West Africa. Int. Sci. Counc. 2018, 1–26. [Google Scholar] [CrossRef]
  81. Microsoft Building Footprints. Available online: www.microsoft.com/en-us/maps/building-footprints (accessed on 13 June 2021).
  82. WorldPop. WorldPop Open Population Repository—Buildings. Available online: https://wopr.worldpop.org/?/Buildings (accessed on 13 June 2021).
  83. Sinha, P.; Gaughan, A.E.; Stevens, F.R.; Nieves, J.J.; Sorichetta, A.; Tatem, A.J. Assessing the spatial sensitivity of a random forest model: Application in gridded population modeling. Comput. Environ. Urban Syst. 2019, 75, 132–145. [Google Scholar] [CrossRef]
  84. Thomson, D.R.; Leasure, D.R.; Bird, T.J.; Tzavidis, N.; Tatem, A.J. How accurate are WorldPop-Global-Unconstrained gridded population data at the cell-level? A simulation analysis in urban Namibia. Preprints 2021, 1–38. [Google Scholar] [CrossRef]
Figure 1. Map of three study cities.
Urbansci 05 00048 g001
Figure 2. Lagos Nigeria (n = 32), Port Harcourt Nigeria (n = 39), and Nairobi Kenya (n = 63) slum settlements in KYC dataset.
Urbansci 05 00048 g002
Figure 3. Lagos State (Nigeria) slum layer used to compare gridded population estimates of SDG 11.1.1 (printed with permission from Badmos and team (2019)). Red = slum, grey = non-slum or unsettled.
Urbansci 05 00048 g003
Figure 4. Visual comparison of nine gridded population datasets in their native resolutions for an area along the Lagos Lagoon (Nigeria). Dark orange = higher population density, white = zero population estimate. (a) Gridded Population of the World by Columbia University’s Center for International Earth Science Information Network (CIESIN). (b) Global Human Settlement Population Layer by the European Commission Joint Research Centre. (c) High Resolution Settlement Layer by the Facebook Connectively Lab and CIESIN. (d) WorldPop Global Unconstrained by the WorldPop team at University of Southampton. (e) LandScan Global by the U.S. Oak Ridge National Laboratory. (f) World Population Estimates by ESRI. (g) WorldPop Global Constrained by the WorldPop team at University of Southampton. (h) peanutButter algorithm by University of Southampton to estimate population counts from building footprints. (i) Geo-Referenced Infrastructure and Demographic Data for Development estimates by WorldPop, CIESIN, Flowminder Foundation, and UN Population Fund with funding from the Bill & Melinda Gates Foundation and UK Department for International Development.
Urbansci 05 00048 g004
Figure 5. Know Your City reported population versus gridded population estimates in 118 slum settlements across Lagos (Nigeria), Port Harcourt (Nigeria), and Nairobi (Kenya). Only gridded population estimates and KYC reported populations aligned in the same time period are reported. Population comparisons in (a) Lagos 2013–2016, (b) Lagos 2017–2020, (c) Port Harcourt 2013–2016, (d) Port Harcourt 2017–2020, (e) Nairobi 2013–2016, and (f) Nairobi 2017–2020.
Urbansci 05 00048 g005
Table 2. Summary of error in nine gridded population datasets across 118 Lagos (Nigeria), Port Harcourt (Nigeria), and Nairobi (Kenya) slum settlements compared to field-referenced population counts reported by Know Your City (KYC). Gridded population datasets ordered by most-to-least accurate.
DatasetMAERMSEBiasMFDataset Characteristics
HRSL32654958−28530.392018Top-downLightly modelledConstr.~30 × 30 m
WorldPop Constrained34915001−29420.272020Top-downHighly modelledConstr.~100 × 100 m
GRID3 (Nigeria only)33665296−33660.212016Bottom-upHighly modelledConstr.~100 × 100 m
WorldPop PeanutButter35865073−35710.212020Bottom-upUn-modelledConstr.~100 × 100 m
WorldPop Unconstrained604810,889−58990.112015, 2018Top-downHighly modelledUnconstr.~100 × 100 m
GPW4v.11618911,482−58920.122015, 2020Top-downUn-modelledUnconstr.~1 × 1 km
LandScan608712,121−60320.122015, 2018Top-downHighly modelledConstr.~1 × 1 km
GHS-POP707912,854−70000.152015Top-downLightly modelledConstr.~250 × 250 m
WPE765314,422−76380.092016Top-downHighly modelledConstr.162 × 162 m
Table 3. Count and percent of the Lagos population living in slum settlements (SDG 11.1.1) as estimated by gridded population datasets, with estimates ordered from highest to lowest. UN-Habitat estimate of SDG 11.1.1 presented for comparison.
DatasetSlum Pop nSlum Pop %Total Pop NDataset Characteristics
GRID3293,8582.969,929,1402016Bottom-upHighly modelledConstrained~100 × 100 m
WorldPop PeanutButter211,2362.917,257,1262020Bottom-upUn-modelledConstrained~100 × 100 m
LandScan336,2881.7619,108,7562018Top-downHighly modelledConstrained~1 × 1 km
WorldPop Constrained229,4461.7313,254,8202020Top-downHighly modelledConstrained~100 × 100 m
HRSL233,6181.6614,040,7512018Top-downLightly modelledConstrained~30 × 30 m
WPE181,3261.6511,021,5962016Top-downHighly modelledConstrained162 × 162 m
GHS-POP150,0591.3411,168,5262015Top-downLightly modelledConstrained~250 × 250 m
WorldPop Unconstrained161,8651.3412,104,2642018Top-downHighly modelledUnconstrained~100 × 100 m
GPW4v.11154,7421.0215,184,1762020Top-downUn-modelledUnconstrained~1 × 1 km
UN-Habitat--56.0--2018Calculated from 2018 Nigeria DHS [71] using the UN-Habitat “slum household” approach [68]
Table 4. Recommendations to potentially improve gridded population estimates in slums and informal settlements.
RecommendationsGPWv4.11GHS-POPHRSLWPELandScanWP-UncontrWP-ConstrWP-PeanutB
Classify building footprints or built-up areas as residential versus non-residential XXXXXXX
Improve GHS-BUILT layer with building footprint data to refine population disaggregation X
Consider highly modelled methods with use of multiple spatial covariates to inform the allocation of population densities to cells X
Use covariate(s) derived from a building footprint layer, and if possible:
  • Classify non-residential buildings, and incorporate this covariate as well
  • Create and use covariate(s) the reflect buildings surrounding each cell
XXXX
If (or when) a global layer of deprived areas is developed, either:
  • Use deprived area layer as a covariate
  • Use deprived area layer to stratify the model in slum/non-slum areas
XXXXX
Retrain BaseVue on a global dataset, or use an alternative land X
Use covariates common to other highly modelled datasets, such as roads, nigh time lights, slope, and elevation X
Use a deprived area layer to update LandScan’s bespoke weighting layer X
Incorporate KYC population estimates and boundaries (or other slum dataset) in model training data XX
Improve building feature extraction algorithms in slums X
Publisher’s Note: MDPI stays neutral with regard to jurisdictional claims in published maps and institutional affiliations.

