How Will the COVID-19 Pandemic Affect the Future of Urban Life? Early Evidence from Highly-Educated Respondents in the United States


Abstract
1. Introduction
2. Methods
3. Results
3.1. The Sample
3.2. Pandemic Experience
3.3. Working from Home
3.4. Shopping, Dining, and Deliveries
3.5. Daily Travel
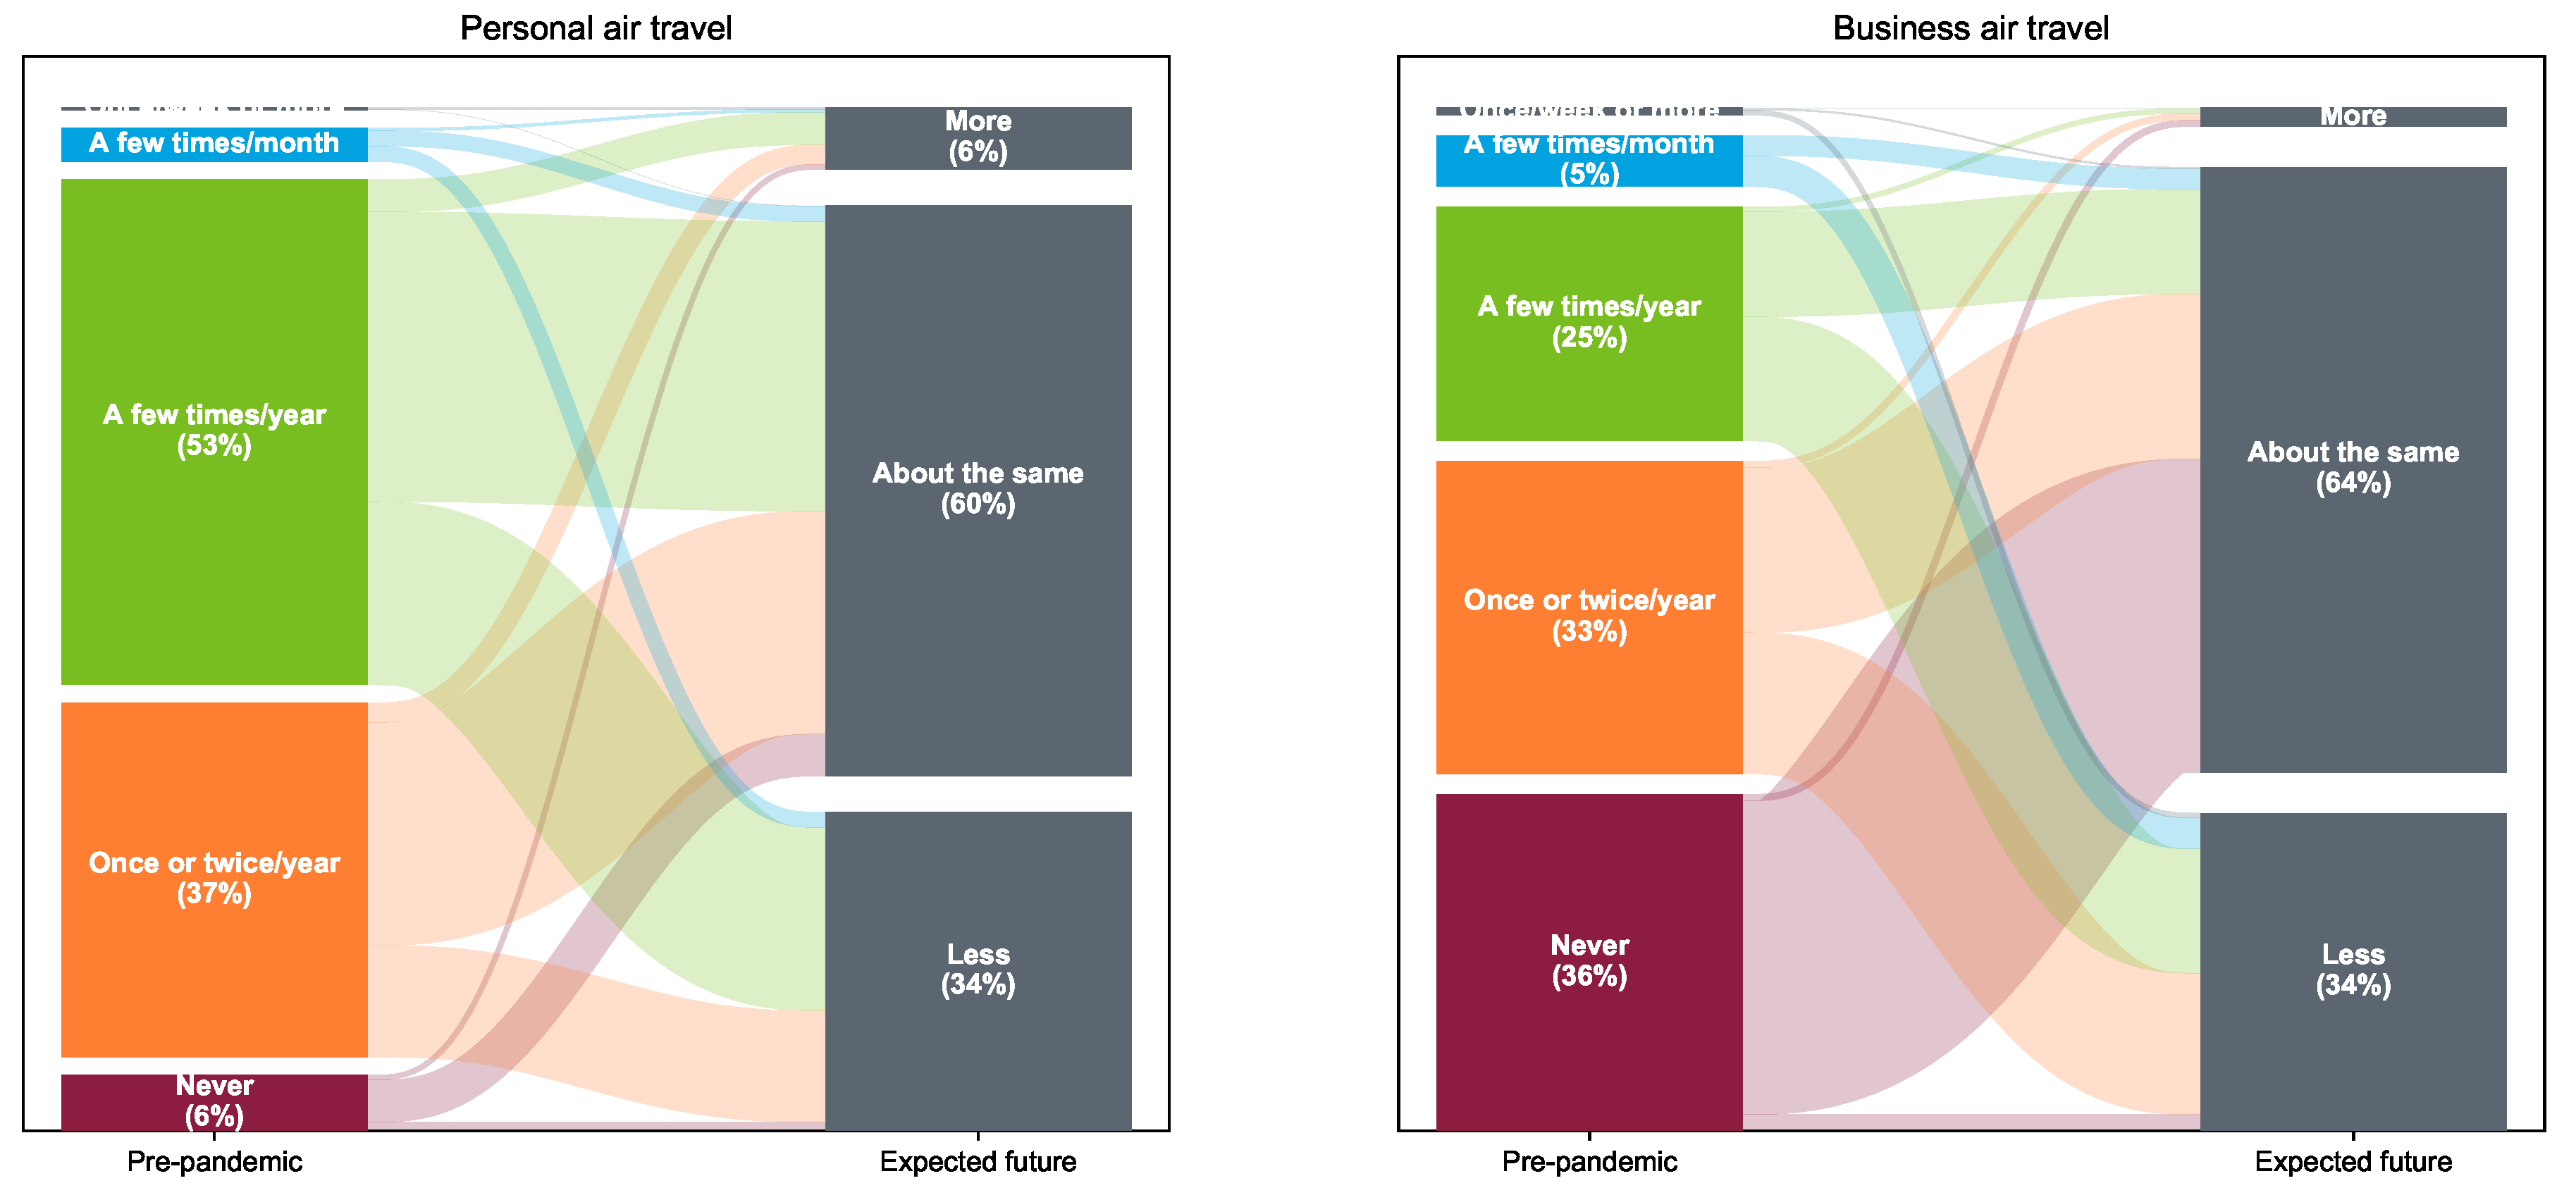
3.6. Air Travel
3.7. Students
3.8. Attitudes
4. Discussion
4.1. Real Estate
4.2. Traffic Congestion
4.3. Environmental Outcomes
5. Conclusions and Future Research
Author Contributions
Funding
Conflicts of Interest
Appendix A

| COVID-19-Concerned | Environmentalist/City-Lover | Anti-Working from Home | Pro-Videoconferencing | Extrovert | Pro-in-Person-Shopping | |
|---|---|---|---|---|---|---|
| Society is overreacting to the coronavirus | −0.74 | |||||
| Everyone should just stay home as much as possible until the coronavirus has subsided | 0.74 | |||||
| Shutting down businesses to prevent the spread of coronavirus is not worth the | −0.68 | |||||
| economic damage that will result | ||||||
| I am concerned that friends or family members will have a severe reaction to the | 0.46 | |||||
| coronavirus if they catch it | ||||||
| My friends and family expect me to stay at home until the coronavirus subsides | 0.44 | |||||
| If I catch the coronavirus, I am concerned that I will have a severe reaction | 0.38 | |||||
| I am committed to using a less polluting means of transportation | 0.72 | |||||
| (e.g., walking, biking, and public transit) as much as possible | ||||||
| Having shops and services within walking distance of my home is important to me | 0.57 | |||||
| I am committed to an environmentally-friendly lifestyle | 0.55 | |||||
| Sometimes I feel guilty about the effects of my airplane trips on the environment | 0.51 | |||||
| I feel safe on a bus or train † | 0.44 | |||||
| Apartment living does not provide enough privacy | −0.43 | |||||
| I like to have a yard at home. | −0.39 | |||||
| Privacy is important to me when I travel † | −0.31 | |||||
| It is hard to get motivated to work away from the main office | 0.7 | |||||
| I like working from home | −0.65 | |||||
| I enjoy the social interaction found at a conventional workplace | 0.56 | 0.43 | ||||
| Working at home may increase family conflicts | 0.39 | |||||
| The time spent traveling to places provides a useful transition between activities | 0.34 | |||||
| Online learning is a good alternative to high school- and college-level classroom instruction | 0.76 | |||||
| Online learning is a good alternative to elementary-level classroom instruction | 0.66 | |||||
| Video calling is a good alternative to visiting friends and family | 0.58 | |||||
| Video calling is a good alternative to in-person business meetings | 0.48 | |||||
| I like seeing people and having other people around me † | 0.3 | 0.58 | ||||
| I like to work on a team | 0.53 | |||||
| I feel uncomfortable around people I do not know † | −0.43 | |||||
| I like being outside † | 0.43 | |||||
| I enjoy spending time with the people I live with | 0.33 | |||||
| I dislike change | −0.3 | |||||
| In-person shopping is usually a chore for me | −0.56 | |||||
| Even if I do not end up buying anything, I still enjoy going to stores and browsing | 0.55 | |||||
| I would not mind shopping for groceries online | −0.37 |
| Attitudinal Statement |
|---|
| If I catch the coronavirus, I am concerned that I will have a severe reaction |
| I am concerned that friends or family members will have a severe reaction to the coronavirus if they catch it |
| I feel that my community is well prepared for disasters |
| Everyone should just stay home as much as possible until the coronavirus has subsided |
| Society is overreacting to the coronavirus |
| Shutting down businesses to prevent the spread of coronavirus is not worth the economic damage that will result |
| My friends and family expect me to stay at home until the coronavirus subsides |
| When I go to a grocery store, I usually buy only items on my list |
| I would not mind shopping for groceries online |
| I enjoy shopping online for other (non-grocery) items |
| Even if I do not end up buying anything, I still enjoy going to stores and browsing |
| In-person shopping is usually a chore for me |
| I like to work on a team |
| Working at home may increase family conflicts |
| I enjoy the social interaction found at a conventional workplace |
| It is hard to get motivated to work away from the main office |
| I like working from home |
| Learning how to use new technologies is often frustrating |
| Video calling is a good alternative to in-person business meetings |
| Video calling is a good alternative to visiting friends and family |
| Online learning is a good alternative to high school- and college-level classroom instruction |
| Online learning is a good alternative to elementary-level classroom instruction |
| The time spent traveling to places provides a useful transition between activities |
| I like to stay close to home |
| Apartment living doesn’t provide enough privacy |
| Having shops and services within walking distance of my home is important to me |
| I like to have a yard at home. |
| I don’t like to stay in one place for long |
| I dislike change |
| I’m pretty much a workaholic |
| I enjoy spending time with the people I live with |
| I am committed to an environmentally-friendly lifestyle |
| I am committed to using a less polluting means of transportation (e.g., walking, biking, and public transit) as much as possible |
| Sometimes I feel guilty about the effects of my airplane trips on the environment |
| I feel uncomfortable around people I do not know † |
| Privacy is important to me when I travel † |
| I feel safe on a bus or train † |
| I like being outside † |
| I like seeing people and having other people around me † |
| Unconcerned | Videoconferencers | Urban Shoppers | Suburban Office Lovers | Work from Home Extroverts | Grand Total | ||
|---|---|---|---|---|---|---|---|
| Sample Size | n | 172 | 313 | 296 | 204 | 305 | 1290 |
| % | 13.3% | 24.3% | 22.9% | 15.8% | 23.6% | 100.0% | |
| Attitudes † | COVID-19-Concerned | −1.97 | 0.24 | 0.32 | 0.45 | 0.26 | 0.00 |
| Environmentalist/City-lover | −0.42 | −0.02 | 0.73 | −0.90 | 0.16 | 0.00 | |
| Anti-working from home | 0.08 | −0.16 | 0.71 | 0.59 | −0.96 | 0.00 | |
| Pro-videoconferencing | −0.05 | 1.13 | −0.36 | −0.56 | −0.41 | 0.00 | |
| Extrovert | 0.13 | −0.40 | 0.15 | −0.52 | 0.53 | 0.00 | |
| Pro-in-person-shopping | 0.28 | 0.18 | 0.44 | −0.68 | −0.31 | 0.00 | |
| Age | 18–29 | 11.6% | 15.7% | 34.5% | 21.6% | 10.2% | 19.1% |
| 30–39 | 19.8% | 25.9% | 28.0% | 23.0% | 23.9% | 24.7% | |
| 40–49 | 23.8% | 19.2% | 9.8% | 23.0% | 23.6% | 19.3% | |
| 50–59 | 20.9% | 18.2% | 12.2% | 14.2% | 21.0% | 17.2% | |
| 60–69 | 12.8% | 13.4% | 4.7% | 10.3% | 15.4% | 11.3% | |
| 70+ | 2.9% | 4.2% | 5.4% | 2.9% | 2.3% | 3.6% | |
| Age not reported | 8.1% | 3.5% | 5.4% | 4.9% | 3.6% | 4.8% | |
| Average age | 45.75 | 44.74 | 38.28 | 41.92 | 46.11 | 43.28 | |
| Gender | Female | 43.0% | 61.3% | 52.7% | 54.4% | 60.3% | 55.6% |
| Male | 47.1% | 33.9% | 41.6% | 42.6% | 36.4% | 39.4% | |
| Other | 0.0% | 0.6% | 1.0% | 0.5% | 0.0% | 0.5% | |
| Gender not reported | 9.9% | 4.2% | 4.7% | 2.5% | 3.3% | 4.6% | |
| Education | Completed High school or less | 2.3% | 1.0% | 0.3% | 0.5% | 0.0% | 0.7% |
| Some college or technical school | 11.6% | 9.9% | 6.4% | 12.7% | 3.3% | 8.2% | |
| Bachelor’s degree(s) or some graduate school | 36.6% | 40.6% | 30.7% | 29.4% | 30.2% | 33.6% | |
| Completed graduate degree(s) | 40.7% | 46.0% | 58.1% | 52.9% | 63.9% | 53.4% | |
| Education not reported | 8.7% | 2.6% | 4.4% | 4.4% | 2.6% | 4.1% | |
| Income | Less than $25,000 | 4.1% | 6.7% | 6.4% | 5.9% | 2.3% | 5.1% |
| $25,000 to $74,999 | 17.4% | 26.5% | 23.3% | 23.5% | 14.1% | 21.2% | |
| $75,000 to $149,000 | 30.2% | 39.0% | 37.5% | 35.3% | 38.0% | 36.7% | |
| $150,000 or more | 33.7% | 21.4% | 23.6% | 29.9% | 40.3% | 29.4% | |
| Income not reported | 14.5% | 6.4% | 9.1% | 5.4% | 5.2% | 7.7% | |
| Children in household | No | 70.9% | 78.3% | 82.8% | 67.6% | 70.5% | 74.8% |
| Yes | 29.1% | 21.7% | 17.2% | 32.4% | 29.5% | 25.2% |
References
- Kraemer, M.U.; Yang, C.H.; Gutierrez, B.; Wu, C.H.; Klein, B.; Pigott, D.M.; Du Plessis, L.; Faria, N.R.; Li, R.; Hanage, W.P.; et al. The effect of human mobility and control measures on the COVID-19 epidemic in China. Science 2020, 368, 493–497. [Google Scholar] [CrossRef]
- Cartenì, A.; Di Francesco, L.; Martino, M. How mobility habits influenced the spread of the COVID-19 pandemic: Results from the Italian case study. Sci. Total Environ. 2020, 741, 140489. [Google Scholar] [CrossRef] [PubMed]
- Shamshiripour, A.; Rahimi, E.; Shabanpour, R.; Mohammadian, A.K. How is COVID-19 reshaping activity-travel behavior? Evidence from a comprehensive survey in Chicago. Transp. Res. Interdiscip. Perspect. 2020, 7, 100216. [Google Scholar] [CrossRef]
- Gössling, S.; Scott, D.; Hall, C.M. Pandemics, tourism and global change: A rapid assessment of COVID-19. J. Sustain. Tour. 2020, 1–20. [Google Scholar] [CrossRef]
- Owens, S.; Driffill, L. How to change attitudes and behaviours in the context of energy. Energy Policy 2008, 36, 4412–4418. [Google Scholar] [CrossRef]
- Barnes, W.; Gartland, M.; Stack, M. Old habits die hard: Path dependency and behavioral lock-in. J. Econ. Issues 2004, 38, 371–377. [Google Scholar] [CrossRef]
- Polites, G.L.; Karahanna, E. Shackled to the status quo: The inhibiting effects of incumbent system habit, switching costs, and inertia on new system acceptance. MIS Q. 2012, 36, 21–42. [Google Scholar] [CrossRef]
- Kramer, A.; Kramer, K.Z. The potential impact of the Covid-19 pandemic on occupational status, work from home, and occupational mobility. J. Vocat. Behav. 2020, 119, 103442. [Google Scholar] [CrossRef]
- Amekudzi-Kennedy, A.; Labi, S.; Woodall, B.; Chester, M.; Singh, P. Reflections on Pandemics, Civil Infrastructure and Sustainable Development: Five Lessons from COVID-19 through the Lens of Transportation. Preprints 2020. [Google Scholar] [CrossRef]
- Gensler Research Institute. BRIEFING #1: Back to the Office. 2020. Available online: https://www.gensler.com/uploads/document/695/file/Gensler-US-Work-From-Home-Survey-2020-Briefing-1.pdf (accessed on 5 October 2020).
- Massachusetts Competitive Partnership. 100 Business Survey: COVID-19 Remote Work; Technical Report; Massachusetts Competitive Partnership: Boston, MA, USA, 2020; Available online: https://633a9a3b-a223-4c7d-b77d-ce154f6a2f3c.filesusr.com/ugd/5c57db_f5a878bc3bb54bff92d7f8089d977a01.pdf (accessed on 26 August 2020).
- Webber, M.M. The urban place and the nonplace realm. In Explorations into Urban Structure; University of Pennsylvania Press: Philadelphia, PA, USA, 1964; pp. 79–153. [Google Scholar] [CrossRef]
- Sassen, S. The Global City: New York, London, Tokyo, 2nd ed.; Princeton University Press: Princeton, NJ, USA, 2001. [Google Scholar]
- Grashuis, J.; Skevas, T.; Segovia, M.S. Grocery shopping preferences during the COVID-19 pandemic. Sustainability 2020, 12, 5369. [Google Scholar] [CrossRef]
- Nhamo, G.; Dube, K.; Chikodzi, D. Restaurants and COVID-19: A Focus on Sustainability and Recovery Pathways. In Counting the Cost of COVID-19 on the Global Tourism Industry; Springer: Cham, Switzerland, 2020; pp. 205–224. [Google Scholar]
- Bureau of Labor Statistics. Industries at a Glance: Food Services and Drinking Places: NAICS 722. 2020. Available online: https://www.bls.gov/iag/tgs/iag722.htm (accessed on 20 August 2020).
- Berrebi, S.J.; Watkins, K.E. Who’s Ditching the Bus? Transp. Res. Part A Policy Pract. 2020, 136, 21–34. [Google Scholar] [CrossRef]
- Savidge, N. Last-Minute Deal Saves Caltrain Tax. Will Voters Support It? San Jose Mercury News, 6 August 2020. [Google Scholar]
- Taylor, B.D.; Garrett, M.; Iseki, H. Measuring Cost Variability in Provision of Transit Service. Transp. Res. Rec. 2000, 1735, 101–112. [Google Scholar] [CrossRef]
- Pucher, J.; Dijkstra, L. Promoting Safe Walking and Cycling to Improve Public Health: Lessons from the Netherlands and Germany. Am. J. Public Health 2003, 93, 1509–1516. [Google Scholar] [CrossRef] [PubMed]
- Schmitt, A. Right of Way: Race, Class, and the Silent Epidemic of Pedestrian Deaths in America; Island Press: Washington, DC, USA, 2020. [Google Scholar]
- Diaz, J. Cities Close Streets to Cars, Opening Space for Social Distancing. The New York Times, 11 April 2020. [Google Scholar]
- Baruchman, M. Seattle Will Permanently Close 20 Miles of Residential Streets to Most Vehicle Traffic. The Seattle Times, 7 May 2020. [Google Scholar]
- Transportation Security Administration. TSA Checkpoint Travel Numbers for 2020 and 2019. Available online: http://web.archive.org/web/20200515043024/https://www.tsa.gov/coronavirus/passenger-throughput (accessed on 15 May 2015).
- Adrienne, N.; Budd, L.; Ison, S. Grounded aircraft: An airfield operations perspective of the challenges of resuming flights post COVID. J. Air Transp. Manag. 2020, 89, 101921. [Google Scholar] [CrossRef] [PubMed]
- Airlines for America. Tracking the Impacts of COVID-19, Updated 5 October 2020. 2020. Available online: https://www.airlines.org/wp-content/uploads/2020/03/A4A-COVID-Impact-Updates-109.pdf (accessed on 5 October 2020).
- Delta Air Lines. Delta Air Lines 2019 Form 10-K. 2020. Available online: https://s2.q4cdn.com/181345880/files/doc_financials/2019/q4/DAL-12.31.2019-10K-NG-02.12.20-445pm-As-Filed-(1).pdf (accessed on 14 August 2020).
- Aucejo, E.M.; French, J.; Ugalde Araya, M.P.; Zafar, B. The impact of COVID-19 on student experiences and expectations: Evidence from a survey. J. Public Econ. 2020, 191, 104271. [Google Scholar] [CrossRef]
- Mokhtarian, P.L.; Salomon, I. Modeling the Desire to Telecommute: The Importance of Attitudinal Factors in Behavioral Models. Transp. Res. Part A 1997, 31, 35–50. [Google Scholar] [CrossRef]
- Kitamura, R.; Mokhtarian, P.L.; Laidet, L. A Micro-Analysis of Land Use and Travel in Five Neighborhoods in the San Francisco Bay Area. Transportation 1997, 24, 125–158. [Google Scholar] [CrossRef]
- Handy, S.L.; Xing, Y. Factors Correlated with Bicycle Commuting: A Study in Six Small U.S. Cities. Int. J. Sustain. Transp. 2011, 5, 91–110. [Google Scholar] [CrossRef]
- Barajas, J.M. Perceptions, People, and Places: Influences on Cycling for Latino Immigrants and Implications for Equity. J. Plan. Educ. Res. 2019. [Google Scholar] [CrossRef]
- Barron, J. As Office Space Shrinks, So Does Privacy for Workers. The New York Times, 22 February 2015. [Google Scholar]
- Danielsson, C.B.; Chungkham, H.S.; Wulff, C.; Westerlund, H. Office Design’s Impact on Sick Leave Rates. Ergonomics 2014, 57, 139–147. [Google Scholar] [CrossRef]
- Kurgat, E.K.; Sexton, J.D.; Garavito, F.; Reynolds, A.; Contreras, R.D.; Gerba, C.P.; Leslie, R.A.; Edmonds-Wilson, S.L.; Reynolds, K.A. Impact of a Hygiene Intervention on Virus Spread in an Office Building. Int. J. Hyg. Environ. Health 2019, 222, 479–485. [Google Scholar] [CrossRef] [PubMed]
- Viggers, H.; Keall, M.; Wickens, K.; Howden-Chapman, P. Increased House Size Can Cancel out the Effect of Improved Insulation on Overall Heating Energy Requirements. Energy Policy 2017, 107, 248–257. [Google Scholar] [CrossRef]
- Wilson, A.; Boehland, J. Small Is Beautiful: U.S. House Size, Resource Use, and the Environment. J. Ind. Ecol. 2005, 9, 277–287. [Google Scholar] [CrossRef]
- Hirt, S.A. Zoned in the USA: The Origins and Implications of American Land-Use Regulation; Cornell University Press: Ithaca, NY, USA, 2014. [Google Scholar]
- Transportation Research Board. Highway Capacity Manual 2000: Metric Units; National Academies: Washington, DC, USA, 2000. [Google Scholar]
- Downs, A. Stuck in Traffic: Coping with Peak-Hour Traffic Congestion; Brookings Institution Press: Washington, DC, USA, 2000. [Google Scholar]
- Wang, Q.; Su, M. A Preliminary Assessment of the Impact of COVID-19 on Environment—A Case Study of China. Sci. Total Environ. 2020, 728, 138915. [Google Scholar] [CrossRef] [PubMed]
- Muhammad, S.; Long, X.; Salman, M. COVID-19 Pandemic and Environmental Pollution: A Blessing in Disguise? Sci. Total Environ. 2020, 728, 138820. [Google Scholar] [CrossRef] [PubMed]
- Zambrano-Monserrate, M.A.; Ruano, M.A.; Sanchez-Alcalde, L. Indirect Effects of COVID-19 on the Environment. Sci. Total Environ. 2020, 728, 138813. [Google Scholar] [CrossRef] [PubMed]
- International Civil Aviation Organization. Destination Green: The next Chapter; Technical Report; International Civil Aviation Organization: Montreal, QC, Canada, 2019. [Google Scholar]
- Telford, T. British Airways Is Retiring Its Entire Fleet of 747s amid Slump in Air Travel. Washington Post, 17 July 2020. [Google Scholar]
- Jaller, M.; Pahwa, A. Evaluating the Environmental Impacts of Online Shopping: A Behavioral and Transportation Approach. Transp. Res. Part D Transp. Environ. 2020, 80, 102223. [Google Scholar] [CrossRef]
- Couclelis, H. Pizza over the Internet: E-Commerce, the Fragmentation of Activity and the Tyranny of the Region. Entrep. Reg. Dev. 2004, 16, 41–54. [Google Scholar] [CrossRef]
- Mokhtarian, P.L. A Conceptual Analysis of the Transportation Impacts of B2C E-Commerce. Transportation 2004, 31, 257–284. [Google Scholar] [CrossRef]
- Yancy, C.W. COVID-19 and African Americans. JAMA 2020, 323, 1891. [Google Scholar] [CrossRef]
- Webb Hooper, M.; Nápoles, A.M.; Pérez-Stable, E.J. COVID-19 and Racial/Ethnic Disparities. JAMA 2020, 323, 2466. [Google Scholar] [CrossRef] [PubMed]
- Nassiri, V.; Lovik, A.; Molenberghs, G.; Verbeke, G. On Using Multiple Imputation for Exploratory Factor Analysis of Incomplete Data. Behav. Res. Methods 2018, 50, 501–517. [Google Scholar] [CrossRef] [PubMed]


| Survey | Census | ||
|---|---|---|---|
| Education respondents 25 years old or older (n = 1163) | No school completed | – | 1.5% |
| Some grade/high school | 0.3% | 10.2% | |
| Completed high school or GED | 0.4% | 26.9% | |
| Some college or technical school | 7.1% | 28.9% | |
| Bachelor’s degree(s) or some graduate school | 33.2% | 20.0% | |
| Completed graduate degree(s) | 59.1% | 12.6% | |
| Income (n = 1196) | Less than $10,000 | 1.9% | 6.3% |
| $10,000 to $14,999 | 1.1% | 4.3% | |
| $15,000 to $24,999 | 2.5% | 9.0% | |
| $25,000 to $34,999 | 2.9% | 8.9% | |
| $35,000 to $49,999 | 5.8% | 12.4% | |
| $50,000 to $74,999 | 14.2% | 17.4% | |
| $75,000 to $99,999 | 12.7% | 12.6% | |
| $100,000 to $124,999 | 14.5% | 9.2% | |
| $125,000 to $149,999 | 12.5% | 5.8% | |
| $150,000 to $199,999 | 11.1% | 6.6% | |
| $200,000 or more | 20.8% | 7.6% | |
| Age (n = 1196) | 18–24 | 6.1% | 12.1% |
| 25–34 | 27.9% | 17.9% | |
| 35–49 | 32.3% | 24.5% | |
| 50–64 | 25.7% | 24.9% | |
| 65 and over | 8.0% | 20.7% | |
| Gender (n=1234) | Female | 58.1% | 50.8% |
| Male | 41.4% | 49.2% | |
| Other | 0.5% | – | |
| Race and Ethnicity (n = 1197) | Non-Hispanic White | 78.4% | 60.2% |
| Non-Hispanic Asian | 8.1% | 5.6% | |
| Non-Hispanic Black/African American | 1.8% | 12.3% | |
| Other non-Hispanic | 1.6% | 1.1% | |
| Two or more races, non-Hispanic | 3.3% | 2.5% | |
| Hispanic or Latino | 6.8% | 18.3% | |
| Density persons/km2 in ZIP code (n = 1198) | 100 or less | 6.3% | 24.7% |
| 100–500 | 15.0% | 23.9% | |
| 500–1000 | 9.3% | 14.5% | |
| 1000–2000 | 30.3% | 18.5% | |
| More than 2000 | 39.1% | 18.4% | |
| Commute mode to work pre-pandemic (n = 1091) | Drive alone | 49.6% | 76.3% |
| Carpool | 4.1% | 9.0% | |
| Public transport | 23.0% | 4.9% | |
| Walk | 5.3% | 2.6% | |
| Bicycle or other | 11.9% | 1.9% | |
| Worked at home | 6.0% | 5.3% | |
| Sample size | 1595 |
| Reasons for Increased Productivity (n = 237 †) | |
| No commuting time | 79.3% |
| Less distractions at home | 45.6% |
| My job is demanding more of me | 36.3% |
| More comfortable workspace at home | 32.1% |
| In crisis situations, I’m able to focus better | 20.3% |
| Reasons for Decreased Productivity (n = 321 †) | |
| More distractions at home | 55.1% |
| There are too many concerns on my mind to be able to focus fully on work | 52.0% |
| Difficult to communicate with co-workers | 42.7% |
| Lack of comfortable workspace | 39.3% |
| Need equipment or technology not available at home | 24.0% |
| Have to share workspace with another worker | 16.8% |
| Childcare | 15.9% |
| Elder/other dependent care | 2.2% |
| Need to care for sick household member | 1.2% |
| † Respondents could choose “In some way [my productivity] has decreased and in other ways it has increased” and thus be asked questions about reasons for both decreased and increased productivity. | |
| Increase in… | ||||||||
|---|---|---|---|---|---|---|---|---|
| Drive Alone | Carpool | Ridehail/Taxi | Transit | Bike | Walk | n | ||
| Decrease in… | Drive alone | 7.1% | 1.3% | 11.9% | 41.2% | 42.5% | 226 | |
| Carpool | 25.8% | 0.8% | 4.7% | 36.7% | 44.5% | 128 | ||
| Ridehail/Taxi | 19.6% | 4.2% | 6.4% | 41.9% | 48.7% | 265 | ||
| Transit | 23.0% | 3.9% | 2.6% | 42.4% | 43.8% | 304 | ||
| Bike | 18.9% | 0.0% | 0.0% | 7.5% | 17.0% | 53 | ||
| Walk | 19.4% | 5.6% | 0.0% | 2.8% | 11.1% | 36 | ||
| Reasons for an Increase in Business Air Travel (n = 21) | |
| I want/need to take trips that were cancelled during the COVID-19 pandemic | 42.9% |
| My job changed and I now have more need to travel by airplane | 42.9% |
| Reasons for a Reduction in Business Air Travel (n = 388) | |
| Those I meet with have realized that we can conduct meetings by conference call/video conference | 51.5% |
| I realized I could conduct my meetings by conference call/video conference | 31.4% |
| I don’t feel safe or comfortable sharing close space with strangers | 26.8% |
| My company adopted a commitment to reduce travel by airplane | 22.4% |
| My job changed and I no longer need to travel by airplane | 8.0% |
| I anticipate taking more of my long-distance trips by car | 7.0% |
| I anticipate taking more of my long-distance trips by train or bus | 2.8% |
| Reasons for an Increase in Personal Air Travel (n = 83) | |
| After having been cooped up at home for so long, I want to travel more than I did before | 67.5% |
| I will need/want to take trips that were cancelled during the COVID-19 pandemic | 57.8% |
| My financial circumstances changed and I can now afford more air travel | 14.5% |
| My priorities changed and I no longer want to or can travel in the same way | 3.6% |
| Reasons for a Reduction in Personal Air Travel (n = 432) | |
| I don’t feel safe or comfortable sharing close space with strangers | 65.5% |
| I anticipate taking more of my long-distance trips by car | 39.8% |
| My priorities changed and I no longer want to or can travel in the same way | 31.9% |
| My financial circumstances changed and I can no longer afford to travel in the same way | 14.8% |
| I anticipate taking more of my long-distance trips by train or bus | 12.3% |
| I am able to use technology (e.g., FaceTime, Zoom) to meaningfully engage with long-distance connections | 12.0% |
| Reasons for an Improvement in Learning Quality (n = 35) | |
| No commuting time | 77.1% |
| More comfortable workspace at home | 48.6% |
| Decreased responsibilities at work | 14.3% |
| Fewer distractions at home | 11.4% |
| Reasons for a Decrease in Learning Quality (n = 122) | |
| Sitting in front of a computer for extended periods of time is too boring and monotonous | 77.9% |
| More distractions at home | 71.3% |
| Difficult to communicate with other students | 69.7% |
| Difficult to communicate with professors | 54.9% |
| Lack of comfortable workspace | 45.1% |
| Need equipment or technology not available at home | 18.0% |
| Increased responsibilities at work | 10.7% |
| Childcare | 6.6% |
| Elder/other dependent care | 4.1% |
| Need to care for sick household member | 1.6% |
| Unconcerned | Videoconferencers | Urban Shoppers | Suburban Office Lovers | Work from Home Extroverts | Grand Total | ||
|---|---|---|---|---|---|---|---|
| Work from home † | Yes | 30.9% | 42.8% | 46.3% | 35.9% | 60.3% | 45.3% |
| before the pandemic | Sample size | 152 | 271 | 255 | 181 | 287 | 1146 |
| Work from home † | Yes | 57.1% | 70.1% | 73.6% | 59.0% | 83.9% | 70.8% |
| after the pandemic | Sample size | 154 | 274 | 254 | 183 | 286 | 1151 |
| Expected dine-in | Less than before | 22.1% | 44.7% | 34.2% | 43.1% | 44.6% | 38.8% |
| formerly frequent† | More than before | 17.4% | 11.8% | 14.5% | 9.6% | 6.0% | 11.5% |
| restaurant diners | Sample size | 149 | 262 | 275 | 167 | 267 | 1120 |
| Expected online shopping | Less than before | 3.5% | 5.6% | 9.2% | 6.3% | 9.3% | 7.1% |
| formerly frequent† | More than before | 15.9% | 27.9% | 13.5% | 22.0% | 19.4% | 20.3% |
| online shoppers | Sample size | 113 | 215 | 185 | 159 | 216 | 888 |
| Unconcerned | Videoconferencers | Urban Shoppers | Suburban Office Lovers | Work from Home Extroverts | Grand Total | ||
|---|---|---|---|---|---|---|---|
| Expected bike use | Less than before | 3.8% | 0.0% | 1.0% | 0.0% | 1.5% | 1.2% |
| formerly | More than before | 30.8% | 36.4% | 43.4% | 37.5% | 42.4% | 40.2% |
| frequent bike users | Sample size | 26 | 44 | 99 | 16 | 66 | 251 |
| Expected bike use | Less than before | 0.0% | 2.0% | 0.5% | 0.6% | 1.7% | 1.1% |
| formerly not | More than before | 16.4% | 20.6% | 35.7% | 8.3% | 31.0% | 23.1% |
| frequent bike users | Sample size | 140 | 247 | 185 | 180 | 232 | 984 |
| Expected walking | Less than before | 3.9% | 4.1% | 0.0% | 4.6% | 1.3% | 2.1% |
| formerly | More than before | 27.6% | 36.3% | 36.5% | 24.6% | 39.4% | 35.0% |
| frequent walkers | Sample size | 76 | 146 | 222 | 65 | 160 | 669 |
| Expected walking | Less than before | 1.1% | 1.9% | 0.0% | 0.0% | 2.1% | 1.2% |
| formerly not | More than before | 20.2% | 20.4% | 33.8% | 8.2% | 19.7% | 19.1% |
| frequent walkers | Sample size | 94 | 157 | 71 | 134 | 142 | 598 |
| Expected transit use | Less than before | 19.2% | 31.2% | 32.4% | 27.1% | 33.3% | 30.2% |
| formerly | More than before | 12.1% | 8.5% | 9.0% | 6.5% | 5.9% | 8.1% |
| transit users | Sample size | 99 | 189 | 256 | 107 | 222 | 873 |
| Expected personal | Less than before | 26.3% | 35.4% | 35.6% | 35.3% | 36.4% | 34.5% |
| air travel | More than before | 5.8% | 6.6% | 6.6% | 7.1% | 5.1% | 6.2% |
| formerly flyers | Sample size | 156 | 288 | 289 | 184 | 297 | 1214 |
| Expected business | Less than before | 43.0% | 43.8% | 54.2% | 43.0% | 55.9% | 49.7% |
| air travel | More than before | 3.2% | 2.7% | 1.7% | 3.0% | 0.9% | 2.0% |
| formerly flyers | Sample size | 93 | 146 | 177 | 100 | 222 | 738 |
Publisher’s Note: MDPI stays neutral with regard to jurisdictional claims in published maps and institutional affiliations. |
© 2020 by the authors. Licensee MDPI, Basel, Switzerland. This article is an open access article distributed under the terms and conditions of the Creative Commons Attribution (CC BY) license (http://creativecommons.org/licenses/by/4.0/).
Share and Cite
Conway, M.W.; Salon, D.; da Silva, D.C.; Mirtich, L. How Will the COVID-19 Pandemic Affect the Future of Urban Life? Early Evidence from Highly-Educated Respondents in the United States. Urban Sci. 2020, 4, 50. https://doi.org/10.3390/urbansci4040050
Conway MW, Salon D, da Silva DC, Mirtich L. How Will the COVID-19 Pandemic Affect the Future of Urban Life? Early Evidence from Highly-Educated Respondents in the United States. Urban Science. 2020; 4(4):50. https://doi.org/10.3390/urbansci4040050
Chicago/Turabian StyleConway, Matthew Wigginton, Deborah Salon, Denise Capasso da Silva, and Laura Mirtich. 2020. "How Will the COVID-19 Pandemic Affect the Future of Urban Life? Early Evidence from Highly-Educated Respondents in the United States" Urban Science 4, no. 4: 50. https://doi.org/10.3390/urbansci4040050
APA StyleConway, M. W., Salon, D., da Silva, D. C., & Mirtich, L. (2020). How Will the COVID-19 Pandemic Affect the Future of Urban Life? Early Evidence from Highly-Educated Respondents in the United States. Urban Science, 4(4), 50. https://doi.org/10.3390/urbansci4040050