Comprehensive Analysis of Dynamic Message Sign Impact on Driver Behavior: A Random Forest Approach


Abstract
1. Introduction
2. Review of Related Work
3. Origin–Destination Matrix Development and Analysis
3.1. Scenario Design
3.2. Network Characteristics
3.3. Survey Questionnaires
3.4. Recruitment Process
4. Data
Random Forest
5. Results
5.1. Stated Preference vs. Revealed Travel Behavior
5.2. Route Diversion Behavioral Analysis
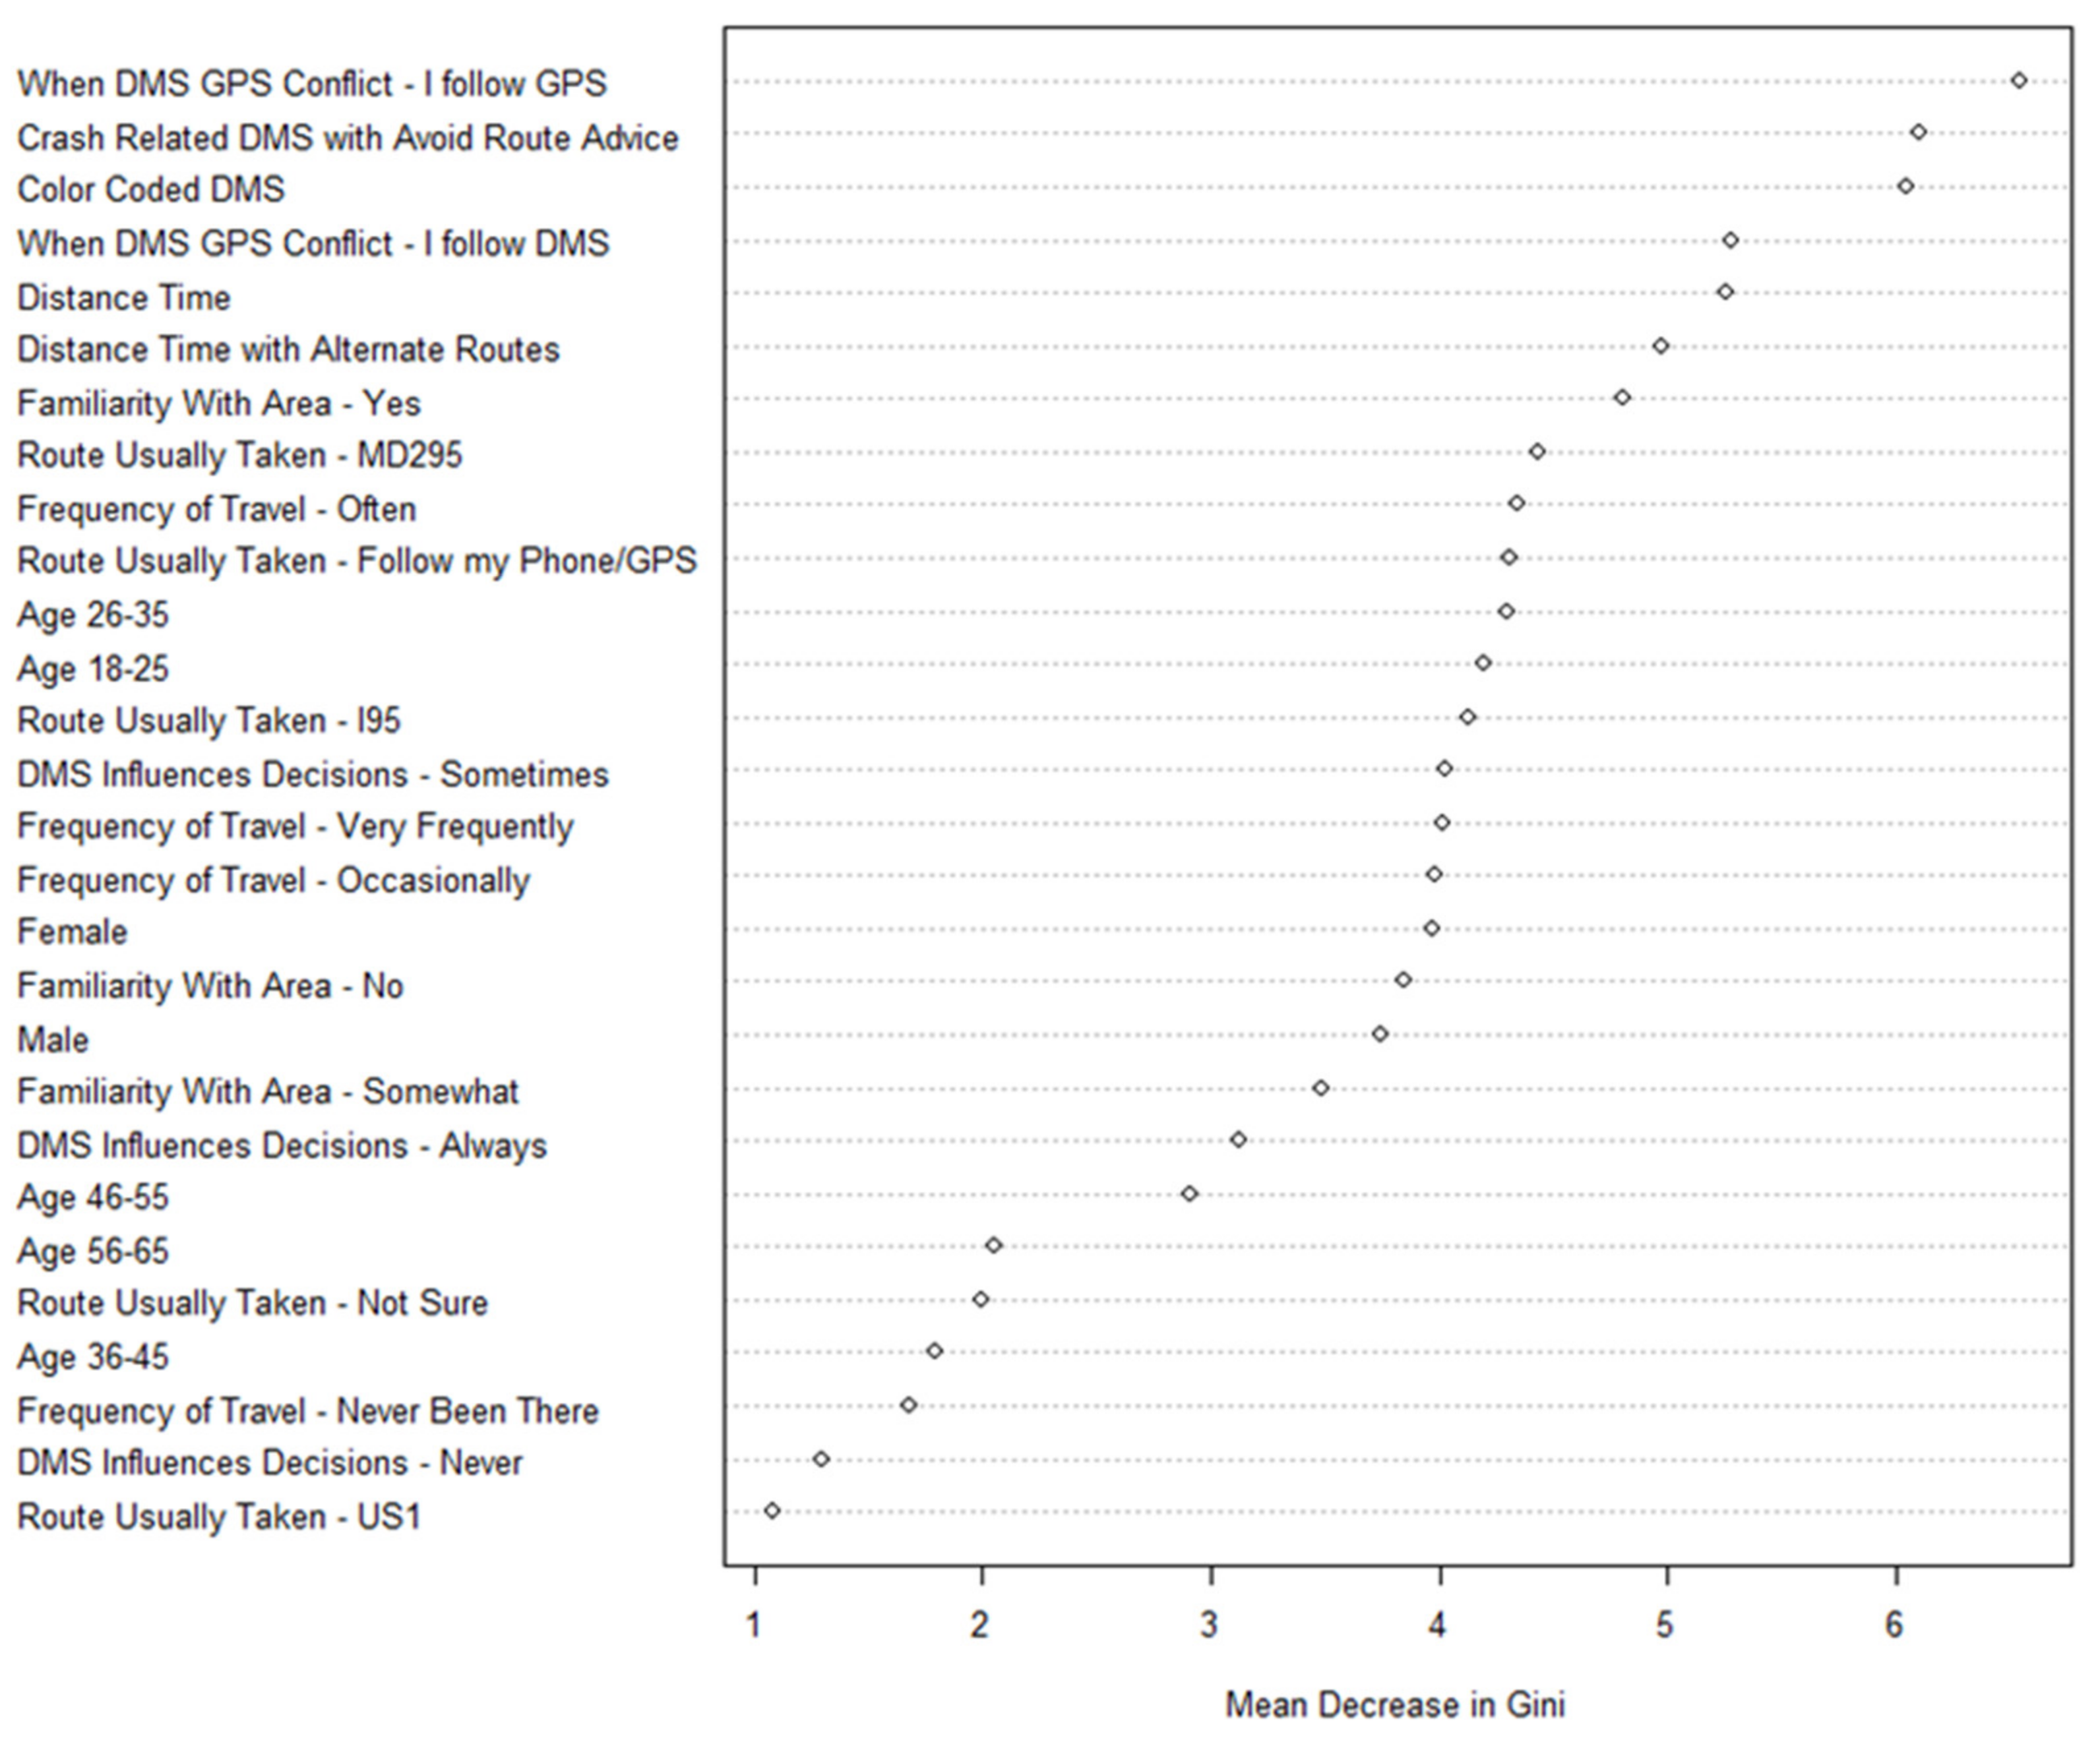
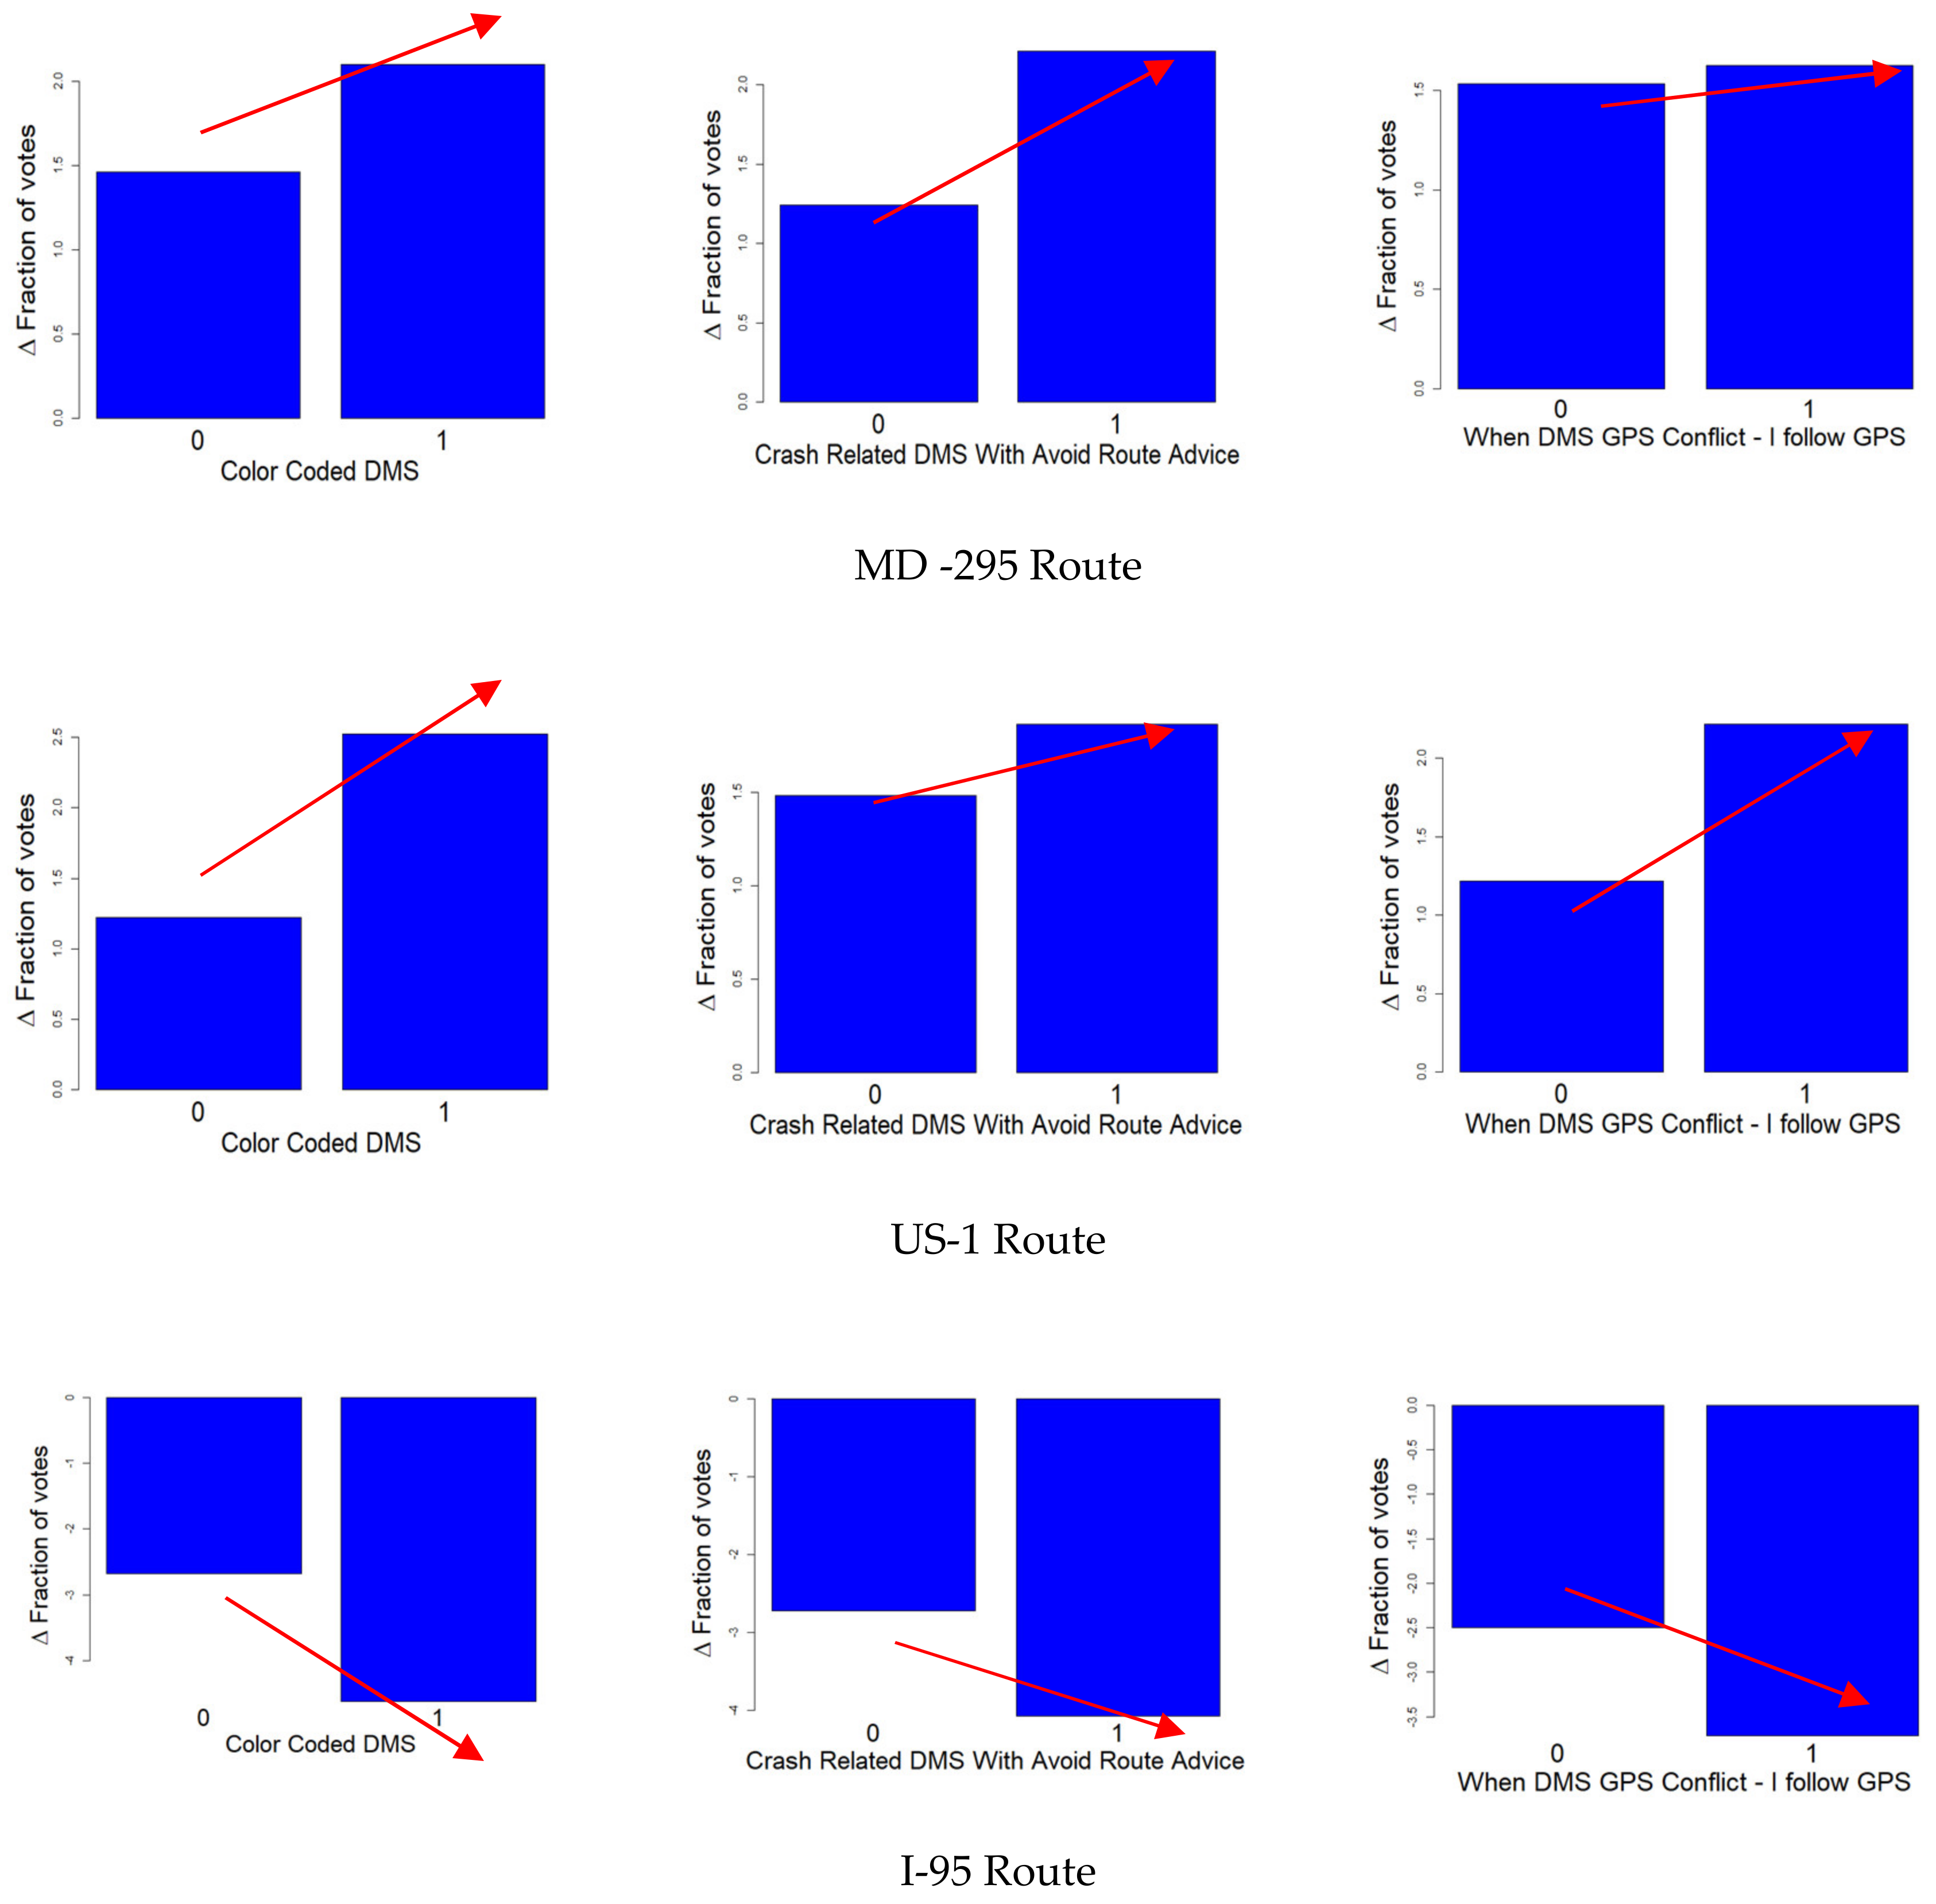
5.3. Route Choice Behavioral Analysis
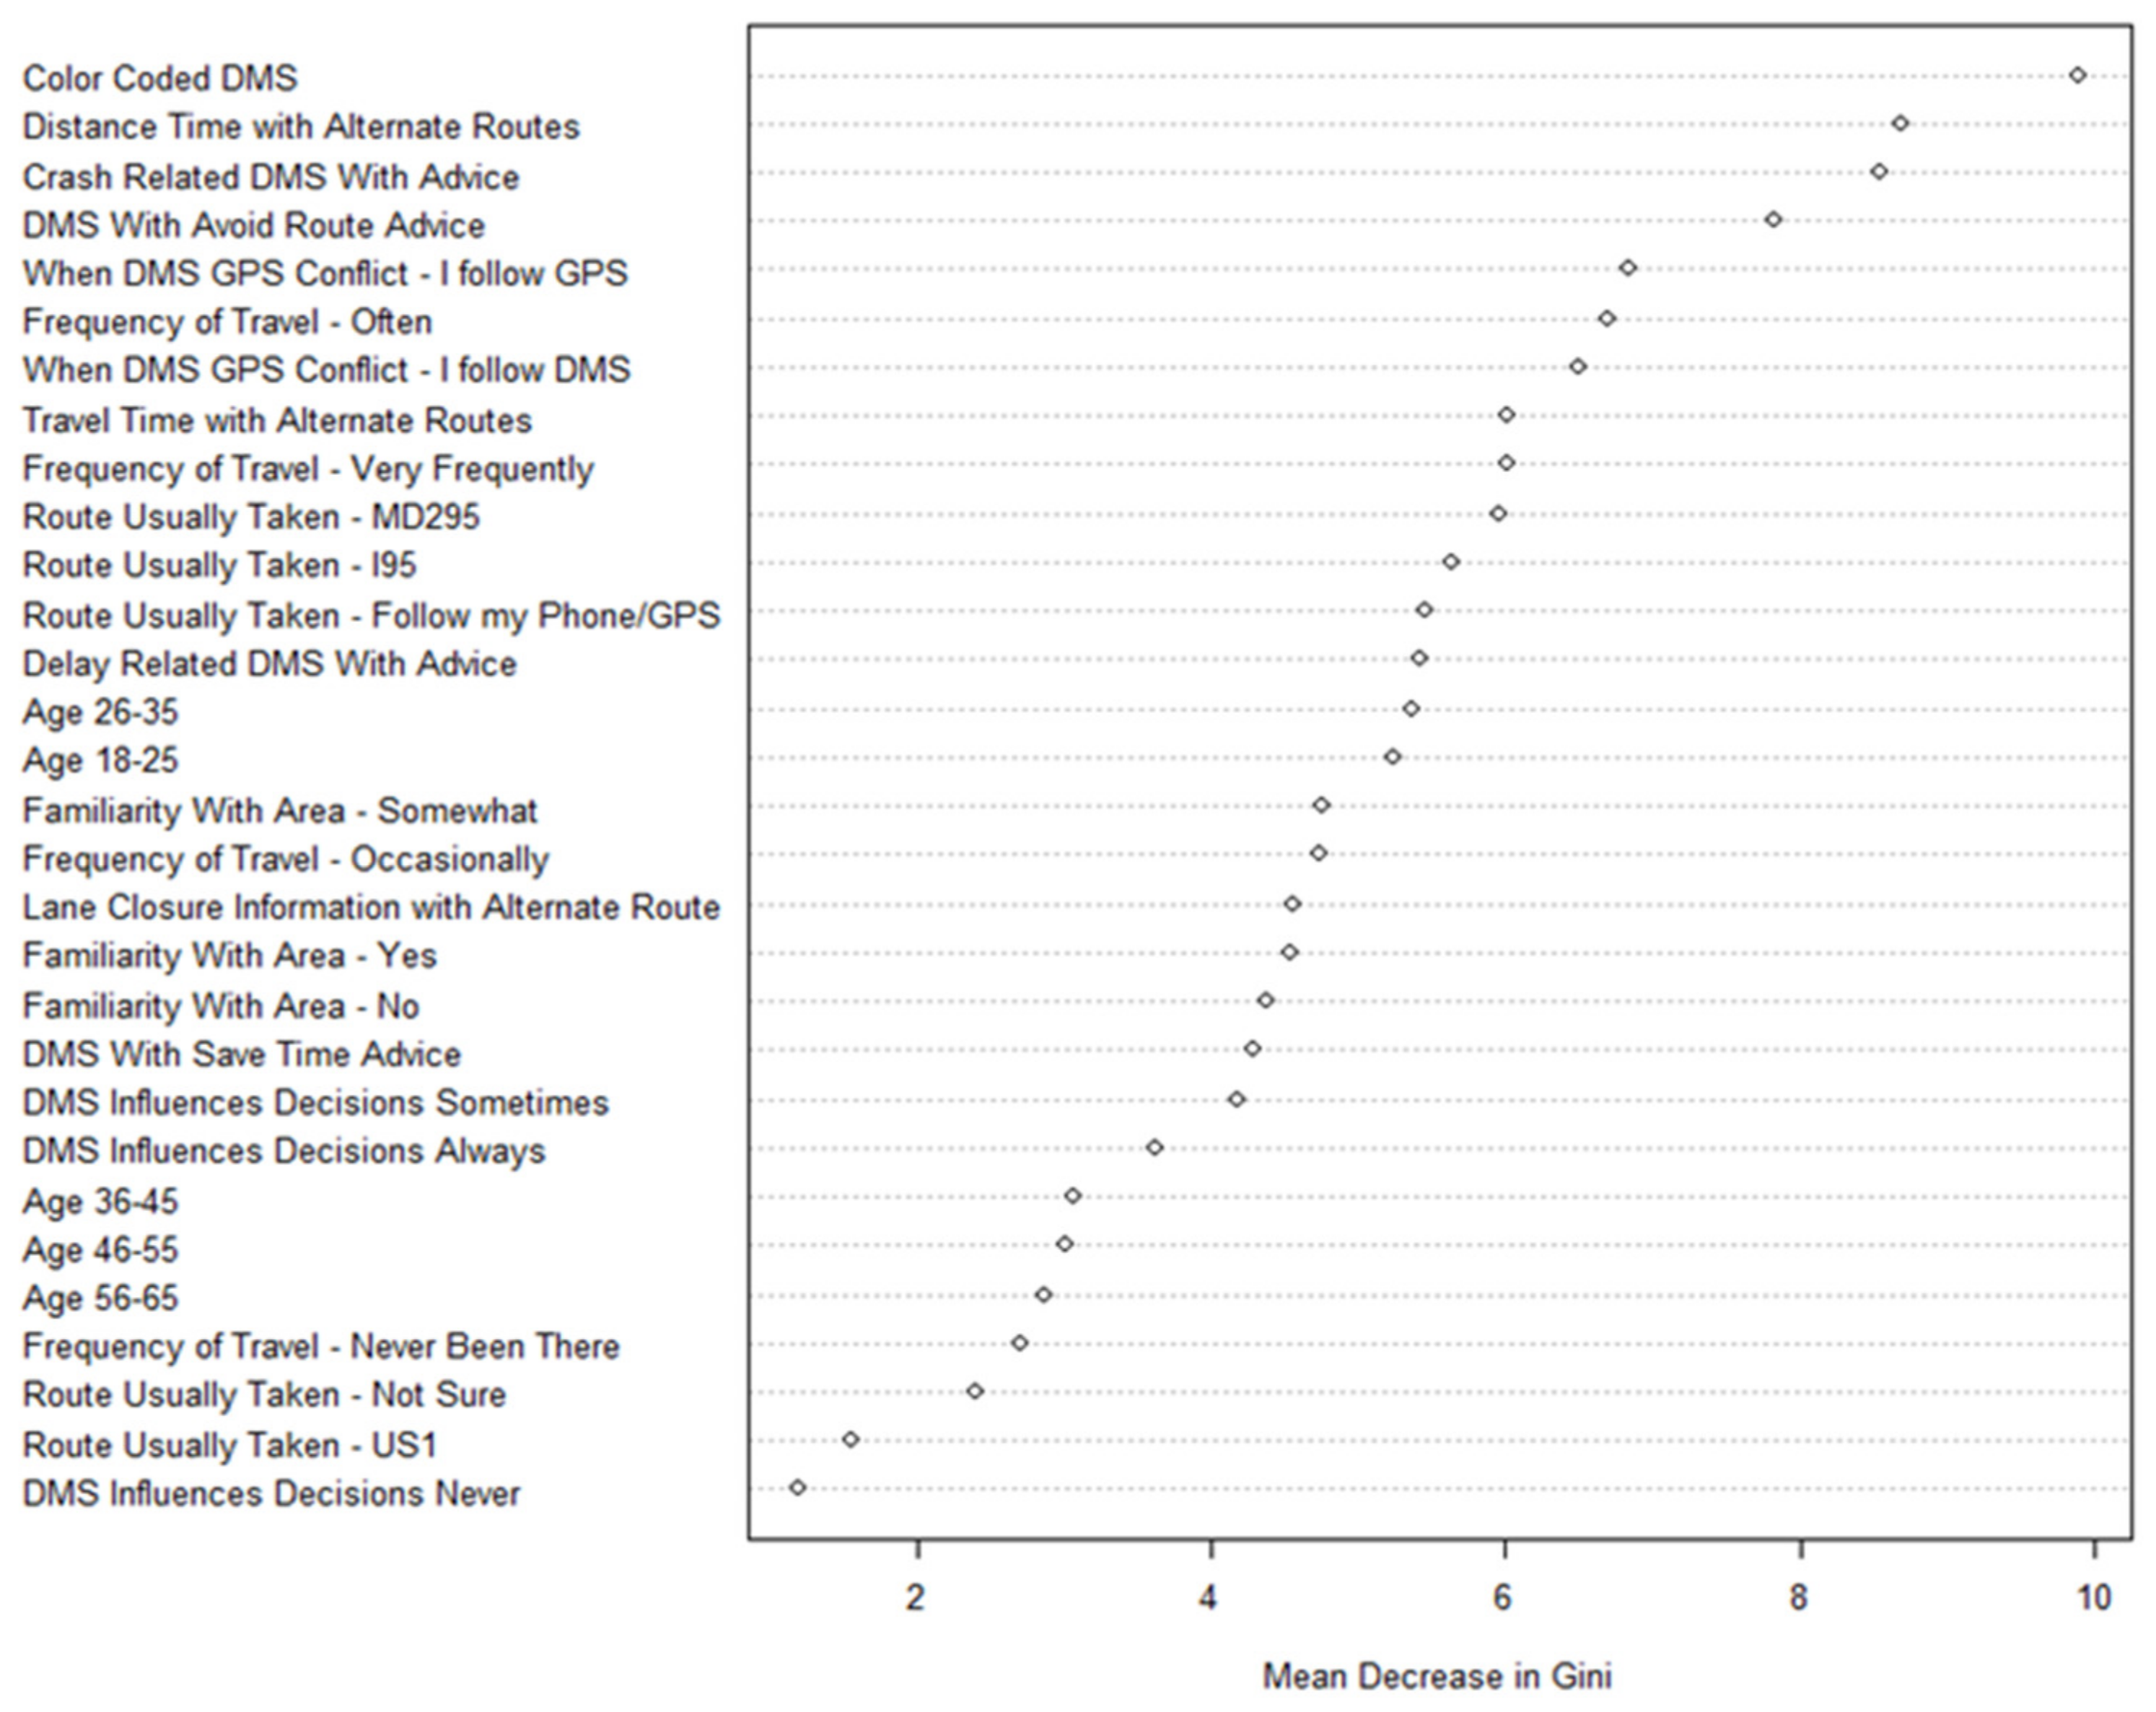
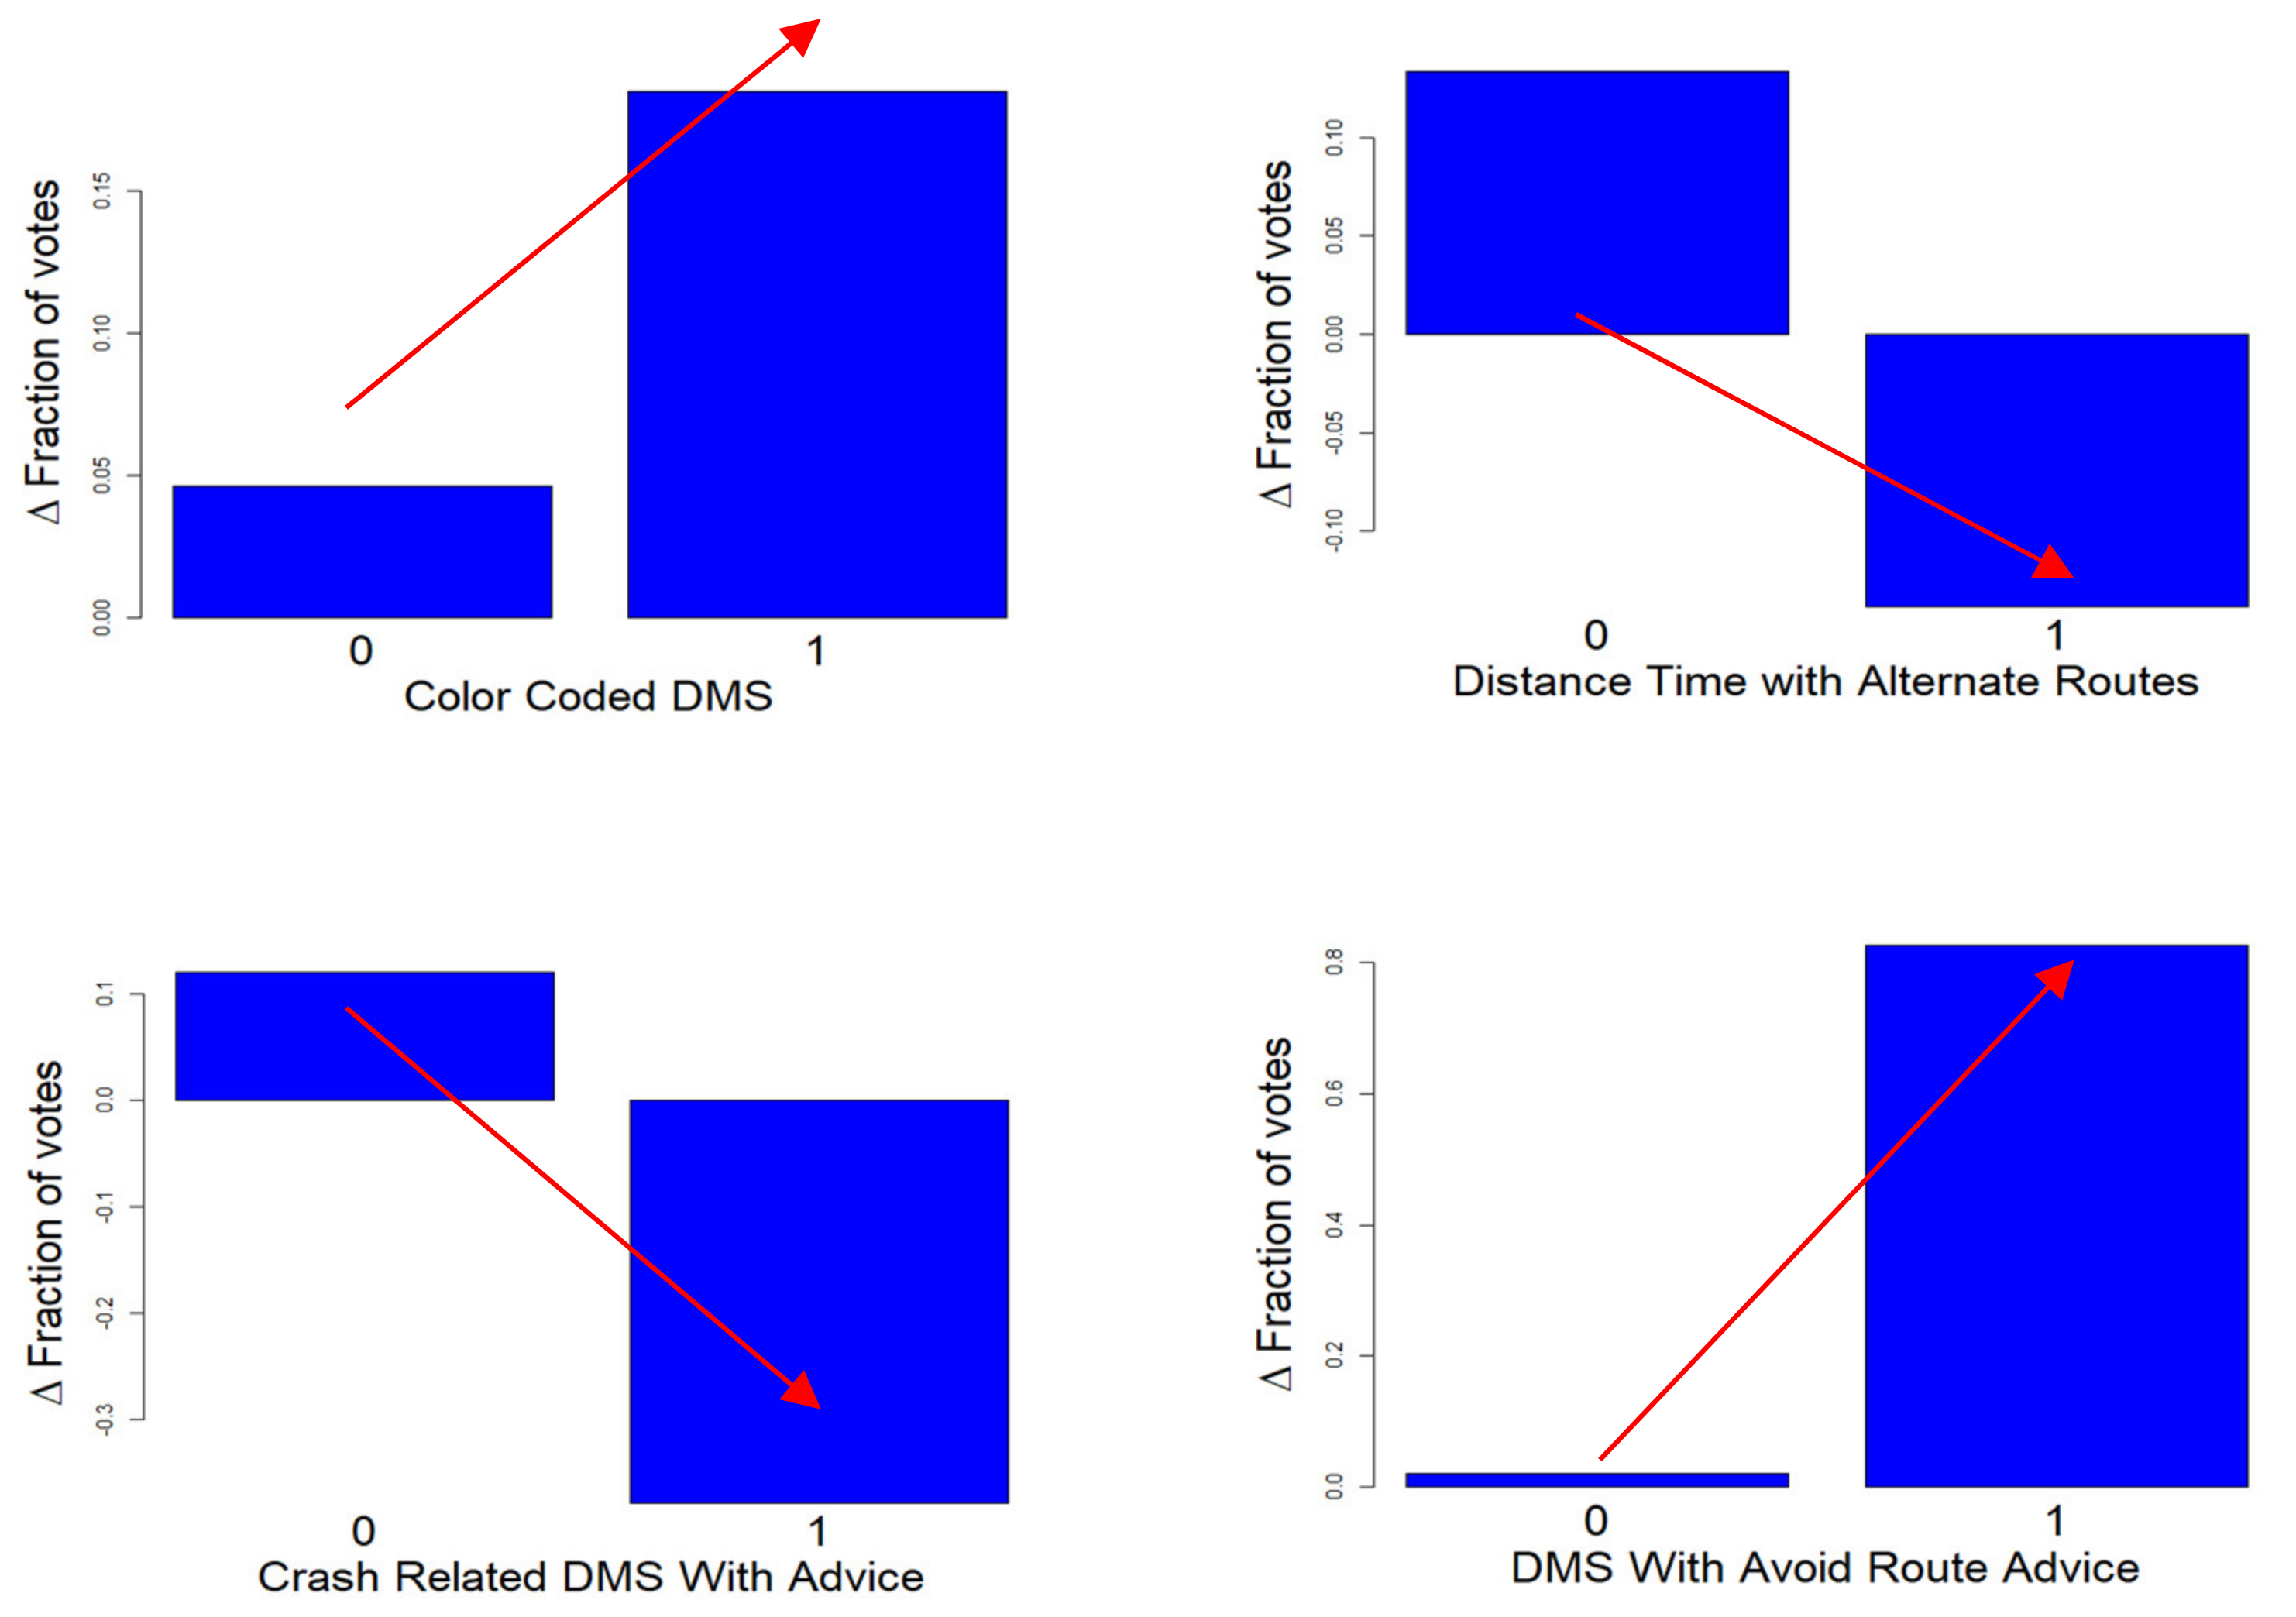
5.4. DMS Compliance Behavioral Analysis
6. Conclusions and Discussion
Author Contributions
Funding
Acknowledgments
Conflicts of Interest
References
- Brown, D.; Danny, I.; Jeihani, M.; Rashidi Moghaddam, Z.; Chavis, C.; Karmakar, N.; Aghdashi, S. Impact of Level of Service (LOS) on the Driver’s Behavior on Arterials; The National of Academies of Sciences, Engineering, and Medicine: Washington, DC, USA, 2018. [Google Scholar]
- Dutta, A.; Fisher, D.L.; Noyce, D.A. Use of a driving simulator to evaluate and optimize factors affecting understandability of variable message signs. Transp. Res. Part F Traffic Psychol. Behav. 2004, 7, 209–227. [Google Scholar] [CrossRef]
- McCall, J.C.; Trivedi, M.M. Driver behavior and situation aware brake assistance for intelligent vehicles. Proc. IEEE 2007, 95, 374–387. [Google Scholar] [CrossRef]
- Rämä, P. Effects of weather-controlled variable speed limits and warning signs on driver behavior. Transp. Res. Rec. J. Transp. Res. Board 1999, 1689, 53–59. [Google Scholar] [CrossRef]
- Banerjee, S.; Jeihani, M.; Khadem, N.K. Influence of work zone signage on driver speeding behavior. J. Mod. Transp. 2019, 27, 52–60. [Google Scholar] [CrossRef]
- Banerjee, S.; Jeihani, M.; Moghaddam, R. Impact of mobile work zone barriers on driving behavior on arterial roads. J. Traffic Logist. Eng. 2018, 6, 37–42. [Google Scholar] [CrossRef]
- Jeihani, M.; Banerjee, S. Drivers’ behavior analysis under reduced visibility conditions using a driving simulator. J. Traffic Logist. Eng. 2018, 6, 48–52. [Google Scholar] [CrossRef][Green Version]
- Dia, H. An agent-based approach to modelling driver route choice behaviour under the influence of real-time information. Transp. Res. Part C Emerg. Technol. 2002, 10, 331–349. [Google Scholar] [CrossRef]
- Oliver, N.; Pentland, A.P. Graphical models for driver behavior recognition in a smartcar. In Proceedings of the Intelligent Vehicles Symposium, Dearborn, MI, USA, USA, 5 October 2000; pp. 7–12. [Google Scholar]
- Salvucci, D.D. Modeling driver behavior in a cognitive architecture. Hum. Factors 2006, 48, 362–380. [Google Scholar] [CrossRef]
- Banerjee, S.; Jeihani, M.; Khadem, N.K.; Brown, D.D. Units of information on dynamic message signs: A speed pattern analysis. Eur. Transp. Res. Rev. 2019, 11, 15. [Google Scholar] [CrossRef]
- Jeihani, M.; Banerjee, S.; Ahangari, S.; Brown, D.D. The Potential Effects of Composition and Structure of Dynamic Message Sign Messages on Driver Behavior Using a Driving Simulator; The National of Academies of Sciences, Engineering, and Medicine: Washington, DC, USA, 2018. [Google Scholar]
- AbuAli, N.; Abou-zeid, H. Driver behavior modeling: Developments and future directions. Int. J. Veh. Technol. 2016, 2016, 1–12. [Google Scholar] [CrossRef]
- Evans, L. The dominant role of driver behavior in traffic safety. Am. J. Public Health 1996, 86, 784–786. [Google Scholar] [CrossRef] [PubMed]
- Dabiri, S.; Kelarestaghi, K.B.; Heaslip, K. Probe people and vehicle-based data sources application in the smart transportation. In Artificial Intelligence and Machine Learning Applications in Civil, Mechanical, and Industrial Engineering; IGI Global: Hershey, PA, USA, 2020. [Google Scholar] [CrossRef]
- Edwards, M.; Young, R. Developing System for Consistent Messaging on Interstate 80’s Dynamic Message Signs: Phase I; The National of Academies of Sciences, Engineering, and Medicine: Washington, DC, USA, 2009. [Google Scholar]
- Dudek, C.L. Changeable Message Sign Displays During Non-incident, Non-roadwork Periods; Transportation Research Board: Washington, DC, USA, 2008; Volume 383. [Google Scholar]
- Dudek, C.L. Changeable Message Sign Operation and Messaging Handbook. Available online: https://tmcpfs.ops.fhwa.dot.gov/cfprojects/uploaded_files/CMS%20Operation%20and%20Messaging%20Handbook-Final%20Draft.pdf (accessed on 31 July 2020).
- Anya. Department of Transportation Signs. Available online: http://transport.forgiveokey.site/department-of-transportation-signs/ (accessed on 31 July 2020).
- Richard, T.; Jaisung, C. Evaluation of pictograms in dynamic lane control systems in the Republic of Korea. J. Transp. Syst. Eng. Inf. Technol. 2009, 9, 56–61. [Google Scholar]
- Jeihani, M.; Ardeshiri, A. Exploring Travelers’ Behavior in Response to Dynamic Message Signs (DMS) Using a Driving Simulator; State Highway Administration, Research Division: Baltimore, MD, USA, 2013. [Google Scholar]
- Richard, T.; De Barros, A. Effectiveness of road safety messages on variable message signs. J. Transp. Syst. Eng. Inf. Technol. 2010, 10, 18–23. [Google Scholar]
- Dudek, C.; Ullman, G. Flashing messages, flashing lines, and alternating one line on changeable message signs. Transp. Res. Rec. J. Transp. Res. Board 2002, 1803, 94–101. [Google Scholar] [CrossRef]
- Ullman, B.; Ullman, G.; Dudek, C.; Williams, A. Driver understanding of sequential portable changeable message signs in work zones. Transp. Res. Rec. J. Transp. Res. Board 2007, 2015, 28–35. [Google Scholar] [CrossRef]
- Wang, J.-H.; Cao, Y. Assessing message display formats of portable variable message signs. Transp. Res. Rec. J. Transp. Res. Board 2005, 1937, 113–119. [Google Scholar] [CrossRef]
- Ardeshiri, A.; Jeihani, M. A speed limit compliance model for dynamic speed display sign. J. Saf. Res. 2014, 51, 33–40. [Google Scholar] [CrossRef] [PubMed]
- Oltedal, S.; Rundmo, T. The effects of personality and gender on risky driving behaviour and accident involvement. Saf. Sci. 2006, 44, 621–628. [Google Scholar] [CrossRef]
- Tsirimpa, A.; Polydoropoulou, A.; Antoniou, C. Development of a mixed multi-nomial logit model to capture the impact of information systems on travelers’ switching behavior. J. Intell. Transp. Syst. 2007, 11, 79–89. [Google Scholar] [CrossRef]
- Zhang, L.; Levinson, D. Determinants of route choice and value of traveler information: A field experiment. Transp. Res. Rec. J. Transp. Res. Board 2008, 2086, 81–92. [Google Scholar] [CrossRef]
- Islam, M.R.; Kelarestaghi, K.B.; Ermagun, A.; Banerjee, S. Gender Differences in Injury Severity Risk of Single-Vehicle Crashes in Virginia: A Nested Logit Analysis of Heterogeneity. arXiv, 2019; arXiv:1901.03289. [Google Scholar]
- Kelarestaghi, K.B.; Zhang, W.; Wang, Y.; Xiao, L.; Hancock, K.; Heaslip, K.P. Impacts to crash severity outcome due to adverse weather and other causation factors. Adv. Transp. Stud. 2017, 43, 31–42. [Google Scholar]
- Couronné, R.; Probst, P.; Boulesteix, A.-L. Random forest versus logistic regression: A large-scale benchmark experiment. BMC Bioinform. 2017, 19, 270. [Google Scholar] [CrossRef] [PubMed]
- Hjerpe, A. Computing Random Forests Variable Importance Measures (VIM) on Mixed Numerical and Categorical Data. Master’s Thesis, KTH, School of Computer Science and Communication (CSC), Stockholm, Sweden, 2016. [Google Scholar]
- Muchlinski, D.; Siroky, D.; He, J.; Kocher, M. Comparing random forest with logistic regression for predicting class-imbalanced civil war onset data. Political Anal. 2015, 24, 87–103. [Google Scholar] [CrossRef]
- Yoo, W.; Ference, B.A.; Cote, M.L.; Schwartz, A. A comparison of logistic regression, logic regression, classification tree, and random forests to identify effective gene-gene and gene-environmental interactions. Int. J. Appl. Sci. Technol. 2012, 2, 268. [Google Scholar]
- Yu, R.; Abdel-Aty, M. Analyzing crash injury severity for a mountainous freeway incorporating real-time traffic and weather data. Saf. Sci. 2014, 63, 50–56. [Google Scholar] [CrossRef]
- Pham, M.-H.; Bhaskar, A.; Chung, E.; Dumont, A.-G. Random forest models for identifying motorway rear-end crash risks using disaggregate data. In Proceedings of the 13th International IEEE Conference on Intelligent Transportation Systems (ITSC), Funchal, Portugal, 19–22 September 2010; pp. 468–473. [Google Scholar]
- Das, A.; Abdel-Aty, M.; Pande, A. Using conditional inference forests to identify the factors affecting crash severity on arterial corridors. J. Saf. Res. 2009, 40, 317–327. [Google Scholar] [CrossRef]
- Krishnaveni, S.; Hemalatha, M. A perspective analysis of traffic accident using data mining techniques. Int. J. Comput. Appl. 2011, 23, 40–48. [Google Scholar] [CrossRef]
- Peeta, S.; Ramos, J.L. Driver response to variable message signs-based traffic information. In Intelligent Transport Systems; IEEE: New York, NY, USA, 2006; Volume 153, pp. 2–10. [Google Scholar] [CrossRef]
- Feng, T.; Arentze, T.A.; Timmermans, H.J. Assessing the relative importance of input variables for route choice modeling: A neural network approach. J. Eastern Asia Soc. Transp. Stud. 2011, 9, 341–353. [Google Scholar]
- Moghaddam, Z.R.; Jeihani, M.; Peeta, S.; Banerjee, S. Comprehending the roles of traveler perception of travel time reliability on route choice behavior. Travel Behav. Soc. 2019, 16, 13–22. [Google Scholar] [CrossRef]
- Levinson, D.M.; Huo, H. Effectiveness of variable message signs using empirical loop detector data. Available online: https://conservancy.umn.edu/handle/11299/179809 (accessed on 31 July 2020).
- Horowitz, A.; Weisser, I.; Notbohm, T. Diversion from a rural work zone with traffic-responsive variable message signage system. Transp. Res. Rec. J. Transp. Res. Board 2003, 1824, 23–28. [Google Scholar] [CrossRef]
- Xuan, Y.E.; Kanafani, A.K. Empirical Evaluation of Drivers’ Behavior Response to Accident Information on Freeway Changeable Message Signs; The National of Academies of Sciences, Engineering, and Medicine: Washington, DC, USA, 2014. [Google Scholar]
- Tian, H.; Gao, S.; Fisher, D.; Post, B. Route choice behavior in a driving simulator with real-time information. Available online: https://www.mobt3ath.com/uplode/book/book-3711.pdf (accessed on 31 July 2020).
- Jindahra, P.; Choocharukul, K. Short-run route diversion: An empirical investigation into variable message sign design and policy experiments. IEEE Trans. Intell. Transp. Syst. 2013, 14, 388–397. [Google Scholar] [CrossRef]
- Chatterjee, K.; Hounsell, N.; Firmin, P.; Bonsall, P. Driver response to variable message sign information in London. Transp. Res. Part C Emerg. Technol. 2002, 10, 149–169. [Google Scholar] [CrossRef]
- Fish, R.L.W.; Haghani, A.; Hamedi, M. Analysis of Traffic Speed Response to Display of Dynamic Message Sign Messages; The National of Academies of Sciences, Engineering, and Medicine: Washington, DC, USA, 2012. [Google Scholar]
- Jeihani, M.; NarooieNezhad, S.; Kelarestaghi, K.B. Integration of a driving simulator and a traffic simulator case study: Exploring drivers’ behavior in response to variable message signs. IATSS Res. 2017, 41, 164–171. [Google Scholar] [CrossRef]
- Dia, H.; Panwai, S. Modelling drivers’ compliance and route choice behaviour in response to travel information. Nonlinear Dyn. 2007, 49, 493–509. [Google Scholar] [CrossRef]
- Schroeder, J.L.; Demetsky, M.J. Data analysis of diversion and dynamic message signs. J. Transp. Eng. 2011, 137, 608–614. [Google Scholar] [CrossRef]
- Strobl, C.; Boulesteix, A.-L.; Zeileis, A.; Hothorn, T. Bias in random forest variable importance measures: Illustrations, sources and a solution. BMC Bioinform. 2007, 8, 25. [Google Scholar] [CrossRef]
- Team, R.C. R: A Language and Environment for Statistical Computing. Available online: http://softlibre.unizar.es/manuales/aplicaciones/r/fullrefman.pdf (accessed on 31 July 2020).
- Breiman, L. Random forests. Mach. Learn. 2001, 45, 5–32. [Google Scholar] [CrossRef]
- Breiman, L. Bagging predictors. Mach. Learn. 1996, 24, 123–140. [Google Scholar] [CrossRef]
- Liaw, A.; Wiener, M. Breiman and Cutlers random forests for classification and regression. Available online: https://www.researchgate.net/publication/304378707_Package_%27randomForest%27_Breiman_and_Cutler%27s_random_forests_for_classification_and_regression (accessed on 31 July 2020).
- Abou-Zeid, M.; Kaysi, I.; Al-Naghi, H. Measuring aggressive driving behavior using a driving simulator: An exploratory study. In Proceedings of the 3rd International Conference on Road Safety and Simulation, Indianapolis, IN, USA, 14–16 September 2011. [Google Scholar]
- Sarwar, M.T.; Anastasopoulos, P.C.; Golshani, N.; Hulme, K.F. Grouped random parameters bivariate probit analysis of perceived and observed aggressive driving behavior: A driving simulation study. Anal. Methods Accid. Res. 2017, 13, 52–64. [Google Scholar] [CrossRef]
- Mullen, N.; Charlton, J.; Devlin, A.; Bedard, M. Simulator validity: Behaviours observed on the simulator and on the road. In Handbook of Driving Simulation for Engineering, Medicine and Psychology; CRC Press: Boca Raton, FL, USA, 2011; pp. 1–18. [Google Scholar]
- Ardeshiri, A.; Jeihani, M.; Peeta, S. Driving Simulator Based Analysis of Driver Compliance Behavior under Dynamic Message Sign Based Route Guidance. The National of Academies of Sciences, Engineering, and Medicine: Washington, DC, USA, 2014. [Google Scholar]
- Ullman, B.R.; Trout, N.D.; Dudek, C.L. Use of Graphics and Symbols on Dynamic Message Signs: Technical Report; Texas Transportation Institute, The Texas A & M University System: College Station, TX, USA, 2009. [Google Scholar]
- FHWA. Manual on Uniform Traffic Control Devices for Streets and Highways; United States Department of Transportation: Washington, DC, USA, 2009. [Google Scholar]


| Order of DMS ENCOUNTERED | Travel Time | Lane Closure | Delay | |||
|---|---|---|---|---|---|---|
| Scenario 1 | Scenario 2 | Scenario 3 | Scenario 4 | Scenario 5 | Scenario 6 | |
| DMS-1 | Distance time | Distance time | Crash-related | Crash | Color Coded | Color Coded |
| With alternative routes | W/O alternative routes | With avoid advice | W/O advice | Design I | Design II | |
| DMS-2 | Distance time | Travel time | Lane closure | DMS | DMS | Delay |
| With alternative routes | With alternative routes | With alternate route | With avoid advice | With save time advice | With advice | |
| DMS-3 | Travel time | Travel time | Crash | DMS | Delay | Delay |
| With alternative routes | W/O alternative routes | With advice | W/O advice | With advice | W/O advice | |
| DMS-4 | Distance time | Travel time | Lane closure | Incident | N/A | N/A |
| W/O alternative routes | W/O alternative routes | W/O advice | W/O advice | |||
| DMS Categories | Signs Used |
|---|---|
| Distance Time with Alternate Routes |  |
| Travel Time with Alternate Routes |  |
| Travel Time without Alternate Routes |  |
| Lane Closure Information with Alternate Route |  |
| Crash-Related DMS with Advice |  |
| Delay-Related DMS with Advice |  |
| Delay-Related DMS without Advice |  |
| Color-Coded DMS (Design I) |  |
| Color-Coded DMS (Design II) |  |
| DMS with Avoid Route Advice |  |
| DMS with Save Time Advice |  |
| Variables | Description | Percentage |
|---|---|---|
| Gender | Male | 55% |
| Female | 45% | |
| Age | 18–25 | 33% |
| 26–35 | 39% | |
| 36–45 | 11% | |
| 46–55 | 10% | |
| 56–65 | 7% | |
| Familiarity with Study Area | Yes | 53% |
| Somewhat | 28% | |
| No | 13% | |
| Frequency of Travel | Very frequently | 25% |
| Often | 37% | |
| Occasionally | 24% | |
| Never been there | 9% | |
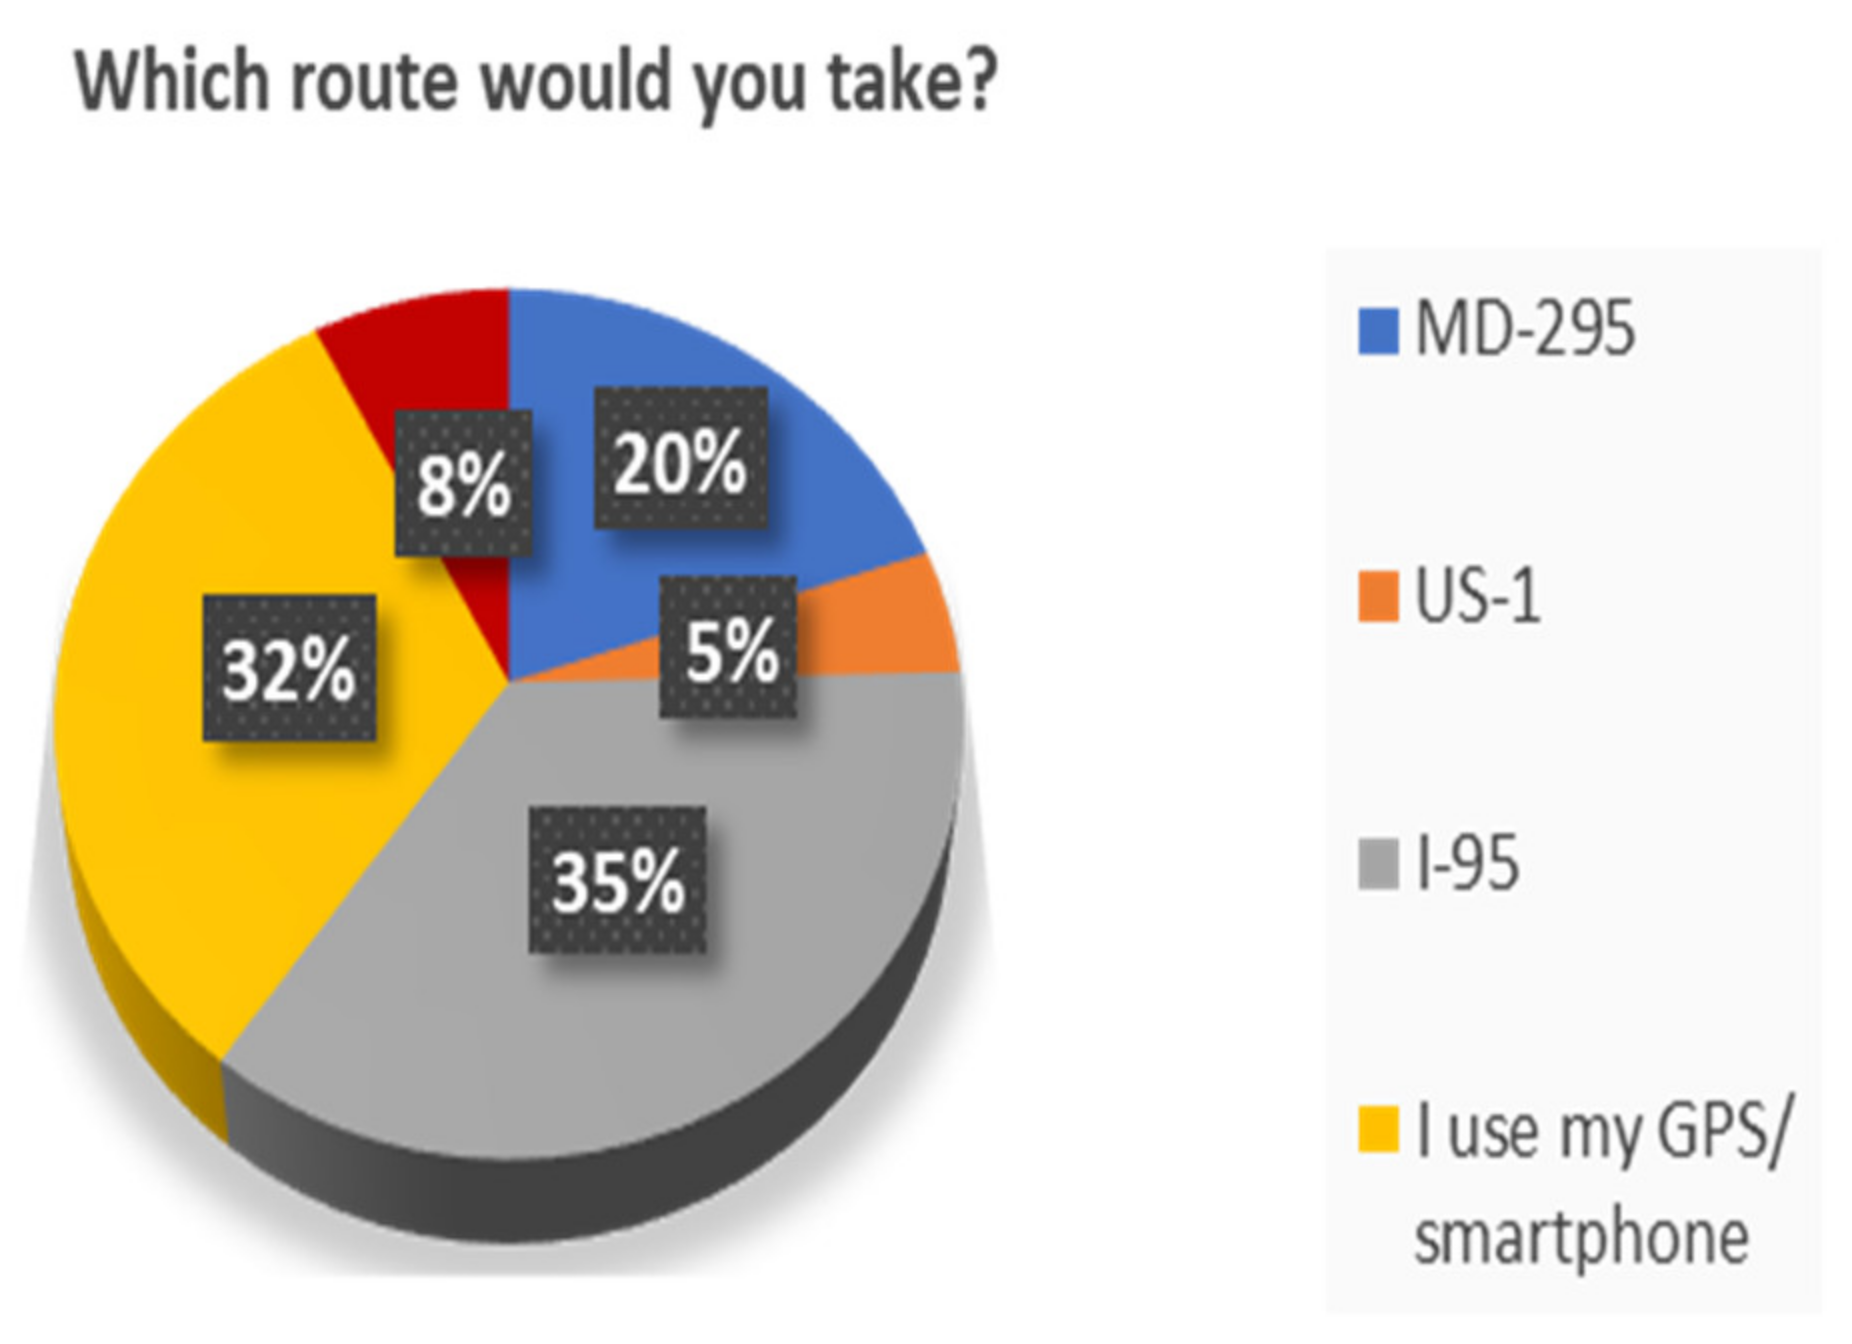
| Route Usually Taken | MD-295 | 19% |
| US-1 | 5% | |
| I-95 | 34% | |
| Follow my GPS | 30% | |
| Not Sure | 8% | |
| DMS Influences Decisions | Always | 18% |
| Sometimes | 77% | |
| Never | 3% | |
| When DMS GPS Conflict | I follow DMS | 27% |
| I follow GPS | 38% |
| Variables | Description | Percentage |
|---|---|---|
| Distance Time with Alternate Routes | Encountered | 11% |
| Did not encounter | 89% | |
| Travel Time with Alternate Routes | Encountered | 22% |
| Did not encounter | 78% | |
| Travel Time without Alternate Routes | Encountered | 12% |
| Did not encounter | 88% | |
| Lane Closure Information with Alternate Route | Encountered | 11% |
| Did not encounter | 89% | |
| Crash-Related DMS With Advice | Encountered | 11% |
| Did not encounter | 89% | |
| Delay-Related DMS With Advice | Encountered | 22% |
| Did not encounter | 78% | |
| Delay-Related DMS Without Advice | Encountered | 11% |
| Did not encounter | 89% | |
| Diversion | Diverted | 42% |
| Did not divert | 58% |
| Variables | Description | Percentage |
|---|---|---|
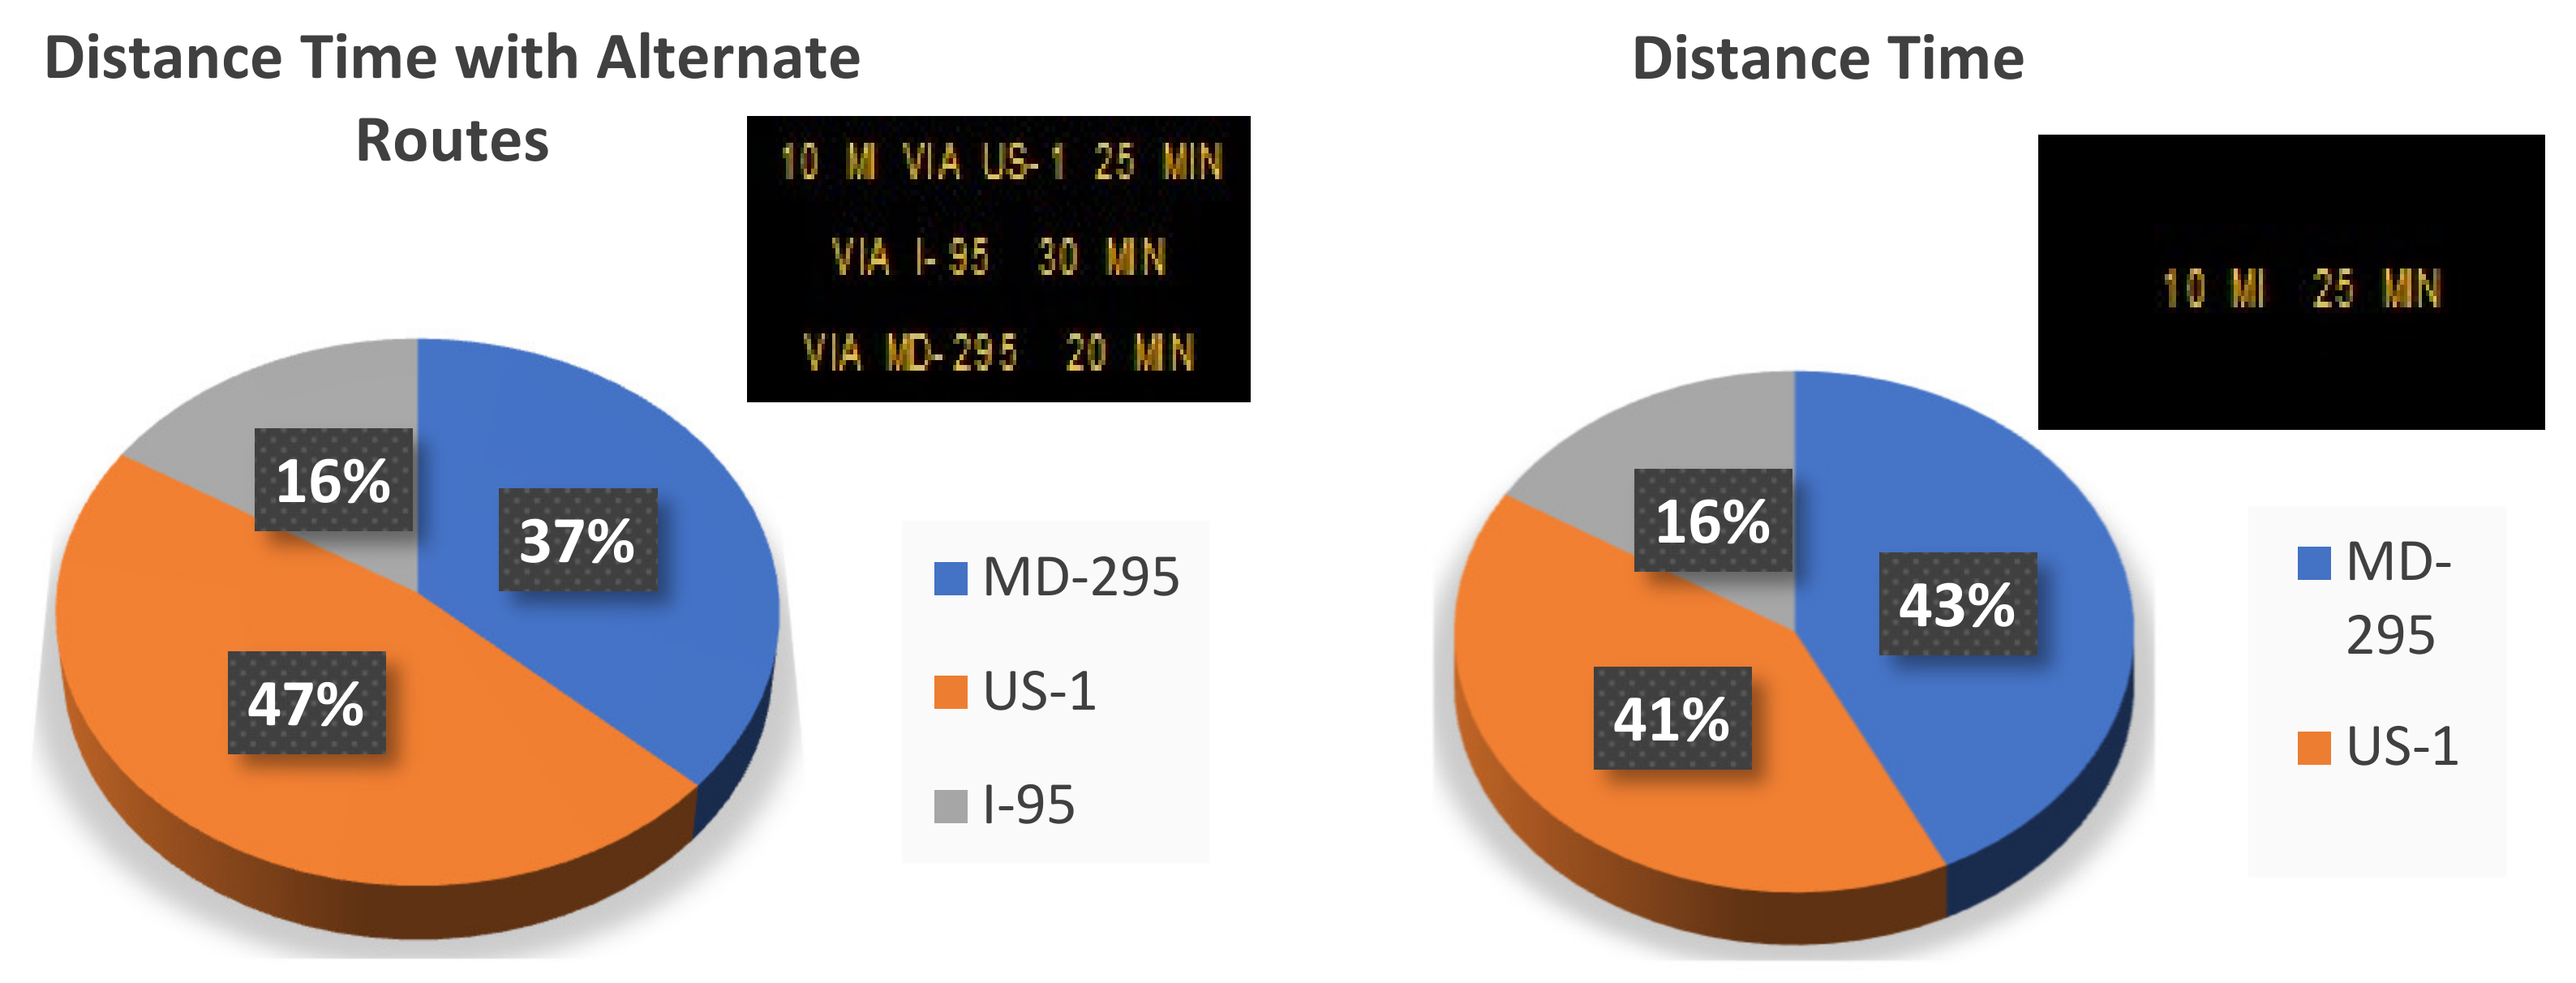
| DMS Messages | Distance Time with Alternate | |
| Routes | 17% | |
| Distance Time | 17% | |
| Crash-Related DMS with | 33% | |
| Advice | ||
| Color-Coded DMS | 33% | |
| Route Choice | MD-295 | 44% |
| US-1 | 47% | |
| I-95 | 9% |
| Variables | Description | Percentage |
|---|---|---|
| DMS Message | Distance Time with Alternate Routes | 18% |
| DMS Message | Travel Time with Alternate Routes | 18% |
| DMS Message | Color-Coded DMS | 17% |
| DMS Message | Lane Closure Information with Alternate Routes | 9% |
| DMS Message | Crash-Related DMS with Advice | 8% |
| DMS Message | DMS with Avoid Route Advice | 4% |
| DMS Message | Delay-Related DMS with Advice | 17% |
| DMS Message | DMS with Save Time Advice | 9% |
| Compliance | Complied Did Not Comply | 53% 47% |
Publisher’s Note: MDPI stays neutral with regard to jurisdictional claims in published maps and institutional affiliations. |
© 2020 by the authors. Licensee MDPI, Basel, Switzerland. This article is an open access article distributed under the terms and conditions of the Creative Commons Attribution (CC BY) license (http://creativecommons.org/licenses/by/4.0/).
Share and Cite
Banerjee, S.; Jeihani, M.; Brown, D.D.; Ahangari, S. Comprehensive Analysis of Dynamic Message Sign Impact on Driver Behavior: A Random Forest Approach. Urban Sci. 2020, 4, 49. https://doi.org/10.3390/urbansci4040049
Banerjee S, Jeihani M, Brown DD, Ahangari S. Comprehensive Analysis of Dynamic Message Sign Impact on Driver Behavior: A Random Forest Approach. Urban Science. 2020; 4(4):49. https://doi.org/10.3390/urbansci4040049
Chicago/Turabian StyleBanerjee, Snehanshu, Mansoureh Jeihani, Danny D. Brown, and Samira Ahangari. 2020. "Comprehensive Analysis of Dynamic Message Sign Impact on Driver Behavior: A Random Forest Approach" Urban Science 4, no. 4: 49. https://doi.org/10.3390/urbansci4040049
APA StyleBanerjee, S., Jeihani, M., Brown, D. D., & Ahangari, S. (2020). Comprehensive Analysis of Dynamic Message Sign Impact on Driver Behavior: A Random Forest Approach. Urban Science, 4(4), 49. https://doi.org/10.3390/urbansci4040049