The “Paris-End” of Town? Deriving Urban Typologies Using Three Imagery Types

 , , , and
Abstract
1. Introduction
Contemporary Approaches
2. Methods
2.1. Neural Network
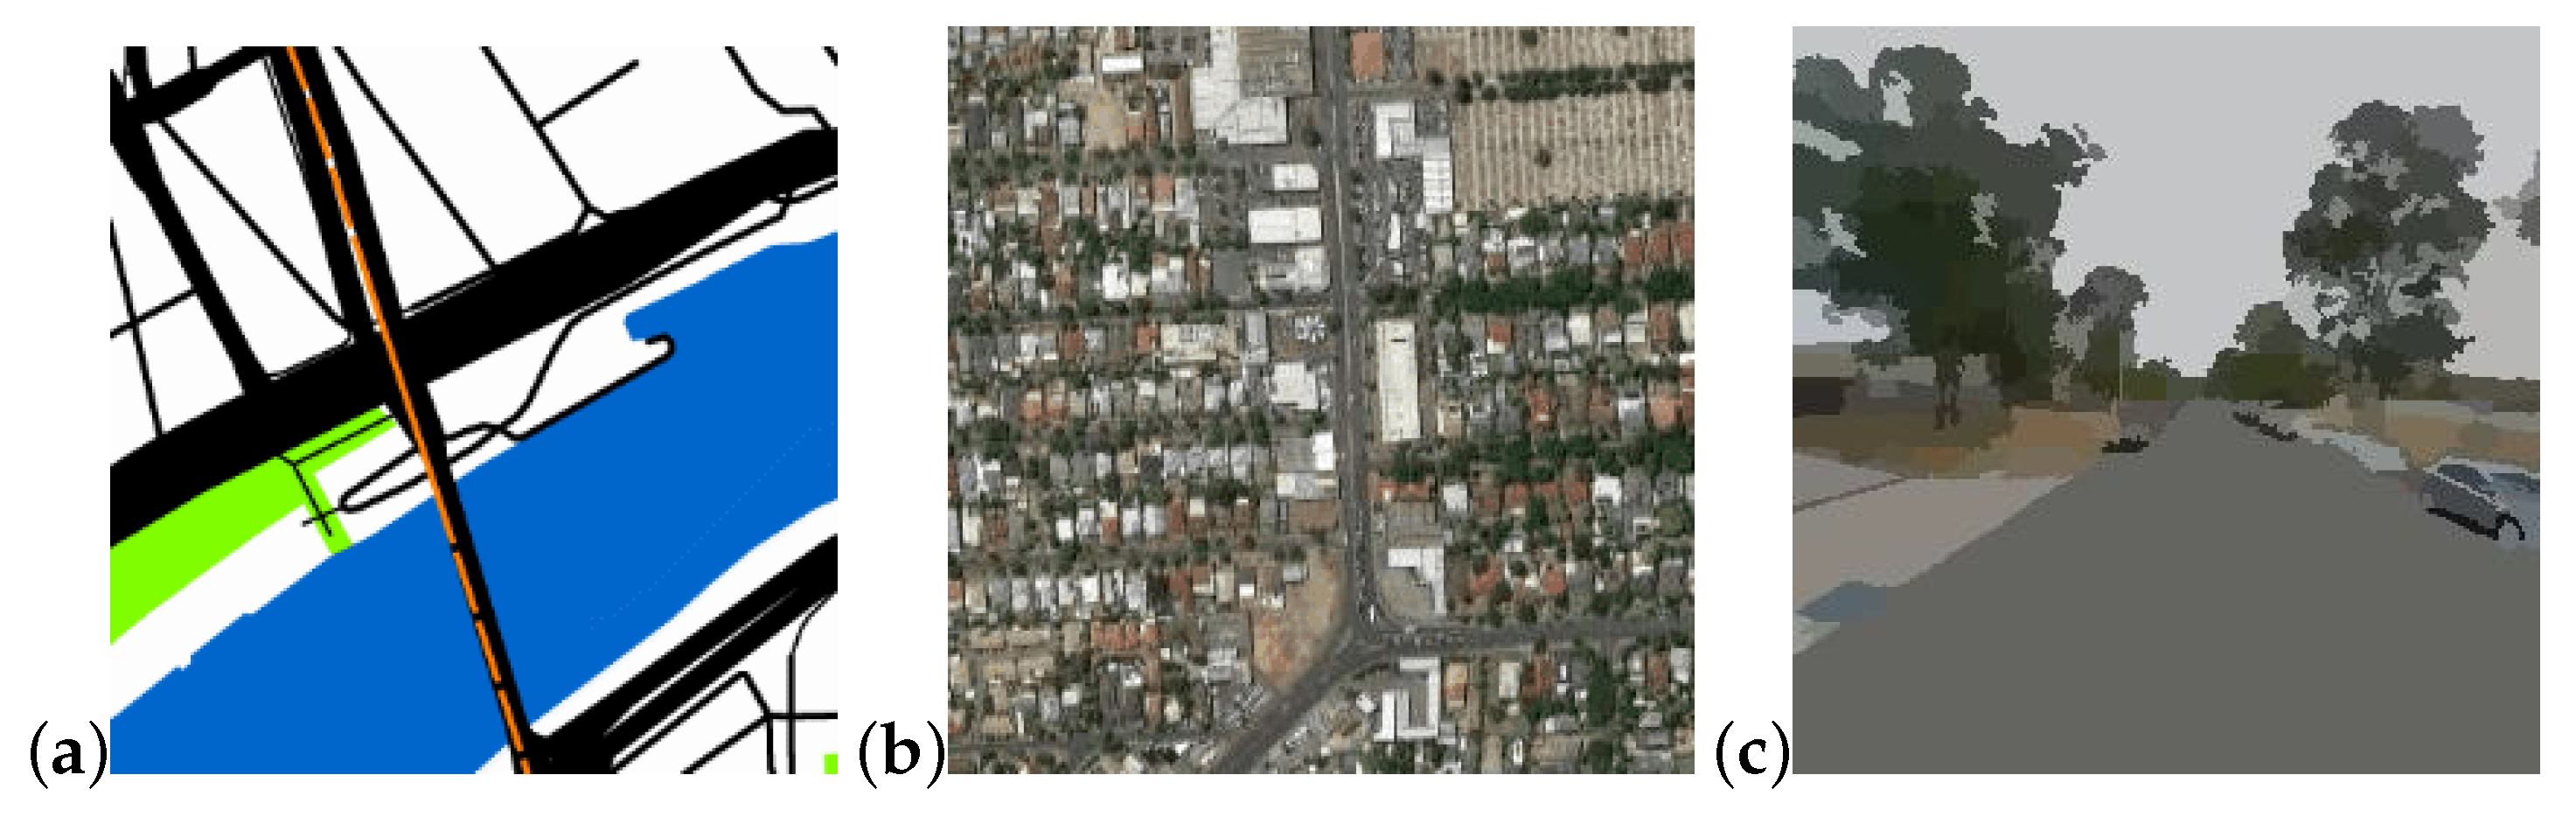
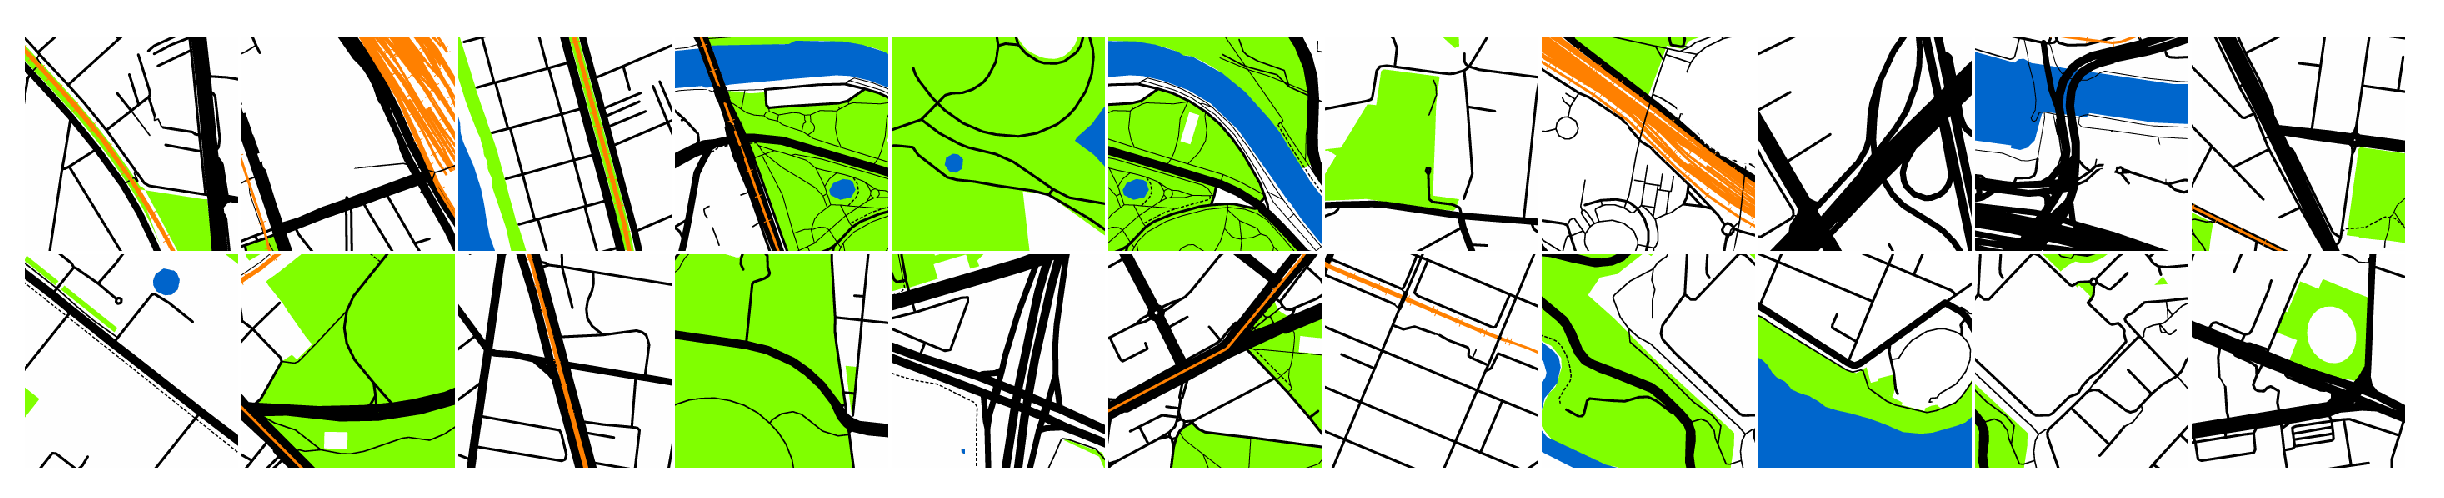
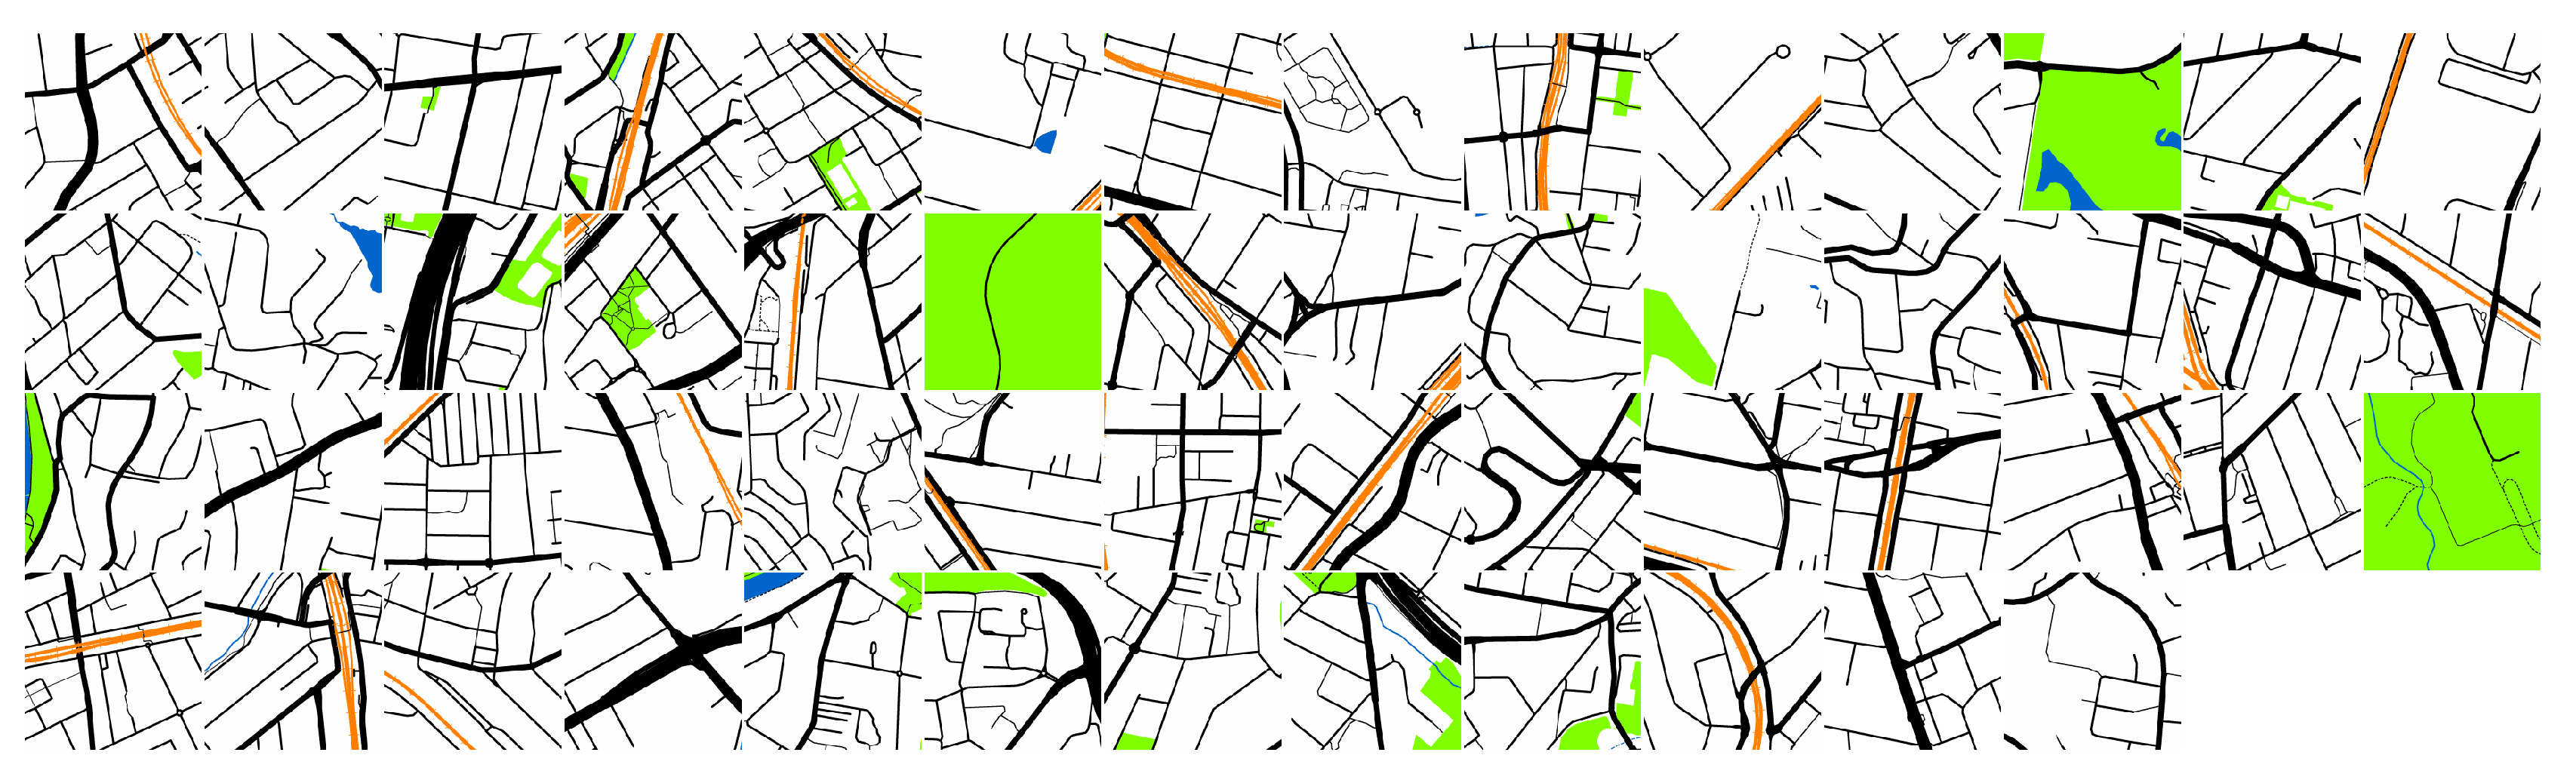
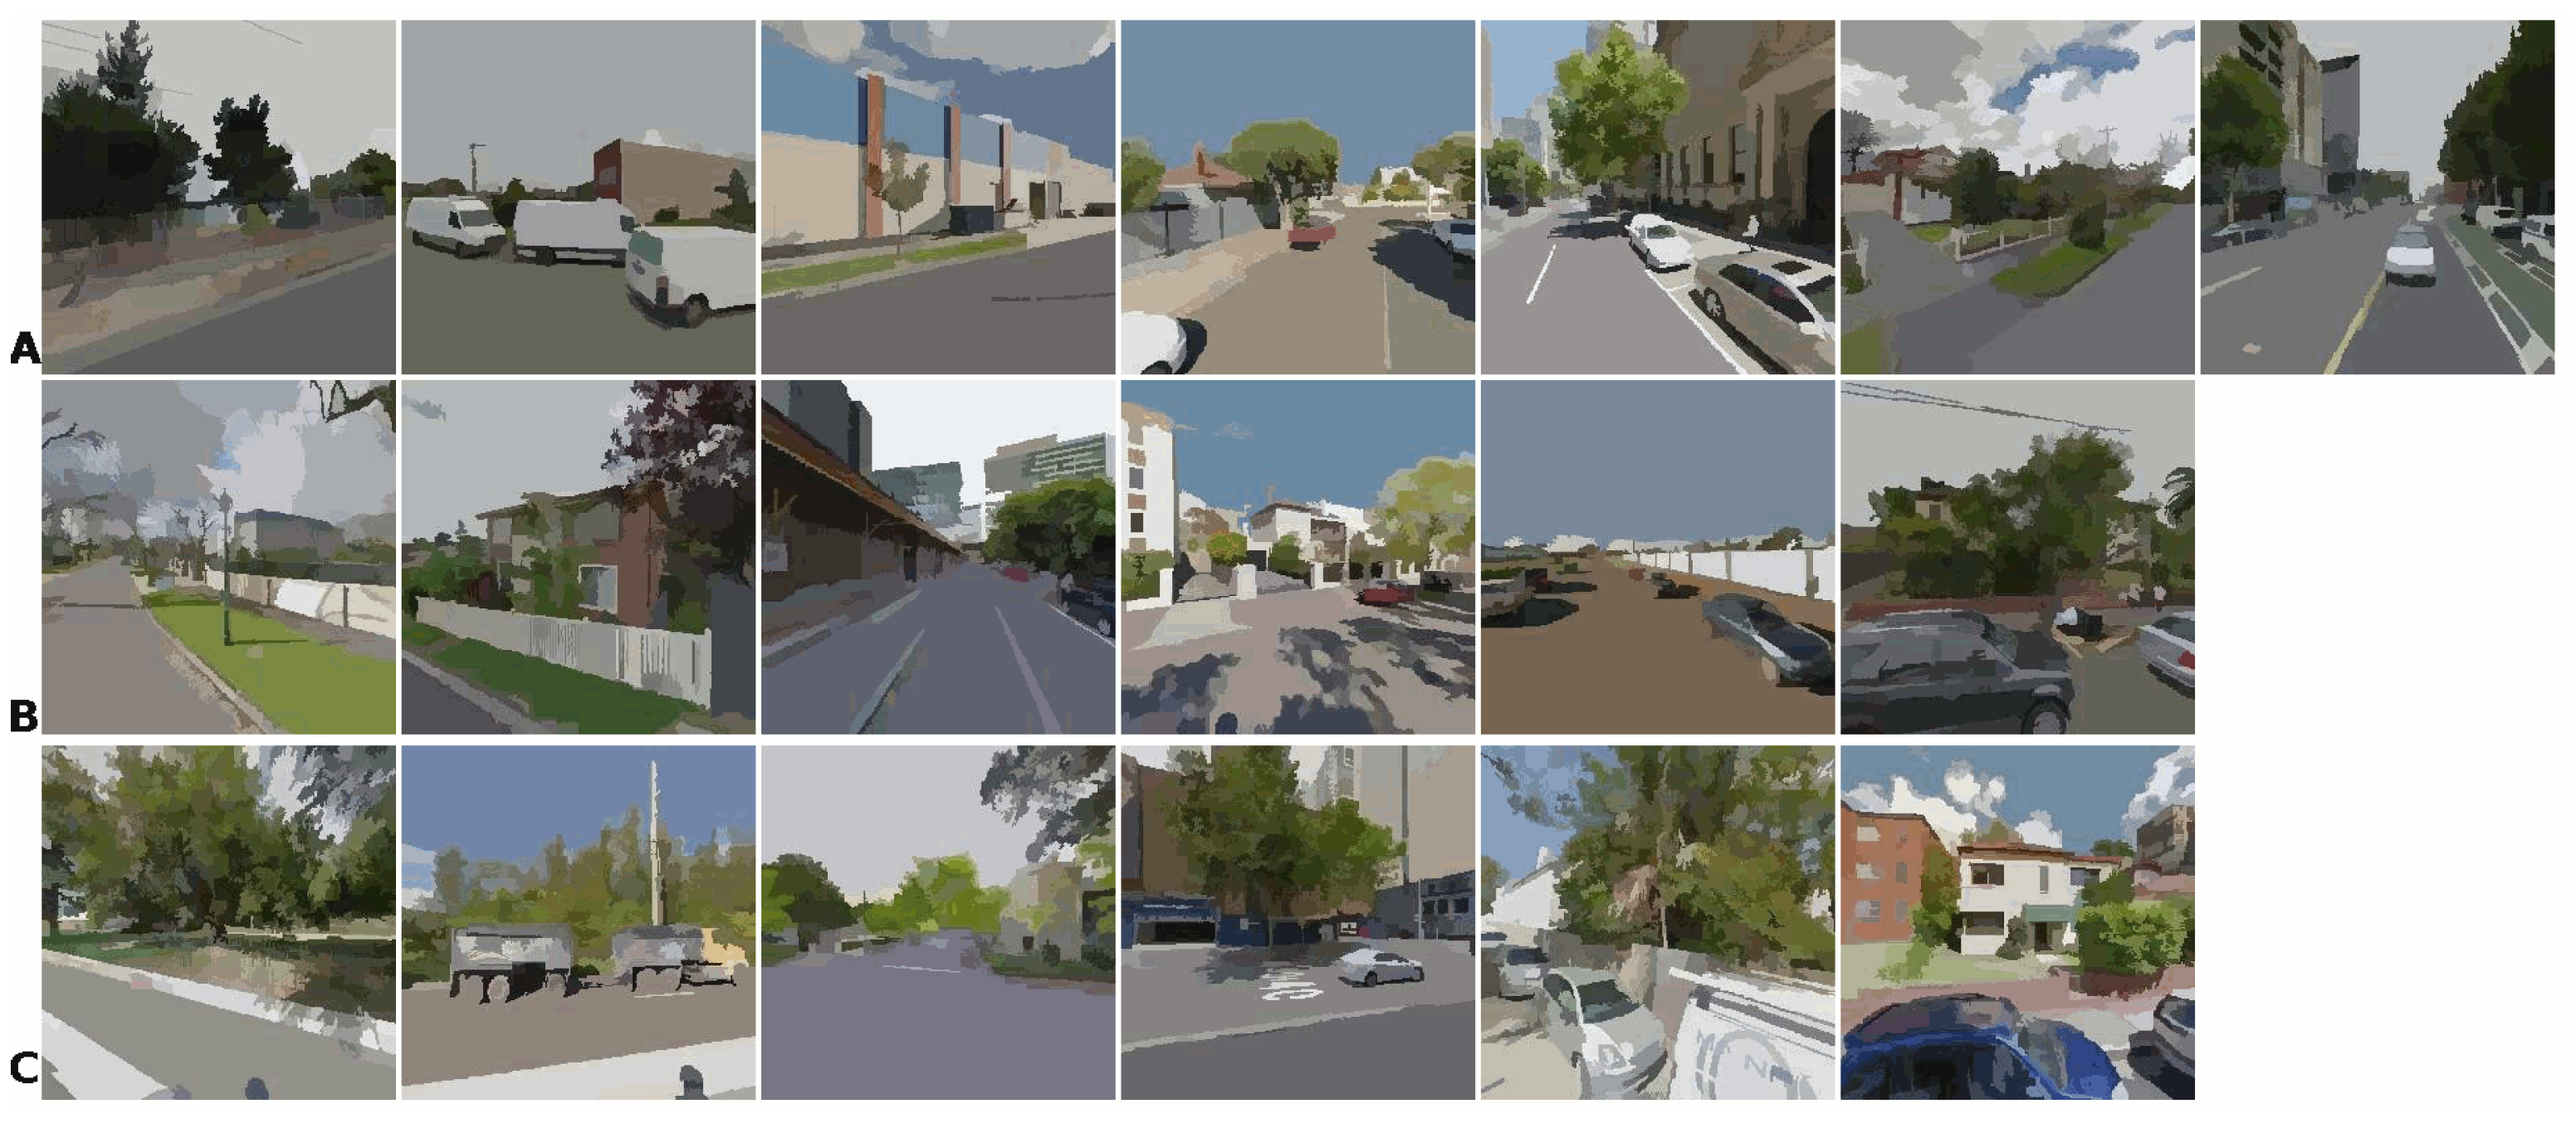
2.2. Imagery Sampling
2.3. Imagery Sources
2.4. Neural Network Training
2.5. Neural Network Inference
3. Results
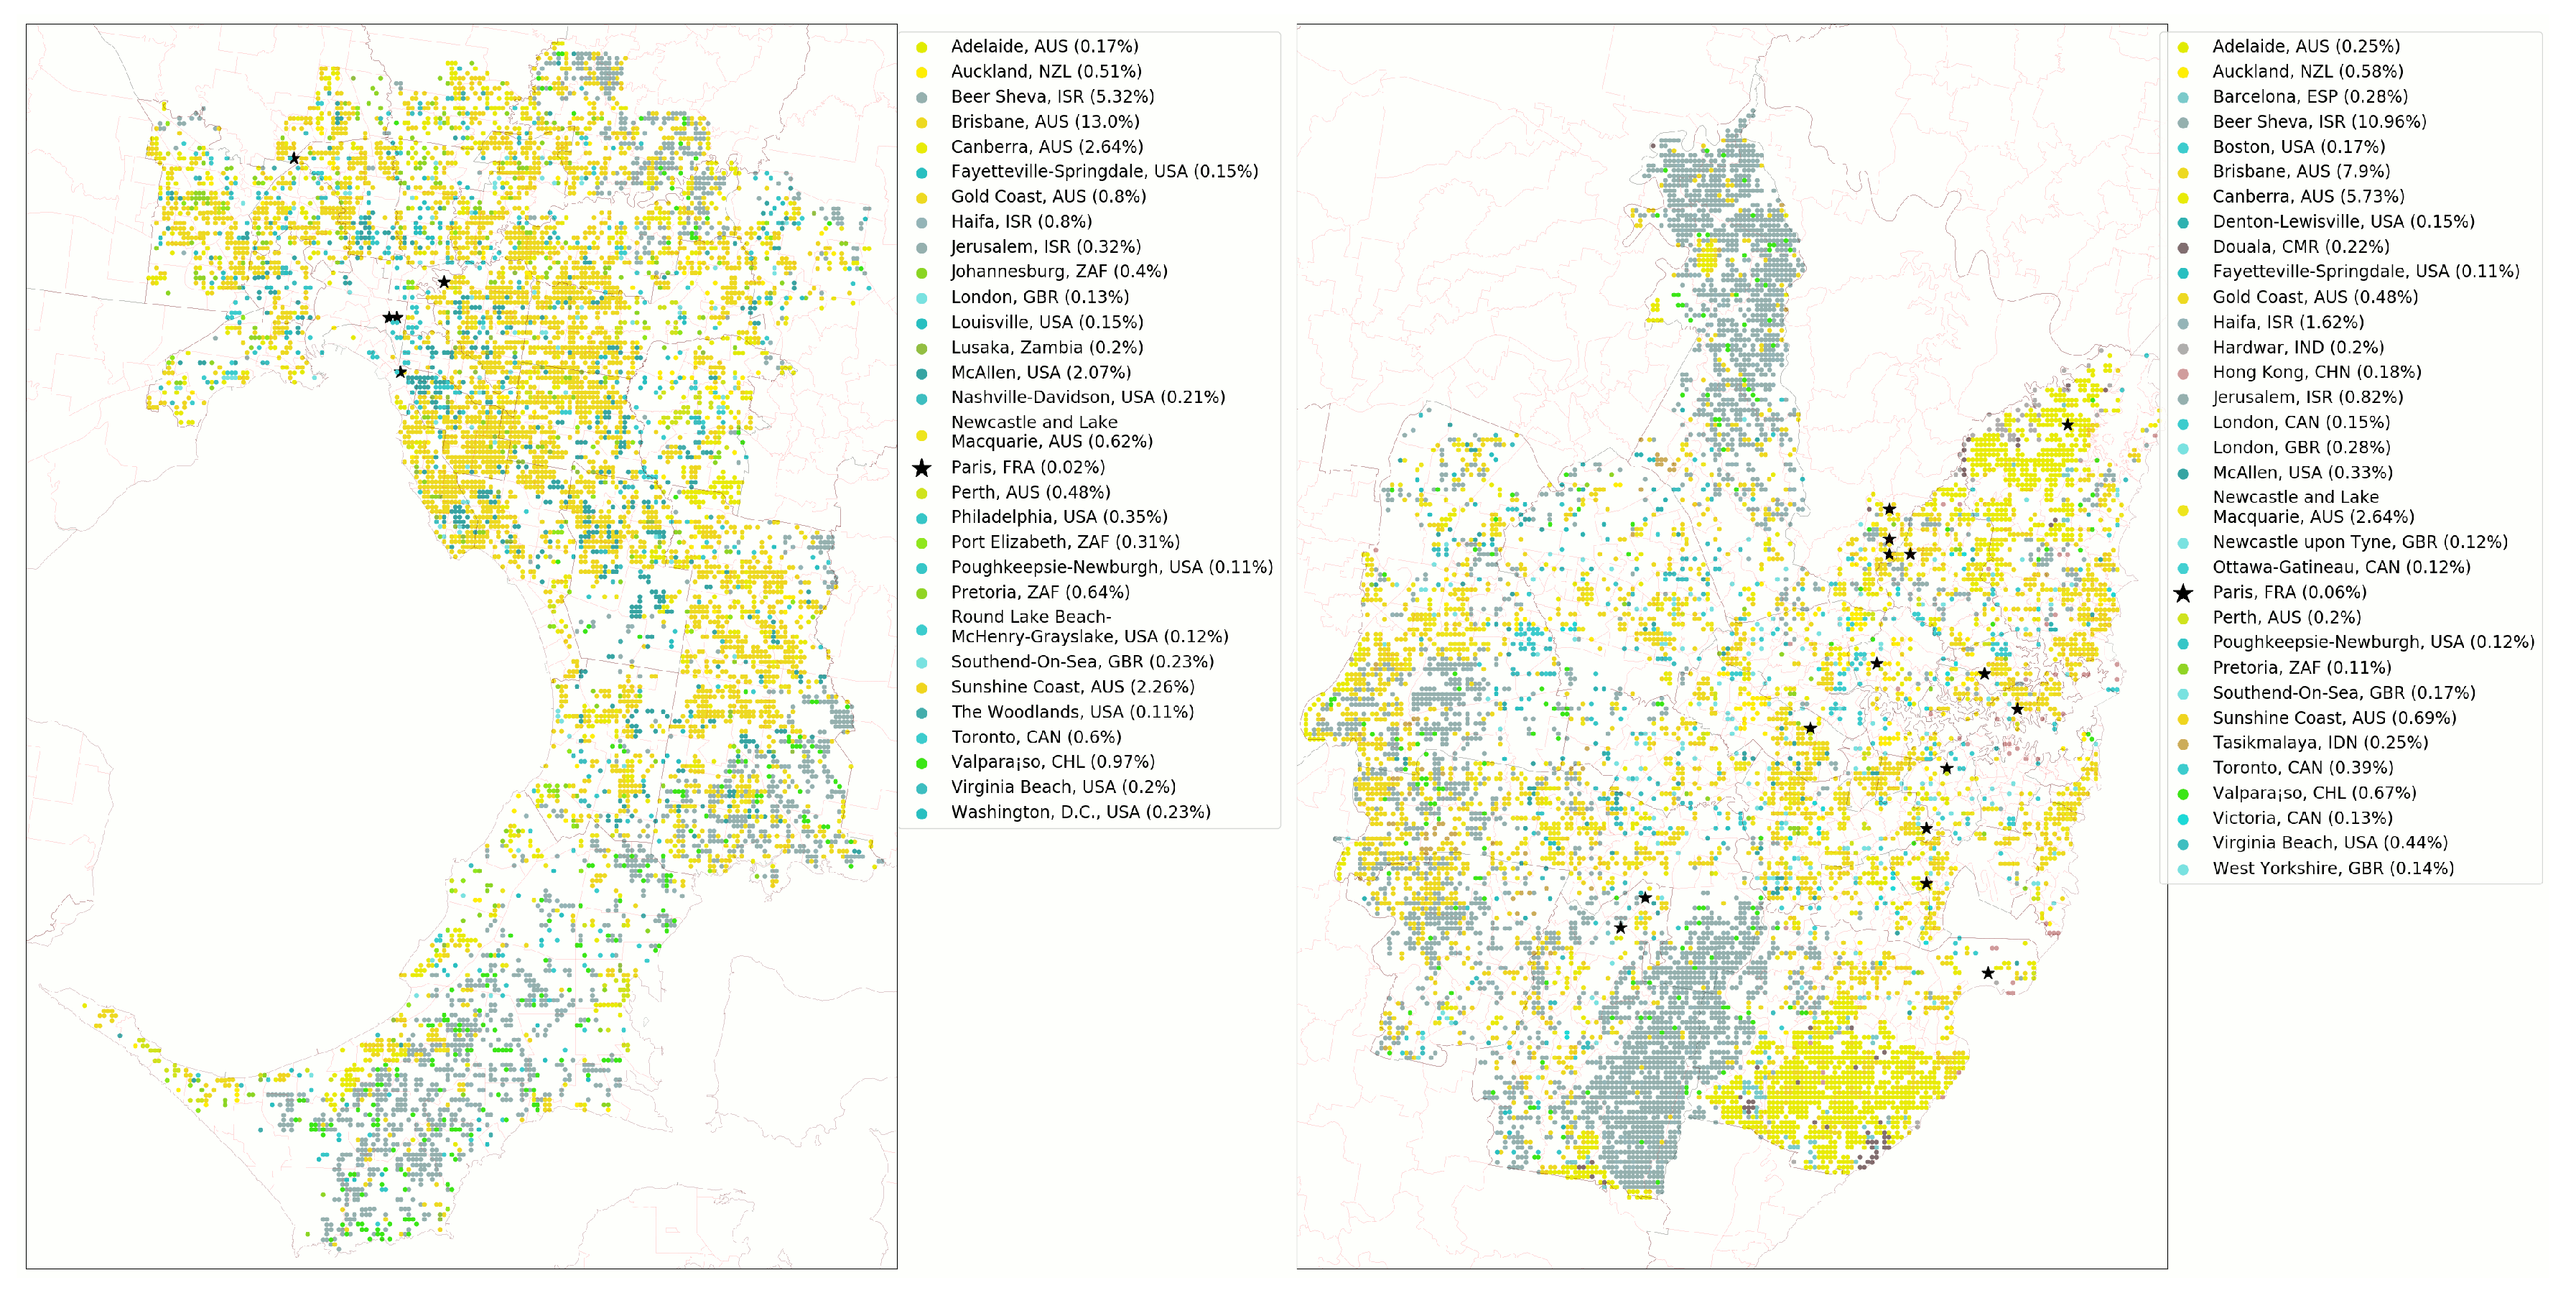
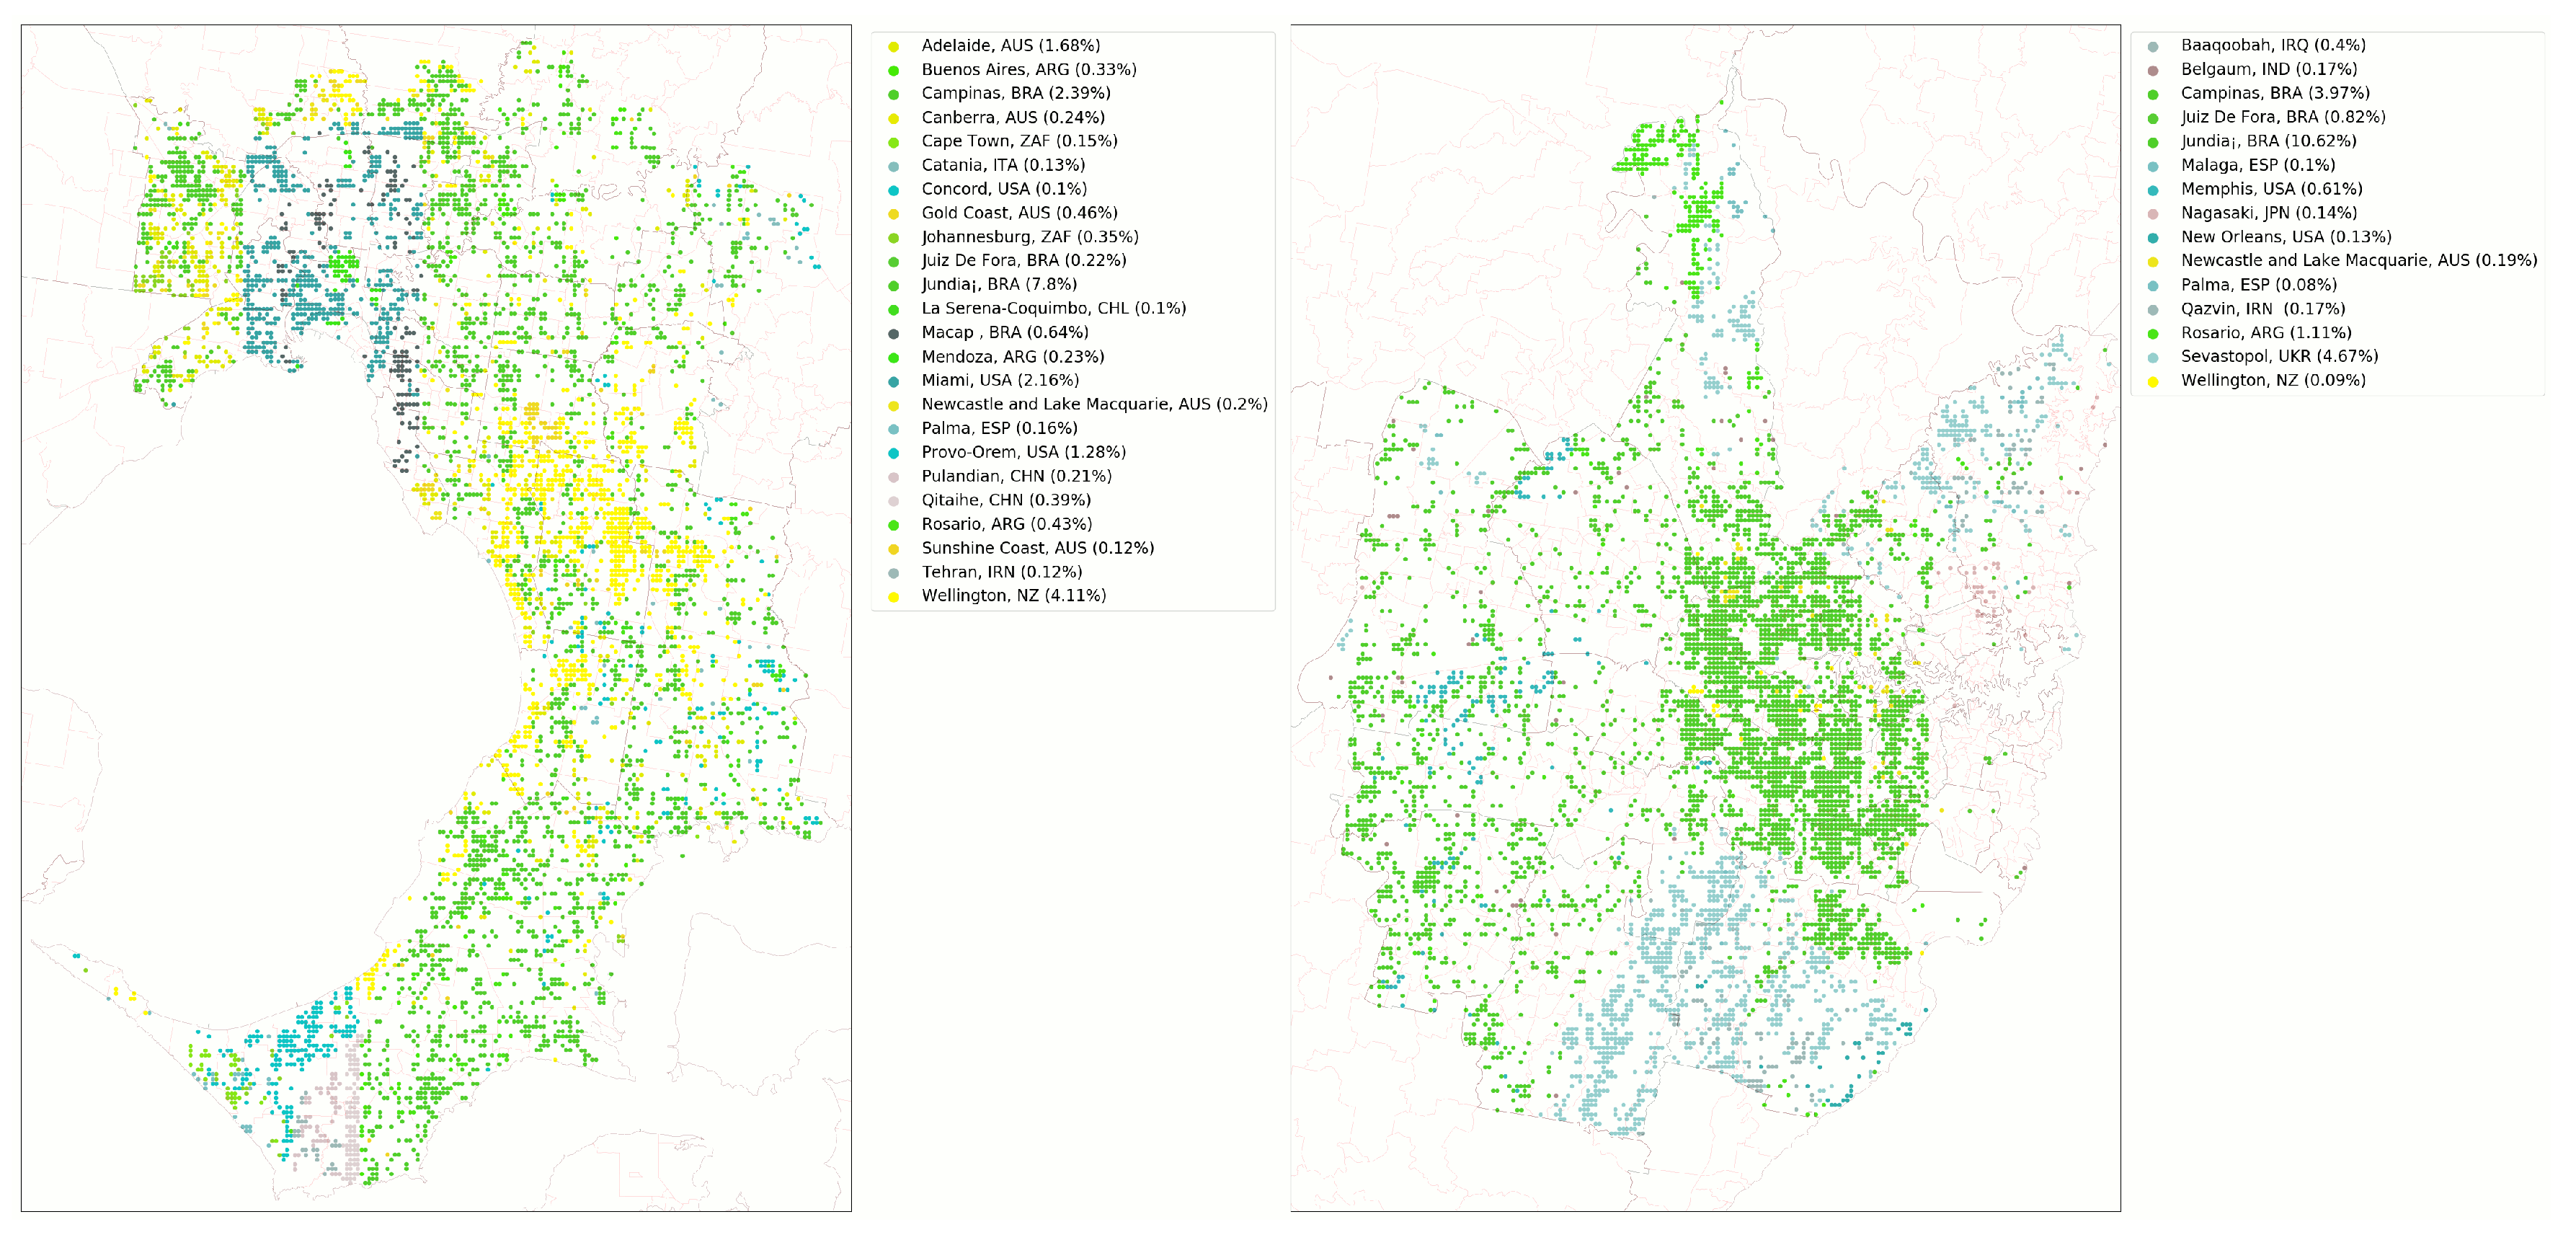
3.1. Top 20 Predicted Cities
3.2. Melbourne Evaluation
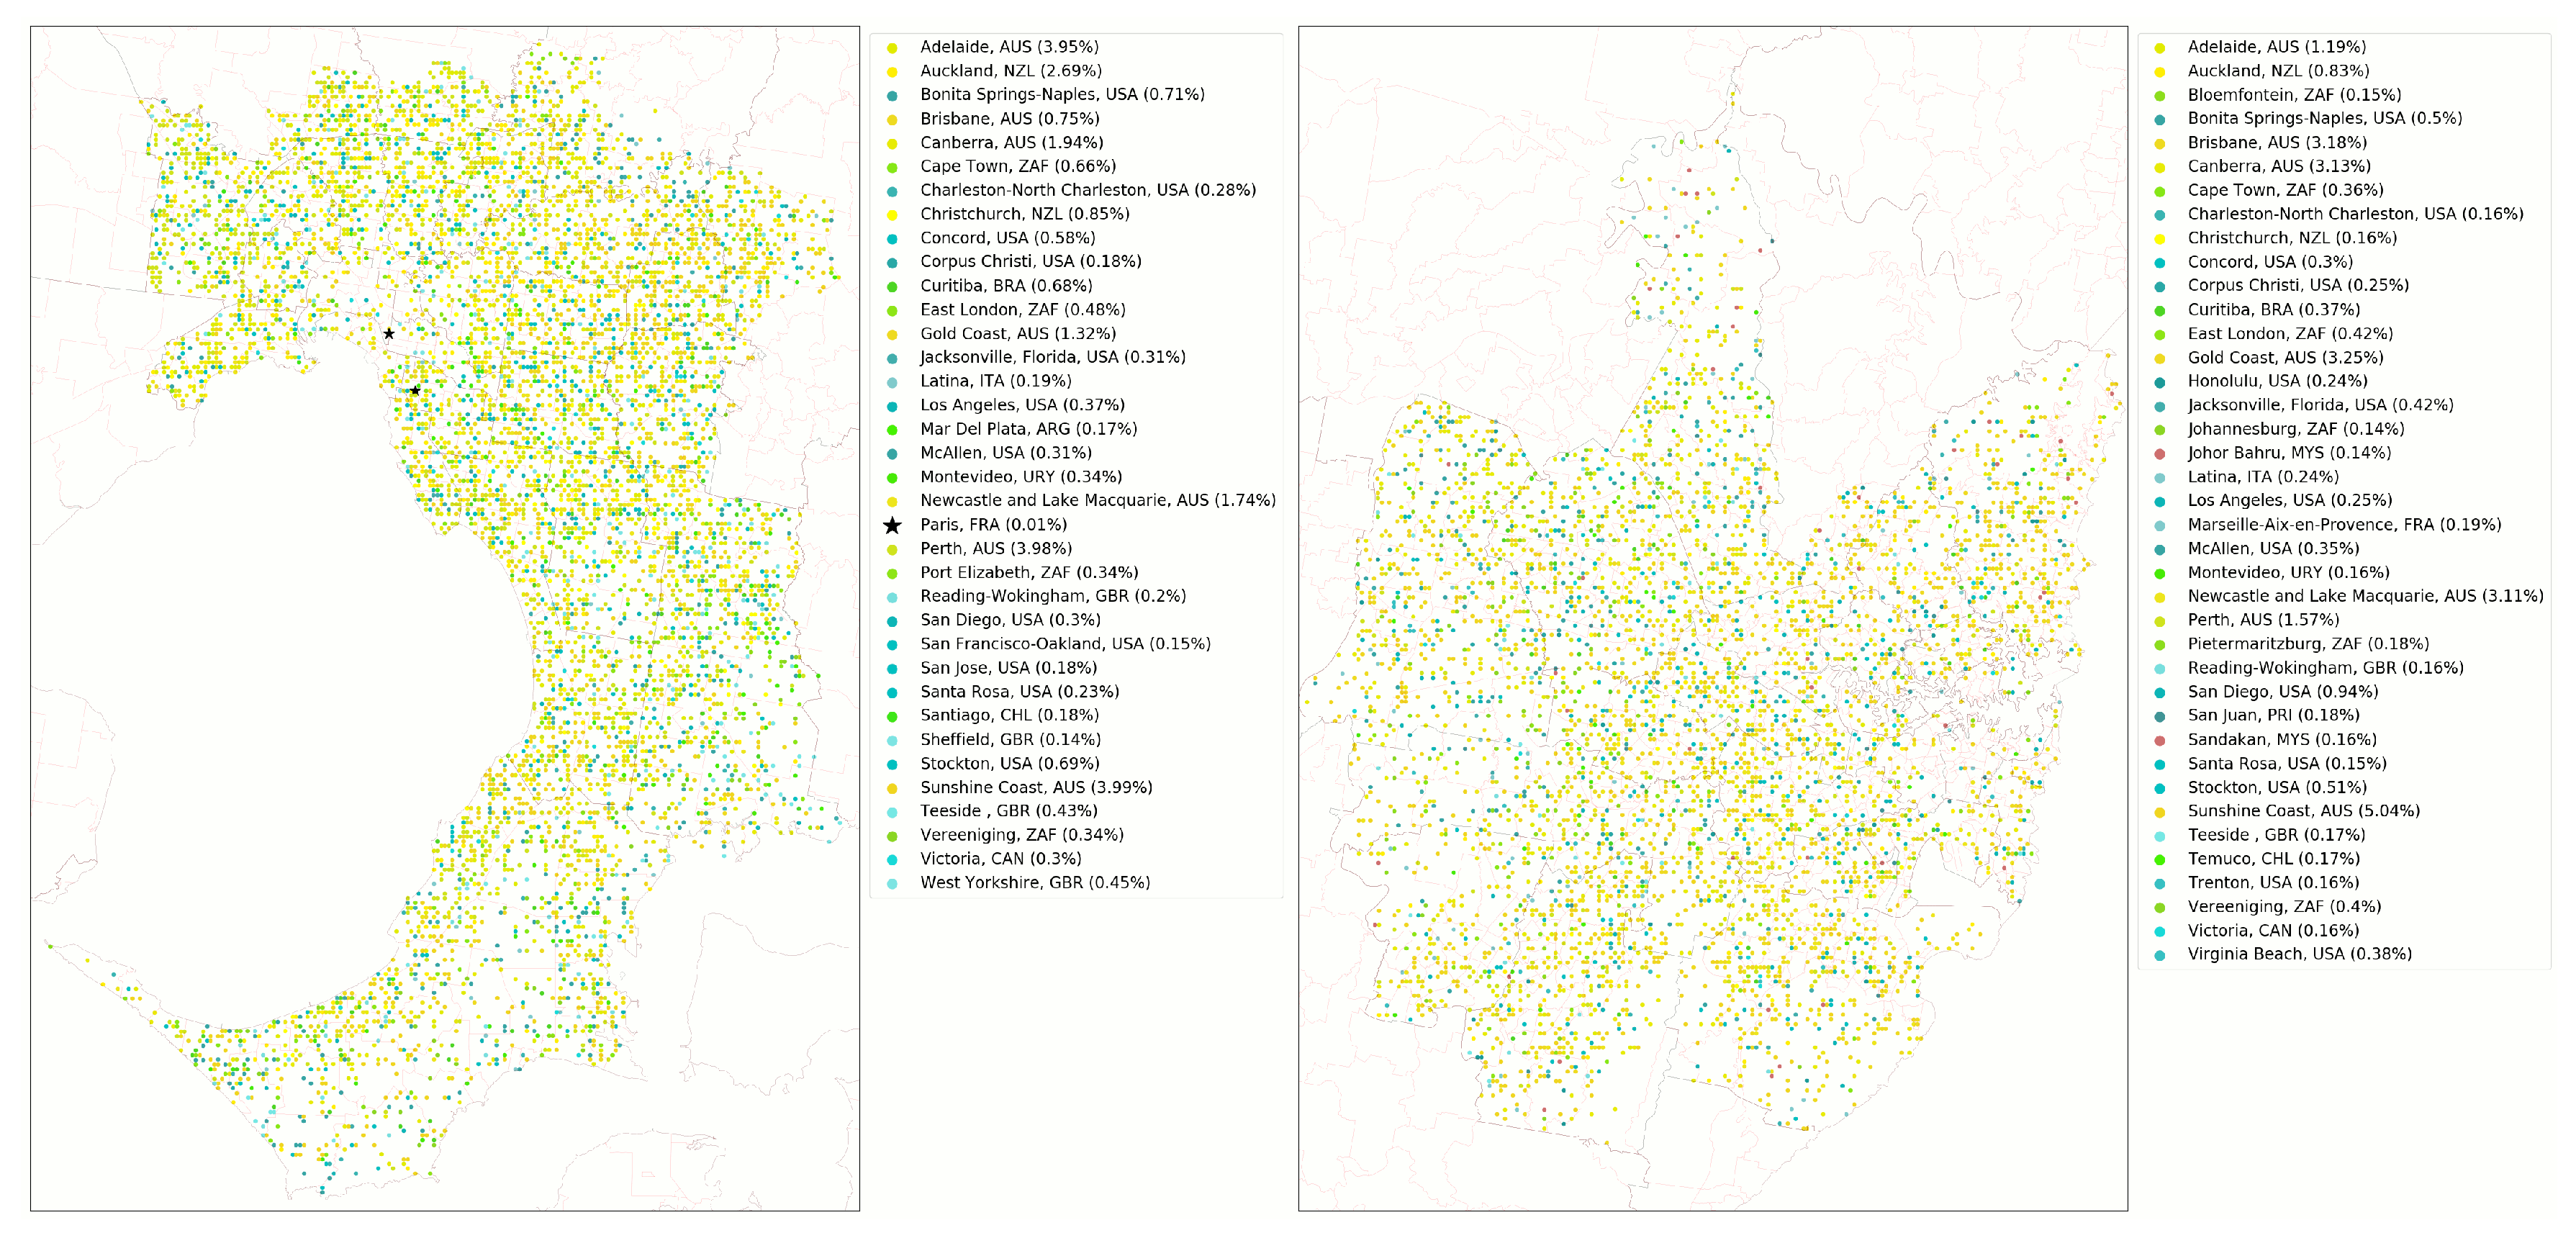
3.3. Sydney Evaluation
3.4. What Cities Are Similar to Paris?
4. Discussion
5. Conclusions
6. Data Availability
Author Contributions
Funding
Conflicts of Interest
References
- Giles-Corti, B.; Vernez-Moudon, A.; Reis, R.; Turrell, G.; Dannenberg, A.L.; Badland, H.; Foster, S.; Lowe, M.; Sallis, J.F.; Stevenson, M.; et al. Urban design, transport, and health 1 City planning and population health: A global challenge. Lancet 2016, 6736, 1–13. [Google Scholar] [CrossRef]
- Kleinert, S.; Horton, R. Urban design: An important future force for health and wellbeing. Lancet 2016, 6736, 1–11. [Google Scholar] [CrossRef]
- Goenka, S.; Andersen, L.B. Urban design and transport to promote healthy lives. Lancet 2016, 6736, 8–10. [Google Scholar] [CrossRef]
- Norman, J.; MacLean, H.L.; Kennedy, C.A. Comparing High and Low Residential Density: Life-Cycle Analysis of Energy Use and Greenhouse Gas Emissions. J. Urban Plan. Dev. 2006, 132, 10–21. [Google Scholar] [CrossRef]
- Daley, M.; Rissel, C. Perspectives and images of cycling as a barrier or facilitator of cycling. Transp. Policy 2011, 18, 211–216. [Google Scholar] [CrossRef]
- Zapata-Diomedi, B.; Knibbs, L.D.; Ware, R.S.; Heesch, K.C.; Tainio, M.; Woodcock, J.; Veerman, J.L. A shift from motorised travel to active transport: What are the potential health gains for an Australian city? PLoS ONE 2017, 12, 1–21. [Google Scholar] [CrossRef]
- Heesch, K.C.; Giles-Corti, B.; Turrell, G. Cycling for transport and recreation: Associations with socio-economic position, environmental perceptions, and psychological disposition. Prev. Med. 2014, 63, 29–35. [Google Scholar] [CrossRef]
- Cepeda, M.; Schoufour, J.; Freak-poli, R.; Koolhaas, C.M.; Dhana, K.; Bramer, W.M.; Franco, O.H. Levels of ambient air pollution according to mode of transport: A systematic review. Lancet Public Health 2016, 2, e23–e34. [Google Scholar] [CrossRef]
- Ming Wen, L.; Rissel, C. Inverse associations between cycling to work, public transport, and overweight and obesity: Findings from a population based study in Australia. Prev. Med. 2008, 46, 29–32. [Google Scholar] [CrossRef]
- Thompson, J.; Stevenson, M.; Wijnands, J.S.; Nice, K.A.; Aschwanden, G.D.P.A.; Silver, J.; Nieuwenhuijsen, M.; Rayner, P.; Schofield, R.; Hariharan, R.; et al. A global analysis of urban design types and road transport injury: An image processing study. Lancet Planet. Health 2020, 4, 32–42. [Google Scholar] [CrossRef]
- Wegener, M.; Gnad, F.; Vannahme, M. The Time Scale of Urban Change. In Advances in Urban Systems Modelling; Hutchinson, B., Batty, M., Eds.; Spiekermann-Wegener: Amsterdam, The Netherlands, 1986; pp. 175–197. [Google Scholar]
- Strano, E.; Nicosia, V.; Latora, V.; Porta, S.; Barthélemy, M. Elementary processes governing the evolution of road networks. Sci. Rep. 2012, 2. [Google Scholar] [CrossRef]
- Mundigo, A.I.; Crouch, D.P. The City Planning Ordinances of the Laws of the Indies Revisited. Part I: Their Philosophy and Implications. Town Plan. Rev. 1977, 48, 247–268. [Google Scholar] [CrossRef]
- Bandini, M. Typology As A Form Of Convention. AA Files 1984, 6, 73–82. [Google Scholar]
- Rossi, A. The Architecture of the City; The MIT Press: Cambridge, MA, USA, 1982; p. 201. [Google Scholar]
- Krier, R. Urban Space; Academy Editions: London, UK, 1979; p. 173. [Google Scholar]
- Crouch, D.P.; Mundigo, A.I. The City Planning Ordinances of the Laws of the Indies Revisited. Part II: Three American Cities. Town Plan. Rev. 1977, 48, 397–418. [Google Scholar] [CrossRef]
- Argan, C.G.; Rykwert, J. On the Typology of Architecture. Archit. Des. 1963, 33, 564–565. [Google Scholar]
- Harris, C.D. A Functional Classification of Cities in the United States. Geogr. Rev. 1943, 33, 86–99. [Google Scholar] [CrossRef]
- Nelson, H.J. A Service Classification of American Cities. Econ. Geogr. 1955, 31, 189–210. [Google Scholar]
- Bruce, G.D.; Witt, R.E. Developing Empirically Derived City Typologies: An Application of Cluster Analysis. Sociol. Q. 1971, 12, 238–246. [Google Scholar] [CrossRef]
- Hillier, B. Space Is the Machine; Cambridge University Press: Cambridge, UK, 1996. [Google Scholar] [CrossRef]
- Zhang, Q.; Seto, K.C. Can night-time light data identify typologies of urbanization? A global assessment of successes and failures. Remote Sens. 2013, 5, 3476–3494. [Google Scholar] [CrossRef]
- Hermosilla, T.; Palomar-Vázquez, J.; Balaguer-Beser, Á.; Balsa-Barreiro, J.; Ruiz, L.A. Using street based metrics to characterize urban typologies. Comput. Environ. Urban Syst. 2014, 44, 68–79. [Google Scholar] [CrossRef]
- Stewart, I.D.; Oke, T.R. Local Climate Zones for Urban Temperature Studies. Bull. Am. Meteorol. Soc. 2012, 93, 1879–1900. [Google Scholar] [CrossRef]
- Stewart, I.D.; Oke, T.R.; Krayenhoff, E.S. Evaluation of the ‘local climate zone’ scheme using temperature observations and model simulations. Int. J. Climatol. 2014, 34, 1062–1080. [Google Scholar] [CrossRef]
- Liu, L.; Zhou, B.; Zhao, J.; Ryan, B.D. C-IMAGE: City cognitive mapping through geo-tagged photos. GeoJournal 2016, 81, 817–861. [Google Scholar] [CrossRef]
- Zhou, B.; Liu, L.; Oliva, A.; Torralba, A. Recognizing city identity via attribute analysis of geo-tagged images. In Computer Vision—ECCV 2014. ECCV 2014. Lecture Notes in Computer Science; Fleet, D., Pajdla, T., Schiele, B., Tuytelaars, T., Eds.; Springer: Cham, Switzerland, 2014; Volume 8691, pp. 519–534. [Google Scholar] [CrossRef]
- Dubey, A.; Naik, N.; Parikh, D.; Raskar, R.; Hidalgo, C.A. Deep learning the city: Quantifying urban perception at a global scale. In Computer Vision—ECCV 2016; Lecture Notes in Computer Science (Including Subseries Lecture Notes in Artificial Intelligence and Lecture Notes in Bioinformatics); Springer: Cham, Switzerland, 2016; pp. 196–212. [Google Scholar] [CrossRef]
- Naik, N.; Philipoom, J.; Raskar, R.; Hidalgo, C. Streetscore—Predicting the Perceived Safety of One Million Streetscapes. In Proceedings of the 2014 IEEE Conference on Computer Vision and Pattern Recognition Workshops, Columbus, OH, USA, 23–28 June 2014; pp. 793–799. [Google Scholar] [CrossRef]
- Salesses, P.; Schechtner, K.; Hidalgo, C.A. The Collaborative Image of The City: Mapping the Inequality of Urban Perception. PLoS ONE 2013, 8. [Google Scholar] [CrossRef]
- Doersch, C.; Singh, S.; Gupta, A.; Sivic, J.; Efros, A. What Makes Paris Look like Paris? ACM Trans. Graph. Assoc. Comput. Mach. 2012, 31, HAL Id:hal-01053876. [Google Scholar] [CrossRef]
- Nice, K.; Aschwanden, G.; Wijnands, J.S.; Thompson, J.; Zhao, H.; Stevenson, M. The Nature of Human Settlement: Building an understanding of high performance city design. arxiv 2019, arXiv:1910.03219. [Google Scholar]
- Anholt, S. The Anholt-GMI City Brands Index: How the world sees the world’s cities. Place Brand. 2006, 2, 18–31. [Google Scholar] [CrossRef]
- Williams, R. Tower plans cast shadow over Collins Street’s Paris end. The Age, 10 May 2010. [Google Scholar]
- Wilden, N. ’France-Soir: A bite of Paris on the Yarra’. The Australian, 2 December 2013. [Google Scholar]
- Bishop, C.M. Neural Networks for Pattern Recognition; Clarendon Press: Oxford, UK, 1995; p. 482. [Google Scholar]
- Samarasinghe, S. Neural Networks for Applied Sciences and Engineering: From Fundamentals to Complex Pattern Recognition; CRC Press: Boca Raton, FL, USA, 2016; p. 570. [Google Scholar]
- Graupe, D. Advanced Series in Circuits and Systems: Volume 7 Principles of Artificial Neural Networks, 3rd ed.; University of Illinois: Chicago, IL, USA, 2013. [Google Scholar]
- Schmidhuber, J. Deep Learning in neural networks: An overview. Neural Netw. 2015, 61, 85–117. [Google Scholar] [CrossRef]
- Szegedy, C.; Liu, W.; Jia, Y.; Sermanet, P.; Reed, S.; Anguelov, D.; Erhan, D.; Vanhoucke, V.; Rabinovich, A. Going deeper with convolutions. In Proceedings of the IEEE Computer Society Conference on Computer Vision and Pattern Recognition, Boston, MA, USA, 7–12 June 2015; pp. 1–9. [Google Scholar] [CrossRef]
- Ioffe, S.; Szegedy, C. Batch Normalization: Accelerating Deep Network Training by Reducing Internal Covariate Shift. In Proceedings of the 32nd International Conference on Machine Learning, Lille, France, 6–11 July 2015. [Google Scholar] [CrossRef]
- United Nations. World Urbanization Prospects; The 2014 Revision, CD-ROM Edition; Department of Economic and Social Affairs, Population Division: New York, NY, USA, 2014. [Google Scholar]
- Barthelemy, M. The Structure and Dynamics of Cities: Urban Data Analysis and Theoretical Modeling; Cambridge University Press: Cambridge, UK, 2016; p. 278. [Google Scholar] [CrossRef]
- Day, J.; Chen, Y.; Ellis, P.; Roberts, M. A Free, Open-Source Tool for Identifying Urban Agglomerations using Point Data. Spat. Econ. Anal. 2016, 11, 67–91. [Google Scholar] [CrossRef]
- Day, J.; Chen, Y.; Ellis, P.; Roberts, M. A free, open-source tool for identifying urban agglomerations using polygon data. Environ. Syst. Decis. 2017, 37, 68–87. [Google Scholar] [CrossRef]
- Quistberg, D.A.; Roux, A.V.D.; Bilal, U.; Moore, K.; Ortigoza, A.; Rodriguez, D.A.; Sarmiento, O.L.; Frenz, P.; Friche, A.A.; Caiaffa, W.T.; et al. Building a Data Platform for Cross-Country Urban Health Studies: The SALURBAL Study. J. Urban Health 2019, 96, 311–337. [Google Scholar] [CrossRef] [PubMed]
- Arribas-Bel, D.; Garcia-Lopez, M.A.; Viladecans-Marsal, E. Building(s and) cities: Delineating urban areas with a machine learning algorithm. J. Urban Econ. 2019. [Google Scholar] [CrossRef]
- Dijkstra, L.; Poelman, H.; Veneri, P. The EU-OECD Definition of a Functional Urban Area; OECD Regional Development Working Papers; OECD: Paris, France, 2019. [Google Scholar] [CrossRef]
- Sinnott, R. Virtues of the Haversine. Sky Telesc. 1984, 68, 159. [Google Scholar]
- Google Maps. Google Static Maps API. 2017. Available online: https://developers.google.com/maps/documentation/static-maps (accessed on 15 June 2017).
- Google Maps. Google Street View API. 2017. Available online: https://developers.google.com/maps/documentation/streetview/ (accessed on 15 June 2017).
- Google. Only Clear Skies on Google Maps and Earth. 2013. Available online: https://maps.googleblog.com/2013/06/only-clear-skies-on-google-maps-and.html (accessed on 20 April 2020).
- Baidu. Baidu Street View API. 2017. Available online: http://api.map.baidu.com/ (accessed on 15 June 2017).
- Pymeanshift. Python Module for Mean Shift Image Segmentation. 2017. Available online: https://github.com/fjean/pymeanshift (accessed on 15 June 2017).
- Yu, D.; Eversole, A.; Seltzer, M.L.; Yao, K.; Huang, Z.; Guenter, B.; Kuchaiev, O.; Zhang, Y.; Seide, F.; Wang, H.; et al. An Introduction to Computational Networks and the Computational Network Toolkit. Microsoft Technical Report MSR-TR-2014–112; Technical Report; Microsoft: Redmond, WA, USA, 2015. [Google Scholar]
- Kohavi, R.; Provost, F. Glossary of Terms. Mach. Learn. 1998, 30, 271–274. [Google Scholar]
- Wijnands, J.S.; Nice, K.A.; Thompson, J.; Zhao, H.; Stevenson, M. Streetscape augmentation using generative adversarial networks: Insights related to health and wellbeing. Sustain. Cities Soc. 2019. [Google Scholar] [CrossRef]
- Li, X.; Zhang, C.; Li, W.; Ricard, R.; Meng, Q.; Zhang, W. Assessing street-level urban greenery using Google Street View and a modified green view index. Urban For. Urban Green. 2015, 14, 675–685. [Google Scholar] [CrossRef]


| Abbreviation | Imagery Source |
|---|---|
| GM | Google Static Maps, image type of “map” |
| GS | Google Static Maps, image type of “satellite” |
| GSV-BSV | Google Street View/Baidu Street View |
| (a). GM | ||
|---|---|---|
| Predicted City | Mel % | Syd % |
| Brisbane, AUS | 13.0 | 7.9 |
| Beer Sheva, ISR | 5.3 | 11.0 |
| Canberra, AUS | 2.6 | 5.7 |
| Sunshine Coast, AUS | 2.3 | 0.7 |
| McAllen, USA | 2.1 | 0.3 |
| Valparaíso, CHL | 1.0 | 0.7 |
| Haifa, ISR | 0.8 | 1.6 |
| Gold Coast, AUS | 0.8 | 0.5 |
| Pretoria, ZAF | 0.6 | - |
| Newcastle, AUS | 0.6 | 2.6 |
| Toronto, CAN | 0.6 | 0.4 |
| Auckland, NZL | 0.5 | 0.6 |
| Perth, AUS | 0.5 | - |
| Johannesburg, ZAF | 0.4 | - |
| Philadelphia, USA | 0.4 | - |
| Jerusalem, ISR | 0.2 | 0.8 |
| Port Elizabeth, ZAF | 0.3 | - |
| Washington, D.C., USA | 0.2 | - |
| Southend-On-Sea, GBR | 0.2 | - |
| Virginia Beach, USA | - | 0.4 |
| London, GBR | - | 0.3 |
| Barcelona, ESP | - | 0.3 |
| Adelaide, AUS | - | 0.3 |
| Tasikmalaya, IDN | - | 0.3 |
| Douala, CMR | - | 0.2 |
| Hardwar, IND | - | 0.2 |
| (b). GS | ||
| Predicted city | Mel % | Syd % |
| Jundiaí, BRA | 7.8 | 10.6 |
| Wellington, NZ | 4.1 | 0.09 |
| Campinas, BRA | 2.4 | 4.0 |
| Miami, USA | 2.2 | - |
| Adelaide, AUS | 1.7 | - |
| Provo-Orem, USA | 1.3 | - |
| Macapá, BRA | 0.6 | - |
| Gold Coast, AUS | 0.5 | - |
| Rosario, ARG | 0.4 | 1.1 |
| Qitaihe, CHN | 0.4 | - |
| Johannesburg, ZAF | 0.4 | 0.05 |
| Buenos Aires, ARG | 0.3 | - |
| Canberra, AUS | 0.2 | - |
| Mendoza, ARG | 0.2 | - |
| Juiz De Fora, BRA | 0.2 | 0.8 |
| Pulandian, CHN | 0.2 | - |
| Newcastle, AUS | 0.2 | 0.2 |
| Palma, ESP | 0.2 | 0.08 |
| Cape Town, ZAF | 0.2 | - |
| Sevastopol, UKR | - | 4.7 |
| Memphis, USA | - | 0.6 |
| Baaqoobah, IRQ | - | 0.4 |
| Belgaum, IND | - | 0.2 |
| Qazvin, IRN | - | 0.2 |
| Nagasaki, JPN | - | 0.1 |
| New Orleans, USA | - | 0.1 |
| Malaga, ESP | - | 0.1 |
| Guayaquil, ECU | - | 0.07 |
| Khabarovsk, RUS | - | 0.06 |
| Chiinu, MDA | - | 0.05 |
| (c). GSV-BSV | ||
| Predicted city | Mel % | Syd % |
| Sunshine Coast, AUS | 4.0 | 5.0 |
| Perth, AUS | 4.0 | 1.6 |
| Adelaide, AUS | 4.0 | 1.2 |
| Auckland, NZL | 2.7 | 0.8 |
| Canberra, AUS | 1.9 | 3.1 |
| Newcastle, AUS | 1.7 | 3.1 |
| Gold Coast, AUS | 1.3 | 3.3 |
| Christchurch, NZL | 0.9 | - |
| Brisbane, AUS | 0.8 | 3.2 |
| Bonita Springs, USA | 0.7 | 0.5 |
| Stockton, USA | 0.7 | 0.5 |
| Curitiba, BRA | 0.7 | 0.4 |
| Cape Town, ZAF | 0.7 | 0.4 |
| Concord, USA | 0.6 | 0.3 |
| East London, ZAF | 0.5 | 0.4 |
| West Yorkshire, GBR | 0.5 | - |
| Teeside, GBR | 0.4 | - |
| Los Angeles, USA | 0.4 | - |
| Montevideo, URY | 0.3 | - |
| San Diego, USA | - | 0.9 |
| Jacksonville, USA | - | 0.4 |
| Vereeniging, ZAF | - | 0.4 |
| Virginia Beach, USA | - | 0.4 |
| McAllen, USA | - | 0.4 |
| Melbourne | Sydney | |||
|---|---|---|---|---|
| Neural Network | Matches | % Matching | Matches | % Matching |
| GM | 22 | 0.1 | 54 | 0.22 |
| GM (filtered < 50%) | 5 | 0.02 | 15 | 0.06 |
| GS | 1 | 0.00004 | 0 | 0 |
| GS (filtered < 50%) | 0 | 0 | 0 | 0 |
| GSV-BSV | 13 | 0.06 | 6 | 0.04 |
| GSV-BSV (filtered < 50%) | 2 | 0.01 | 0 | 0 |
© 2020 by the authors. Licensee MDPI, Basel, Switzerland. This article is an open access article distributed under the terms and conditions of the Creative Commons Attribution (CC BY) license (http://creativecommons.org/licenses/by/4.0/).
Share and Cite
Nice, K.A.; Thompson, J.; Wijnands, J.S.; Aschwanden, G.D.P.A.; Stevenson, M. The “Paris-End” of Town? Deriving Urban Typologies Using Three Imagery Types. Urban Sci. 2020, 4, 27. https://doi.org/10.3390/urbansci4020027
Nice KA, Thompson J, Wijnands JS, Aschwanden GDPA, Stevenson M. The “Paris-End” of Town? Deriving Urban Typologies Using Three Imagery Types. Urban Science. 2020; 4(2):27. https://doi.org/10.3390/urbansci4020027
Chicago/Turabian StyleNice, Kerry A., Jason Thompson, Jasper S. Wijnands, Gideon D. P. A. Aschwanden, and Mark Stevenson. 2020. "The “Paris-End” of Town? Deriving Urban Typologies Using Three Imagery Types" Urban Science 4, no. 2: 27. https://doi.org/10.3390/urbansci4020027
APA StyleNice, K. A., Thompson, J., Wijnands, J. S., Aschwanden, G. D. P. A., & Stevenson, M. (2020). The “Paris-End” of Town? Deriving Urban Typologies Using Three Imagery Types. Urban Science, 4(2), 27. https://doi.org/10.3390/urbansci4020027