1. Introduction
Walkability has emerged over the last decades as a key topic in health, transport and urban research. Numerous walkability indexes have been developed for research and practice, incorporating various measures of density, functional mix and access networks [
1,
2,
3,
4]. While reducing distances between people and destinations, these key dimensions of urbanity are also synergistically interconnected [
5,
6]. A change to either density, mix or access can lead to a chain of transformations involving the others. Complicating this further, each of these interlinked properties is itself complex and multiplicitous, with various measures only capturing partial aspects of these. Within this broad field of walkability studies, our focus here is on the exploration of how the morphology of the public space at street level directly mediates capacities for walking.
Among studies of urban access networks, there are two distinct approaches. Street network studies focus on street configuration or connectivity. These rely on graph models that use road centre lines or other axial abstractions of the streetspace to calculate various topological network properties. Such measures include the “centrality” and “betweenness” of each street segment relative to the larger network. While there are major differences among such models [
7], a common characteristic is that these make abstraction of street width, shape and sometimes even length. Yet these basic geometric attributes of streets are crucial to their capacity to enable mobility and social interaction [
8]. While topological measures can embed such spatial attributes by weighting the “value” of each network element according to one or more of its spatial properties (such as length or width) [
9], such measures are not able to consider geometric properties that have been lost in the process of converting a morphology into a network model, such as the capacity to cross diagonally a broad street or a square. Furthermore, such hybrid measures run the risk of conflating entirely different properties into a number that conceals key differences.
A second kind of approach in the study of pedestrian access is that of morphological studies, which focus on the analysis of urban form. The spatiality of the urban fabric is captured through mapping, which is then analysed visually, identifying patterns [
10,
11,
12]. Maps are not replaceable with algebraic methods, as maps embody spatial knowledge that is not reducible to simple metrics [
13]. Nevertheless, given the impetus for statistical analysis, various metrics of urban form related to access have proliferated [
14,
15]. By metrics of urban form, we mean here only direct measures of actual urban form, and do not include measures of topological models that are independent of urban forms and distances. Such measures of morphologies can be grouped into two types: permeability measures that quantify the ease of movement through the urban fabric, and catchment measures that quantify the potential to reach destinations within walking distance. This corresponds with the distinction made in transport studies between resistance against and attraction of movement [
16]. While various such measures have been in use, including average block area, block diagonal, intersection density and pedsheds, it has been shown that many of these are poor proxies for permeability and catchment, the capacities to walk through and to the urban fabric [
17]. Instead, Pafka & Dovey have proposed two new measures: the area-weighted average perimeter (AwaP) and interface catchment (IC) that, combined, can better capture the capacities of urban fabrics to enable and attract pedestrian movement [
17].
AwaP calculates the average perimeter of urban blocks within a study area, weighing the perimeter of each block by its area. This way, the impact of a large block will be proportional with the share of the study area it occupies, and its effect as a major barrier to movement is not lost in the average. The lower the AwaP, the easier it is to walk through the urban fabric. An AwaP of 400 m corresponds to a square block of 100 × 100 m, often taken as the maximum block length that still allows good permeability. IC measures the total length of public/private interfaces reachable from a starting point and within a given walking distance. IC is relevant for walking as most urban attractions, such as dwellings, shops and workplaces, are accessed through the public/private interface, where buildings meet the street [
18]. High IC values indicate high capacity for accommodating urban attractions. Together, these two measures account for both street width and block size, measuring both walkable access and what one may get access to [
17].
In the past decades, urban research has increasingly benefited from big data and computational power. Until now, this has been most apparent in street network studies [
19,
20,
21,
22] that benefited from the widespread use of road models in transport planning and the computational power of GIS applications. Morphological studies, on the other hand, have largely remained reliant on hand-drawn maps, or graphic software enabled tracing of urban form [
10,
11,
12,
23]. Seeking to overcome these limitations in urban morphological research, this paper presents the development of the GIS tool “AwaP-IC” for measuring two key morphological properties of the urban fabric related to walkable access. The main challenge this tool had to overcome was to bridge between the logic of walkability through Euclidean space, an infinity of route choices within a continuous urban space, and the logic of the GIS platform, based on relations between a defined set of points. Thus, a key contribution this paper seeks to make is to open new ways of combining GIS computational power with morphological studies. The algorithms developed in this process may be used in or be the basis for many more complex applications of GIS to the study of urban form. Also, to our knowledge, the algorithm used in the IC tool is the first computational approach for calculating catchment that supports walking through open space. As such, it presents a novel contribution.
In the following section, we will present the algorithms developed for the AwaP-IC tool. Then, we will illustrate applications of the tool, based on a case study in Madrid. In the final section, we will discuss the broader implications for walkability and morphological research, and highlight potentials for further development and use.
2. AwaP-IC Tool
While AwaP and IC should be considered together in the analysis of walkable access, in this (1.0) version of the AwaP-IC tool, the two measures are provided by distinct QGIS plugins (in the
Supplementary Materials). The minimum required QGIS version for these plugins is 3.4. The plugins have been developed in Python using only the spatial computation libraries embedded in QGIS and will work on any desktop version of the software without the need to install any third-party libraries or additions.
The base requirement for the calculation of AwaP and IC is a layer of urban blocks drawn as polygons, or closed polylines. Lines within the blocks, such as lot subdivisions, will be ignored. However, other errors in the urban blocks layer may not be recognised by the software, and may lead to errors or long processing times. As both AwaP and IC are calculated in metres, a projected coordinate system should be used in the QGIS project. Instead of the very common WGS84 -EPSG:4326, which uses degrees as a unit for distance, the WGS84/Pseudo-Mercator—EPSG:3857, which measures distances in metres, may be used.
2.1. AwaP Tool
The area-weighted average perimeter (AwaP) is a measure of permeability [
17] that takes into consideration the perimeters and areas of all urban blocks within a given study area, and is calculated as:
where
n is the number of blocks,
Pi and
Ai are the perimeter and the area of block
i, respectively, and
AT is the total area of all blocks combined. Low AwaP scores indicate high permeability and high scores indicate low permeability within the given area. Large open spaces within the study area will not affect AwaP as they pose no barriers to movement, but will have an impact on IC.
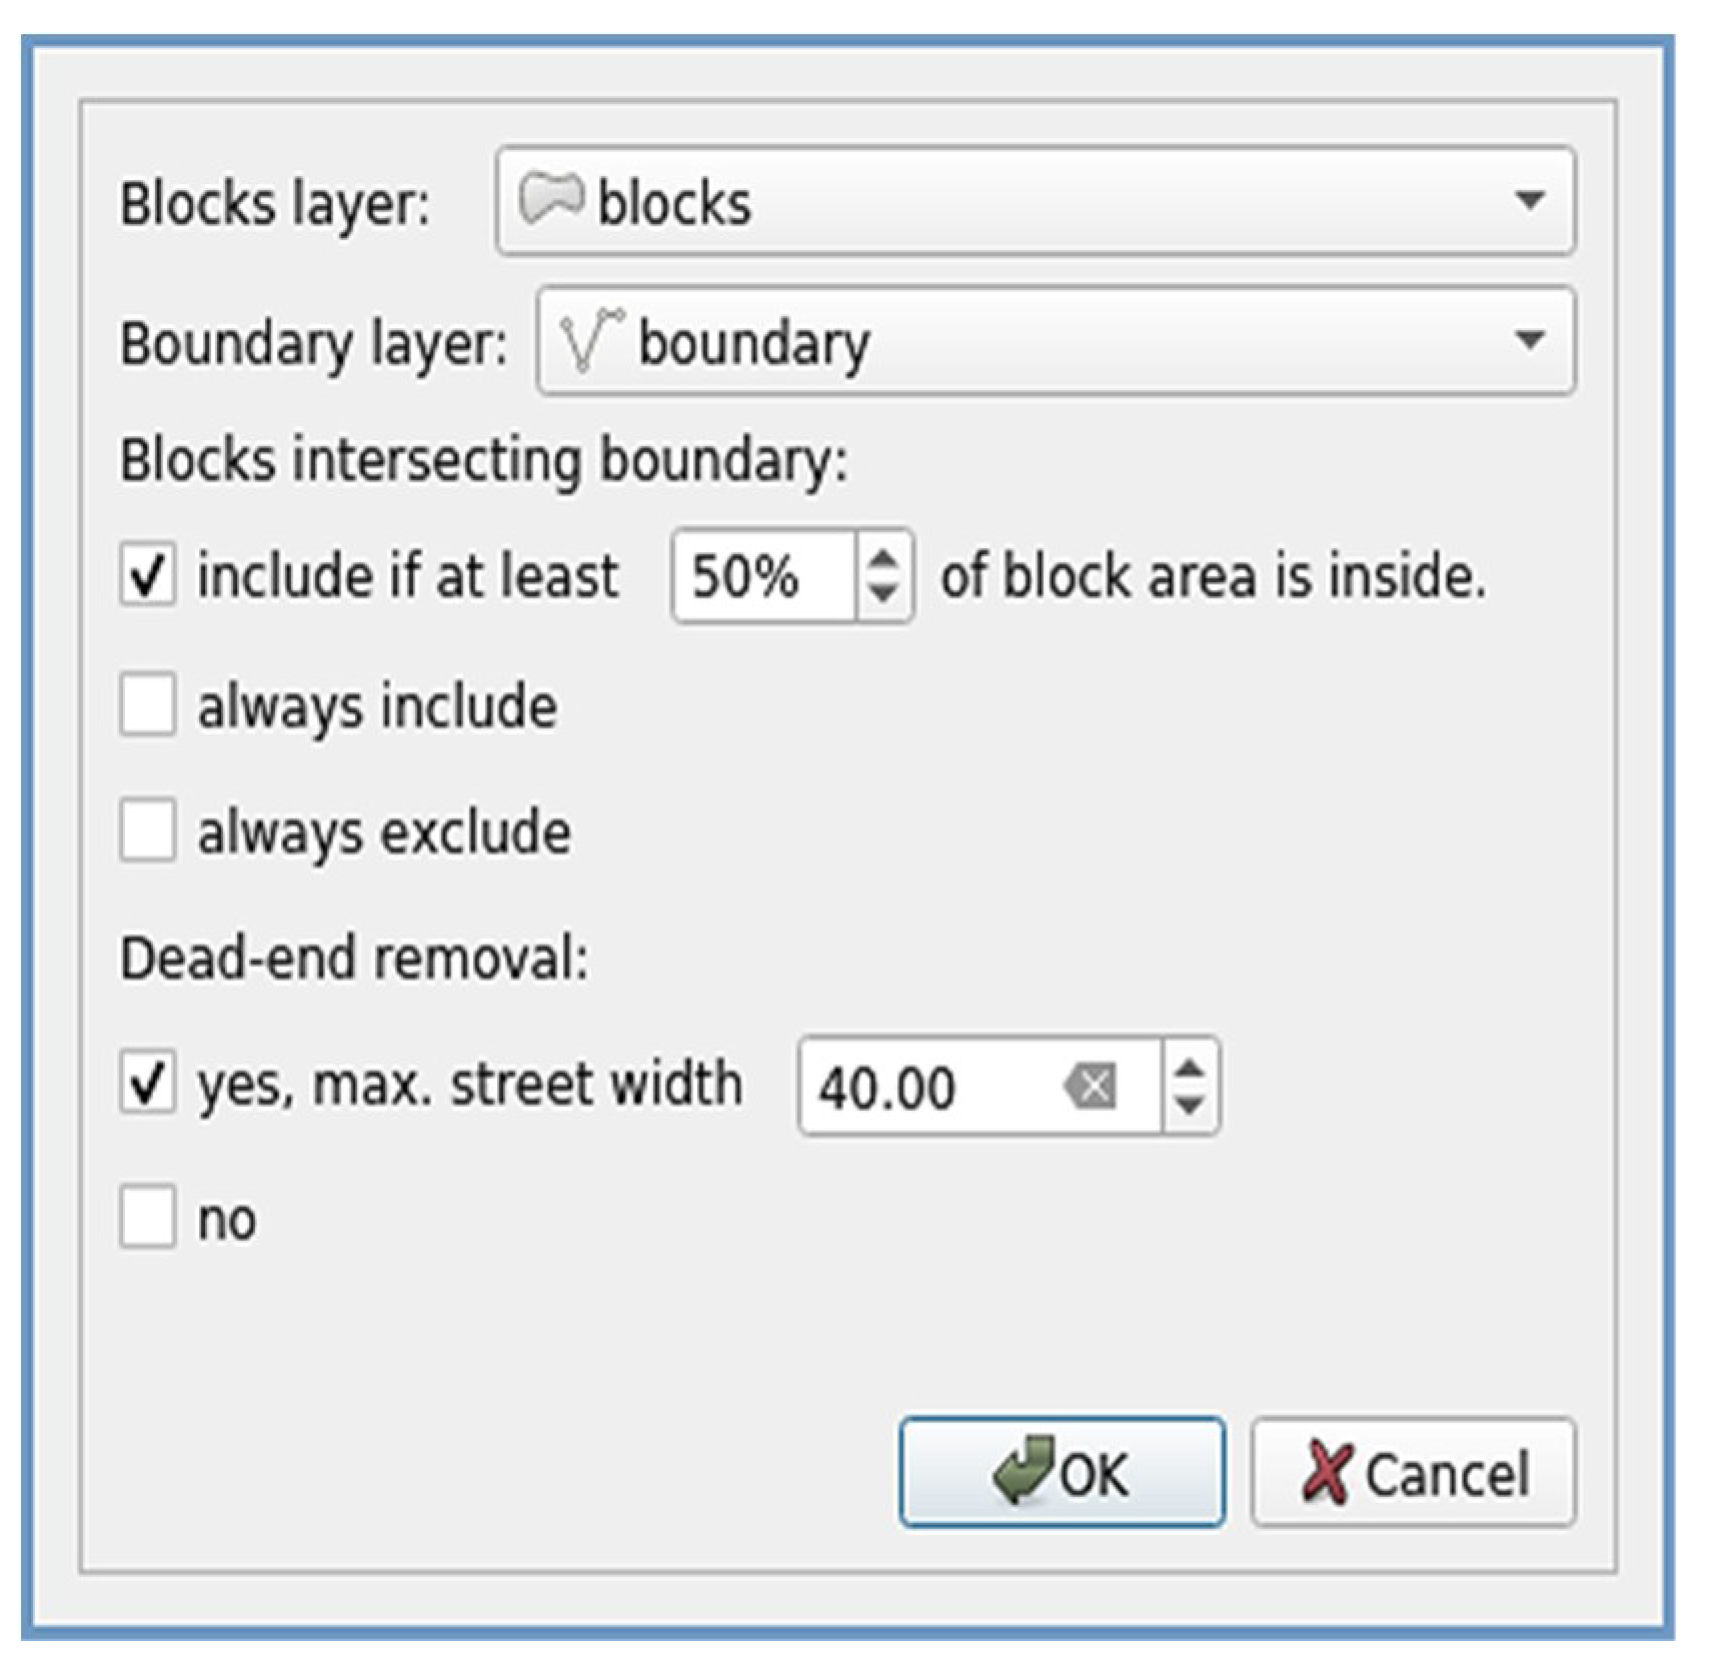
The AwaP tool is developed as a plugin in the QGIS software. The graphical interface of the tool is shown in
Figure 1. It takes in several parameters in order to calculate AwaP:
Blocks layer—A layer containing the urban blocks for which AwaP will be calculated. This layer can have polygon geometries, or linear geometries where outlines of urban blocks are represented as closed polylines.
Boundary layer—A layer containing the boundary of the area of interest (i.e., the area that contains the blocks for which AwaP will be calculated). This layer, too, can have a polygon geometry, or a linear geometry where the boundary of the study area is represented as a closed polyline.
Blocks intersecting boundary—A parameter that specifies whether to consider the urban blocks which are only partly within the study area. The default option is to include a block if more than half of the block is within the area of interest.
Dead-end removal—A parameter that specifies if the dead-end streets should be removed from blocks prior to calculating AwaP, and the maximum width of the dead-end streets to be removed. The default maximum street width of 40 m should work for most urban morphologies.
After the parameters have been set, AwaP is calculated in the following steps:
- (1)
From the blocks layer, the urban blocks that are within the area of interest (i.e., specified by the boundary layer) are selected, taking into consideration the parameter for the blocks intersecting the boundary.
- (2)
Dead-ends are removed, if this option is selected.
- (3)
AwaP is calculated for the selected urban blocks, according to the formula stated above.
- (4)
The selected blocks which were used for calculating AwaP are stored into a new polygon layer where the calculated AwaP will be shown in the layer name and in the attribute table of the layer.
2.1.1. Blocks Intersecting the Boundary
In the AwaP tool, the urban blocks are selected by checking which blocks are within the area of interest represented with the specified boundary. Whether the blocks which are partly inside and partly outside of the area of interest should be considered in this calculation would depend on the specifics of each research. Regarding such urban blocks, there are three options:
Include if at least some percentage of the block area is inside—Only the blocks for which more than a specified percentage of their area is inside the area of interest will be included in the AwaP calculation; others will be disregarded. The default value is 50%.
Always include—All the blocks that are at least partly within the area of interest will be included in the AwaP calculation.
Always exclude—Only the blocks that are entirely within the area of interest will be included in the AwaP calculation.
2.1.2. Removing Dead-End Streets from Urban Blocks
Since it is unlikely that a person seeking to walk around an urban block would enter the dead-end streets, dead-ends are per default removed for AwaP calculation [
17]. The tool has the capability to remove the dead-end streets by buffering the blocks out and back in by the same distance, an approach inspired by a Paul Ramsey blog post [
24]. The dead-end removal takes a single parameter that specifies the maximum street width to be considered. Any streets in the block that are wider than this specified width will not be considered dead-ends and will not be removed prior to computing AwaP.
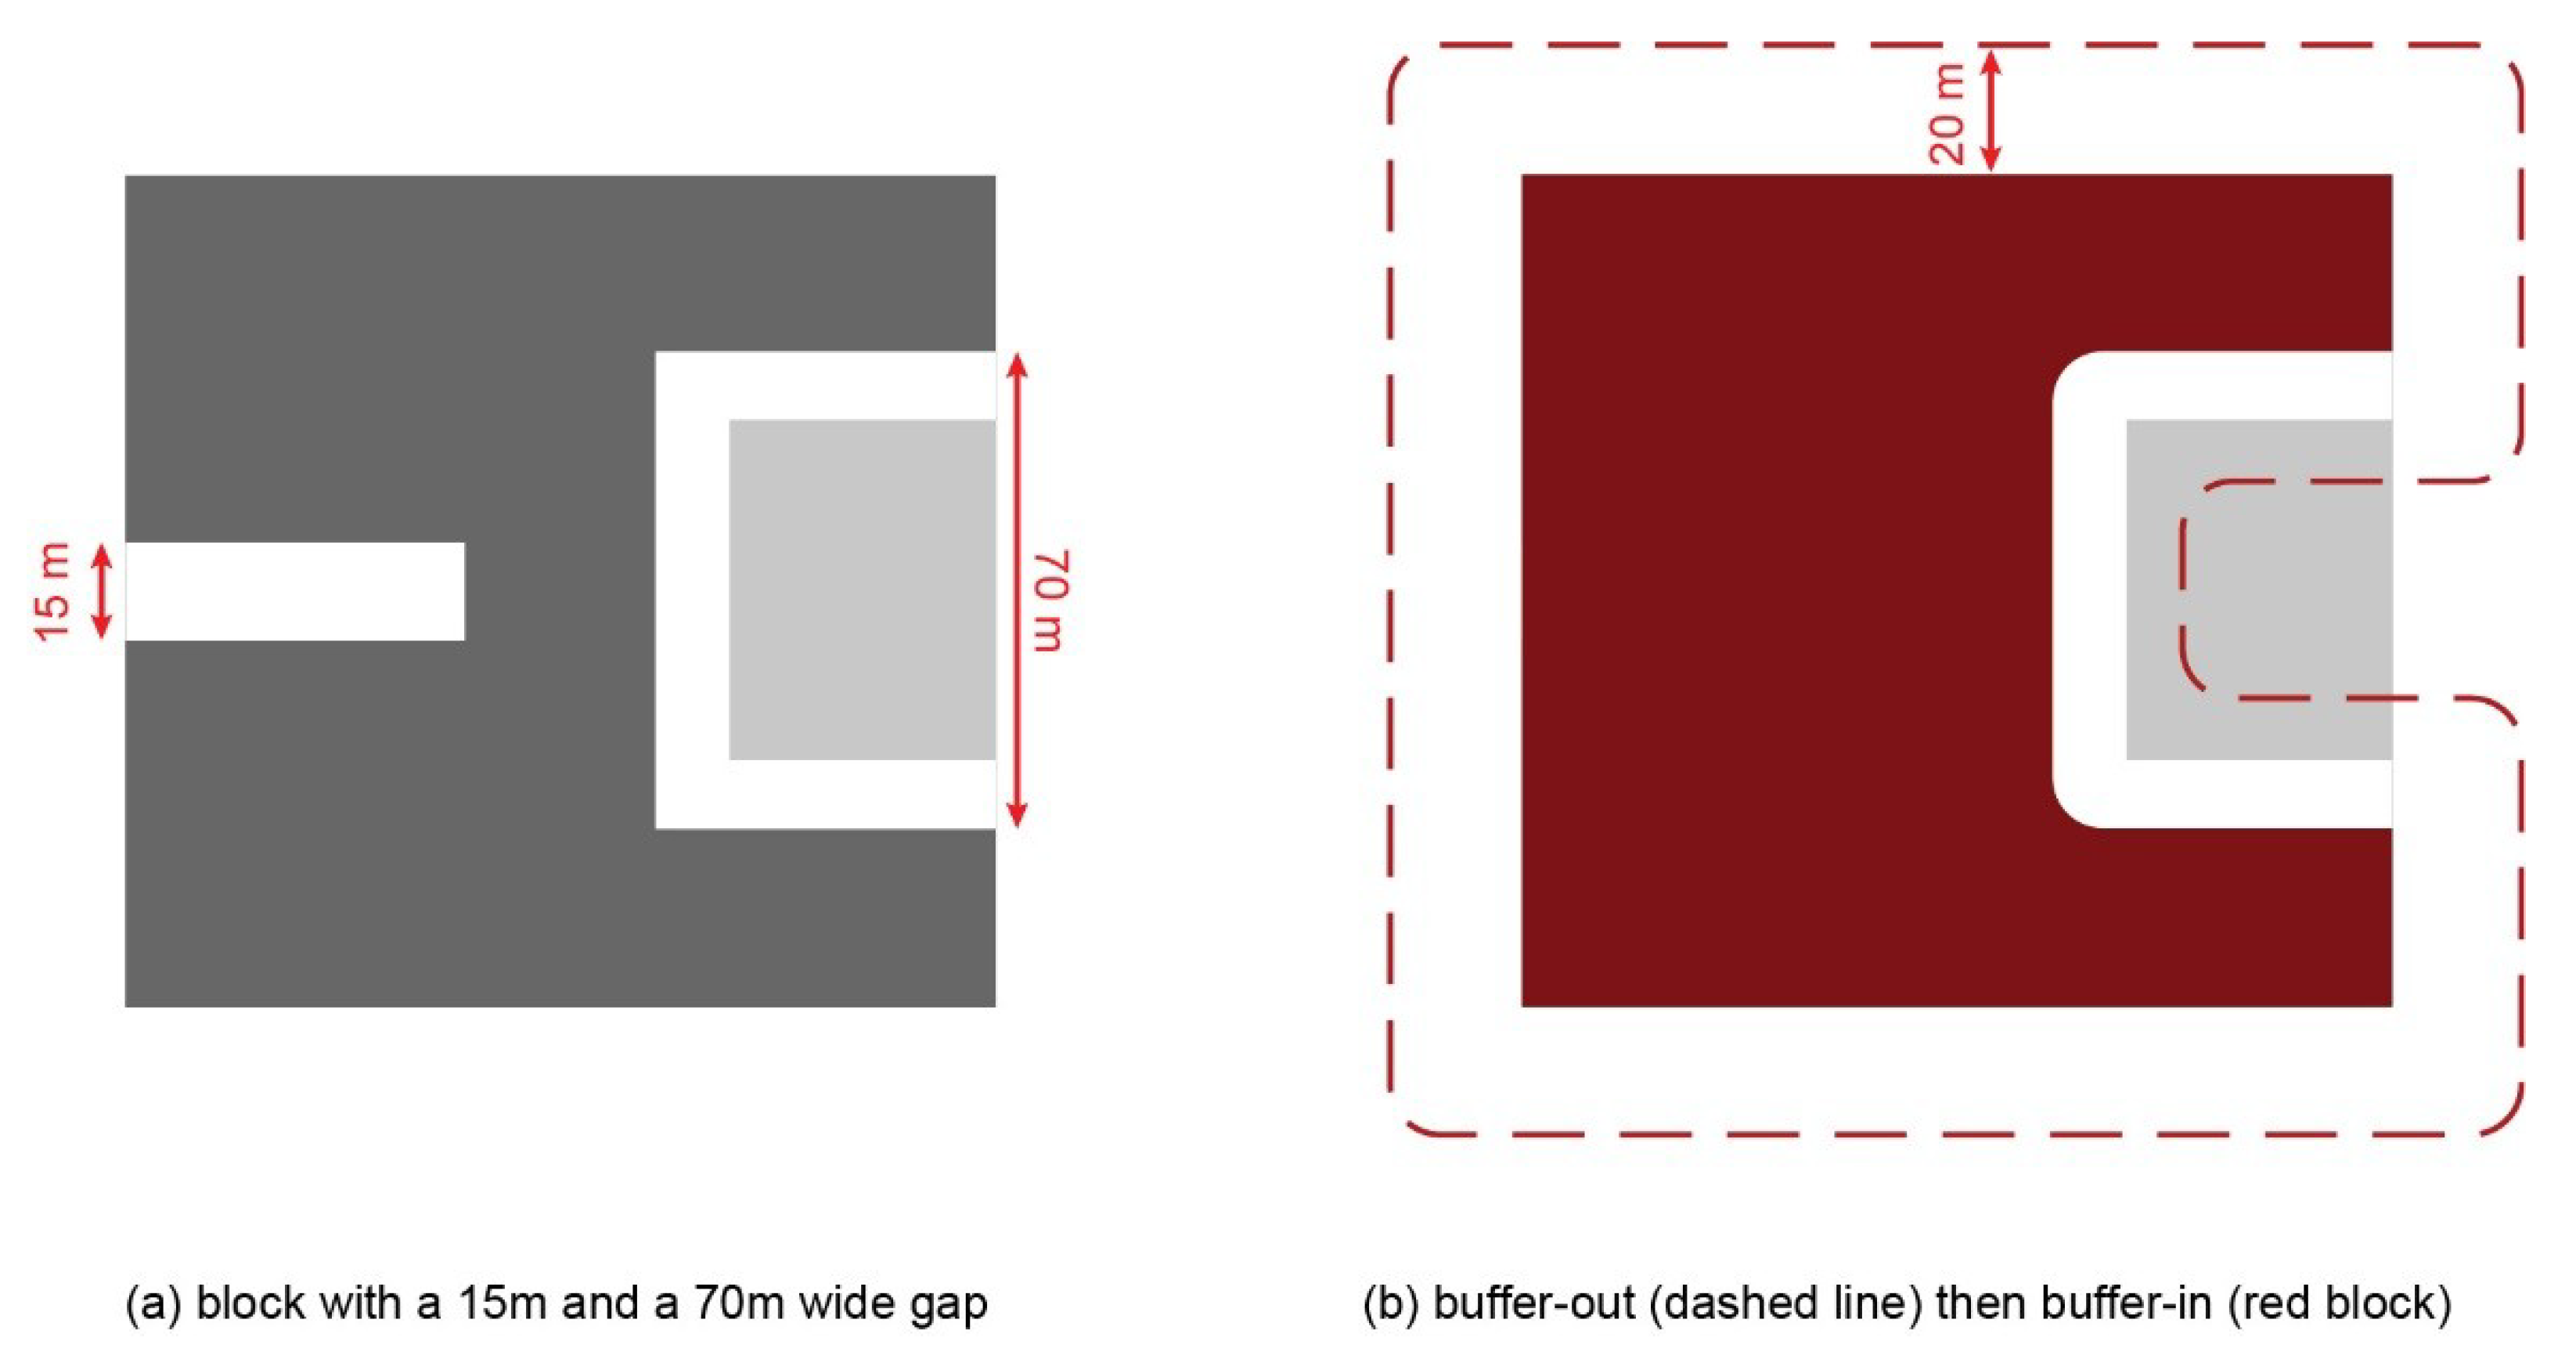
This feature is required as there is no general geometric definition of a dead-end street. A block with a dead-end street and a U-shaped block have the same geometric characteristics, with the tendency for dead-end streets to be narrower. However, as there is no fixed threshold for this distinction, the threshold value is defined through this adjustable parameter. If the tool erroneously distorts blocks rather than removing dead-ends, the value will need to be lowered.
Figure 2a shows an example of an urban block which has two public spaces carved into it. On the left it is a 15 m wide street, while on the right it is a U-shaped non-dead-end lane. The dead-end removal is performed in two steps:
- (1)
Buffer out—First, an outward buffer of the urban block polygon is created, where the polygon is buffered by half of the specified maximum street width (i.e., 40/2 = 20 m) as shown in
Figure 2b. The reason for halving the maximum street width when determining the buffer distance is that the buffer is being created on both sides of the street and will meet in the middle if the buffer distance is at least half of the street width (and thus fill in the dead-end street).
- (2)
Buffer in—Then, the newly created buffer of the urban block polygon is buffered “back in” by the same amount. This is done by buffering the new polygon by the negative of the previous step (i.e., −20 m). This procedure should fill in all the dead-end streets whose width is less than the maximum street width, while leaving the wider public spaces unaffected (
Figure 2b).
In this version of the AwaP-IC tool, the dead-end removal uses rounded buffers. This is because during the testing of the tools, flat cornered buffers were creating incorrect results within the QGIS platform. Thus, some block corners will be slightly rounded after dead-end removal, but not enough to noticeably affect the results.
2.2. IC Tool
Interface catchment (IC) is a measure of the total length of public/private interfaces within a given walking distance [
17]. While there are various definitions of what constitutes public and private space [
25], here we focus on ownership, which is closely linked to control over land use. This is captured by a cadastral map, in which the subdivisions between various publicly owned parcels and between adjacent privately owned parcels have been removed. This delineation between public and private land is one of the most permanent aspects of urban morphology that may remain relatively unaltered for centuries. The difference between IC and other catchment metrics is that it also accounts for the street width. IC looks at which edges of urban blocks may be accessed from a given starting point within a maximum walking distance. The assumption here is that a person is able to walk through any open space that is not occupied by urban blocks.
Like AwaP, the IC tool is developed as a plugin that enables users to calculate the interface catchment in QGIS. The plugin’s graphical interface is shown in
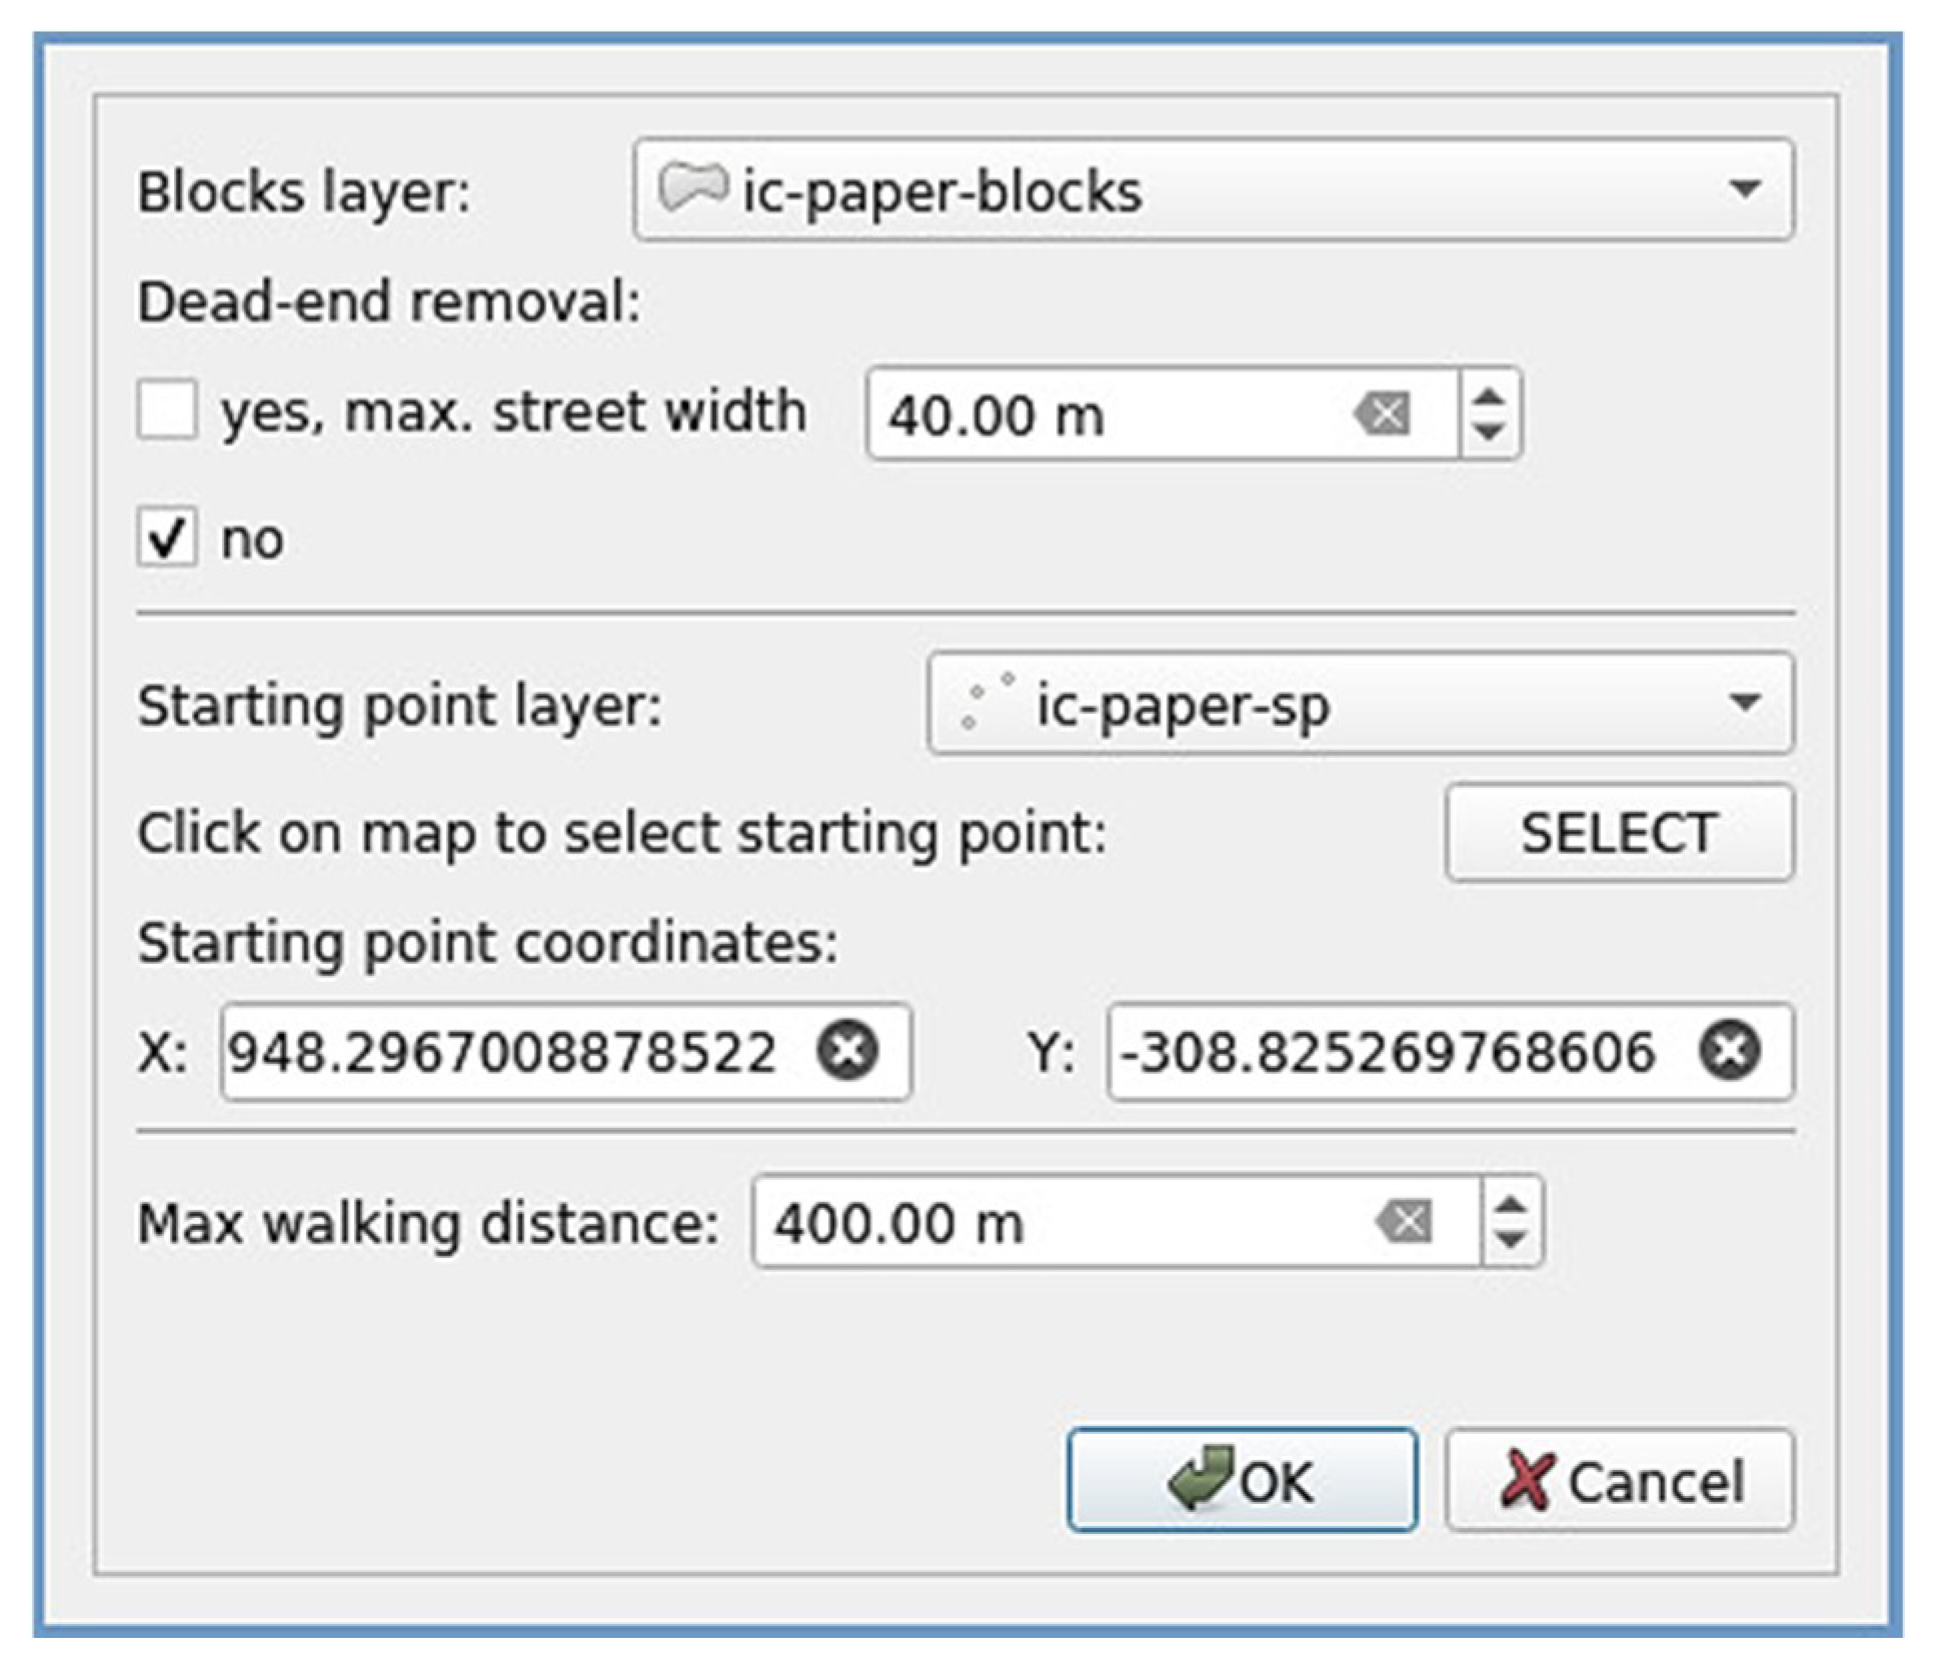
Figure 3. The IC tool requires the following parameters to be set:
Blocks layer—A layer containing the urban blocks for which the IC will be calculated. This layer can have polygon geometries, or linear geometries where outlines of urban blocks are represented as closed polylines.
Dead-end removal—A parameter that specifies if the dead-end streets should be removed from blocks prior to calculating IC, and the maximum width of the dead-end streets to be removed. Per default, this option is disabled, as IC is meant to measure all attractions within walking distance, including attractions located in dead-ends. For an explanation of the dead-end removal process, see
Section 2.1.2. “Removing Dead-End Streets from Urban Blocks” above.
Starting point—A starting point from which the IC calculation will commence is required. This starting point can be set in one of three ways:
- ○
By selecting the starting point layer—Take into consideration the fact that there must be only one starting point defined at a time. If the starting point layer has multiple point objects, a single point which is to be set as a starting point of IC calculation needs to be selected with a selection tool in QGIS.
- ○
By selecting a point on the map—When the “SELECT” button is clicked, the IC tool interface will temporarily disappear from the screen and wait for the user to click on the map. The map coordinates of the point where the user has clicked will be set as the starting point.
- ○
By defining the point coordinates—Whenever the starting point is set via one of the previously mentioned options, its coordinates will be shown in the starting point coordinates X and Y fields. However, these coordinates can also be edited directly.
Regardless of which option has been used for selecting the starting point, when the plugin is run, the current coordinates present in these fields will be used to define the starting point for IC calculation.
Maximum walking distance—The distance a pedestrian can walk in the IC calculation. The default value is 400 m, frequently used in urban planning as average walking distance.
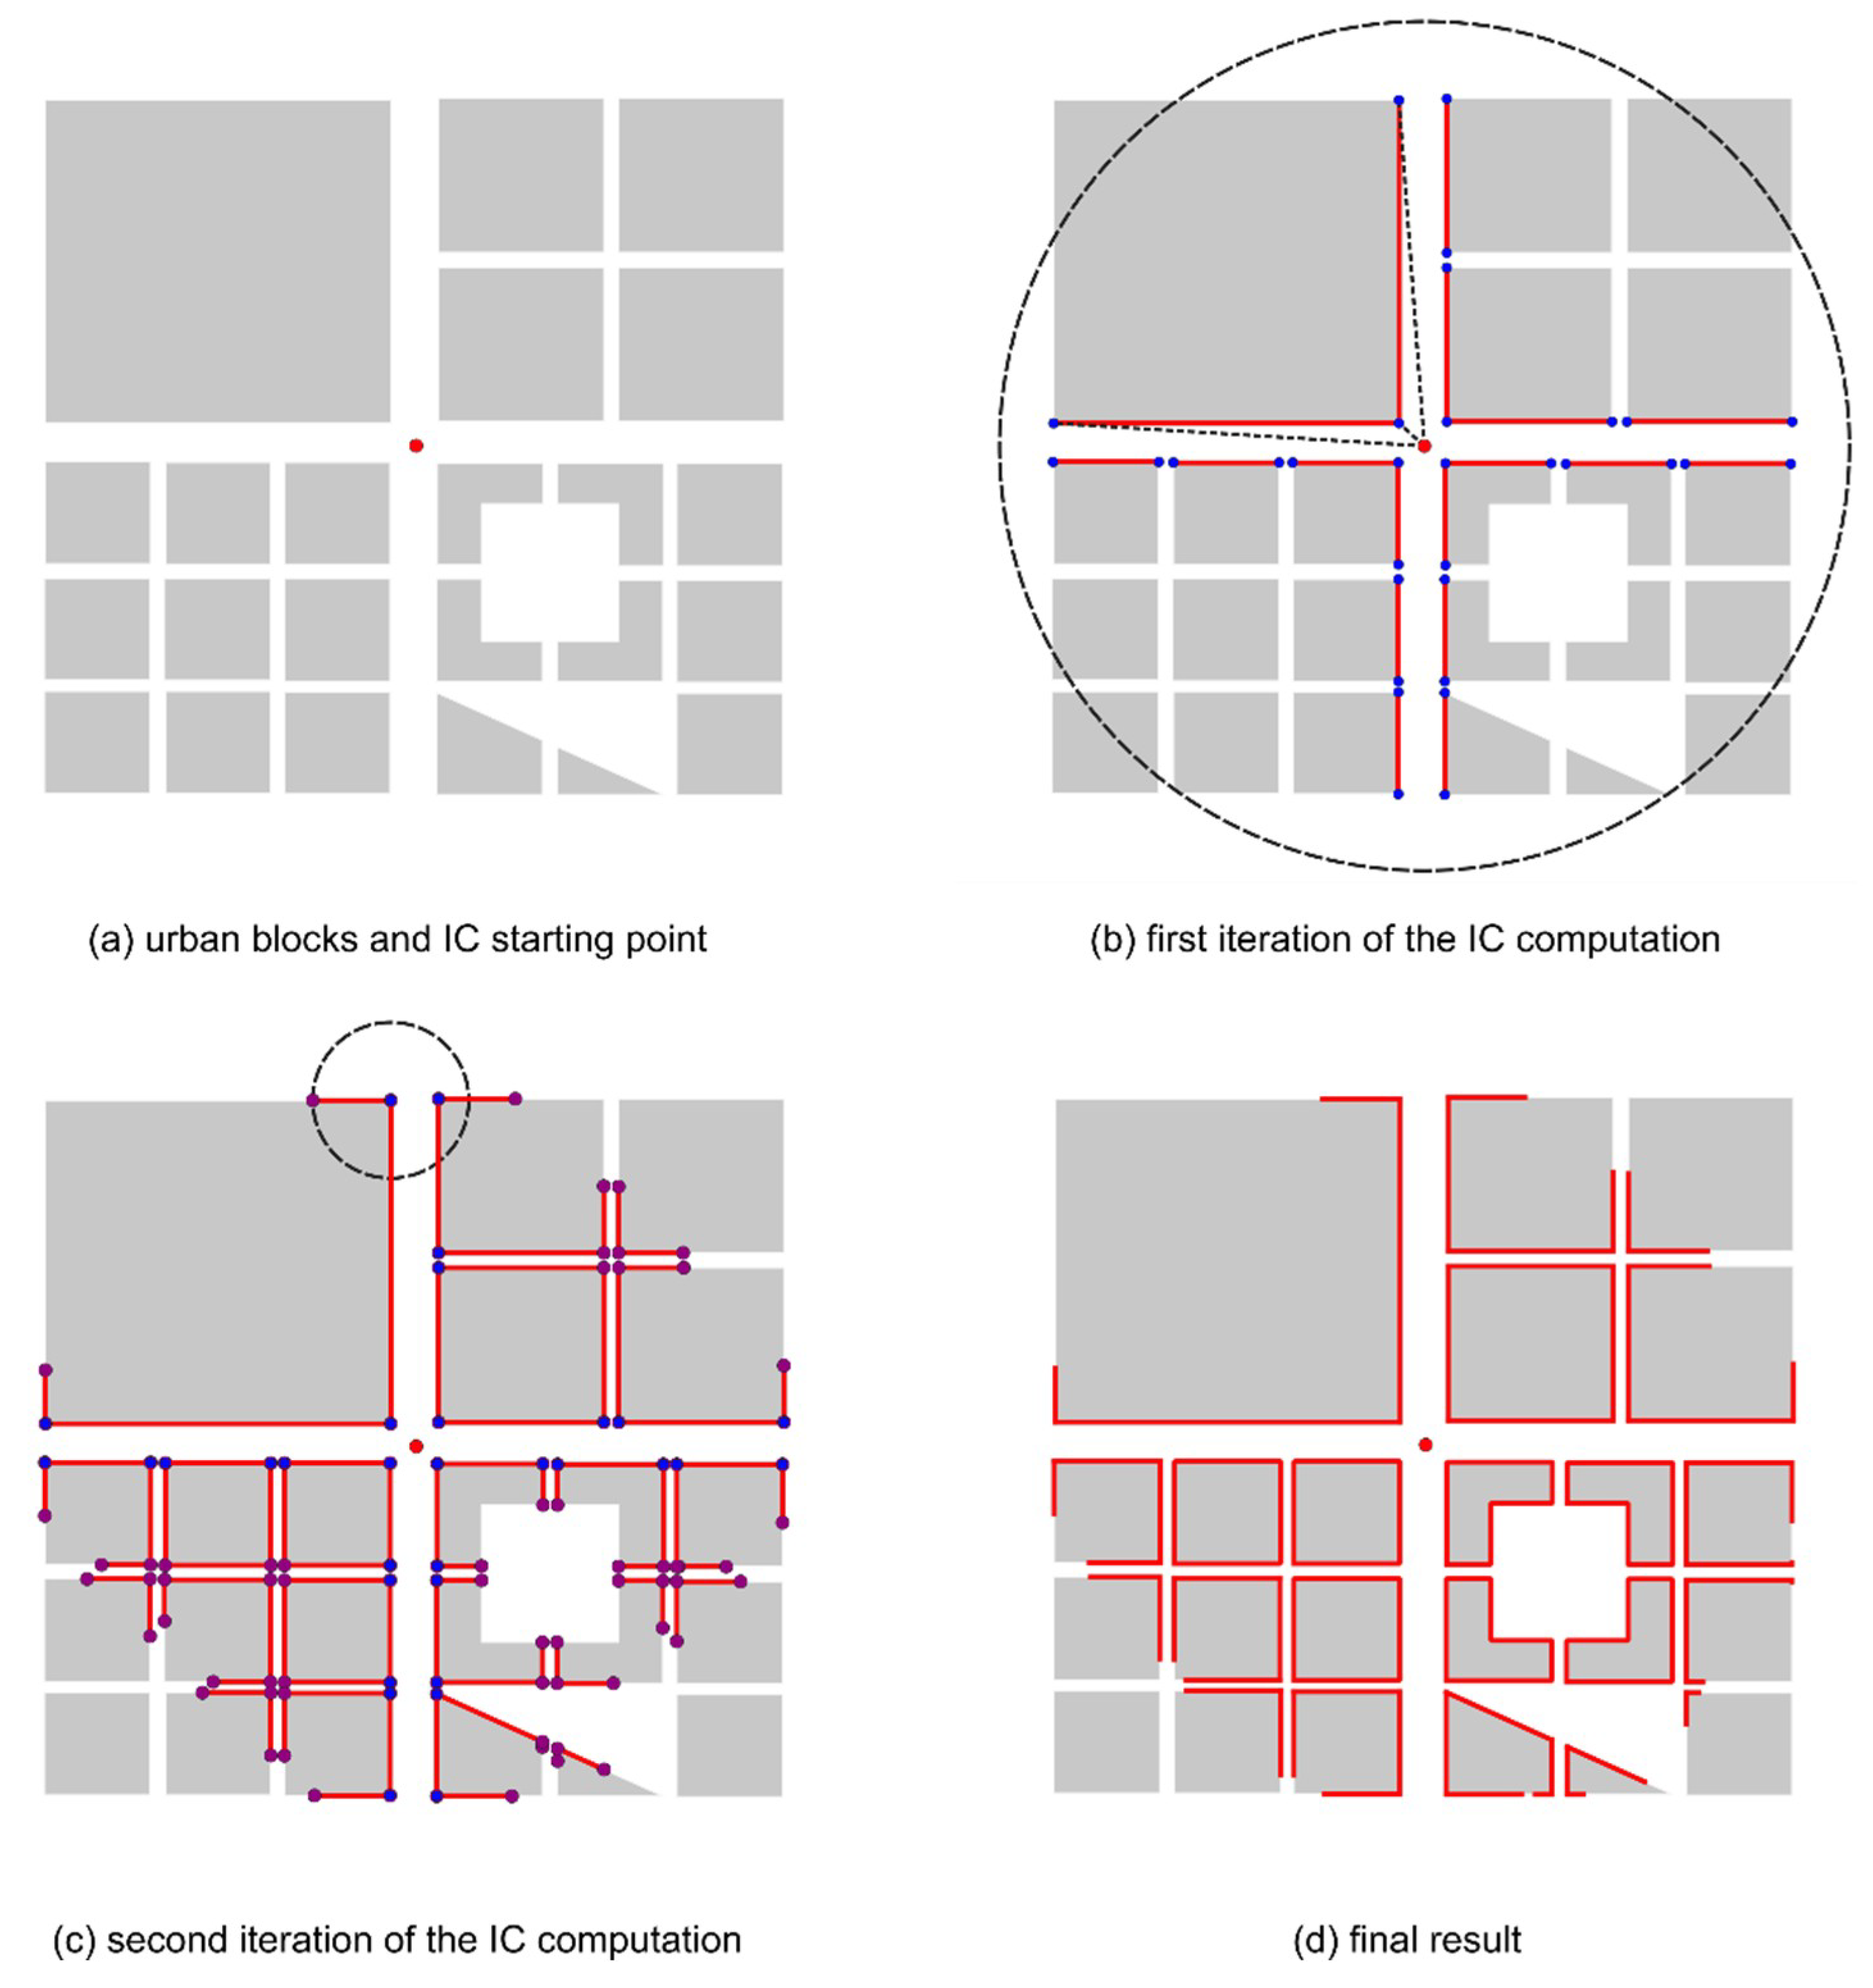
IC Computation
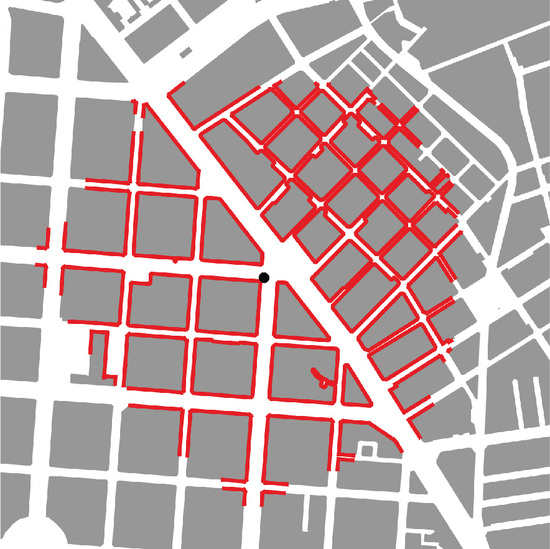
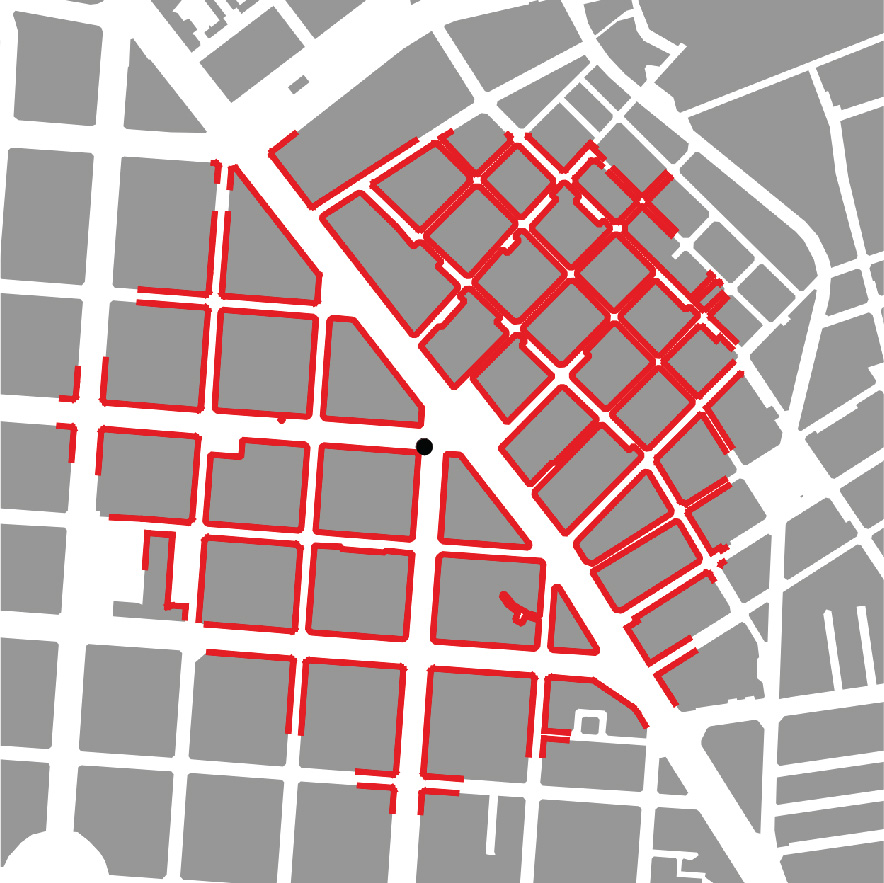
In contrast to the existing approaches, where catchment is calculated along the network of street centre lines, the algorithm for IC computation supports movement through open space. IC calculation may be described by analogy as a lasso whose length is the maximum walking distance, and whose one end is attached to the IC starting point. Then this lasso will be “whipped” around the blocks in all possible directions, and for all the parts of the blocks’ boundaries that are touched by the lasso, it can be concluded that they can be reached with the given walking distance. The challenge occurs when this analogy needs to be formalised in a computational algorithm. The IC computation is based on the boundary points of urban blocks and the following assumptions:
If the destination point (i.e., any block boundary point) may be reached by walking in a straight line from the starting point without crossing any blocks, and if the distance walked is less than the maximum walking distance, then that point is reachable from the starting point. This assumption ensures that walking through open space (i.e., any space not occupied with blocks) is supported. Walking along the edges of blocks is also supported.
If the two consecutive block boundary points are reachable from the same starting point, then the entire portion of the boundary between these points is also reachable from the same starting point.
IC is computed in several steps which are then iteratively repeated until there is no more walking distance remaining on any of the starting points. These steps are illustrated below based on a generic model (
Figure 4a):
- (1)
Create a circle with a radius equal to the allowed walking distance around the starting point (
Figure 4b). This circle shows what the catchment would be if there were no obstacles.
- (2)
For each point in the blocks’ boundaries that is within this circle, test if the point can be reached from the starting point by walking in a straight line, and without running into any obstacles (
Figure 4b). If yes, note that this point is reachable and that the distance from the starting point to this point needs to be walked (i.e., spent from the maximum walking distance budget) for this point to be reached.
- (3)
If two points of the block’s boundary are reachable from the starting point, then it can be concluded that all the parts of the block’s boundary between these points can be reached from the starting point as well. Thus, the entire portion of the block’s boundary between the reachable points that is facing the starting point can be considered reachable (
Figure 4b).
- (4)
The points which were reached in this iteration, and for which there is some walking distance remaining, will be used as new starting points for next iterations (
Figure 4c). In these iterations, the same steps that were mentioned above will be repeated, where the maximum walking distance for each point will be the remaining walking distance after that point was reached.
Figure 4d shows the IC calculation that is finalised after all iterations have been completed.
This IC computation algorithm presents a novel contribution. A drawback of this algorithm is that it analyses all the points in blocks’ boundaries. In cases where blocks have curved or circular boundaries, there may be many more points to analyse than for blocks of rectangular shape. This may slow down the IC computation. Also, there may be some blocks which have “unclean” geometries with unnecessary points. One such example is a rectangular block which has more than two points defining a straight edge (i.e., other than start and end point of a straight edge, there are multiple points along the edge). Because in such cases more points need to be analysed, the algorithm’s performance may slow down.
3. Case Study
Previous applications of AwaP and IC measures [
17] have been limited by the large amount of time required for calculating these measures manually. In the following, with the help of AwaP-IC, we show how by easily taking multiple measures by shifting a frame, we can also analyse the variability of AwaP across the urban fabric and its implications. Then, we explore how the variability of IC as the starting point is continuously shifted. As a basis, we are using a shapefile of the building blocks of Madrid, which was readily available and contains a wide range of urban block shapes, with subtle variations within neighbourhoods and major variations between neighbourhoods. This is based on the cadastral map of Madrid [
26], for which we merged adjoining parcels. Publicly owned parcels, such as parks and squares that are not fenced and thus thoroughly permeable, have been merged with the street space. However, other discrepancies between the actual urban form and this representation of its urban blocks may remain. Some blocks, for instance, may have privately owned but publicly accessible through-connections.
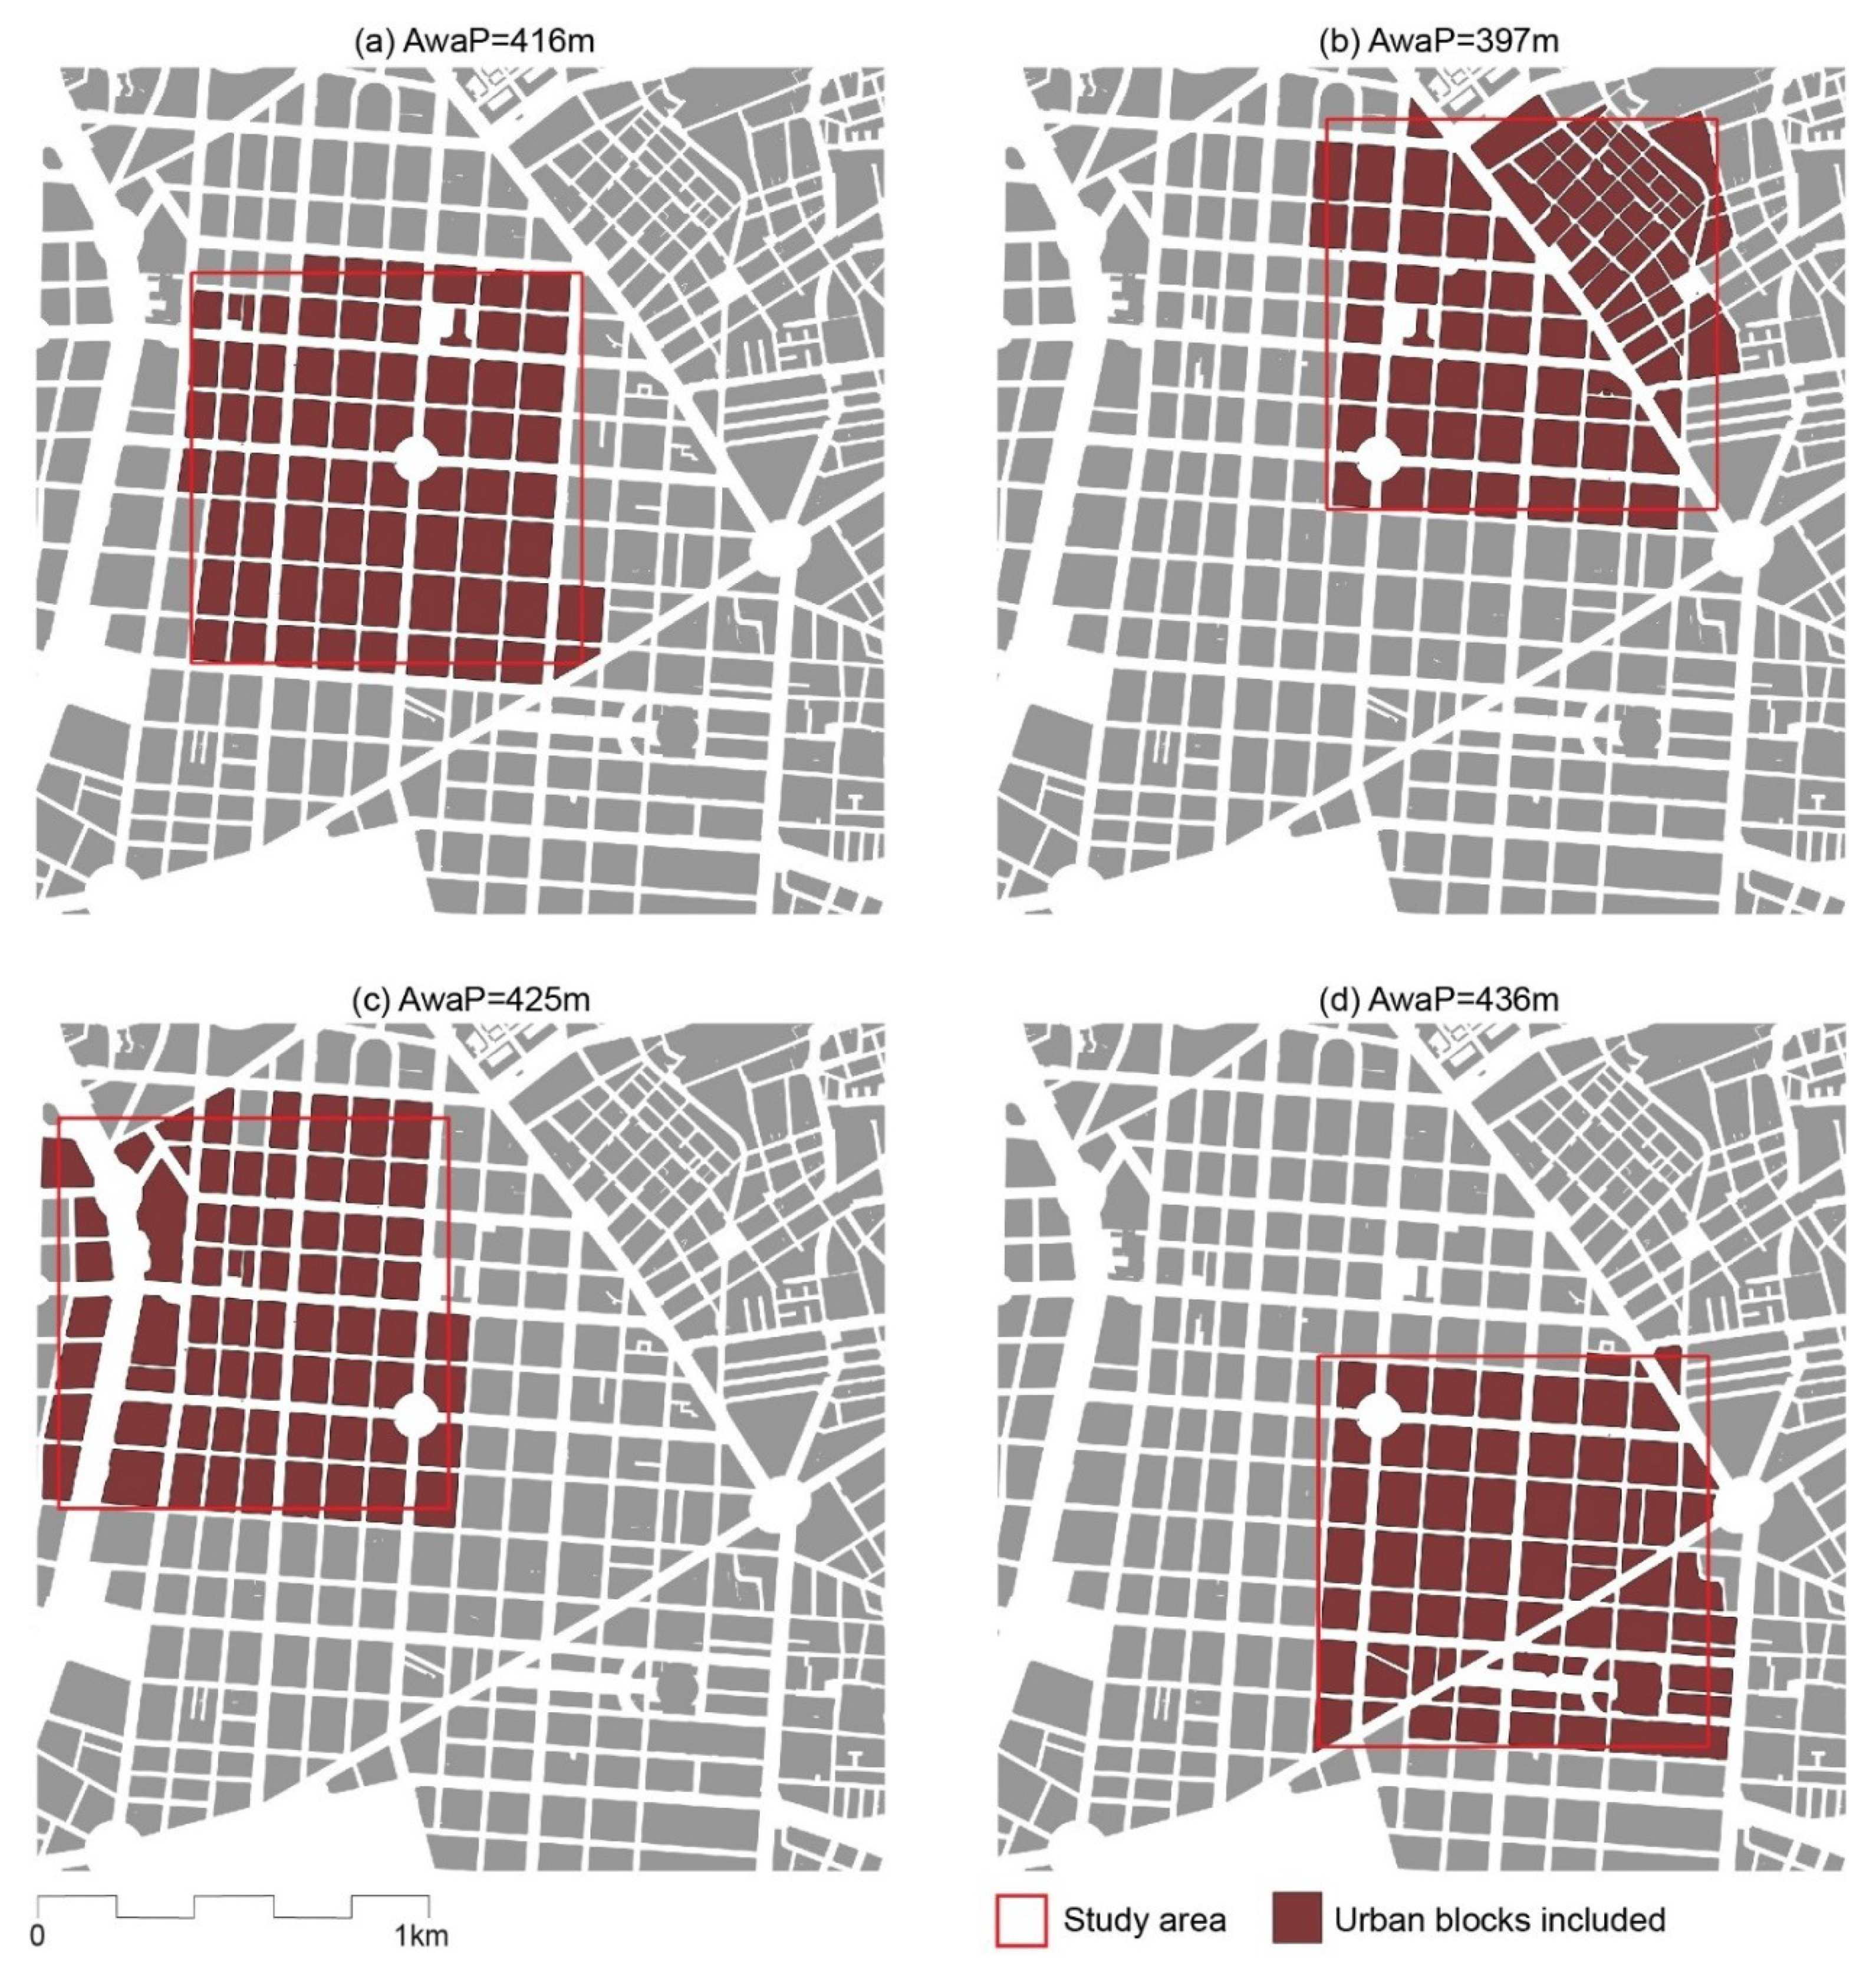
Figure 5 shows the Salamanca district of Madrid, a 19th century extension, following a grid pattern intersected by several diagonal streets. The urban blocks were inspired from Cerdá’s early plans for Barcelona, slightly longer than 100 metres, with chamfered corners [
27]. The 1 × 1 km frame in the top-left example (
Figure 5a) captures the area around a circular plaza. The AwaP of 416 m indicates a relatively good permeability, with blocks only slightly larger than 100 × 100 m. When the frame is moved to the northeast (
Figure 5b), AwaP decreases to 397 m, as many smaller blocks are included. While there are significantly more small blocks in this frame, AwaP only decreases moderately, as their weighting is lower—these only occupy about a third of the frame, and are surrounded by elongated blocks that constitute substantial barriers to walking. Moving the frame to the northwest (
Figure 5c), AwaP increases to 425 m, as large elongated blocks along a wide boulevard are included. When shifting the frame to the southeast (
Figure 5d), AwaP increases further to 436 m. Overall, AwaP stays relatively stable, with variations of only +/−5%, as the largest part of the frame contains the same blocks of ca. 100 × 100 m. Thus, while visually we can identify a range of block sizes and shapes, overall capacities for movement through the urban fabric appear to be fairly constant.
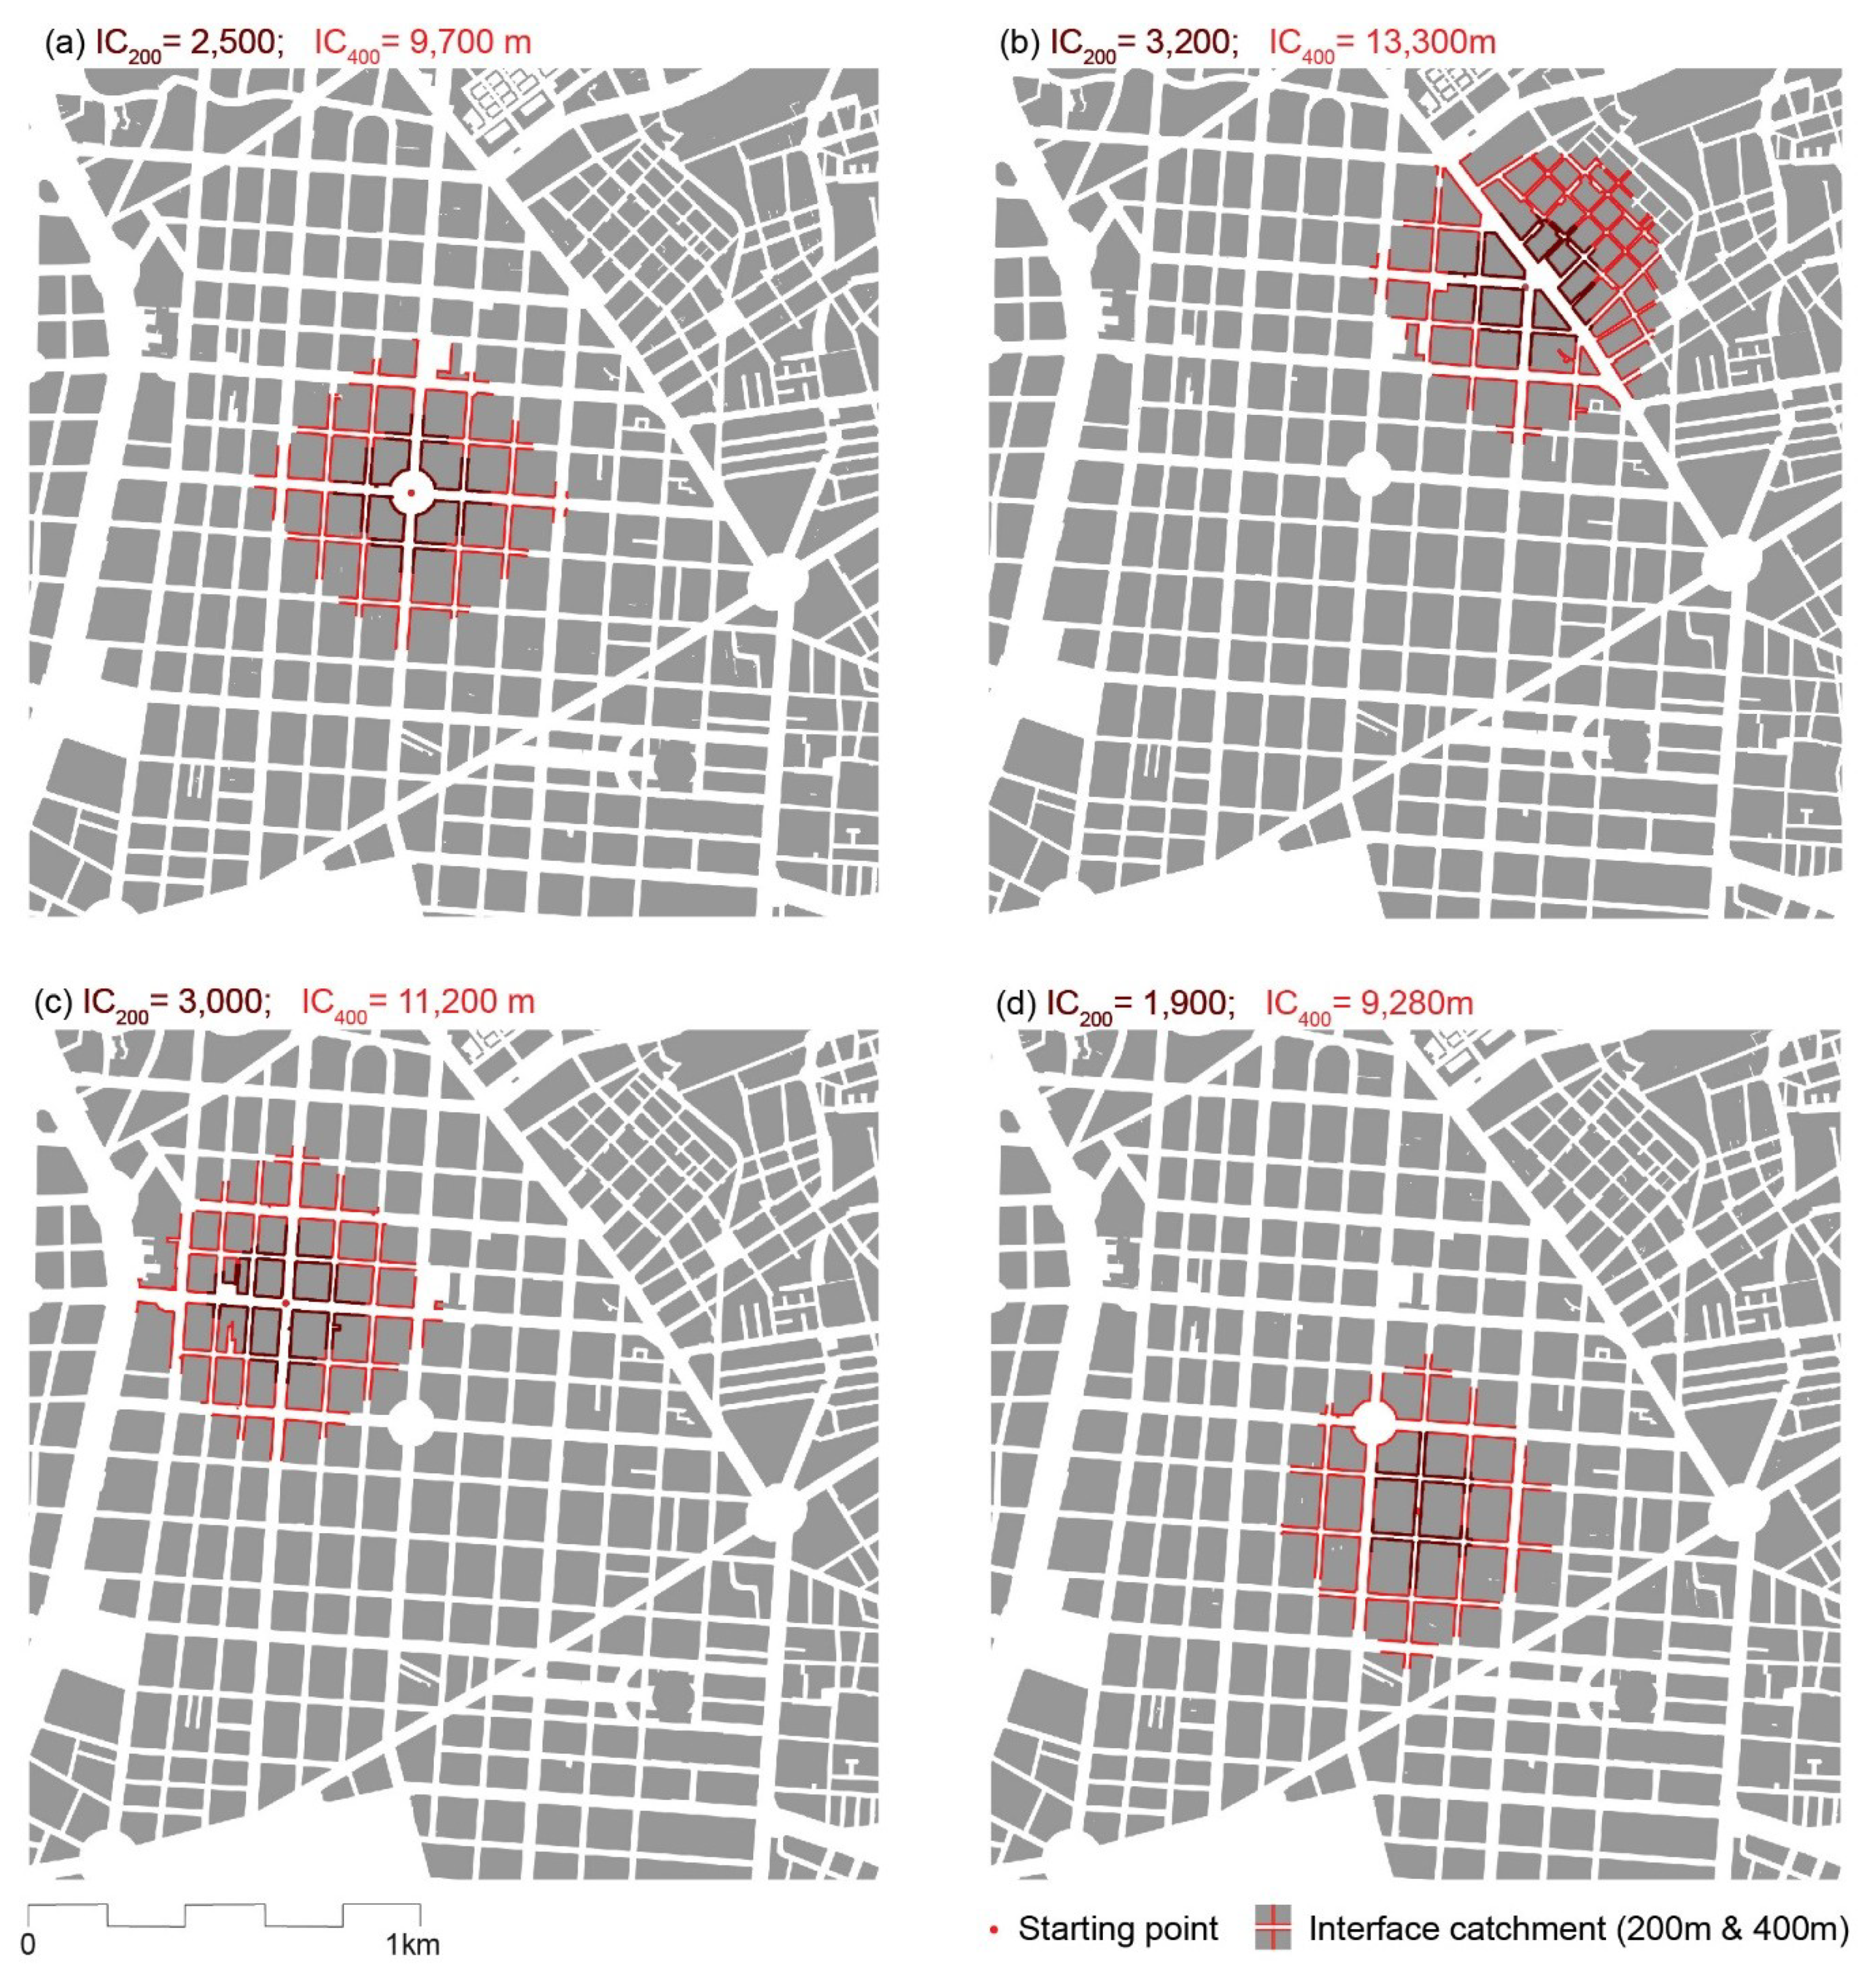
Figure 6 shows the same district and the IC for a 200 m and 400 m walking distance, starting from different points. At the centre of the study area, IC
200 is 2.5 km and IC
400 is almost 10 km (
Figure 6a). In the northeast, IC
200 increases to over 3 km and IC
400 to over 13 km, as blocks are smaller and streets narrower (
Figure 6b). In the northwest, it is only slightly higher than in the central area (
Figure 6c). Moving to the southeast where we encounter more elongated blocks, IC
200 drops close to 2 km and IC
400 to 9 km (
Figure 6d). Overall, the variation here is around +/−25%, much higher than in the case of AwaP.
It is notable that the overall shape of these walking catchments is different from those we find in other studies. In the past, walking catchments have been either approximated with a circle of a given radius that ignores the urban morphology, or calculated based on street centre lines, that for a grid leads to a square-shaped catchment. The catchments shown in
Figure 6 are between these two shapes, appearing as a square with rounded edges. The reason for this is that the IC tool calculates all possible routes through urban space, including diagonal crossings of streets, squares or parks. While such trajectories may not be possible because of car traffic, they do reflect overall capacities for walking assuming no other constraints imposed by footpaths, formal crossings or traffic conditions.
Both for AwaP and IC, the largest contrast is between example (b), which includes the smallest blocks and narrowest streets, and (d), which includes some of the largest blocks and widest streets. While capacities to walk through the urban fabric (AwaP) remain similar, interface catchments (IC) vary considerably. This may, of course, not correlate with actual pedestrian flows, which are also influenced by functional mix and density, as well as other nonmorphological factors. Rather, these measures reveal potentials within this urban fabric that may inform future planning and design.
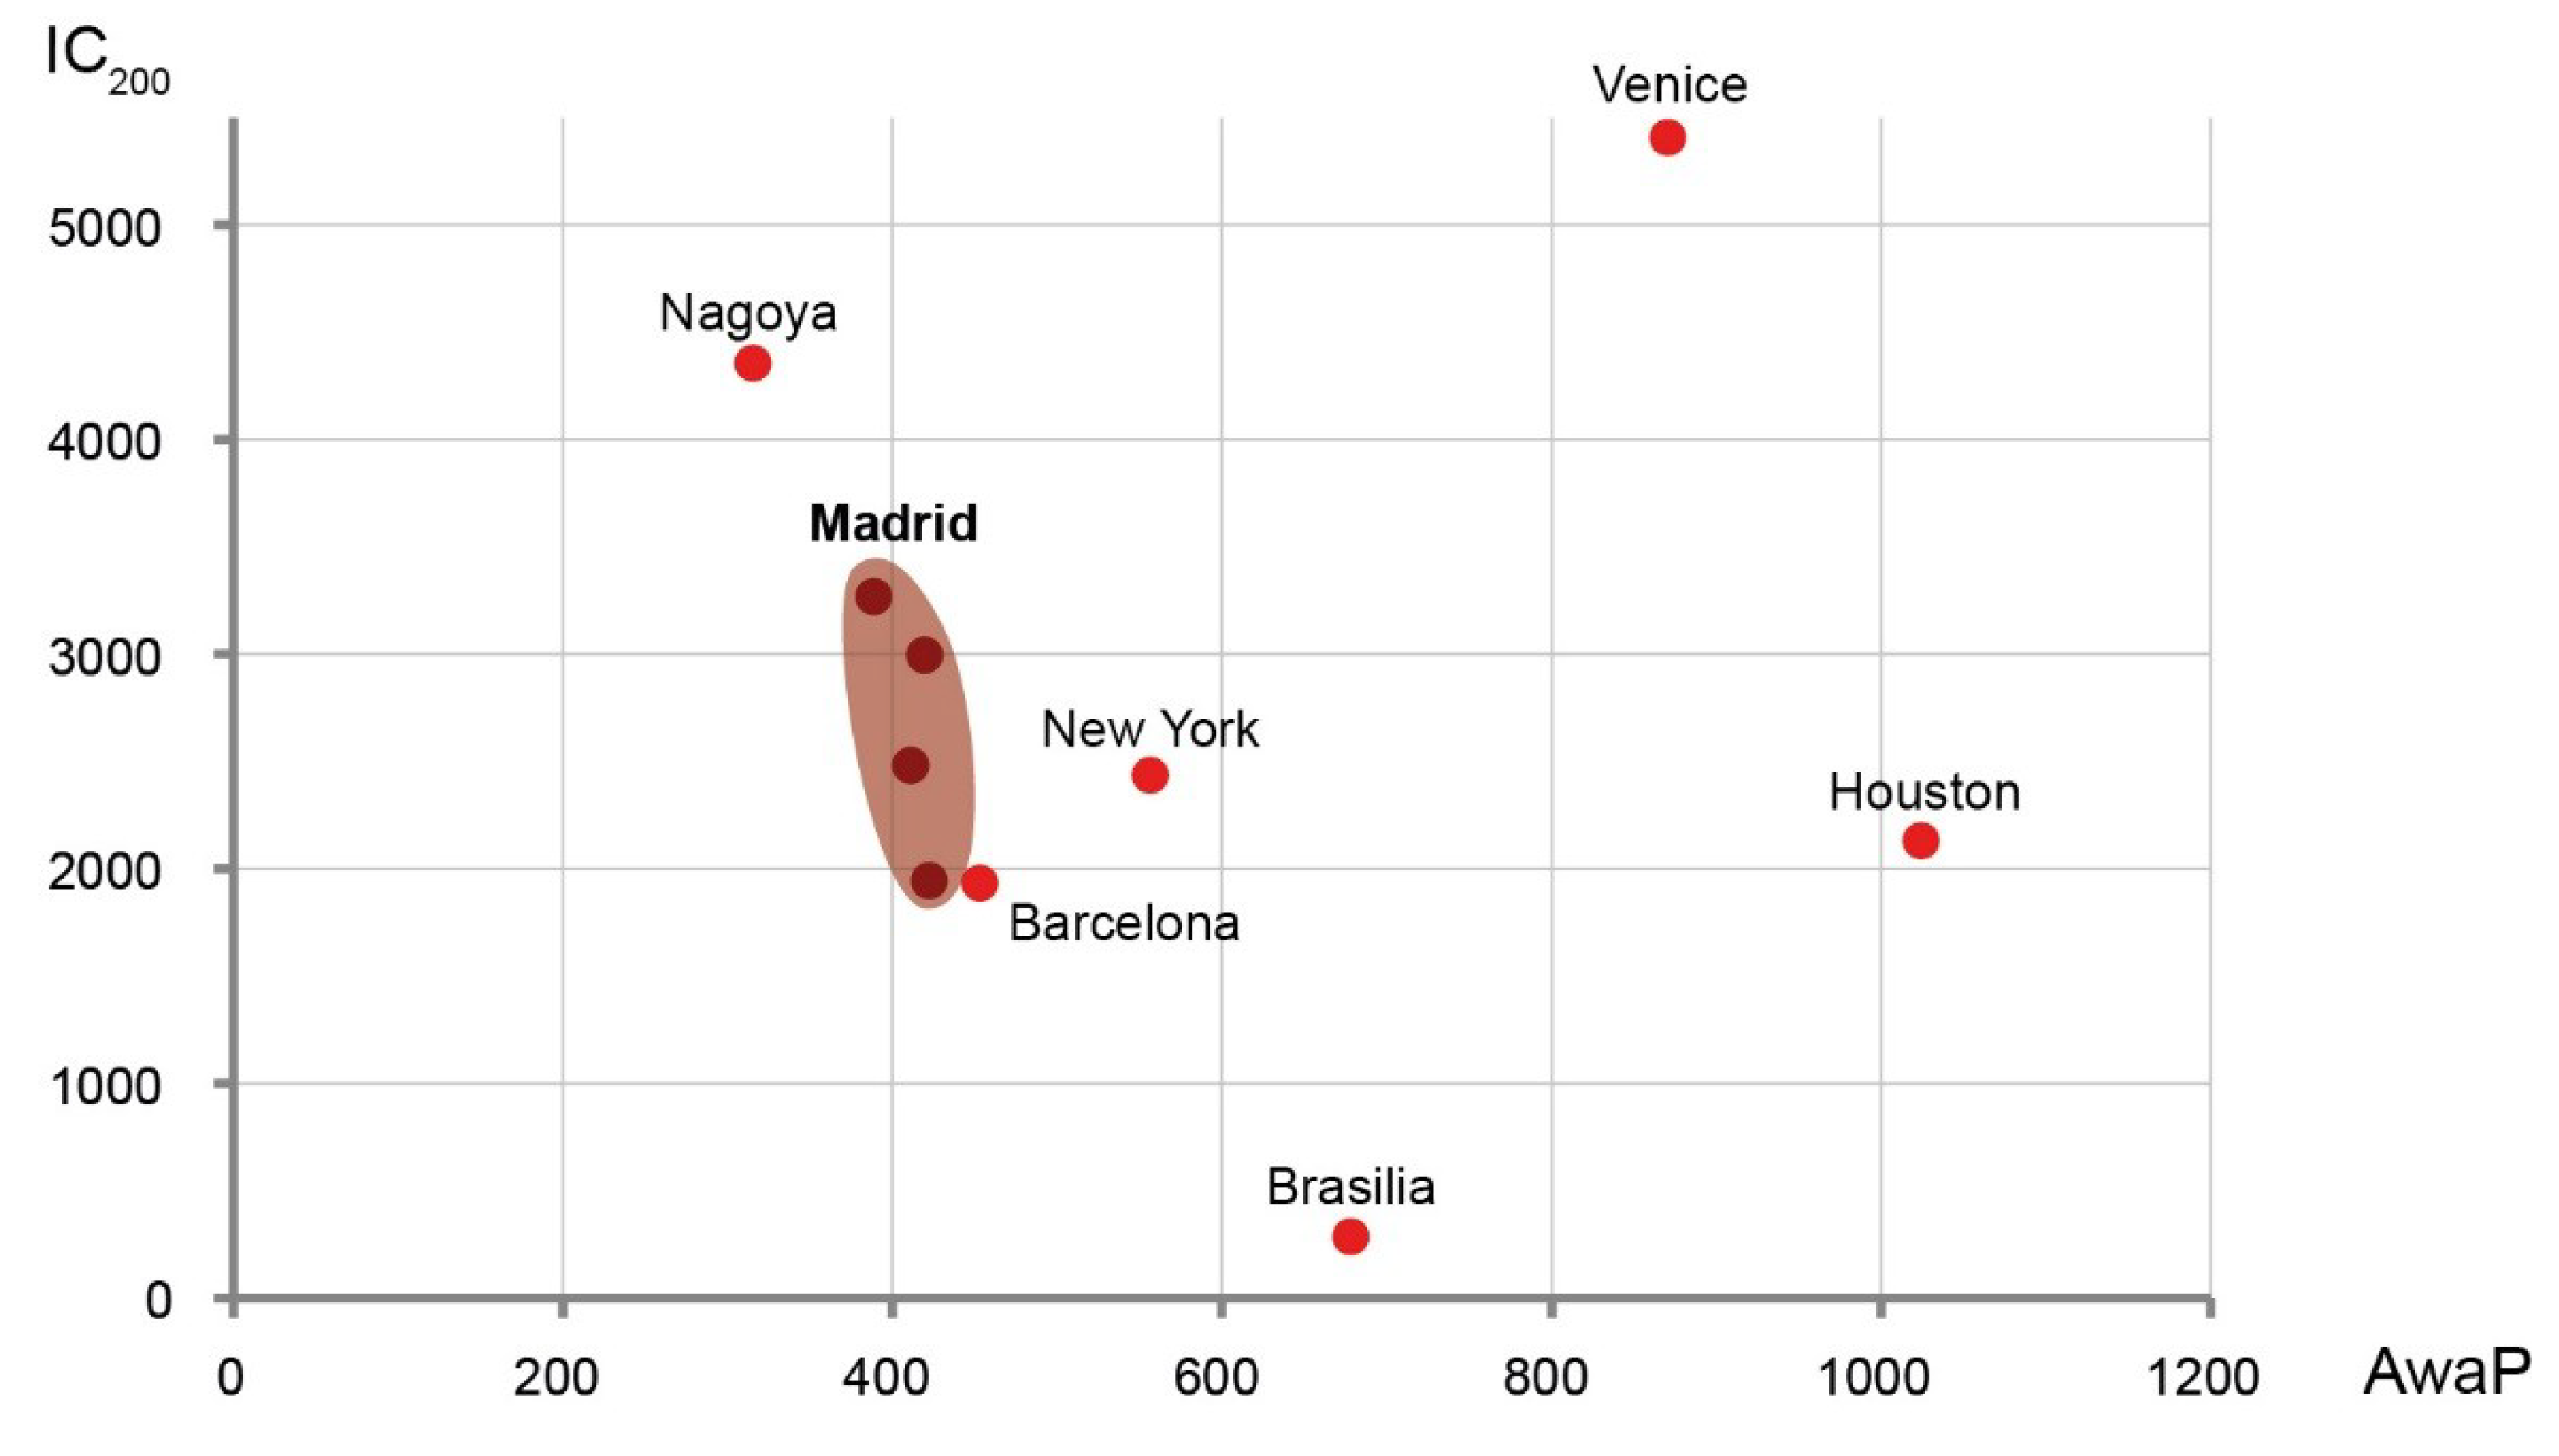
Figure 7 shows the combination of AwaP and IC measures for the four sample sites in Madrid, compared to measures of six 1 km
2 morphologies from a previous study [
17]. It shows this part of Madrid having a combination of permeability and interface catchment that ranges between the values measured in Barcelona, New York and Nagoya, all grids with short blocks. This is in contrast with morphologies that have low permeability and high catchment such as Venice, low permeability and low catchment such as Houston, or morphologies that have very low catchment such as the modernist Brasilia. The diagram also shows the high variability of IC
200 compared to the relative stability of AwaP.
4. Discussion
The GIS tool AwaP-IC presented here measures two key properties of urban morphologies related to walkable access: the capacity to walk through the urban fabric (AwaP) and the capacity to walk to various attractions located at the public/private interface (IC). AwaP scores below 400 m indicate high permeability, while high IC scores indicate the capacity to sustain access to a multiplicity of entrances. Combined AwaP and IC differentiate between the high permeability and catchment of urban areas, high permeability and low catchment of modernist developments, the low permeability and high catchment of intricate labyrinthine urban fabrics as well as the low permeability and catchment of cul-de-sac suburbs.
Rather than following previous approaches of abstracting public space to a street network graph model, this tool directly analyses public space based on its basic form, as captured by cadastral maps. Street width, urban squares and parks, are not removed from the analysis, but considered as spaces of pedestrian movement. However, as a planar tool, AwaP-IC does not account for underpasses and overpasses, which may constitute a significant type of pedestrian connection in cities like Hong Kong [
28].
The main challenge that had to be overcome in the development of AwaP-IC was to bridge between the logic of walkability through Euclidean space, an infinity of route choices within a continuous space with discrete obstacles, and the spatial computation logic of the GIS platform, based on relations between a defined set of points, lines and polygons. This was most evident in the development of an algorithm for the IC calculation. The algorithm may be described by analogy as a lasso whose base is the IC starting point and length is the maximum walking distance. This lasso is “whipped” around the blocks in all possible directions, recording all the public/private interfaces that are reached. This is akin to a person seeking to move along the shortest route (crossing streets, squares and parks diagonally) while turning around corners, passing by a range of attractions—entries to various buildings.
As AwaP and IC are measures of capacities of moving through and to the urban fabric, they can be used for assessing designs and plans for future urban scenarios, defining planning controls for permeable neighbourhoods and detecting barriers to movement or a limited potential to accommodate a diversity of attractions within existing morphologies. AwaP may enable replacing rigid urban codes stipulating the maximum length of each block [
29] with more flexible codes of a maximum AwaP for a neighbourhood that would allow for a greater diversity of street layouts in new urban developments.
The tool has been successfully tested with formal urban morphologies, but many challenges remain, particularly for informal conditions where public/private access distinctions are less clear. Furthermore, there are many barriers to walking that are not captured by cadastral boundaries, such as topography, highways and median fences. Nevertheless, we hope that AwaP-IC can empower a new stream of urban morphological studies with the computational capacity of GIS. As an open-source tool, it can be further developed for use in urban mapping and to streamline the analysis of large datasets. The algorithms developed for AwaP-IC may be used in or be the basis for more complex applications of GIS to the study of urban form.
In its current version, AwaP-IC can only take singular measures of AwaP within a frame or of IC from one starting location. An immediate opportunity for further development would be to extend the operationality of AwaP from frames to grids, thus mapping the entire territory of a city or metropolis. Similarly, IC could be expanded to map catchments across a larger territory based on a set of points: a dataset of intersection nodes, midblock points, public transport stops or a regular array of equidistant points. The output of these could be colour-coded to illustrate the various degrees of permeability and catchment. A more integrated AwaP-IC could be used to map the various types of permeability and catchment relations. While AwaP-IC can provide better measures of walkable access as a capacity embodied in urban morphology, it is important to acknowledge the limitations of any such measure for a comprehensive assessment of walkability. Walkability is not a simple extensive property of the urban fabric, but a much more complex and somewhat elusive concept, related to a broad range of urban morphological attributes such as density and pavement, but also nonmorphological attributes such as climate and safety. Walking distance is highly variable depending on environmental and social factors, while route choice may follow various logics, depending on the purpose of a trip.
While urban design knowledge cannot be reduced to numbers [
30], we need to advance a “science of cities” [
21] that better measures what is measurable. We should be also steering away from the risk of engaging in the production of pseudo-science [
31] that ignores the nonmeasurable aspects of urbanity. In this endeavour, it is key to study actual cities and their built form, as there is no greater risk to urban design and planning than deriving our understanding from models that are removed from the lived experience of the urban realm [
5,
32].

