1. Introduction
Over the last 10 years, Spanish cities have been hit with greater or lesser intensity by a financial, economic and real-estate crisis [
1], whose effects include great debt in the public sector. This debt led to fiscal restructuring and a greater privatization of public goods and services. All this occurred at a time when the population demanded more employment, access to public education and health, homes, and access to social benefits in order to reach the end of the month.
Perhaps one of the biggest issues leading to this situation was the repeated denial of the crisis by the government. In 2007, it claimed that the gradual deceleration across the Spanish economy was responding to a correction measure and a restructuring of the economy that would relieve pressure on the construction sector, which until then was inflated. Moreover, it was affirmed that the country could face such economic deceleration thanks to the boom of public accounts, which showed a surplus of around 1.8% of the GDP, and that there were no problems with employment, as there were three million more employed individuals than four years prior. In this context, local governments continued with a neoliberal urban growth model that, far from responding to planning, followed the rules of the market and promoted the construction of public infrastructures and facilities, as well as large residential projects. The population continued to invest in the purchase of homes thanks to their financing being facilitated.
However, in 2011, the European Commission [
2] had already warned that the European model of sustainable urban development was under threat because it cannot provide jobs for all. Weakening links between economic growth, employment, and social progress have pushed a larger share of the population out of the labor market or toward low-skilled and low-wage service-sector jobs. An increase in income disparities and a “poor getting poorer” situation is also being observed. In some neighborhoods, local populations suffer from a concentration of inequality in terms of poor housing, low-quality education, unemployment, and difficulty or inability to access certain services (health, transport, ICT). An increase in social polarization and segregation are also being observed. Consequently, spatial segregation processes—as an effect of social polarization—are becoming more frequent, making it increasingly difficult for low-income or marginalized groups to find decent housing at affordable prices, while an increasing number of “society dropouts” may lead to the development of closed sub-cultures with fundamentally hostile attitudes toward mainstream society in many cities.
Ten years after the start of the crisis, some reports, such as that of CaixaBank Research [
3], are beginning to show signs of economic recovery (in 2017 the GDP recorded a growth of 3.1% compared to 2016, and the number of unemployed individuals decreased by 471,100 in 2017, representing a decrease of 11.1%). However, Europe warns that even though the economy seems to be growing on a macro scale there are still many cities that seem stuck in a “middle-income trap”: the GDP per capita growth from 2001 to 2015 was significantly below the EU average. Although the employment rate has recovered, the unemployment rate is still above its pre-crisis level, and there is a large amount of temporary work with low wage, the manufacturing sector is too small and weak to be competitive, the regional innovation systems are not strong enough, and investments in innovation, skills, and infrastructure are insufficient [
4].
That is why the European Commission insists that in order to move beyond the crisis, local governments should generate growth and employment, strengthen their innovation and education centers and put initiatives into action that make their city a safe, inclusive, resilient and sustainable space. In this sense, Ranci, Brandsen, and Satabilenlli [
5] affirm that there is a strong connection between the degree of economic competitiveness of cities and the degree of social cohesion. According to these authors, a guarantee of this relationship depends on the following three factors: (i) to what extent the welfare state is able to forge a network of social and economic organizations, (ii) the importance given by citizens to social solidarity and equality, and (iii) the strength of local governments’ political investment in supporting local solidarity initiatives aimed at helping the population in situations of vulnerability.
When the crisis began, it became clear that the development model in place until then had not created the necessary mechanisms to face a situation of lasting crisis. This can be explained by the existence of a Welfare State in Spain not guaranteeing a decrease in poverty and inequality. Just as in other southern European countries, social welfare is based on funds stemming from worker contributions. A very different conjuncture to those countries with a social democratic welfare state, characterized by a very strong emphasis on collective bargaining, or those with a Liberal welfare state, also characterized by a strong emphasis on employment for all but in a context of high income inequality and strict work requirements for the recipients of social benefits [
6].
In order to face the state of vulnerability in which the Spanish population has been subjected, the welfare state would have to improve its family protection policies, housing policies and a minimum income programme so it could fulfil three analytical functions [
7]:
The “Robin Hood” function that implies a redistribution from better-off members of society to those faced with material or other types of deprivation or those subject to higher social risks. These mechanisms are designed to protect against these risks by delivering poverty relief, providing social housing, redistributing income, and reducing social exclusion. Labor market regulations protect against unfair dismissal and ensure rights for temporary workers. Social risks have evolved over time and now include concepts such as one-parent families and the isolation of old-age pensioners from their families.
The “piggy bank” function through which the welfare state enables citizens to insure themselves against social hardship and to spread out their income more securely over their lifetime, with pensions being the main element.
The social investment function that enables the state to invest in social capital. This includes early childcare, state education from primary level through university, out-of-work training, and various types of work-related tax benefits.
In the medium term, it is clear that it will be necessary to rethink the role of the State in relation to the economy. However, for the moment, we must find a solution to the crisis and the state of vulnerability that citizens find themselves in. Local governments should promote urban resilience actions in order to avoid inequality, exclusion and social polarization [
8,
9].
Throughout this article we will first analyze the factors that determined the crisis in Spain and how alarming levels of vulnerability were reached in the main cities. Second, the degree of vulnerability existing in medium-sized cities will be measured and mapped out using the cases of A Coruña and Vigo as an example. This cartography will allow us to establish a classification of the different urban areas based on their degree of vulnerability. Subsequently we will approach the initiatives that the winning parties in the 2015 municipal elections carried in their electoral programs to reduce vulnerability and improve the quality of life of its citizens. We will check to what extent the proposals have been carried out.
2. Crisis and Vulnerability in Spanish Cities
2.1. Triggering Factors of the Crisis
The 2008 crisis in Spain questioned the current welfare state model, sinking the three main pillars that according to the political economy theory sustain the daily life of the population: the labor market, family structure, and welfare institutions. Understanding how Spain got to this situation requires us to go back to the 1980s, when, on the one hand, the democratic city councils were established and there was a notable institutionalization of local political life; and on the other hand, an economic reactivation began, based on the construction sector, a neoliberal development model characterized by treating territory as a business [
10] and deregulation in planning, from which the urban expansion process was designed by a lobby group which saw the participation of owners, developers, banks, savings banks and companies in the sector [
11,
12,
13,
14].
From then on, cities registered overflowing growth along their immediate peripheries, of such intensity and speed that some authors described it as an “urbanization tsunami” [
15]. The traditional city was losing meaning in the face of the protagonism gained by new metropolitan realities. As a result of the centrifugal movements of the medium- or high-income population of the consolidated city toward metropolitan centers in search of better housing conditions, services, schools, higher environmental quality, and security, there was a decline and impoverishment of consolidated urban areas, increasing their degree of isolation and social segregation. Moreover, the creation of new biased urban nuclei by the metropolitan territory generated situations of territorial conflict and tensions between the native population, who saw how their landscape was transformed and their ways of life changed, and the new residents, who wanted to find the comforts that the city offered them in the new residential areas. Processes of residential segregation, which were more evident in the housing developments whose residents remained isolated from their immediate surroundings, turning them into true ghettos of the wealthy population, who preferred to go to the city center to do their shopping or for leisure. In this context, local governments had to face new challenges, such as the creation and improvement of infrastructure (electricity grid, water) and basic services (health, education, refuse collection, urban transport) to satisfy a growing population. The task was not simple due to the fact that urban growth exceeded the municipal administrative limits and required supra-municipal planning that was not carried out due to either a lack of interest, a fear of losing competences, or the lack of an institutionalized figure capable of planning these spaces (like in the metropolitan areas). However, the local administrations were holding up since the profits of new housing construction and capital gains prevailed over the problems derived from a lack of planning and inefficient management. In fact, despite the crisis beginning in 2008, the reaction by local administrations was delayed, and they even denied that it existed in their localities. It was not until two or three years later that they had a reality check when they could not afford to pay their public debt and had serious cash flow problems in paying for the most basic services, such as electricity and telephony or, in some cases, the payrolls of public employees [
16]. By then, unemployment already affected 20.3% of the active population and would continue to increase until reaching 26% in 2012. Social and family-based fragility was evident, as more and more people could not reach the end of the month and could not afford their mortgage payments, leading to the eviction of thousands of families. Many of them found support in family or friends, but others, especially in the case of immigrants, did not have any support network. Social assistance services, dependent on local governments, were overwhelmed by the demand for benefits at a time when their budget items were being cut dramatically to meet public debt payment. The result was a worrying increase in the number of people in situations of vulnerability and a widespread pessimism and fear among the population who, in previous years, saw poverty and social exclusion as a very distant problem, and who now, with the country’s new economic and employment situation, found themselves on a tightrope that could break at any moment, endangering their social welfare.
At first, it was thought that the crisis would be temporary. However, its continuation caused the number of people and families who had not paid their mortgages to multiply and part of the financial sector (most Savings Banks took unreasonable risks in their involvement in the construction business) and the public sector to be dragged into bankruptcy. The population began to wonder if the economic growth of the previous years had been an illusion and realized that social cohesion as a crucial ingredient of urban development [
17] had been replaced by a new, more radical approach in line with the economic market. Up until then, business owners, bankers, and politicians had focused their interests on growing, building, and obtaining large, fast profits, leaving any social aspects in the background. This, coupled with the emergence of numerous cases of corruption in the government and an interest in rescuing the banks instead of strengthening basic services for the population (health, education, social assistance) led to a resurgence of social and political movements. There were different kinds, ranging from more defensive movements focused on a particular place (against the closure of a company or an eviction order issued to a mortgage victim) to more general movements demanding direct democracy and an end to corruption. These movements fueled the indignados protest with its camps on the streets of all major cities [
18].
The municipal elections of 2015 installed representatives of these movements in the local governments of large cities, such as Madrid, Barcelona, and Valencia, and in other medium-sized cities, such as Cádiz, Santiago de Compostela, and A Coruña, where the population demanded a change in the governance model. Aspects such as participation, transparency, shared responsibility among administrations, effectiveness, and coherence took on greater prominence in the new way of running cities [
19].
After many decades in which neoliberal governance had intensified polarization of cities’ social and urban structure, these new administrations began to devote a substantial part of their public budgets to alleviating the vulnerability found in some neighborhoods, which were forgotten by the administration for decades. The administration began to see the city as a whole, realizing that it was made up of neighborhoods that needed to be considered, rather than just city centers (understood to essentially be historic centers and 19th-century bourgeois housing developments) and certain outlying developments, where state-of-the-art architecture reached its peak of expression in a post-modern city that gave preference to self-investment and urban development over strategic planning.
2.2. The Consequences of a Protracted Crisis over Time
Numerous authors have analyzed in depth the effects of the crisis from an economic, social, political and territorial standpoint [
11,
12,
19,
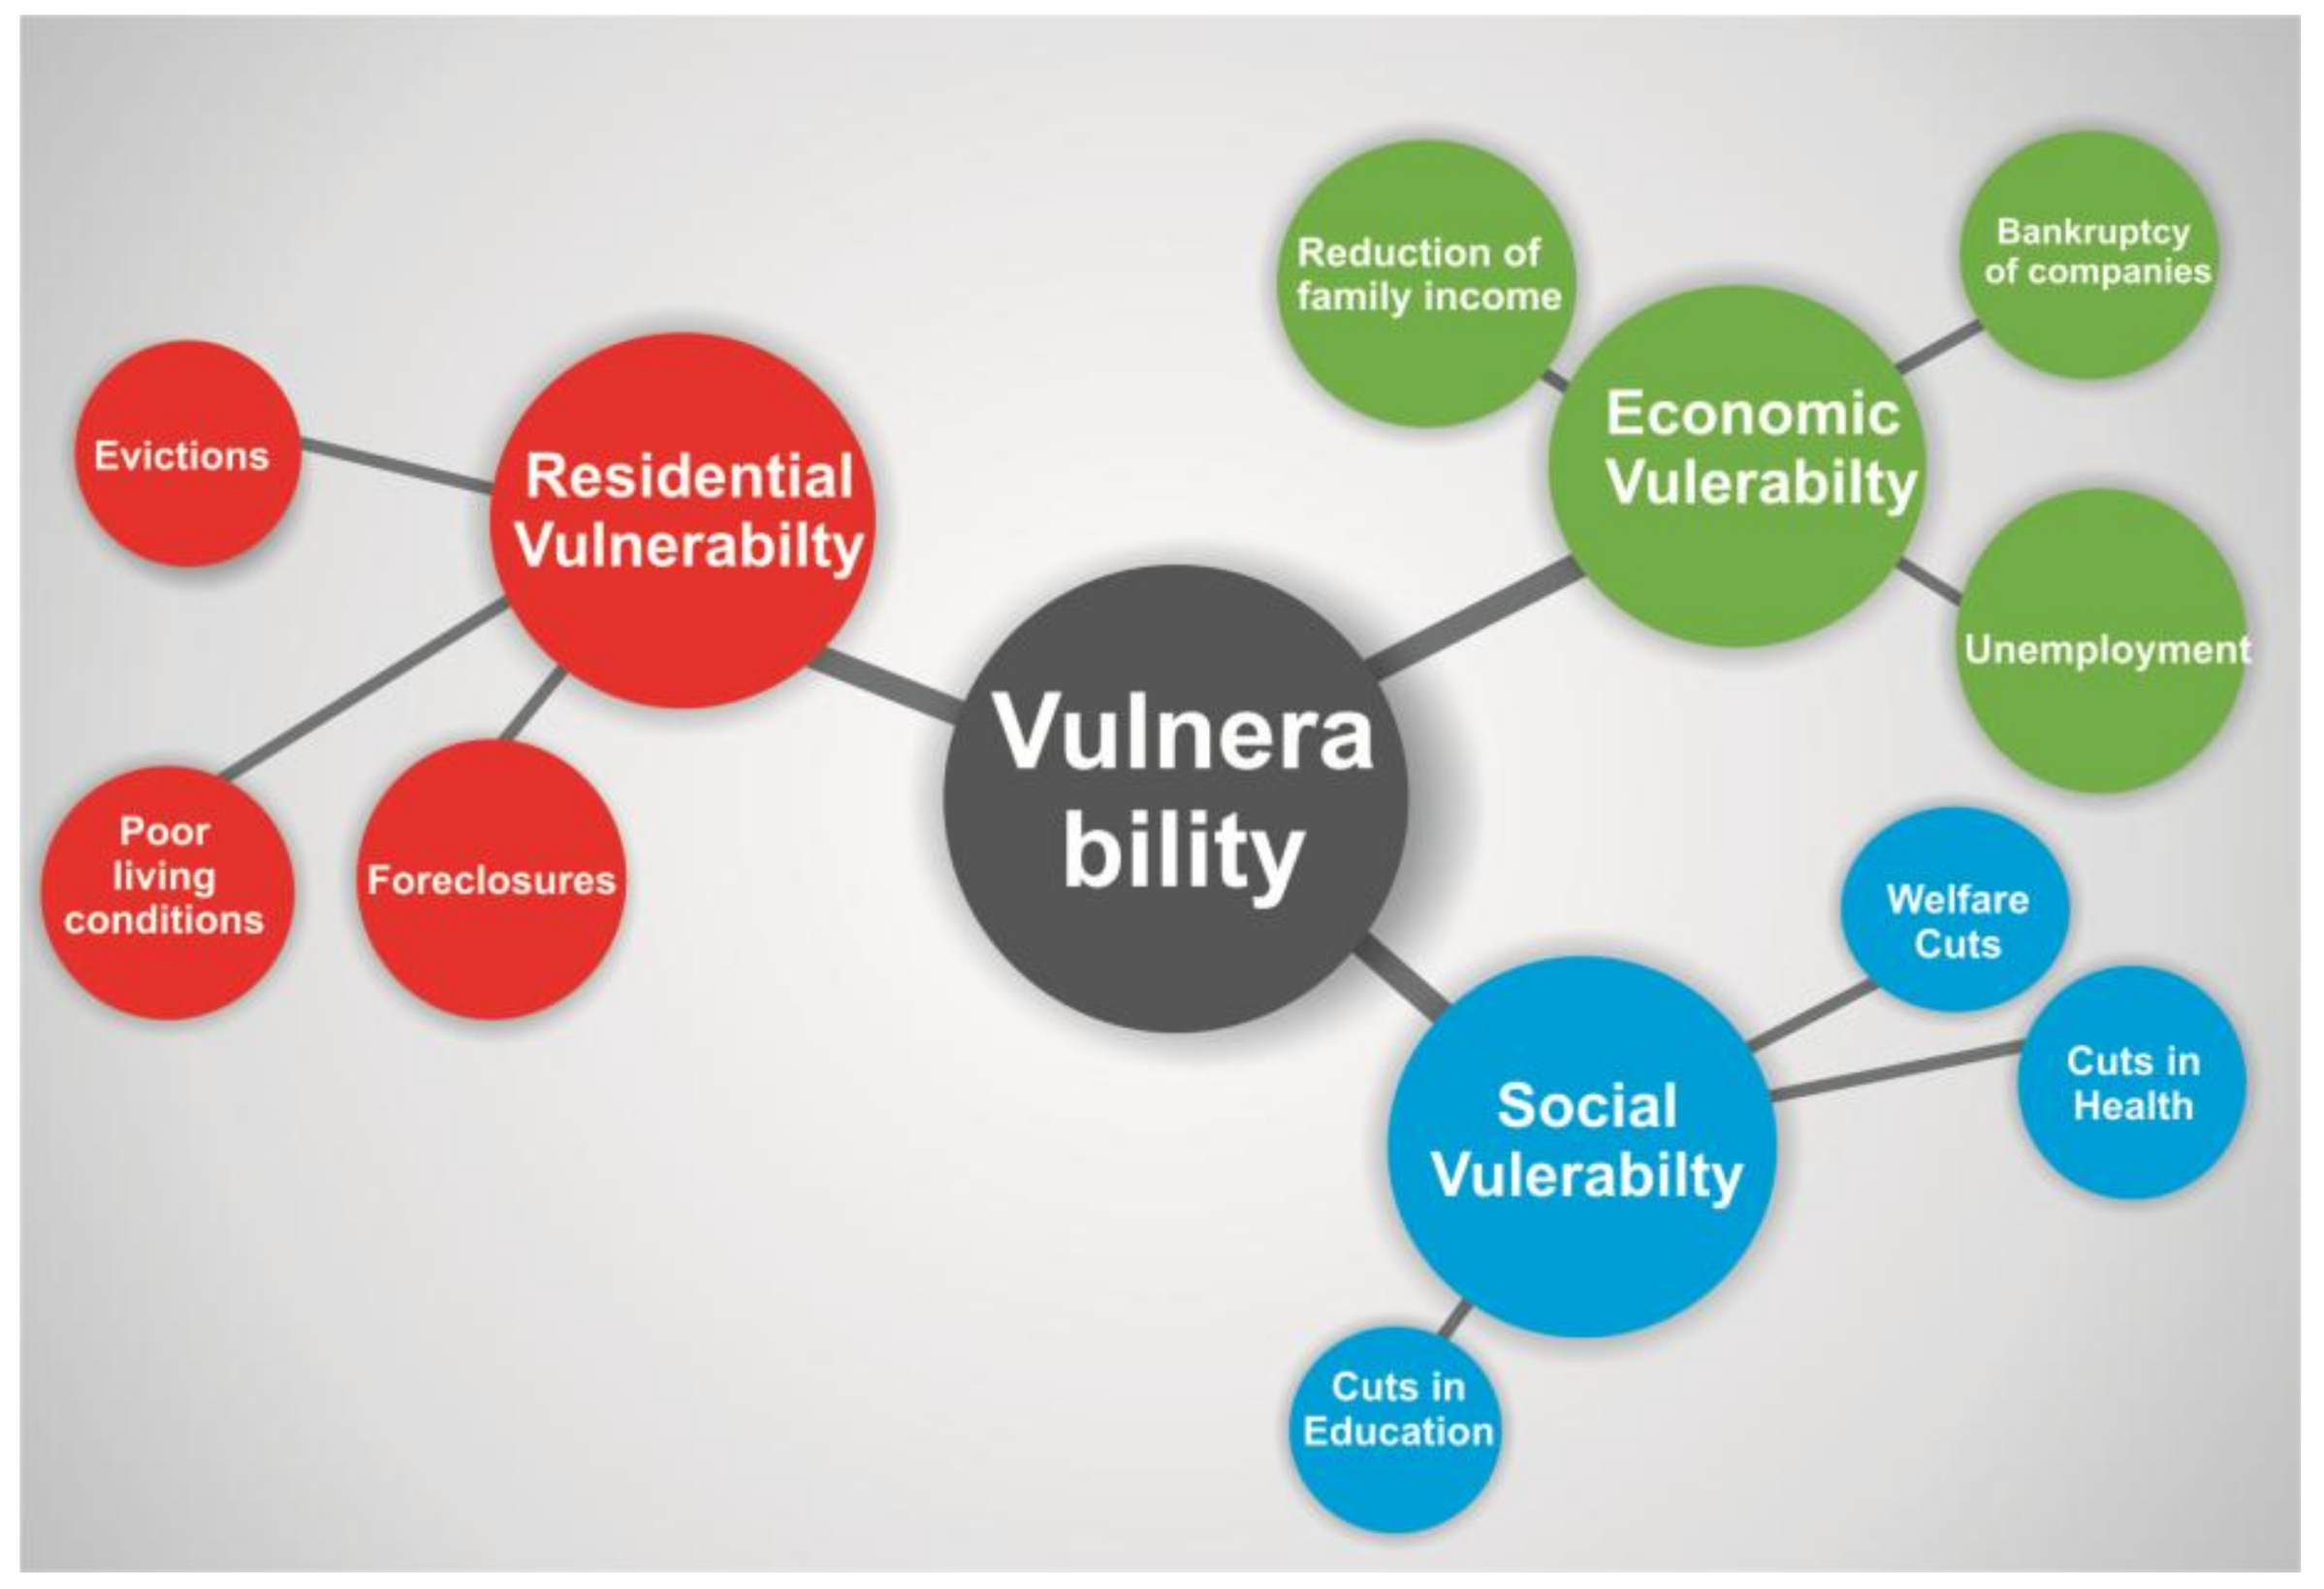
20]. All of them agree that there were three main aspects that had the greatest impact: the housing crisis, the destabilization of the labor market, and social inequality. Based on these, we can classify urban vulnerability into the following three categories (
Figure 1):
Economic vulnerability: considering the fact that many companies have closed, the loss of employment and the prolongation of unemployment situations have led to severe poverty. Unemployment benefits have a maximum duration of two years, so many families now have all members unemployed. The groups most affected by situations of long-term unemployment are those over the age of 45, immigrants, women, and young people.
Social vulnerability: a decrease in family income has limited the population’s access to goods and services, some of which are of prime necessity, such as healthcare (when having to pay for certain medicines) and education (the purchase of books and school supplies).
Residential vulnerability: being unable to afford the rent and mortgage payments; this situation has caused the number of foreclosures and evictions to multiply.
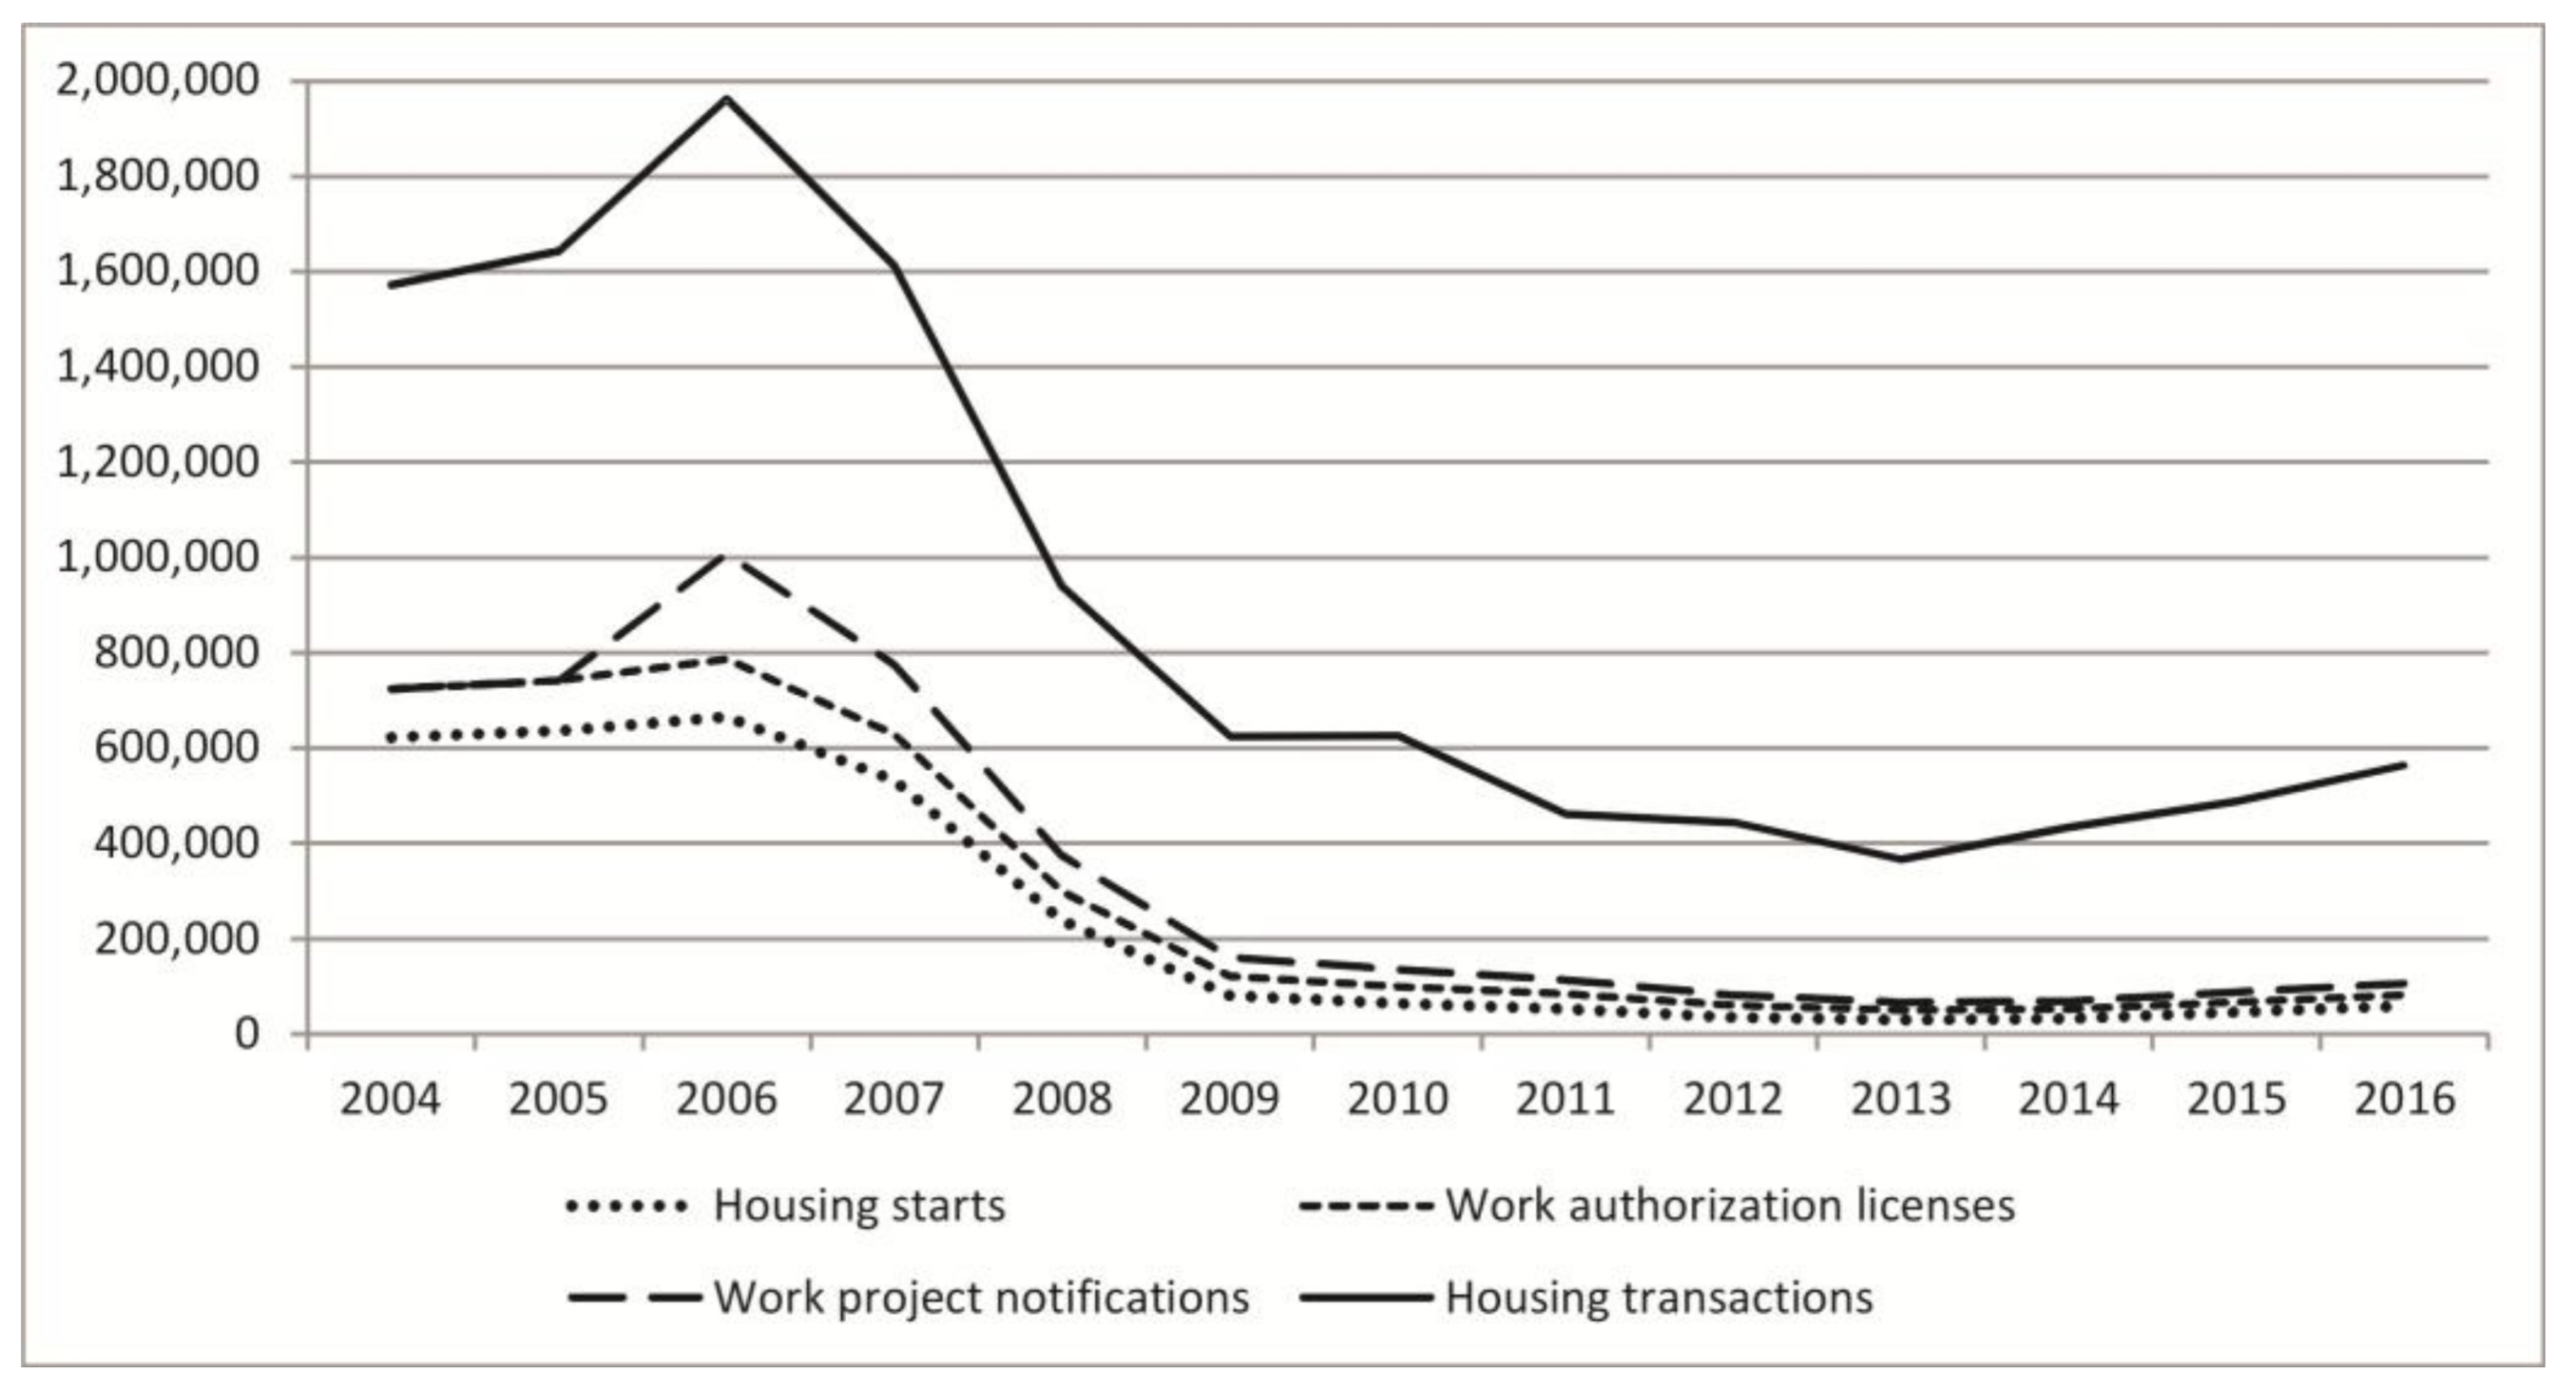
With regard to the economic vulnerability, two aspects must be highlight: the collapse of the construction sector and the destabilization of the labor market housing crisis. During times of great economic growth, the construction sector came to represent close to 18% of real GDP growth and more than 12% in direct employment. Since the crisis began, it has reduced its contribution to the GDP by 8 points, mainly as a result of the collapse of activity in national public civil works [
21], the interruption of large urban projects, and a decrease in new housing purchases. This is confirmed by the data related to visas, licenses, transactions and the volume of new homes started. The latter experienced the greatest decrease of around 95.6%, until 2013 when it began to recover, while licenses and visas decreased by around 83.5% and 92.4%, respectively (
Figure 2). Regarding transactions or home sales, the crisis also caused them to be reduced by 68.5%, despite the fact that the price per square meter also experienced a decrease during that period.
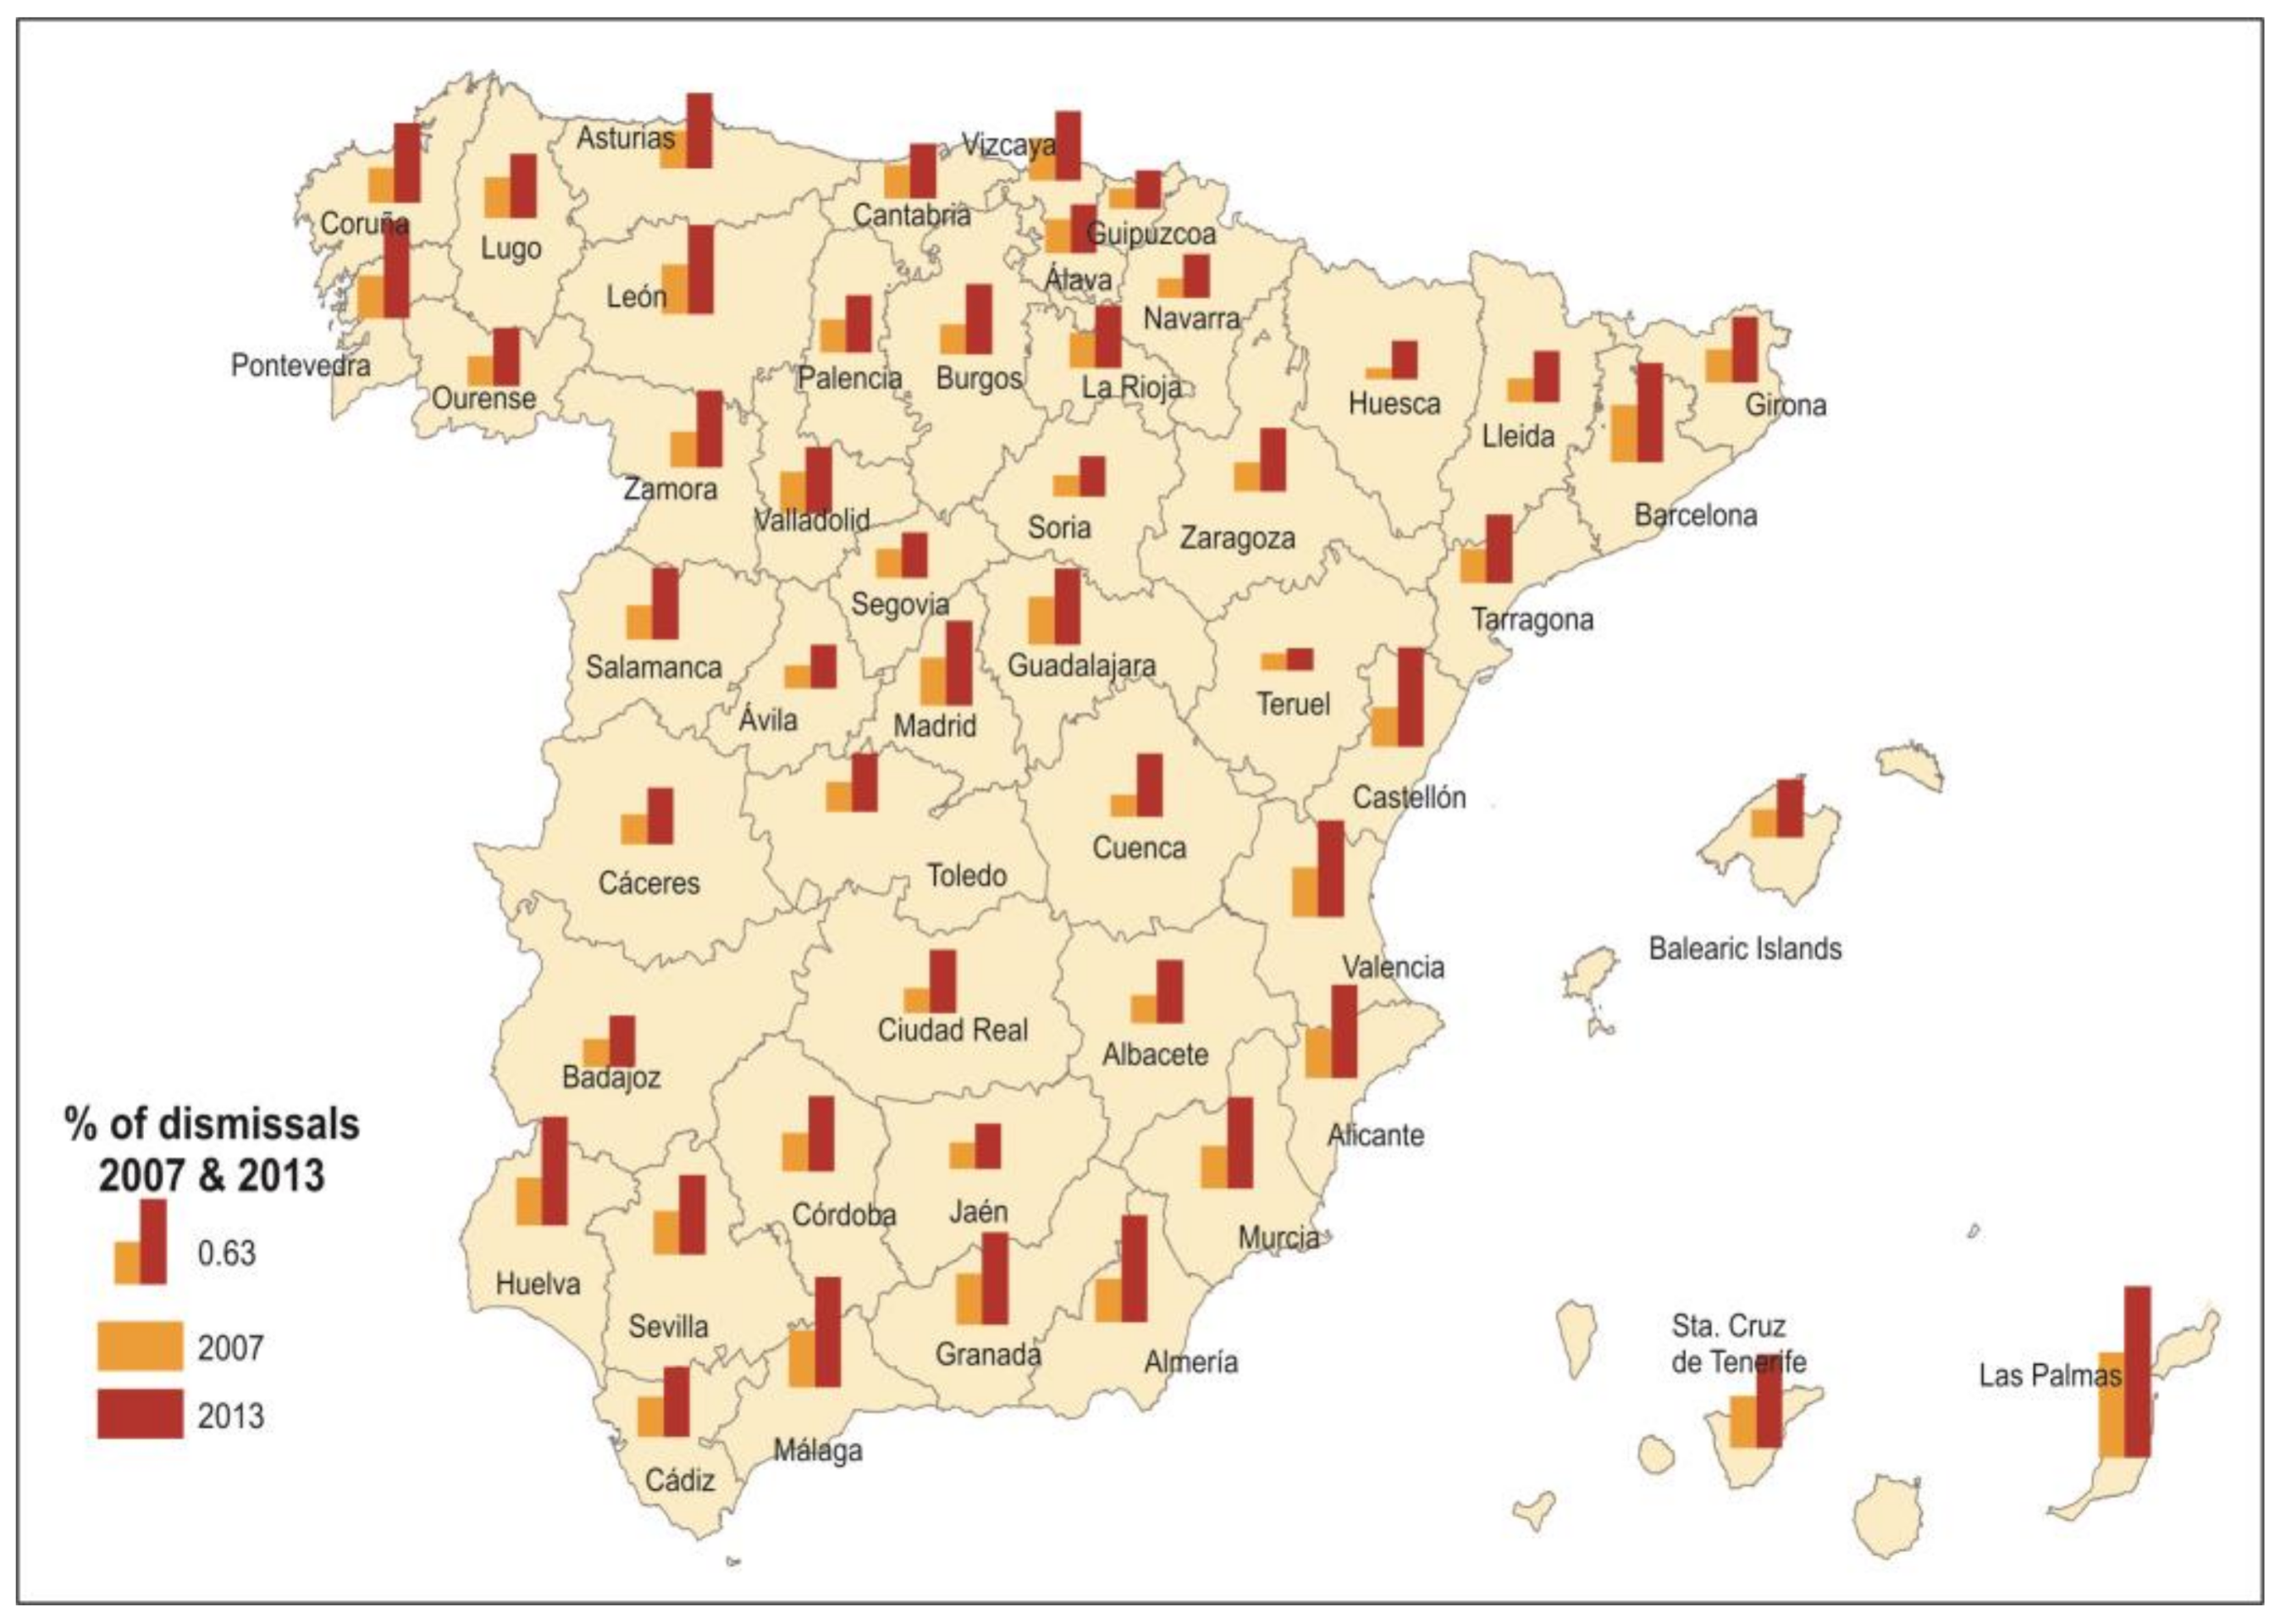
On the other hand, regarding to the destabilization of the labor market, it should be noted that the crisis led to the closure of numerous companies and, consequently, an increase in unemployment. The statistics of the College of Registrars indicate that in the period of the crisis (2008–2013), a total of 214,958 companies closed in Spain, at a rate of 23,884 annually. Likewise, during the same period, a total of 1,149,899 dismissal requests were submitted to the Labor Court, which went from 66,249 in 2007 to 146,796 in 2013. The cities with a greater incidence were those of the Canary Islands, with the dismissals of Las Palmas de Gran Canaria representing 1.27% of the working population, and those of the Mediterranean Axis, where real estate development was associated with the tourism product of sun and beach, highlighting the cases of Malaga, Huelva, Almeria, Barcelona, Castellon, and Valencia, where this percentage falls around 0.7% (
Figure 3).
As a result, the unemployment rate went from 8.5% in 2007 to 25.5% in 2013 [
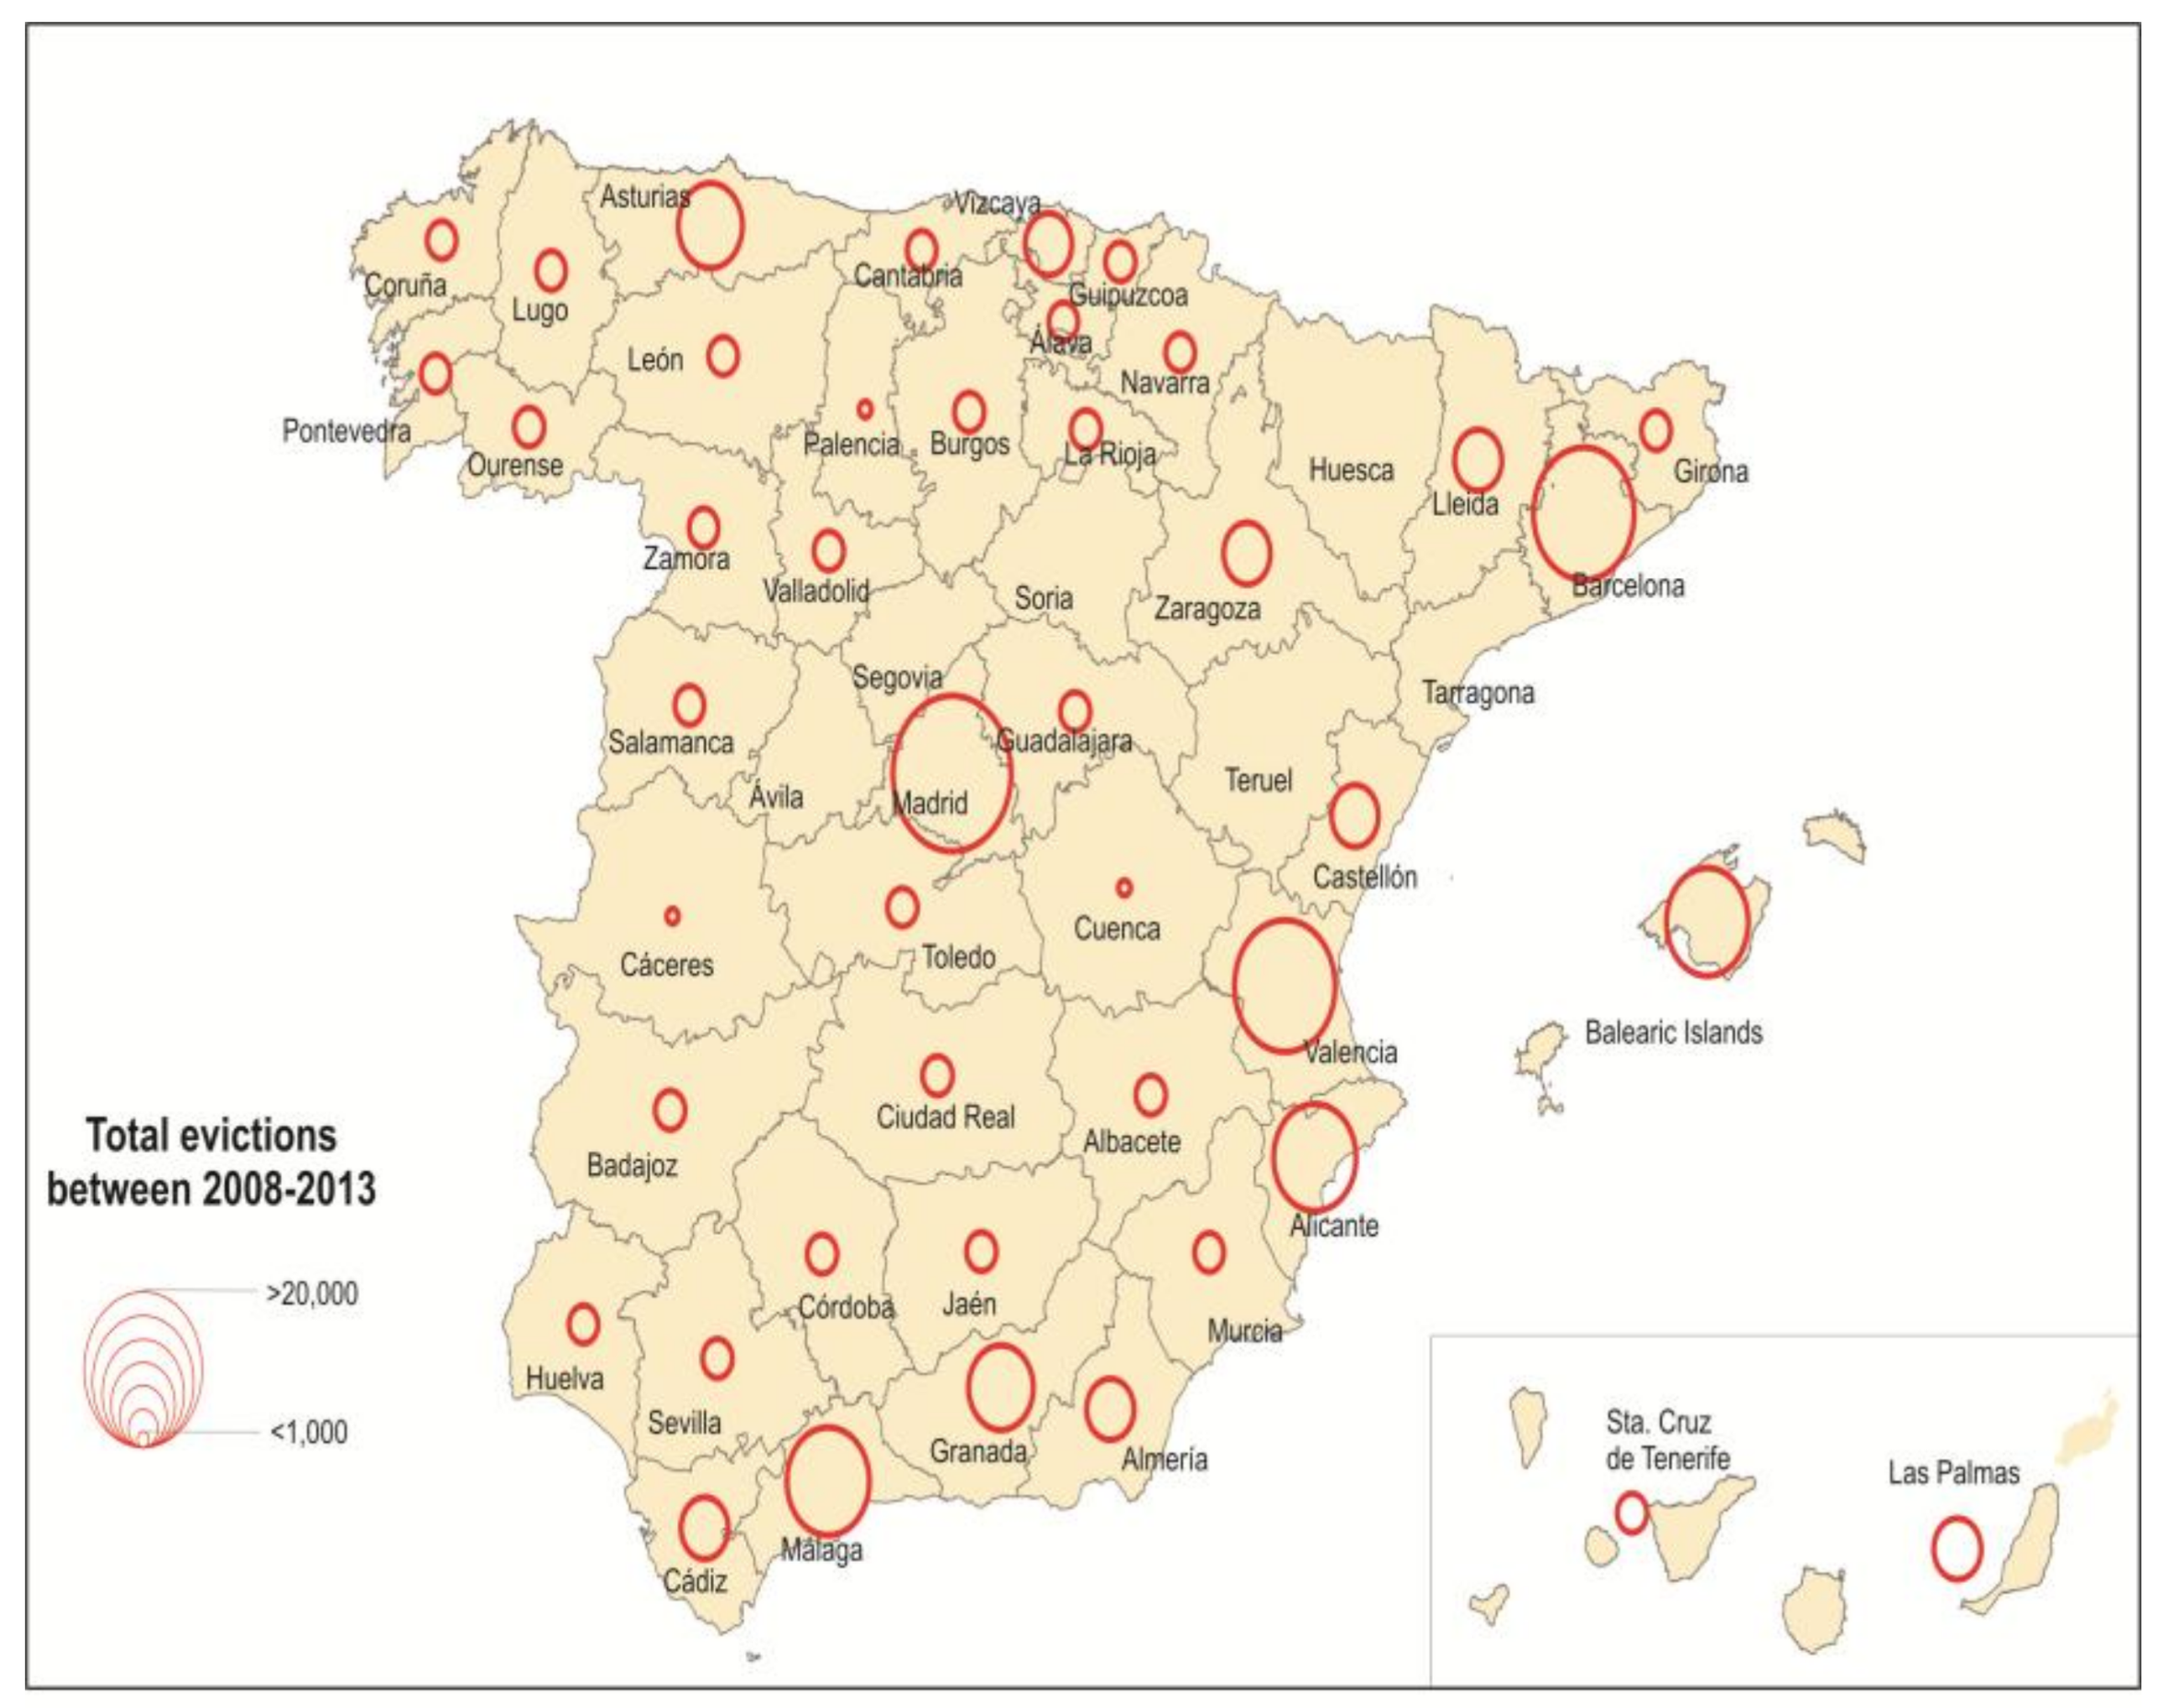
22], with a total of 5,896,300 unemployed individuals. The groups most affected by unemployment were men, immigrant workers, and those who had been unemployed for more than a year. The crisis and its continuation caused thousands of families to see their family income and spending capacity decrease and more and more households to register all their working-age members as unemployed, leading to the social vulnerability increase. Regarding residential vulnerability, Judicial Power Statistics shows that in 2007 foreclosures (the situation prior to eviction) increased by 297% over the previous year, although it was in 2009 when they reached their maximum with a total of 183,676 cases. From then on, the numbers began to fall, but in 2014 a total of 132,863 were still recorded. Of this total, 20.2% corresponded to loans granted in 2007, 17.3% to mortgages signed in 2006 and 12.1% to loans from 2005. This meant that the period 2005–2008, which coincided with the most bullish phase of the bubble, saw a concentration of 61.6% of foreclosures initiated in that year. In absolute values, the cities that saw the highest rate in the period 2008 to 2013 were those located in the provinces of Madrid (with over 70,000), Barcelona and Valencia (which exceeded 40,000), and Alicante, the Balearic Islands and Malaga (all exceeding 20,000). These six provinces accounted for 61% of the total evictions reported in that period. As noted, they are large urban agglomerations and these provinces correspond to established tourist destinations, where the bubble had a greater impact (
Figure 4).
These figures allow us to assess the degree of tension, anger, impotence, and vulnerability to which Spanish families were subjected since 2008. In a short period of time, many of them lost their employment and housing, and they had to see how the State instead of helping them by offering them official protection housing focused on paying the debt contracted by the banks. It was then that it became clear that housing and urban policies carried out so far developed the creation of a housing park unable to meet the needs of society. According to the Housing Emergency Report in 2013 there was no public rental housing park available to accommodate low-income groups—the percentage of social rental housing did not reach 2% of the total, when the EU-15 average was between 20% and 30%. The aid to the payment of the rent was scarce and was linked to the budgetary availability, and the private rental market was insufficient (15% of the total) and highly speculative (there were no limits to indiscriminate increases in income). Likewise, the introduction of measures aimed at combating unjustified unemployment and underutilization of real estate had been renounced, as is the case in other countries such as France, where houses that remain empty for 18 months can be requisitioned. That is why Spain had the highest percentage of empty homes in Europe (13.7% compared to 8% in Germany and 6.3% in France) [
23,
24].
2.3. Map of the Crisis
Since 2014, statistics have shown an incipient recovery in the employment rate—in 2016. it was around 18.63%, and in that same year, the number of foreclosures was reduced by 41,129, 10.62% less than 2015. However, this improvement in quantitative indicators does not seem to be reflected in greater citizen welfare or in a decrease in inequality. As many as 18,083,692 households can currently be counted in Spain, of which 1,610,900 see all their working-age members unemployed [
25]. According to a survey of living conditions, 16.6% of people say they have great difficulty reaching the end of the month, 19.0% have difficulty, and 27.0% have some difficulty. As a result, the poverty rate has reached 29.2%, reaching over 40% in some cities of Andalusia, the Canary Islands, Extremadura, and Murcia. To this, we can add the fact that social protection rates are decreasing and the distribution of wealth is changing in such a way that inequality is increasing between individuals with a higher income and those with a lower income. Regarding social protection, the coverage rate of unemployment benefits has gone from 76.5% of the unemployed in 2008 to 56.6% in 2016. The average number of people with unemployment benefits in 2015 was 2.2 million, with a decrease of 27% compared to 2010. The average monthly expenditure per beneficiary has decreased from 2012, going from €920.30 on average per beneficiary to €798.70 in 2016, down 13.2% [
26]. The evolution of the labor market continues to show the absence of change in the productive model. Job creation continues to be concentrated in unproductive, low-value-added services (sales, hospitality, ancillary services) with a low impact on the industry and from sectors with medium and high technological intensity. In addition, in January 2017, 91% of signed contracts were temporary and almost a third where part-time, proving the great precariousness of the labor market.
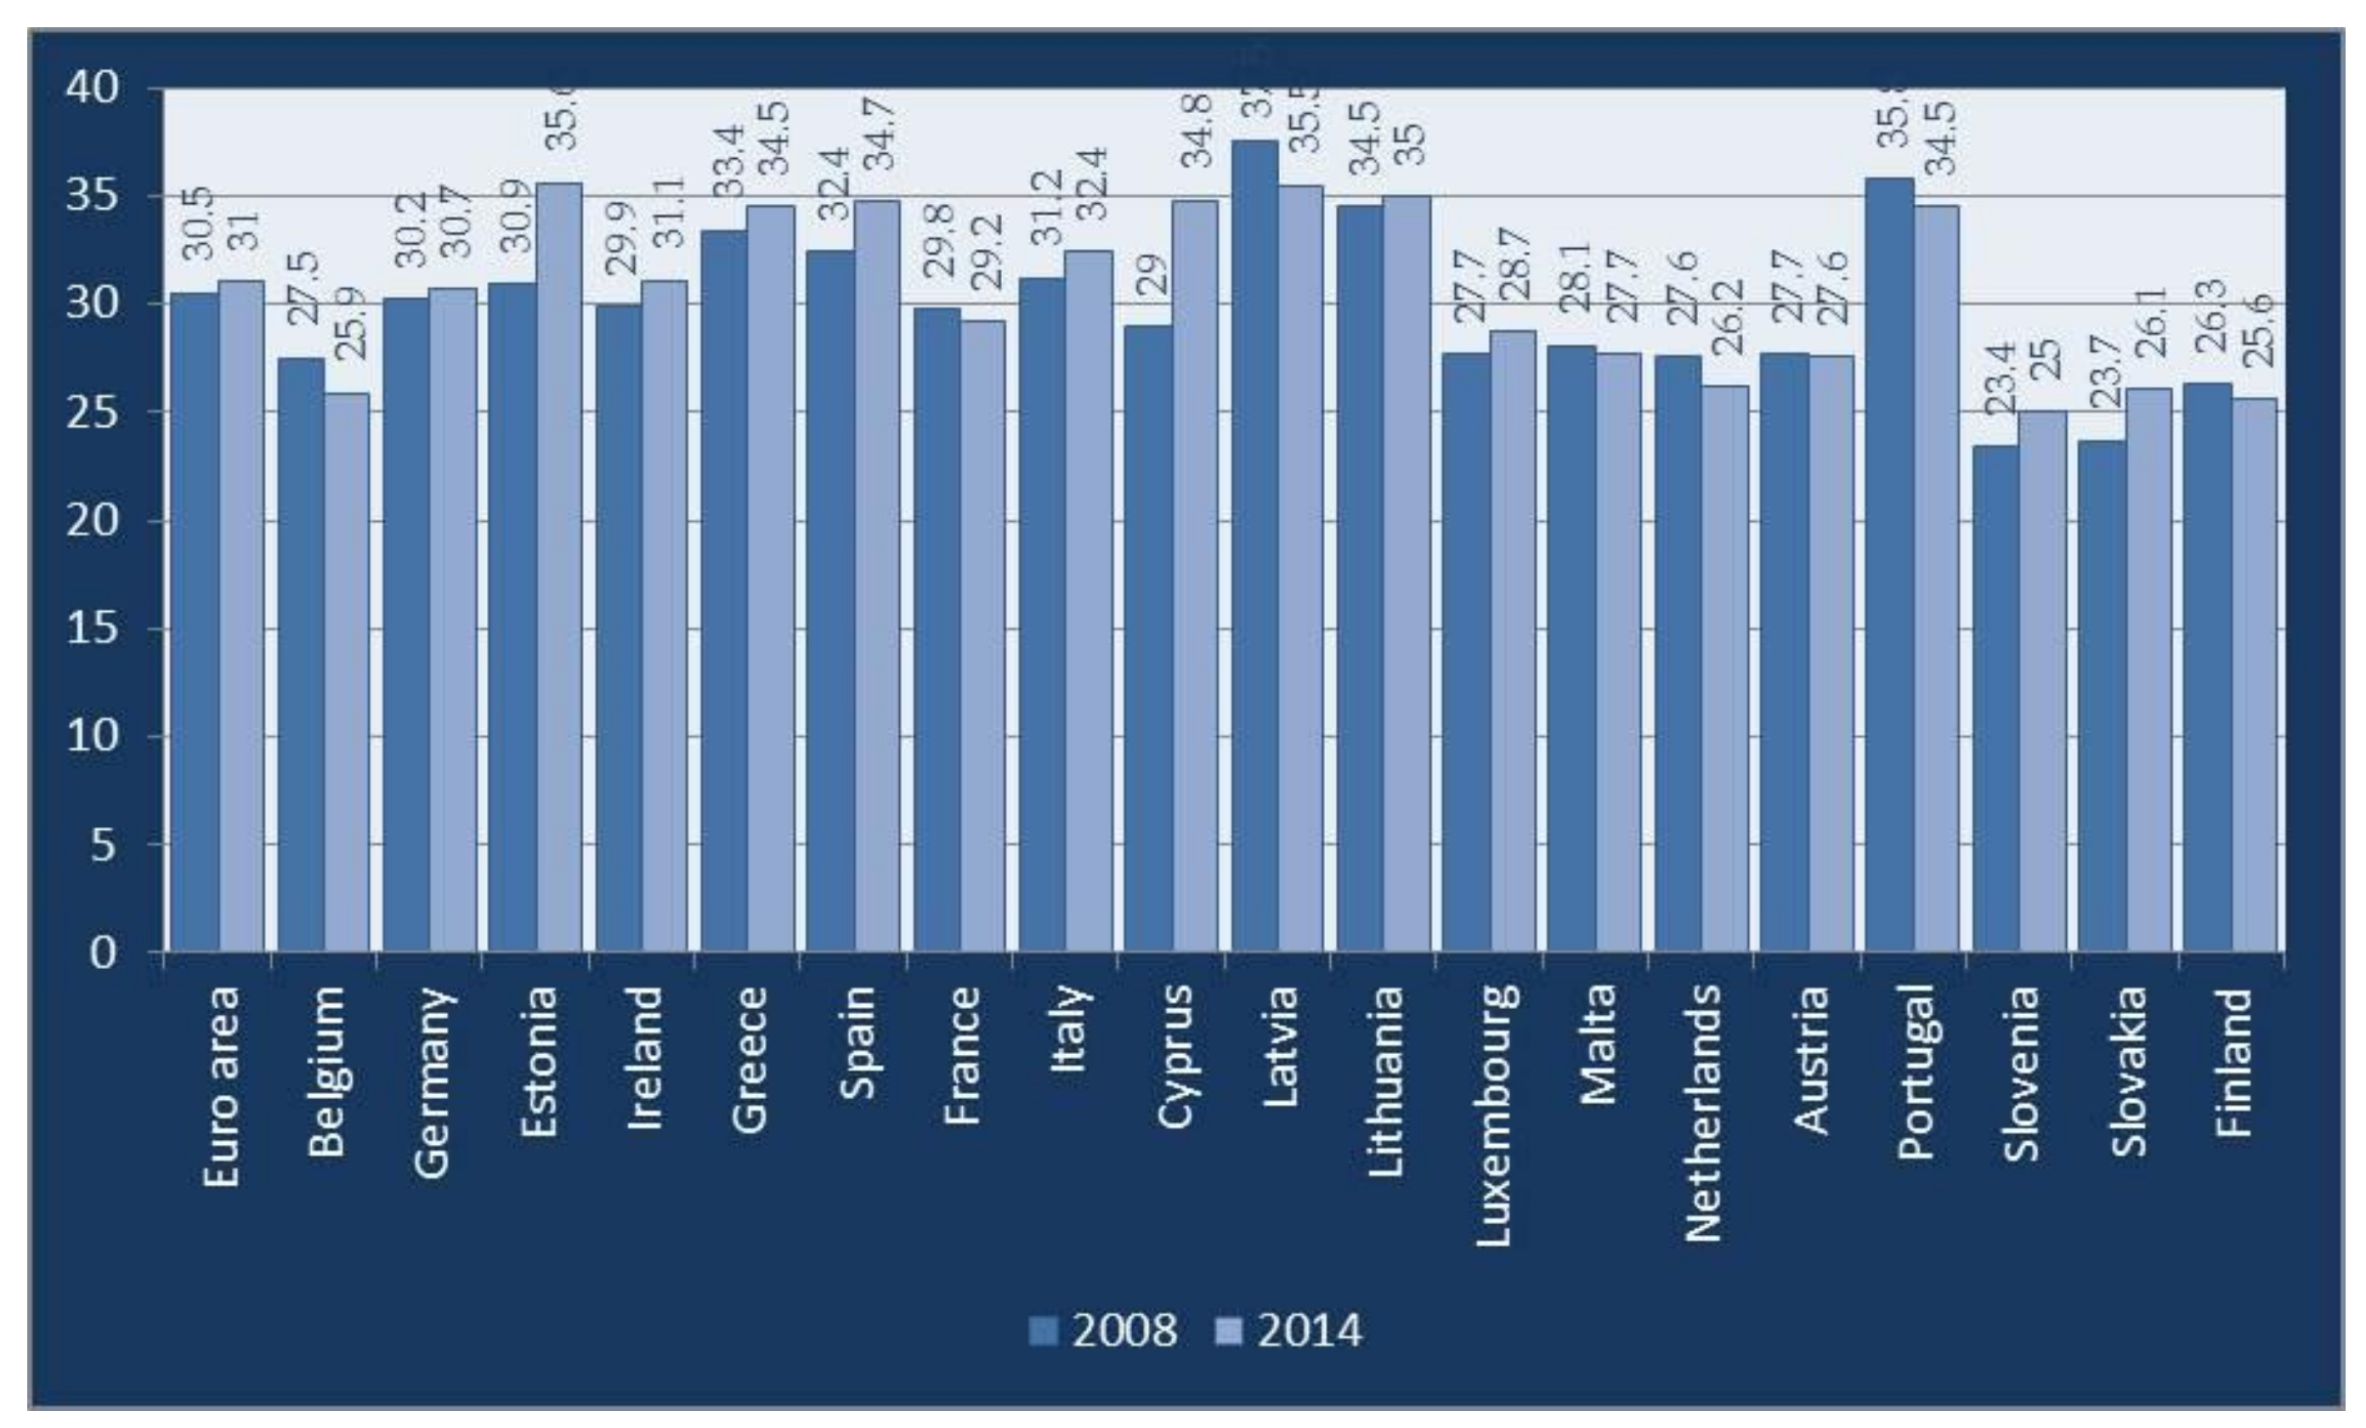
The European Commission shows concern because Spain continues to maintain a high degree of inequality. It maintains that the adjustment measures that have been implemented in Spain have favored the concentration of wealth and the proliferation of poverty in a growing part of the population [
27]. This socialization of poverty has made Spain the country in which social inequality has deepened the most, standing at the level of Bulgaria, Greece, and Lithuania [
28]. A fact that is confirmed, on the one hand, by the Gini index, which during the crisis period increased by 2.3 points and stands at 34.7 points, while for Europe within the Eurozone it has increased by 0.5 points and stands at 31 points (
Figure 5). And on the other hand, due to the fact that if we analyze the distribution of wealth according to the income strata, we can observe that the percentage of the population located in the middle strata has been reduced by six points, the lowest strata has increased by seven points, and the upper strata has remained in the same position [
29]. These figures are what caused Europe to issue the Spanish government a warning, berating the scant impact of its social policies when it comes to reducing poverty.
Focusing on the local and mainly urban perspective, it should be noted that the impact of the crisis has not had the same effect on all Spanish cities, making the degree of vulnerability very different. According to the Crisis Atlas [
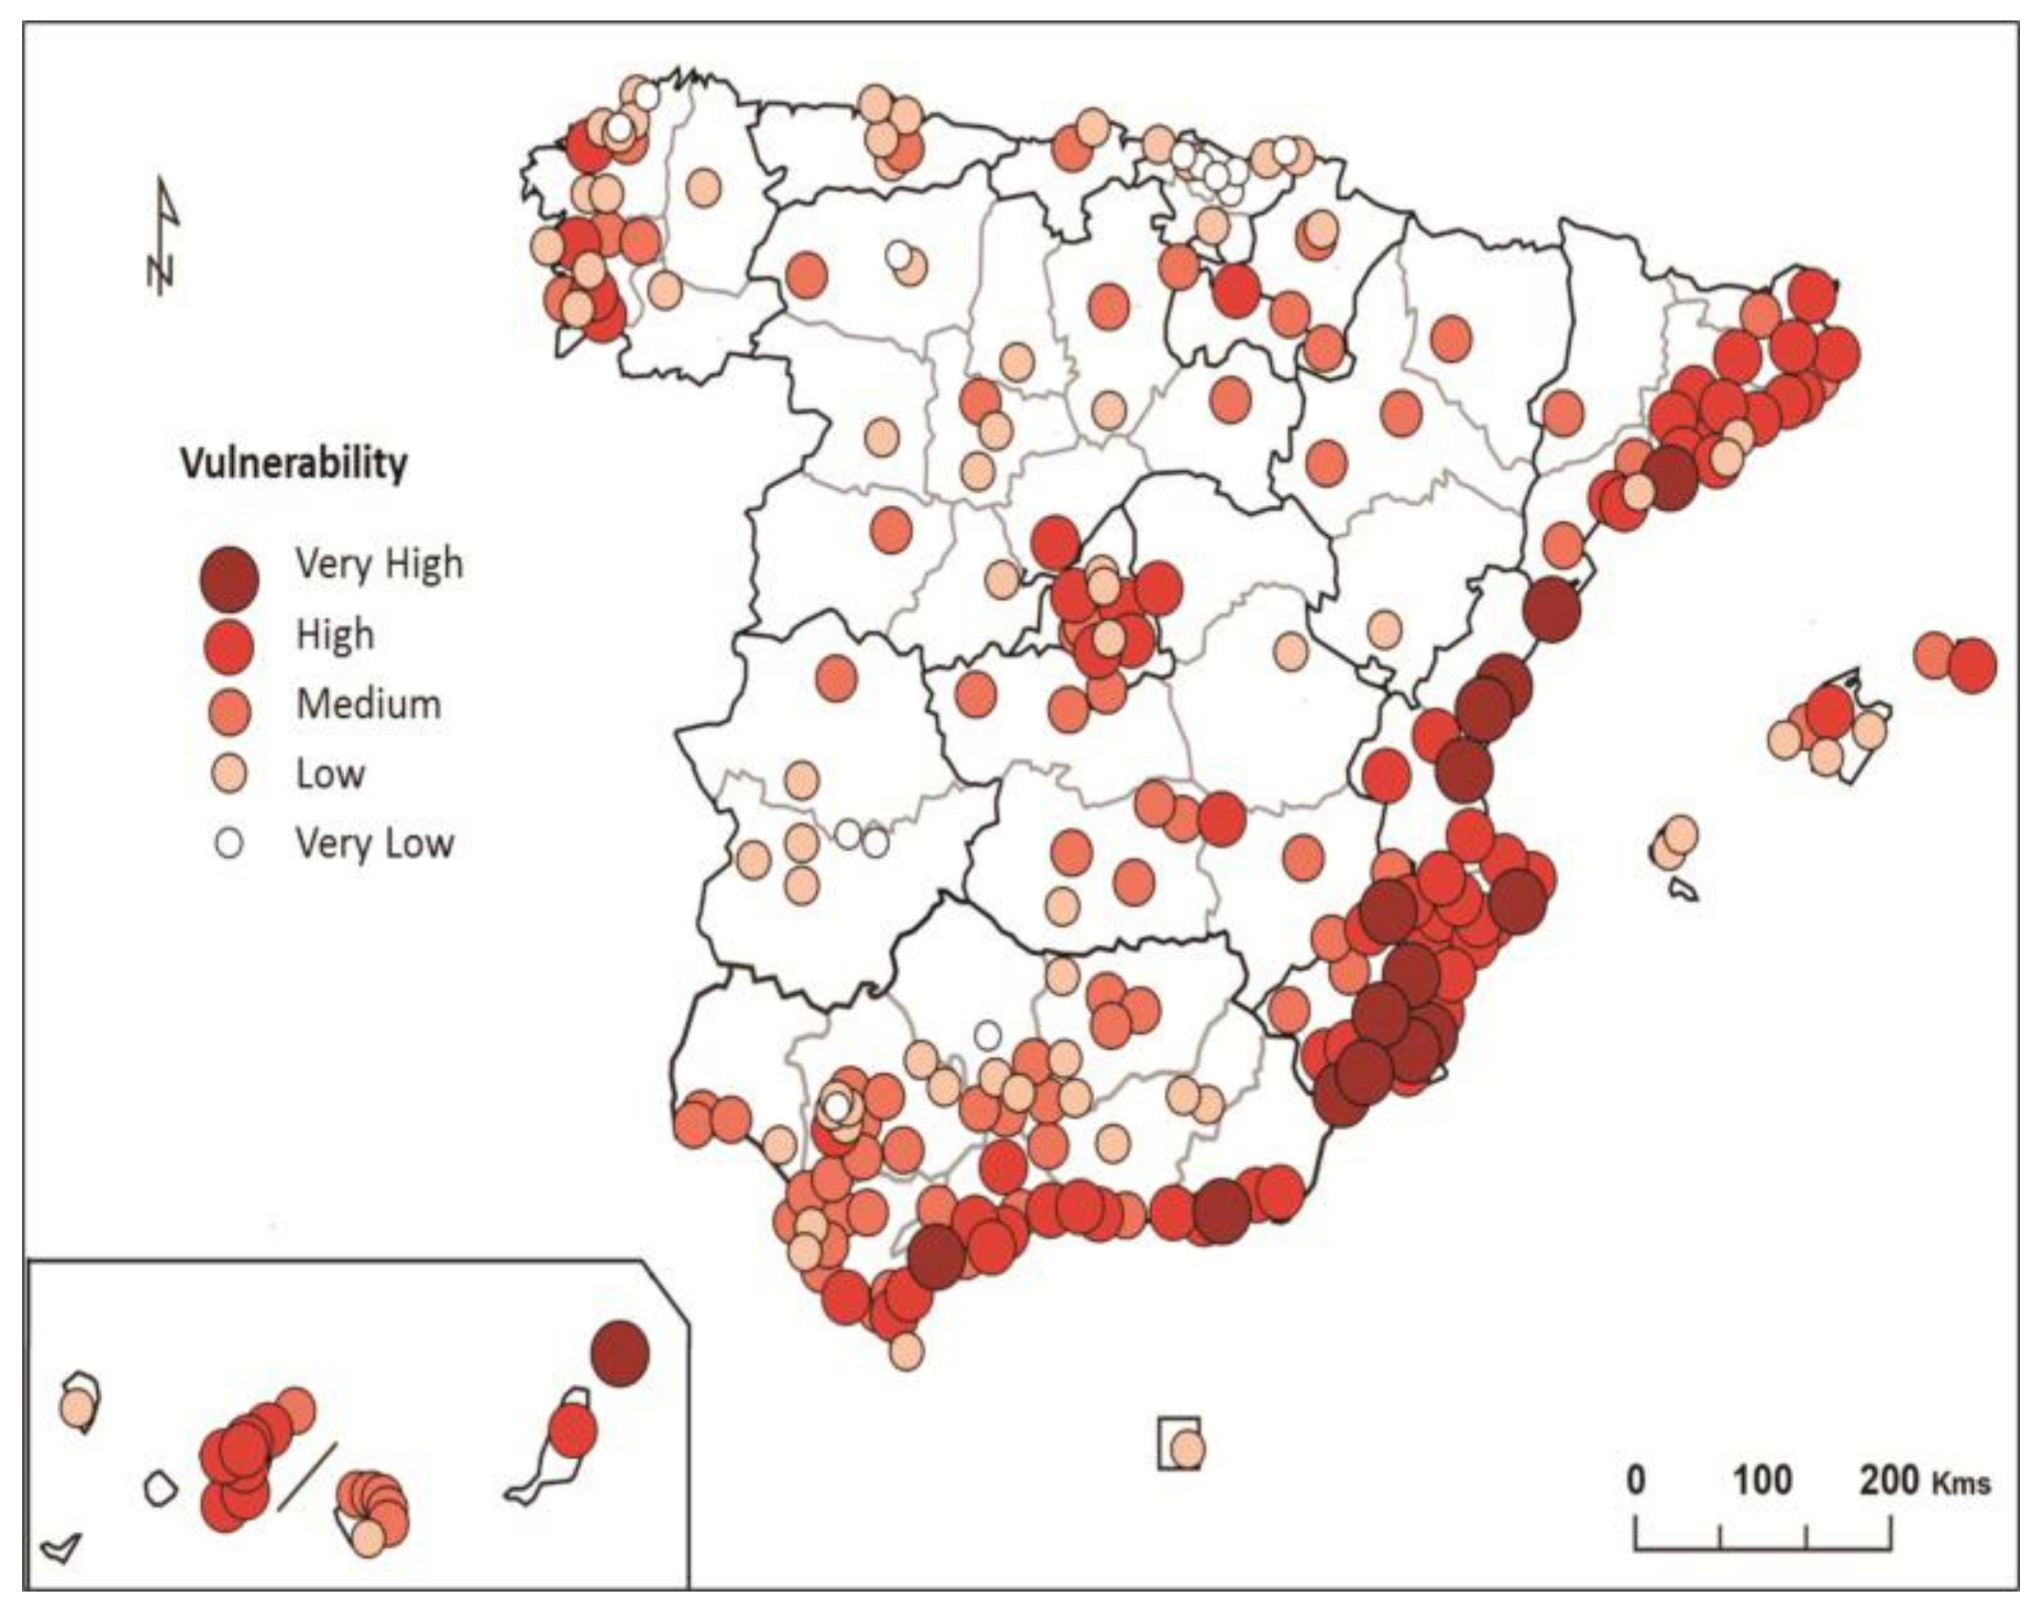
20], a differentiation can be established between those cities that have better withstood the onslaught of the crisis, and those that have been deeply scarred, showing high levels of vulnerability. Regarding the latter, it can be observed that they are concentrated in the following three focal points (
Figure 6):
The Mediterranean coast (especially in the Regions of Valencia and Andalusia), the Balearic Islands, and the Canary Islands, where tourist-based development, particularly in the dense construction on a massive scale of second homes for the middle-income population, generated a deep artificialization of the land, which caused serious environmental and socioeconomic impact and negatively affected the age-old agri-food specialization due to competition for soil or water.
The metropolitan areas of the urban agglomerations of Madrid and Barcelona, throughout which immigrant and working-class neighborhoods spread, and where the impact of the bubble has left a landscape of architectural skeletons and unfinished spaces, eventually becoming ghost spaces.
Areas of development, throughout which medium-sized cities are located and where the population and economic activity are concentrated. Worth noting are the Atlantic Axis in the northwest, the Huelva-Seville-Córdoba corridor in the south and the Ebro corridor in the northeast.
What is understood by urban vulnerability? According to the Urban Analysis of Vulnerable Neighborhoods published by the Ministry of Development [
30], it refers to any unease or discomfort present in cities brought on by the combination of multiple aspects of disadvantage, in which all hope for upward social mobility and overcoming one’s social status of exclusion (or close to it) is considered extremely difficult to achieve. To the contrary, it also entails the perception of insecurity and fear of the possibility of downward social mobility or a worsening of one’s current living conditions. In general, the degree of vulnerability is greater in large cities, not only because a larger volume of the population is concentrated, but because individualism and an anomic social climate prevail within them, leading the individual to believe that they cannot count on other people, and that their family relationships are weaker. Moreover, they are the main destination of the immigrant population, which see them as having the greatest potential for finding a job. However, it has sometimes been interpreted that large cities are more prone to receiving a more intense initial impact than medium-sized cities due to their greater openness to the outside and their link to global markets. Furthermore, housing prices are more expensive, costs (such as transportation) are increased, and working conditions may be worse, as there is an ample workforce for a scarce labor supply.
This is not to say that medium-sized cities do not have problems of vulnerability. Their main weaknesses include limited economic diversification, which translates into a high percentage of SMEs, a shortage of innovative clusters, a lack of R&D+I institutions, limited social and cultural diversity—which is perceived in the shortage of local initiatives—little citizen mobilization, local governments with scarce resources and bureaucratic inertia, and low participation in city networks [
20]. What happens is that these problems do not often come to light, either due to ignorance or because they do not interest their local governments. However, there is no doubt that these cities have also been affected by unemployment—we can see how their qualified human resources have had to emigrate to find work, and that the local administration has still not offered any plan for social improvement and economic dynamism for the most vulnerable neighborhoods.
Improving the quality of life of its citizens implies an in-depth knowledge of their problems. That is why, in order to measure the degree of vulnerability in medium-sized cities, see to what extent their governments are conscious of the situation and review the measures being taken to overcome this situation, two case studies have been selected: A Coruña and Vigo. These two cities are in north-western Spain, which make up the two main developed areas of the Atlantic Axis, with a similar population (243,978 and 292,817 inhabitants, respectively), but with very different trajectories. What they have in common is that they are both coastal cities, with important fishing ports on a national and international scale. However, while A Coruña is a city mainly offering services, in Vigo, automobile and shipyard industrial activity prevails. As regards local administration, in the first, the Marea Atlántica party has governed since the municipal elections of 2015, a left-leaning party born out of the people’s movement and that demands a new model of urban governance based on transparency, real democracy, and social cohesion; in Vigo, the Socialist Party governs, whose representative has been in power for 11 years.
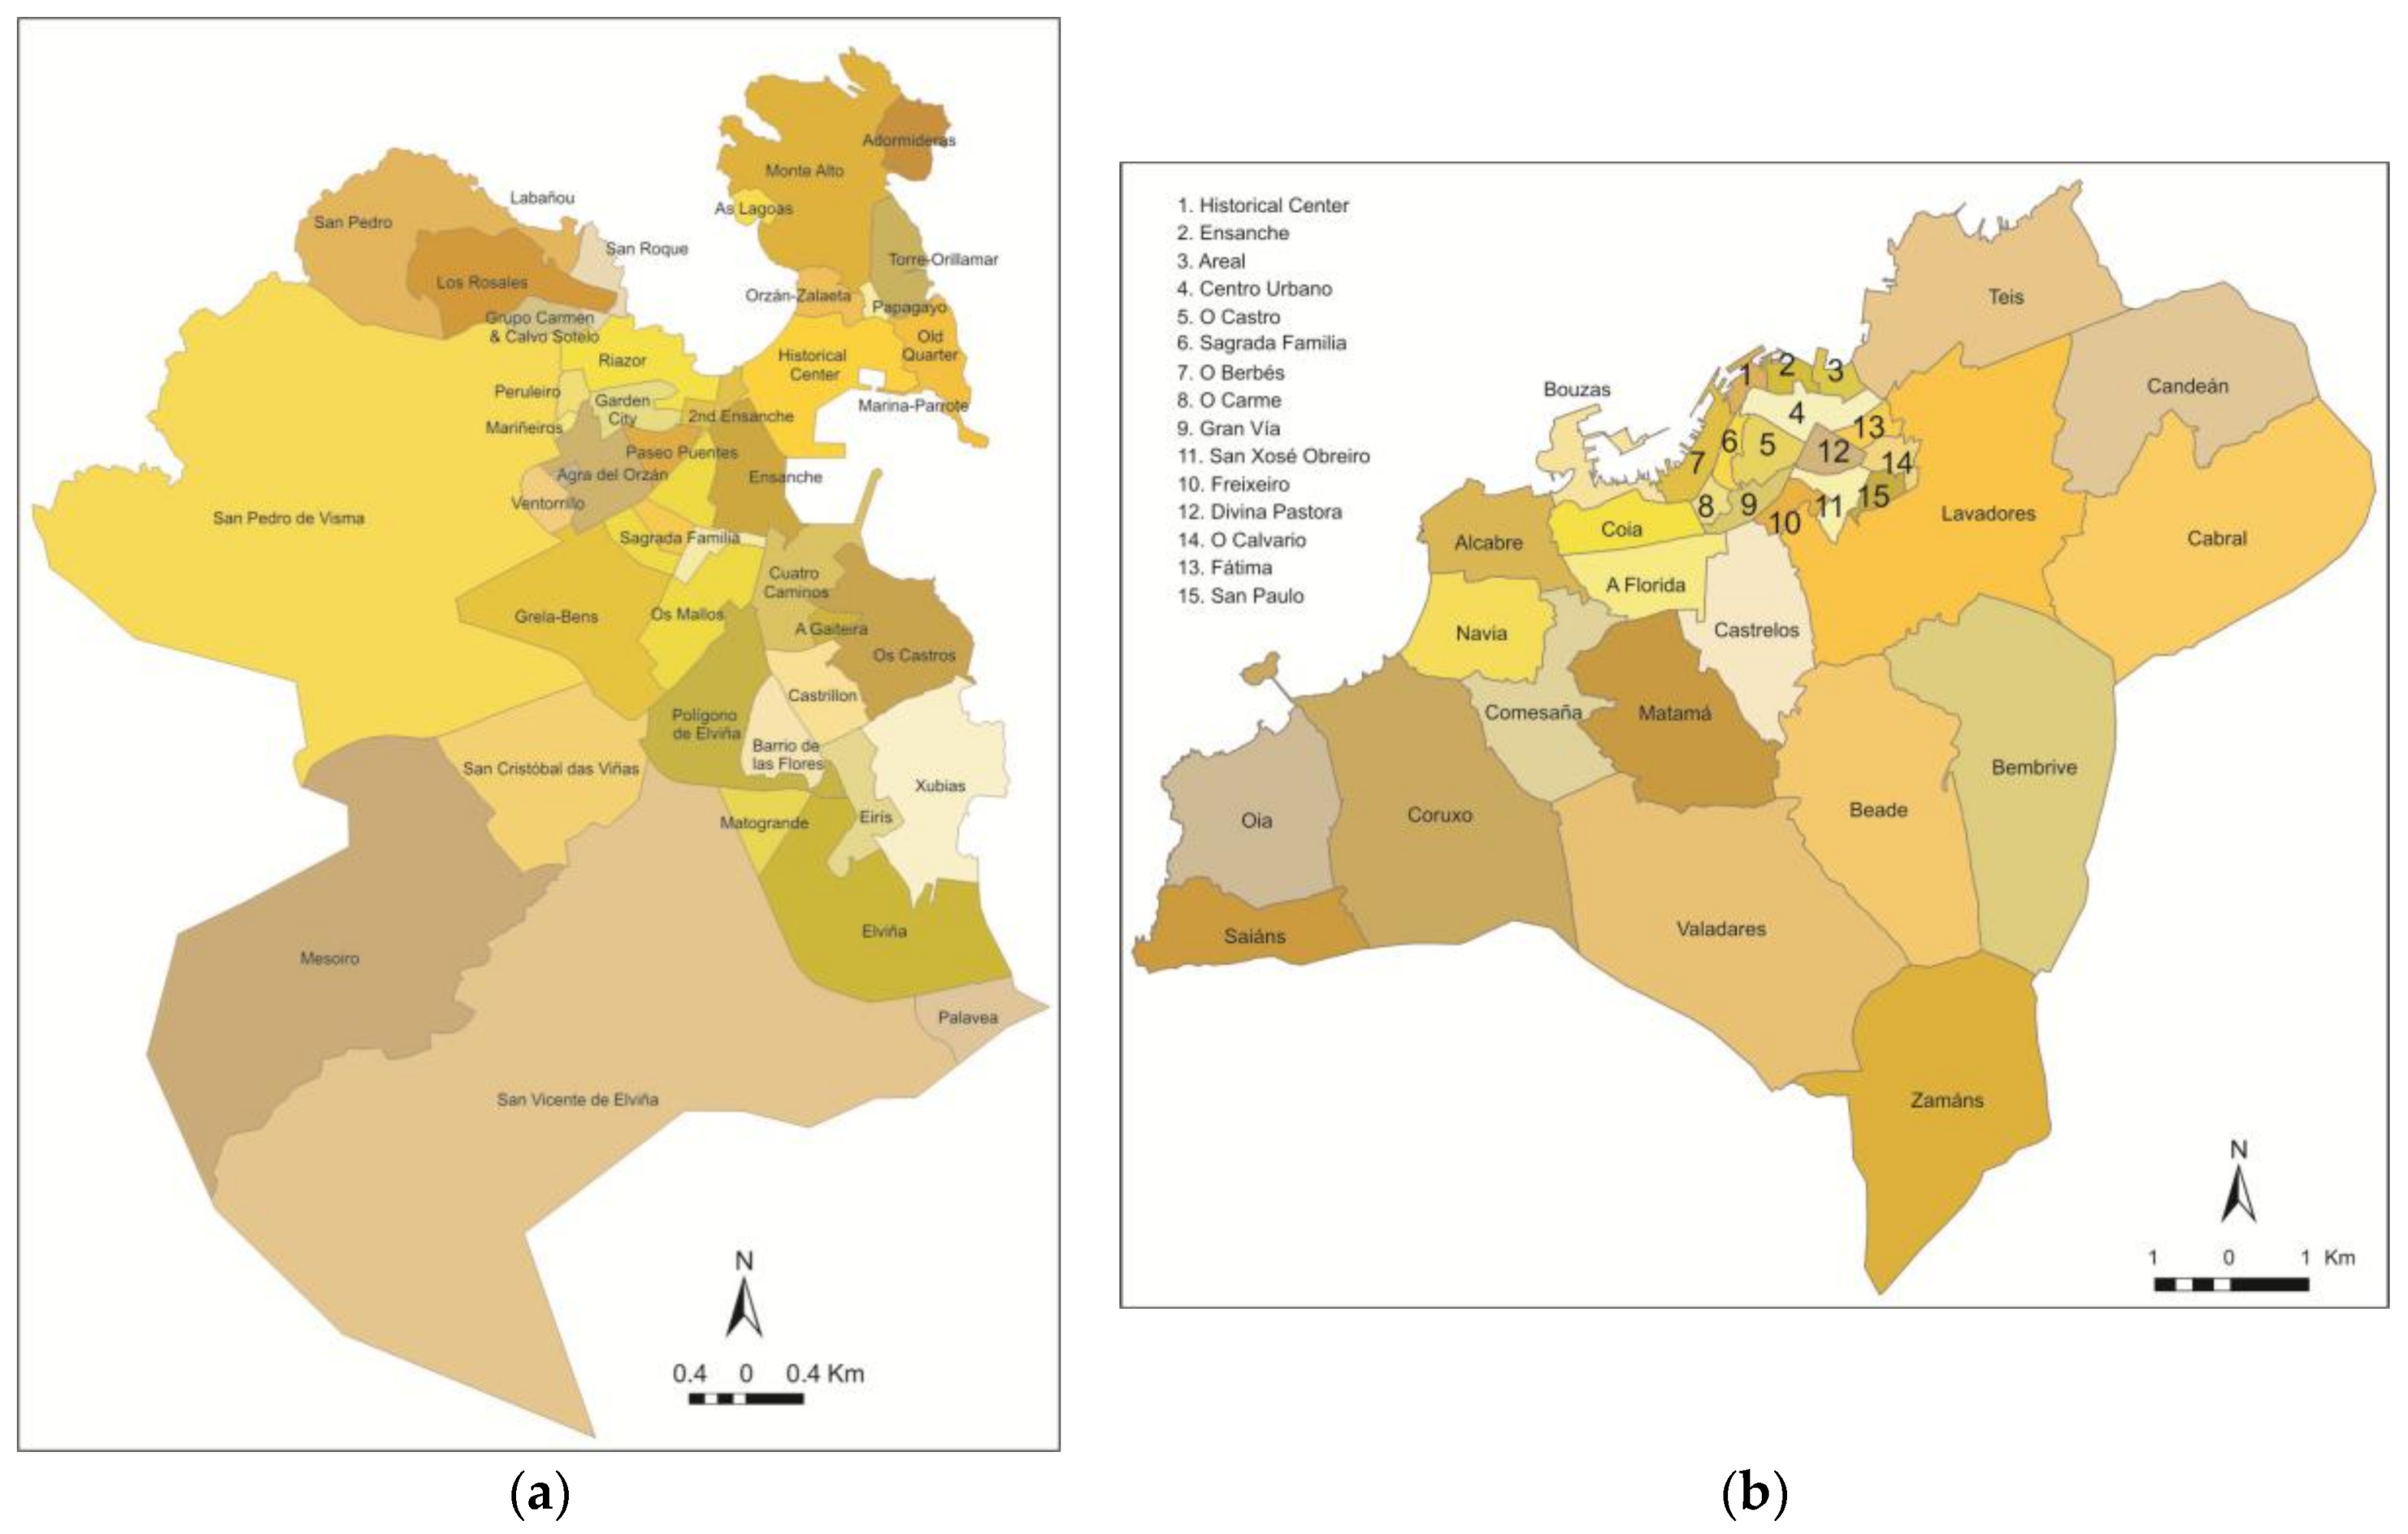
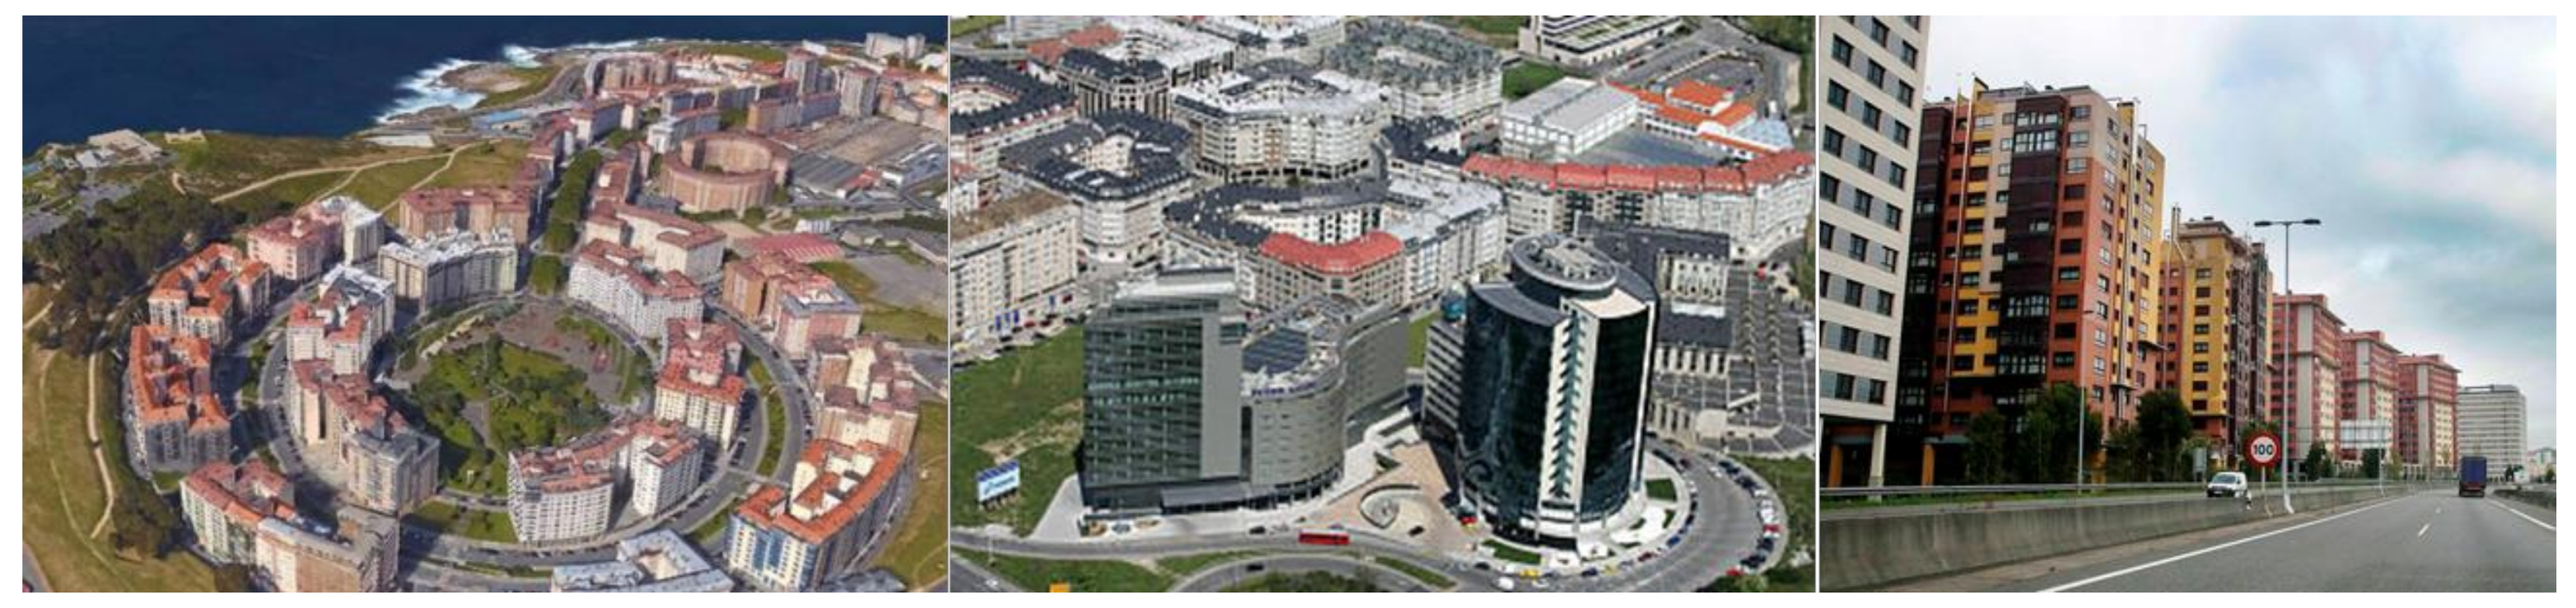
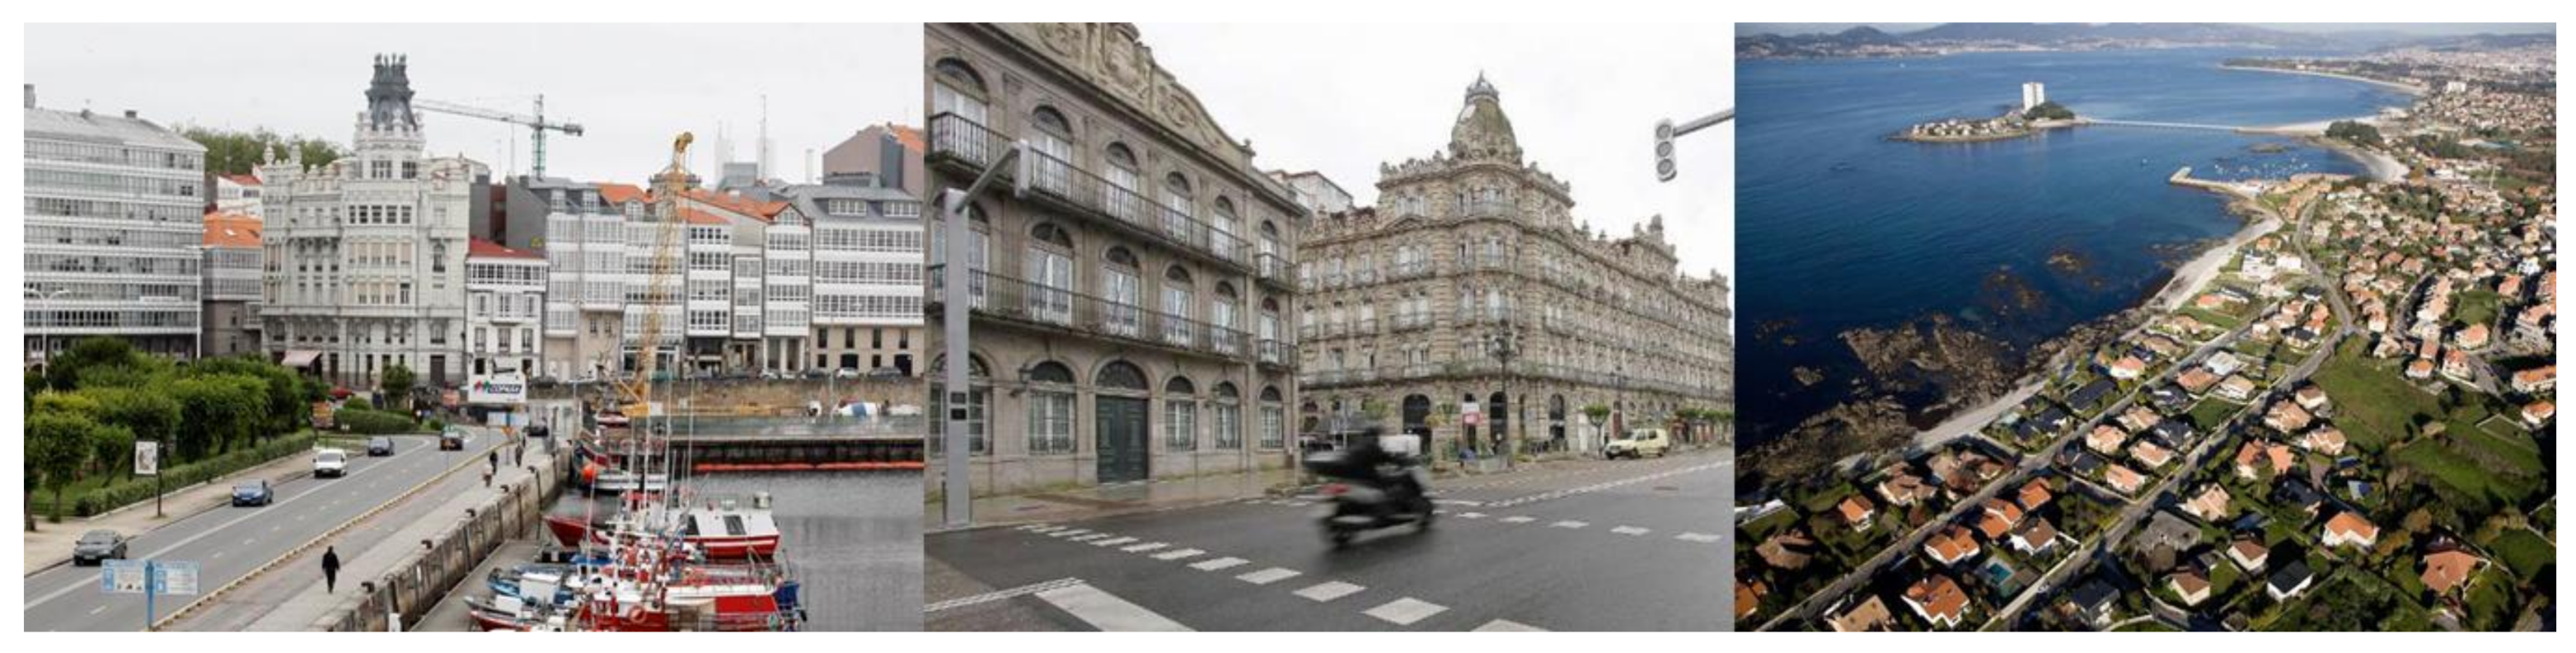
On an urban level, while A Coruña is a compact city, densely populated, and where urban growth has been conditioned by the scarce surface area of the municipality and its location on a peninsula, the urban space of Vigo is fragmented and disorganized. However, in both, we can make out a Historic Center, corresponding to the walled pre-industrial city, in which two areas can be differentiated: the old town, which after a period of serious physical, social, and economic deterioration is recovering thanks to European funds under the URBAN and regional initiatives, the well-known Integral Rehabilitation Areas (ARIs), and a second area, more dynamic and cared for at an urban level, identified as an urban center where commercial and business activity is concentrated and land and housing prices are higher. In this urban space, the value of the land determines residential and economic segregation, since only people with a high purchasing power can afford to purchase real estate and only those establishments or specialized entities with high profits can pay the rent of commercial establishments or offices. From the urban center a set of residential neighborhoods unfolds, in which the working population resides. It is possible to differentiate the following items between them (
Figure 7):
Those developed in the years 1960–1970 by the private initiative, which wanted to build on a massive scale to offer housing to the population coming to the city to work in industry (Florida, Teis, Cabral, O Calvario, Castrelos, and Balaídos in the case of Vigo; or Agra del Orzán, Os Mallos, Monte Alto, A Gaiteira, Castrillón, and Os Castros in A Coruña);
Those that were built as a result of plans developed by the public initiative, aimed at people with a medium to medium-low purchasing power and/or who were expelled from other urban areas through expropriation processes. In general, they are characterized by having an open urban framework, with buildings in blocks (Coia in Vigo; Polígono de Elviña, Barrio de las Flores, Labañou, Sagrada Familia in A Coruña);
New residential areas, built after 1990, where there was a concern for design, the quality of housing, green areas, and sports-leisure facilities (Navia in Vigo, Los Rosales and Paseo Puentes in A Coruña).
3. Method
Methodologically, from a geographical standpoint, both the consolidated urban space and the immediate periphery have been considered, although, with respect to the latter, there are notable differences between the cities being studied. In the case of A Coruña, the peripheral settlements are smaller, are very localized, and respond to two well-differentiated typologies: older settlements in which, despite conserving a rural landscape, the ways of life of their inhabitants are completely urban, and recently built housing developments for the well-off middle class. In the case of Vigo, what draws attention is its scattered peripheral growth, the result of urban development based on partial plans, and whose rustic land has not been accommodating, absorbing a large part of the housing deficit required by economically disadvantaged social groups, reaching densities higher than 100 hab/ha [
31]. For statistical collection on an intra-urban scale, we have used urban cadastral sections, with these units being the smallest units of analysis. According to the National Institute of Statistics, in 2011 there were a total of 187 census tracts in A Coruña and 243 in Vigo in 2011.
For the calculation of the vulnerability index, we have supervised the research developed by Méndez, Albertos and Sánchez, Subirats and Martí-Costa, as well as Méndez [
20,
32,
33]. However, when collecting the variables of analysis, we perceived that many of the indicators managed to have their origin in surveys, and that there was a significant statistical gap at the census tract scale with respect to important indicators such as the level of income, the number of basic facilities (educational, health) or the population with social benefits; and that in many occasions the sample volume used does not allow a sufficient level of confidence to be reached.
Taking these limitations into account, we combined the variables that put the economic, social and residential stability of the individual at risk into a single measurement. The variables we selected are the only ones offered by the Population and Housing Census published in 2011 by the National Institute of Statistics (INE) and the Galician Institute of Statistics (IGE). It is the last statistical publication to offer detailed and analyzed information on a scale of urban areas.
Each of the indicators has been classified according to the three main vulnerability groups identified in
Table 1.
The first group refers to socio-demographic vulnerability, broken down into three aspects. The first focuses on ageing measured by the ageing index. The ageing process gradually transforms an adult subject with good health and full autonomy into an increasingly fragile individual who will gradually become more vulnerable and will have more difficulties developing their own model of life [
34]. As a result, the more older population is registered, the more demand there will be for home care services and residences for the elderly. In this sense, it should be noted that A Coruña and Vigo are located in one of the Spanish regions with the highest ageing rate. The second aspect refers to immigration which, although it is understood that in times of prosperity it can be a fundamental contribution to alleviate the effects of an ageing population, in times of crisis it can become an area gravely affected by vulnerability due to the shortage of employment and precarious employment situations; that is, when they are not part of the unemployed population. The third aspect deals with educational level, because we can understand that one of the groups most affected by the crisis and vulnerability are young people with failed schooling and a poor education. The European Commission insists that good education and the acquisition of skills better qualifies an individual to find a job and amass higher purchasing power [
28].
With regard to the socio-economic vulnerability aspect, a key factor to take into account is the volume of unemployed workers measured by the unemployment rate. This indicator relates, in an obvious way, to the ability to deal with basic-needs costs, especially in cases of long-term unemployment and with no unemployment benefits. If we relate this indicator to the ageing population, it is of interest to analyze the working population replacement rate, which measures the relationship between individuals 60–64 years of age that are ending their working lives, with people who are in the 15–19 years of age range, who are just starting it. This indicator shows that in the case of an ageing population the number of workers entering the labor market is lower, but essential to maintaining the welfare state. Finally, we have taken into account the volume of workers with a temporary contract, understanding that this type of contract does not guarantee peace of mind and continues to limit their ability to acquire a home or request a mortgage.
The third group of factors relates to residential vulnerability. A lot of research has featured the speculative process which resulted in a housing bubble and a high number of empty houses [
11,
12,
18]. It is possible that developers never got to sell those homes, and if sold, they perhaps remained empty as they had been purchased as investments and not out of necessity. In any case, we can argue two reasons that may account for the number of empty homes: (a) they are unoccupied because the elderly owners pass away or move their residence to live with relatives; (b) are abandoned because they do not meet the appropriate habitability conditions. In any case, we think that the existence of a large number of empty homes denotes a lack of economic dynamism and a prominent demographic gap. Likewise, urban areas with an abundance of empty homes are being affected by squatting. The year of construction was also taken into account, specifically prior to 1970. This decade meant the construction of residential neighborhoods on a massive scale with poor construction quality, which currently suffer certain deficiencies (deterioration of façades, lack of elevators) so these buildings need more improvements. In relation to building state, because those in a deteriorate state determine poor living conditions and lead to degraded urban landscapes.
Once the indicators were selected, they were adjusted through normalization based on the unit, in a way so that values stayed within the range [0–1] where 1 indicates a greater degree of vulnerability. The formula used was X
normalized = (X − X
min)/(X
max − X
min) where X
max and X
min are the maximum and minimum value of X. Subsequently, the normalized value was multiplied y the weighting value indicated in
Table 2. As demonstrated, each of the variables was assigned a weighting value (in percentage terms) so that the sum was 100. The distribution of the weighting responds to the subjective criterion of the authors and to the knowledge acquired through different research financed by Europe and the Ministry of Economy and Competitiveness on the causes of the crisis, its effects and possible alternatives for remedying it. In all of them, it was found that unemployment and temporality are the most important factors when determining situations of poverty, social exclusion and vulnerability, for that reason, a 15% weight was assigned to these variables, while the rest remained at 10%.
With the weights determined, the results were mapped on a choropleth map for which a Geometric Interval was defined, and through which a balance was created between the changes highlighted in the central values and in the extreme values, thus producing a cartographically more comprehensible result.
4. Urban Vulnerability in A Coruña and Vigo
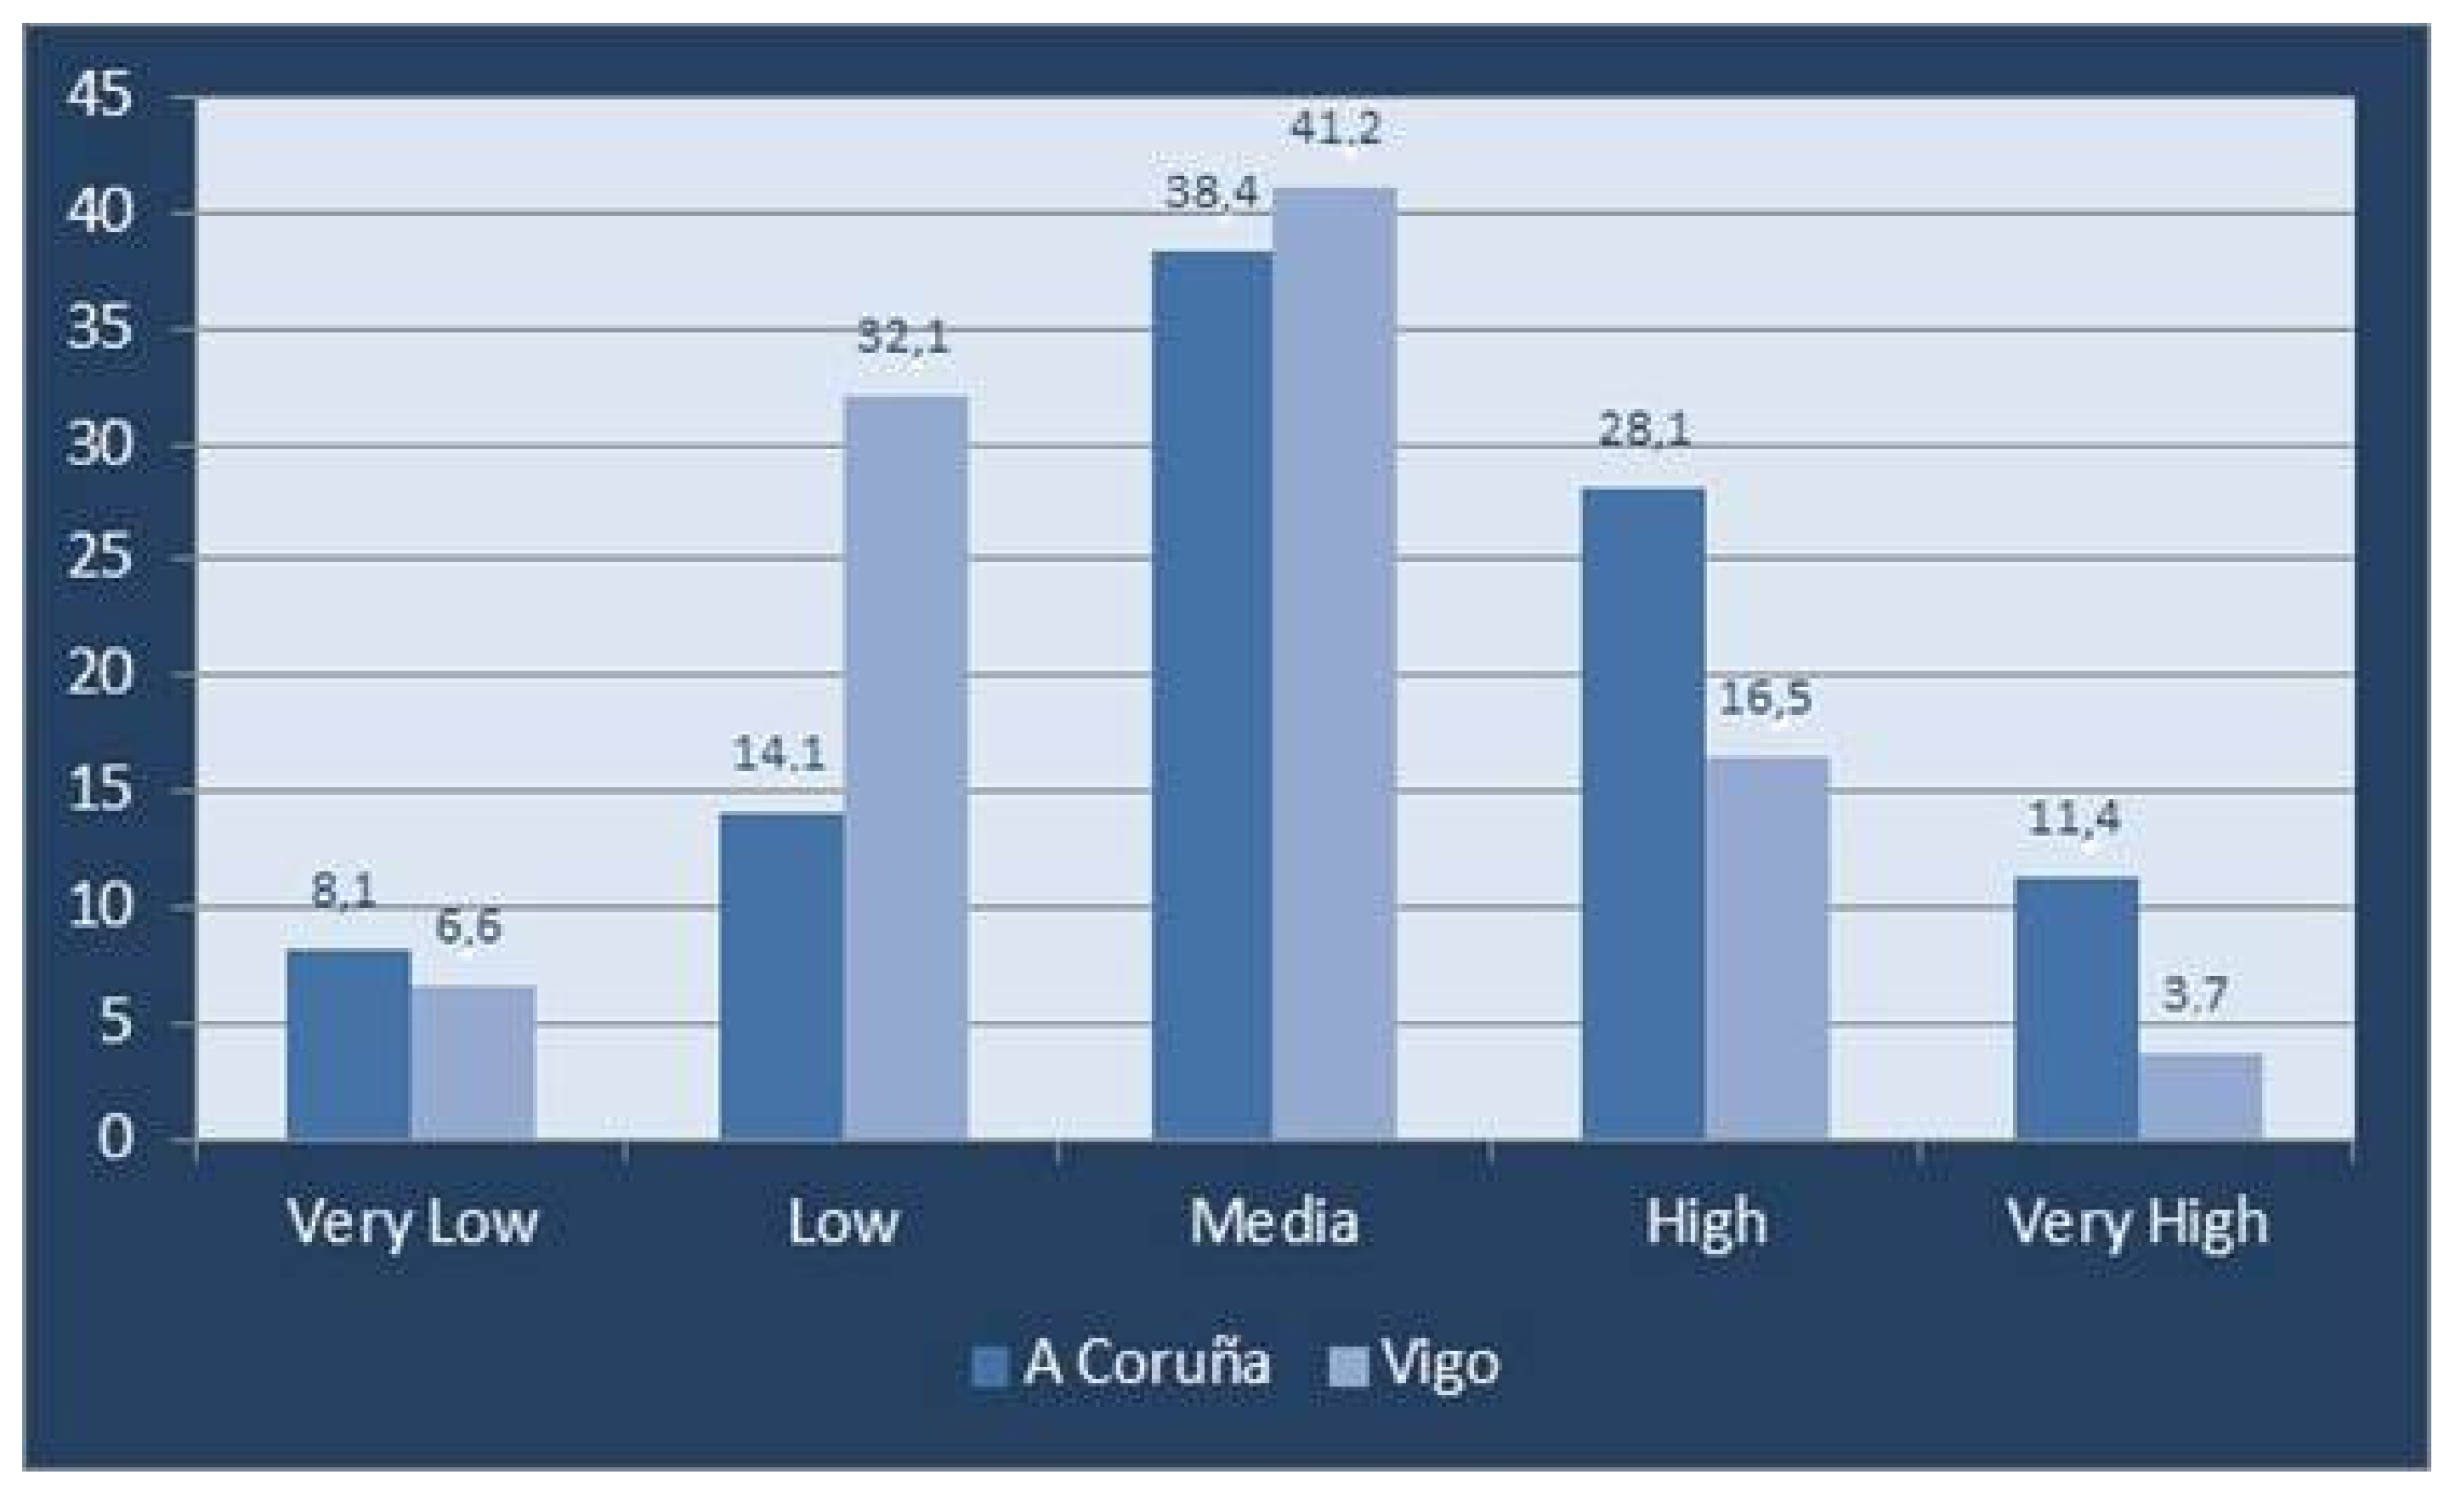
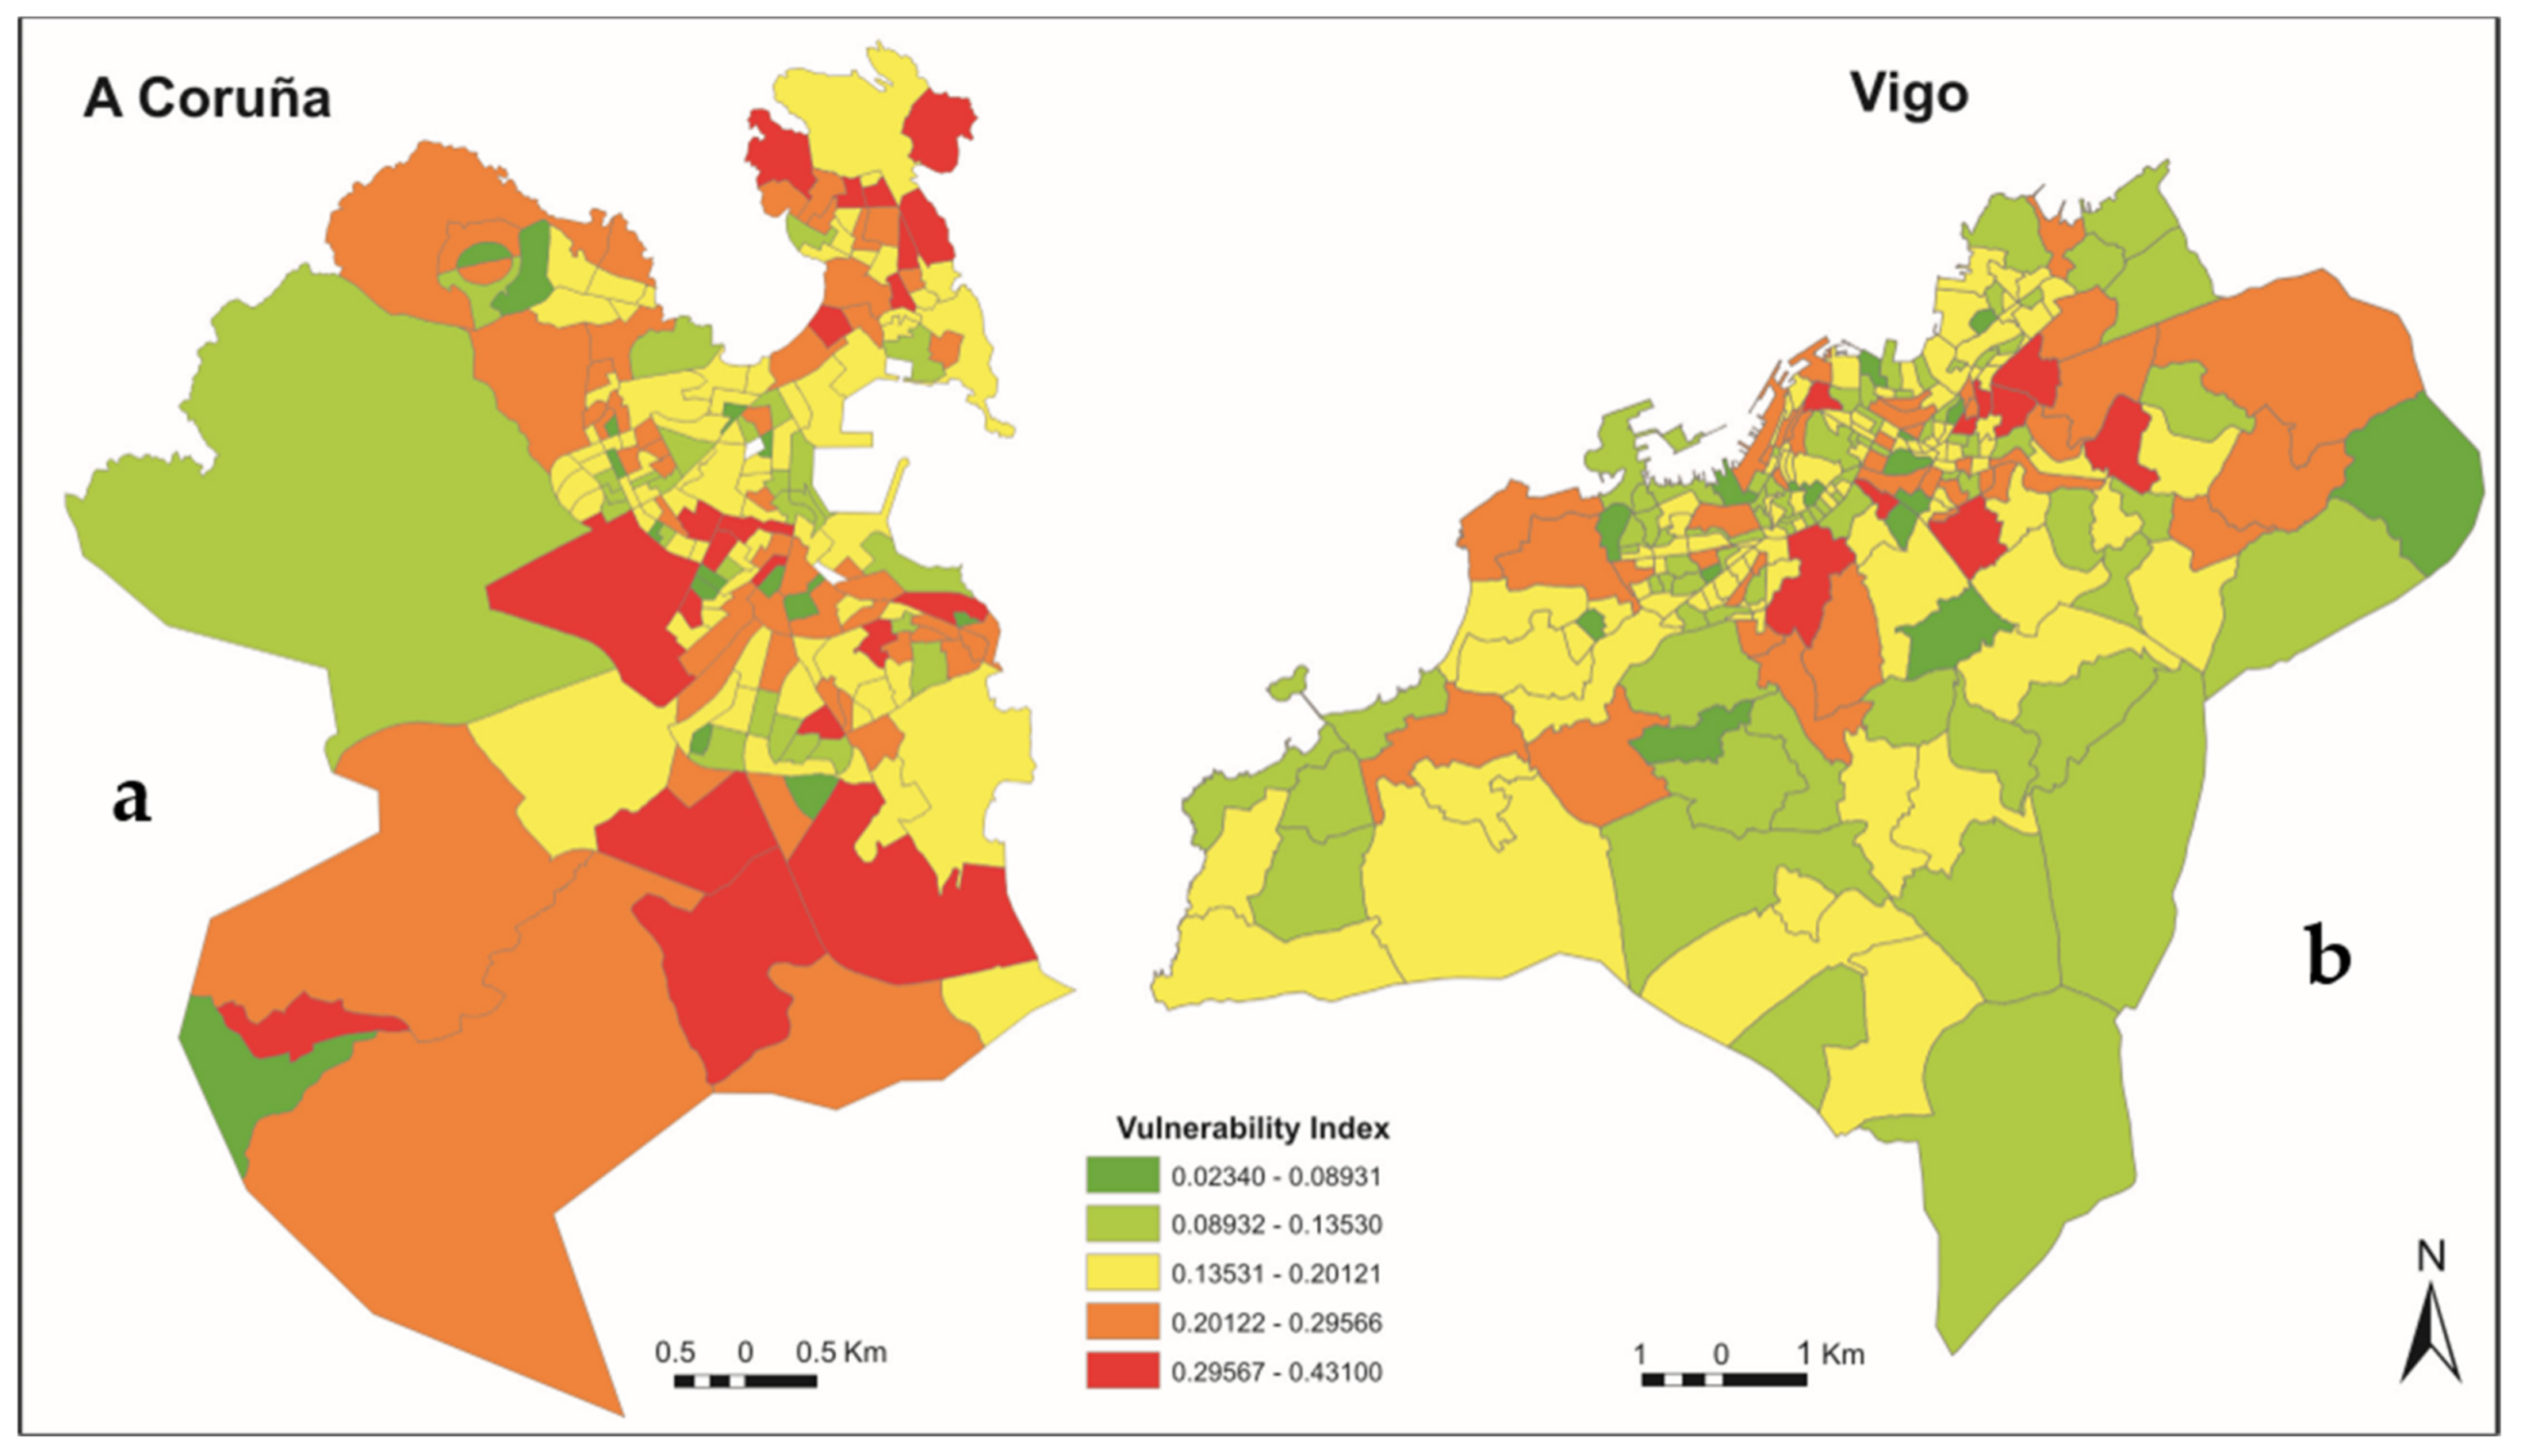
The urban vulnerability index obtained for A Coruña and Vigo tells us that the first has seen a greater impact from the economic crisis, as there are more urban areas in situations of high or very high vulnerability, specifically 39.5% of the cadastral sections, compared to 20.2% registered in Vigo (
Figure 8). On the other hand, while in Vigo, 38.7% of the sections are affected by a low vulnerability, this rate does not even reach 23% in A Coruña.
Among the factors explaining this situation, we must emphasize that Vigo is characterized by having a consolidated industrial fabric, with the automobile manufacturer Citröen, the canning factories (Albo, Molíns, Alfageme), the fishing industry (Pescanova) and the frozen foods industry standing out. Also in its vicinity is the O Porriño industrial estate, which houses industries committed to R&D+I, and are linked to the energy sector, such as Gamesa, or the chemical-pharmacological sector, such as PharmaMar (antitumor drugs of marine origin), Sylentis (drugs based on gene silencing—RNAi), Zelnova (insecticides, air fresheners), Xylazel (wood protection products), and Genomics (molecular analysis). In A Coruña, however, the business fabric is weaker, with the Petroleum Refinery and the Inditex group, linked to the fashion industry. Secondly, despite A Coruña having a somewhat lower unemployment rate than Vigo (16.28% versus 18.63%), its economy is built on smaller businesses and a service sector based on commerce and tourism—branches of activity in which work contracts are more unstable and have worse working conditions and wages. In this sense, the fact cannot be ignored that its Atlantic climate determines the concentration of tourist activity in the summer months; and that A Coruña has 12 malls, becoming one of the cities with the most land surface area allocated for shopping centers, only to be surpassed by Barcelona and Madrid. This phenomenon has led to the closure of small businesses both in the urban center and in other areas that had traditionally stood out for their commercial dynamism, such as the neighborhood of Agra del Orzán [
35]. Finally, the fact that in Vigo there is an urban dispersion of 37% of the population gives a greater capacity for resilience with vulnerability having a lower impact. Although most of its inhabitants work in the industrial or service sector, having a house with a small vegetable garden allows them to have basic food products and reduce family spending. This situation is not registered in A Coruña, where its location on a peninsula and a more irregular topography in the periphery has caused urban development to be concentrated in one part of the municipality and 87% of the population to reside in flats in the consolidated urban nucleus.
If we analyze the degree of vulnerability in the urban center of both cities (
Figure 9), the conclusions we can draw are that the areas with a higher vulnerability index respond to both areas in the Historic Center that have been left out of rehabilitation processes and with serious social problems (prostitution and drugs) as well as residential neighborhoods. In relation to the latter, on the one hand, we can differentiate those built in the developmental period (1960–1970), in which private and public housing were combined, where an adult-older population currently resides and where some social conflict has resurfaced due to an increase in criminal action. This refers to the neighborhoods of Monte Alto, Sagrada Familia, Mallos, and Barrio de las Flores in A Coruña. On the other hand, the outlying urban sectors, in which for years there was spontaneous growth, with shanty towns and accessibility problems such as Torre-Orillamar and Adormideras in A Coruña and others that are not yet fully consolidated and in which the landscape is based on housing blocks coexisting with garden spaces and traditional settlements such as Alcabre, Freixeiro, Salgueira, Divina Pastora-Urzaiz and San Xosé Obreiro in Vigo and Elviña, Eirís ,and Mesoiro in the city of A Coruña (
Figure 10). In recent years, official housing has been built on these spaces to house the low-income population and shanty town dwellers from areas that were expropriated due to the construction of new infrastructure in the periphery, and the local government wanting them to integrate socially.
Areas with medium-level vulnerability have the greatest presence in both cities. In both cities, they are registered in most of the urban sections that make up the historic and urban center, where some processes of urban renewal have mitigated the deteriorating situation suffered over decades of neglect and where there is interest on the part of local governments to reactivate commercial activity and improve the quality of life of the inhabitants thanks to pedestrianization and urban improvement (lighting, urban furniture, vegetation) initiatives. We can also find them in those residential areas where a process of demographic regeneration is taking place or those built in recent decades, when there was greater concern for better building quality and green areas, and there was a proliferation of townhouses in the immediate periphery. In A Coruña, these would be Los Rosales, Matrogrande, San Critóbal das Viñas, As Xubias, and Palavea. As for Vigo, these vulnerability indexes are recorded in areas such as Navia and Comesaña, Coruxo, Candeán, and Bembrive, where housing developments have proliferated and single-family homes that were once for use on weekends have been converted into main residences (
Figure 11).
Finally, areas with low vulnerability rates fall under four types of spaces: urban centers and peripheral areas, where the population with the highest purchasing power resides and where land prices are a factor in commercial and residential segregation; waterfronts, where traditional buildings alternate with new ones, all of them of high value—these areas are currently part of the development image of both cities and where intense gentrification processes have taken place (Parrote and the Marina in A Coruña, and Areal in Vigo); some sectors of neighborhoods that, although during the eighties stood out for their social conflict and were a focus of drugs such as Coia in Vigo and the Barrio de las Flores in A Coruña, nowadays have become quieter and of a higher quality thanks to their morphology into an open layout, the abundance of green spaces, and a turnover of residents. Previously an adult population predominated—even though it was part of the middle class, it showed strong differences in terms of its purchasing power—and a large group of young people, submerged in the world of drugs; currently, they are neighborhoods where there is an adult-young, middle-class population occupying the homes that have been left empty as a result of the death of their owners, and who walk safely through the streets since drugs devastated that whole generation of troubled youths. Peripheral urban sectors are those among which can be distinguished those near the beaches where secondary housing has proliferated to spend the weekend or the summer months (Palavea in Coruña, Oia in Vigo) and those in which there still persists a typology of traditional settlement of small houses with orchards, but in which the inhabitants have a totally urban lifestyle (San Pedro de Visma in Coruña, Cabral, Bembrive, Zamáns in Vigo) (
Figure 12).
5. Initiatives to Combat Vulnerability
The 2015 municipal elections marked a turning point in municipal policies in order to tackle the serious consequences of the crisis. All parties in their electoral programs advocated for a change in the way the city is governed and stressed the demand to serve the neediest population and encourage economic growth.
However, once in power, the strategies promoted by local governments to deal with situations of vulnerability were very inconsistent. While some have chosen to accept their fate and react defensively to external pressures, others have decided to consider more proactive responses, arising from decisions and efforts of different people and institutions [
36]. Some, such as Madrid or Barcelona, have focused their efforts on the following four key aspects: (a) give more attention to those most affected by the crisis, (b) stop eviction processes and seek alternatives in order to offer decent housing, (c) increase the participation of citizens in the city government and give more power to the urban districts, and (d) reduce intra-urban and territorial cohesion inequality in neighborhoods thanks to a budget distribution that would benefit the most disadvantaged individuals [
19]. To do this, the local administration has transferred powers to the neighborhood councils in order to bring the administration closer to citizens and encourage participatory actions. In addition, they have conducted studies on the vulnerability of neighborhoods on the basis of which they have already designed various urgent action projects, mainly focused on offering government-owned homes or housing with social rents, as well as reducing social unrest through the promotion of culture and sport among children.
In the case of medium-sized cities, there are no large-scale measures or an interest in finding out to what extent the crisis has affected its neighborhoods and the population that lives there. It is true that there has been interest on the part of local governments to achieve more cohesive and less vulnerable cities. However, it is a fact that they still do not have in-depth studies of their cities. The statistical data available is scarce and does not cover the complexity of a vulnerability analysis. No field work has been done to obtain qualitative and quantitative information that alleviates the lack of official data (e.g., homeless and socially excluded individuals, families who need help to buy school books, child poverty, etc.), and there has not been a concern to develop intra-urban scale ratios of educational centers or health personnel in relation to the number of inhabitants.
In the case of A Coruña, the A Marea party focused its 2015 electoral program on the following five areas of intervention in order to change the urban governance model and serve the most vulnerable population:
Strengthen democratic values and citizen participation. To achieve this, it proposed complete transparency in spending, the creation of a digital platform for citizen participation, the creation of participatory budgets and citizen participation in controlling spending; citizen referendums for transcendence issues and the limitation of eight-year mandates.
Achieve a new territorial and urban model. To do this, it proposed creating a plan to promote the right to property and give a boost to public housing; provide a solution to the city’s precarious settlements with a comprehensive integration plan (housing, employment, education, healthcare), create a support program for self-managed urban vegetable gardens and create parking rules to dissuade private cars from entering the city, and educate the population on environmental issues
Promote justice and social cohesion through the creation of a Municipal Social Income to supplement the income of the neediest individuals; eradication of children’s food poverty using the city’s school network, eradication of energy poverty, care of dependent individuals through the creation of a Comprehensive Care Plan, creation of a Local Social Inclusion Plan, implementation of educational reinforcement programs to reduce school failure, and implementation of a Local Labor Inclusion Strategy for those Collectives at risk of exclusion.
Promote a new economic and energy model by diversifying economic activity, encouraging local commerce, developing a Municipal Plan for the promotion of R&D+I, expanding family reconciliation services, carrying out research studies to update the real niches of the labor situation; recognizing the situations of energy poverty, prioritizing ethical banking, and pay off funds in banking institutions that carry out evictions.
Promote culture, memory, and identity through the creation of a research center facilitating the implementation of cultural projects in the city, the promotion of basic sports and the installation of equipment on the street, the use of cultural and sports facilities by people with some type of disability, meet the demand for municipal nursery schools, and connect cultural infrastructures with the population of the neighborhoods in which they are located.
In Vigo, the city’s ruling Socialist Party (in power since 2007) did not publish its electoral program but defined the priorities for its mandate to the media. It is mainly focused on humanizing the streets, creating playgrounds, fostering employment through work promoted by the municipal government (work in play centers and citizen support services like neighborhood caretakers), tax reduction for motorcycles and the promotion of electric bicycles, recovering fluvial spaces through the creation of walking trails, promoting culture and urban art, and increasing the number of flights on offer at the airport. As can be seen, it is still an urban government model that prioritizes work and in which initiatives for the promotion of social cohesion are completely absent.
After three years of governing, there are few initiatives to combat vulnerability that have been launched. The only changes that have been observed are the creation of a transparency portal through which the municipal budget is made public, and the creation of participatory budgets (three million euros) that are available to inhabitants to develop those projects that they consider of interest to improve their neighborhood and the city. However, despite the fact that weekly the mayor attends to the citizens through a radio program to know their problems and needs, it has not yet gone into depth on the state of the issue. Consequently, the only objective data available to the city council are the number of grants offered to individuals applying for RISGA, public assistance to guarantee financial subsistence support to those lacking. In the case of Vigo, only the transparency portal for municipal budgets has been created. A fact that corroborates the total lack of interest on the part of the local government for the situation of vulnerability in which the inhabitants are. It can be said that the mayor is still betting on a “showcase” city model, with attractive and pleasant streets for the walk, but that it hides serious social and economic problems in its neighborhoods.
As a result, the vulnerable population must seek their own resilience mechanisms. Among these are assistance centers such as shelters where they can sleep, and inexpensive kitchens that offer breakfast and lunch to people with problems in their dining rooms, even serving families or individuals who cannot access the dining room by bringing the food to their homes. There are also existing food banks in some neighborhoods, whose staff is voluntary, and other assistance entities such as the Red Cross or Cáritas that distribute food, kits to help children (hygiene and food), family support kits (school material, personal hygiene) and financial aid to help cover basic needs (rental payment, electricity bill), and that travel through the city with their mobile social emergency units, helping the homeless so that people can eat something hot, get warm clothes and receive health care. Lastly, we cannot forget the networks of friends and family members that, in the case of A Coruña and Vigo, continue to be of great importance. The money and food that they contribute is used for survival and causes the recorded degree of vulnerability to be lower than that actually derived from the economic and social situation of families.
6. Conclusions
Although the biggest cities in Spain, such as Madrid, Barcelona, Valencia, and Seville, have suffered most from the impact of the crisis, it has also left its mark on medium-sized cities (250,000–500,000 inhabitants). Here, the closing of companies, unemployment, the reduction of family income, and foreclosures have driven the population into a state of vulnerability. Despite the 2015 municipal elections bringing about greater interest by local governments to improve the quality of life of their citizens, there are still few initiatives that have been implemented to achieve it. In this sense, we believe that as long as local administrations do not stop to find out firsthand the reality of their neighborhoods and what the needs of their inhabitants are, they will not achieve the expected success in reducing levels of poverty and vulnerability. It is true that there is a statistical vacuum limiting the information necessary to carry out in-depth studies and that, since the start of the crisis, local administrations have been affected by excessive control of their local finances and by severe budget cuts applied by the State. For this reason, we find it necessary to promote qualitative studies through fieldwork, population surveys, and participatory actions in order to have a complete vision closer to reality.
Taking what has been noted into account, this article has made a first methodological approach regarding the study of vulnerability on an intra-urban scale, which, although based on the case studies of A Coruña and Vigo, we understand can be applied to other cities with similar characteristics (250,000–500,000 inhabitants). The results obtained signal to us that it is urgent to intervene in historical centers, where the loss of centrality and the predominance of an aging population has led to degradation, and in working-class neighborhoods and the outskirts, where social unrest is increasing. Finally, we believe that vulnerability maps are a key tool from which to visualize the most vulnerable urban areas and to define priorities for intervention.


