1. Introduction
Climate-linked migration in pastoral drylands is an important research and policy issue, yet the links among ecological stress, livelihood disruption, and urban expansion remain insufficiently understood, especially where official statistics may miss peri-urban growth or delayed migrant registration [
1,
2,
3]. Projections across six world regions suggest that up to 216 million people could move internally by 2050 under climate-related pressures, with drylands among the highly exposed settings [
4,
5]. We measure precipitation deficits with the 12-month Standardized Precipitation Index (SPI_12) and official dzud severity classifications, and ecological stress with MODIS NDVI anomalies reflecting realized pasture conditions shaped by climate, vegetation response, grazing pressure, and land use.
Mongolia is a strong empirical setting because about 83% of its territory is rangeland, rural livelihoods remain closely tied to mobile pastoralism, and urban growth is concentrated in Ulaanbaatar. Comparable climate–mobility dynamics occur across drylands with heterogeneous exposure and adaptive capacity [
6]. The 2009–2010 dzud killed more than 10.3 million animals, about 20% of the national herd, and the 2023–2024 dzud again caused large-scale livestock mortality [
7,
8,
9]. Over the same period, Ulaanbaatar’s population rose from 794,730 in 2000 to 1,768,151 in 2024 [
10]. Many migrants settle in peri-urban ger districts, named for portable circular, felt-covered dwellings traditionally used by Mongolian pastoral households and situated among incrementally serviced plots and low-density settlement [
11,
12].
This study addresses three gaps. First, Mongolia-focused research on dzud, pastoral vulnerability, migration, and urban change remains largely separated across empirical strands rather than integrated in a long-run subnational design [
1,
7,
13,
14,
15]. Second, satellite and administrative indicators capture different settlement and population constructs, so any divergence measure depends on valid satellite components [
14,
16,
17,
18,
19,
20,
21,
22]. Third, multi-sensor integration can create false confidence when a composite is retained after one component fails independent validation. The revised design therefore places measurement validation before downstream urban-composite, destination-side, and spatial inference.
The study uses a balanced panel of 21 aimags (first-level administrative provinces of Mongolia) and Ulaanbaatar from 2000 to 2024 (N = 550), combining ecological, livelihood, migration, and satellite indicators. Its retained remote-sensing contribution is a validation-first monitoring architecture: MODIS vegetation conditions and a locked DMSP/VIIRS nighttime-light series are retained, while Landsat BuiltUp serves as a methodological validation diagnostic. No replacement urban composite is imposed after the physical BuiltUp component fails transfer validation.
The original design specified a three-component Urban Expansion Index (UEI) and a Mismatch Index comparing it with administrative Urban_Share. Because the BuiltUp component failed transfer validation, the final analysis reports neither UEI nor Mismatch as empirical findings and does not substitute a post hoc two-component index. Satellite–administrative divergence is therefore treated as a measurement problem rather than inferred from an invalid composite.
The retained empirical design is modular. M1, M2, and M5 provide origin-side evidence on ecological conditions, livestock loss, and registered provincial out-migration pressure; nighttime lights remain a descriptive satellite signal with a cross-sensor warning. Prespecified M3 and M4 are not retained because their outcomes depended on the failed UEI/BuiltUp architecture. These modules are not interpreted as a single origin-to-destination causal chain.
2. Literature Review and Theoretical Framework
2.1. Pastoral Mobility Pressure and Urban Expansion Pathways
Environmental stress can shape migration, but mobility responses depend on household resources, institutions, livelihood systems, and adaptive capacity [
1,
2]. Cattaneo et al. [
23] emphasize that stress may increase migration for some households while constraining it for others, a concern especially relevant in drylands [
3,
5]. Pastoral drylands combine high exposure with uneven adaptive capacity [
6], and weather shocks can reduce livestock productivity [
24]. In livestock-dependent settings, such livelihood disruption can increase migration pressure when asset losses weaken household resilience [
7,
13].
Mongolia illustrates the relevance of this origin-side livelihood context because rural mobility has long been shaped by dzud events, livestock losses, and changing pastoral livelihoods. Sternberg [
7] documents the consequences of the 2009–2010 dzud, while Fernández-Giménez et al. [
13,
25] examine dzud-related social and ecological dynamics and rangeland co-management. Mongolia-specific evidence also shows that drought frequency, duration, and severity affect pasture production [
26]. Together, this literature supports treating vegetation condition, winter hazard exposure, livestock loss, and mobility pressure as related but analytically distinct elements of pastoral vulnerability.
2.2. Remote Sensing of Urban Expansion and Satellite–Administrative Divergence
Remote sensing supports monitoring of urban land cover and settlement change. WSF 2015 and WSF 3D provide global built-up information at 10–30 m resolution [
14,
19], while Dynamic World v1 provides 10 m land-cover probabilities for recent years [
27]. Mongolia-specific studies examine Ulaanbaatar land suitability and ger-district detection [
11,
12], and Landsat enables multi-decadal settlement monitoring [
20]. Together, these sources motivate combining physical built-up mapping with other satellite indicators while keeping ecological, administrative, and settlement measures conceptually distinct.
Nighttime lights are widely used as proxies for settlement intensity and urban economic activity [
21,
22], but long-run analysis requires harmonization because DMSP OLS and VIIRS differ in resolution, radiometry, saturation, and sensor design. Prior studies use invariant-region calibration for intra-DMSP drift [
28] and cross-sensor rescaling for DMSP–VIIRS continuity [
29,
30]. MODIS NDVI provides a complementary measure of ecological conditions in drylands and Mongolian grasslands [
15,
31,
32]. These signals therefore offer distinct, not interchangeable, information for multi-sensor monitoring.
Satellite-based urbanization measures need not coincide with administrative statistics. Prior work documents gaps between remotely sensed settlement indicators and official classifications in data-constrained settings [
16,
17,
18], reflecting differences in physical form, light intensity, population classification, temporary activity, and administrative boundaries. This study therefore treats satellite–administrative divergence as a measurement question. Because the planned BuiltUp-dependent composite failed transfer validation, no final Mismatch Index is used to infer informality, undercount, or unregistered migration.
2.3. Spatial Urban Dynamics, Panel Econometrics, and Mediation-Oriented Analysis
Spatial models are appropriate only when the dependent variable has an adequate measurement foundation. Anselin [
33], LeSage and Pace [
34], and Elhorst [
35] provide the spatial-econometric framework originally specified for the urban-composite branch, while Driscoll and Kraay [
36] motivate robust covariance estimation in the retained panel models. Weather-shock studies illustrate stronger identification under plausibly exogenous variation [
37,
38], and applied work shows the relevance of regional dependence [
39]. Because UEI ultimately depended on a BuiltUp component that failed transfer validation, the final study does not report the UEI-based spatial model or alternative weight-matrix re-estimation.
Mediation analysis can assess whether an association is compatible with an intermediate pathway, but causal interpretation requires strong assumptions such as sequential ignorability [
40,
41]. Those assumptions cannot be verified in this observational provincial panel. Moreover, the retained lag structure estimates NDVI_(t − 1) to livestock loss_t and livestock loss_(t − 1) to out-migration_t in separate equations. M5 is therefore a mediation-oriented product diagnostic, not an exact causal decomposition or mediated share.
The conceptual framework combines push–pull, asset-based livelihoods, climate-mobility, and urban economic geography. Lee [
42] links origin-side stressors to migration pressure, while Carter and Barrett [
43] show how loss of productive assets can constrain recovery; in pastoral systems, livestock mortality is the relevant asset shock [
7,
13]. Black et al. [
44] emphasize that climate stress can produce both mobility and immobility depending on resources and institutions. Urban economic geography separately motivates persistence in settlement and infrastructure concentration [
45].
These perspectives motivate a modular rather than causal-chain design. Push–pull and asset-based theories support testing whether poorer ecological conditions are associated with greater livelihood loss and whether loss is associated with registered out-migration [
42,
43], while the broader mobility literature allows heterogeneous responses [
1,
44]. Urban economic geography remains relevant to the original destination-side question [
45], but the final manuscript does not estimate a BuiltUp-dependent urban-composite pathway after that measurement component failed validation.
3. Materials and Methods
3.1. Study Area, Panel Structure, and Hypotheses
The study covers Mongolia’s 21 aimags and Ulaanbaatar from 2000 to 2024, forming a balanced panel of 22 spatial units with 25 annual observations per unit (
N = 550). Satellite indicators are aggregated to the official administrative boundaries obtained from the Mongolian Administrative Boundary Information System (
https://khil.gazar.gov.mn) [
46]. Mongolia’s extensive rangelands, climate-sensitive rural livelihoods, and concentration of urban growth in Ulaanbaatar make the provincial scale suitable for examining ecological stress, livestock loss, migration pressure, and urban monitoring.
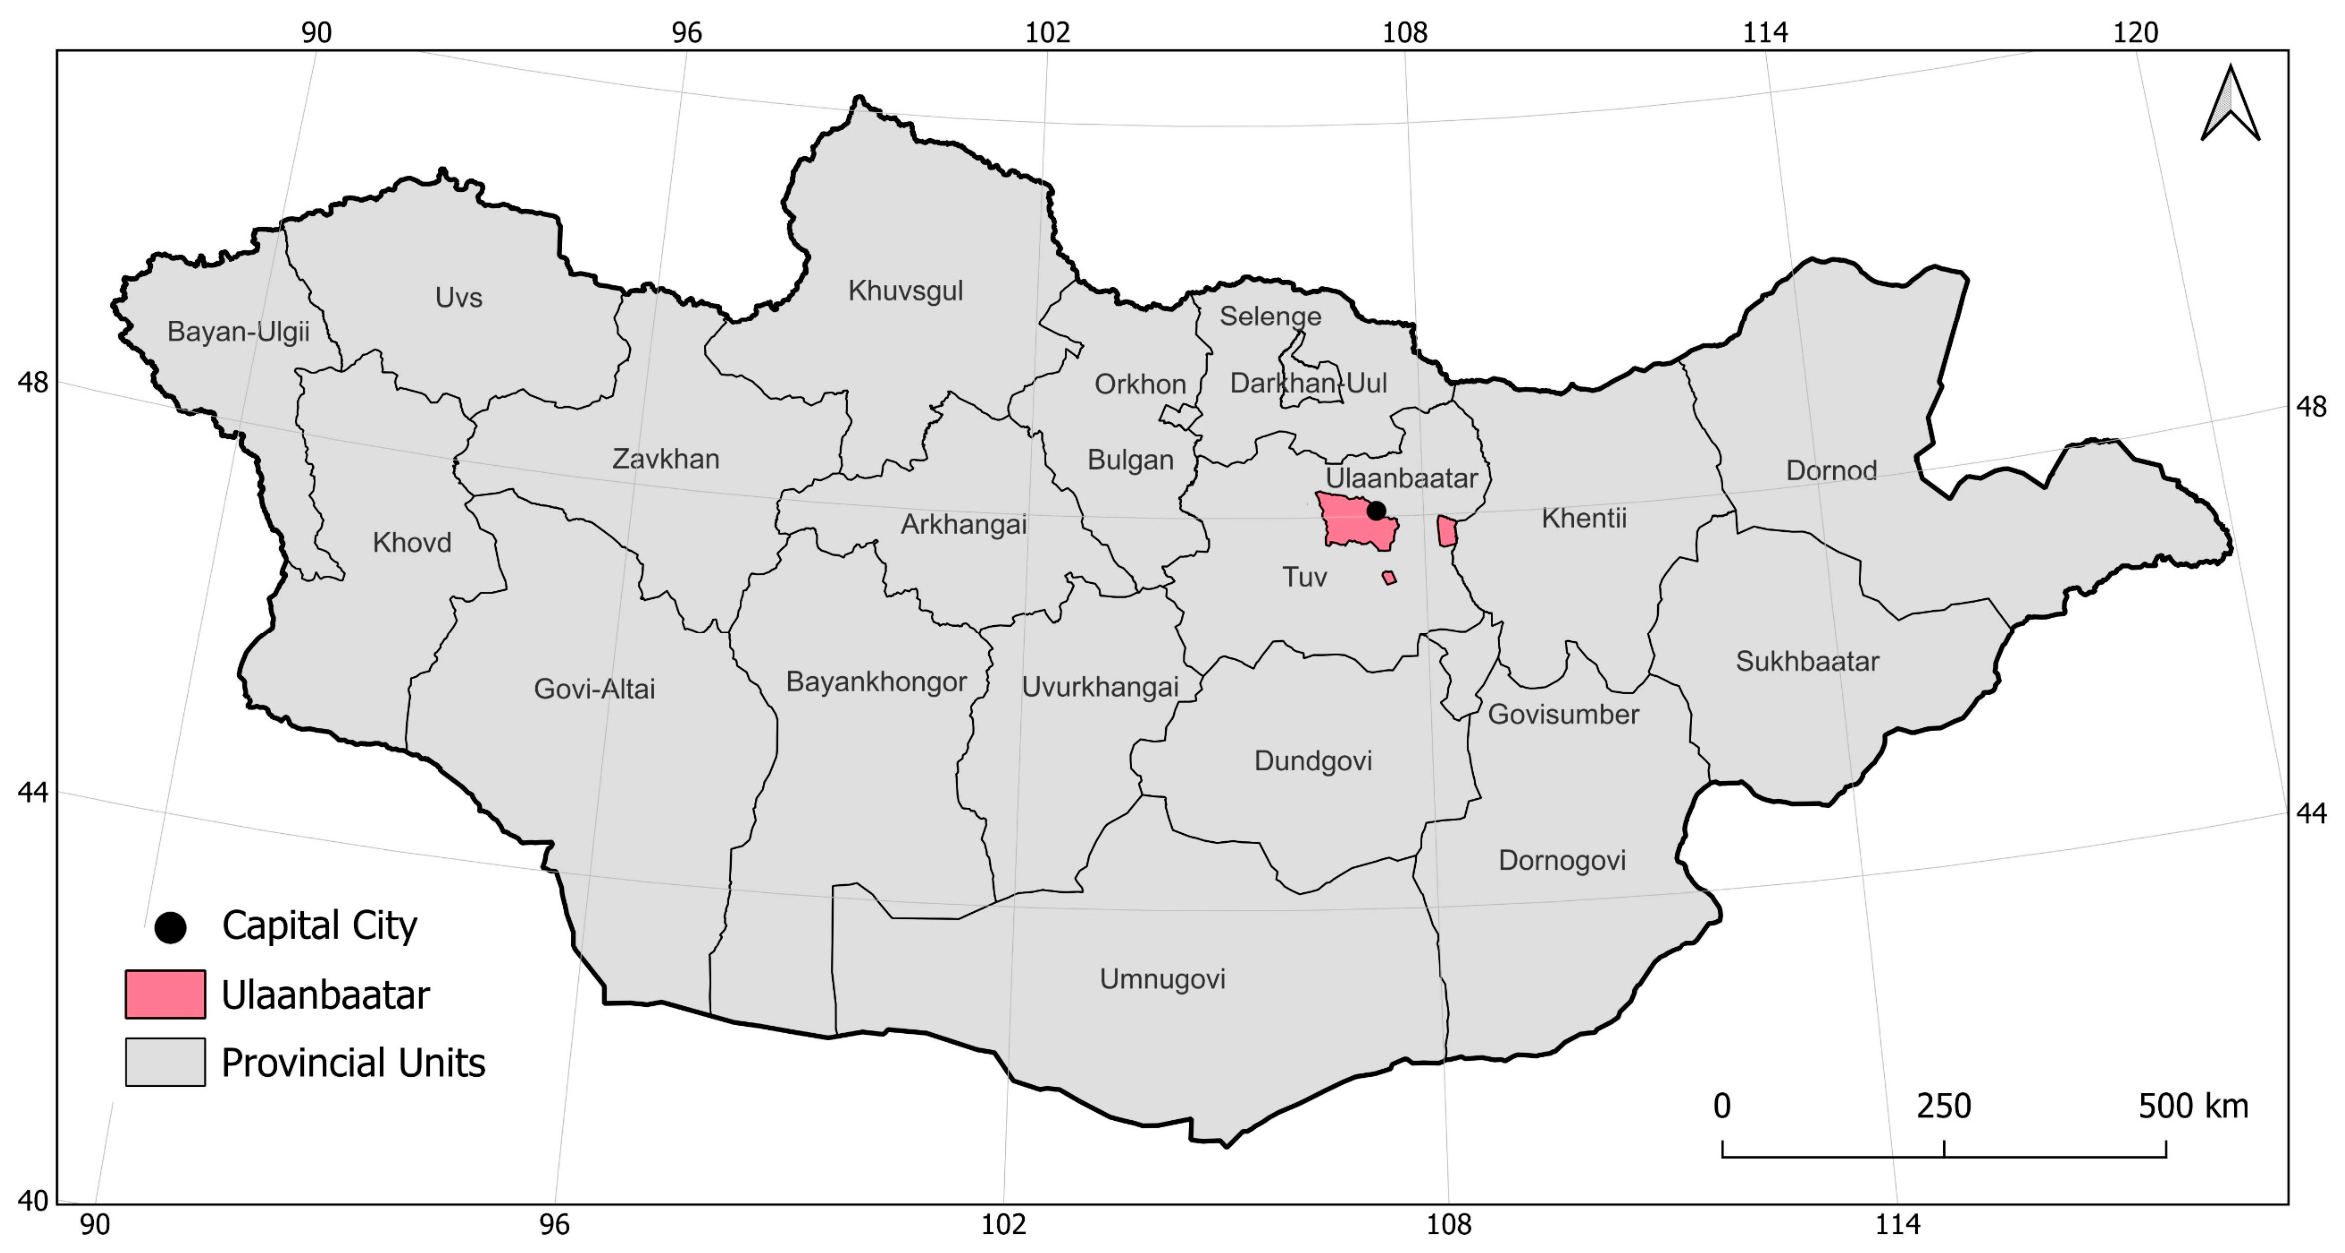
Figure 1 shows the study area and analytical units. Dzud refers to a severe winter disaster involving extreme cold, deep snow cover, and pasture shortage, often following summer drought and causing large-scale livestock mortality.
Samples differ by empirical role. M1 and M2 use the 21 aimags and exclude Ulaanbaatar; after the one-year lag,
N = 504. M5 uses the same origin-side sample. Prespecified M3 and M4 retain their model numbers for traceability but are not retained because their urban outcomes depended on the failed BuiltUp/UEI branch.
Table 1 summarizes these roles, and
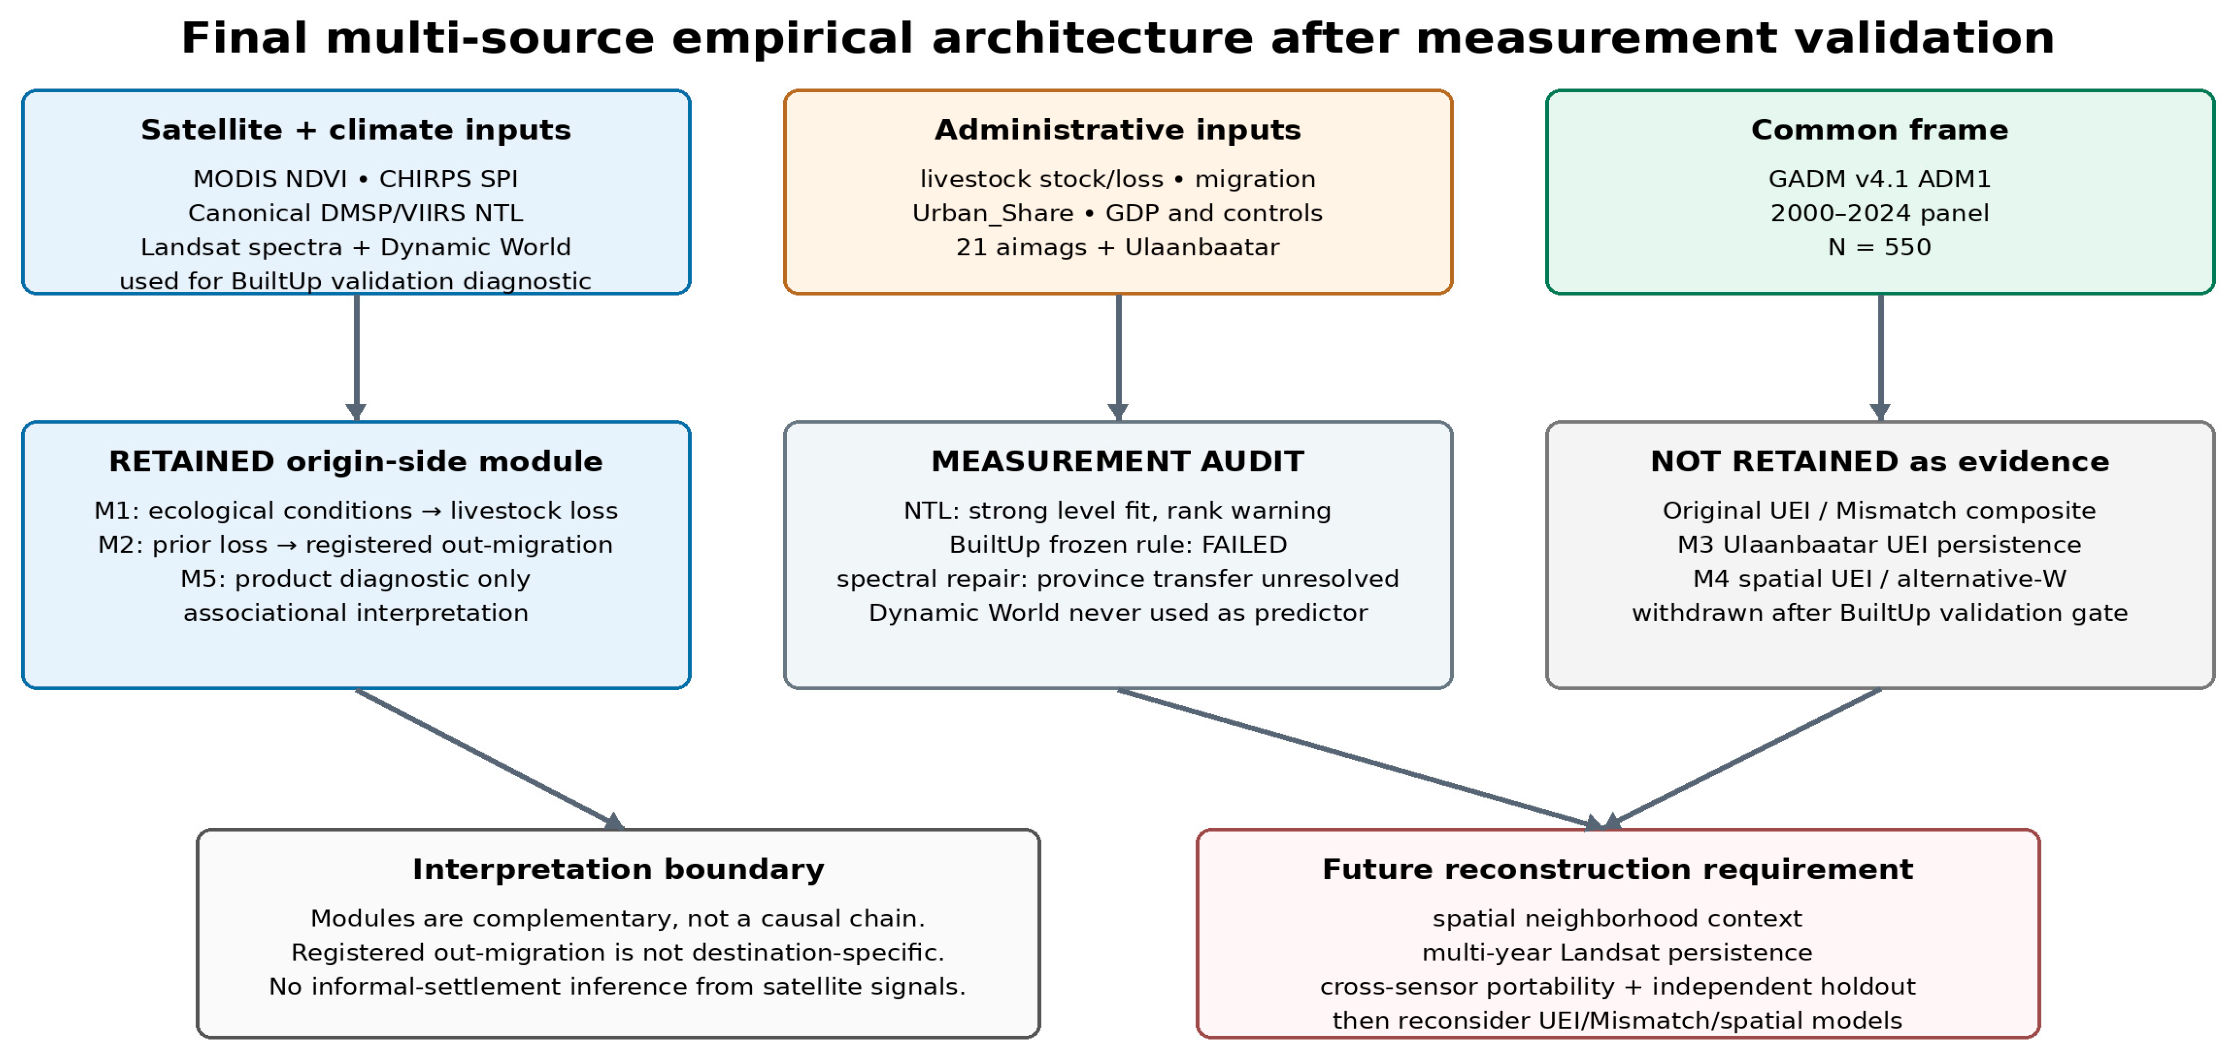
Figure 2 shows the retained pathway and measurement gate. Provincial Out_Migration records registered departures but not destinations.
Based on
Section 2, four hypotheses were prespecified while keeping origin-side, destination-side, and spatial/measurement questions separate. H1, H2, and H4 remain evaluable under the retained origin-side architecture. H3 is preserved verbatim for traceability but is not evaluated in the final Results because its primary satellite urbanization outcome depended on the BuiltUp/UEI branch that failed the measurement gate.
H1. Lower NDVI anomaly, lower SPI values indicating greater precipitation deficit, and higher dzud severity are expected to be associated with higher provincial livestock mortality.
H2. Higher lagged livestock loss is expected to be associated with greater subsequent out-migration pressure.
H3. Ulaanbaatar’s satellite-derived urban expansion is expected to exhibit temporal persistence. The direct annual association between registered in-migration and the Urban Expansion Index is examined as exploratory, given the limited statistical power of the available city-level time series.
H4. The pair of origin-side associations is expected to be consistent with livestock loss acting as an intermediate livelihood variable between NDVI-based ecological conditions and registered out-migration pressure; no exact causal mediated share is hypothesized.
3.2. Data Sources and Key Variables
This study integrates satellite indicators, administrative socioeconomic and migration variables, and climate-hazard records. Satellite indicators were processed in Google Earth Engine [
47] and aggregated to provincial boundaries. Socioeconomic and migration data come from the National Statistics Office of Mongolia [
10], dzud severity from the National Agency for Meteorology and Environmental Monitoring [
48], and CHIRPS v2.0 precipitation is used to calculate SPI [
49].
A key distinction is made between NDVI_anom and ndvi_mean. Canonical NDVI_anom is computed separately within each province over 2000–2024 as (ndvi_mean_it − province mean_i) divided by the province-specific population standard deviation. It is therefore a within-province standardized ecological-condition measure used in the origin-side models. By contrast, ndvi_mean is the unstandardized growing-season mean retained as a descriptive vegetation measure; it is not used in a final UEI because that composite was withdrawn after BuiltUp validation. NDVI_anom is a proxy for realized ecological conditions rather than an exogenous climate shock. It can reflect precipitation, vegetation response, grazing pressure, pasture management, and land-use dynamics. SPI_12 and Dzud_Severity are complementary hazard indicators that are less directly determined by local land use. Out_Migration is interpreted narrowly as registered provincial out-migration pressure: the records do not identify whether departures were directed to Ulaanbaatar or elsewhere. BuiltUp is retained only as a validation diagnostic, while UEI and Mismatch are classified as non-retained planned constructs.
Table 2 summarizes the key variables, sources, and analytical roles.
This variable structure separates the retained empirical domains from the failed measurement branch. SPI_12, Dzud_Severity, and NDVI_anom describe precipitation conditions, winter hazard exposure, and realized ecological conditions. Livestock loss and registered out-migration describe the origin-side livelihood and mobility domain. Canonical nighttime lights provide a descriptive settlement/activity signal subject to a cross-sensor warning. Landsat BuiltUp, the planned UEI, the Mismatch Index, M3, and M4 are not used as final inferential evidence after the BuiltUp transfer-validation failure.
3.3. Satellite Processing and Measurement Validation
This subsection documents the satellite and climate processing retained in the final study and the validation audit that determined the empirical scope. All spatial aggregation uses the same GADM v4.1 ADM1 frame. NDVI/SPI and the canonical nighttime-light architecture are retained. The Landsat BuiltUp rule is documented because its external validation failure is a methodological finding; the planned BuiltUp-dependent composite indices are not retained. NDVI anomaly and SPI: Growing season vegetation conditions were measured using MODIS MOD13A3 v6.1 NDVI [
50]. Monthly June to August composites were filtered using the Pixel Reliability layer. Pixels classified as Good or Marginal were retained, while Snow or Cloud pixels were excluded. Province-level NDVI was calculated by averaging valid pixels within each provincial polygon. The NDVI anomaly was calculated as:
where
is the growing season NDVI for province
i in year
, and
and
are the province-specific means and standard deviations for 2000–2024. This transformation removes long-run baseline differences across provinces and captures within-province deviations in vegetation. Because NDVI reflects both climate variability and long-run baseline differences across provinces and captures within-province use pressure, it is interpreted as a realized ecological stress indicator rather than a purely exogenous climate shock. Precipitation deficits were measured using CHIRPS v2.0. The 12-month Standardized Precipitation Index was estimated as:
where
is 12-month accumulated precipitation, G (⋅) is the province-specific gamma cumulative distribution function with parameters α
i and
and
is the inverse standard normal cumulative distribution function. Following standard SPI interpretation, SPI_12 < −1 indicates moderate drought, SPI_12 < −1.5 indicates severe drought, and SPI_12 < −2 indicates extreme drought. SPI_3 and SPI_6 are used in robustness checks.
Night-time light harmonization: The canonical nighttime-light series uses DMSP-OLS Version 4 stable_lights and VIIRS VCMCFG under a frozen two-stage calibration. DMSP images are first inter-calibrated to the F18-2013 reference using the fixed-Sicily quadratic procedure; raw DN = 0 and DN = 63 are retained at their bounds, while DN 1–62 are transformed and bounded to [0, 63]. Calibrated same-year DMSP composites are then merged. Province-level DMSP values are mapped to the VIIRS log scale using the 2013 cross-sensor relation log1p(VIIRS_i,2013) = α + β log1p(DMSPcal_i,2013) + ε_i, estimated with an intercept across the 22 spatial units.
The canonical 2000–2012 branch is α + β × log1p(inter-calibrated DMSP), while 2013–2024 uses the observed annual province-level log1p(VIIRS) branch. VIIRS annual values are formed from cf_cvg-weighted monthly radiance, with negative radiance set to zero before annual aggregation. No additional temporal-light threshold is imposed. No temporal smoothing or three-year rolling mean is applied. The locked pooled NTL reference is used only for fixed longitudinal standardization and descriptive comparison; it is not combined with BuiltUp in a final composite index.
The locked pooled NTL reference has a mean of 0.2673 and a sample standard deviation of 0.2124 (N = 550; ddof = 1). This affine standardization preserves the ordering of the canonical NTL series but does not remove the material cross-sensor measurement warning: the 2013 calibration shows strong linear agreement and materially weaker rank agreement, while the 2012–2013 transition shows a larger rank discontinuity. These diagnostics are reported transparently as measurement limitations rather than used to justify ex-post recalibration.
Built-up classification and validation: The historical mapping branch draws on the multi-decadal Landsat archive [
51]. The historical rule classified a pixel as built when NDBI > 0 and NDVI < 0.2, following the NDBI formulation of Zha et al. [
52]. Rather than treating that rule as validated by assumption, the revision audited it against Dynamic World v1 [
27] using the actual 2016–2024 fixed-sample development/diagnostic set (
N = 39,600; 4400 observations per year; 22 ADM1 units each year). Dynamic World served only as the reference/diagnostic label and was never a model predictor.
Pixels were classified as built-up where
External validation determined the downstream scope. The frozen rule showed poor discrimination and severe bare-to-built error, while enriched spectral candidates improved average performance but retained material class-specific and province-transfer failures. Candidate specifications and cutoffs were fixed before outer evaluation; Dynamic World served only as reference information, and no repaired classifier was frozen. No Random Forest or open-ended black-box search was used as a substitute for transfer validation [
53], and accuracy diagnostics follow standard remote-sensing assessment principles [
54]. Detailed validation results are reported in
Section 4.1.3 and
Tables S9–S11.
Composite-index scope decision: The original design combined nighttime lights, BuiltUp, and inverted vegetation intensity in a UEI and compared that composite with Urban_Share through a Mismatch Index. Because BuiltUp did not pass transfer validation, the three-component UEI was not scientifically admissible. A two-component replacement was also not introduced post hoc because it would constitute a different construct without a prespecified validation target. Consequently, UEI and Mismatch are not reported as final empirical results, and no BuiltUp-dependent M3, Moran, SAR/SEM/SDM, or alternative-spatial-weight result is retained.
3.4. Empirical Strategy
The empirical strategy separates retained origin-side modules from non-retained urban-composite modules. M1 and M2 estimate associations among ecological conditions, livestock loss, and registered provincial out-migration; M5 assesses whether the two separately timed associations are compatible with an intermediate livelihood role. M3 and M4 retain their prespecified numbers for traceability but are not estimated as final evidence because their BuiltUp/UEI-dependent outcomes failed the input-validity gate.
Core push side models (M1 and M2): M1 tests whether ecological stress and climate hazards are associated with livestock mortality. The baseline model is a two-way fixed effects specification with Driscoll and Kraay standard errors:
Here, LivestockLoss_ratio_it is abnormal livestock mortality in year t divided by livestock stock in year t − 1. L1_NDVI_anom is the one-year lagged within-province standardized ecological-condition measure. The specification also includes lagged SPI_12 and Dzud_Severity together with time-varying controls such as livestock per capita and real GDP per capita. Province and year fixed effects absorb time-invariant provincial factors and national year shocks; time-invariant covariates therefore do not supply separately identified within coefficients. Driscoll–Kraay inference uses the locked two-lag Bartlett-kernel specification. The main sample contains 21 aimags from 2001 to 2024 (N = 504).
M2 tests whether lagged livestock loss is associated with subsequent out-migration pressure:
where the dependent variable is a pooled standardized version of registered provincial Out_Migration. The standardization is fixed over the full 550-observation panel using the historical mean 2216.078 and population standard deviation 1918.477; it is not a per-1000-population rate. The coefficient on lagged livestock-loss ratio therefore describes the association between prior-year proportional livestock mortality and standardized registered out-migration pressure, conditional on the controls and fixed effects. The migration records do not identify destination.
Ulaanbaatar persistence model (M3), prespecified but not retained: M3 was originally intended to examine persistence in a satellite-derived urban expansion outcome and to treat same-year registered in-migration as exploratory. Because the primary UEI depended on the failed BuiltUp component, the final manuscript does not report the historical M3 estimates. This decision also avoids drawing low-powered inference from approximately 22–24 annual city observations
Spatial dependence model (M4), prespecified but not retained: M4 was originally intended to test spatial structure in the UEI. The dependent variable failed the input-validity gate because its BuiltUp component did not pass transfer validation. The historical Moran/SDM results and alternative-W extensions are therefore removed from principal evidence rather than re-estimated on an invalid outcome. Spatial econometric analysis can be reconsidered after a defensible historical urban outcome is reconstructed.
Mediation-oriented product diagnostic (M5): M5 evaluates the origin-side pair of associations involving NDVI-based ecological conditions, livestock loss, and registered out-migration pressure. Because the retained equations use different lag positions, the product a × b is reported as a diagnostic of compatibility with an intermediate livelihood role rather than as an identified causal mediation effect or exact mediated proportion.
The product diagnostic is calculated as a × b. Its sampling uncertainty is summarized with the Sobel statistic and an aimag-cluster bootstrap.
An exact identity between a × b and c − c′ is not imposed because path a uses NDVI_(t − 1) to livestock loss_t, whereas path b uses livestock loss_(t − 1) to out-migration_t. Consequently, an exact mediated share is not reported under this lag structure.
The primary M5 sample contains 21 aimags (N = 504). Path a links lagged NDVI_anom to contemporaneous livestock loss, and path b links lagged livestock loss to standardized registered out-migration. Their product and cluster-bootstrap interval summarize compatibility with an intermediate livelihood role; they do not establish sequential ignorability, destination-specific migration, or a causal mediated proportion. M1, M2, and M5 thus constitute the retained origin-side evidence, while M3/M4 remain non-retained prespecified analyses.
3.5. Identification Risks and Robustness Checks
The main identification risks are reverse causation, residual time-varying confounding, and measurement error. Lagging ecological and livelihood variables reduces contemporaneous feedback but does not create exogeneity. NDVI_anom may respond to precipitation, grazing intensity, land management, and changes in livestock pressure, so it is treated as a realized ecological-condition proxy rather than an instrumental variable or randomized shock. SPI_12 and Dzud_Severity provide complementary hazard measures, but none of these observational specifications identifies a causal effect. The measurement audit adds a separate rule: a downstream analysis is retained only when its satellite input passes its own validation gate.
Residual time-varying confounding can affect both the magnitude and direction of the origin-side estimates. Disaster assistance or non-agricultural employment could weaken a positive loss–migration association, whereas remoteness, poor market access, adverse labor demand, or insecure pasture-use conditions could strengthen it. Province and year fixed effects absorb time-invariant geography and common national shocks but not local time-varying factors. Administrative migration records may miss temporary or delayed registration, and satellite measurement is separately constrained by the NTL cross-sensor rank warning and the failed BuiltUp transfer gate.
Robustness checks are interpreted only when they use the same locked variable definitions and pass the same input-validity gate as the corresponding main specification. The origin-side sensitivity analyses therefore remain on the canonical NDVI, livestock-loss-ratio, and standardized out-migration scales. The BuiltUp/UEI/Mismatch/M3/spatial robustness chain is not retained because its measurement foundation failed validation. This is a scope reduction, not a reinterpretation of the historical outputs.
4. Results
4.1. Descriptive Patterns and Satellite Measurement Diagnostics
4.1.1. Descriptive Statistics
The panel shows substantial variation in livelihood and migration outcomes across provinces and years, while the retained satellite variables represent distinct measurement domains.
Table 3 provides the full distributions: SPI_12 is centered near zero by construction, NDVI_anom captures within-province vegetation deviations, and canonical nighttime lights describe settlement/activity intensity. BuiltUp, UEI, and Mismatch are not summarized as final panel outcomes because the BuiltUp measurement gate failed.
4.1.2. Nighttime-Light Measurement Diagnostics
The main nighttime-light result is a contrast between strong cross-sensor level agreement and weaker rank continuity. In the 2013 overlap, DMSP-to-VIIRS calibration has R
2 = 0.973 and Spearman = 0.639; rank continuity falls to 0.555 across the 2012–2013 transition. This supports descriptive longitudinal-level use but cautions against assuming seamless province ranking across sensors. Full diagnostics are reported in
Table S6 and
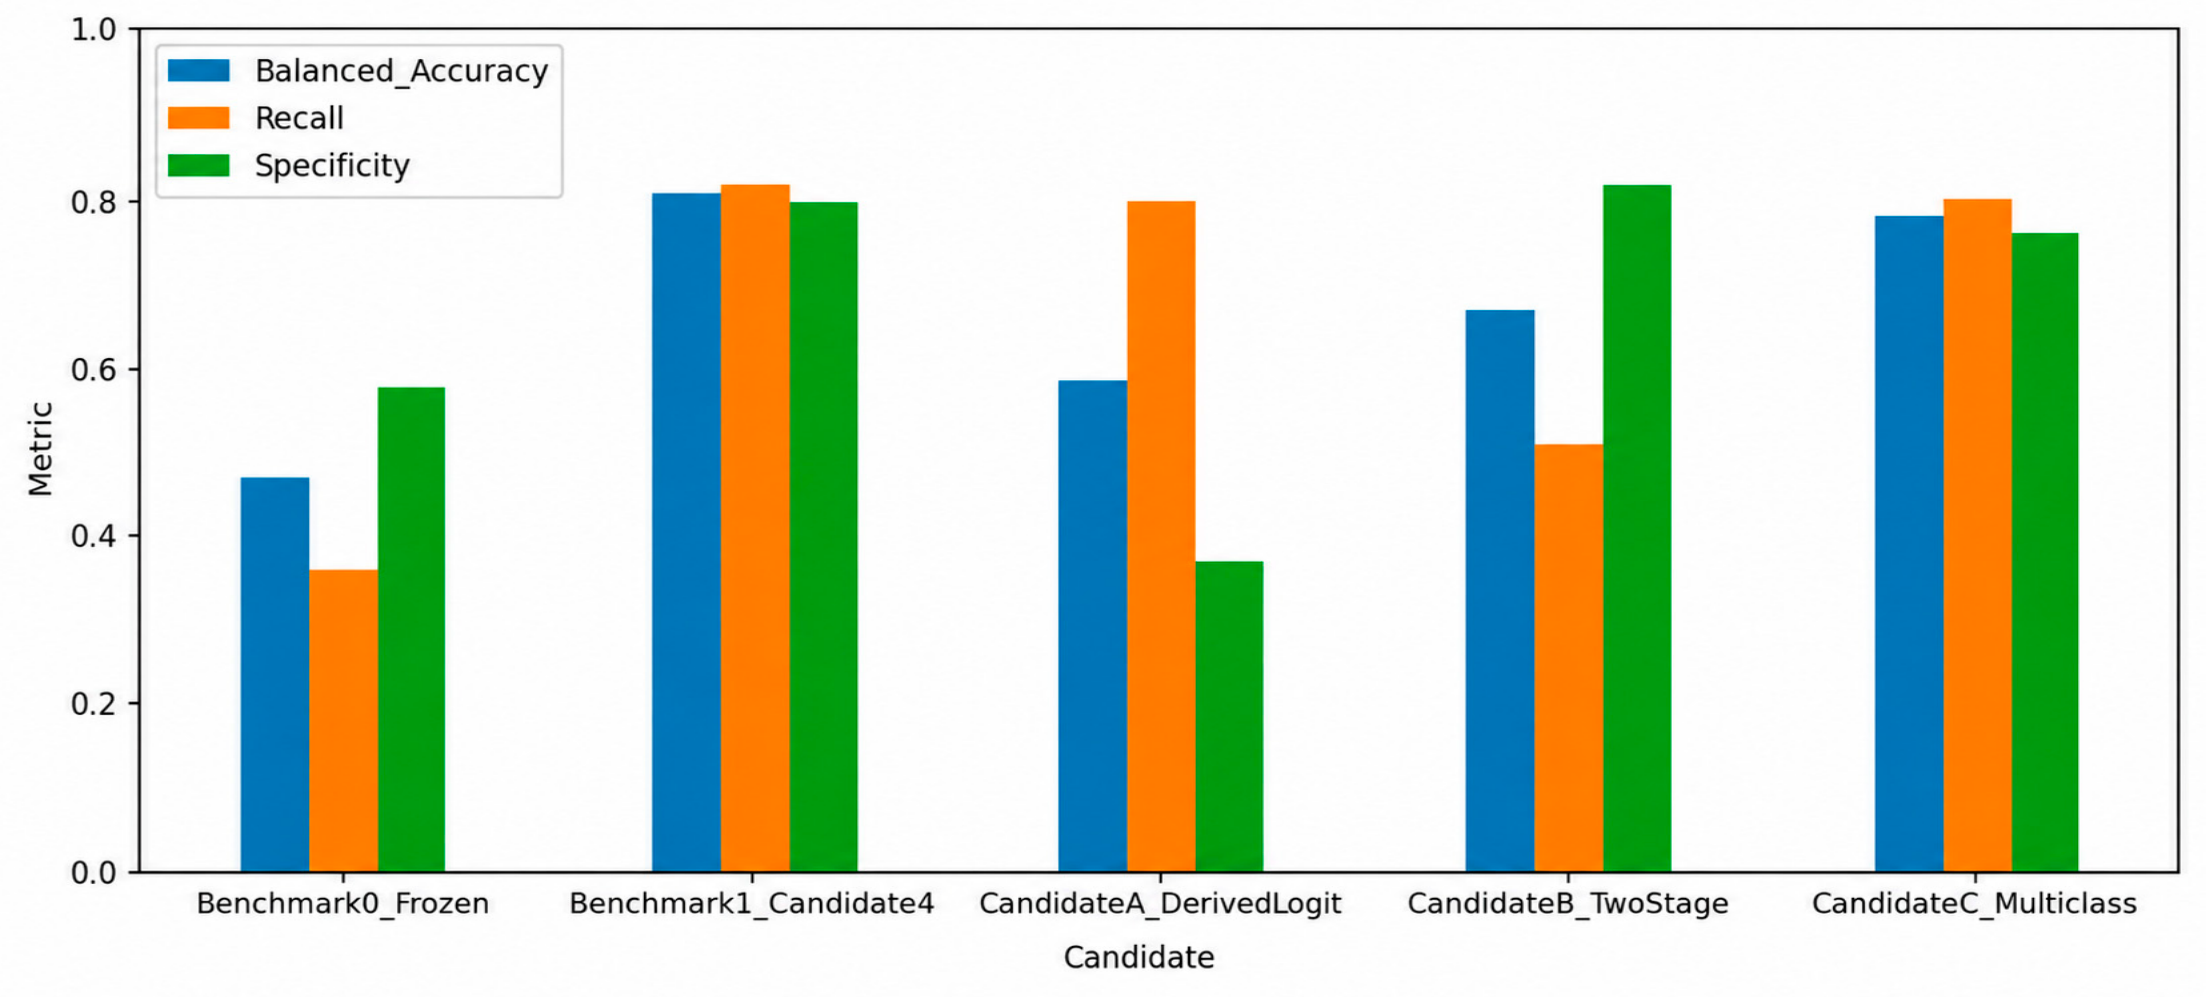
Figure S2. The performance of the frozen and enriched spectral BuiltUp candidates is summarized in
Figure 3.
4.1.3. BuiltUp Validation Gate
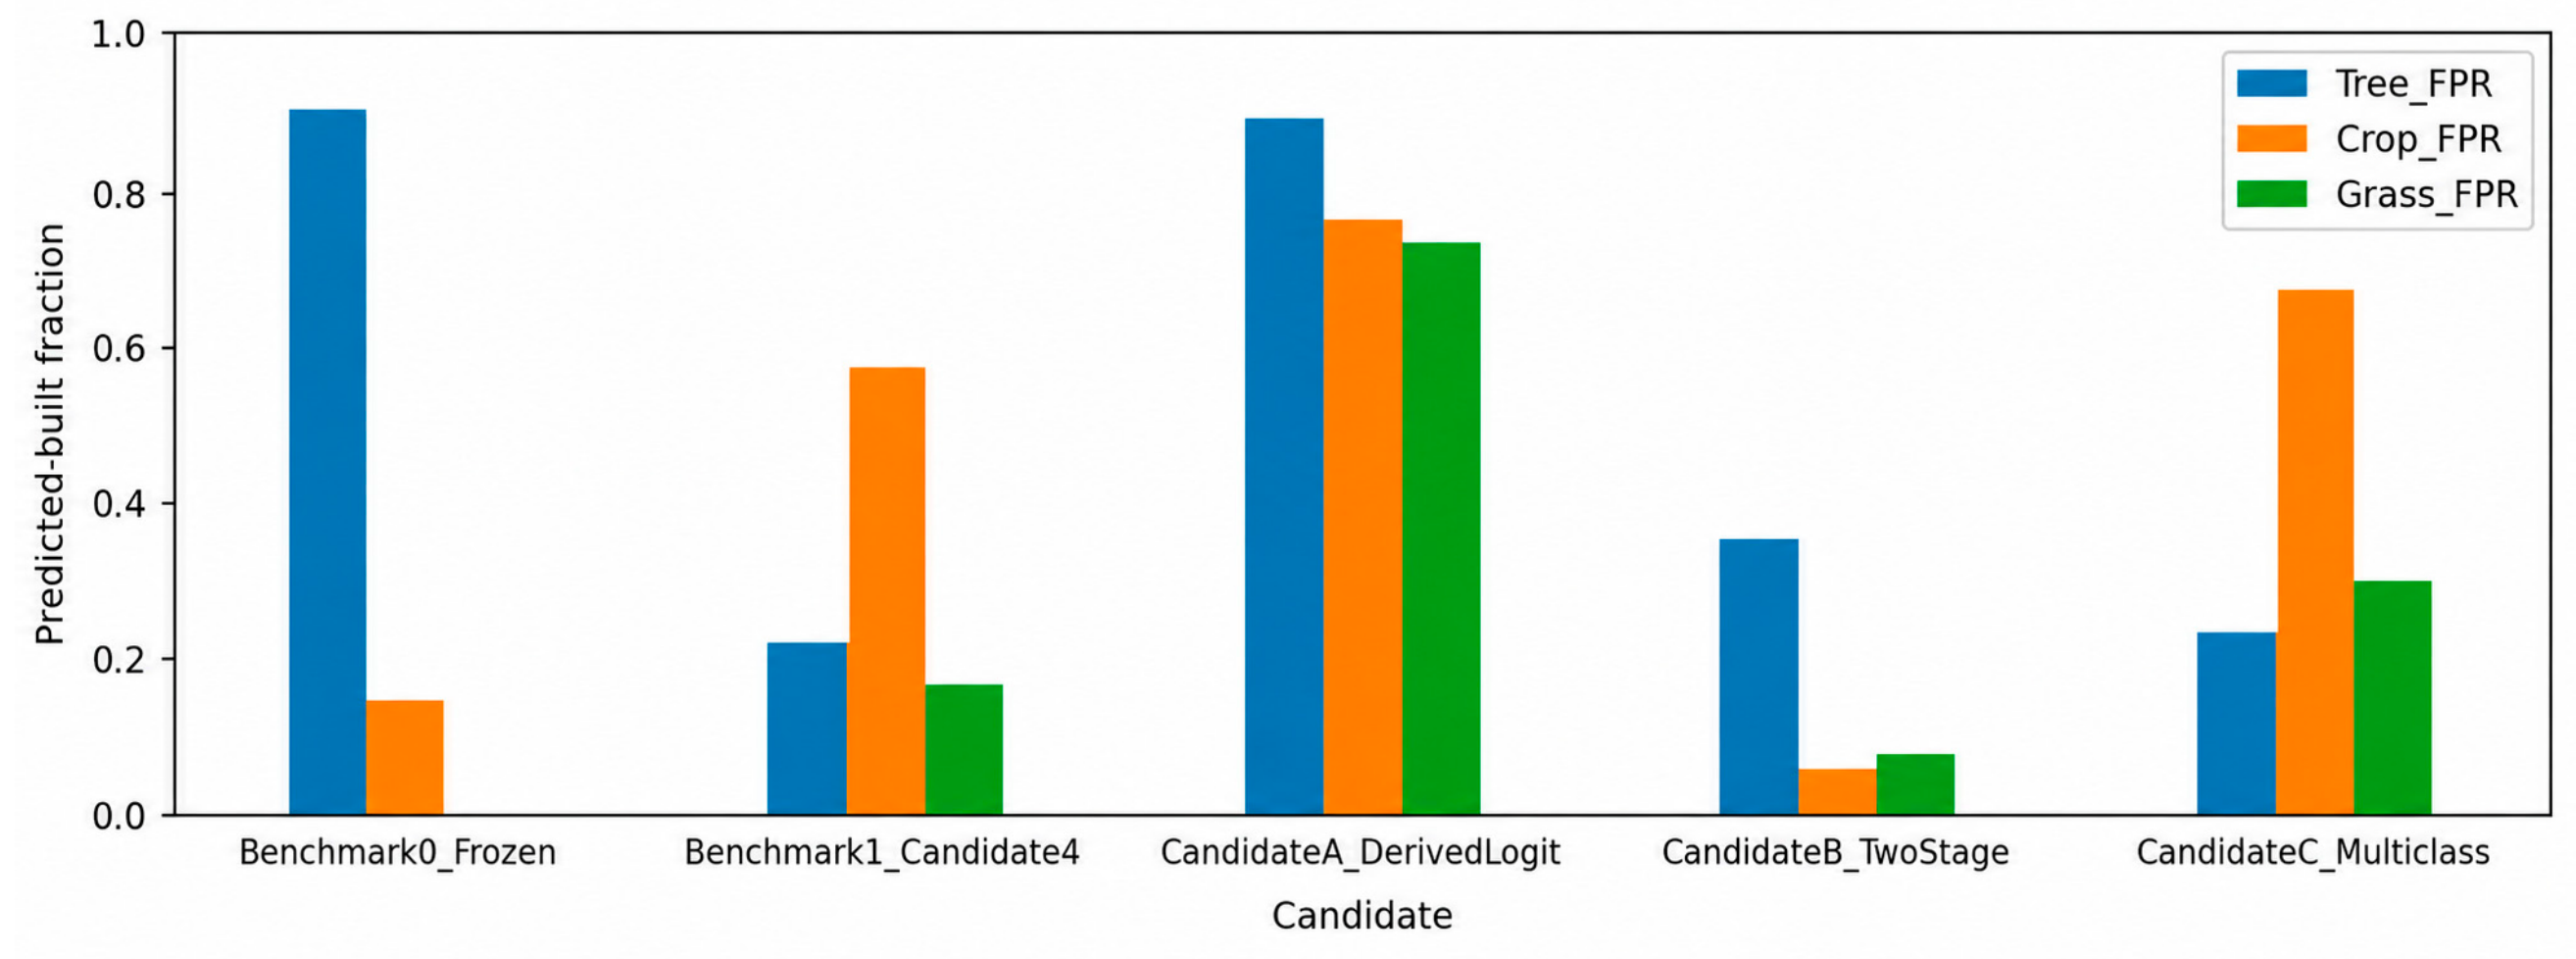
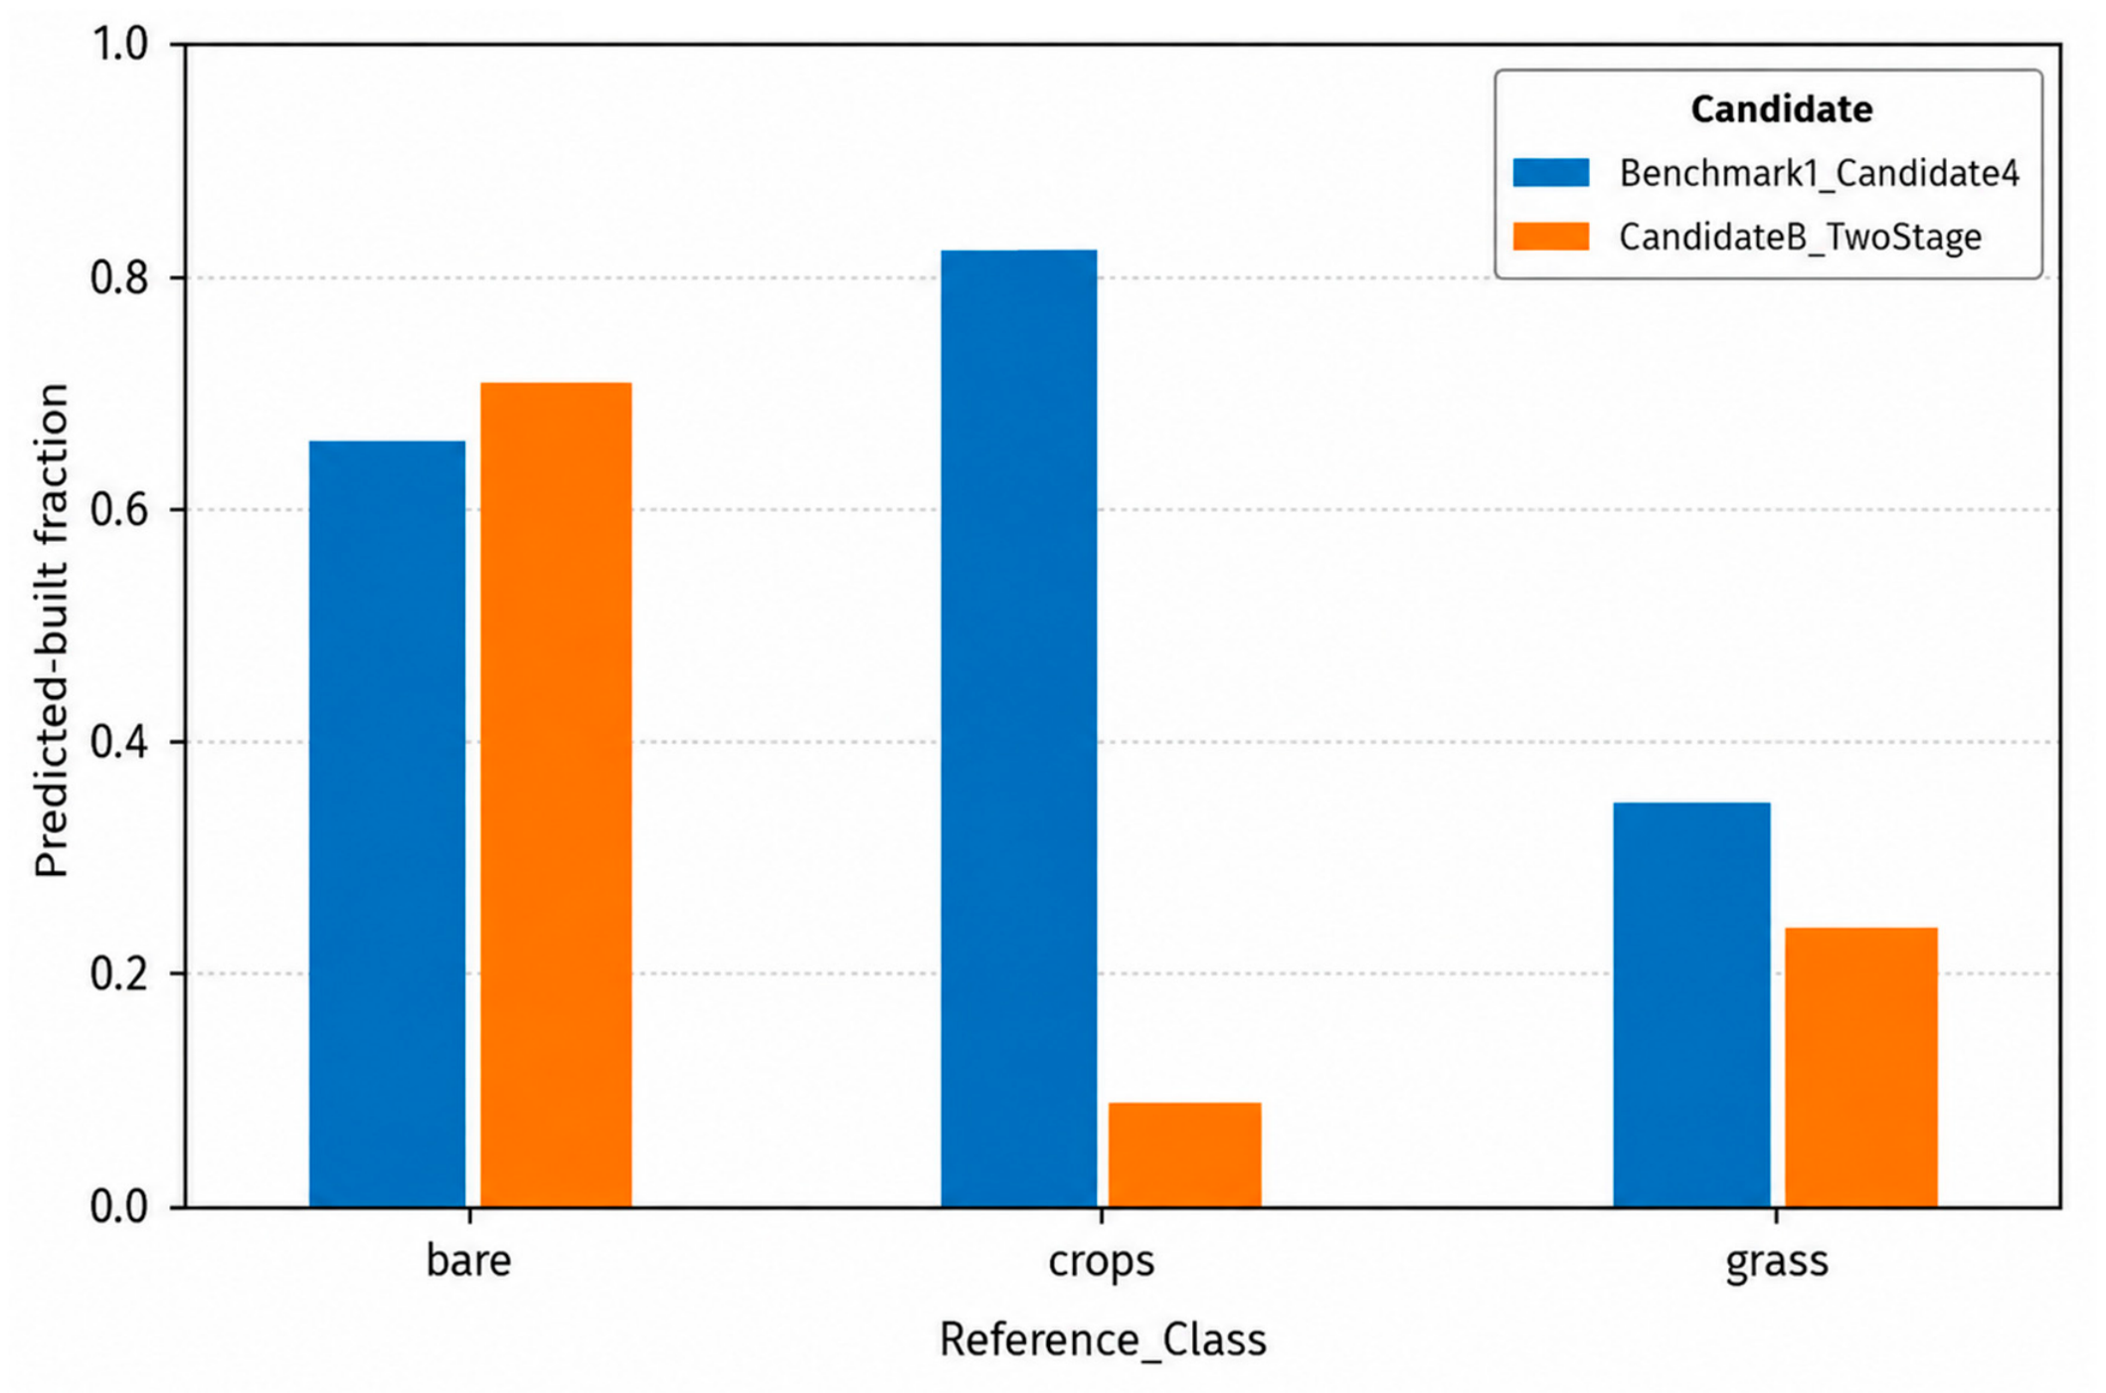
The historical BuiltUp rule did not provide a defensible measure of physical urban extent. Its most consequential error was classifying 94.9% of Dynamic World bare reference observations as built, despite weak overall discrimination. Enriched spectral models improved average performance but traded one error for another: the strongest aggregate benchmark retained substantial crop commission, while the two-stage candidate reduced crop and grass false positives at the cost of lower built recall and persistent bare-soil error.
Figure 4 shows these class-specific trade-offs.
The decisive weakness is spatial transfer rather than temporal stability. Performance remained comparatively stable across held-out years but deteriorated materially for held-out provinces, with Govisümber the worst case. The same pattern persisted under stricter Dynamic World confidence screens, so low-confidence reference labels alone do not explain the failure.
No spectral-only candidate therefore met the combined requirements for class-specific error control, useful recall, and stable province transfer, and no repaired classifier was frozen. A defensible historical redesign would require local spatial context, multi-year persistence, cross-sensor portability, and a prospectively specified independent holdout; these features are future requirements, not completed results.
4.2. Ecological Stress, Livestock Loss, and Out-Migration Pressure
The retained origin-side analysis uses 21 aimags (N = 504, 2001–2024) and separates ecological conditions, livestock loss, and subsequent registered out-migration pressure. Ulaanbaatar is excluded because this module concerns pastoral origins rather than destination-specific urban expansion. H1, H2, and H4 are evaluated as observational associations.
4.2.1. NDVI-Based Ecological Stress and Livestock Mortality
The M1 results support a temporal association between poorer prior-year vegetation conditions and greater livestock mortality (
Table 4). The lagged NDVI association is negative in both the baseline and extended specifications, and dzud severity is also positively associated with loss when included. In contrast, lagged SPI_12 and contemporaneous NDVI do not provide comparable support. H1 is therefore supported for lagged vegetation condition and dzud severity, but not uniformly across all ecological indicators.
4.2.2. Livestock Loss and Out-Migration Pressure
M2 indicates that years following greater proportional livestock loss are associated with higher standardized registered out-migration pressure (
Table 5). This result is stable across both specifications; lagged SPI_12 and NDVI_anom are not statistically significant, while real GDP per capita is positive in the fully specified model. Substantively, livelihood loss is more directly aligned with subsequent registered mobility pressure than the ecological indicators in this specification. The administrative records do not identify destinations, so the result cannot be interpreted as movement to Ulaanbaatar.
Figure 5 places this association beside M1 without implying a causal chain.
4.2.3. Mediation-Oriented Product Diagnostic
M5 is consistent with, but does not identify, an intermediate livelihood role for livestock loss (
Table 6). The negative path-a and positive path-b coefficients produce a negative product whose cluster-bootstrap interval excludes zero, but the component equations use different lag positions. Because a × b is not an exact c − c′ decomposition and neither c nor c′ is statistically significant at the 5% level, H4 is interpreted narrowly: the two origin-side associations are compatible with an intermediate role for livestock loss, not an exact mediated share or causal pathway.
4.3. BuiltUp Transfer Validation and Downstream Scope Decision
4.3.1. Province Transfer and Error Trade-Offs
Table 7 shows the central classifier-development trade-off: no spectral candidate combines acceptable class-specific error control with stable province transfer. Benchmark 1 improves overall discrimination but still confuses cropland with built surfaces; Candidate B reduces crop and grass false positives by sacrificing recall and still leaves substantial bare-soil error. Govisumber is the clearest held-out example (
Figure 6), showing that the problem is not average accuracy alone but transfer to local land-cover conditions. Detailed metrics are reported in
Supplementary Tables S9–S11.
4.3.2. Consequences for UEI, Mismatch, M3, and M4
Table 8 records the final downstream scope decision. The failed historical BuiltUp series is not used as validated evidence. The original UEI is therefore withdrawn, and the Mismatch Index is not computed from that invalid composite. H3/M3 is not evaluated because its primary urban outcome depended on UEI/BuiltUp, and the UEI-based M4 spatial model and alternative-W robustness are not re-estimated. Retaining those historical estimates would give false precision after a failed measurement gate. H3 remains documented as a prespecified hypothesis that could not be evaluated under the final validated architecture.
4.4. Robustness and Sensitivity Checks
This subsection reports robustness checks only for retained results. The purpose is to assess whether the canonical origin-side findings are sensitive to sample composition or specification and to document the locked NTL measurement warning. BuiltUp/UEI/Mismatch/M3/spatial robustness is not reported because the downstream branch failed its input-validity gate.
4.4.1. Leave One Province out Sensitivity Analysis
Leave-one-province-out checks show that the two core origin-side relationships do not depend on any single aimag (
Table 9). The lagged NDVI–livestock-loss coefficient remains negative and statistically significant in all 21 exclusions, and the livestock-loss–out-migration coefficient remains positive and statistically significant in all 21. By contrast, the reduced-form NDVI–migration association keeps the same negative sign but is statistically significant in only 1 of 21 iterations. The strongest robustness evidence therefore concerns the two linked origin-side associations, not the reduced-form relationship.
4.4.2. Additional Specification and Measurement Checks
Additional checks reinforce this hierarchy of evidence. The lagged NDVI result remains negative and statistically significant in the baseline and extended M1 models, whereas contemporaneous NDVI is small and not statistically significant; the fully specified M2 model retains a positive and statistically significant lagged livestock-loss coefficient (
Supplementary Table S2). Historical local-projection, interaction, threshold, nonlinear feature-importance, UEI-composite, and spatial outputs are not treated as current evidence when they were not reproduced from the authoritative retained inputs.
Nighttime-light checks support a different conclusion: levels align strongly across sensors, but provincial ranks are less stable near the transition. The 2013 overlap has Pearson r = 0.987 but Spearman ρ = 0.639, and rank continuity weakens further across 2012–2013 (ρ = 0.555). These diagnostics remain a material measurement warning that pooled z-standardization does not remove.
5. Discussion
5.1. Urban Monitoring, Measurement Validation, and Satellite–Administrative Divergence
The measurement contribution is the validation-first treatment of satellite urban indicators. Nighttime lights remain useful for longitudinal settlement/activity monitoring, but strong cross-sensor-level agreement does not imply stable provincial ranking. The BuiltUp problem is more consequential: the frozen NDBI–NDVI rule systematically confuses bare and some cropland surfaces with built land, and enriched spectral candidates do not transfer reliably across provinces. This does not invalidate Landsat urban mapping generally; it shows that this tested spectral architecture is inadequate as a validated 2000–2024 BuiltUp measure for Mongolia’s heterogeneous drylands [
14,
19,
20,
27,
51,
52,
54].
The NTL warning is consistent with known DMSP/VIIRS radiometric and sensor-design differences that motivate intercalibration and cross-sensor harmonization [
28,
29,
30,
55]. The canonical series is therefore retained for descriptive longitudinal level comparisons, while province ranking around the transition is interpreted cautiously.
The failed BuiltUp gate narrows destination-side conclusions. Historical UEI persistence, same-year migration, Mismatch, and spatial UEI results are not reported because their dependent variable no longer met the measurement requirement. Satellite–administrative divergence remains substantively important, but quantitative mismatch requires a validated satellite urban construct.
5.2. Origin-Side Livelihood Stress and Migration Pressure
The origin-side results align with pastoral-vulnerability research while adding a longitudinal provincial perspective. The lagged NDVI pattern is consistent with evidence that drought reduces Mongolian pasture production [
26] and that weather fluctuations affect livestock productivity [
24]; the positive dzud-severity term also accords with research on severe-winter livelihood disruption [
7,
13,
25]. The subsequent loss–out-migration association is compatible with push–pull and asset-based livelihood accounts [
42,
43]. Because environmental stress can also constrain mobility [
1,
2,
44], these aimag-level associations should not be read as household-level causal effects.
M5 links the two origin-side findings without establishing a causal mechanism. Its negative product is statistically distinguishable from zero under the locked diagnostics, but different lag positions prevent an exact c − c′ decomposition or mediated percentage. The practical implication is limited to monitoring: vegetation conditions and livestock loss help identify periods of elevated pastoral livelihood pressure associated with subsequent registered out-migration, not movement specifically to Ulaanbaatar or direct urban expansion.
5.3. Why the Urban-Composite and Spatial Branch Was Withdrawn
Spatial dependence remains relevant because settlement, infrastructure, and administrative classifications are geographically structured [
33,
34,
35], but spatial robustness cannot repair an invalid dependent variable. After BuiltUp failed transfer validation, re-estimating Moran, SAR, SEM, SDM, or alternative weights on the original UEI would only analyze a construct that failed its measurement gate. Future spatial analysis therefore requires a context-valid historical urban outcome.
5.4. Urban Planning and Adaptation Monitoring Implications
The retained findings have implications for validation-first urban monitoring and adaptation planning. In the current study, canonical nighttime lights can complement administrative records as a descriptive settlement/activity signal, but quantitative satellite–administrative divergence should not be inferred until a context-valid physical BuiltUp measure is available. Operationally, retained satellite and livelihood indicators are screening inputs rather than automatic intervention triggers. This study does not estimate a universal satellite threshold, and it does not retain a UEI or Mismatch threshold after the composite was withdrawn. A defensible monitoring system would calibrate any future threshold against field, cadastral, infrastructure, and administrative evidence and would specify the decision-specific costs of false positives and false negatives. NDVI and livestock-loss monitoring can support origin-side situational awareness, while NTL can complement administrative monitoring with explicit sensor-transition caution.5.5. Limitations and Future Research.
Several limitations remain. Administrative migration records capture registered movement without a complete origin–destination matrix and may miss temporary or delayed registration. MODIS NDVI is coarse for fine peri-urban change, and nighttime lights retain cross-sensor rank instability despite strong linear calibration. Most importantly, the historical BuiltUp classifier and enriched spectral candidates fail the required transfer standard, so BuiltUp, UEI, Mismatch, M3, and UEI-based spatial results are not retained. Time-varying confounding may also persist despite fixed effects, including disaster assistance, non-agricultural employment, market access, land and pasture institutions, infrastructure investment, and COVID-period mobility constraints; its net direction cannot be identified from the available data.
Future work should resolve the measurement bottleneck before rebuilding the urban-composite branch. Historical BuiltUp reconstruction should add local spatial context, multi-year Landsat persistence, explicit cross-sensor portability, and a prospectively specified independent validation sample. Only after that gate is passed should UEI/Mismatch, Ulaanbaatar M3, and spatial models be reconsidered. Household-level origin–destination migration, cadastral and service-infrastructure data, and higher-frequency Sentinel-2 or Dynamic World products could then test the timing and mechanisms linking pastoral mobility pressure to physical urban change more directly.
6. Conclusions
This study re-evaluates multi-source monitoring of ecological stress, livelihood disruption, migration pressure, and urban change in Mongolia over 2000–2024. The retained evidence combines origin-side NDVI, CHIRPS, dzud, livestock, and registered migration analyses with an audited nighttime-light series; Landsat BuiltUp is retained only as a validation finding.
Canonical nighttime lights remain useful descriptively but carry a cross-sensor rank warning. The historical Landsat BuiltUp rule fails external transfer validation, and spectral-only repairs do not transfer stably across provinces. Consequently, the original UEI, Mismatch, M3, and UEI-based spatial results are not reported.
The satellite–administrative divergence question remains important, but the final study does not quantify it with the withdrawn composite. The methodological contribution is instead to show that disagreement between measurement systems should be investigated only after each satellite component passes an appropriate validation gate.
Origin-side results show that poorer lagged vegetation conditions are associated with higher proportional livestock loss, dzud severity with higher loss in the extended model, and greater prior-year livestock loss with higher standardized registered out-migration pressure. These are livelihood and mobility-pressure associations, not evidence of migrant destinations or a causal pathway to Ulaanbaatar.
Overall, the study demonstrates a validation-first monitoring principle: retain supported origin-side evidence and an explicitly qualified NTL signal, but withdraw a composite when its physical component does not transfer reliably. Context-aware historical BuiltUp reconstruction is therefore a prerequisite for future UEI, Mismatch, M3, or spatial urbanization analysis.
Supplementary Materials
The following supporting information can be downloaded at:
https://www.mdpi.com/article/10.3390/urbansci10090532/s1, Table S1: Final analysis-retention matrix after the BuiltUp validation gate; Table S2: Canonical M1 specification comparison under Phase 1R definitions; Table S3: Interaction models for out-migration pressure; Table S4: Threshold models for livestock loss and out-migration pressure; Table S5: BuiltUp candidate architectures and development diagnostics; Table S6: Canonical nighttime-light harmonization and transition diagnostics; Table S7: Residual spatial autocorrelation summary; Table S8: Supplementary spatial lag robustness model for out-migration pressure; Table S9: Province-transfer stability across BuiltUp candidates; Table S10: Aggregate BuiltUp classifier diagnostics, 2016–2024; Table S11: Class-specific and province-transfer BuiltUp diagnostics; Figure S1: Highest feature redundancies in the enriched Landsat development set; Figure S2: Canonical 2013 nighttime-light cross-sensor calibration diagnostic; Figure S3: Province-transfer range and median balanced accuracy across BuiltUp candidates.
Author Contributions
B.S.: Conceptualization, Methodology, Formal Analysis (Satellite image processing), Writing—Original Draft, Writing—Review and Editing. T.S. (Tsolmon Sodnomdavaa): Methodology (machine learning, remote sensing), Writing—Review and Editing; H.J.: Software, Data Curation, Writing—Review and Editing; E.D.: Investigation (field data collection, household survey coordination), Data Curation. T.S. (Tegshjargal Sodnomdavaa): Investigation, Resources. E.E.: Investigation. M.U.: Investigation (satellite data processing), Visualization (GIS analysis). All authors have read and agreed to the published version of the manuscript.
Funding
This research was supported by the Science and Technology Plan Project of Inner Mongolia Autonomous Region (Grant No. 2025YFHH0105) and the Natural Science Foundation of Inner Mongolia Autonomous Region (Grant No. 2026MS0830).
Institutional Review Board Statement
Not applicable.
Informed Consent Statement
Not applicable.
Data Availability Statement
The study integrates official statistical data with satellite-derived ecological and nighttime-light indicators. Administrative socioeconomic, migration, livestock, labor, and economic data were obtained from the National Statistics Office of Mongolia (
https://www.1212.mn). MODIS NDVI, CHIRPS precipitation, and DMSP/VIIRS nighttime-light inputs were processed under the documented workflows. Landsat/Dynamic World files used for the BuiltUp validation are retained as methodological diagnostic evidence; the failed historical BuiltUp series and its dependent UEI/Mismatch/spatial outputs are not treated as validated study results. Processed data and reproducibility materials supporting the retained findings and validation audit are available from the corresponding author upon reasonable request.
Acknowledgments
This work has been completed within the framework of the project (P2025-5046) supported by the National University of Mongolia, and we would like to thank the editors and anonymous reviewers for their comments and for helping us to enhance the manuscript.
Conflicts of Interest
Authors Enkhbayar Davaatseren and Erkhetbayar Enkhbayar were employed by the company Nomadic Industrial Cluster System (NICS) LLC. The remaining authors declare that the research was conducted in the absence of any commercial or financial relationships that could be construed as a potential conflict of interest.
References
- Black, R.; Bennett, S.R.G.; Thomas, S.M.; Beddington, J.R. Climate change: Migration as adaptation. Nature 2011, 478, 447–449. [Google Scholar] [CrossRef] [Scilit] [PubMed]
- Hoffmann, R.; Dimitrova, A.; Muttarak, R.; Crespo Cuaresma, J.; Peisker, J. A meta-analysis of country-level studies on environmental change and migration. Nat. Clim. Change 2020, 10, 904–912. [Google Scholar] [CrossRef] [Scilit]
- IPCC. Climate Change 2022: Impacts, Adaptation and Vulnerability; Cambridge University Press: Cambridge, UK, 2022. [Google Scholar] [CrossRef] [Scilit]
- Clement, V.; Rigaud, K.K.; de Sherbinin, A.; Jones, B.; Adamo, S.; Schewe, J.; Sadiq, N.; Shabahat, E. Groundswell Part 2: Acting on Internal Climate Migration; World Bank: Washington, DC, USA, 2021. [Google Scholar] [CrossRef] [Scilit]
- Rigaud, K.K.; de Sherbinin, A.; Jones, B.; Bergmann, J.; Clement, V.; Ober, K.; Adamo, S.; McCusker, B.; Heuser, S.; Amelia, M. Groundswell: Preparing for Internal Climate Migration; World Bank: Washington, DC, USA, 2018. [Google Scholar] [CrossRef] [Scilit]
- Hermans, K.; McLeman, R. Climate change, drought, land degradation and migration: Exploring the linkages. Curr. Opin. Environ. Sustain. 2021, 50, 236–244. [Google Scholar] [CrossRef] [Scilit]
- Sternberg, T. Unravelling Mongolia’s extreme winter disaster of 2010. Nomadic Peoples 2010, 14, 72–86. [Google Scholar] [CrossRef] [Scilit]
- Ayusheeva, S.; Ivanova, S.; Botoeva, N.; Lubsanova, N.; Mikheeva, A.; Bardakhanova, T.; Maksanova, L.; Altaev, A.; Tulokhonov, A. Impact of the dzud disaster on nomadic livestock farming in Mongolia. Sustainability 2025, 17, 10631. [Google Scholar] [CrossRef] [Scilit]
- United Nations Development Programme. Socio-Economic Impact Assessment of Dzud 2023–2024: Dzud Resilience Strategy Policy Recommendations; UNDP Mongolia: Ulaanbaatar, Mongolia, 2025; Available online: https://www.undp.org/mongolia/publications/socio-economic-impact-assessment-dzud-2023-2024-dzud-resilience-strategy-policy-recommendations (accessed on 9 August 2026).
- National Statistics Office of Mongolia. Statistical Yearbook of Mongolia 2024; National Statistics Office of Mongolia: Ulaanbaatar, Mongolia, 2024; Available online: https://www.1212.mn (accessed on 9 August 2026).
- Boldbaatar, G.; Gombodorj, G.; Donorov, D.; Andriambololonaharisoamalala, R.; Indra, M.; Purevtseren, M. Land suitability analysis in monocentric post-socialist city: Case of Ulaanbaatar, Mongolia. PLoS ONE 2024, 19, e0308762. [Google Scholar] [CrossRef] [Scilit] [PubMed]
- Yang, J.; Lee, S.; Park, S.; Lee, M.; Cha, M. AI-based Ger detection reveals post-pandemic delay in informal housing progress in Mongolia. npj Urban Sustain. 2025, 5, 78. [Google Scholar] [CrossRef] [Scilit]
- Fernández-Giménez, M.E.; Batkhishig, B.; Batbuyan, B. Cross-boundary and cross-level dynamics increase vulnerability to severe winter disasters (dzud) in Mongolia. Glob. Environ. Change 2012, 22, 836–851. [Google Scholar] [CrossRef] [Scilit]
- Marconcini, M.; Metz-Marconcini, A.; Üreyen, S.; Palacios-Lopez, D.; Hanke, W.; Bachofer, F.; Zeidler, J.; Esch, T.; Gorelick, N.; Kakarla, A.; et al. Outlining where humans live, the World Settlement Footprint 2015. Sci. Data 2020, 7, 242. [Google Scholar] [CrossRef] [Scilit] [PubMed]
- Nyamtseren, M.; Pham, T.D.; Vu, T.T.P.; Navaandorj, I.; Shoyama, K. Mapping Vegetation Changes in Mongolian Grasslands (1990–2024) Using Landsat Data and Advanced Machine Learning Algorithm. Remote Sens. 2025, 17, 400. [Google Scholar] [CrossRef] [Scilit]
- Kakooei, M.; Bailie, J.; Pettersson, M.B.; Söderberg, A.; Becevic, A.; Daoud, A. A high resolution urban and rural settlement map of Africa using deep learning and satellite imagery. Sci. Rep. 2026, 16, 637. [Google Scholar] [CrossRef] [Scilit] [PubMed]
- Thomson, D.R.; Gaughan, A.E.; Stevens, F.R.; Yetman, G.; Elias, P.; Chen, R. Evaluating the Accuracy of Gridded Population Estimates in Slums: A Case Study in Nigeria and Kenya. Urban Sci. 2021, 5, 48. [Google Scholar] [CrossRef] [Scilit]
- Kuffer, M.; Wang, J.; Thomson, D.R.; Georganos, S.; Abascal, A.; Owusu, M.; Vanhuysse, S. Spatial Information Gaps on Deprived Urban Areas (Slums) in Low-and-Middle-Income-Countries: A User-Centered Approach. Urban Sci. 2021, 5, 72. [Google Scholar] [CrossRef] [Scilit]
- Esch, T.; Brzoska, E.; Dech, S.; Leutner, B.; Palacios-Lopez, D.; Metz-Marconcini, A.; Marconcini, M.; Roth, A.; Zeidler, J. World Settlement Footprint 3D—A first three-dimensional survey of the global building stock. Remote Sens. Environ. 2022, 270, 112877. [Google Scholar] [CrossRef] [Scilit]
- Gong, P.; Li, X.; Zhang, W. 40-Year (1978–2017) human settlement changes in China reflected by impervious surfaces from satellite remote sensing. Sci. Bull. 2019, 64, 756–763. [Google Scholar] [CrossRef] [Scilit] [PubMed]
- Chen, X.; Nordhaus, W.D. Using luminosity data as a proxy for economic statistics. Proc. Natl. Acad. Sci. USA 2011, 108, 8589–8594. [Google Scholar] [CrossRef] [Scilit] [PubMed]
- Keola, S.; Andersson, M.; Hall, O. Monitoring Economic Development from Space: Using Nighttime Light and Land Cover Data to Measure Economic Growth. World Dev. 2015, 66, 322–334. [Google Scholar] [CrossRef] [Scilit]
- Cattaneo, C.; Beine, M.; Fröhlich, C.J.; Kniveton, D.; Martinez-Zarzoso, I.; Mastrorillo, M.; Millock, K.; Piguet, E.; Schraven, B. Human migration in the era of climate change. Rev. Environ. Econ. Policy 2019, 13, 189–206. [Google Scholar] [CrossRef] [Scilit]
- Emediegwu, L.E.; Ubabukoh, C.L. Re-examining the impact of annual weather fluctuations on global livestock production. Ecol. Econ. 2023, 204, 107662. [Google Scholar] [CrossRef] [Scilit]
- Fernández-Giménez, M.E.; Batkhishig, B.; Batbuyan, B.; Ulambayar, T. Lessons from the Dzud: Community-Based Rangeland Management Increases the Adaptive Capacity of Mongolian Herders to Winter Disasters. World Dev. 2015, 68, 48–65. [Google Scholar] [CrossRef] [Scilit]
- Nandintsetseg, B.; Shinoda, M. Assessment of drought frequency, duration, and severity and its impact on pasture production in Mongolia. Nat. Hazards 2013, 66, 995–1008. [Google Scholar] [CrossRef] [Scilit]
- Brown, C.F.; Brumby, S.P.; Guzder-Williams, B.; Birch, T.; Hyde, S.B.; Mazzariello, J.; Czerwinski, W.; Pasquarella, V.J.; Haertel, R.; Ilyushchenko, S.; et al. Dynamic World, near real-time global 10 m land use land cover mapping. Sci. Data 2022, 9, 251. [Google Scholar] [CrossRef] [Scilit]
- Zhang, Q.; Pandey, B.; Seto, K.C. A robust method to generate a consistent time series from DMSP/OLS nighttime light data. IEEE Trans. Geosci. Remote Sens. 2016, 54, 5821–5831. [Google Scholar] [CrossRef] [Scilit]
- Li, X.; Li, D.; Xu, H.; Wu, C. Intercalibration between DMSP/OLS and VIIRS night-time light images to evaluate city light dynamics of Syria’s major human settlement during Syrian Civil War. Int. J. Remote Sens. 2017, 38, 5934–5951. [Google Scholar] [CrossRef] [Scilit]
- Li, X.; Zhou, Y.; Zhao, M.; Zhao, X. A harmonized global nighttime light dataset 1992–2018. Sci. Data 2020, 7, 168. [Google Scholar] [CrossRef] [Scilit] [PubMed]
- Pettorelli, N.; Vik, J.O.; Mysterud, A.; Gaillard, J.-M.; Tucker, C.J.; Stenseth, N.C. Using the satellite-derived NDVI to assess ecological responses to environmental change. Trends Ecol. Evol. 2005, 20, 503–510. [Google Scholar] [CrossRef] [Scilit] [PubMed]
- Smith, T.; Boers, N. Global vegetation resilience linked to water availability and variability. Nat. Commun. 2023, 14, 498. [Google Scholar] [CrossRef] [Scilit] [PubMed]
- Anselin, L. Spatial Econometrics: Methods and Models; Kluwer Academic Publishers: Dordrecht, The Netherlands, 1988. [Google Scholar] [CrossRef] [Scilit]
- LeSage, J.P.; Pace, R.K. Introduction to Spatial Econometrics; CRC Press: Boca Raton, FL, USA, 2009. [Google Scholar] [CrossRef] [Scilit]
- Elhorst, J.P. Spatial Econometrics: From Cross-Sectional Data to Spatial Panels; Springer: Berlin/Heidelberg, Germany, 2014. [Google Scholar] [CrossRef] [Scilit]
- Driscoll, J.C.; Kraay, A.C. Consistent covariance matrix estimation with spatially dependent panel data. Rev. Econ. Stat. 1998, 80, 549–560. [Google Scholar] [CrossRef] [Scilit]
- Dell, M.; Jones, B.F.; Olken, B.A. What do we learn from the weather? The new climate-economy literature. J. Econ. Lit. 2014, 52, 740–798. [Google Scholar] [CrossRef] [Scilit]
- Hsiang, S.M.; Jina, A.S. The Causal Effect of Environmental Catastrophe on Long-Run Economic Growth; NBER Working Paper No. 20352; National Bureau of Economic Research: Cambridge, MA, USA, 2014. [Google Scholar] [CrossRef] [Scilit]
- Emediegwu, L.E.; Wossink, A.; Hall, A.R. The impacts of climate change on agriculture in sub-Saharan Africa: A spatial panel data approach. World Dev. 2022, 158, 105967. [Google Scholar] [CrossRef] [Scilit]
- Imai, K.; Keele, L.; Tingley, D. A general approach to causal mediation analysis. Psychol. Methods 2010, 15, 309–334. [Google Scholar] [CrossRef] [Scilit] [PubMed]
- Keele, L. Causal Mediation Analysis: Warning! Assumptions Ahead. Am. J. Eval. 2015, 36, 500–513. [Google Scholar] [CrossRef] [Scilit]
- Lee, E.S. A theory of migration. Demography 1966, 3, 47–57. [Google Scholar] [CrossRef] [Scilit]
- Carter, M.R.; Barrett, C.B. The economics of poverty traps and persistent poverty: An asset-based approach. J. Dev. Stud. 2006, 42, 178–199. [Google Scholar] [CrossRef] [Scilit]
- Black, R.; Arnell, N.W.; Adger, W.N.; Thomas, D.; Geddes, A. Migration, immobility and displacement outcomes following extreme events. Environ. Sci. Policy 2013, 27, S32–S43. [Google Scholar] [CrossRef] [Scilit]
- Fujita, M.; Krugman, P.; Venables, A.J. The Spatial Economy: Cities, Regions, and International Trade; MIT Press: Cambridge, MA, USA, 1999. [Google Scholar] [CrossRef] [Scilit]
- General Authority for Land Administration and Management, Geodesy and Cartography. Mongolian Administrative Boundary Information System (Khil Tses). [Data Set]. Available online: https://khil.gazar.gov.mn/home (accessed on 9 August 2026).
- Gorelick, N.; Hancher, M.; Dixon, M.; Ilyushchenko, S.; Thau, D.; Moore, R. Google Earth Engine: Planetary-scale geospatial analysis for everyone. Remote Sens. Environ. 2017, 202, 18–27. [Google Scholar] [CrossRef] [Scilit]
- National Agency for Meteorology and Environmental Monitoring. Official Website. NAMEM: Ulaanbaatar, Mongolia. Available online: https://namem.gov.mn/en/home (accessed on 11 August 2026).
- Funk, C.; Peterson, P.; Landsfeld, M.; Pedreros, D.; Verdin, J.; Shukla, S.; Husak, G.; Rowland, J.; Harrison, L.; Hoell, A.; et al. The climate hazards infrared precipitation with stations—A new environmental record for monitoring extremes. Sci. Data 2015, 2, 150066. [Google Scholar] [CrossRef] [Scilit] [PubMed]
- Didan, K. MODIS/Terra Vegetation Indices Monthly L3 Global 1 km SIN Grid V061 [Data Set]; NASA LP DAAC: Sioux Falls, SD, USA, 2021. [Google Scholar] [CrossRef]
- Wulder, M.A.; Loveland, T.R.; Roy, D.P.; Crawford, C.J.; Masek, J.G.; Woodcock, C.E.; Allen, R.G.; Anderson, M.C.; Belward, A.S.; Cohen, W.B.; et al. Current status of Landsat program, science, and applications. Remote Sens. Environ. 2019, 225, 127–147. [Google Scholar] [CrossRef] [Scilit]
- Zha, Y.; Gao, J.; Ni, S. Use of normalized difference built-up index in automatically mapping urban areas from TM imagery. Int. J. Remote Sens. 2003, 24, 583–594. [Google Scholar] [CrossRef] [Scilit]
- Breiman, L. Random forests. Mach. Learn. 2001, 45, 5–32. [Google Scholar] [CrossRef] [Scilit]
- Congalton, R.G.; Green, K. Assessing the Accuracy of Remotely Sensed Data: Principles and Practices, 3rd ed.; CRC Press: Boca Raton, FL, USA, 2019. [Google Scholar] [CrossRef] [Scilit]
- Elvidge, C.D.; Baugh, K.; Zhizhin, M.; Hsu, F.-C.; Ghosh, T. VIIRS night-time lights. Int. J. Remote Sens. 2017, 38, 5860–5879. [Google Scholar] [CrossRef] [Scilit]
Figure 1.
Study Area and Provincial Units of Analysis in Mongolia.
Figure 1.
Study Area and Provincial Units of Analysis in Mongolia.
Figure 2.
Methodological workflow and model-specific analytical roles. Notes: M1, M2, and M5 form the retained origin-side module. M3 and M4 retain their original model numbers for traceability but are not reported as final inferential evidence after the BuiltUp validation gate. Dynamic World is used only as reference/diagnostic information and never as a predictor.
Figure 2.
Methodological workflow and model-specific analytical roles. Notes: M1, M2, and M5 form the retained origin-side module. M3 and M4 retain their original model numbers for traceability but are not reported as final inferential evidence after the BuiltUp validation gate. Dynamic World is used only as reference/diagnostic information and never as a predictor.
Figure 3.
Leakage-safe LOADM1O performance of the frozen and enriched spectral BuiltUp candidates. Notes: The figure reports pooled balanced accuracy, recall, and specificity for the 2016–2024 fixed-sample development/diagnostic set. Dynamic World is used only as reference information. Candidate specifications and cutoffs were fixed before outer evaluation; no inner tuning was required. No candidate was frozen as a historical BuiltUp classifier.
Figure 3.
Leakage-safe LOADM1O performance of the frozen and enriched spectral BuiltUp candidates. Notes: The figure reports pooled balanced accuracy, recall, and specificity for the 2016–2024 fixed-sample development/diagnostic set. Dynamic World is used only as reference information. Candidate specifications and cutoffs were fixed before outer evaluation; no inner tuning was required. No candidate was frozen as a historical BuiltUp classifier.
Figure 4.
Class-specific false-positive rates under leakage-safe LOADM1O evaluation of BuiltUp candidates.
Figure 4.
Class-specific false-positive rates under leakage-safe LOADM1O evaluation of BuiltUp candidates.
Figure 5.
Origin-side associations among NDVI anomaly, livestock loss, and registered provincial out-migration pressure. Notes: Step 1 summarizes the M1 association between lagged NDVI_anom and the livestock-loss ratio (β = −0.0148, SE = 0.0062). Step 2 summarizes the M2 association between lagged livestock-loss ratio and standardized registered provincial Out_Migration (β = 1.113, SE = 0.319 in the fully specified model). The arrows represent separately timed observational associations. The administrative migration outcome does not identify migrants’ destinations, and the figure is not an origin-to-Ulaanbaatar causal pathway.
Figure 5.
Origin-side associations among NDVI anomaly, livestock loss, and registered provincial out-migration pressure. Notes: Step 1 summarizes the M1 association between lagged NDVI_anom and the livestock-loss ratio (β = −0.0148, SE = 0.0062). Step 2 summarizes the M2 association between lagged livestock-loss ratio and standardized registered provincial Out_Migration (β = 1.113, SE = 0.319 in the fully specified model). The arrows represent separately timed observational associations. The administrative migration outcome does not identify migrants’ destinations, and the figure is not an origin-to-Ulaanbaatar causal pathway.
Figure 6.
Govisumber class-specific commission under held-out province evaluation of the strongest spectral benchmark and the two-stage candidate.
Figure 6.
Govisumber class-specific commission under held-out province evaluation of the strongest spectral benchmark and the two-stage candidate.
Table 1.
Model-specific sample restrictions and empirical role.
Table 1.
Model-specific sample restrictions and empirical role.
| Model | Spatial Sample | Observations | Empirical Role |
|---|
| M1: Ecological stress and livestock loss | 21 aimags, Ulaanbaatar excluded | 504 | Tests whether lower NDVI anomaly, greater precipitation deficit, and higher dzud severity are associated with livestock mortality |
| M2: Livestock loss and out-migration pressure | 21 aimags, Ulaanbaatar excluded | 504 | Tests whether lagged livestock loss is associated with subsequent out-migration pressure |
| M3: Ulaanbaatar persistence model | Ulaanbaatar only; prespecified, not retained | Not reported | Prespecified H3 module; not evaluated because its primary urban outcome depended on the failed BuiltUp/UEI branch |
| M4: Spatial dependence model | All 22 spatial units; prespecified, not retained | Not estimated | Prespecified M4 spatial module; not re-estimated because the UEI dependent variable failed the input-validity gate |
| M5: Mediation-oriented product diagnostic | 21 aimags as primary sample; all 22 units as robustness check | 504/528 | Examines whether the two origin-side associations are compatible with livestock loss as an intermediate livelihood variable; no exact causal mediated share is claimed |
Table 2.
Key variables, data sources, and analytical roles.
Table 2.
Key variables, data sources, and analytical roles.
| Variable | Measurement/Source | Role in Analysis |
|---|
| NDVI_anom | MOD13A3 v6.1; June–August ndvi_mean standardized within each province over 2000–2024 using the province-specific population SD | Within-province ecological-condition proxy in M1, M2, and M5 |
| ndvi_mean | MODIS MOD13A3 v6.1; absolute growing season NDVI mean | Absolute vegetation measure; not used in a final UEI |
| SPI_12 | CHIRPS-derived 12-month Standardized Precipitation Index | Precipitation deficit proxy; lower values indicate drier conditions |
| Dzud_Severity | NAMEM official dzud severity classification, 0 to 3 | Winter hazard indicator capturing snow, cold, and pasture shortage |
| LivestockLoss_rate | Abnormal livestock mortality in year t divided by total livestock in year t − 1 | Livelihood disruption ratio; dependent variable in M1 and origin-side intermediate variable in M5 |
| Out_Migration | Registered provincial out-migrants from NSO records; pooled z-standardized over all 550 observations for M2/M5; destination not identified | Origin-side registered migration pressure; dependent variable in M2 |
| In_Migration_UB | Registered migrants to Ulaanbaatar from NSO records | Prespecified M3 variable; not used in final inferential results |
| NTL | Canonical DMSP-OLS/VIIRS nighttime lights on a common log scale: mapped DMSP 2000–2012 and observed log1p(VIIRS) 2013–2024; no smoothing | Descriptive satellite proxy for settlement/activity intensity; fixed pooled z-score used only for longitudinal descriptive comparison and not in a final composite index. |
| Built-Up | Historical Landsat NDBI–NDVI threshold rule; audited against Dynamic World 2016–2024 | Methodological validation diagnostic only; failed transfer gate |
| UEI | Original planned composite of NTL, BuiltUp, and inverted ndvi_mean | Not retained after BuiltUp validation failure |
| Urban_Share | Administrative urban population share from NSO | Administrative urbanization measure; retained descriptively, not used in a final Mismatch Index |
| Mismatch Index | Original planned difference between standardized UEI and Urban_Share | Not computed/reported in final evidence |
| RealGDP_pc | Provincial real GDP per capita from NSO | Economic control variable |
| Road_Density | Road length divided by provincial area | Infrastructure control variable |
| Mining_Province | Binary indicator for major mining-intensive provinces | Structural control for mining-related differences |
Table 3.
Descriptive statistics of key variables, 2000–2024.
Table 3.
Descriptive statistics of key variables, 2000–2024.
| Variable | Mean | Std. Dev. | Min | Max | Source |
|---|
| LivestockLoss, thousand animals | 103.5 | 201.5 | 0.0 | 1825.0 | NSO |
| Out_Migration, persons | 2216.1 | 1920.2 | 199.0 | 16,820.0 | NSO |
| In_Migration, persons | 2223.6 | 5986.8 | 1.0 | 41,592.0 | NSO |
| Net_Migration, persons | 7.6 | 4877.3 | −8136.0 | 40,246.0 | NSO |
| SPI_12 | 0.000 | 0.915 | −2.030 | 3.340 | CHIRPS |
| NDVI_anom, ecological stress proxy | 0.000 | 0.017 | −0.067 | 0.059 | MODIS |
| ndvi_mean, UEI component | 0.178 | 0.074 | 0.058 | 0.366 | MODIS |
| Dzud_Severity, 0–3 | 1.069 | 0.999 | 0.000 | 3.000 | NAMEM |
| NTL, Sum-of-Lights | 0.446 | 1.020 | 0.001 | 7.188 | DMSP-VIIRS |
Table 4.
M1: NDVI anomaly and livestock mortality.
Table 4.
M1: NDVI anomaly and livestock mortality.
| Variable | Spec. 1: Lagged Baseline | Spec. 2: + SPI_12 and Dzud_Severity | Spec. 3: Contemporaneous |
|---|
| L1_NDVI_anom | −0.01481 ** (0.00617) | −0.01370 ** (0.00621) | |
| NDVI_anom, current year | | | 0.00329 (0.00529) |
| L1_SPI_12/L1_Dzud_Severity | | −0.00784 (0.00730)/0.00454 ** (0.00215) | |
| Controls | Yes | Yes | Yes |
| Province fixed effects | Yes | Yes | Yes |
| Year fixed effects | Yes | Yes | Yes |
| Observations | 504 | 504 | 504 |
Table 5.
M2: Livestock loss and out-migration pressure.
Table 5.
M2: Livestock loss and out-migration pressure.
| Variable | Push Model 1 | Push Model 2 |
|---|
| L1_LivestockLoss_rate | 1.067 *** (0.314) | 1.113 *** (0.319) |
| L1_SPI_12 | 0.018 (0.035) | 0.003 (0.031) |
| L1_NDVI_anom | −0.039 (0.024) | −0.038 (0.024) |
| L1_RealGDP_pc | | 0.0000178 *** (0.0000062) |
| Province fixed effects | Yes | Yes |
| Year fixed effects | Yes | Yes |
| Observations | 504 | 504 |
Table 6.
Mediation-oriented product diagnostics: NDVI_anom, LivestockLoss_ratio, and Out_Migration_z.
Table 6.
Mediation-oriented product diagnostics: NDVI_anom, LivestockLoss_ratio, and Out_Migration_z.
| Measure | Estimate | Interpretation |
|---|
| Path a: L1_NDVI_anom to LivestockLoss_ratio | −0.01481 ** (SE = 0.00617) | Lower lagged NDVI_anom is associated with higher proportional livestock loss |
| Path b: L1_LivestockLoss_ratio to Out_Migration_z | 1.115 *** (SE = 0.318) | Higher prior-year livestock loss is associated with higher standardized registered out-migration pressure |
| Total association, c | −0.03790 | Reduced-form L1_NDVI_anom to Out_Migration_z association; p = 0.094 |
| Direct association, c′ | −0.03618 | L1_NDVI_anom coefficient with lagged livestock loss included; p = 0.105 |
| Product diagnostic, a × b | −0.01652 | Product of separately timed origin-side coefficients; not an exact mediated effect |
| Sobel Z/p-value | −1.981/0.0476 | Sampling diagnostic for a × b |
| Bootstrap 95% CI | [−0.02705, −0.00725] | 10,000-draw aimag-cluster bootstrap; seed 42 |
| Exact mediated share | Not reported | Different lag positions mean a × b ≠ c − c′; an exact mediation percentage is not identified |
Table 7.
BuiltUp classifier development diagnostics under leakage-safe leave-one-ADM1-out evaluation.
Table 7.
BuiltUp classifier development diagnostics under leakage-safe leave-one-ADM1-out evaluation.
| Candidate | Balanced Accuracy | MCC | Recall | Specificity | Key Error |
|---|
| Frozen original | 0.4741 | −0.0530 | 0.3631 | 0.5852 | Bare→built FPR = 0.9491 |
| Benchmark 1/Candidate 4 | 0.8156 | 0.6312 | 0.8215 | 0.8097 | Crop→built FPR = 0.5677 |
| Candidate B/two-stage | 0.6677 | 0.3532 | 0.5114 | 0.8240 | Bare = 0.3474; crop = 0.0592; grass = 0.0795 |
Table 8.
Downstream analytical decisions following the BuiltUp validation gate.
Table 8.
Downstream analytical decisions following the BuiltUp validation gate.
| Output/Analysis | Dependency | Validation Status | Status in Final Analysis | Future Prerequisite |
|---|
| Historical BuiltUp panel | Direct BuiltUp measure | Failed transfer validation | Excluded from validated evidence | Context-aware historical reconstruction |
| UEI | Includes BuiltUp as a direct component | Invalid input | Not reported | Validated BuiltUp or a separately prespecified urban construct |
| Mismatch Index | Depends on UEI | Invalid input | Not reported | Valid satellite urbanization construct |
| M3/H3 | UEI/BuiltUp primary outcome | Invalid primary outcome; short time series | Not evaluated | Valid urban outcome and prespecified small-sample design |
| M4 + alternative W | UEI dependent variable | Invalid dependent variable | Not re-estimated/not retained | Valid urban outcome, followed by spatial-weight robustness |
Table 9.
Leave-one-province-out sensitivity analysis.
Table 9.
Leave-one-province-out sensitivity analysis.
| Relationship | Mean β | Min β | Max β | % p < 0.05 | % Same Sign |
|---|
| L1_NDVI_anom → LivestockLoss_ratio | −0.01479 | −0.01619 | −0.01278 | 100.0% | 100.0% |
| L1_LivestockLoss_ratio → Out_Migration_z | 1.113 | 1.021 | 1.275 | 100.0% | 100.0% |
| Reduced form: L1_NDVI_anom → Out_Migration_z | −0.03792 | −0.04584 | −0.03170 | 4.8% | 100.0% |
| Disclaimer/Publisher’s Note: The statements, opinions and data contained in all publications are solely those of the individual author(s) and contributor(s) and not of MDPI and/or the editor(s). MDPI and/or the editor(s) disclaim responsibility for any injury to people or property resulting from any ideas, methods, instructions or products referred to in the content. |




 ,
,