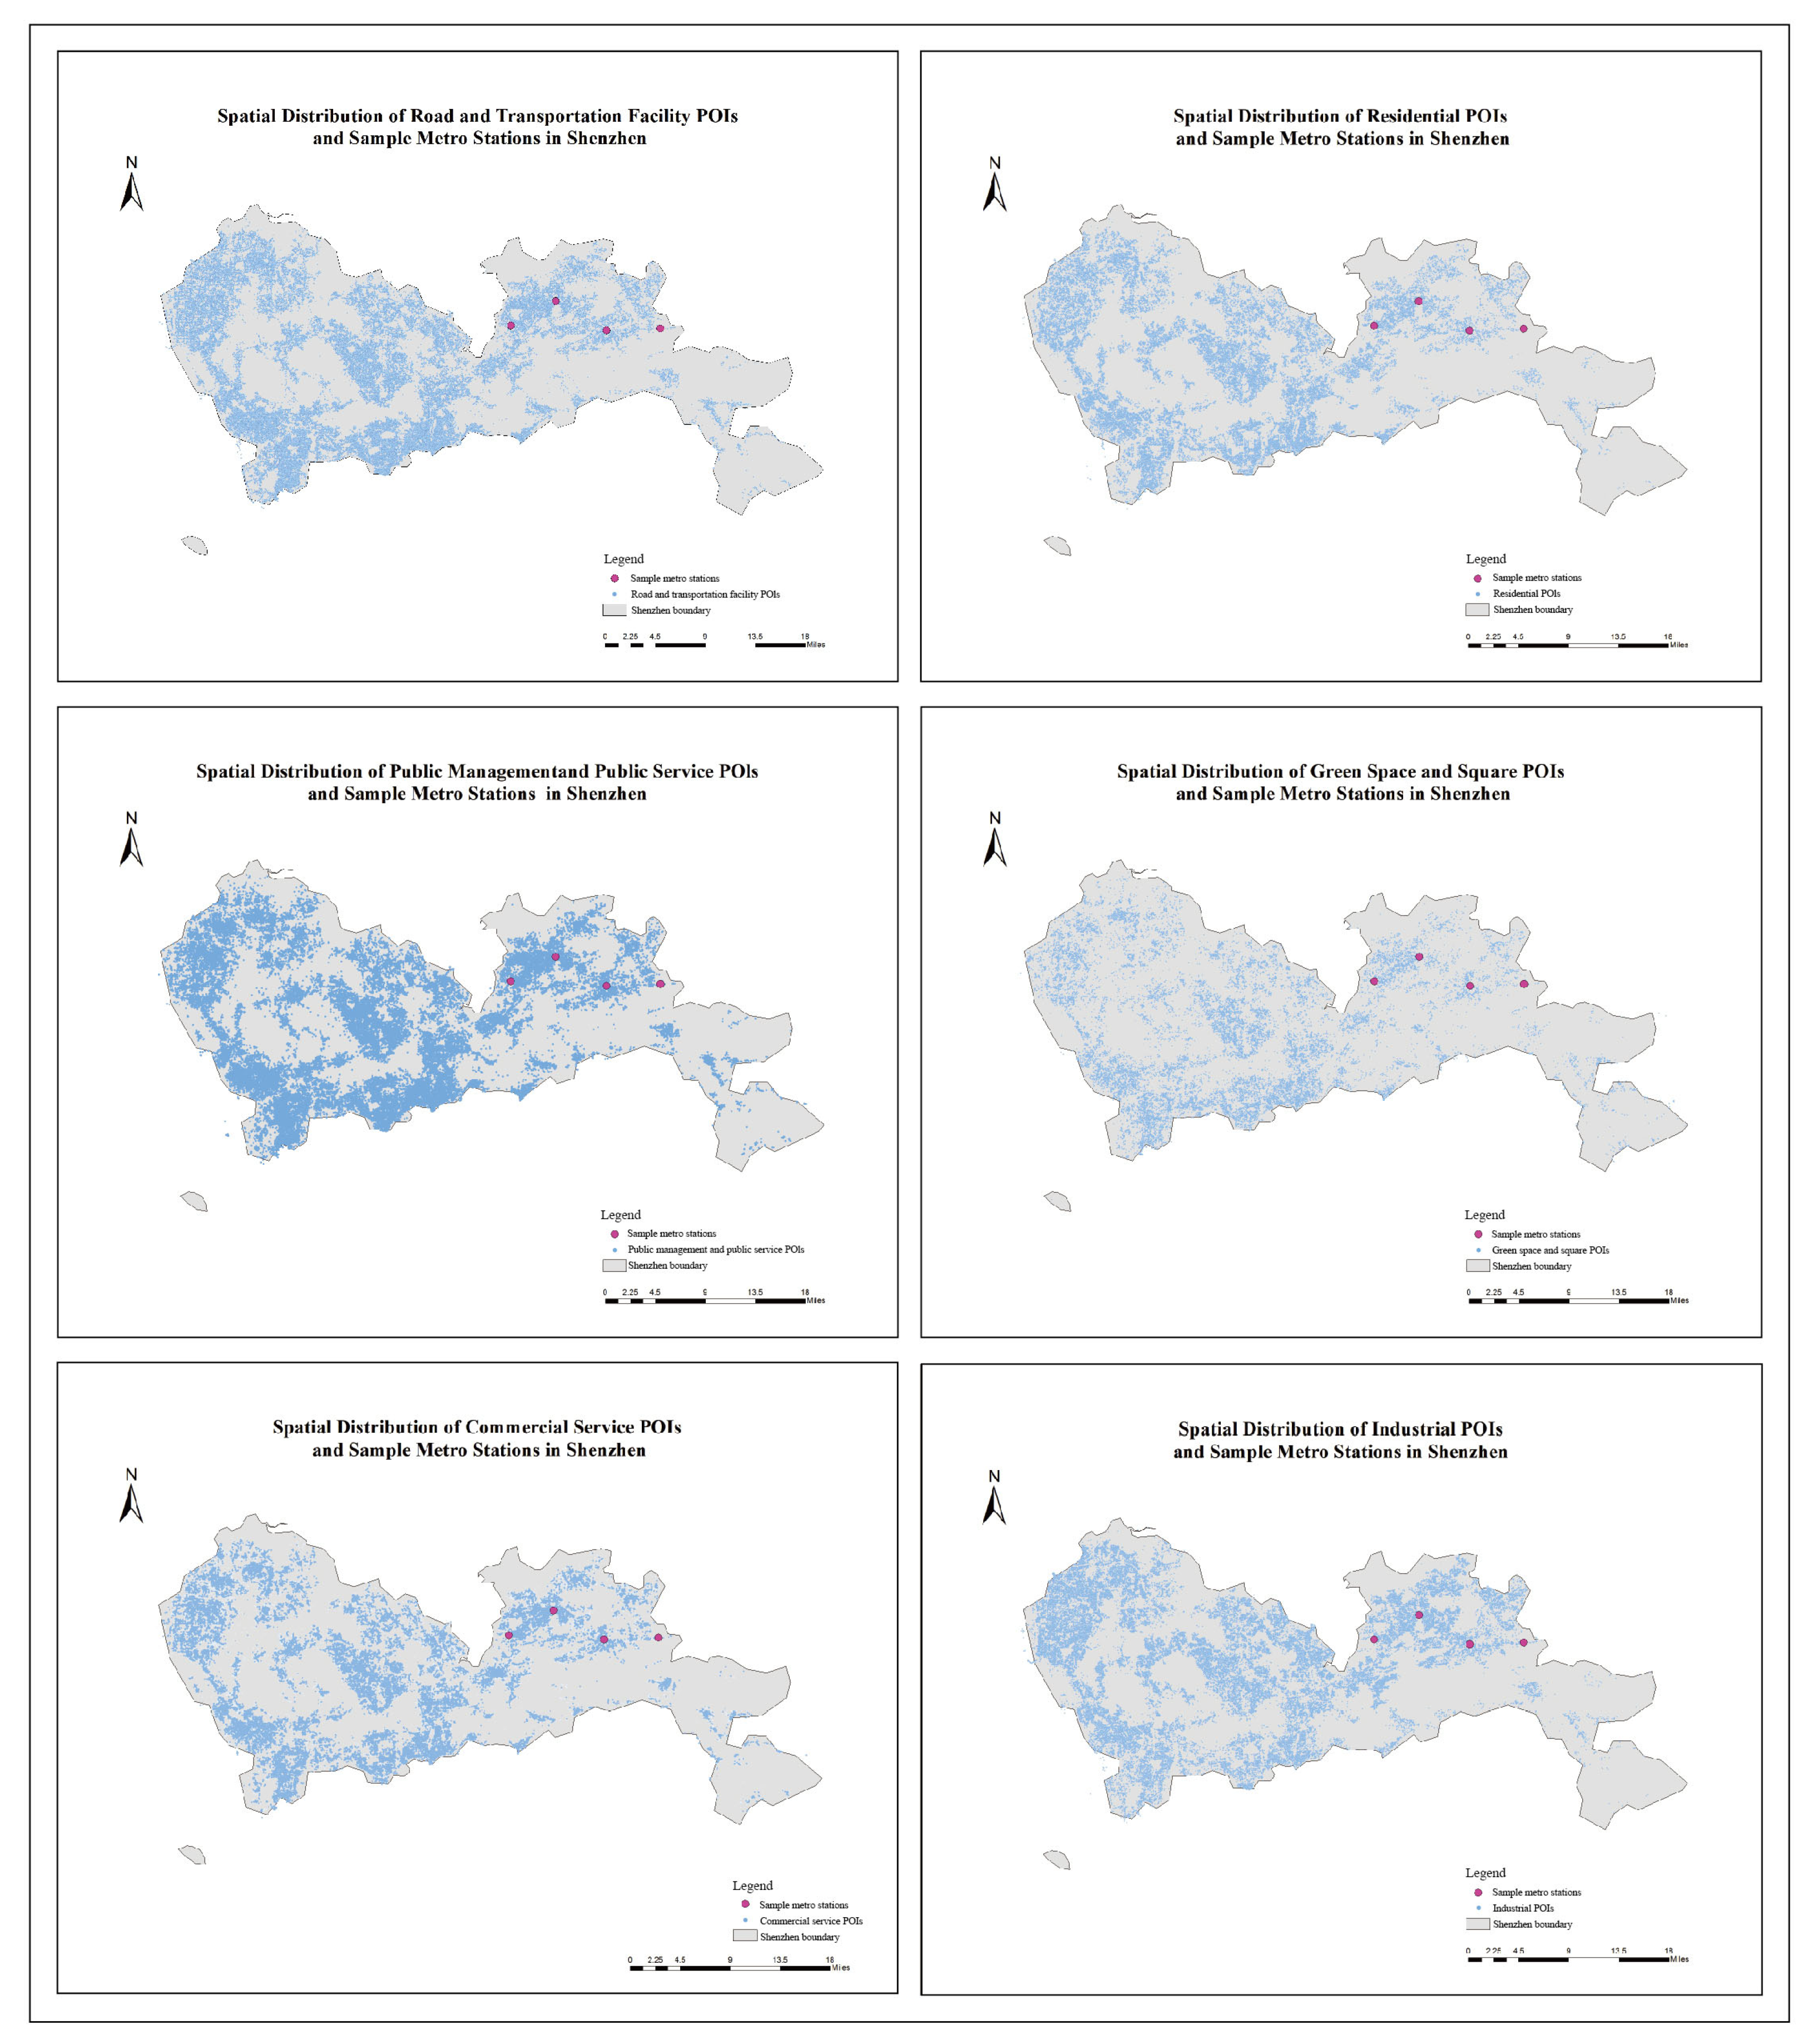
Constructing an Evaluation Framework and Developing Optimization Strategies for Public Cultural Service Spaces in Metro Station Areas: A Scene Theory
Abstract
1. Introduction
2. Literature Review
2.1. Scene Attributes of Public Cultural Service Spaces in Metro Station Areas
2.2. Applicability of Scene Theory for Evaluating Cultural Spaces in Metro Station Areas
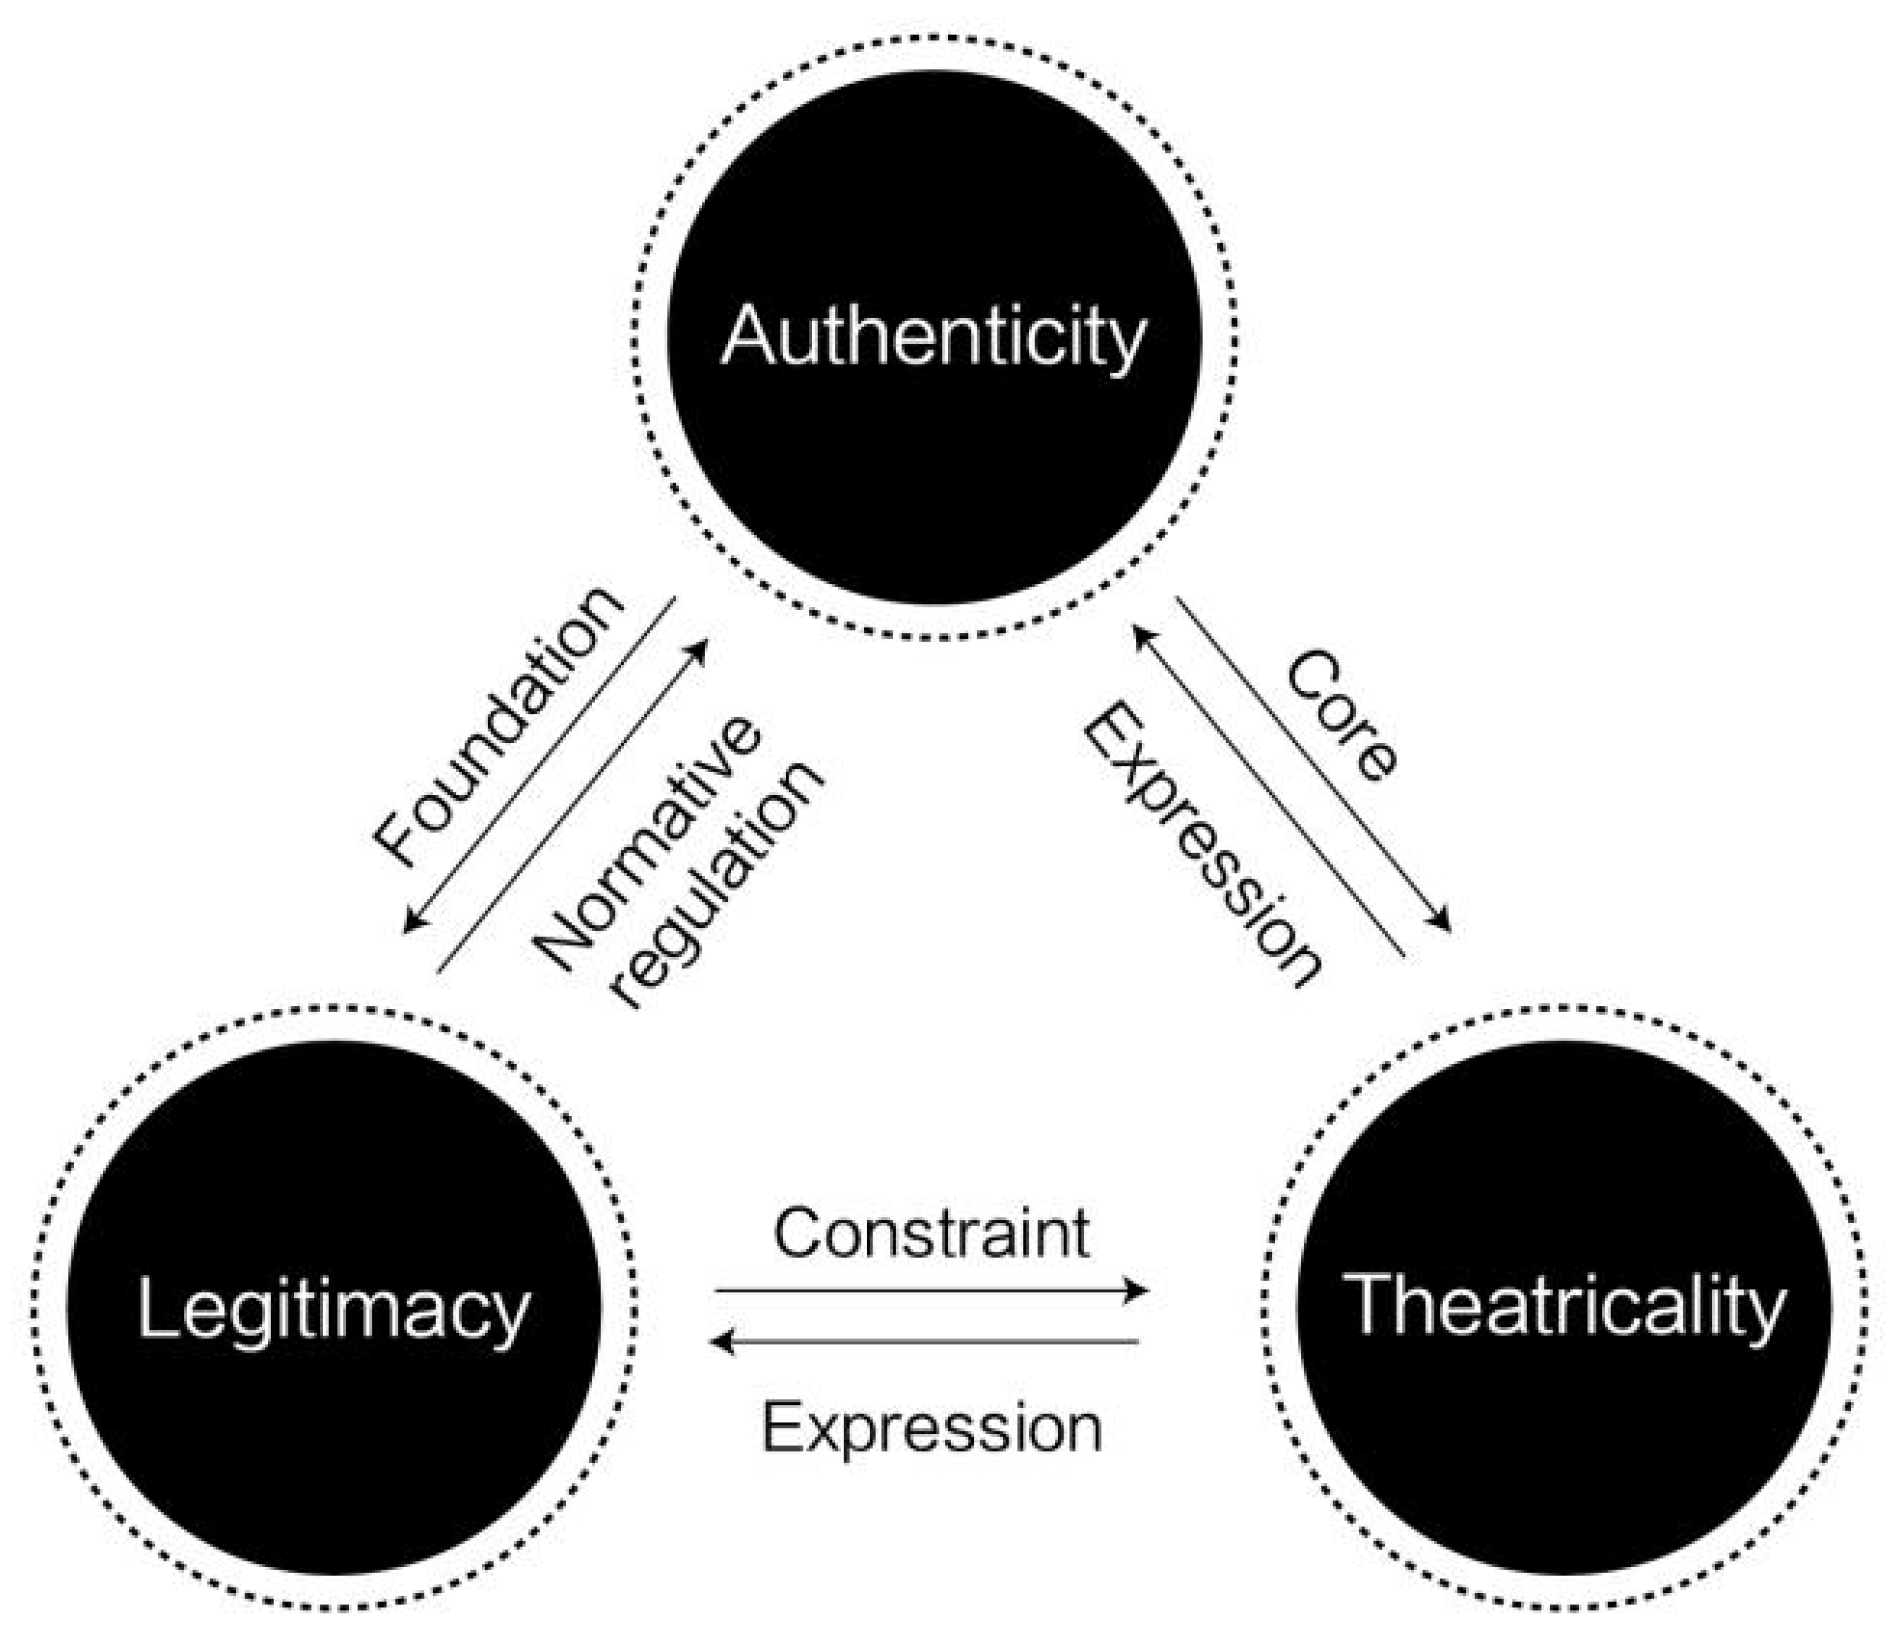
2.3. Development of Evaluation Dimensions Based on Scene Theory
2.4. Determination and Operational Definitions of Evaluation Indicators
3. Research Design and Methods
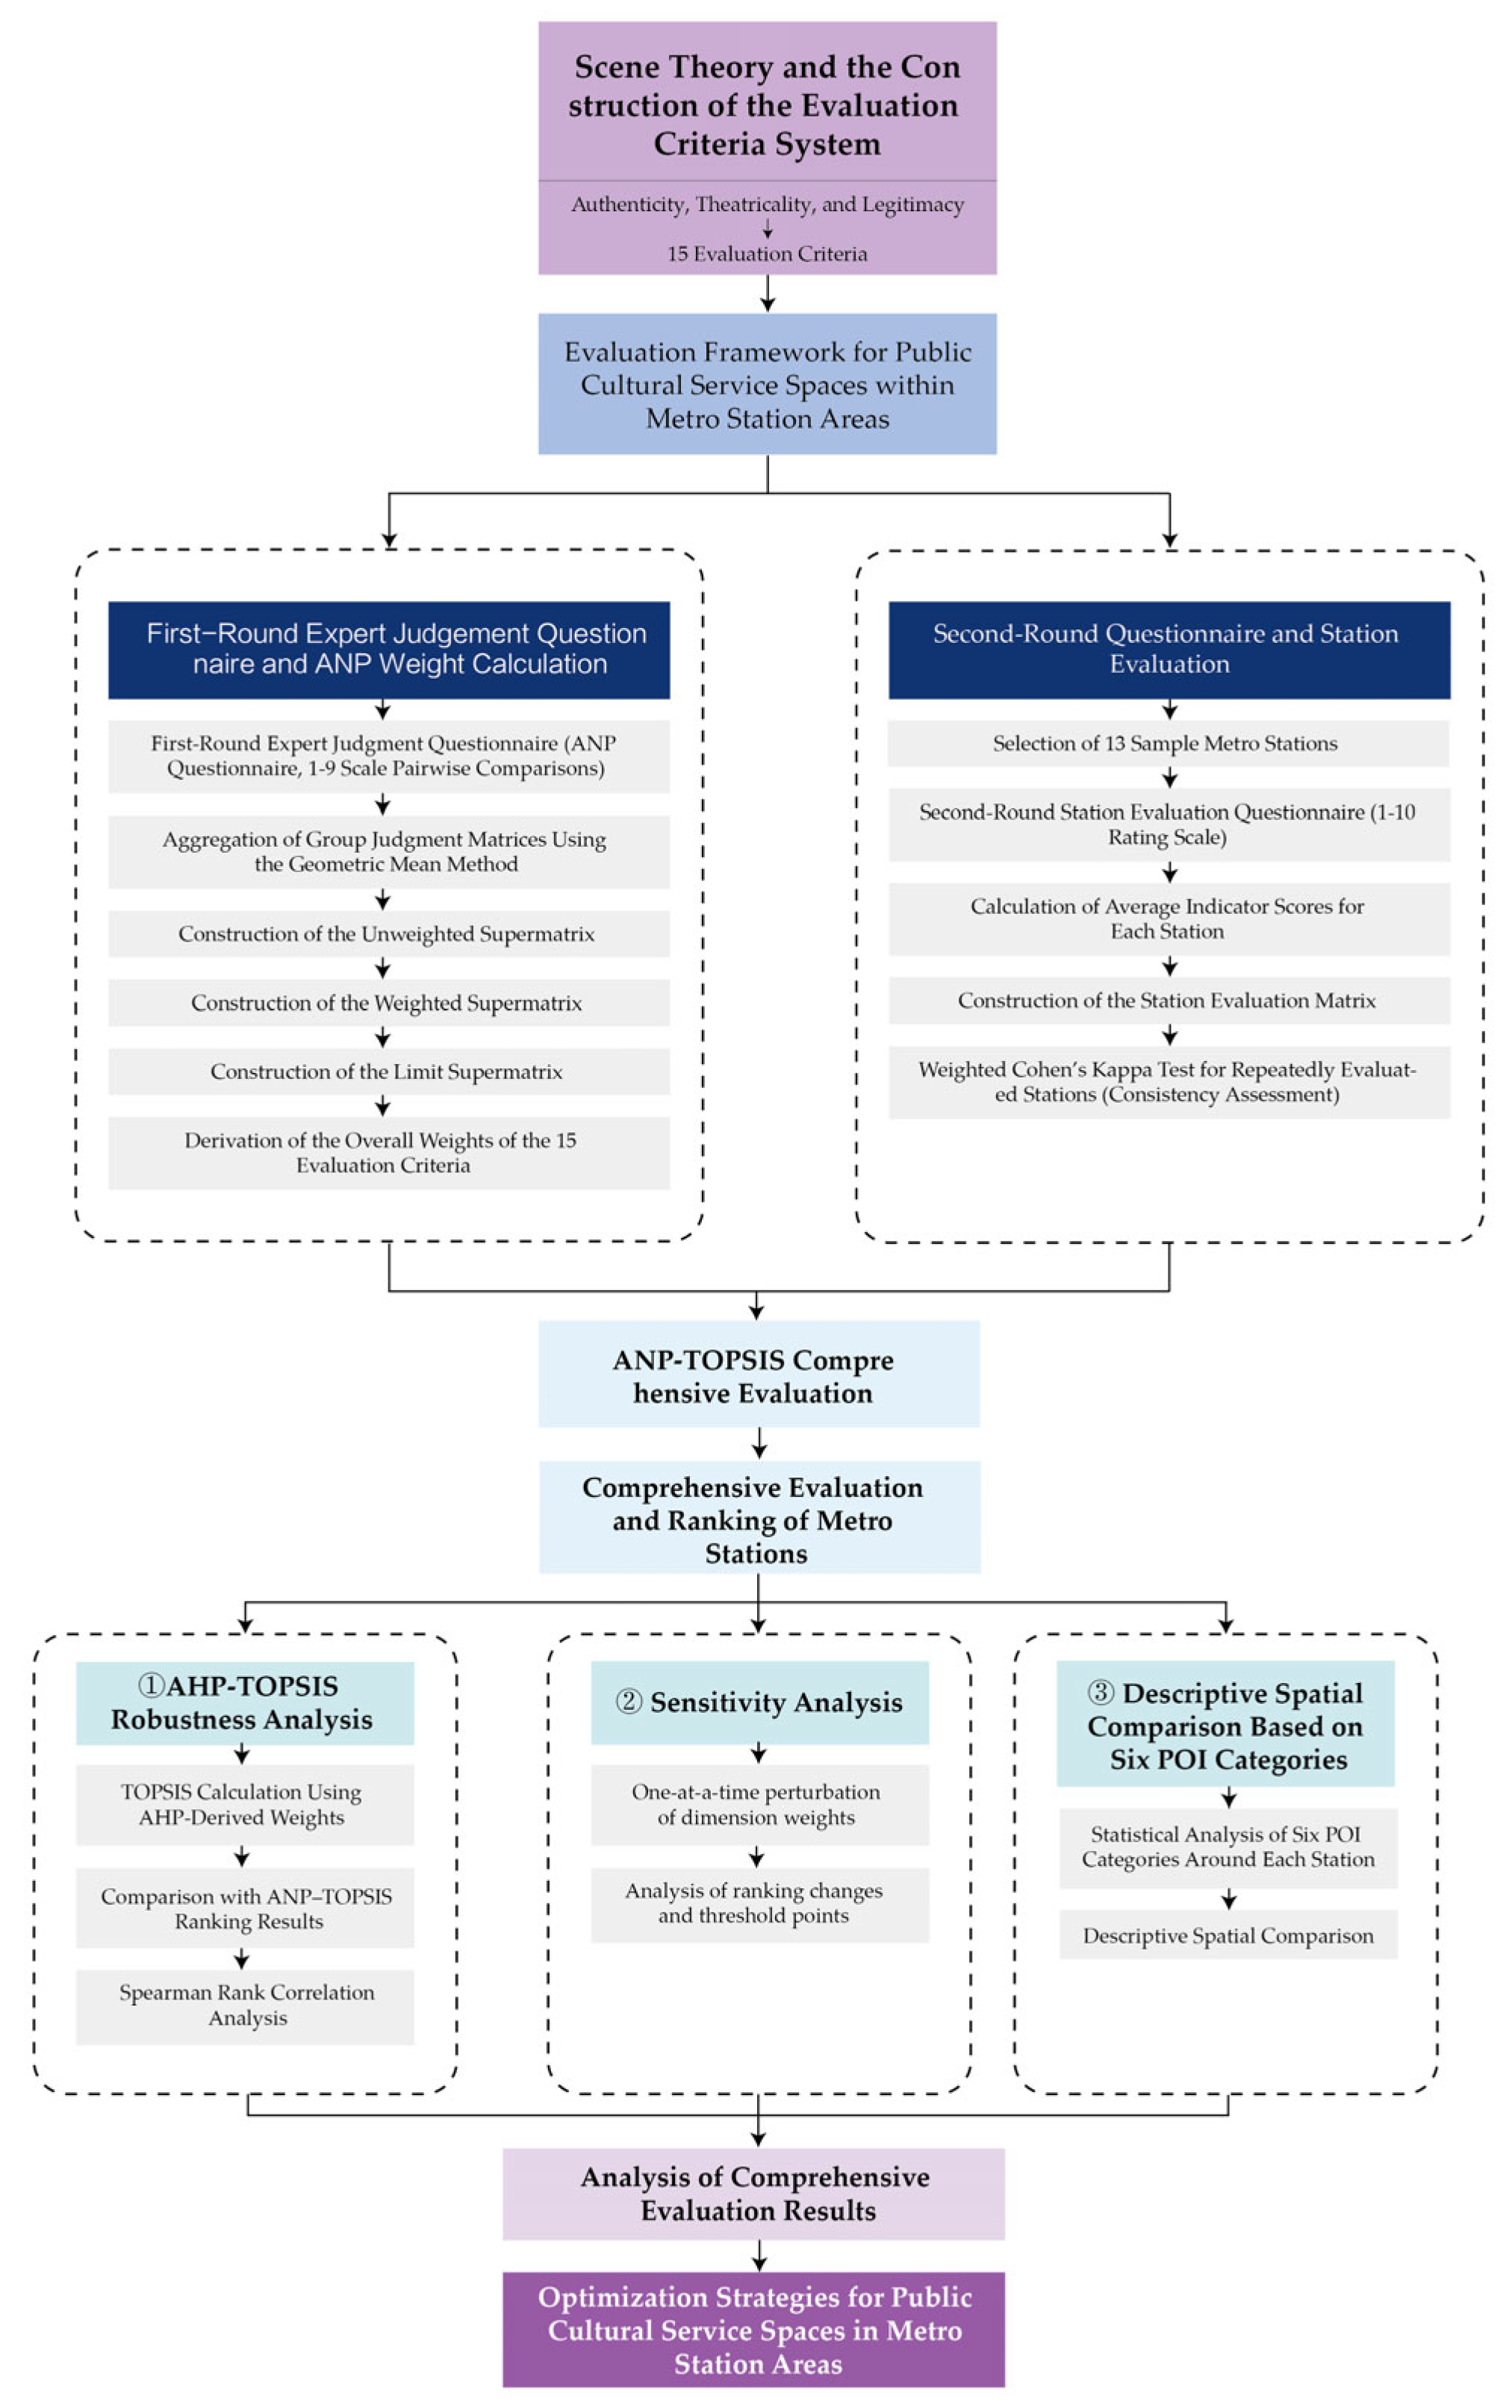
3.1. Research Process
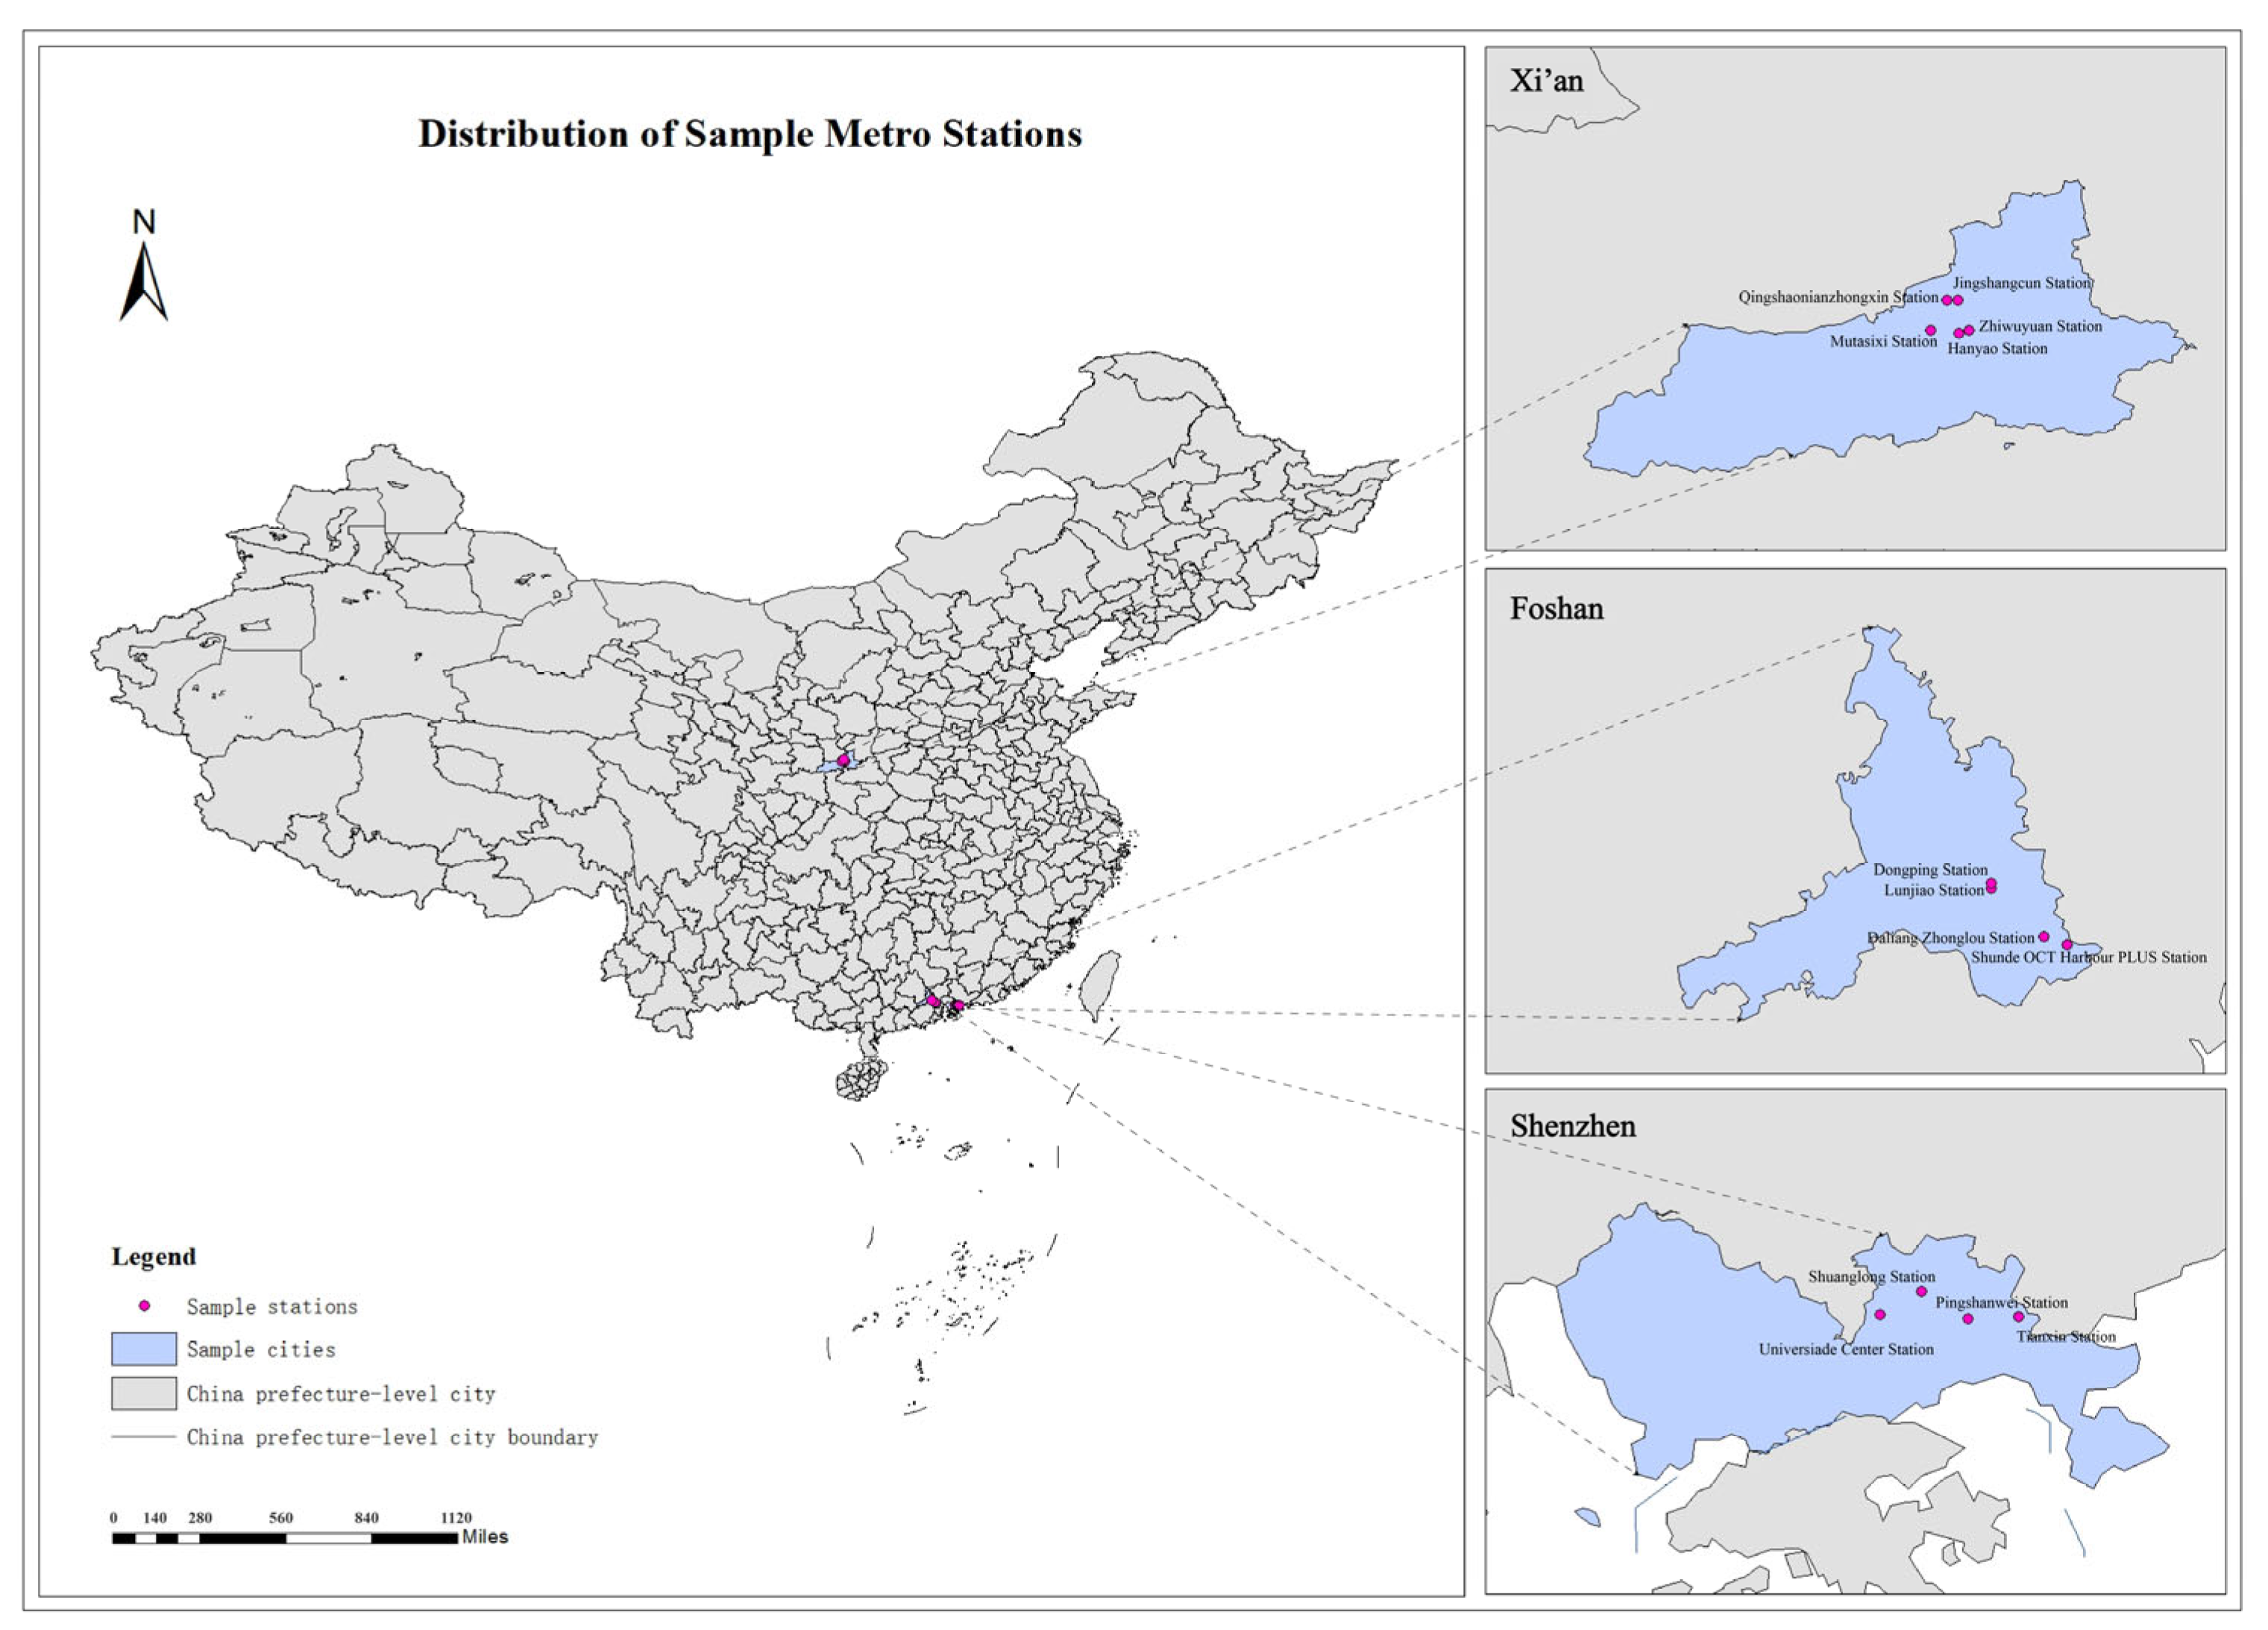
3.2. Case Study Sites and Data Sources
3.3. Two-Round Questionnaire Design and Data Collection
3.4. Weight Calculation and Comprehensive Evaluation Methods
3.4.1. ANP-Based Weight Calculation
- Step 1: Construction of Pairwise Comparison Matrices
- Step 2: Aggregation of Group Judgment Matrices
- Step 3: Derivation of Local Priority Weights
- Step 4: Construction of the Unweighted Supermatrix
- Step 5: Construction of the Weighted Supermatrix
- Step 6: Derivation of the Limit Supermatrix and Final Weights
3.4.2. TOPSIS-Based Comprehensive Evaluation
- Step 1: Construction of the Decision Matrix
- Step 2. Normalization of the Original Evaluation Matrix
- Step 3. Construction of the Weighted Normalized Matrix
- Step 4. Determination of the Positive and Negative Ideal Solutions
- Step 5. Calculation of the Distances from the Positive and Negative Ideal Solutions
- Step 6. Calculation of the Relative Closeness Coefficient
3.4.3. Robustness Test
3.4.4. Sensitivity Analysis
4. Results
4.1. ANP Weight Results
4.2. ANP–AHP Robustness and Sensitivity Tests
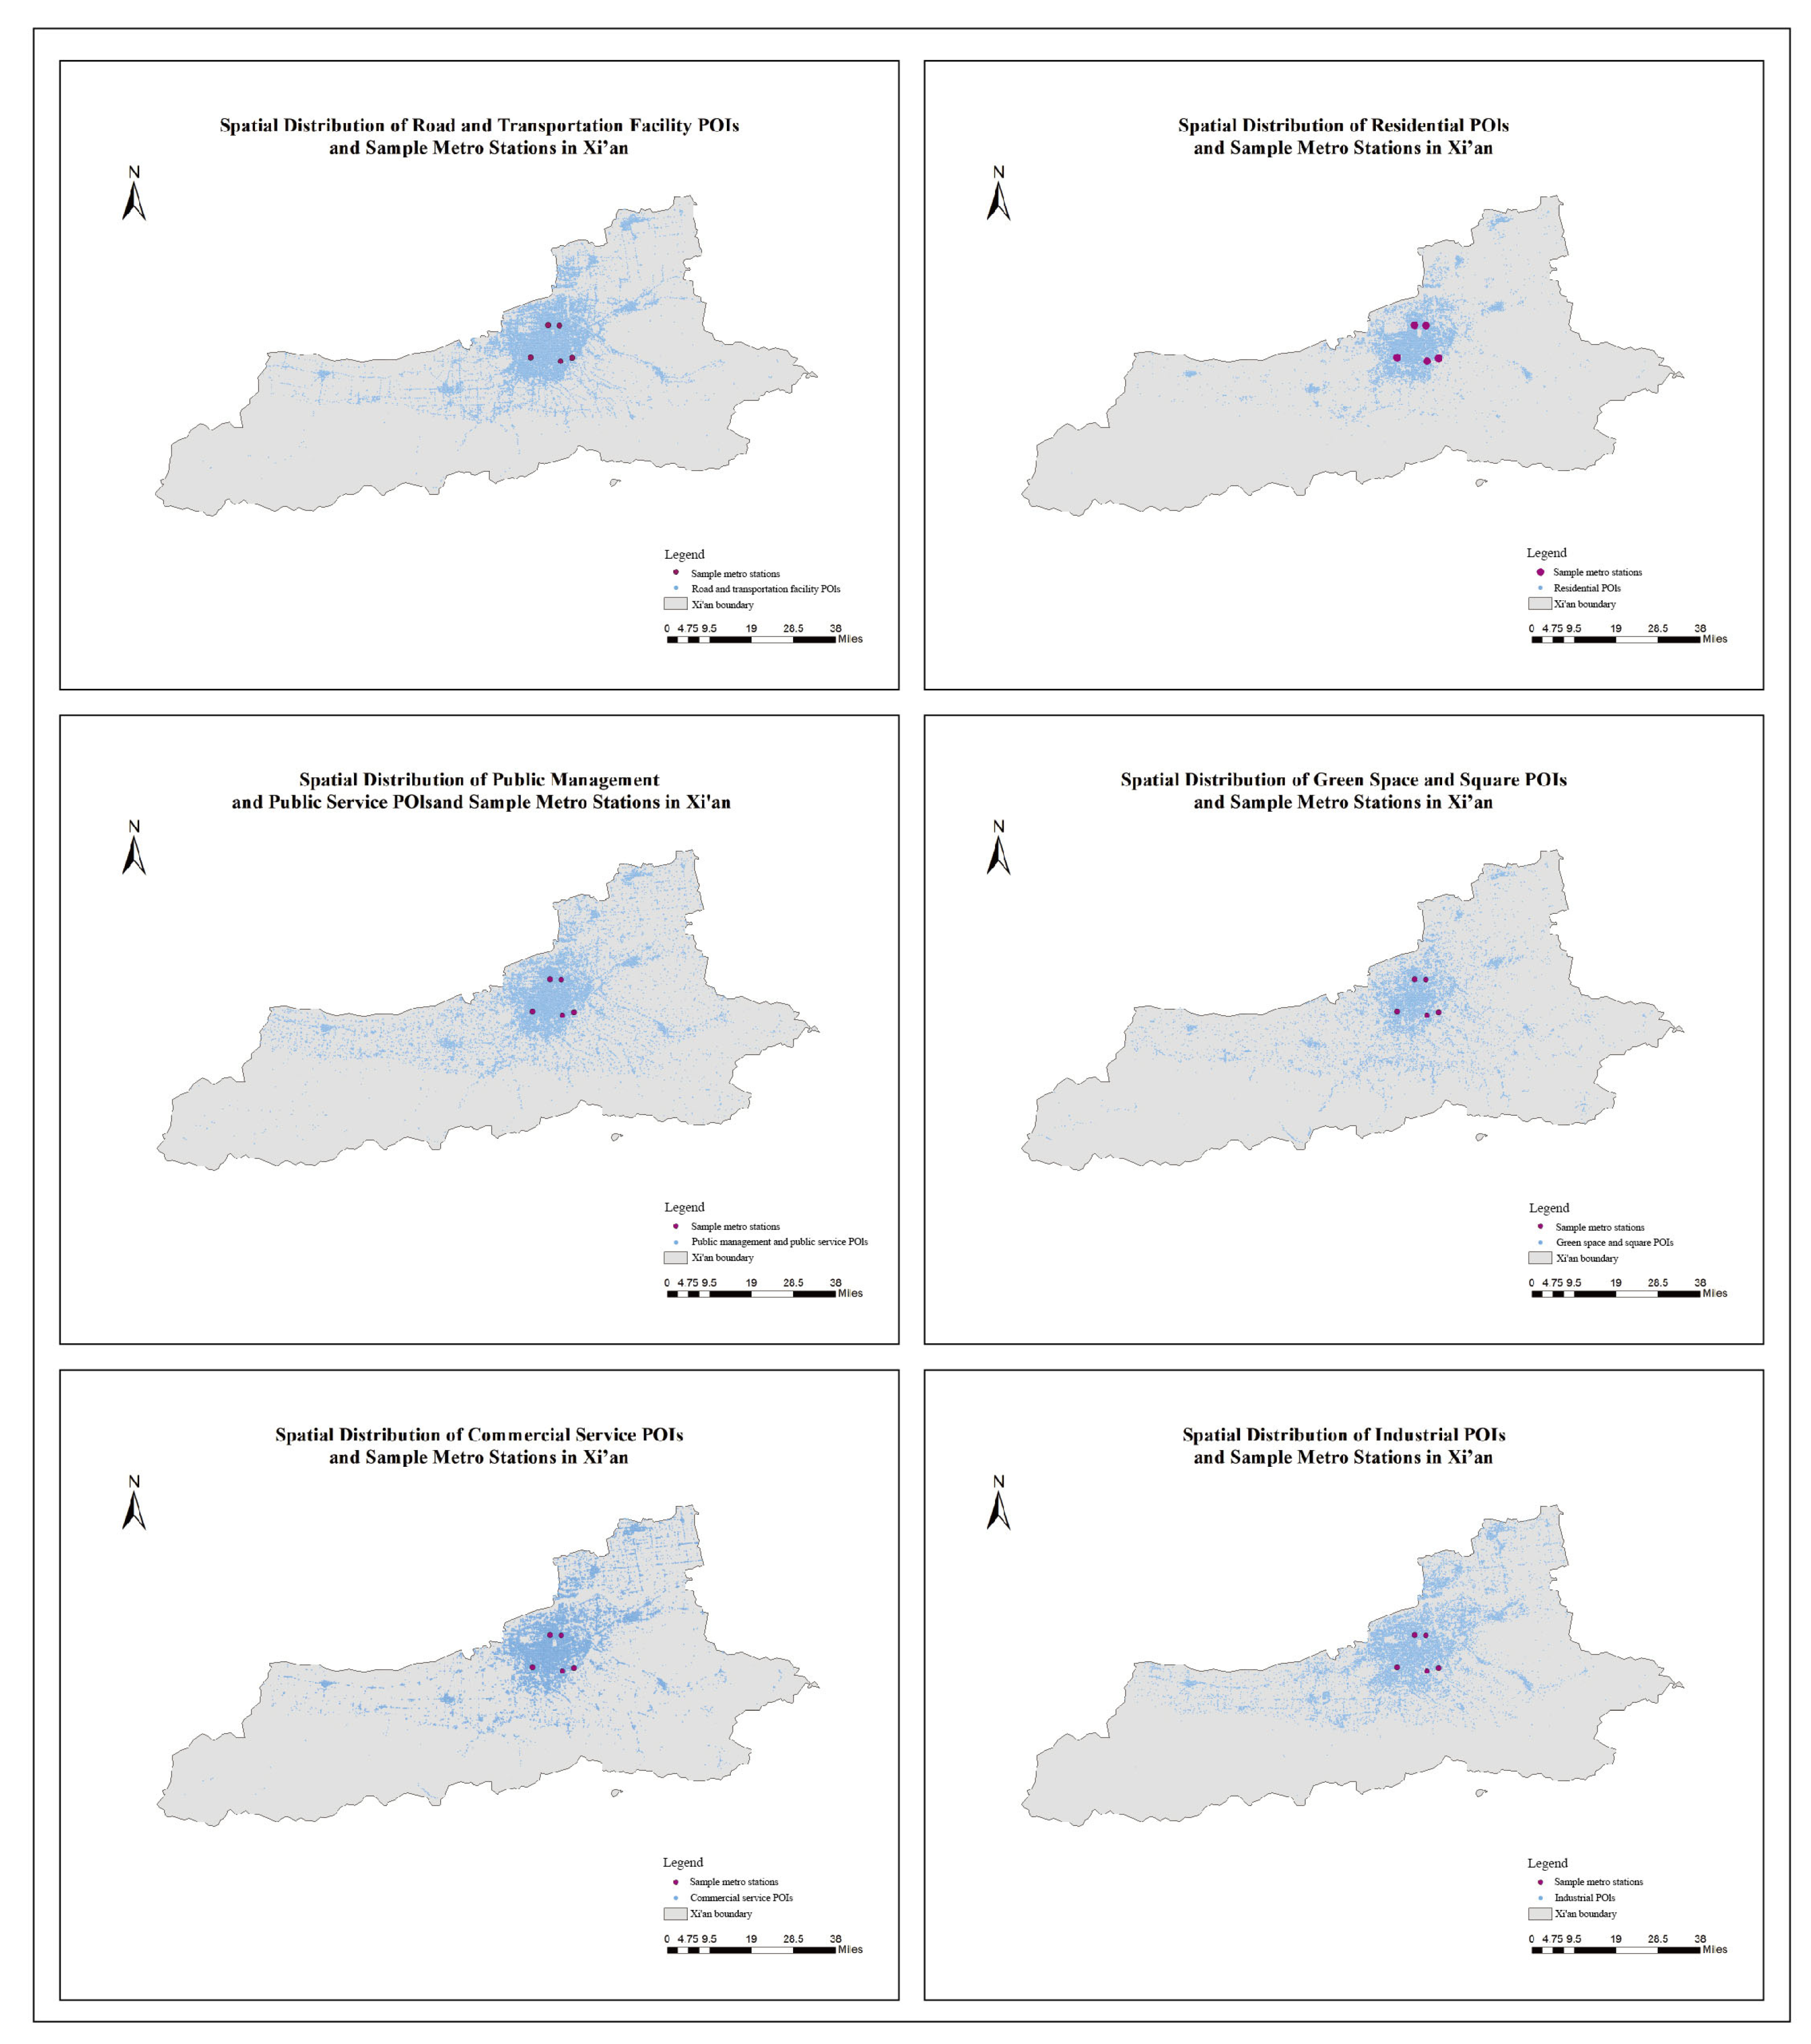
4.3. Comprehensive Evaluation Differences Among Sampled Stations and Descriptive Comparison of Built Environments
5. Discussion
5.1. Interpretation and Extension of Scene Theory in Metro Station Public Cultural Service Spaces
5.2. Optimization Strategies Based on Evaluation Results
6. Conclusions
6.1. Main Findings
6.2. Theoretical, Methodological, and Practical Contributions
6.3. Limitations and Future Research
Author Contributions
Funding
Institutional Review Board Statement
Data Availability Statement
Conflicts of Interest
Abbreviations
| ANP | Analytic Network Process |
| TOPSIS | Technique for Order Preference by Similarity to Ideal Solution |
| AHP | Analytic Hierarchy Process |
| POI | Point of interest |
| TOD | Transit-Oriented Development |
| PRD | Pearl River Delta |
| GBA | Greater Bay Area |
| OAT | One-at-a-Time |
Appendix A

| ANP | A1 | A2 | A3 | A4 | A5 | B1 | B2 | B3 | B4 | B5 | C1 | C2 | C3 | C4 | C5 |
|---|---|---|---|---|---|---|---|---|---|---|---|---|---|---|---|
| A1 | 1.000 | 0.000 | 0.000 | 0.000 | 0.000 | 0.063 | 0.075 | 0.030 | 0.024 | 0.046 | 0.035 | 0.037 | 0.053 | 0.059 | 0.064 |
| A2 | 0.000 | 1.000 | 0.000 | 0.000 | 0.000 | 0.079 | 0.094 | 0.038 | 0.030 | 0.057 | 0.036 | 0.038 | 0.055 | 0.061 | 0.066 |
| A3 | 0.000 | 0.000 | 1.000 | 0.000 | 0.000 | 0.053 | 0.063 | 0.025 | 0.020 | 0.038 | 0.031 | 0.034 | 0.048 | 0.054 | 0.059 |
| A4 | 0.000 | 0.000 | 0.000 | 1.000 | 0.000 | 0.027 | 0.033 | 0.013 | 0.011 | 0.020 | 0.011 | 0.011 | 0.016 | 0.018 | 0.020 |
| A5 | 0.000 | 0.000 | 0.000 | 0.000 | 1.000 | 0.042 | 0.050 | 0.020 | 0.016 | 0.030 | 0.027 | 0.029 | 0.042 | 0.046 | 0.050 |
| B1 | 0.098 | 0.096 | 0.075 | 0.034 | 0.035 | 1.000 | 0.000 | 0.000 | 0.000 | 0.000 | 0.048 | 0.052 | 0.074 | 0.082 | 0.090 |
| B2 | 0.081 | 0.080 | 0.062 | 0.029 | 0.029 | 0.000 | 1.000 | 0.000 | 0.000 | 0.000 | 0.039 | 0.041 | 0.059 | 0.066 | 0.072 |
| B3 | 0.037 | 0.036 | 0.028 | 0.013 | 0.013 | 0.000 | 0.000 | 1.000 | 0.000 | 0.000 | 0.018 | 0.019 | 0.027 | 0.030 | 0.033 |
| B4 | 0.032 | 0.032 | 0.025 | 0.011 | 0.011 | 0.000 | 0.000 | 0.000 | 1.000 | 0.000 | 0.017 | 0.019 | 0.027 | 0.030 | 0.032 |
| B5 | 0.041 | 0.040 | 0.031 | 0.014 | 0.015 | 0.000 | 0.000 | 0.000 | 0.000 | 1.000 | 0.018 | 0.019 | 0.027 | 0.030 | 0.033 |
| C1 | 0.068 | 0.067 | 0.052 | 0.024 | 0.024 | 0.045 | 0.054 | 0.022 | 0.017 | 0.033 | 1.000 | 0.000 | 0.000 | 0.000 | 0.000 |
| C2 | 0.027 | 0.027 | 0.021 | 0.010 | 0.010 | 0.040 | 0.047 | 0.019 | 0.015 | 0.029 | 0.000 | 1.000 | 0.000 | 0.000 | 0.000 |
| C3 | 0.045 | 0.044 | 0.035 | 0.016 | 0.016 | 0.044 | 0.052 | 0.021 | 0.017 | 0.032 | 0.000 | 0.000 | 1.000 | 0.000 | 0.000 |
| C4 | 0.091 | 0.089 | 0.069 | 0.032 | 0.032 | 0.071 | 0.085 | 0.034 | 0.027 | 0.051 | 0.000 | 0.000 | 0.000 | 1.000 | 0.000 |
| C5 | 0.058 | 0.057 | 0.045 | 0.021 | 0.021 | 0.065 | 0.077 | 0.031 | 0.025 | 0.047 | 0.000 | 0.000 | 0.000 | 0.000 | 1.000 |
| Aample Station | A1 | A2 | A3 | A4 | A5 | B1 | B2 | B3 | B4 | B5 | C1 | C2 | C3 | C4 | C5 |
|---|---|---|---|---|---|---|---|---|---|---|---|---|---|---|---|
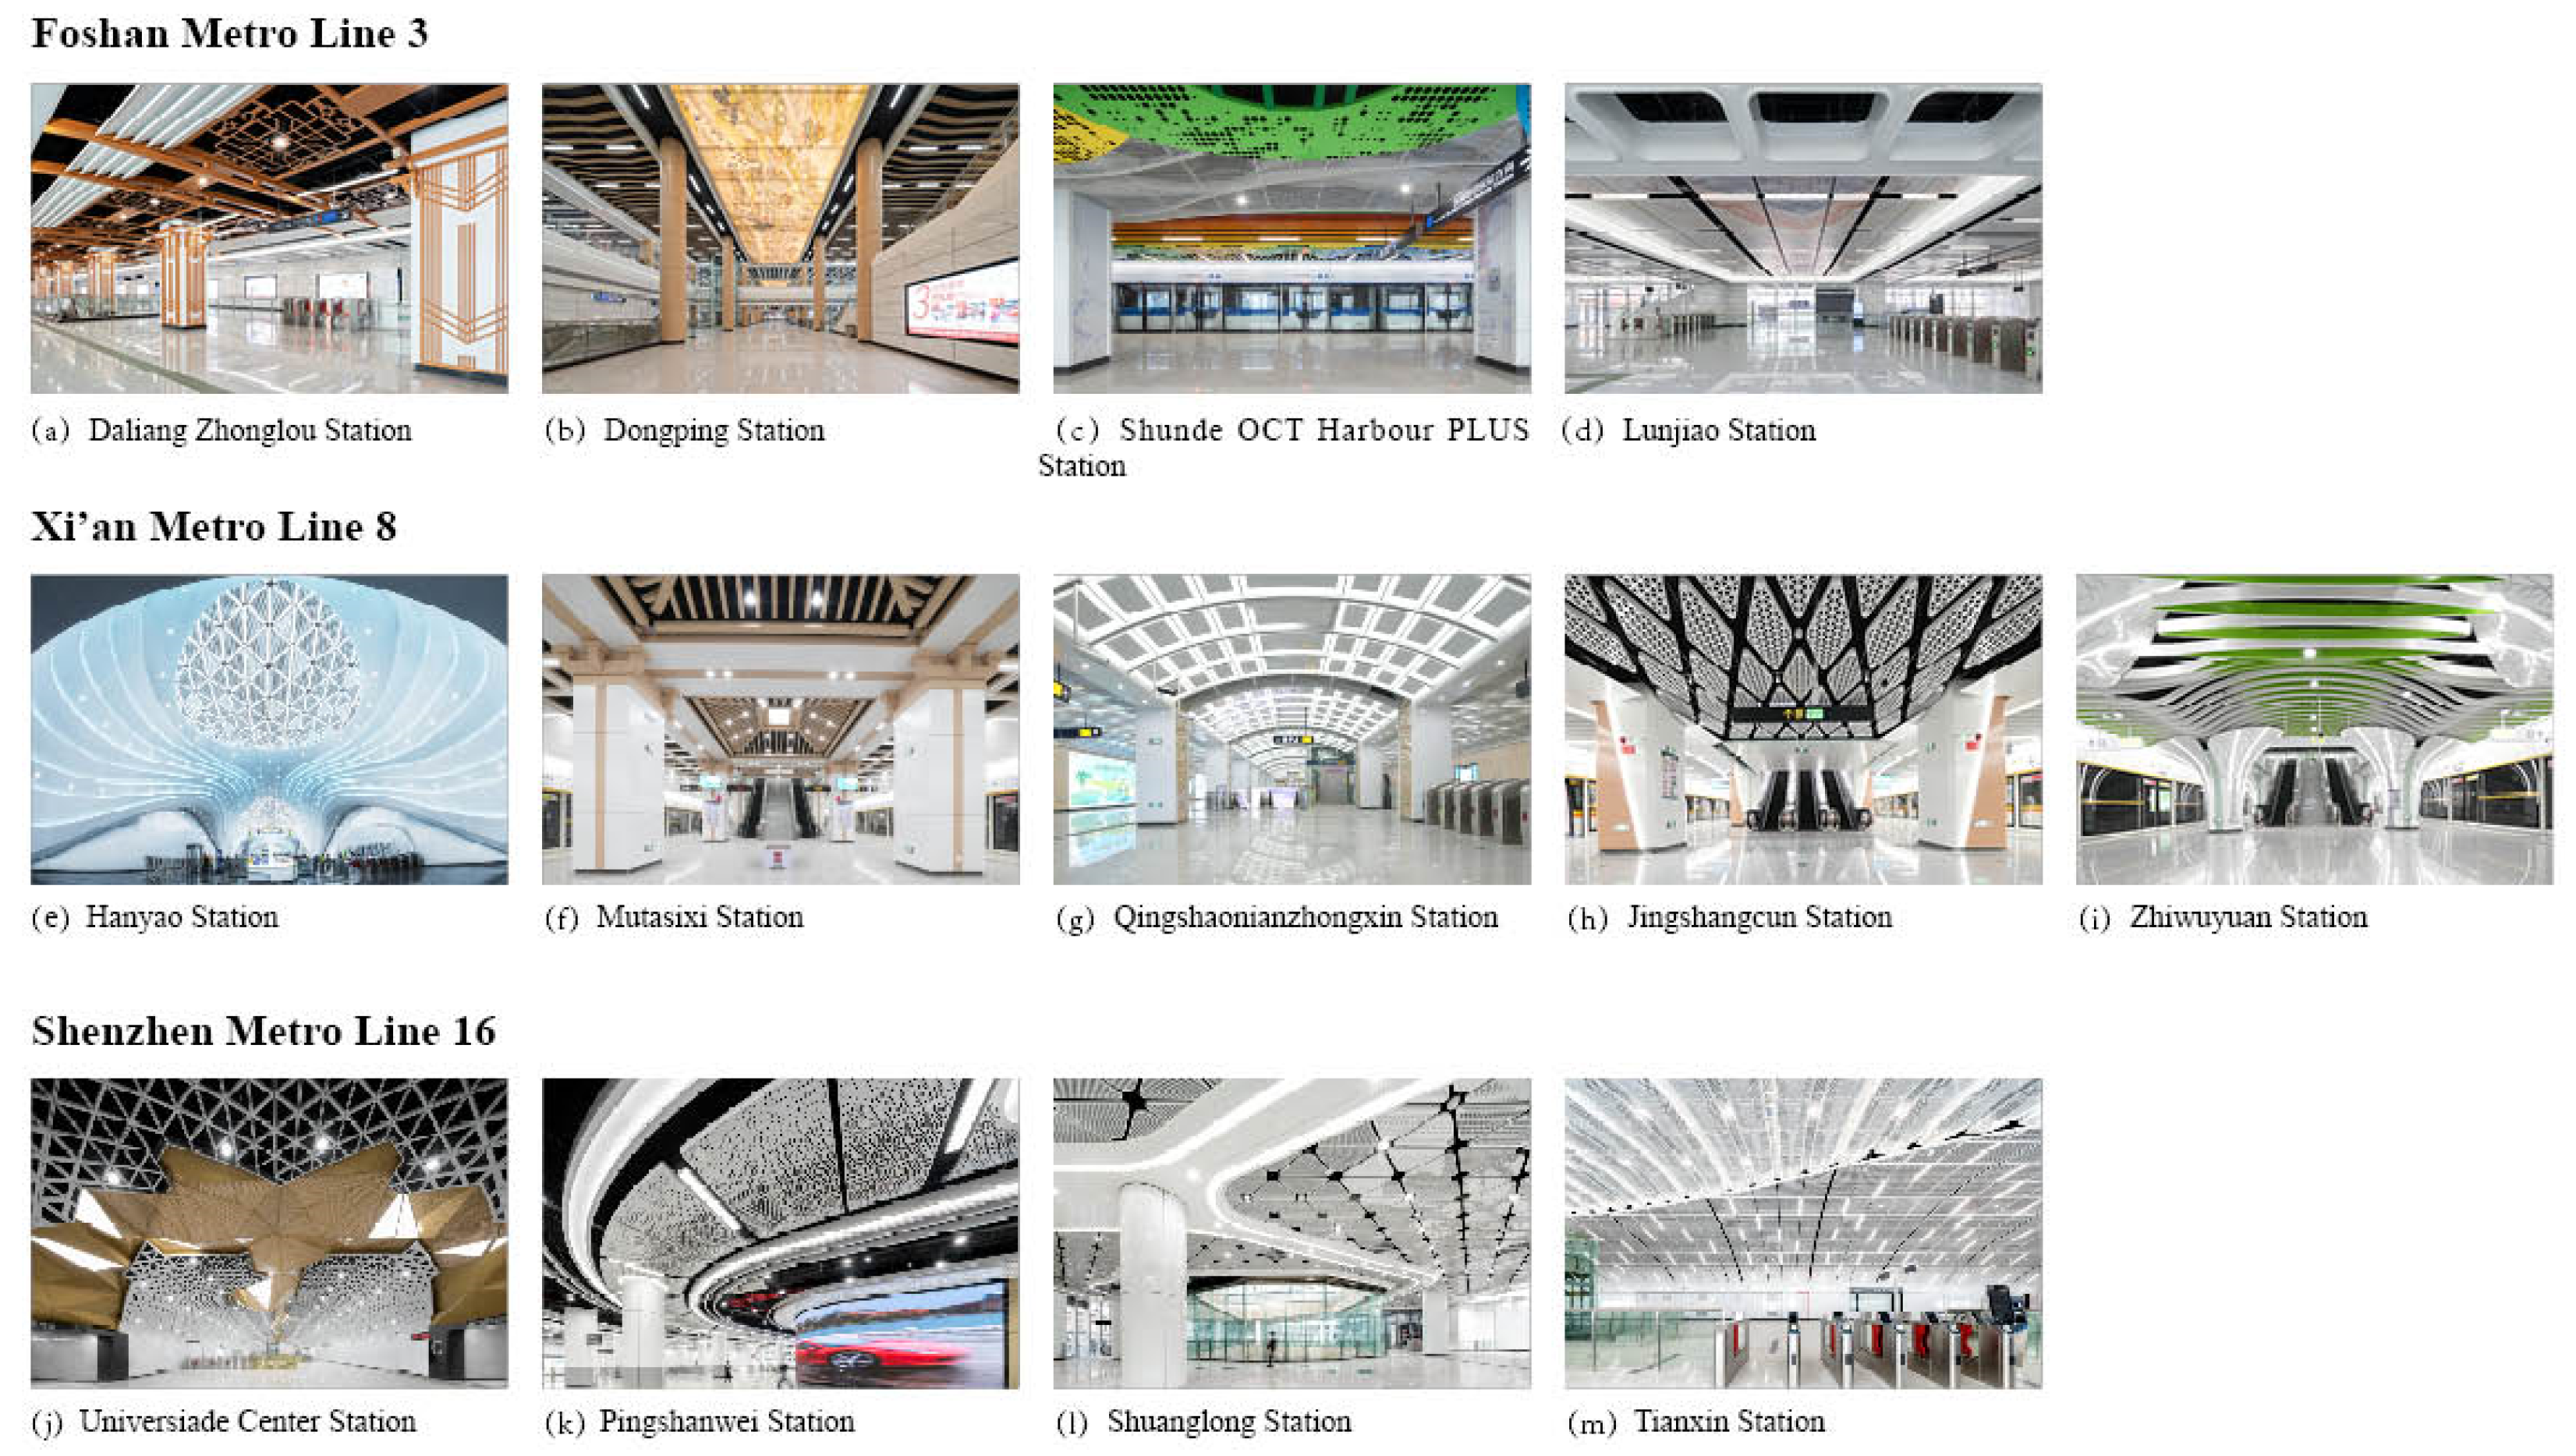
| Daliang Zhonglou Station | 8 | 8 | 7 | 5 | 6 | 8 | 7 | 6 | 5 | 5 | 8 | 8 | 8 | 8 | 7 |
| Dongping Station | 8 | 6 | 9 | 8 | 10 | 7 | 5 | 7 | 8 | 7 | 7 | 9 | 8 | 6 | 9 |
| 6 | 3 | 6 | 5 | 6 | 5 | 6 | 6 | 5 | 5 | 6 | 6 | 6 | 3 | 6 | |
| 5 | 5 | 5 | 5 | 5 | 4 | 5 | 4 | 4 | 4 | 6 | 8 | 5 | 5 | 5 | |
| 6 | 6 | 7 | 4 | 4 | 9 | 9 | 6 | 8 | 8 | 4 | 7 | 6 | 6 | 7 | |
| 5 | 5 | 7 | 7 | 4 | 4 | 3 | 8 | 5 | 8 | 7 | 6 | 5 | 5 | 7 | |
| Shunde OCT Harbour PLUS Station | 1 | 1 | 8 | 1 | 1 | 5 | 3 | 2 | 1 | 3 | 7 | 5 | 1 | 1 | 8 |
| Lunjiao Station | 1 | 1 | 8 | 1 | 5 | 2 | 2 | 2 | 2 | 5 | 8 | 4 | 1 | 1 | 8 |
| Hanyao Station | 10 | 10 | 8 | 8 | 8 | 8 | 6 | 7 | 8 | 7 | 8 | 8 | 10 | 10 | 8 |
| 8 | 4 | 6 | 2 | 8 | 10 | 10 | 9 | 5 | 4 | 1 | 9 | 8 | 4 | 6 | |
| 9 | 9 | 7 | 7 | 9 | 9 | 9 | 8 | 7 | 7 | 9 | 9 | 9 | 9 | 7 | |
| Mutasixi Station | 7 | 6 | 5 | 4 | 6 | 5 | 6 | 6 | 5 | 6 | 7 | 8 | 7 | 6 | 5 |
| Qingshaonianzhongxin Station | 10 | 10 | 10 | 10 | 10 | 9 | 7 | 9 | 7 | 9 | 8 | 9 | 10 | 10 | 10 |
| Jingshangcun Station | 8 | 8 | 8 | 8 | 6 | 5 | 7 | 7 | 7 | 7 | 8 | 8 | 8 | 8 | 8 |
| Zhiwuyuan Station | 8 | 6 | 6 | 4 | 4 | 7 | 8 | 7 | 7 | 6 | 6 | 6 | 8 | 6 | 6 |
| Universiade Center Station | 8 | 7 | 8 | 8 | 7 | 9 | 8 | 9 | 9 | 7 | 8 | 8 | 8 | 7 | 8 |
| 4 | 6 | 8 | 7 | 9 | 9 | 7 | 4 | 7 | 4 | 3 | 3 | 4 | 6 | 8 | |
| Pingshanwei Station | 10 | 7 | 6 | 8 | 8 | 10 | 10 | 8 | 7 | 10 | 10 | 6 | 10 | 7 | 6 |
| Shuanglong Station | 8 | 8 | 4 | 8 | 6 | 9 | 9 | 6 | 8 | 5 | 7 | 4 | 8 | 8 | 4 |
| 8 | 5 | 6 | 3 | 5 | 10 | 10 | 4 | 10 | 10 | 10 | 10 | 8 | 5 | 6 | |
| Tianxin Station | 8 | 8 | 8 | 8 | 9 | 9 | 10 | 9 | 10 | 9 | 6 | 6 | 8 | 8 | 8 |


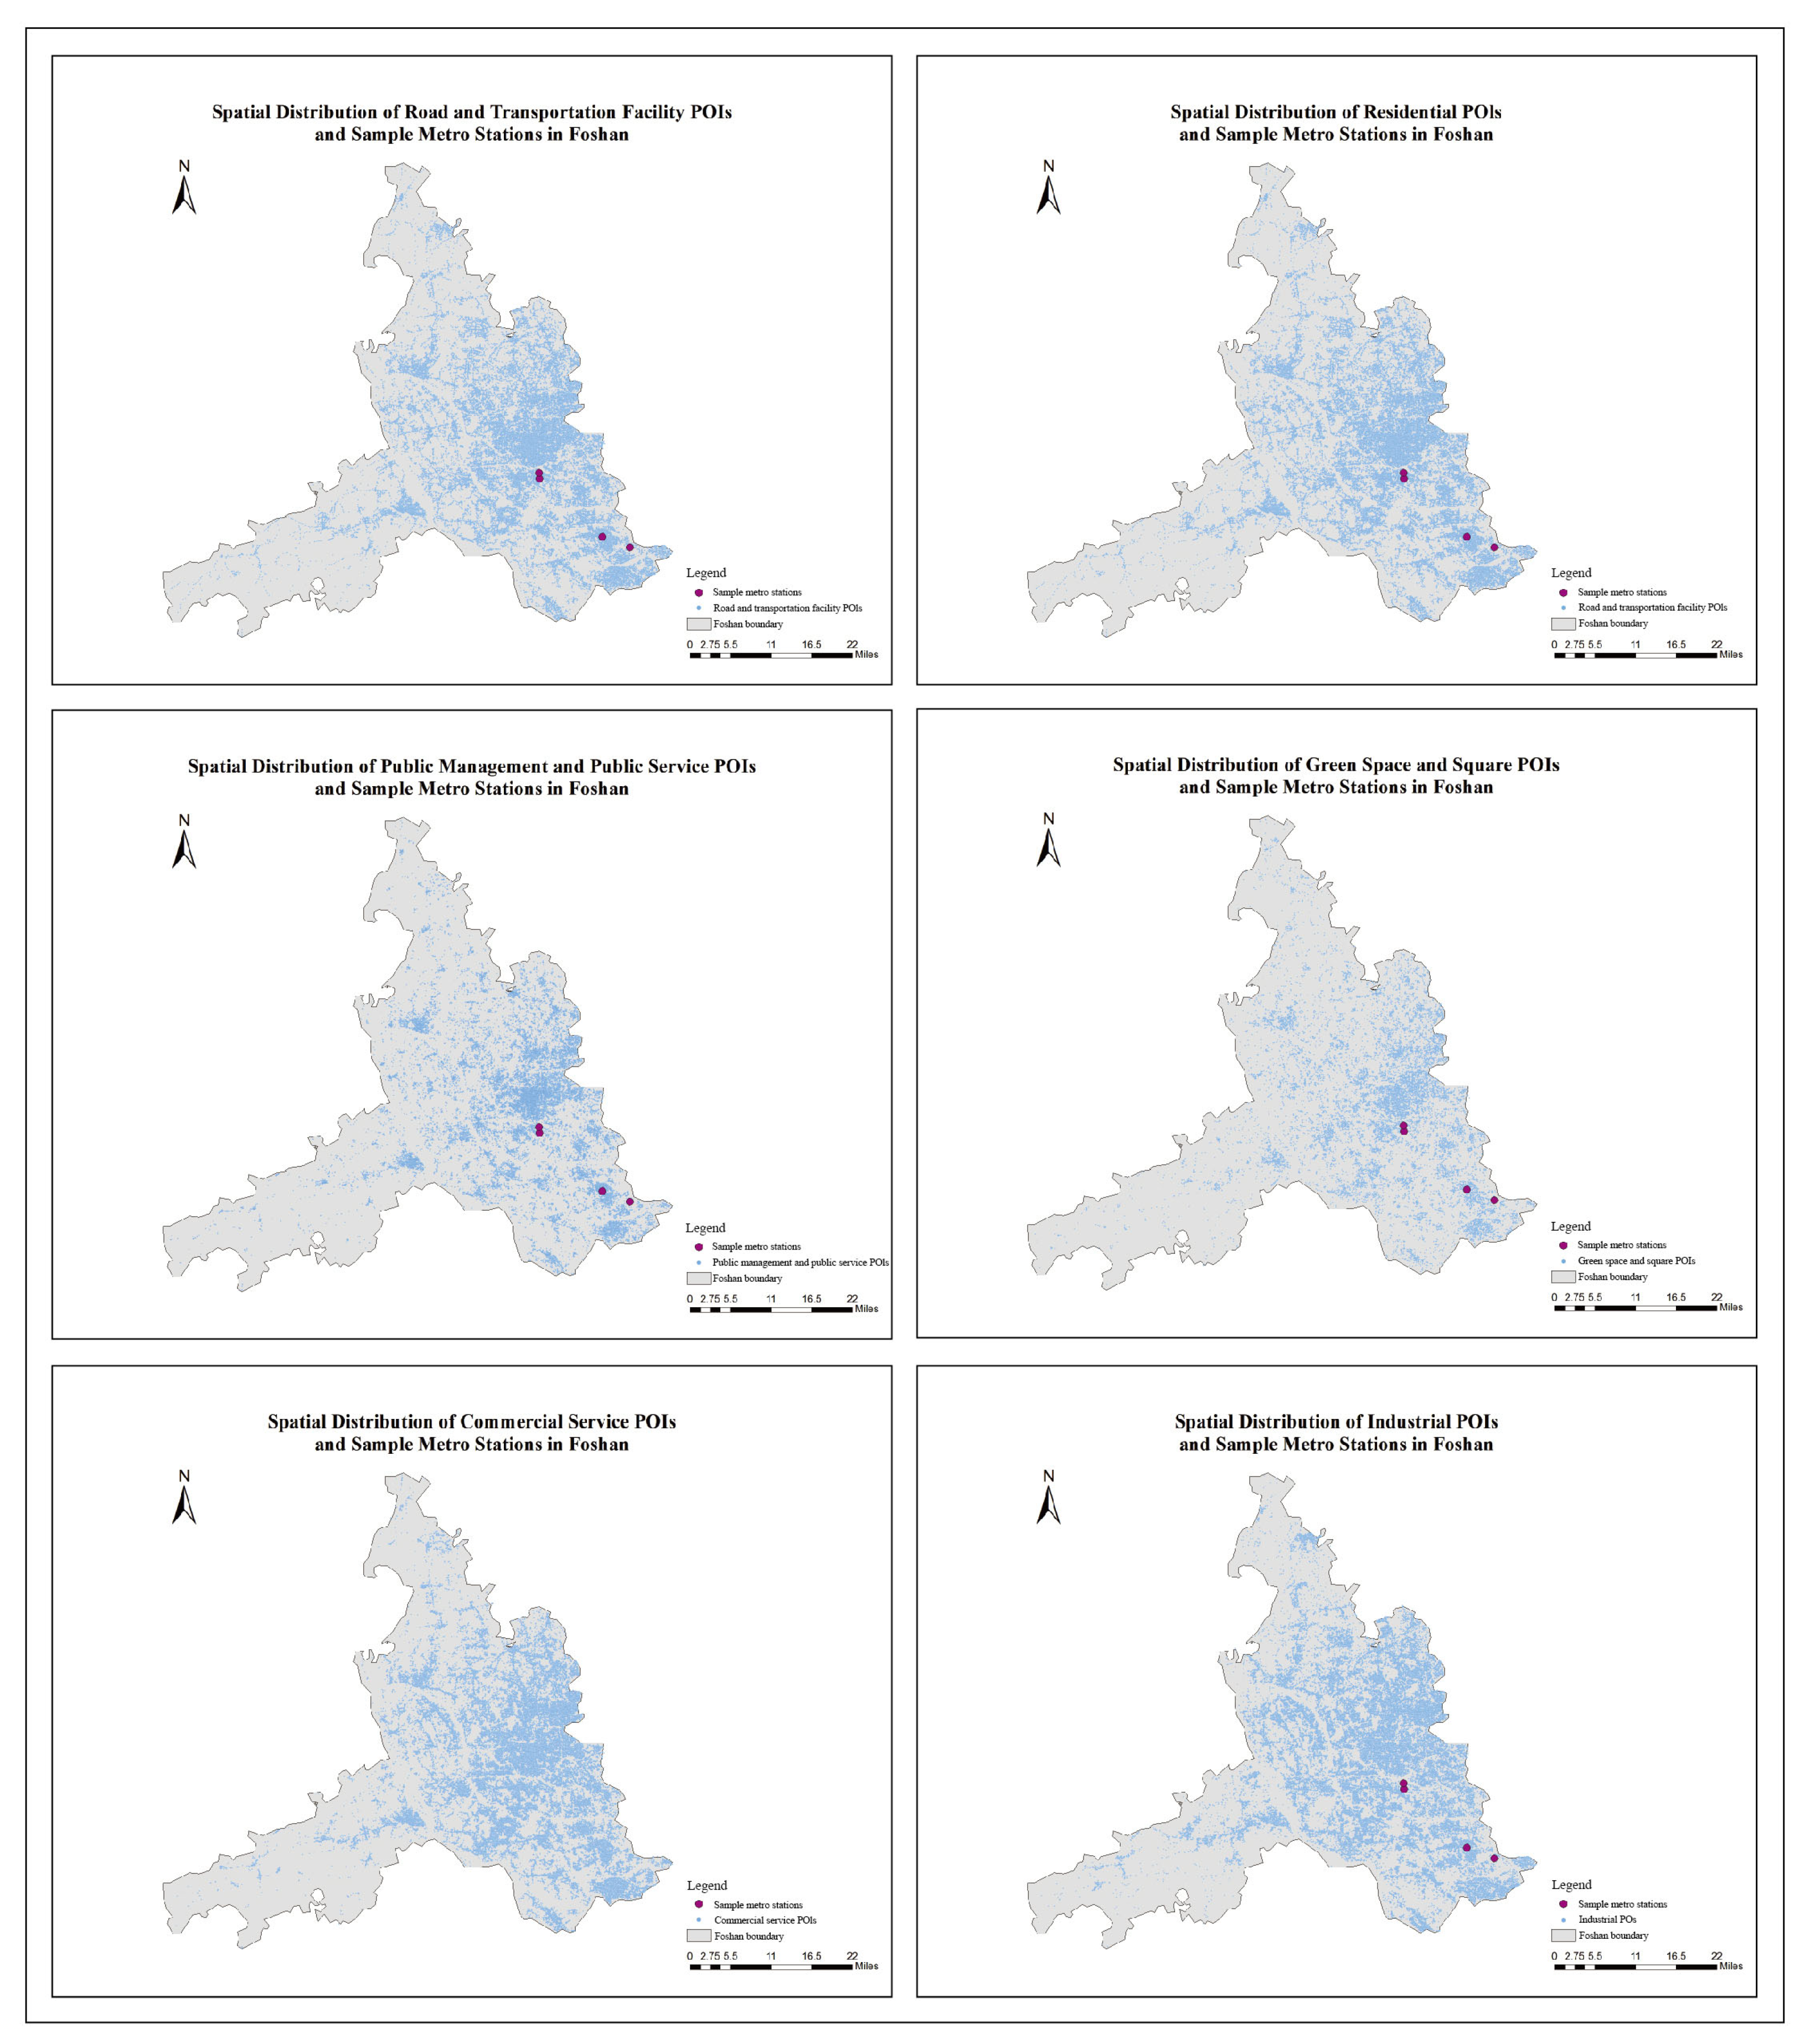
Appendix B
- Evaluation Target
- Research Objective
- Questionnaire Instructions
- ANP Network Structure
| Items | Please Complete or Select the Appropriate Option |
|---|---|
| Name | ________________________________________ |
| Affiliation | ________________________________________ |
| Professional Title/Position | ________________________________________ |
| Professional Background | □Urban Planning/Urban Design □Transportation Planning/Transportation Engineering □Architecture/Architectural Design □Landscape Architecture/Environmental Design □Cultural Industries and Related Fields □Public Art/Visual Communication □Public Administration/Sociology □Other: ________ |
| Years of Professional Experience | □Less than 3 years □3–5 years □6–10 years □More than 10 years |
| Level of Familiarity with Scene Theory and Spatial Experience Evaluation | □Not at all familiar □Slightly familiar □Moderately familiar □Familiar □Very familiar |
| Level of Familiarity with the Evaluation Target | □Not at all familiar □Slightly familiar □Moderately familiar □Familiar □Very familiar |
| Numerical Value | Meaning |
|---|---|
| 1 | Both are equally important/have an equivalent level of influence |
| 3 | One is slightly more important/influential than the other |
| 5 | One is clearly more important/influential than the other |
| 7 | One is substantially more important/influential than the other |
| 9 | One is extremely more important/influential than the other |
| 2, 4, 6, 8 | Intermediate values between two adjacent judgments |
| Module | Matrix Content | Matrix Size | Necessity of S |
|---|---|---|---|
| M0 | The importance of the three primary dimensions relative to overall scene quality | 3 × 3 | Required |
| M1–M3 | Assessment of interdependencies among the three primary dimensions | Three sets of 3 × 3 matrices | Required |
| M4–M6 | Relative-importance comparisons among the five subdimensions within each primary dimension (A, B, and C) | Three sets of 5 × 5 matrices | Required |
| M7–M12 | Judgments of cross-dimensional interdependencies among subdimensions for A ↔ B, A ↔ C, and B ↔ C | Six sets of 5 × 5 matrices | Supplementary |
| Item | Judgment Context | Indicator | Please Select One Judgment Value | Indicator |
|---|---|---|---|---|
| Q1 | With respect to enhancing the overall quality of the target scene, which primary dimension is more important? | A Authenticity | Left side is stronger: □9 □8 □7 □6 □5 □4 □3 □2 □1 Equal Right side is stronger: □2 □3 □4 □5 □6 □7 □8 □9 | C Legitimacy |
| Q2 | Which primary dimension is more important for enhancing the overall quality of the target scene? | A Authenticity | Left side is stronger: □9 □8 □7 □6 □5 □4 □3 □2 □1 Equal Right side is stronger: □2 □3 □4 □5 □6 □7 □8 □9 | B Theatricality |
| Q3 | Which primary dimension is more important for enhancing the overall quality of the target scene? | C Legitimacy | Left side is stronger: □9 □8 □7 □6 □5 □4 □3 □2 □1 Equal Right side is stronger: □2 □3 □4 □5 □6 □7 □8 □9 | B Theatricality |
| Item | Judgment Context | Indicator | Please Select One Judgment Value | Indicator |
|---|---|---|---|---|
| Q4 | Which has a stronger influence on the formation or enhancement of Authenticity (A)? | A Its own local foundations | Left side is stronger: □9 □8 □7 □6 □5 □4 □3 □2 □1 Equal Right side is stronger: □2 □3 □4 □5 □6 □7 □8 □9 | B The normative influence of Legitimacy |
| Q5 | Which has a stronger influence on the formation or enhancement of Authenticity (A)? | A Its own local foundations | Left side is stronger: □9 □8 □7 □6 □5 □4 □3 □2 □1 Equal Right side is stronger: □2 □3 □4 □5 □6 □7 □8 □9 | B The expressive influence of Theatricality |
| Q6 | Which has a stronger influence on the formation or enhancement of Authenticity (A)? | C The normative influence of Legitimacy | Left side is stronger: □9 □8 □7 □6 □5 □4 □3 □2 □1 Equal Right side is stronger: □2 □3 □4 □5 □6 □7 □8 □9 | B The expressive influence of Theatricality |
| Q7 | Which has a stronger influence on the formation or enhancement of Legitimacy (C)? | A The foundational influence of Authenticity | Left side is stronger: □9 □8 □7 □6 □5 □4 □3 □2 □1 Equal Right side is stronger: □2 □3 □4 □5 □6 □7 □8 □9 | C Its own normative order |
| Q8 | Which has a stronger influence on the formation or enhancement of Legitimacy (C)? | A The foundational influence of Authenticity | Left side is stronger: □9 □8 □7 □6 □5 □4 □3 □2 □1 Equal Right side is stronger: □2 □3 □4 □5 □6 □7 □8 □9 | B The performative influence of Theatricality |
| Q9 | Which has a stronger influence on the formation or enhancement of Legitimacy (C)? | C Its own normative order | Left side is stronger: □9 □8 □7 □6 □5 □4 □3 □2 □1 Equal Right side is stronger: □2 □3 □4 □5 □6 □7 □8 □9 | B The performative influence of Theatricality |
| Q10 | Which has a stronger influence on the formation or enhancement of Theatricality (B)? | A The core influence of Authenticity | Left side is stronger: □9 □8 □7 □6 □5 □4 □3 □2 □1 Equal Right side is stronger: □2 □3 □4 □5 □6 □7 □8 □9 | C The constraining influence of Legitimacy |
| Q11 | Which has a stronger influence on the formation or enhancement of Theatricality (B)? | A The core influence of Authenticity | Left side is stronger: □9 □8 □7 □6 □5 □4 □3 □2 □1 Equal Right side is stronger: □2 □3 □4 □5 □6 □7 □8 □9 | B Its own performative capacity |
| Q12 | Which has a stronger influence on the formation or enhancement of Theatricality (B)? | C The constraining influence of Legitimacy | Left side is stronger: □9 □8 □7 □6 □5 □4 □3 □2 □1 Equal Right side is stronger: □2 □3 □4 □5 □6 □7 □8 □9 | B Its own performative capacity |
| Item | Judgment Context | Indicator | Please Select One Judgment Value | Indicator |
|---|---|---|---|---|
| Q13 | Which subdimension is more important for enhancing Authenticity (A)? | A1 Local | Left side is stronger: □9 □8 □7 □6 □5 □4 □3 □2 □1 Equal Right side is stronger: □2 □3 □4 □5 □6 □7 □8 □9 | A2 Ethnic |
| Q14 | Which subdimension is more important for enhancing Authenticity (A)? | A1 Local | Left side is stronger: □9 □8 □7 □6 □5 □4 □3 □2 □1 Equal Right side is stronger: □2 □3 □4 □5 □6 □7 □8 □9 | A3 State |
| Q15 | Which subdimension is more important for enhancing Authenticity (A)? | A1 Local | Left side is stronger: □9 □8 □7 □6 □5 □4 □3 □2 □1 Equal Right side is stronger: □2 □3 □4 □5 □6 □7 □8 □9 | A4 Corporate |
| Q16 | Which subdimension is more important for enhancing Authenticity (A)? | A1 Local | Left side is stronger: □9 □8 □7 □6 □5 □4 □3 □2 □1 Equal Right side is stronger: □2 □3 □4 □5 □6 □7 □8 □9 | A5 Rational |
| Q17 | Which subdimension is more important for enhancing Authenticity (A)? | A2 Ethnic | Left side is stronger: □9 □8 □7 □6 □5 □4 □3 □2 □1 Equal Right side is stronger: □2 □3 □4 □5 □6 □7 □8 □9 | A3 State |
| Q18 | Which subdimension is more important for enhancing Authenticity (A)? | A2 Ethnic | Left side is stronger: □9 □8 □7 □6 □5 □4 □3 □2 □1 Equal Right side is stronger: □2 □3 □4 □5 □6 □7 □8 □9 | A4 Corporate |
| Q19 | Which subdimension is more important for enhancing Authenticity (A)? | A2 Ethnic | Left side is stronger: □9 □8 □7 □6 □5 □4 □3 □2 □1 Equal Right side is stronger: □2 □3 □4 □5 □6 □7 □8 □9 | A5 Rational |
| Q20 | Which subdimension is more important for enhancing Authenticity (A)? | A3 State | Left side is stronger: □9 □8 □7 □6 □5 □4 □3 □2 □1 Equal Right side is stronger: □2 □3 □4 □5 □6 □7 □8 □9 | A4 Corporate |
| Q21 | Which subdimension is more important for enhancing Authenticity (A)? | A3 State | Left side is stronger: □9 □8 □7 □6 □5 □4 □3 □2 □1 Equal Right side is stronger: □2 □3 □4 □5 □6 □7 □8 □9 | A5 Rational |
| Q22 | Which subdimension is more important for enhancing Authenticity (A)? | A4 Corporate | Left side is stronger: □9 □8 □7 □6 □5 □4 □3 □2 □1 Equal Right side is stronger: □2 □3 □4 □5 □6 □7 □8 □9 | A5 Rational |
| Item | Judgment Context | Indicator | Please Select One Judgment Value | Indicator |
|---|---|---|---|---|
| Q23 | Which subdimension is more important for enhancing Theatricality (B)? | B1 Exhibitionistic | Left side is stronger: □9 □8 □7 □6 □5 □4 □3 □2 □1 Equal Right side is stronger: □2 □3 □4 □5 □6 □7 □8 □9 | B2 Glamorous |
| Q24 | Which subdimension is more important for enhancing Theatricality (B)? | B1 Exhibitionistic | Left side is stronger: □9 □8 □7 □6 □5 □4 □3 □2 □1 Equal Right side is stronger: □2 □3 □4 □5 □6 □7 □8 □9 | B3 Neighbourly |
| Q25 | Which subdimension is more important for enhancing Theatricality (B)? | B1 Exhibitionistic | Left side is stronger: □9 □8 □7 □6 □5 □4 □3 □2 □1 Equal Right side is stronger: □2 □3 □4 □5 □6 □7 □8 □9 | B4 Transgressive |
| Q26 | Which subdimension is more important for enhancing Theatricality (B)? | B1 Exhibitionistic | Left side is stronger: □9 □8 □7 □6 □5 □4 □3 □2 □1 Equal Right side is stronger: □2 □3 □4 □5 □6 □7 □8 □9 | B5 Formal |
| Q27 | Which subdimension is more important for enhancing Theatricality (B)? | B2 Glamorous | Left side is stronger: □9 □8 □7 □6 □5 □4 □3 □2 □1 Equal Right side is stronger: □2 □3 □4 □5 □6 □7 □8 □9 | B3 Neighbourly |
| Q28 | Which subdimension is more important for enhancing Theatricality (B)? | B2 Glamorous | Left side is stronger: □9 □8 □7 □6 □5 □4 □3 □2 □1 Equal Right side is stronger: □2 □3 □4 □5 □6 □7 □8 □9 | B4 Transgressive |
| Q29 | Which subdimension is more important for enhancing Theatricality (B)? | B2 Glamorous | Left side is stronger: □9 □8 □7 □6 □5 □4 □3 □2 □1 Equal Right side is stronger: □2 □3 □4 □5 □6 □7 □8 □9 | B5 Formal |
| Q30 | Which subdimension is more important for enhancing Theatricality (B)? | B3 Neighbourly | Left side is stronger: □9 □8 □7 □6 □5 □4 □3 □2 □1 Equal Right side is stronger: □2 □3 □4 □5 □6 □7 □8 □9 | B4 Transgressive |
| Q31 | Which subdimension is more important for enhancing Theatricality (B)? | B3 Neighbourly | Left side is stronger: □9 □8 □7 □6 □5 □4 □3 □2 □1 Equal Right side is stronger: □2 □3 □4 □5 □6 □7 □8 □9 | B5 Formal |
| Q32 | Which subdimension is more important for enhancing Theatricality (B)? | B4 Transgressive | Left side is stronger: □9 □8 □7 □6 □5 □4 □3 □2 □1 Equal Right side is stronger: □2 □3 □4 □5 □6 □7 □8 □9 | B5 Formal |
| Item | Judgment Context | Indicator | Please Select One Judgment Value | Indicator |
|---|---|---|---|---|
| Q33 | Which subdimension is more important for enhancing Legitimacy (C)? | C1 Traditional | Left side is stronger: □9 □8 □7 □6 □5 □4 □3 □2 □1 Equal Right side is stronger: □2 □3 □4 □5 □6 □7 □8 □9 | C2 Utilitarian |
| Q34 | Which subdimension is more important for enhancing Legitimacy (C)? | C1 Traditional | Left side is stronger: □9 □8 □7 □6 □5 □4 □3 □2 □1 Equal Right side is stronger: □2 □3 □4 □5 □6 □7 □8 □9 | C3 Egalitarian |
| Q35 | Which subdimension is more important for enhancing Legitimacy (C)? | C1 Traditional | Left side is stronger: □9 □8 □7 □6 □5 □4 □3 □2 □1 Equal Right side is stronger: □2 □3 □4 □5 □6 □7 □8 □9 | C4 Self-expressive |
| Q36 | Which subdimension is more important for enhancing Legitimacy (C)? | C1 Traditional | Left side is stronger: □9 □8 □7 □6 □5 □4 □3 □2 □1 Equal Right side is stronger: □2 □3 □4 □5 □6 □7 □8 □9 | C5 Charismatic |
| Q37 | Which subdimension is more important for enhancing Legitimacy (C)? | C2 Utilitarian | Left side is stronger: □9 □8 □7 □6 □5 □4 □3 □2 □1 Equal Right side is stronger: □2 □3 □4 □5 □6 □7 □8 □9 | C3 Egalitarian |
| Q38 | Which subdimension is more important for enhancing Legitimacy (C)? | C2 Utilitarian | Left side is stronger: □9 □8 □7 □6 □5 □4 □3 □2 □1 Equal Right side is stronger: □2 □3 □4 □5 □6 □7 □8 □9 | C4 Self-expressive |
| Q39 | Which subdimension is more important for enhancing Legitimacy (C)? | C2 Utilitarian | Left side is stronger: □9 □8 □7 □6 □5 □4 □3 □2 □1 Equal Right side is stronger: □2 □3 □4 □5 □6 □7 □8 □9 | C5 Charismatic |
| Q40 | Which subdimension is more important for enhancing Legitimacy (C)? | C3 Egalitarian | Left side is stronger: □9 □8 □7 □6 □5 □4 □3 □2 □1 Equal Right side is stronger: □2 □3 □4 □5 □6 □7 □8 □9 | C4 Self-expressive |
| Q41 | Which subdimension is more important for enhancing Legitimacy (C)? | C3 Egalitarian | Left side is stronger: □9 □8 □7 □6 □5 □4 □3 □2 □1 Equal Right side is stronger: □2 □3 □4 □5 □6 □7 □8 □9 | C5 Charismatic |
| Q42 | Which subdimension is more important for enhancing Legitimacy (C)? | C4 Self-expressive | Left side is stronger: □9 □8 □7 □6 □5 □4 □3 □2 □1 Equal Right side is stronger: □2 □3 □4 □5 □6 □7 □8 □9 | C5 Charismatic |
| Item | Judgment Context | Indicator | Please Select One Judgment Value | Indicator |
|---|---|---|---|---|
| Q43 | For enhancing Theatricality (B), which factor within Authenticity is more influential in serving as the core of scene expression, narrative, and experience? | A1 Local | Left side is stronger: □9 □8 □7 □6 □5 □4 □3 □2 □1 Equal Right side is stronger: □2 □3 □4 □5 □6 □7 □8 □9 | A2 Ethnic |
| Q44 | For enhancing Theatricality (B), which factor within Authenticity is more influential in serving as the core of scene expression, | A1 Local | Left side is stronger: □9 □8 □7 □6 □5 □4 □3 □2 □1 Equal Right side is stronger: □2 □3 □4 □5 □6 □7 □8 □9 | A3 State |
| Q45 | For enhancing Theatricality (B), which factor within Authenticity is more influential in serving as the core of scene expression, | A1 Local | Left side is stronger: □9 □8 □7 □6 □5 □4 □3 □2 □1 Equal Right side is stronger: □2 □3 □4 □5 □6 □7 □8 □9 | A4 Corporate |
| Q46 | For enhancing Theatricality (B), which factor within Authenticity is more influential in serving as the core of scene expression, | A1 Local | Left side is stronger: □9 □8 □7 □6 □5 □4 □3 □2 □1 Equal Right side is stronger: □2 □3 □4 □5 □6 □7 □8 □9 | A5 Rational |
| Q47 | For enhancing Theatricality (B), which factor within Authenticity is more influential in serving as the core of scene expression, | A2 Ethnic | Left side is stronger: □9 □8 □7 □6 □5 □4 □3 □2 □1 Equal Right side is stronger: □2 □3 □4 □5 □6 □7 □8 □9 | A3 State |
| Q48 | For enhancing Theatricality (B), which factor within Authenticity is more influential in serving as the core of scene expression, | A2 Ethnic | Left side is stronger: □9 □8 □7 □6 □5 □4 □3 □2 □1 Equal Right side is stronger: □2 □3 □4 □5 □6 □7 □8 □9 | A4 Corporate |
| Q49 | For enhancing Theatricality (B), which factor within Authenticity is more influential in serving as the core of scene expression, | A2 Ethnic | Left side is stronger: □9 □8 □7 □6 □5 □4 □3 □2 □1 Equal Right side is stronger: □2 □3 □4 □5 □6 □7 □8 □9 | A5 Rational |
| Q50 | For enhancing Theatricality (B), which factor within Authenticity is more influential in serving as the core of scene expression, | A3 State | Left side is stronger: □9 □8 □7 □6 □5 □4 □3 □2 □1 Equal Right side is stronger: □2 □3 □4 □5 □6 □7 □8 □9 | A4 Corporate |
| Q51 | For enhancing Theatricality (B), which factor within Authenticity is more influential in serving as the core of scene expression, | A3 State | Left side is stronger: □9 □8 □7 □6 □5 □4 □3 □2 □1 Equal Right side is stronger: □2 □3 □4 □5 □6 □7 □8 □9 | A5 Rational |
| Q52 | For enhancing Theatricality (B), which factor within Authenticity is more influential in serving as the core of scene expression, | A4 Corporate | Left side is stronger: □9 □8 □7 □6 □5 □4 □3 □2 □1 Equal Right side is stronger: □2 □3 □4 □5 □6 □7 □8 □9 | A5 Rational |
| Item | Judgment Context | Indicator | Please Select One Judgment Value | Indicator |
|---|---|---|---|---|
| Q53 | For enhancing Legitimacy (C), which factor within Authenticity is more influential in providing the foundation for the scene to gain recognition and acceptance? | A1 Local | Left side is stronger: □9 □8 □7 □6 □5 □4 □3 □2 □1 Equal Right side is stronger: □2 □3 □4 □5 □6 □7 □8 □9 | A2 Ethnic |
| Q54 | For enhancing Legitimacy (C), which factor within Authenticity is more influential in providing the foundation for the scene to gain recognition and acceptance? | A1 Local | Left side is stronger: □9 □8 □7 □6 □5 □4 □3 □2 □1 Equal Right side is stronger: □2 □3 □4 □5 □6 □7 □8 □9 | A3 State |
| Q55 | For enhancing Legitimacy (C), which factor within Authenticity is more influential in providing the foundation for the scene to gain recognition and acceptance? | A1 Local | Left side is stronger: □9 □8 □7 □6 □5 □4 □3 □2 □1 Equal Right side is stronger: □2 □3 □4 □5 □6 □7 □8 □9 | A4 Corporate |
| Q56 | For enhancing Legitimacy (C), which factor within Authenticity is more influential in providing the foundation for the scene to gain recognition and acceptance? | A1 Local | Left side is stronger: □9 □8 □7 □6 □5 □4 □3 □2 □1 Equal Right side is stronger: □2 □3 □4 □5 □6 □7 □8 □9 | A5 Rational |
| Q57 | For enhancing Legitimacy (C), which factor within Authenticity is more influential in providing the foundation for the scene to gain recognition and acceptance? | A2 Ethnic | Left side is stronger: □9 □8 □7 □6 □5 □4 □3 □2 □1 Equal Right side is stronger: □2 □3 □4 □5 □6 □7 □8 □9 | A3 State |
| Q58 | For enhancing Legitimacy (C), which factor within Authenticity is more influential in providing the foundation for the scene to gain recognition and acceptance? | A2 Ethnic | Left side is stronger: □9 □8 □7 □6 □5 □4 □3 □2 □1 Equal Right side is stronger: □2 □3 □4 □5 □6 □7 □8 □9 | A4 Corporate |
| Q59 | For enhancing Legitimacy (C), which factor within Authenticity is more influential in providing the foundation for the scene to gain recognition and acceptance? | A2 Ethnic | Left side is stronger: □9 □8 □7 □6 □5 □4 □3 □2 □1 Equal Right side is stronger: □2 □3 □4 □5 □6 □7 □8 □9 | A5 Rational |
| Q60 | For enhancing Legitimacy (C), which factor within Authenticity is more influential in providing the foundation for the scene to gain recognition and acceptance? | A3 State | Left side is stronger: □9 □8 □7 □6 □5 □4 □3 □2 □1 Equal Right side is stronger: □2 □3 □4 □5 □6 □7 □8 □9 | A4 Corporate |
| Q61 | For enhancing Legitimacy (C), which factor within Authenticity is more influential in providing the foundation for the scene to gain recognition and acceptance? | A3 State | Left side is stronger: □9 □8 □7 □6 □5 □4 □3 □2 □1 Equal Right side is stronger: □2 □3 □4 □5 □6 □7 □8 □9 | A5 Rational |
| Q62 | For enhancing Legitimacy (C), which factor within Authenticity is more influential in providing the foundation for the scene to gain recognition and acceptance? | A4 Corporate | Left side is stronger: □9 □8 □7 □6 □5 □4 □3 □2 □1 Equal Right side is stronger: □2 □3 □4 □5 □6 □7 □8 □9 | A5 Rational |
| Item | Judgment Context | Indicator | Select One Judgment Value | Indicator |
|---|---|---|---|---|
| Q63 | For enhancing Authenticity (A), which factor within Theatricality is more influential in facilitating the effective expression of local culture, historical memory, and institutional content? | B1 Exhibitionistic | Left side is stronger: □9 □8 □7 □6 □5 □4 □3 □2 □1 Equal Right side is stronger: □2 □3 □4 □5 □6 □7 □8 □9 | B2 Glamorous |
| Q64 | For enhancing Authenticity (A), which factor within Theatricality is more influential in facilitating the effective expression of local culture, historical memory, and institutional content? | B1 Exhibitionistic | Left side is stronger: □9 □8 □7 □6 □5 □4 □3 □2 □1 Equal Right side is stronger: □2 □3 □4 □5 □6 □7 □8 □9 | B3 Neighbourly |
| Q65 | For enhancing Authenticity (A), which factor within Theatricality is more influential in facilitating the effective expression of local culture, historical memory, and institutional content? | B1 Exhibitionistic | Left side is stronger: □9 □8 □7 □6 □5 □4 □3 □2 □1 Equal Right side is stronger: □2 □3 □4 □5 □6 □7 □8 □9 | B4 Transgressive |
| Q66 | For enhancing Authenticity (A), which factor within Theatricality is more influential in facilitating the effective expression of local culture, historical memory, and institutional content? | B1 Exhibitionistic | Left side is stronger: □9 □8 □7 □6 □5 □4 □3 □2 □1 Equal Right side is stronger: □2 □3 □4 □5 □6 □7 □8 □9 | B5 Formal |
| Q67 | For enhancing Authenticity (A), which factor within Theatricality is more influential in facilitating the effective expression of local culture, historical memory, and institutional content? | B2 Glamorous | Left side is stronger: □9 □8 □7 □6 □5 □4 □3 □2 □1 Equal Right side is stronger: □2 □3 □4 □5 □6 □7 □8 □9 | B3 Neighbourly |
| Q68 | For enhancing Authenticity (A), which factor within Theatricality is more influential in facilitating the effective expression of local culture, historical memory, and institutional content? | B2 Glamorous | Left side is stronger: □9 □8 □7 □6 □5 □4 □3 □2 □1 Equal Right side is stronger: □2 □3 □4 □5 □6 □7 □8 □9 | B4 Transgressive |
| Q69 | For enhancing Authenticity (A), which factor within Theatricality is more influential in facilitating the effective expression of local culture, historical memory, and institutional content? | B2 Glamorous | Left side is stronger: □9 □8 □7 □6 □5 □4 □3 □2 □1 Equal Right side is stronger: □2 □3 □4 □5 □6 □7 □8 □9 | B5 Formal |
| Q70 | For enhancing Authenticity (A), which factor within Theatricality is more influential in facilitating the effective expression of local culture, historical memory, and institutional content? | B3 Neighbourly | Left side is stronger: □9 □8 □7 □6 □5 □4 □3 □2 □1 Equal Right side is stronger: □2 □3 □4 □5 □6 □7 □8 □9 | B4 Transgressive |
| Q71 | For enhancing Authenticity (A), which factor within Theatricality is more influential in facilitating the effective expression of local culture, historical memory, and institutional content? | B3 Neighbourly | Left side is stronger: □9 □8 □7 □6 □5 □4 □3 □2 □1 Equal Right side is stronger: □2 □3 □4 □5 □6 □7 □8 □9 | B5 Formal |
| Q72 | For enhancing Authenticity (A), which factor within Theatricality is more influential in facilitating the effective expression of local culture, historical memory, and institutional content? | B4 Transgressive | Left side is stronger: □9 □8 □7 □6 □5 □4 □3 □2 □1 Equal Right side is stronger: □2 □3 □4 □5 □6 □7 □8 □9 | B5 Formal |
| Item | Judgment Context | Indicator | Select One Judgment Value | Indicator |
|---|---|---|---|---|
| Q73 | For enhancing Legitimacy (C), which factor within Theatricality is more influential in facilitating the effective representation of local culture, historical memory, and State-related elements? | B1 Exhibitionistic | Left side is stronger: □9 □8 □7 □6 □5 □4 □3 □2 □1 Equal Right side is stronger: □2 □3 □4 □5 □6 □7 □8 □9 | B2 Glamorous |
| Q74 | For enhancing Legitimacy (C), which factor within Theatricality is more influential in facilitating the effective representation of local culture, historical memory, and State-related elements? | B1 Exhibitionistic | Left side is stronger: □9 □8 □7 □6 □5 □4 □3 □2 □1 Equal Right side is stronger: □2 □3 □4 □5 □6 □7 □8 □9 | B3 Neighbourly |
| Q75 | For enhancing Legitimacy (C), which factor within Theatricality is more influential in facilitating the effective representation of local culture, historical memory, and State-related elements? | B1 Exhibitionistic | Left side is stronger: □9 □8 □7 □6 □5 □4 □3 □2 □1 Equal Right side is stronger: □2 □3 □4 □5 □6 □7 □8 □9 | B4 Transgressive |
| Q76 | For enhancing Legitimacy (C), which factor within Theatricality is more influential in facilitating the effective representation of local culture, historical memory, and State-related elements? | B1 Exhibitionistic | Left side is stronger: □9 □8 □7 □6 □5 □4 □3 □2 □1 Equal Right side is stronger: □2 □3 □4 □5 □6 □7 □8 □9 | B5 Formal |
| Q77 | For enhancing Legitimacy (C), which factor within Theatricality is more influential in facilitating the effective representation of local culture, historical memory, and State-related elements? | B2 Glamorous | Left side is stronger: □9 □8 □7 □6 □5 □4 □3 □2 □1 Equal Right side is stronger: □2 □3 □4 □5 □6 □7 □8 □9 | B3 Neighbourly |
| Q78 | For enhancing Legitimacy (C), which factor within Theatricality is more influential in facilitating the effective representation of local culture, historical memory, and State-related elements? | B2 Glamorous | Left side is stronger: □9 □8 □7 □6 □5 □4 □3 □2 □1 Equal Right side is stronger: □2 □3 □4 □5 □6 □7 □8 □9 | B4 Transgressive |
| Q79 | For enhancing Legitimacy (C), which factor within Theatricality is more influential in facilitating the effective representation of local culture, historical memory, and State-related elements? | B2 Glamorous | Left side is stronger: □9 □8 □7 □6 □5 □4 □3 □2 □1 Equal Right side is stronger: □2 □3 □4 □5 □6 □7 □8 □9 | B5 Formal |
| Q80 | For enhancing Legitimacy (C), which factor within Theatricality is more influential in facilitating the effective representation of local culture, historical memory, and State-related elements? | B3 Neighbourly | Left side is stronger: □9 □8 □7 □6 □5 □4 □3 □2 □1 Equal Right side is stronger: □2 □3 □4 □5 □6 □7 □8 □9 | B4 Transgressive |
| Q81 | For enhancing Legitimacy (C), which factor within Theatricality is more influential in facilitating the effective representation of local culture, historical memory, and State-related elements? | B3 Neighbourly | Left side is stronger: □9 □8 □7 □6 □5 □4 □3 □2 □1 Equal Right side is stronger: □2 □3 □4 □5 □6 □7 □8 □9 | B5 Formal |
| Q82 | For enhancing Legitimacy (C), which factor within Theatricality is more influential in facilitating the effective representation of local culture, historical memory, and State-related elements? | B4 Transgressive | Left side is stronger: □9 □8 □7 □6 □5 □4 □3 □2 □1 Equal Right side is stronger: □2 □3 □4 □5 □6 □7 □8 □9 | B5 Formal |
| Item | Judgment Context | Indicator | Select One Judgment Value | Indicator |
|---|---|---|---|---|
| Q83 | For enhancing Authenticity (A), which factor within Legitimacy is more influential in regulating the expression of local culture, historical memory, and identity, thereby making it more credible, legitimate, and acceptable? | C1 Traditional | Left side is stronger: □9 □8 □7 □6 □5 □4 □3 □2 □1 Equal Right side is stronger: □2 □3 □4 □5 □6 □7 □8 □9 | C2 Utilitarian |
| Q84 | For enhancing Authenticity (A), which factor within Legitimacy is more influential in regulating the expression of local culture, historical memory, and identity, thereby making it more credible, legitimate, and acceptable? | C1 Traditional | Left side is stronger: □9 □8 □7 □6 □5 □4 □3 □2 □1 Equal Right side is stronger: □2 □3 □4 □5 □6 □7 □8 □9 | C3 Egalitarian |
| Q85 | For enhancing Authenticity (A), which factor within Legitimacy is more influential in regulating the expression of local culture, historical memory, and identity, thereby making it more credible, legitimate, and acceptable? | C1 Traditional | Left side is stronger: □9 □8 □7 □6 □5 □4 □3 □2 □1 Equal Right side is stronger: □2 □3 □4 □5 □6 □7 □8 □9 | C4 Self-expressive |
| Q86 | For enhancing Authenticity (A), which factor within Legitimacy is more influential in regulating the expression of local culture, historical memory, and identity, thereby making it more credible, legitimate, and acceptable? | C1 Traditional | Left side is stronger: □9 □8 □7 □6 □5 □4 □3 □2 □1 Equal Right side is stronger: □2 □3 □4 □5 □6 □7 □8 □9 | C5 Charismatic |
| Q87 | For enhancing Authenticity (A), which factor within Legitimacy is more influential in regulating the expression of local culture, historical memory, and identity, thereby making it more credible, legitimate, and acceptable? | C2 Utilitarian | Left side is stronger: □9 □8 □7 □6 □5 □4 □3 □2 □1 Equal Right side is stronger: □2 □3 □4 □5 □6 □7 □8 □9 | C3 Egalitarian |
| Q88 | For enhancing Authenticity (A), which factor within Legitimacy is more influential in regulating the expression of local culture, historical memory, and identity, thereby making it more credible, legitimate, and acceptable? | C2 Utilitarian | Left side is stronger: □9 □8 □7 □6 □5 □4 □3 □2 □1 Equal Right side is stronger: □2 □3 □4 □5 □6 □7 □8 □9 | C4 Self-expressive |
| Q89 | For enhancing Authenticity (A), which factor within Legitimacy is more influential in regulating the expression of local culture, historical memory, and identity, thereby making it more credible, legitimate, and acceptable? | C2 Utilitarian | Left side is stronger: □9 □8 □7 □6 □5 □4 □3 □2 □1 Equal Right side is stronger: □2 □3 □4 □5 □6 □7 □8 □9 | C5 Charismatic |
| Q90 | For enhancing Authenticity (A), which factor within Legitimacy is more influential in regulating the expression of local culture, historical memory, and identity, thereby making it more credible, legitimate, and acceptable? | C3 Egalitarian | Left side is stronger: □9 □8 □7 □6 □5 □4 □3 □2 □1 Equal Right side is stronger: □2 □3 □4 □5 □6 □7 □8 □9 | C4 Self-expressive |
| Q91 | For enhancing Authenticity (A), which factor within Legitimacy is more influential in regulating the expression of local culture, historical memory, and identity, thereby making it more credible, legitimate, and acceptable? | C3 Egalitarian | Left side is stronger: □9 □8 □7 □6 □5 □4 □3 □2 □1 Equal Right side is stronger: □2 □3 □4 □5 □6 □7 □8 □9 | C5 Charismatic |
| Q92 | For enhancing Authenticity (A), which factor within Legitimacy is more influential in regulating the expression of local culture, historical memory, and identity, thereby making it more credible, legitimate, and acceptable? | C4 Self-expressive | Left side is stronger: □9 □8 □7 □6 □5 □4 □3 □2 □1 Equal Right side is stronger: □2 □3 □4 □5 □6 □7 □8 □9 | C5 Charismatic |
| Item | Judgment Context | Indicator | Select One Judgment Value | Indicator |
|---|---|---|---|---|
| Q93 | For enhancing Theatricality (B), which factor within Legitimacy is more influential in constraining the ways in which the scene is displayed, experienced interactively, and expressed? | C1 Traditional | Left side is stronger: □9 □8 □7 □6 □5 □4 □3 □2 □1 Equal Right side is stronger: □2 □3 □4 □5 □6 □7 □8 □9 | C2 Utilitarian |
| Q94 | For enhancing Theatricality (B), which factor within Legitimacy is more influential in constraining the ways in which the scene is displayed, experienced interactively, and expressed? | C1 Traditional | Left side is stronger: □9 □8 □7 □6 □5 □4 □3 □2 □1 Equal Right side is stronger: □2 □3 □4 □5 □6 □7 □8 □9 | C3 Egalitarian |
| Q95 | For enhancing Theatricality (B), which factor within Legitimacy is more influential in constraining the ways in which the scene is displayed, experienced interactively, and expressed? | C1 Traditional | Left side is stronger: □9 □8 □7 □6 □5 □4 □3 □2 □1 Equal Right side is stronger: □2 □3 □4 □5 □6 □7 □8 □9 | C4 Self-expressive |
| Q96 | For enhancing Theatricality (B), which factor within Legitimacy is more influential in constraining the ways in which the scene is displayed, experienced interactively, and expressed? | C1 Traditional | Left side is stronger: □9 □8 □7 □6 □5 □4 □3 □2 □1 Equal Right side is stronger: □2 □3 □4 □5 □6 □7 □8 □9 | C5 Charismatic |
| Q97 | For enhancing Theatricality (B), which factor within Legitimacy is more influential in constraining the ways in which the scene is displayed, experienced interactively, and expressed? | C2 Utilitarian | Left side is stronger: □9 □8 □7 □6 □5 □4 □3 □2 □1 Equal Right side is stronger: □2 □3 □4 □5 □6 □7 □8 □9 | C3 Egalitarian |
| Q98 | For enhancing Theatricality (B), which factor within Legitimacy is more influential in constraining the ways in which the scene is displayed, experienced interactively, and expressed? | C2 Utilitarian | Left side is stronger: □9 □8 □7 □6 □5 □4 □3 □2 □1 Equal Right side is stronger: □2 □3 □4 □5 □6 □7 □8 □9 | C4 Self-expressive |
| Q99 | For enhancing Theatricality (B), which factor within Legitimacy is more influential in constraining the ways in which the scene is displayed, experienced interactively, and expressed? | C2 Utilitarian | Left side is stronger: □9 □8 □7 □6 □5 □4 □3 □2 □1 Equal Right side is stronger: □2 □3 □4 □5 □6 □7 □8 □9 | C5 Charismatic |
| Q100 | For enhancing Theatricality (B), which factor within Legitimacy is more influential in constraining the ways in which the scene is displayed, experienced interactively, and expressed? | C3 Egalitarian | Left side is stronger: □9 □8 □7 □6 □5 □4 □3 □2 □1 Equal Right side is stronger: □2 □3 □4 □5 □6 □7 □8 □9 | C4 Self-expressive |
| Q101 | For enhancing Theatricality (B), which factor within Legitimacy is more influential in constraining the ways in which the scene is displayed, experienced interactively, and expressed? | C3 Egalitarian | Left side is stronger: □9 □8 □7 □6 □5 □4 □3 □2 □1 Equal Right side is stronger: □2 □3 □4 □5 □6 □7 □8 □9 | C5 Charismatic |
| Q102 | For enhancing Theatricality (B), which factor within Legitimacy is more influential in constraining the ways in which the scene is displayed, experienced interactively, and expressed? | C4 Self-expressive | Left side is stronger: □9 □8 □7 □6 □5 □4 □3 □2 □1 Equal Right side is stronger: □2 □3 □4 □5 □6 □7 □8 □9 | C5 Charismatic |
| Confirmation Item | Expert’s Signature/Date |
|---|---|
| I confirm that I have completed this questionnaire based on my professional judgment. | Signature: __________________ Date: __________________ |
Appendix C
- Introduction
| Item | Question | Answer |
|---|---|---|
| Q1 | Questionnaire No. | __________ |
| Q2 | Date of Completion | __________ |
| Q3 | Evaluation Method | □On-site Visit □Photographs/Videos □Design Documents □Comprehensive Understanding |
| Q4 | Subject of Evaluation | A Metro Station Familiar to the Respondent |
| Score Range | Meaning | Description |
|---|---|---|
| Score: 1–2 | Very Weak Performance | This criterion is barely evident, has very low recognizability, or contributes only minimally to enhancing spatial quality. |
| Score: 3–4 | Relatively Weak Performance | This criterion is evident only sporadically or in limited areas; overall, it lacks clarity, and its distinctive qualities and impact are relatively weak. |
| Score: 5–6 | Moderate Performance | This criterion is evident to some extent and generally meets the standard of an average metro station, but its distinctive qualities or impact are not particularly prominent. |
| Score: 7–8 | Relatively Strong Performance | This criterion is clearly evident, demonstrating notable recognizability, experiential quality, public value, or a positive contribution to enhancing spatial quality. |
| Score: 9–10 | Outstanding Performance | This criterion is highly evident and distinctive, contributes significantly to enhancing spatial quality, and may be regarded as a key strength of the station. |
| Criterion | Example Rating | Corresponding Score Range | Meaning | Interpretation of the Selected Score |
|---|---|---|---|---|
| A1 Local | □1□2 □3 □4 □5 □6 □7 ☑8 □9□10 | Score: 7–8 | Relatively Strong Performance | This indicates that the station exhibits clear local cultural characteristics and a strong local identity, scoring 8. |
| Subject of Evaluation | City | Metro Line | Station Name | Source of Familiarity | Reason for Selection |
|---|---|---|---|---|---|
| ____________ (A Station with Which You Are Familiar) | ______ | ________ | ________ | □On-site Visit □Visual Materials □Design Documents □Comprehensive Understanding | ___________ |
| Dimension | Criterion | Low-Score Reference (1–4) | Mid-Range Score Reference (5–6) | High-Score Reference (7–10) |
|---|---|---|---|---|
| Authenticity (A) | Local (A1) | Local symbols, local memories, or locally distinctive features are relatively weak, making the station difficult to recognize overall. | Certain local elements or cultural memories are present, but their expression is relatively fragmented, with a moderate level of recognizability. | Local identity, local memories, or local cultural characteristics are clearly expressed, with a relatively high level of recognizability. |
| Ethnic (A2) | Ethnic cultural identity, ethnic symbols, or shared memories are weakly represented. | Ethnic cultural expression is present, but it is not sufficiently prominent or is only moderately integrated with the space. | Ethnic symbols, shared memories, or cultural distinctiveness are relatively clear. | |
| State (A3) | Public order, institutional norms, or official identity are weakly expressed. | Public order and institutional norms are basically reflected, but their systematic expression is moderate. | Institutional order is clear, rules are expressed consistently, and the sense of public order is relatively strong. | |
| Corporate (A4) | Commercial, corporate, or brand culture is weakly expressed, with a low level of spatial integration. | Commercial/brand expression is present, but its integration with the public cultural space is moderate. | Commercial/brand expression is clear and relatively well coordinated with the spatial environment. | |
| Rational (A5) | Circulation routes, functional zoning, or spatial organization are unclear, resulting in relatively low efficiency of use. | The spatial organization is generally reasonable and can meet ordinary circulation and usage needs. | Circulation routes are clear, functional organization is well defined, and spatial-use efficiency is relatively high. |
| Dimension | Criterion | Low-Score Reference (1–4) | Mid-Range Score Reference (5–6) | High-Score Reference (7–10) |
|---|---|---|---|---|
| Theatricality (B) | Exhibitionistic (B1) | Public display content is not readily apparent, with limited display information or relatively weak expressive impact. | Display content is present, but its mode of presentation and visibility are moderate. | Display content is clear, with relatively prominent visibility and expressive impact. |
| Glamorous (B2) | Visual appeal, aesthetic quality, or symbolic atmosphere is relatively weak. | A certain degree of appeal is present, but the distinctive qualities and creation of atmosphere are moderate. | Visual appeal, aesthetic characteristics, and symbolic atmosphere are relatively prominent. | |
| Neighbourly (B3) | Conditions for staying, interaction, coexistence, or community connection are relatively weak. | Certain conditions for interaction or staying are provided, but their everyday quality and friendliness are moderate. | Staying, interaction, and coexistence are relatively well supported, with a certain degree of community friendliness. | |
| Transgressive (B4) | Unconventional, experimental, or innovative expression is not readily apparent. | A certain degree of innovative expression is present, but the novelty of the experience is moderate. | Experimental or unconventional expression is relatively evident, and the experience is relatively novel. | |
| Formal (B5) | Rule-related guidance, organization of order, or formal cultural expression is insufficient. | Rule-related guidance and expressions of order are present, but their systematic organization is moderate. | The system of rules is clear, the spatial order is stable, and the degree of formality is relatively high. |
| Dimension | Criterion | Low-Score Reference (1–4) | Mid-Range Score Reference (5–6) | High-Score Reference (7–10) |
|---|---|---|---|---|
| Legitimacy (C) | Traditional (C1) | Historical continuity, traditional symbols, or expressions of cultural heritage are insufficient. | Traditional elements are present, but their expression is relatively superficial or their integration with the space is moderate. | Traditional symbols are clear, with a relatively strong sense of historical continuity and cultural inheritance. |
| Utilitarian (C2) | Convenience, service efficiency, or value in daily use is relatively weak. | Basic daily-use needs are met, but convenience and efficiency are moderate. | The functions are convenient, service efficiency is relatively high, and daily needs are addressed relatively well. | |
| Egalitarian (C3) | Equal access, accessibility, inclusiveness, or opportunities for sharing are insufficient. | The basic needs of the general population are met, but support for diverse groups is moderate. | Use by diverse groups is convenient, with relatively strong inclusiveness and opportunities for sharing. | |
| Self-expressive (C4) | Opportunities for individual expression, participation, or creation are relatively limited. | Certain opportunities for expression or participation are available, but their openness and continuity are moderate. | Individual expression, public participation, and creative activities are relatively well supported. | |
| Charismatic (C5) | Iconicity, symbolic appeal, or emotional appeal is relatively weak. | A certain degree of recognizability or appeal is present, but the emotional connection is moderate. | Iconicity is strong, with a relatively high degree of recognizability, making it easy to foster identification or emotional attachment. |
| Dimension | Criterion | Score (1–10) |
|---|---|---|
| Authenticity (A) | Local (A1) | □1□2 □3 □4 □5 □6 □7 □8 □9□10 |
| Ethnic (A2) | □1□2 □3 □4 □5 □6 □7 □8 □9□10 | |
| State (A3) | □1□2 □3 □4 □5 □6 □7 □8 □9□10 | |
| Corporate (A4) | □1□2 □3 □4 □5 □6 □7 □8 □9□10 | |
| Rational (A5) | □1□2 □3 □4 □5 □6 □7 □8 □9□10 | |
| Theatricality (B) | Exhibitionistic (B1) | □1□2 □3 □4 □5 □6 □7 □8 □9□10 |
| Glamorous (B2) | □1□2 □3 □4 □5 □6 □7 □8 □9□10 | |
| Neighbourly (B3) | □1□2 □3 □4 □5 □6 □7 □8 □9□10 | |
| Transgressive (B4) | □1□2 □3 □4 □5 □6 □7 □8 □9□10 | |
| Formal (B5) | □1□2 □3 □4 □5 □6 □7 □8 □9□10 | |
| Legitimacy (C) | Traditional (C1) | □1□2 □3 □4 □5 □6 □7 □8 □9□10 |
| Utilitarian (C2) | □1□2 □3 □4 □5 □6 □7 □8 □9□10 | |
| Egalitarian (C3) | □1□2 □3 □4 □5 □6 □7 □8 □9□10 | |
| Self-expressive (C4) | □1□2 □3 □4 □5 □6 □7 □8 □9□10 | |
| Charismatic (C5) | □1□2 □3 □4 □5 □6 □7 □8 □9□10 |
| Question | Answer |
|---|---|
| The Station’s Most Prominent Strength | ____________________ |
| The Station’s Most Evident Shortcoming | ____________________ |
| Whether the Station Is Suitable as an Exemplary Case | ____________________ |
| Recommendations for Improvement | ____________________ |
| Item | Answer |
|---|---|
| Under the Authenticity dimension, are there any important criteria that have not yet been considered in this study? | _____________________________ |
| Under the Theatricality dimension, are there any important criteria that have not yet been considered in this study? | _____________________________ |
| Under the Legitimacy dimension, are there any important criteria that have not yet been considered in this study? | _____________________________ |
| Do you believe there are any other important factors affecting the quality of public cultural service spaces in metro station areas? | _____________________________ |
| Item | Please Complete or Select |
|---|---|
| Gender | □Male □Female □Other |
| Age | □Under 18 □18—25 □26—35 □36—45 □46—60 □Over 60 |
| Occupation/Status | □Student □Teacher/Researcher □Planning and Design Professional □Rail Transit Professional □Public Art/Cultural Planning Professional □General Passenger □ Other: ____________ |
| Academic/Professional Background | □Urban Planning □Architectural Design □Environmental Design □Landscape Design □Public Art □Transportation Planning □Sociology □Other: ____________ |
| Whether You Regularly Use the Metro for Travel | □Frequently □Occasionally □Rarely |
| Level of Interest in Public Cultural Spaces in Metro Stations | □Not at All Interested □Not Very Interested □Moderately Interested □Quite Interested □Very Interested |
| Willingness to Participate in a Follow-up Interview | □Willing □Unwilling |
| Contact Information (Optional) | ________________________________________ |
| Item | Please Complete or Select |
|---|---|
| I have read the questionnaire instructions and understand the meaning of the 1–10 rating scale. | □ |
| I have rated only stations with which I am familiar or about which I have sufficient information. | □ |
| All 15 criteria for each evaluated station have been assigned a score from 1 to 10. | □ |
| I have made my assessments, to the best of my ability, according to the criterion descriptions rather than solely on the basis of my personal aesthetic preferences. | □ |
| Respondent’s Signature | ________________ |
| Date | ________________ |
References
- Liu, Y.; Yang, D.; Timmermans, H.J.; de Vries, B. Analysis of the Impact of Street-Scale Built Environment Design Near Metro Stations on Pedestrian and Cyclist Road Segment Choice: A Stated Choice Experiment. J. Transp. Geogr. 2020, 82, 102570. [Google Scholar] [CrossRef] [Scilit]
- Wei, Z.; Hu, Y.; Chen, Y.; Wang, T. Optimized Design of Cultural Space in Wuhan Metro: Analysis and Reflection Based on Multi-Source Data. Buildings 2025, 15, 2201. [Google Scholar] [CrossRef] [Scilit]
- Jasińska, A.; Kłosek-Kozłowska, K.; Danuta, K. Passengers’ Experience in Underground Non-Transfer Metro Stations: The Impact of Spatial Characteristics. Tunn. Undergr. Space Technol. 2024, 143, 105482. [Google Scholar] [CrossRef] [Scilit]
- Yang, X.; Yang, X.; Xue, S.; Zhang, J.; Pan, F.; Kang, Y.; Wang, Q. The Effect of Waiting Area Design at the Metro Platform on Passengers’ Alighting and Boarding Behaviors. Appl. Math. Comput. 2019, 358, 177–193. [Google Scholar] [CrossRef] [Scilit]
- Buchunde, S.; Saidi, S.; Ataeian, S. Impact of Station Design and Passengers Flow on Urban Rail Dwell Time: A Systemwide Analysis Using Apc and Avl Data. Transp. Res. Rec. 2024, 2678, 266–280. [Google Scholar] [CrossRef] [Scilit]
- Zhang, Q.; Yan, J.; Sun, T.; Liu, J. Image-building and Place Perception of the Subway Station’s Cultural Landscape: A Case Study in Xi’an, China. Land 2023, 12, 463. [Google Scholar] [CrossRef] [Scilit]
- González Martínez, P. Echo from the Underground: The Heritage Customization of Subway Infrastructures in Shanghai’s Listed Areas. Built Herit. 2021, 5, 5. [Google Scholar] [CrossRef] [Scilit]
- Mouratidis, K. Urban Planning and Quality of Life: A Review of Pathways Linking the Built Environment to Subjective Well-being. Cities 2021, 115, 103229. [Google Scholar] [CrossRef] [Scilit]
- Yang, J.; Cao, J.; Zhou, Y. Elaborating Non-linear Associations and Synergies of Subway Access and Land Uses with Urban Vitality in Shenzhen. Transp. Res. Part A Policy Pract. 2021, 144, 74–88. [Google Scholar] [CrossRef] [Scilit]
- Lang, W.; Lang, H.; Hui, E.C.; Chen, T.; Wu, J.; Jahre, M. Measuring Urban Vibrancy of Neighborhood Performance Using Social Media Data in Oslo, Norway. Cities 2022, 131, 103908. [Google Scholar] [CrossRef] [Scilit]
- Yang, L.; Wu, M.; Chen, Y.; Wu, C. Examining the Impact of the Urban Transportation System on Tangible and Intangible Vitality at the City-block Scale in Nanjing, China. Environ. Plan. B Urban Anal. City Sci. 2024, 51, 1833–1853. [Google Scholar] [CrossRef] [Scilit]
- Silver, D.; Clark, T.N.; Navarro Yáñez, C.J. Scenes: Social Context in an Age of Contingency. Soc. Forces 2010, 88, 2293–2324. [Google Scholar] [CrossRef] [Scilit]
- Papa, E.; Bertolini, L. Accessibility and Transit-oriented Development in European Metropolitan Areas. J. Transp. Geogr. 2015, 47, 70–83. [Google Scholar] [CrossRef] [Scilit]
- Zhang, Y.; Marshall, S.; Manley, E. Network Criticality and the Node-place-design Model: Classifying Metro Station Areas in Greater London. J. Transp. Geogr. 2019, 79, 102485. [Google Scholar] [CrossRef] [Scilit]
- Antrop, M. Why Landscapes of the Past Are Important for the Future. Landsc. Urban Plan. 2005, 70, 21–34. [Google Scholar] [CrossRef] [Scilit]
- Scannell, L.; Gifford, R. Defining Place Attachment: A Tripartite Organizing Framework. J. Environ. Psychol. 2010, 30, 1–10. [Google Scholar] [CrossRef] [Scilit]
- Yang, L.; van Dam, K.H.; Zhang, L. Developing Goals and Indicators for the Design of Sustainable and Integrated Transport Infrastructure and Urban Spaces. Sustainability 2020, 12, 9677. [Google Scholar] [CrossRef] [Scilit]
- Sdoukopoulos, A.; Pitsiava-Latinopoulou, M.; Basbas, S.; Papaioannou, P. Measuring Progress Towards Transport Sustainability Through Indicators: Analysis and Metrics of the Main Indicator Initiatives. Transp. Res. Part D Transp. Environ. 2019, 67, 316–333. [Google Scholar] [CrossRef] [Scilit]
- Silver, D.; Clark, T.N. The Power of Scenes. Cult. Stud. 2015, 29, 425–449. [Google Scholar] [CrossRef] [Scilit]
- Bisani, S.; Daye, M.; Mortimer, K. Legitimacy and Inclusivity in Place Branding. Ann. Tour. Res. 2024, 109, 103840. [Google Scholar] [CrossRef] [Scilit]
- Rickly, J.; Canavan, B. The Emergence of Authenticity: Phases of Tourist Experience. Ann. Tour. Res. 2024, 109, 103844. [Google Scholar] [CrossRef] [Scilit]
- Skandalis, A.; Banister, E.; Byrom, J. Spatial Authenticity and Extraordinary Experiences: Music Festivals and the Everyday Nature of Tourism Destinations. J. Travel Res. 2024, 63, 357–370. [Google Scholar] [CrossRef] [Scilit]
- Cnossen, B.; Bencherki, N. Artful Legitimacy: The Role of Materiality in Practices of Legitimation. Organ. Stud. 2023, 44, 919–938. [Google Scholar] [CrossRef] [Scilit]
- Suchman, M.C. Managing Legitimacy: Strategic and Institutional Approaches. Acad. Manag. Rev. 1995, 20, 571. [Google Scholar] [CrossRef] [Scilit]
- Wang, Y.; Zhou, Y. Metro Cultural Scene: A New Community Scale in Urban Scene Research. Environ. Plan. B Urban Anal. City Sci. 2024, 51, 1931–1947. [Google Scholar] [CrossRef] [Scilit]
- Wu, J.; Ouyang, G.; Wang, Y.; He, F.; He, R. Adaptive Reuse of Industrial Heritage in Mining Towns Based on Scene Theory: A Case Study of Meitanba Town, China. Buildings 2026, 16, 1317. [Google Scholar] [CrossRef] [Scilit]
- Klekotko, M. Mathematics of Culture, Or How to Count the Cultural Character of a City? Ask. Res. Methods 2021, 30, 81–104. [Google Scholar] [CrossRef] [Scilit]
- Navarro, C.J.; Mateos, C.; Rodríguez, M.J. Cultural Scenes, the Creative Class and Development in Spanish Municipalities. Eur. Urban Reg. Stud. 2014, 21, 301–317. [Google Scholar] [CrossRef] [Scilit]
- Miller, D.L.; Silver, D. Cultural Scenes and Contextual Effects on Political Attitudes. Eur. J. Cult. Political Sociol. 2015, 2, 241–266. [Google Scholar] [CrossRef] [Scilit]
- Silver, D. The American Scenescape: Amenities, Scenes and the Qualities of Local Life. Camb. J. Reg. Econ. Soc. 2012, 5, 97–114. [Google Scholar] [CrossRef] [Scilit]
- Heng, H.; Zhang, J.; Wu, H.; Xiong, J. Mapping Urban Scenescapes of Ethnicity: A Study of Tibetan Cultural Scenes in Downtown Chengdu, China. J. Asian Archit. Build. Eng. 2024, 23, 1796–1807. [Google Scholar] [CrossRef] [Scilit]
- Wu, C.; Wilkes, R.; Silver, D.; Clark, T.N. Current Debates in Urban Theory from a Scale Perspective: Introducing a Scenes Approach. Urban Stud. 2019, 56, 1487–1497. [Google Scholar] [CrossRef] [Scilit]
- Silver, D.; Miller, D. Cultural Scenes and Voting Patterns in Canada. Can. J. Politi. Sci. 2014, 47, 425–450. [Google Scholar] [CrossRef] [Scilit]
- Luo, J.; Jian, I.Y.; Chan, E.H.; Chen, W. Cultural Regeneration and Neighborhood Image from the Aesthetic Perspective: Case of Heritage Conservation Areas in Shanghai. Habitat Int. 2022, 129, 102689. [Google Scholar] [CrossRef] [Scilit]
- Mateos-Mora, C.; Navarro, J.C.; Rodríguez-García, M.J. A Guide for the Analysis of Cultural Scenes: A Measurement Proposal and Its Validation for the Spanish Case. Cult. Trends 2022, 31, 354–371. [Google Scholar] [CrossRef] [Scilit]
- Wu, J.; Zheng, H.; Wang, T.; Clark, T.N. Bohemian Cultural Scenes and Creative Development of Chinese Cities: An Analysis of 65 Cities Using Cultural Amenity Data. Sustainability 2021, 13, 5260. [Google Scholar] [CrossRef] [Scilit]
- Ministry of Transport of the People’s Republic of China. China’s Urban Rail Transit Operating Mileage Exceeds 11,710 km. 2026. Available online: https://www.mot.gov.cn/xinwen/jiaotongyaowen/202601/t20260129_4199263.html (accessed on 20 July 2026).
- Liu, Y.; He, S. From the Pearl River Delta to the Greater Bay Area: State Spatial Selectivity, Contingent Socio-spatial Processes, and Variegated Geographies of China’s City-regionalism. Trans. Plan. Urban Res. 2024, 3, 216–240. [Google Scholar] [CrossRef] [Scilit]
- Zhang, X.; Li, Y.; Zhou, C.; Luan, X.; Yuan, F. Rescaling of the Land Regime in the Making of City-regions: A Case Study of China’s Pearl River Delta. Urban Stud. 2023, 60, 483–500. [Google Scholar] [CrossRef] [Scilit]
- Zhao, Y.; Jin, K.; Zhang, D.; Wang, L.; Li, J.; Dai, T. Transforming Urban Landscapes: Reuse of Heritage Sites Through Multi-value Interpretations in Xi’an, China. Land 2024, 13, 948. [Google Scholar] [CrossRef] [Scilit]
- Eisenhardt, K.M. Building Theories from Case Study Research. Acad. Manag. Rev. 1989, 14, 532. [Google Scholar] [CrossRef] [Scilit]
- Käär, S.; Brosig, C.; Westner, M.; Strahringer, S. Short and Sweet: Multiple Mini Case Studies as a Form of Rigorous Case Study Research. Inf. Syst. E-Bus. Manag. 2024, 22, 351–384. [Google Scholar] [CrossRef] [Scilit]
- Mauksch, S.; Von der Gracht, H.A.; Gordon, T.J. Who Is an Expert for Foresight? a Review of Identification Methods. Technol. Forecast. Soc. Change 2020, 154, 119982. [Google Scholar] [CrossRef] [Scilit]
- Tseng, P.; Pilcher, N. Evaluating the Key Factors of Green Port Policies in Taiwan Through Quantitative and Qualitative Approaches. Transp. Policy 2019, 82, 127–137. [Google Scholar] [CrossRef] [Scilit]
- Hallowell, M.R.; Gambatese, J.A. Qualitative Research: Application of the Delphi Method to Cem Research. J. Constr. Eng. Manag. 2010, 136, 99–107. [Google Scholar] [CrossRef] [Scilit]
- Foroozesh, F.; Monavari, S.M.; Salmanmahiny, A.; Robati, M.; Rahimi, R. Assessment of Sustainable Urban Development Based on a Hybrid Decision-making Approach: Group Fuzzy Bwm, Ahp, and Topsis–gis. Sustain. Cities Soc. 2022, 76, 103402. [Google Scholar] [CrossRef] [Scilit]
- Ishizaka, A.; Mu, E. What Is So Special About the Analytic Hierarchy and Network Process? Ann. Oper. Res. 2023, 326, 625–634. [Google Scholar] [CrossRef] [Scilit]
- Ciardiello, F.; Genovese, A. A Comparison Between Topsis and Saw Methods. Ann. Oper. Res. 2023, 325, 967–994. [Google Scholar] [CrossRef] [Scilit]
- Ibraeva, A.; Correia, G.H.A.; Silva, C.; Antunes, A.P. Transit-Oriented Development: A Review of Research Achievements and Challenges. Transp. Res. Part A Policy Pract. 2020, 132, 110–130. [Google Scholar] [CrossRef] [Scilit]
- Vale, D.S.; Viana, C.M.; Pereira, M. The Extended Node-place Model at the Local Scale: Evaluating the Integration of Land Use and Transport for Lisbon’s Subway Network. J. Transp. Geogr. 2018, 69, 282–293. [Google Scholar] [CrossRef] [Scilit]
- Rollero, C.; De Piccoli, N. Place Attachment, Identification and Environment Perception: An Empirical Study. J. Environ. Psychol. 2010, 30, 198–205. [Google Scholar] [CrossRef] [Scilit]
- Matthews, T.; Gadaloff, S. Public Art for Placemaking and Urban Renewal: Insights from Three Regional Australian Cities. Cities 2022, 127, 103747. [Google Scholar] [CrossRef] [Scilit]


| Dimension | Selection Basis | Original Bipolar Attribute | Selection Basis | Indicator Layer | Definition | Definition Basis |
|---|---|---|---|---|---|---|
| Authenticity (A) | [19,25,26] | Local | [19,25,27,28] | Local (A1) | Place-based identity, local authenticity, local memory, and culturally recognizable characteristics of a place. | [29,30] |
| Global | ||||||
| Ethnic | Ethnic (A2) | Collective cultural identity, ethnic or group-related symbols, shared memory, and culturally distinctive meanings. | [31] | |||
| Non-ethnic | ||||||
| State | State (A3) | Public authority, institutional order, civic regulation, official identity, and state-related symbolic representation. | [27,32] | |||
| Anti-state | ||||||
| Corporate | Corporate (A4) | Commercial organization, brand presence, market participation, and corporate involvement in spatial production and service provision. | [33] | |||
| Independent | ||||||
| Rational | Rational (A5) | Logical order, functional clarity, efficiency, and rule-based organization in spatial or social arrangements. | [25,32] | |||
| Non-rational | ||||||
| Theatricality (B) | Exhibitionistic | Exhibitionistic (B1) | Public display, visibility, performance, self-presentation, and the outward presentation of individual or collective identity. | [28] | ||
| Reserved | ||||||
| Glamorous | Glamorous (B2) | Aesthetic appeal, visual attraction, stylishness, distinction, and desirable symbolic atmosphere. | [19,34] | |||
| Ordinary | ||||||
| Neighbourly | Neighbourly (B3) | Social familiarity, friendliness, mutual support, everyday interaction, and community-oriented relations. | [28] | |||
| Distant | ||||||
| Transgressive | Transgressive (B4) | Unconventionality, experimentation, boundary-crossing, and resistance to ordinary or established norms. | [35] | |||
| Conformist | ||||||
| Formal | Formal (B5) | Standardization, rule-governed behavior, institutional regulation, orderliness, and formal modes of cultural expression. | [27,35] | |||
| Informal | ||||||
| Legitimacy (C) | Traditional | Traditional (C1) | Historical continuity, inherited meanings, cultural heritage, customs, and established local values. | [30] | ||
| Novel | ||||||
| Utilitarian | Utilitarian (C2) | Practical usefulness, functional value, service efficiency, convenience, and orientation toward everyday needs. | [27] | |||
| Unproductive | ||||||
| Egalitarian | Egalitarian (C3) | Equality, equal access, non-hierarchical relations, inclusive participation, and shared opportunities. | [27] | |||
| Particular | ||||||
| Self-expressive | Self-expressive (C4) | Personal identity, creativity, individuality, cultural attitudes, and opportunities for expressive participation. | [33,36] | |||
| Scripted | ||||||
| Charismatic | Charismatic (C5) | Symbolic attraction, iconicity, emotional appeal, cultural aura, and the capacity to generate recognition or attachment. | [36] | |||
| Routine |
| Number | Professional Title | Work Years | Expertise Area |
|---|---|---|---|
| Expert 1 | Senior Engineer | ≥10 years | Urban Planning/Urban Design |
| Expert 2 | Professor-level Senior Engineer | ≥10 years | Human Geography |
| Expert 3 | Engineer | ≥10 years | Urban Planning/Urban Design |
| Expert 4 | Senior Engineer | ≥10 years | Architecture/Environmental Design |
| Expert 5 | Senior Engineer | ≥10 years | Transportation Planning/Transportation Engineering |
| Expert 6 | Senior Engineer | ≥10 years | Transportation Planning/Transportation Engineering |
| Expert 7 | Senior Engineer | ≥10 years | Transportation Planning/Transportation Engineering |
| Expert 8 | Professor-level Senior Engineer | ≥10 years | Transportation Planning/Transportation Engineering |
| Expert 9 | Senior Engineer | ≥10 years | Architecture/Environmental Design |
| Expert 10 | Researcher | ≥10 years | Transportation Planning/Transportation Engineering |
| Number | Professional Background | Work Years | Area of Expertise |
|---|---|---|---|
| Expert 1 | Planning and Design Professional | 5–10 years | Environmental Design |
| Expert 2 | Planning and Design Professional | 5–10 years | Environmental Design |
| Expert 3 | Public Art and Cultural Planning Professional | 5–10 years | Environmental Design |
| Expert 4 | Public Art and Cultural Planning Professional | 5–10 years | Public Art |
| Expert 5 | Planning and Design Professional | 5–10 years | Environmental Design |
| Expert 6 | Public Art and Cultural Planning Professional | 5–10 years | Architectural Design |
| Expert 7 | Planning and Design Professional | 5–10 years | Architectural Design |
| Expert 8 | Public Art and Cultural Planning Professional | ≥10 years | Environmental Design |
| Expert 9 | Planning and Design Professional | ≥10 years | Urban Planning |
| Expert 10 | University Faculty/Researcher | ≥10 years | Architectural Design |
| Expert 11 | Public Art and Cultural Planning Professional | 5–10 years | Environmental Design |
| Expert 12 | Planning and Design Professional | 5–10 years | Environmental Design |
| Expert 13 | Rail Transit Professional | ≥10 years | Urban Planning |
| Expert 14 | Planning and Design Professional | ≥10 years | Urban Planning |
| Expert 15 | University Faculty/Researcher | ≥10 years | Architectural Design |
| Expert 16 | Public Art and Cultural Planning Professional | 5–10 years | Environmental Design |
| Expert 17 | Public Art and Cultural Planning Professional | ≥10 years | Environmental Design |
| Dimension | Dimension Weight | Criterion | Global Weight |
|---|---|---|---|
| Authenticity (A) | 0.498 | Local (A1) | 0.027 |
| Ethnic (A2) | 0.032 | ||
| State (A3) | 0.028 | ||
| Corporate (A4) | 0.021 | ||
| Rational (A5) | 0.041 | ||
| Theatricality (B) | 0.206 | Exhibitionistic (B1) | 0.091 |
| Glamorous (B2) | 0.064 | ||
| Neighbourly (B3) | 0.063 | ||
| Transgressive (B4) | 0.070 | ||
| Formal (B5) | 0.046 | ||
| Legitimacy (C) | 0.296 | Traditional (C1) | 0.138 |
| Utilitarian (C2) | 0.082 | ||
| Egalitarian (C3) | 0.078 | ||
| Self-expressive (C4) | 0.127 | ||
| Charismatic (C5) | 0.092 |
| City | Metro Line | Sample Station | Distance from the Positive Ideal Solution | Distance from the Negative Ideal Solution | Relative Closeness to the Ideal Solution |
|---|---|---|---|---|---|
| Xi’an | Line 8 | Qingshaonianzhongxin Station | 0.018 | 0.064 | 0.782 |
| Shenzhen | Line 16 | Shuanglong Station | 0.020 | 0.063 | 0.755 |
| Shenzhen | Line 16 | Pingshanwei Station | 0.021 | 0.062 | 0.750 |
| Shenzhen | Line 16 | Tianxin Station | 0.026 | 0.062 | 0.704 |
| Xi’an | Line 8 | Hanyao Station | 0.029 | 0.058 | 0.669 |
| Xi’an | Line 8 | Jingshangcun Station | 0.029 | 0.050 | 0.633 |
| Shenzhen | Line 16 | Universiade Center Station | 0.032 | 0.055 | 0.629 |
| Foshan | Line 3 | Daliang Zhonglou Station | 0.033 | 0.048 | 0.593 |
| Xi’an | Line 8 | Zhiwuyuan Station | 0.035 | 0.049 | 0.585 |
| Xi’an | Line 8 | Mutasixi Station | 0.039 | 0.039 | 0.500 |
| Foshan | Line 3 | Dongping Station | 0.041 | 0.038 | 0.483 |
| Foshan | Line 3 | Shunde OcT Harbour PLUs Station | 0.061 | 0.020 | 0.242 |
| Foshan | Line 3 | Lunjiao station | 0.0670 | 0.016 | 0.183 |
| Criterion | ANP Global Weight | Rank | AHP Global Weight | Rank | Ranking Change |
|---|---|---|---|---|---|
| Local (A1) | 0.027 | 14 | 0.163 | 1 | 13 |
| Ethnic (A2) | 0.032 | 12 | 0.154 | 2 | 10 |
| State (A3) | 0.028 | 13 | 0.126 | 3 | 10 |
| Corporate (A4) | 0.021 | 15 | 0.052 | 9 | 6 |
| Rational (A5) | 0.041 | 11 | 0.057 | 7 | 4 |
| Exhibitionistic (B1) | 0.091 | 4 | 0.043 | 10 | −6 |
| Glamorous (B2) | 0.064 | 8 | 0.056 | 8 | 0 |
| Neighbourly (B3) | 0.063 | 9 | 0.019 | 14 | −5 |
| Transgressive (B4) | 0.070 | 7 | 0.018 | 15 | −8 |
| Formal (B5) | 0.046 | 10 | 0.029 | 13 | −3 |
| Traditional (C1) | 0.138 | 1 | 0.034 | 12 | −11 |
| Utilitarian (C2) | 0.082 | 5 | 0.037 | 11 | −6 |
| Egalitarian (C3) | 0.078 | 6 | 0.066 | 6 | 0 |
| Self-expressive (C4) | 0.127 | 2 | 0.071 | 5 | −3 |
| Charismatic (C5) | 0.092 | 3 | 0.072 | 4 | −1 |
| City | Metro Line | Sample Station | ANP-TOPSISRelative Closeness (Ci) | Rank | AHP-TOPSIS Relative Closeness (Ci) | Rank | Ranking Change |
|---|---|---|---|---|---|---|---|
| Xi’an | Line 8 | Qingshaonianzhongxin Station | 0.782 | 1 | 0.915 | 1 | 0 |
| Shenzhen | Line 16 | Shuanglong Station | 0.755 | 2 | 0.637 | 7 | 5 |
| Shenzhen | Line 16 | Pingshanwei Station | 0.750 | 3 | 0.721 | 5 | 2 |
| Shenzhen | Line 16 | Tianxin Station | 0.704 | 4 | 0.768 | 2 | −2 |
| Xi’an | Line 8 | Hanyao Station | 0.669 | 5 | 0.743 | 3 | −2 |
| Xi’an | Line 8 | Jingshangcun Station | 0.633 | 6 | 0.730 | 4 | −2 |
| Shenzhen | Line 16 | Universiade Center Station | 0.629 | 7 | 0.621 | 8 | 1 |
| Foshan | Line 3 | Daliang Zhonglou Station | 0.593 | 8 | 0.688 | 6 | −2 |
| Xi’an | Line 8 | Zhiwuyuan Station | 0.585 | 9 | 0.592 | 9 | 0 |
| Xi’an | Line 8 | Mutasixi Station | 0.500 | 10 | 0.540 | 10 | 0 |
| Foshan | Line 3 | Dongping Station | 0.483 | 11 | 0.496 | 11 | 0 |
| Foshan | Line 3 | Shunde OcT Harbour PLUs Station | 0.242 | 12 | 0.168 | 12 | 0 |
| Foshan | Line 3 | Lunjiao station | 0.183 | 13 | 0.160 | 13 | 0 |
| City | Metro Line | Sample Station | Number of Evaluators | Weighted Kappa |
|---|---|---|---|---|
| Shenzhen | Line 16 | Shuanglong Station | 2 | 0.060 |
| Shenzhen | Line 16 | Universiade Center Station | 2 | 0.015 |
| Xi’an | Line 8 | Hanyao Station | 3 | 0.106 |
| Foshan | Line 3 | Dongping Station | 5 | 0.031 |
| Stakeholder | Applicable Research Outcome | Specific Beneficiary Approach |
|---|---|---|
| Urban rail transit operators | 15 evaluation indicators, weighting results, and station evaluation results | Identifying weaknesses in cultural displays, public services, and spatial experiences to provide a basis for station maintenance, content updates, and operational optimization |
| Urban planning, transport, and cultural management departments | Comprehensive evaluation framework, station rankings, and comparative analysis of differences | Assisting in identifying the construction and operational needs of different stations, and providing references for public cultural service resource allocation and related policy formulation |
| Planning, architecture, and environmental design institutions | Three-dimensional evaluation structure, key indicator weights, and station evaluation results | Determining priorities for cultural recognition, public services, public participation, and experiential expression in design and renovation projects, supporting differentiated optimization |
| Urban public cultural institutions and community organizations | Key indicators including Traditional, Self-expressive, Charismatic, and Exhibitionistic | Clarifying intervention directions for local cultural displays, community participation, and public expression, and providing references for Exhibitionistic, public art, and cultural activity organization |
| Metro passengers and other space users | Public cultural service spaces after evaluation and optimization | Potentially gaining clearer local cultural recognition, improved public services, more inclusive participation opportunities, and better spatial experiences |
Disclaimer/Publisher’s Note: The statements, opinions and data contained in all publications are solely those of the individual author(s) and contributor(s) and not of MDPI and/or the editor(s). MDPI and/or the editor(s) disclaim responsibility for any injury to people or property resulting from any ideas, methods, instructions or products referred to in the content. |
© 2026 by the authors. Licensee MDPI, Basel, Switzerland. This article is an open access article distributed under the terms and conditions of the Creative Commons Attribution (CC BY) license.
Share and Cite
Lu, C.; Cai, Y.; Xu, M. Constructing an Evaluation Framework and Developing Optimization Strategies for Public Cultural Service Spaces in Metro Station Areas: A Scene Theory. Urban Sci. 2026, 10, 511. https://doi.org/10.3390/urbansci10090511
Lu C, Cai Y, Xu M. Constructing an Evaluation Framework and Developing Optimization Strategies for Public Cultural Service Spaces in Metro Station Areas: A Scene Theory. Urban Science. 2026; 10(9):511. https://doi.org/10.3390/urbansci10090511
Chicago/Turabian StyleLu, Chulin, Yajun Cai, and Muchuan Xu. 2026. "Constructing an Evaluation Framework and Developing Optimization Strategies for Public Cultural Service Spaces in Metro Station Areas: A Scene Theory" Urban Science 10, no. 9: 511. https://doi.org/10.3390/urbansci10090511
APA StyleLu, C., Cai, Y., & Xu, M. (2026). Constructing an Evaluation Framework and Developing Optimization Strategies for Public Cultural Service Spaces in Metro Station Areas: A Scene Theory. Urban Science, 10(9), 511. https://doi.org/10.3390/urbansci10090511