Article

Integrating Local Climate Zones, Landscape Metrics, and Remote Sensing in Understanding Contemporary Urban Thermal Dynamics in an Arid Metropolis in Qatar


by
Rana N. Jawarneh
1,*,
Madhavi Indraganti
2,
Sultana F. Al-Nabet
2,
Abdulrahman H. Al-Mana
3 and
Aamna Azad
2
1
Applied Geography and GIS Program, Department of Humanities, Qatar University, Doha P.O. Box 2713, Qatar
2
Department of Architecture and Urban Planning, Qatar University, Doha P.O. Box 2713, Qatar
3
Spatial Planning Unit, Ministry of Municipality, Doha P.O. Box 636, Qatar
*
Author to whom correspondence should be addressed.
Urban Sci. 2026, 10(7), 395; https://doi.org/10.3390/urbansci10070395
Submission received: 28 April 2026 / Revised: 23 May 2026 / Accepted: 27 May 2026 / Published: 10 July 2026

Abstract

Urban heat intensification is an increasing concern in rapidly urbanizing arid cities, where extreme climatic conditions intersect with expansive urban growth. This study examines the spatiotemporal dynamics of urban thermal patterns in the Doha metropolitan region, Qatar, by integrating multi-season remote sensing with urban morphological analysis. Seasonal composites of land surface temperature (LST), Urban Heat Island (UHI) intensity, and Normalized Difference Vegetation Index (NDVI) were derived from Landsat 8–9 Collection 2 Level-2 imagery across eight seasons from Spring 2024 to Winter 2026. Urban form was characterized using Local Climate Zones (LCZs) and quantified through class-level landscape metrics, i.e., Largest Patch Index (LPI), Number of Patches (NP), and CLUMPY. The results showed a pronounced seasonal variability, with LST ranging from approximately 12.5 °C in winter to 61.3 °C in summer, and intra-urban UHI exceeding 10 °C during peak conditions. The bare soil/sand, with relative coverage of 52.84% and LPI of 25.45%, and the large low-rise, with relative coverage of 38.60% and LPI of 14.70%, typologies dominate the landscape, forming highly aggregated spatial structures, while vegetation cover remained minimal. Weak negative relationships between NDVI and thermal indicators revealed that vegetation alone had limited explanatory power. In contrast, LCZ-based analysis revealed a better thermal differentiation across urban typologies, with compact forms associated with higher thermal intensities. These findings highlight the dominant role of urban morphology and spatial configuration in shaping thermal patterns and support the need for morphology-sensitive planning strategies in arid urban environments.

1. Introduction

Arid cities are increasingly exposed to extreme thermal conditions, a challenge that is intensifying due to climate change, rapid urbanization, and expanding impervious surfaces, with projections indicating that parts of the Arabian Gulf may experience heat conditions approaching limits of human adaptability [1]. Recent global assessments indicate a marked rise in the frequency, duration, and severity of extreme heat events, with urban areas experiencing disproportionate impacts due to the Urban Heat Island (UHI) effect [2,3,4]. These impacts are particularly acute in Middle Eastern cities, where summer temperatures have exceeded 55 °C in recent years, placing considerable strain on urban livability, public health, and infrastructure systems [3]. In the Qatari context, these challenges have been formally acknowledged in national planning and environmental policy frameworks, which emphasize climate-responsive urban development, heat mitigation strategies, and sustainable land use planning as core priorities [5]. Recent global-scale analyses further confirm that urban areas across diverse climatic contexts exhibit increasing land surface temperature (LST) trends, with built-up zones consistently recording higher temperatures, while vegetated areas demonstrate significant cooling effects [6].
Remote sensing-based studies indicate that these transformations have been accompanied by measurable increases in LST across Qatar’s urban regions, with pronounced warming observed in densely built, industrial, and sparsely vegetated areas, underscoring the growing thermal burden associated with urban expansion [7,8]. The UHI phenomenon in arid cities is primarily driven by land use change, urban morphology, surface material properties, and anthropogenic heat emissions [9]. In dense and industrial land uses, these factors contribute to elevated land surface temperatures, increased cooling energy demand, and heightened health risks during extreme heat events [10]. Extensive literature also demonstrates that land use and land cover transformations are among the primary drivers of LST variability, with indices such as Normalized Difference Vegetation Index (NDVI) and Normalized Difference Built-up Index (NDBI) consistently identified as key predictors of urban thermal patterns [11].
While in situ meteorological observations and microclimate models provide valuable insights, they often lack the spatial continuity required to capture fine-scale thermal variability across complex metropolitan landscapes [12]. Remote sensing-derived LST has therefore become a widely adopted proxy for assessing urban thermal environments, particularly in data-scarce regions [13]. When combined with land use classification frameworks, such data enable systematic evaluation of how urban form and surface characteristics influence thermal conditions. Among these frameworks, the Local Climate Zone (LCZ) classification provides a standardized, globally validated approach for linking urban morphology, land cover, and thermal behavior [14]. LCZs have been shown to effectively capture intra-urban temperature variability across climatic contexts, including arid and semi-arid cities [15,16]. Moreover, intra-urban environments exhibit substantial microclimatic variability driven by differences in land cover composition and surface characteristics, reinforcing the need for spatially explicit analytical frameworks to capture localized thermal dynamics [17].
Qatar is a clear example of how rapid development and energy use intensify climate impacts in arid cities. It ranks among the world’s highest in terms of gross domestic product (GDP) per capita, reflecting a highly energy-intensive development trajectory [18]. This economic profile is accompanied by exceptionally high per capita CO2 emissions driven primarily by electricity generation, cooling demand, transport, and industrial activity [19,20]. In hot arid cities, such elevated energy consumption directly contributes to anthropogenic heat emissions, which interact with urban form, surface materials, and climatic extremes to amplify land surface temperatures and intensify urban heat stress [21]. These dynamics are particularly consequential in rapidly expanding urban centers of Qatar, where economic growth, spatial expansion, and climate exposure converge to heighten vulnerability to extreme heat and associated climate risks. In this context, evidence-based urban planning and climate-responsive design have emerged as critical tools for mitigating thermal stress and enhancing resilience in hot arid environments [22]. While Qatar has already established climate-responsive planning and environmental frameworks, the key challenge is strengthening place-specific empirical evidence on the performance of vegetation-based and other heat mitigation interventions under its extreme hot–arid conditions, thereby enabling broader strategic guidance to be translated into spatially explicit, operational planning responses.
Beyond categorical differentiation of urban typologies, recent advances in urban morphology research emphasize the importance of quantifying spatial structure through landscape ecology (i.e., patch-level, landscape-level, and class-level metrics). This is useful, as LCZ typologies classify urban surface types, but they do not, by themselves, capture how those types are spatially arranged. To address this, the study uses class-level landscape metrics to quantify compositional dominance and configurational structure, allowing assessment of how both LCZ type and spatial arrangement relate to seasonal thermal variability. Class-level spatial indicators enable systematic measurement of compositional dominance, aggregation, fragmentation, and internal cohesion within complex urban mosaics. At a disciplinary level, raster-based spatial metrics have become central to sustainable urban morphology research. Recent studies demonstrate that landscape-based measures and spatial statistical approaches are widely employed to link urban form characteristics with environmental performance outcomes, including thermal regulation [23,24,25]. The integration of LCZ mapping with landscape metrics has been empirically shown to provide a robust framework for linking urban spatial structure with thermal variability. Zhang et al. (2022) demonstrate that both LCZ composition and configuration significantly influence surface UHI intensity, with compositional dominance often exerting stronger effects than configurational attributes [26]. This coupling of LCZ classification with class-level spatial metrics therefore offers a theoretically grounded and empirically validated approach for examining how structural urban characteristics relate to seasonal thermal patterns.
While prior studies have established the relationship between LCZ spatial patterns and Surface Urban Heat Island (SUHI) using single-year, regression-based frameworks, these approaches are typically limited to static temporal snapshots and are often applied in non-arid environments where vegetation plays a more dominant role in thermal regulation [26]. In contrast, the present study extends this framework by incorporating multi-seasonal analysis across a two-year period, integrating an expanded set of landscape metrics to capture both compositional dominance and configurational structure, and explicitly examining vegetation–thermal interactions through NDVI. In addition, a context-specific urban-normalized UHI definition is adopted to isolate intra-urban thermal variability in a desert environment, where conventional urban–rural comparisons may be less meaningful.
Despite the growing body of international literature, empirical studies that integrate LCZ-based thermal analysis with seasonal assessment, vegetation dynamics, and class-level spatial configuration remain limited for Gulf cities. In the context of Qatar’s urban centers, existing research has documented long-term UHI intensification and land cover change, yet detailed seasonal evaluations that explicitly connect urban form, vegetation health, and structural configuration with thermal stress remain scarce [7,8]. To address this gap, the present study investigates the seasonal spatial dynamics of urban thermal conditions across major urban centers in Qatar. Specifically, the study has the following objectives: (a) to examine the spatial and seasonal associations between LST, UHI intensity, and LCZ typologies across urban centers in Qatar; (b) to analyze relationships between LCZ compositional dominance (e.g., Percent of land (PLAND), Largest Patch Index (LPI)) and configurational properties (e.g., aggregation, contiguity, fragmentation) and observed urban thermal patterns; (c) to evaluate statistical associations between vegetation density (as indicated by NDVI) and intra-urban thermal variability across seasons; and (d) to derive evidence-informed insights to support climate-responsive urban planning and heat mitigation strategies in arid metropolitan contexts. By situating the findings within both international urban climate scholarship and the local planning context of Qatar, the study advances morphology-sensitive urban heat diagnostics in rapidly urbanizing desert cities.

2. Materials and Methods

2.1. Study Area

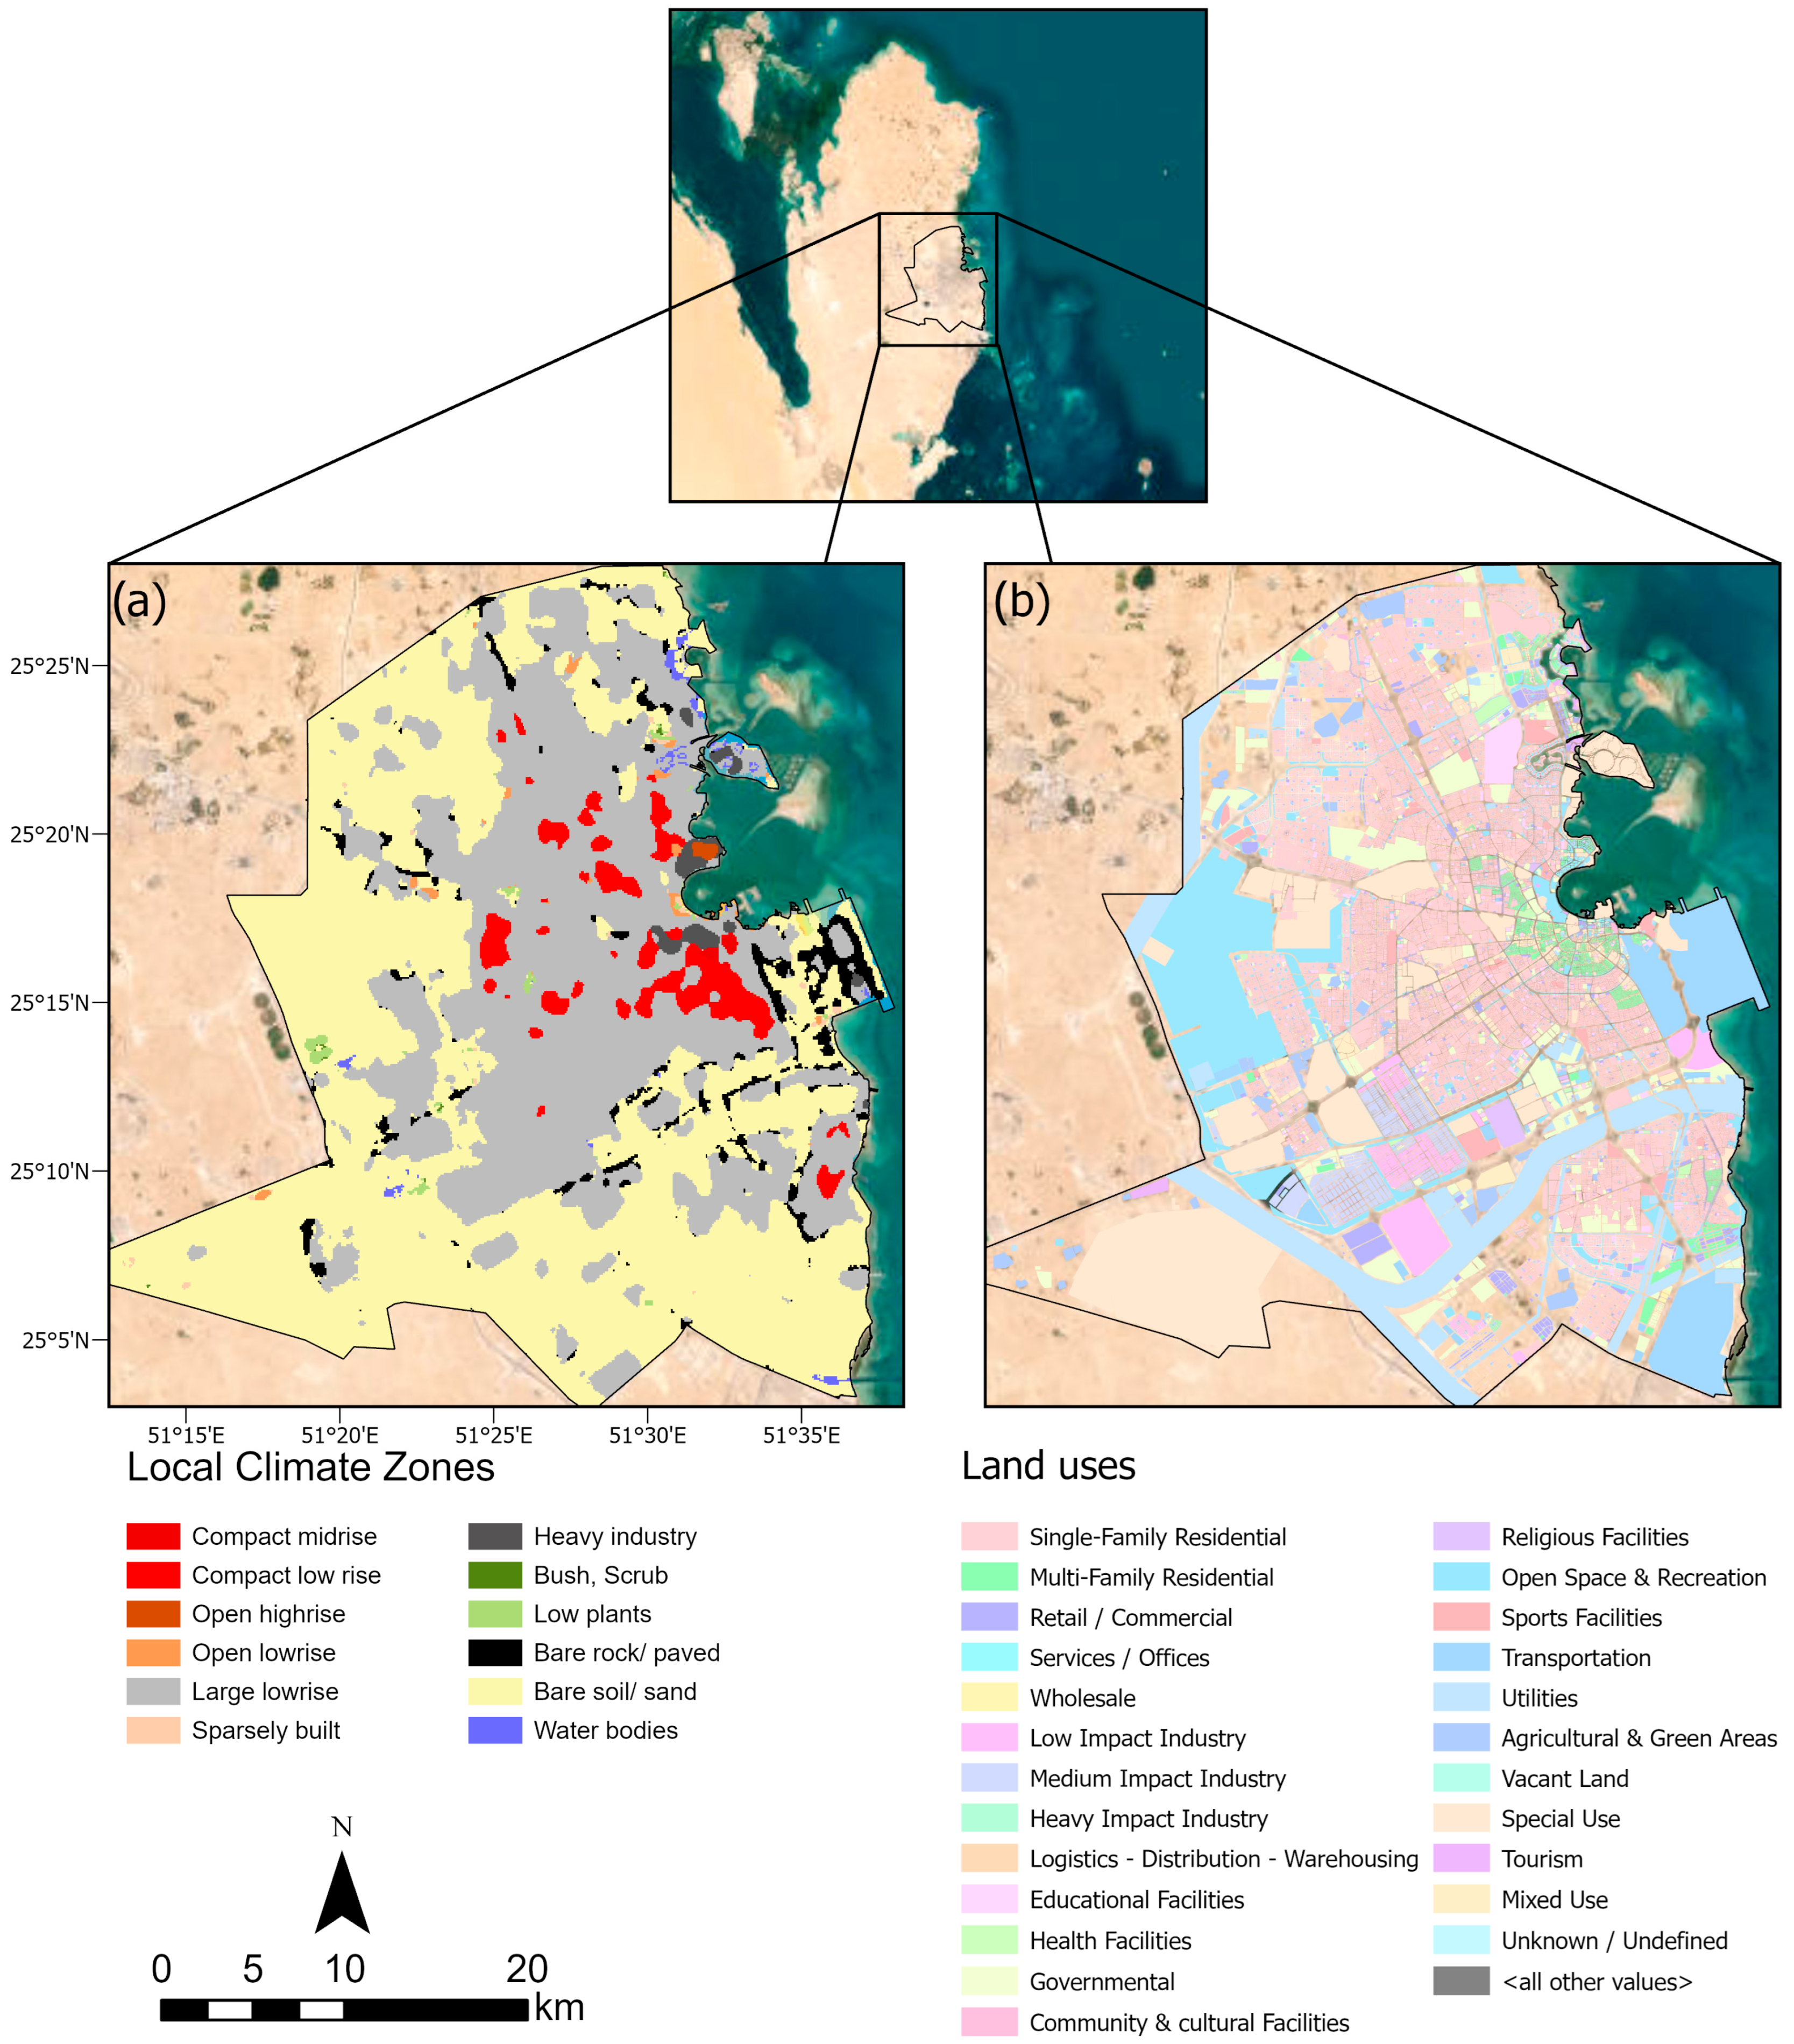
The study area encompasses the major urban centers of Qatar, including the entire Doha Municipality and parts of Al Daayen, Al Rayyan, Umm Salal, and Al Wakrah Municipalities, along the eastern coast of Qatar, with an area of approximately 1614 km2 (Figure 1). Qatar is classified as an arid environment, with limited winter precipitation, mild winters, and hot summers. It has limited natural vegetation and extensive barren areas, which together dominate 92.11% of the land area, while built-up surfaces account for about 4.53% of the land area. Permanent water bodies account for 1.74%, and cropland represents approximately 1.21% of the total land cover [27].
The land uses in our study area include low-, mid-, and high-rise residential districts, mixed-use developments, industrial zones, civic infrastructure, and urban green spaces. The spatial distribution of these land use and land cover (LULC) categories was examined using the Local Climate Zone (LCZ) classification framework (Figure 2). Doha Municipality accommodates approximately 1.186 million residents, representing a substantial share of Qatar’s total population of 2.846 million, according to the 2020 Census [28]. However, the present study area extends beyond Doha’s administrative boundary, meaning that the population considered in this study is substantially larger than the Doha Municipality figure alone.

2.2. Data Sources and Methods

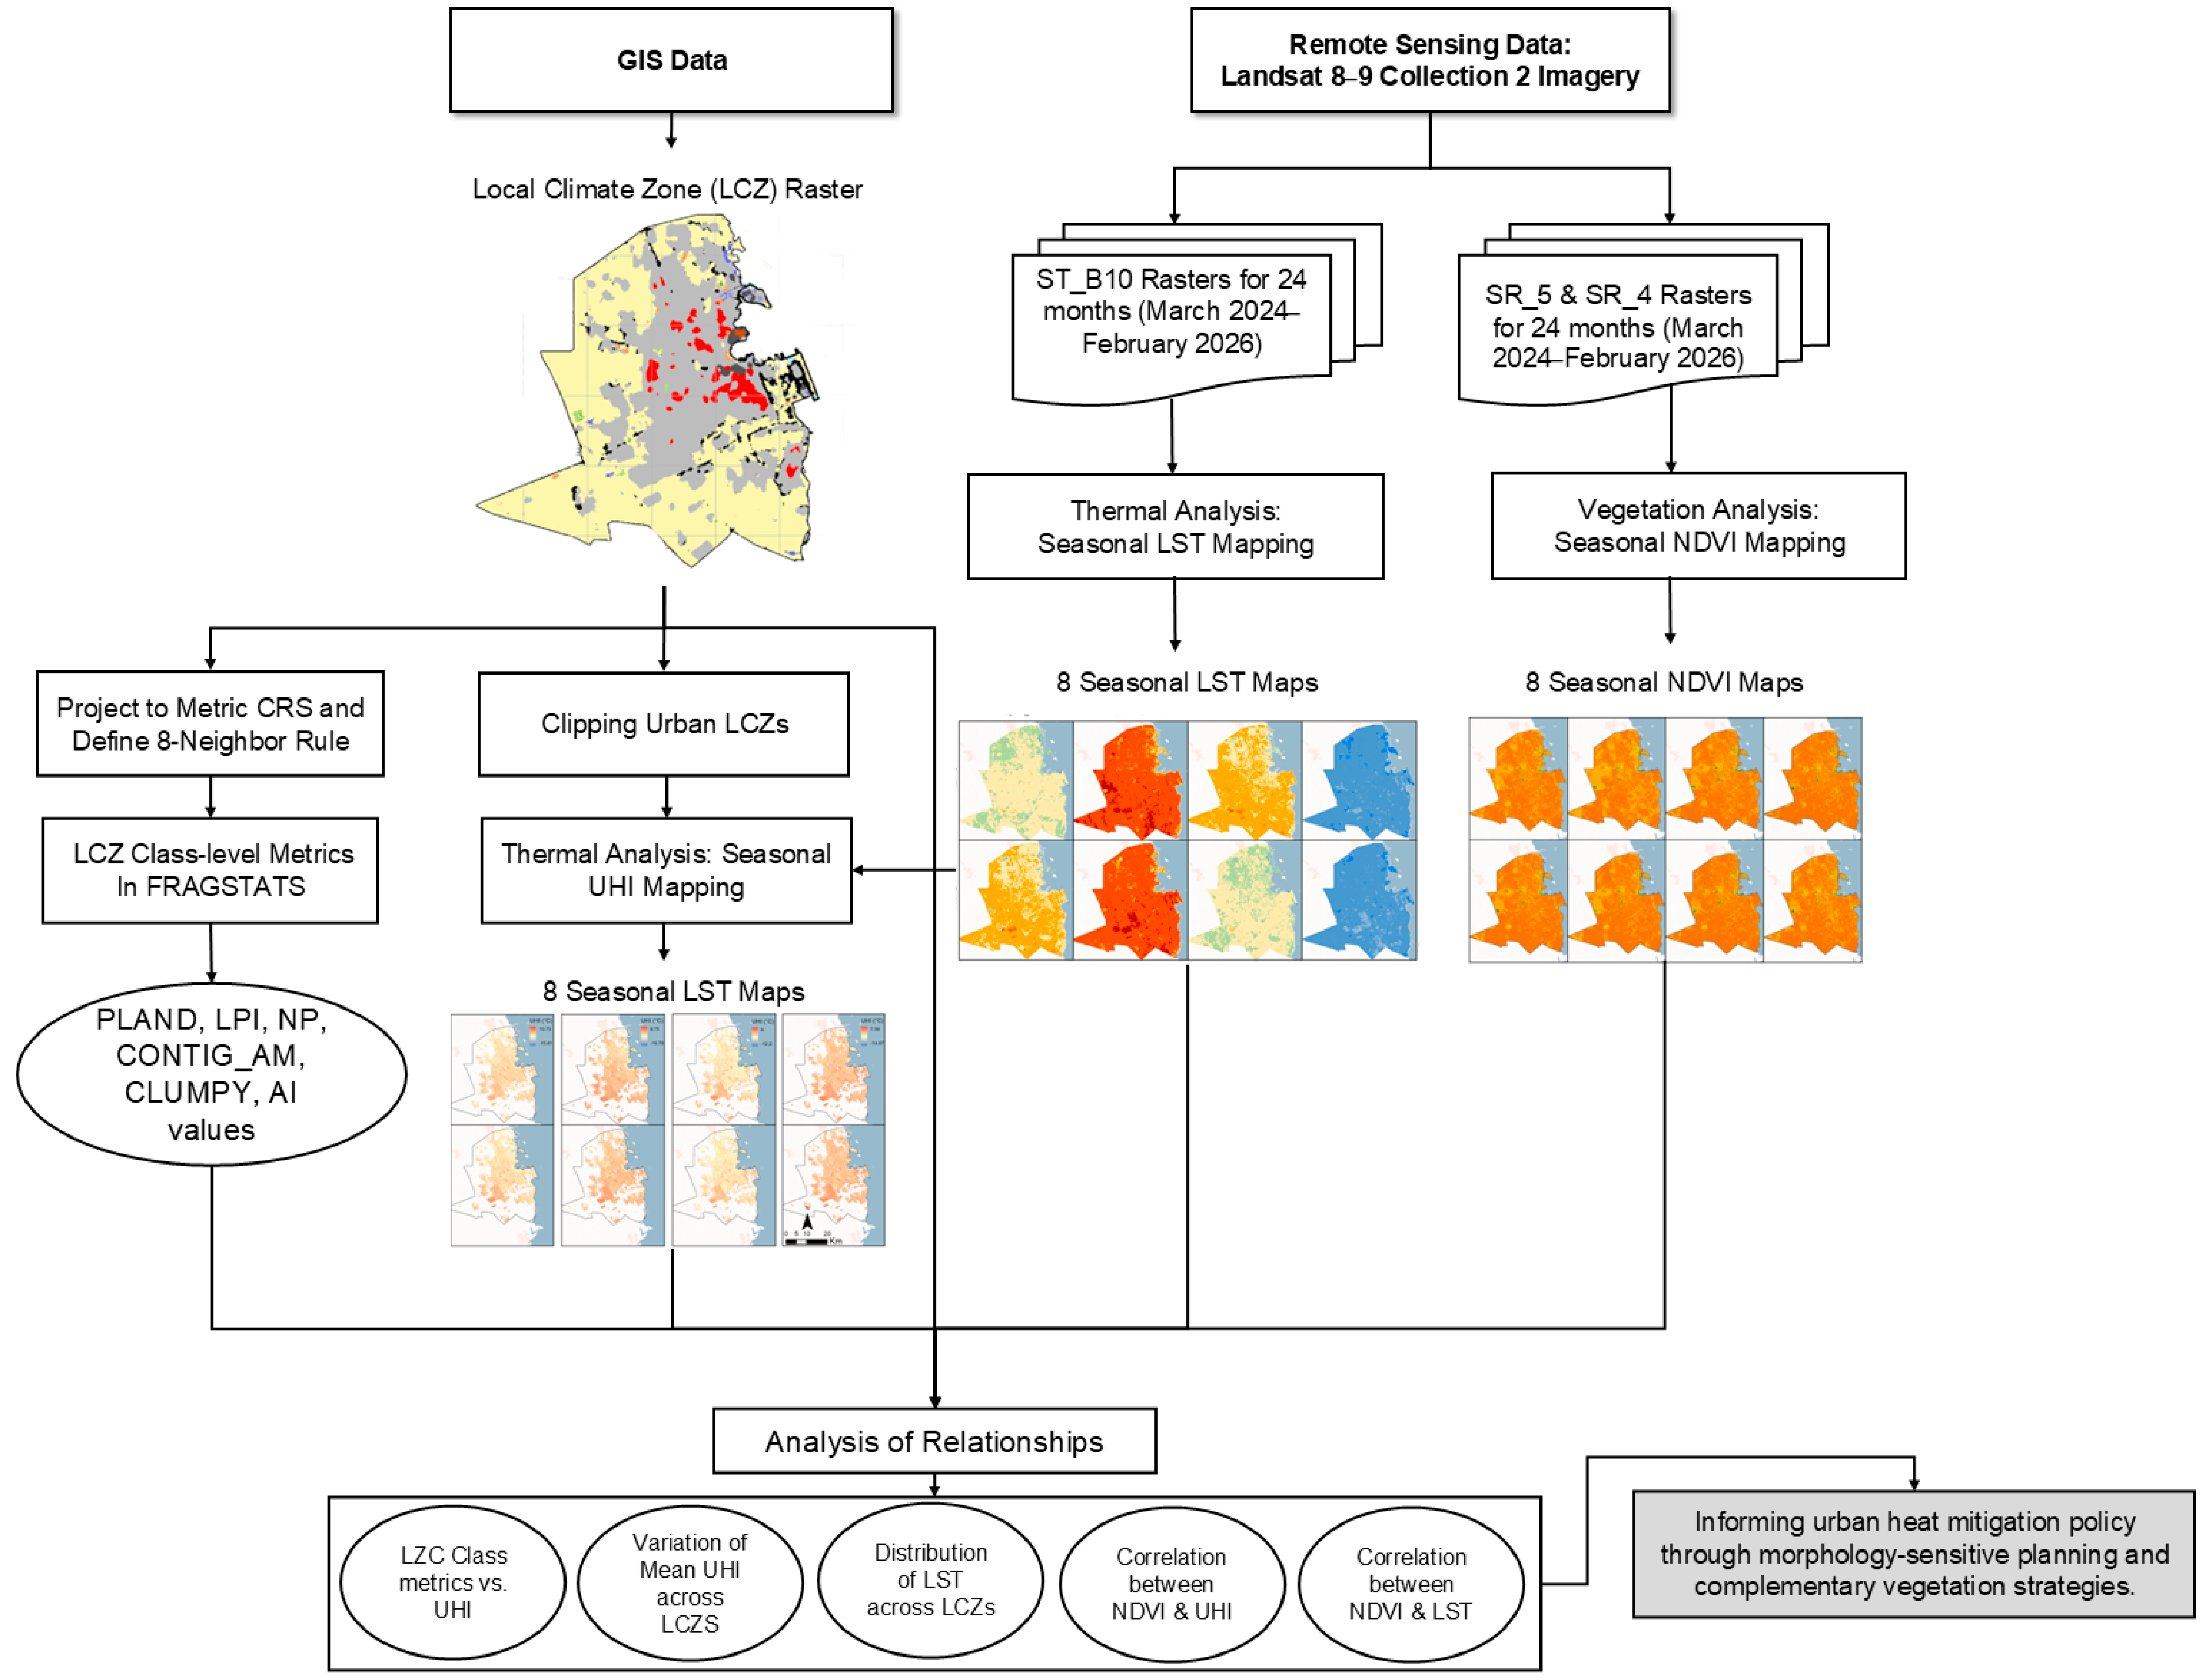
The overall analytical workflow adopted in this study is illustrated in Figure 2. The framework integrates remote sensing-derived thermal and vegetation indicators with GIS-based Local Climate Zone (LCZ) classification to examine the relationship between urban spatial structure and thermal variability. Spatial analysis, map preparation, and visualization were conducted using ArcGIS Pro version 3.6.1 (Esri, Redlands, CA, USA). Pearson correlation analysis and multi-season comparative assessment were conducted to evaluate statistical associations among UHI, LST, NDVI, and spatial pattern metrics. This integrated workflow enables systematic examination of how urban form and vegetation structure influence intra-urban thermal dynamics across seasons. Statistical analyses were conducted at the pixel/grid level across the study area, ensuring a large sample size for correlation analysis between LST, UHI, NDVI, and spatial pattern metrics. This approach enables robust assessment of spatial relationships beyond aggregated land use categories.

2.2.1. Landsat Data

Seasonal LST was derived from multi-temporal imagery obtained from the United States Geological Survey, specifically from the Landsat 8 and Landsat 9 Operational Land Imager/Thermal Infrared Sensor (OLI/TIRS). Level-2, Collection 2 surface temperature products were employed, which provide atmospherically corrected and geometrically refined datasets [29]. The Landsat 8–9 OLI multispectral bands, including Band 4 (Red) and Band 5 (NIR) used to derive NDVI, have a native spatial resolution of 30 m. The TIRS Band 10 used for LST retrieval has a native resolution of 100 m but is resampled to 30 m in the delivered Collection 2 Level-2 product using cubic convolution [29]. All derived products, i.e., LST, NDVI, and UHI, were therefore analyzed at a consistent 30 m spatial resolution across the study area. To capture seasonal variability while minimizing short-term atmospheric noise, one cloud-free LST image was selected for each month (Table 1). Each seasonal composite was generated by averaging three monthly cloud-free scenes (one per month), yielding a total of 24 scenes across eight seasons (Table 1). Scene selection prioritized images with minimal cloud cover. In arid regions such as Qatar, satellite-derived LST and surface reflectance products can be adversely affected by atmospheric dust and aerosol haze, which may contaminate optical bands and introduce bias into thermal retrievals, even under cloud-free conditions [29]. The use of Landsat Collection 2 Level-2 products, which incorporate atmospheric correction via the LaSRC and single-channel algorithms, substantially reduces these effects [29]. Furthermore, the concurrent operation of Landsat 8 and Landsat 9, orbiting 180° out of phase and together providing an 8-day combined revisit cycle, substantially increased the pool of available cloud- and dust-free scenes per month, reducing the risk of data gaps in the final composites [29]. Qatar’s hyper-arid climate, characterized by consistently low cloud cover frequencies, further supports the availability and quality of Landsat imagery throughout the study period.
The period, including two seasonal cycles from Spring 2024 to Winter 2026, was selected as a representative contemporary timeframe to assess the most recent urban developments and their thermal implications. The two-year span also allows for interannual comparisons of corresponding seasons (e.g., Summer 2024 vs. Summer 2025), ensuring that seasonal variability is examined within a consistent, recent climatic context. In the study, year 1 corresponds to the annual cycle from Spring 2024 to Winter 2025, while year 2 represents the second annual cycle from Spring 2025 to Winter 2026.

2.2.2. Land Climate Zone Data

Land use and land cover characteristics were represented using the global Local Climate Zone (LCZ) dataset developed by Demuzere et al. (2022) [14]. The LCZ raster data were imported into ArcGIS Pro, converted to vector polygons, and projected to the coordinate reference system of the study area to ensure spatial alignment and enable overlay analysis with derived thermal datasets.

2.3. Data Processing

2.3.1. LCZ Spatial Pattern in the Study Area

The Local Climate Zone (LCZ) classification was conceptualized as a categorical landscape mosaic, consistent with landscape ecological theory in which urban space is represented as a heterogeneous assembly of spatially discrete but interacting patch types [30]. To quantify the spatial structure and configuration of urban land cover in Qatar’s urban centers, landscape metrics were computed using FRAGSTATS v4.2, a spatial pattern analysis program designed for categorical (thematic) raster data [31]. FRAGSTATS is widely applied in landscape ecology and urban morphology research to evaluate the compositional and configurational properties of spatial patch mosaics derived from classified raster datasets. The analysis was conducted at the class level using a suite of landscape metrics (Table 2). The use of class-level landscape metrics to characterize urban form has been widely validated in metric-based urban morphology research [24,25]. These studies in urban morphology further support parameterizing urban form through landscape and morphological indicators [23].
The class-level metrics used in this study are suitable for assessing urban structural processes because they differentiate between compositional attributes (e.g., PLAND, LPI, AREA_AM) and configurational attributes (e.g., NP, CONTIG, CLUMPY, AI), enabling a clear distinction between spatial amount and spatial arrangement [31]. The LCZ raster dataset was projected in a metric coordinate system to ensure accurate area and adjacency calculations. An 8-neighbor (queen’s case) adjacency rule was applied to define patch contiguity, allowing diagonal cell connections to be treated as part of the same patch.

2.3.2. Land Surface Temperature Calculation

Land surface temperature (LST) was derived from the Level-2 Surface Temperature product (ST_B10) obtained from the United States Geological Survey (USGS) Landsat 8–9 Collection 2 dataset [32]. The ST_B10 band represents atmospherically corrected surface temperatures generated using the USGS single-channel algorithm, which integrates radiative transfer modeling with surface emissivity information derived from the ASTER Global Emissivity Database [29,32]. Unlike Level-1 thermal data, the Level-2 product does not require manual conversion from digital numbers to spectral radiance or brightness temperature, as atmospheric correction and emissivity adjustments are already incorporated within the USGS processing chain [29,32].
The scaled integer values of ST_B10 were converted to Celsius using the USGS-provided scaling equation:
LST = [(ST_B10 × 0.00341802) + 149.0] − 273.15
where LST is expressed in °C, this standardized retrieval approach ensures consistency across seasonal datasets and minimizes uncertainties associated with emissivity estimation and atmospheric correction. Regarding product accuracy, the USGS Collection 2 Level-2 Surface Temperature product includes a per-pixel uncertainty band (ST_QA) expressed in Kelvin. Independent validation of the Landsat LST algorithm has reported typical absolute accuracies in the range of approximately ±2 K under standard atmospheric conditions, with the operational single-channel algorithm performing robustly across diverse land cover types [32]. Geolocation accuracy for Tier 1 Collection 2 scenes meets a specification of ≤12 m radial RMSE, ensuring spatial consistency across the multi-temporal dataset used in this study [29].
Seasonal LST values were computed by averaging three consecutive monthly scenes corresponding to each climatological season. Specifically, spring represents the mean of March–May imagery, summer of June–August imagery, autumn of September–November imagery, and winter of December–February imagery. This compositing approach reduces scene-specific anomalies and provides a more stable representation of seasonal thermal conditions.

2.3.3. Urban Heat Island (UHI) Calculation

To quantify intra-urban thermal variability, Urban Heat Island (UHI) intensity was calculated using a mean–deviation (relative anomaly) approach, a commonly adopted method for characterizing spatial thermal heterogeneity within urban areas [26,33]. Prior to UHI computation, non-urban Local Climate Zone (LCZ) classes, particularly desert and sparsely vegetated surfaces, were excluded from the analysis. This step was implemented to prevent high-temperature desert pixels from disproportionately influencing the statistical baseline and artificially inflating anomaly magnitudes. Restricting the reference baseline to built LCZ typologies ensures that calculated anomalies represent intra-urban thermal contrasts rather than urban–desert gradients [26,30].
Urban LCZ classes representing built typologies were extracted and used as a mask to clip the seasonal LST rasters. The resulting urban-only LST dataset served as the basis for UHI estimation. UHI intensity was calculated as the deviation of each pixel’s land surface temperature from the mean LST of the urban area:
U H I i = L S T i L S T ¯ urban  
where
L S T i is the temperature of pixel i
L S T ¯ urban   is the mean LST computed across all urban pixels within the study area
This approach represents relative thermal anomalies within the built environment rather than a traditional urban–rural temperature difference [33]. Positive UHI values indicate pixels warmer than the urban average, while negative values represent relatively cooler zones within the city. Normalizing LST values to the urban mean enables consistent seasonal comparison across years and reduces the influence of inter-annual background temperature variability [26]. In this study, UHI refers to a relative intra-urban thermal anomaly rather than a conventional urban–rural temperature difference. All reported UHI values, therefore, reflect deviations from the urban mean and should not be interpreted as absolute urban–rural thermal contrasts.

2.3.4. Normalized Difference Vegetation Index (NDVI) Calculation

The NDVI was computed to quantify vegetation density and examine its relationship with land surface temperature (LST) and intra-urban thermal variability in urban centers of Qatar. Normalized difference indices are widely used to establish correlations between land use/land cover characteristics and surface thermal behavior. NDVI has been extensively employed to monitor vegetation extent, agricultural productivity, and vegetation health under varying climatic conditions [34,35,36,37]. In this study, NDVI was derived from the USGS Landsat 8–9 Collection 2 Level-2 Surface Reflectance product, which provides atmospherically corrected reflectance values. The index was calculated following the formulation proposed by Townshend and Justice (1986) [38], according to the equation:
N D V I = N I R R E D N I R + R E D
where
NIR = Surface reflectance of Band 5 (Near-Infrared)
RED = Surface reflectance of Band 4 (Red)
To ensure seasonal consistency, three cloud-free scenes were selected for each of the four seasons (spring, summer, autumn, and winter) over the two-year time frame. The surface reflectance bands (Band 4 and Band 5) were composited seasonally using mean aggregation prior to NDVI calculation. The OLI surface reflectance bands from which NDVI was derived carry a native spatial resolution of 30 m. The LaSRC atmospheric correction algorithm applied to Collection 2 Level-2 surface reflectance products is well-validated for arid and urban environments, with surface reflectance uncertainties generally below 5% relative reflectance under conditions of low aerosol loading [29].

2.4. Validation and Result Reliability

In the absence of direct in situ validation, we assessed the reliability of the retrieved LST patterns by comparing them with established empirical and theoretical findings in the literature. Satellite-derived LST is a widely accepted variable for analyzing land–atmosphere energy exchange and urban thermal environments, with well-established retrieval methodologies and documented uncertainties [39].
In arid and desert cities, previous studies have consistently reported pronounced seasonal variability and elevated surface temperatures, particularly during summer months, driven by high solar radiation, low vegetation cover, and extensive impervious surfaces. For instance, research conducted in desert environments, such as Isfahan, demonstrates strong seasonal LST contrasts and significant thermal variability linked to land surface characteristics [40]. At the same time, studies in Makkah similarly highlight elevated temperatures over exposed and developing urban surfaces and the influence of urban morphology on thermal behavior [41].
While this approach does not replace direct ground-based validation, the consistency between observed thermal magnitudes, seasonal trends, and LCZ-based spatial patterns with prior empirical findings supports the plausibility and robustness of the LST results presented in this study. Furthermore, the spatial distribution of LST observed in this study aligns with established relationships between land cover composition, urban structure, and thermal response. This pattern is well documented in urban climate studies, where both the composition and configuration of urban structure types significantly influence LST variability [41].
To provide an independent cross-validation of the seasonal LST patterns derived from Landsat, monthly mean air temperature and total precipitation data were obtained from the ERA5-Land reanalysis dataset for the study period March 2024 to December 2025 [42]. ERA5-Land is a global, high-resolution land surface reanalysis product produced by the European Centre for Medium-Range Weather Forecasts (ECMWF) under the Copernicus Climate Change Service, offering hourly estimates of land surface variables at 9 km spatial resolution [42]. Monthly aggregates of air temperature (2 m) and precipitation were extracted for the Qatar study area and used to assess the consistency between reanalysis-based meteorological seasonality and the remotely sensed thermal patterns presented in Section 3.2.

3. Results

3.1. Understanding LCZ Patterns in the Study Area

Based on the LCZ map, we estimated the approximate area and percentage of each land use and land cover, as presented in Table 3. This area estimation was further compared with the Qatar National Master Plan, developed by the Ministry of Municipality and Environment, to determine how each land use and land cover category corresponds to the official zoning. Although deriving satellite-based land cover data does not necessarily align with the in situ land use institutional plan, there is clear alignment between the LCZ map and Qatar National Master Plan zoning designations [43]. For example, mid-rise and high-rise compact LCZs are usually found in the Metropolitan and Town Centers; industrial LCZs are located within heavy- and medium-industrial zone boundaries; and sparsely built or bare-soil zones are aligned with Rural/Desert or undeveloped lands. This comparison validates the reliability of LCZ data.
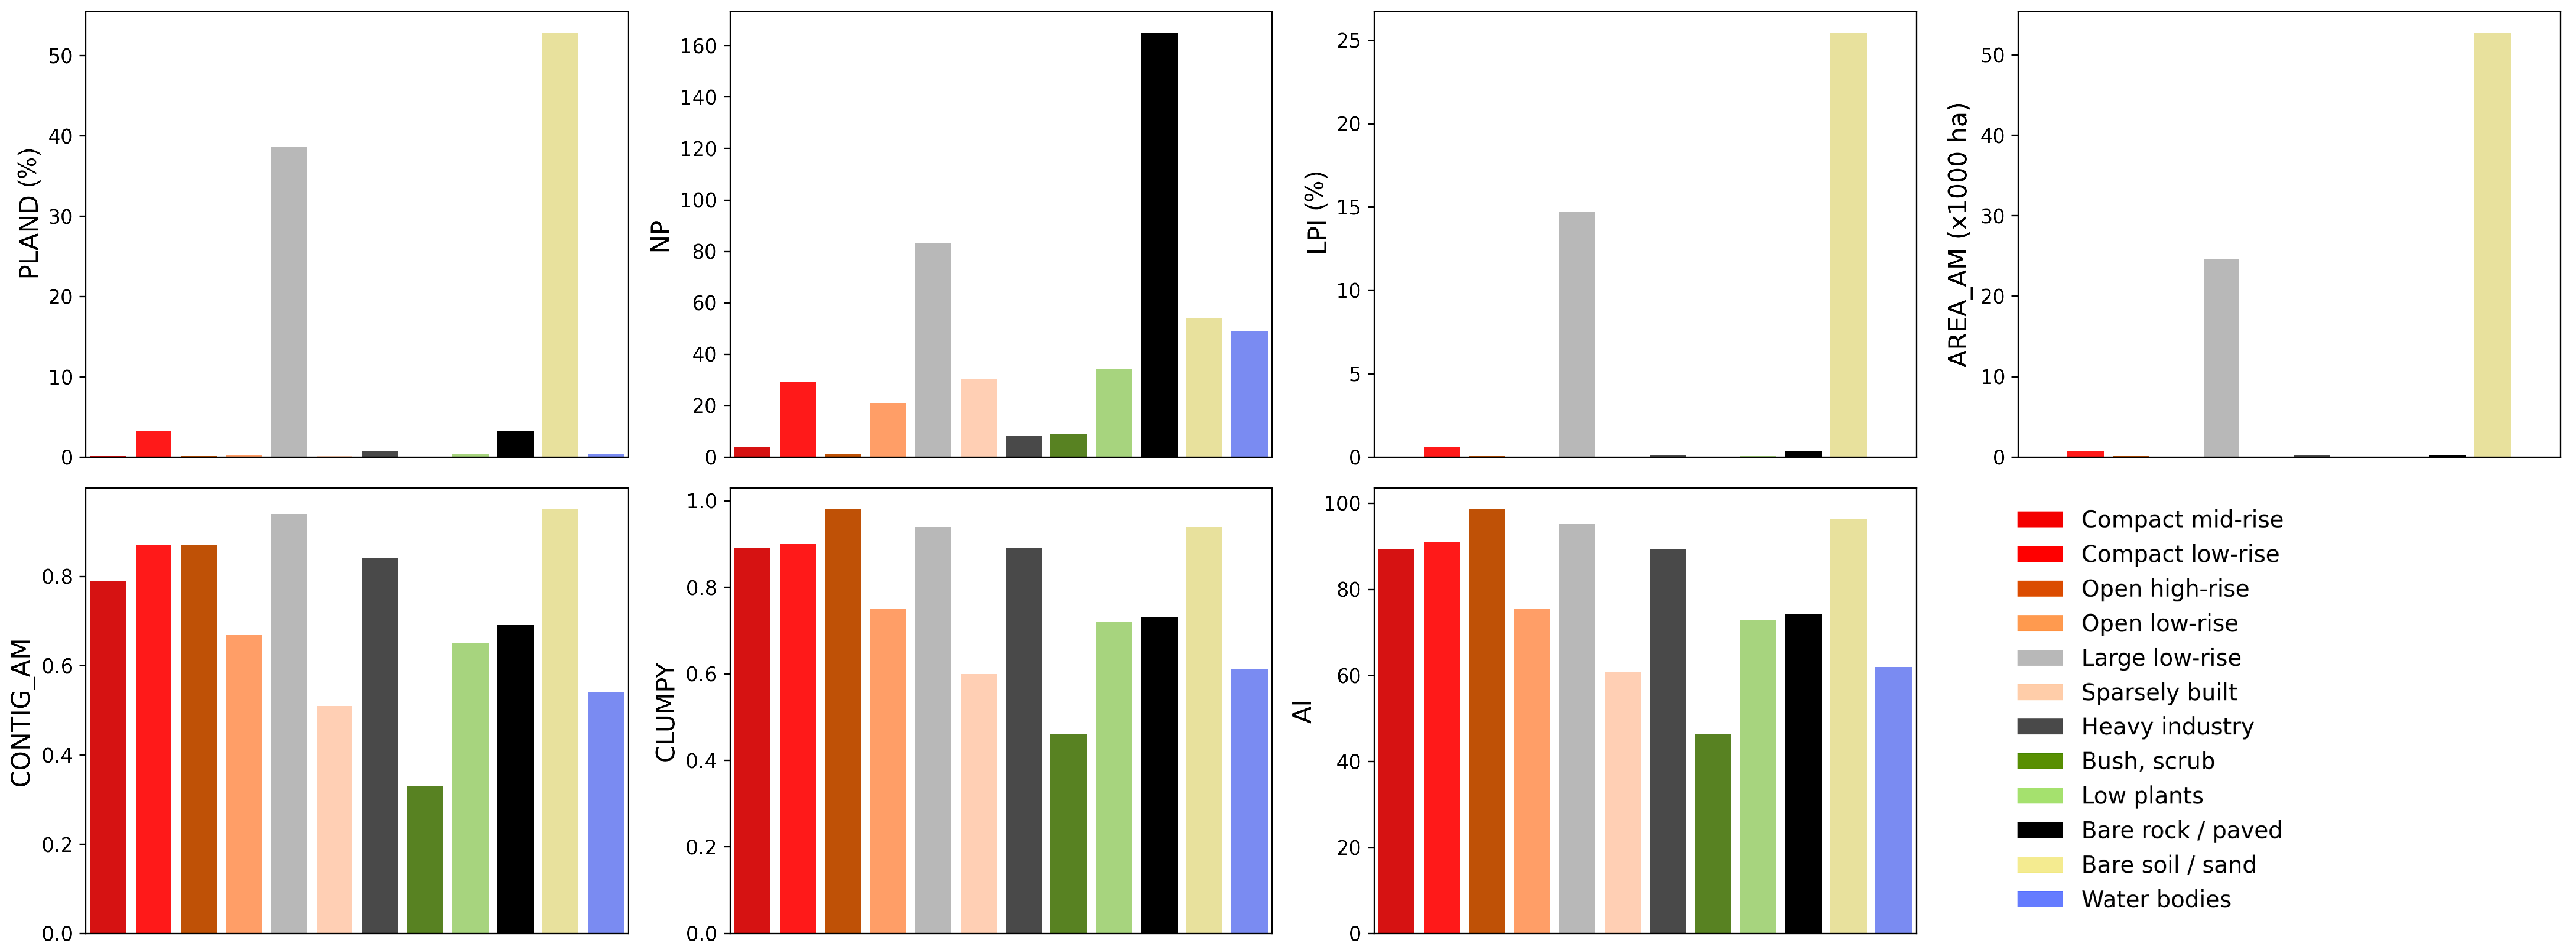
Figure 3 presents the full set of class-level landscape metrics for each LCZ in the study area (metrics defined in Section 2.3.1 and Table 2). Each panel shows one metric across all LCZ classes, enabling simultaneous comparison of compositional dominance (PLAND, LPI, AREA_AM) and spatial configuration (NP, CONTIG_AM, CLUMPY, AI). PLAND results indicate a landscape dominated by bare soil/sand (52.84%) and large low-rise development (38.61%), together accounting for over 90% of the study area. Other built typologies remain marginal, with compact low-rise (3.24%) and bare rock/paved surfaces (3.15%) representing secondary components, while compact mid-rise (0.13%) and open high-rise (0.10%) confirm limited vertical intensification. Vegetation classes are negligible, with bush/scrub (0.03%) and low plants (0.34%) indicating minimal natural vegetative cover.
Spatial configuration metrics reveal patterns of fragmentation and concentration. Bare rock/paved exhibits the highest subdivision (165 NP), followed by large low-rise (83 NP), while high-rise development is highly concentrated (1 NP). Compact low-rise shows moderate fragmentation (29 NP). The Largest Patch Index (LPI) further highlights structural dominance, with bare soil/sand (25.46%) forming a contiguous desert backdrop and large low-rise (14.70%) representing extensive suburban blocks. Among built classes, compact low-rise shows the highest internal consolidation (0.63%), while other typologies remain dispersed across smaller patches.
Aggregation and contiguity metrics confirm a highly clustered metropolitan structure. Dominant classes, i.e., bare soil/sand and large low-rise, exhibited strong aggregation (95–96% AI; 0.94–0.95 CLUMPY) and high internal cohesion (more than 0.94 CONTIG_AM), while open high-rise forms a highly consolidated urban node (98.58% AI). In contrast, vegetative classes are dispersed and weakly aggregated.

3.2. Seasonal Variation in Land Surface Temperature (LST)

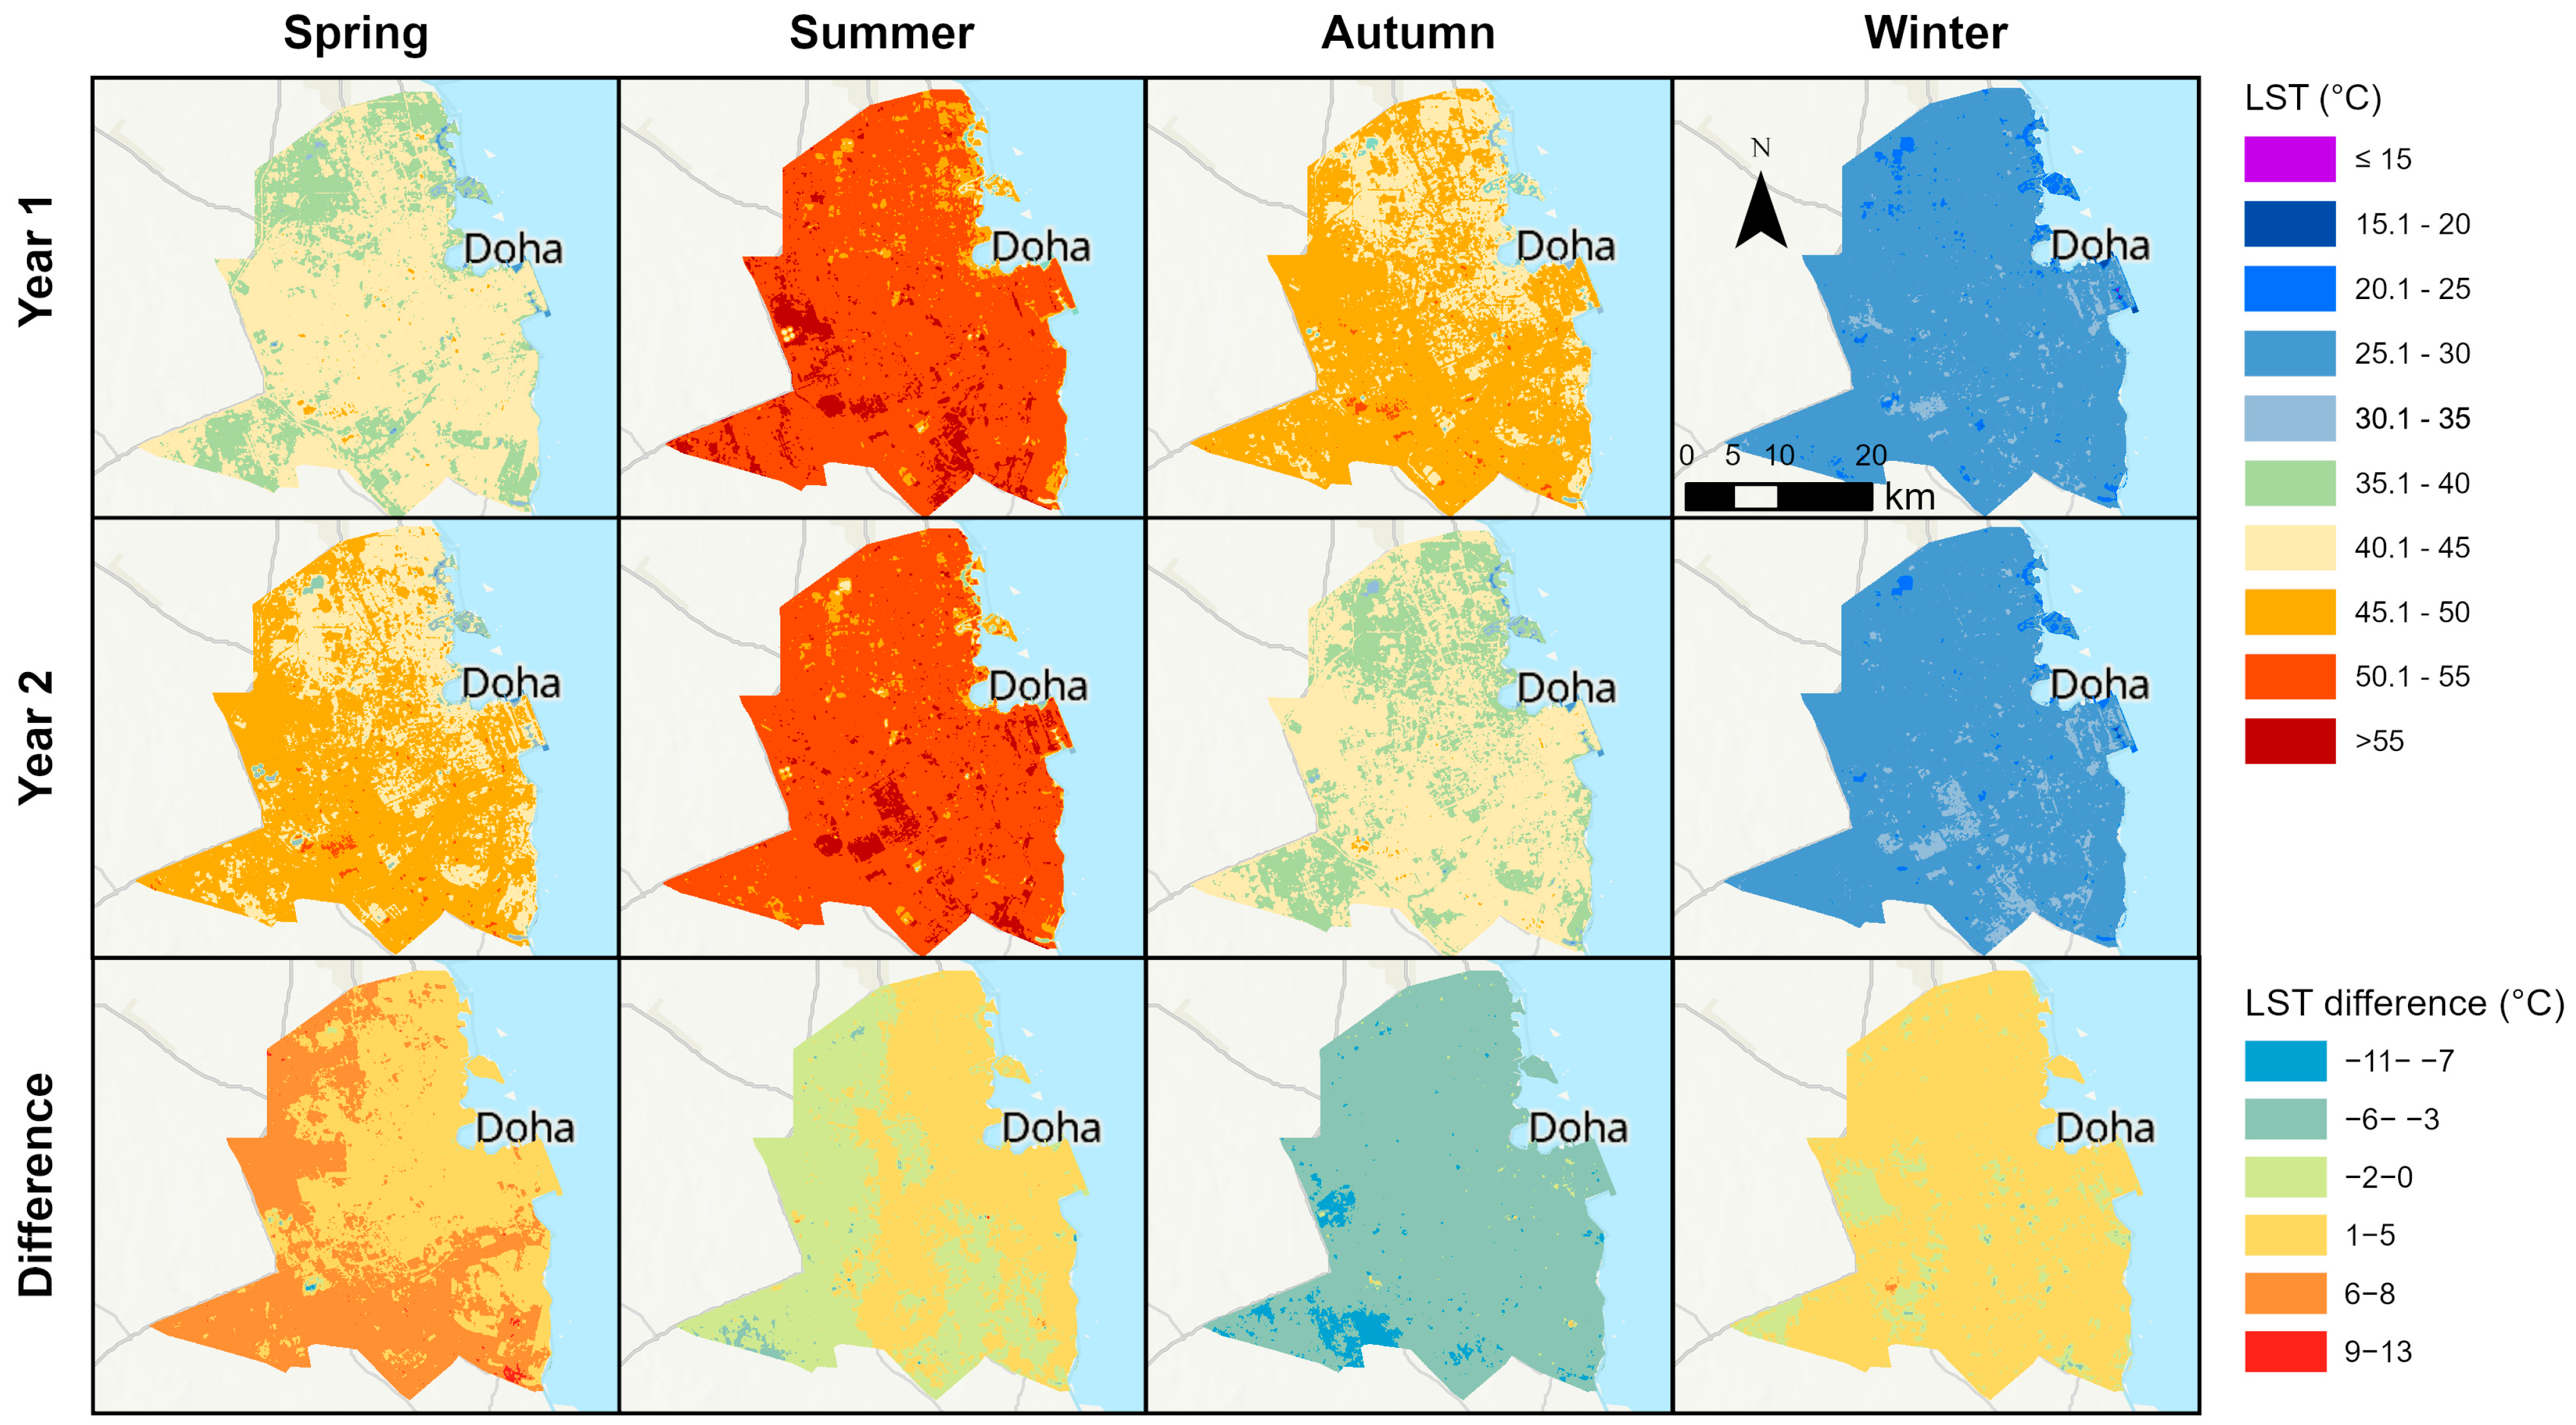
The seasonal LST maps demonstrate thermal variability across both intra-annual and interannual scales (Figure 4). Summer represents the period of maximum surface heating, with peak temperatures reaching 61.07 °C in Summer 2024 and slightly increasing to 61.33 °C in Summer 2025, indicating a marginal interannual rise of approximately 0.26 °C. In contrast, winter records the lowest thermal conditions, with minimum temperatures declining to 12.47 °C in Winter 2025 and 13.00 °C in Winter 2026, reflecting a modest interannual increase of roughly 0.5 °C. The seasonal thermal amplitude between peak summer and minimum winter conditions exceeds 48 °C, which is a characteristic of arid environments.
Spring 2025 appears noticeably warmer than Spring 2024, with a broader spatial dominance of higher temperature classes, suggesting stronger early-season heat accumulation. Conversely, Autumn 2024 shows higher temperature concentrations than Autumn 2025, with cooler classes more spatially extensive. This contrast indicates that transitional seasons are not thermally symmetrical (Figure 4).
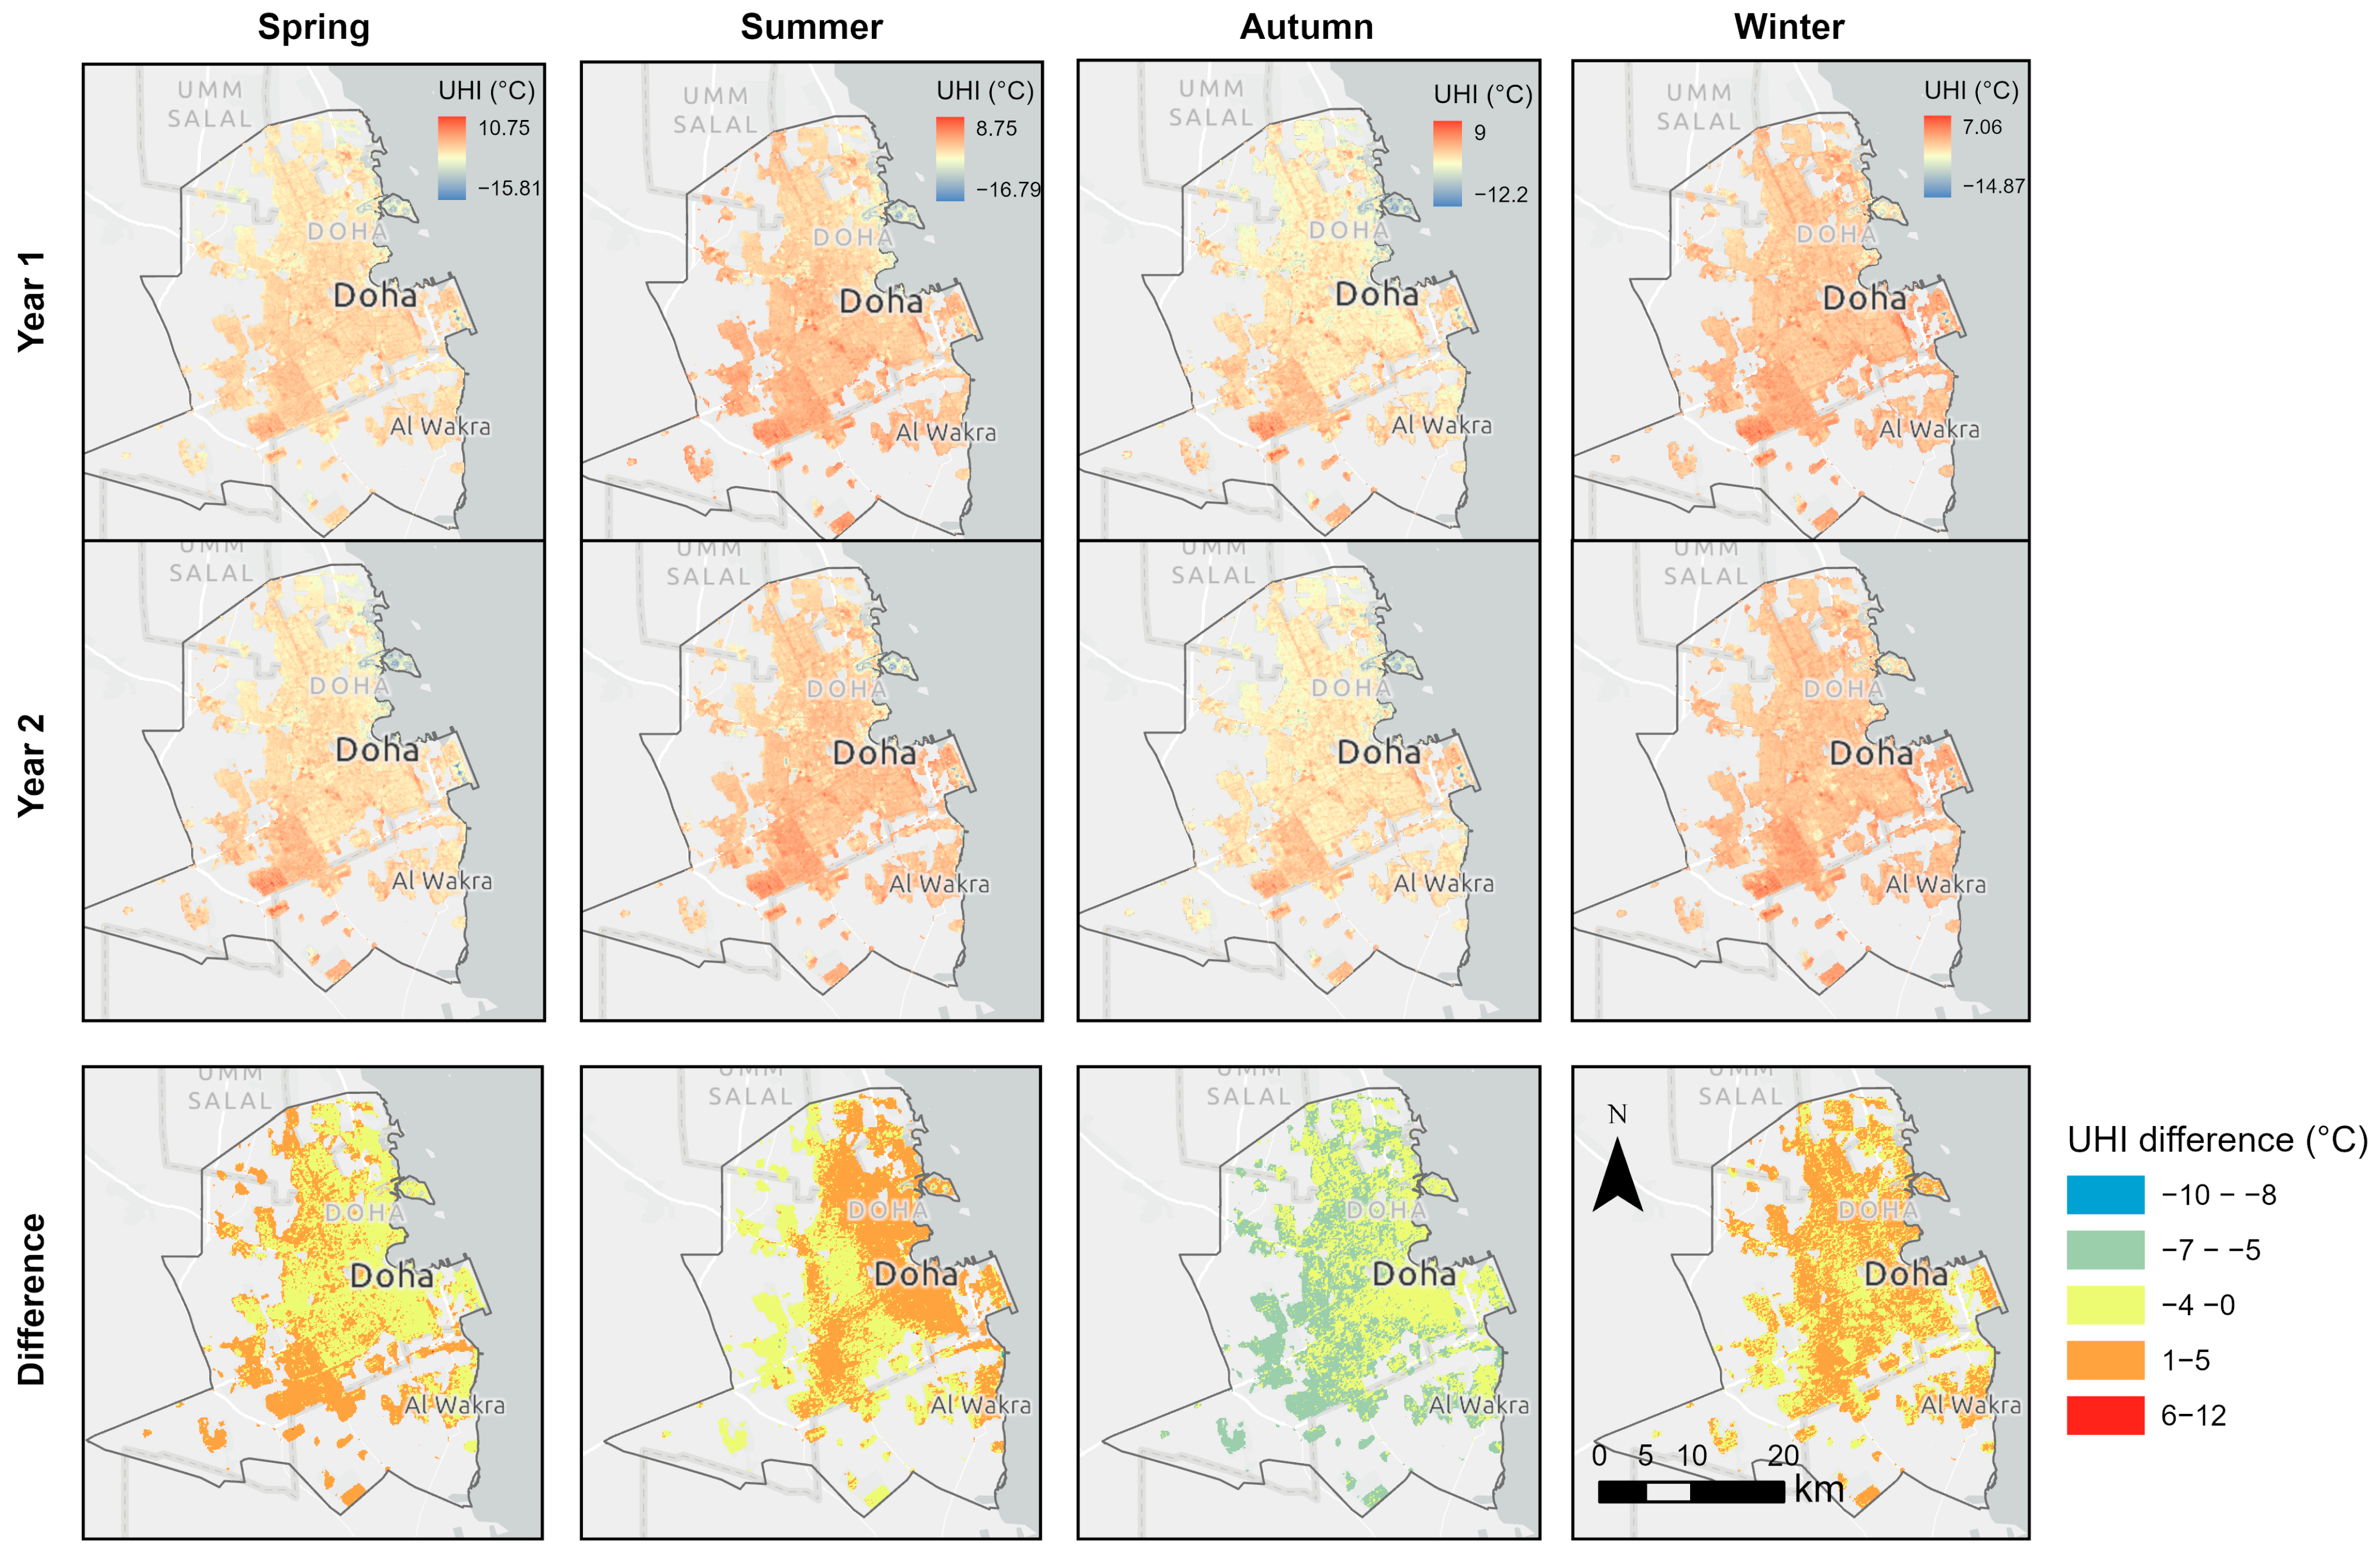
The seasonal difference maps (Year 2 minus Year 1, for each corresponding season) reveal a consistent warming trend across Doha, with Year 2 recording higher LSTs than Year 1 in spring (6–8 °C), summer (1–5 °C), and winter (1–5 °C), likely reflecting continued urban expansion and surface imperviousness. Autumn stands out as an exception, showing localized cooling of −3 to −6 °C in vegetated and peripheral areas, possibly indicative of interannual climatic variability or increased greenery coverage in those zones.
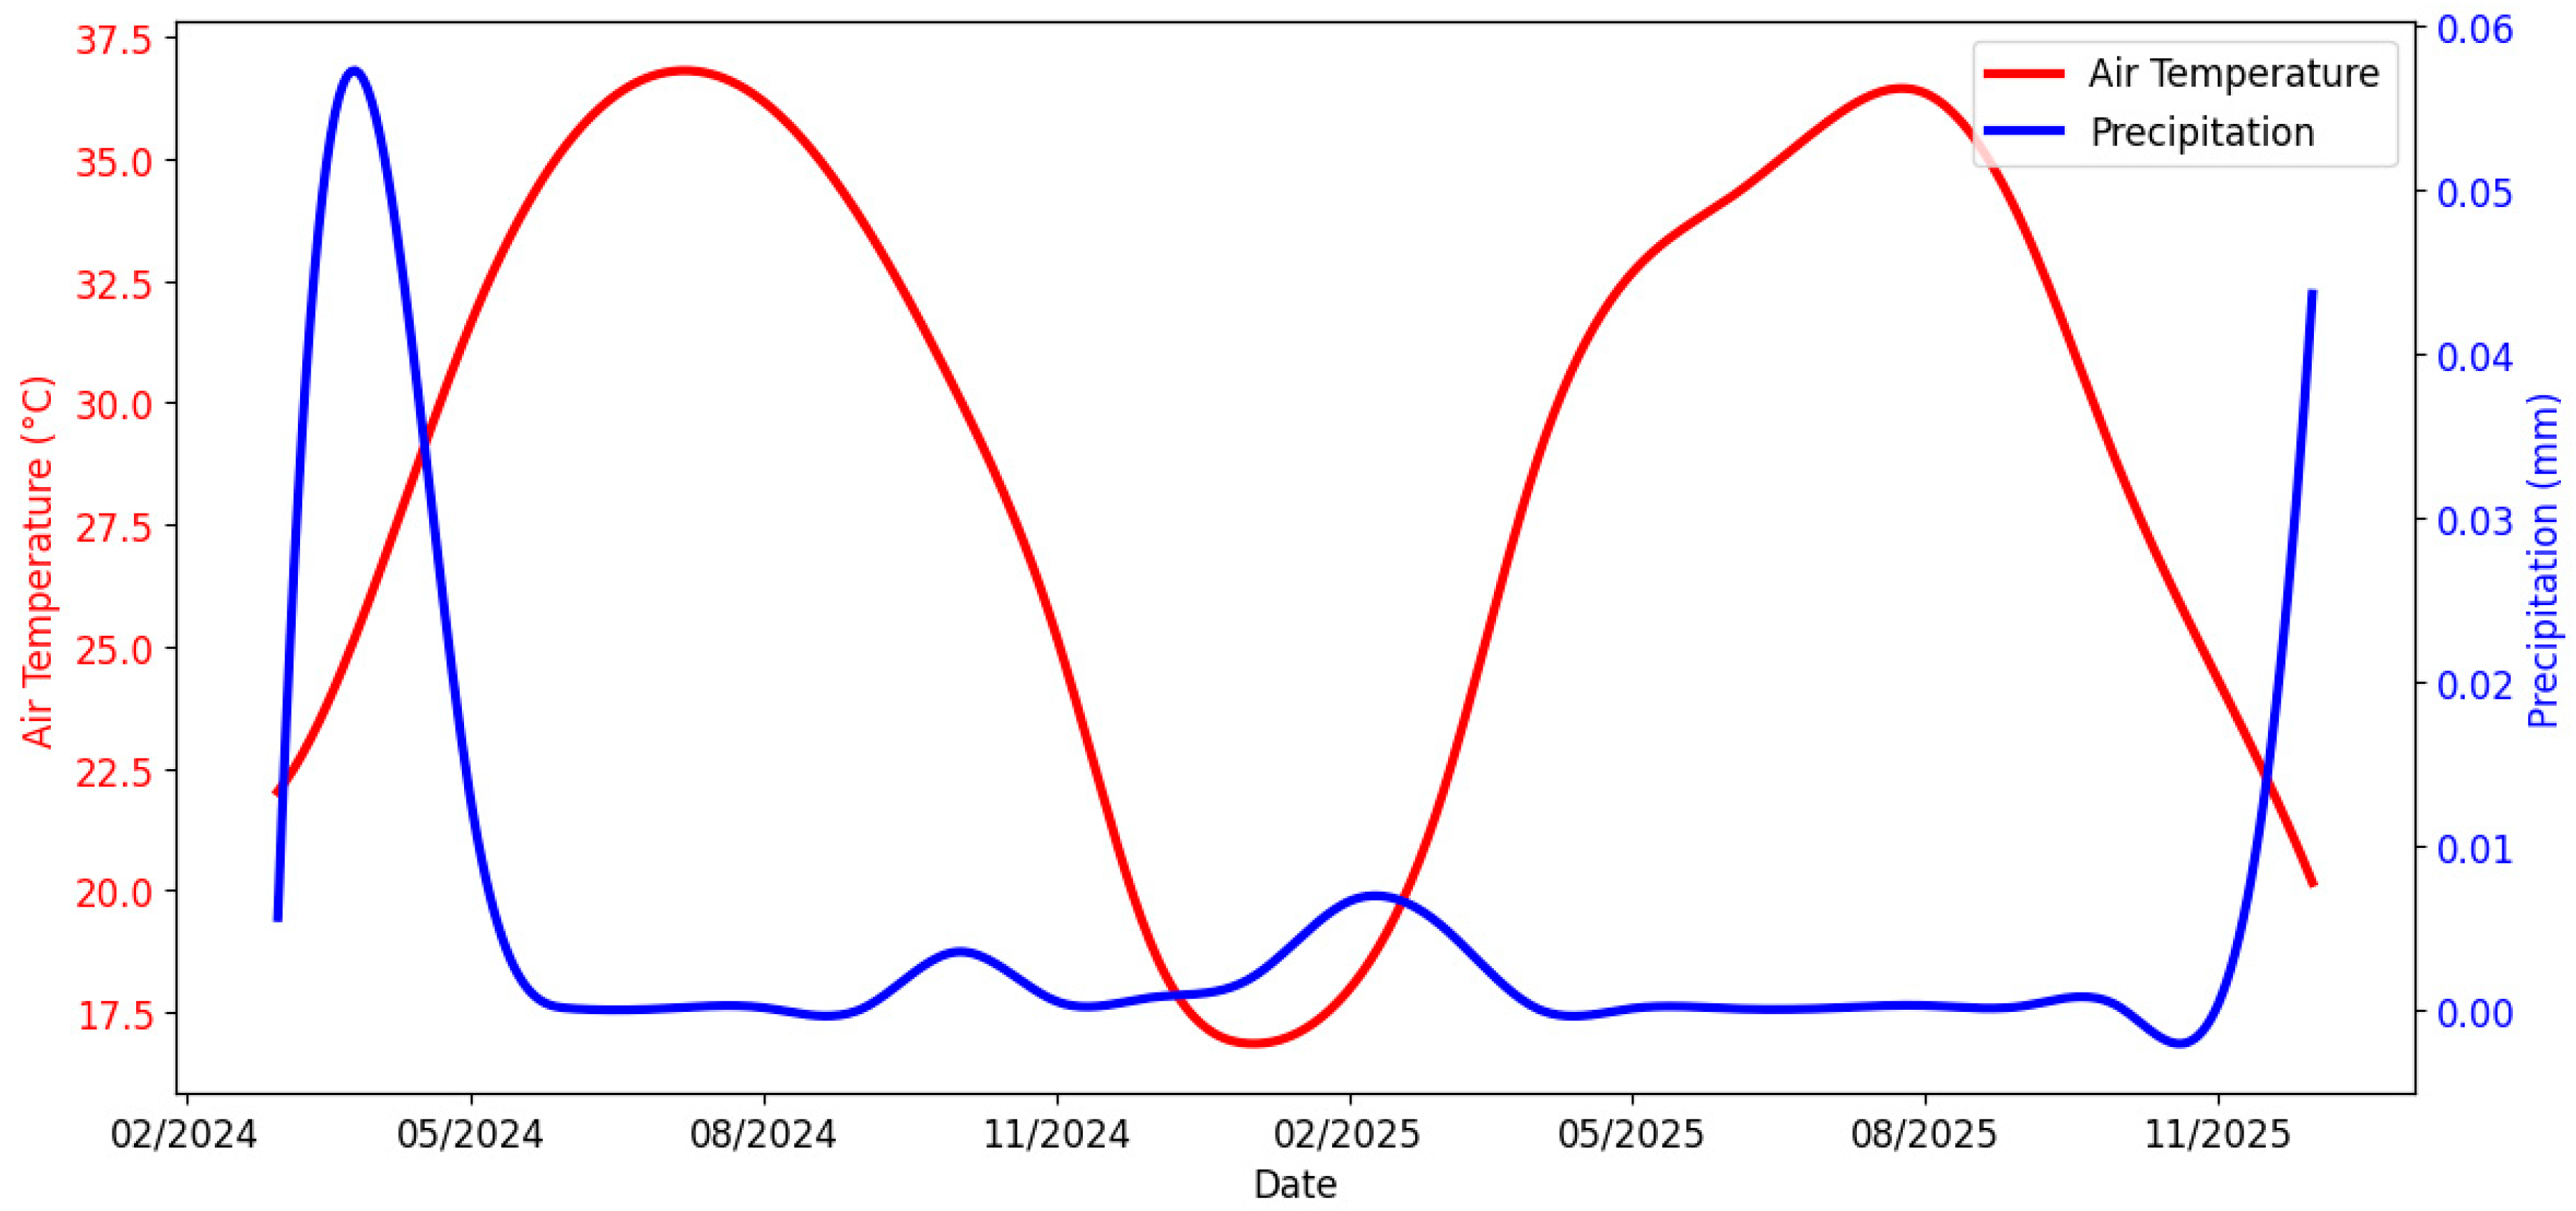
The seasonal LST patterns derived from Landsat are broadly consistent with the independent ERA5-Land reanalysis data for the same period (Figure 5). ERA5-Land monthly mean air temperature over the study area peaks in July–August, reaching approximately 36–37 °C in both 2024 and 2025, and declines to its lowest values in January–February, averaging approximately 17–18 °C. This seasonal trajectory closely mirrors the Landsat-derived LST seasonal cycle, where summer months record maximum surface temperatures and winter months represent the thermal minimum. The transitional seasons of spring and autumn similarly show corresponding warming and cooling trends in both datasets. Precipitation remains negligible across the summer months in both years, with minor recorded events during spring and late autumn, consistent with Qatar’s arid climatic regime and corroborating the vegetation dynamics observed in the NDVI analysis (Section 3.4). The agreement between ERA5-Land meteorological seasonality and the remotely sensed LST patterns provides independent support for the reliability of the Landsat-derived thermal data used in this study.

3.3. Seasonal Urban Heat Island (UHI) Patterns in the Study Area

In the UHI maps presented in Figure 6, the analysis was restricted to urban land cover classes, with desert/sand (bare soil) LCZs excluded prior to calculation. Consequently, the reported values represent intra-urban UHI anomalies, reflecting thermal deviations relative to the urban mean rather than conventional urban–rural temperature differences. This approach eliminates the cooling bias that would otherwise arise from comparison with extensive desert surfaces.
Spring exhibits the widest intra-urban thermal range among all seasons, with maximum UHI anomalies reaching 10.75 °C and minimum values declining to approximately −15.81 °C. Summer maintains strong and spatially consolidated intra-urban UHI patterns, with peak values of 8.75 °C and minimum values of approximately −16.79 °C, indicating pronounced thermal variability. Hotspots are consistently distributed across built-up areas during this period.
Autumn demonstrates similarly elevated intra-urban UHI anomalies, with maximum values of approximately 9 °C and minimum values around −12.2 °C. The spatial structure remains stable, with hotspots concentrated in dense urban zones. Winter exhibits comparatively lower intra-urban UHI magnitudes, with peak values of approximately 7.06 °C and minimum values reaching −14.87 °C. Despite reduced overall thermal intensity, the spatial distribution of hotspots remains closely aligned with dense urban and industrial areas, indicating the persistent influence of urban morphology on thermal patterns across seasons.
The seasonal UHI difference maps (Year 2 minus Year 1, for each corresponding season) indicate an intensification of the urban heat island effect in spring and summer, with increases of 1–5 °C and locally up to 6–12 °C concentrated in the densely built-up areas of central Doha, reflecting the growing thermal footprint of urban development. Conversely, autumn exhibits a widespread UHI reduction of −5 to −7 °C across the urban core, while winter shows a more spatially mixed pattern with moderate cooling in some districts, suggesting that the UHI intensification is most pronounced during the hottest seasons.

3.4. Seasonal Normalized Difference Vegetation Index (NDVI)

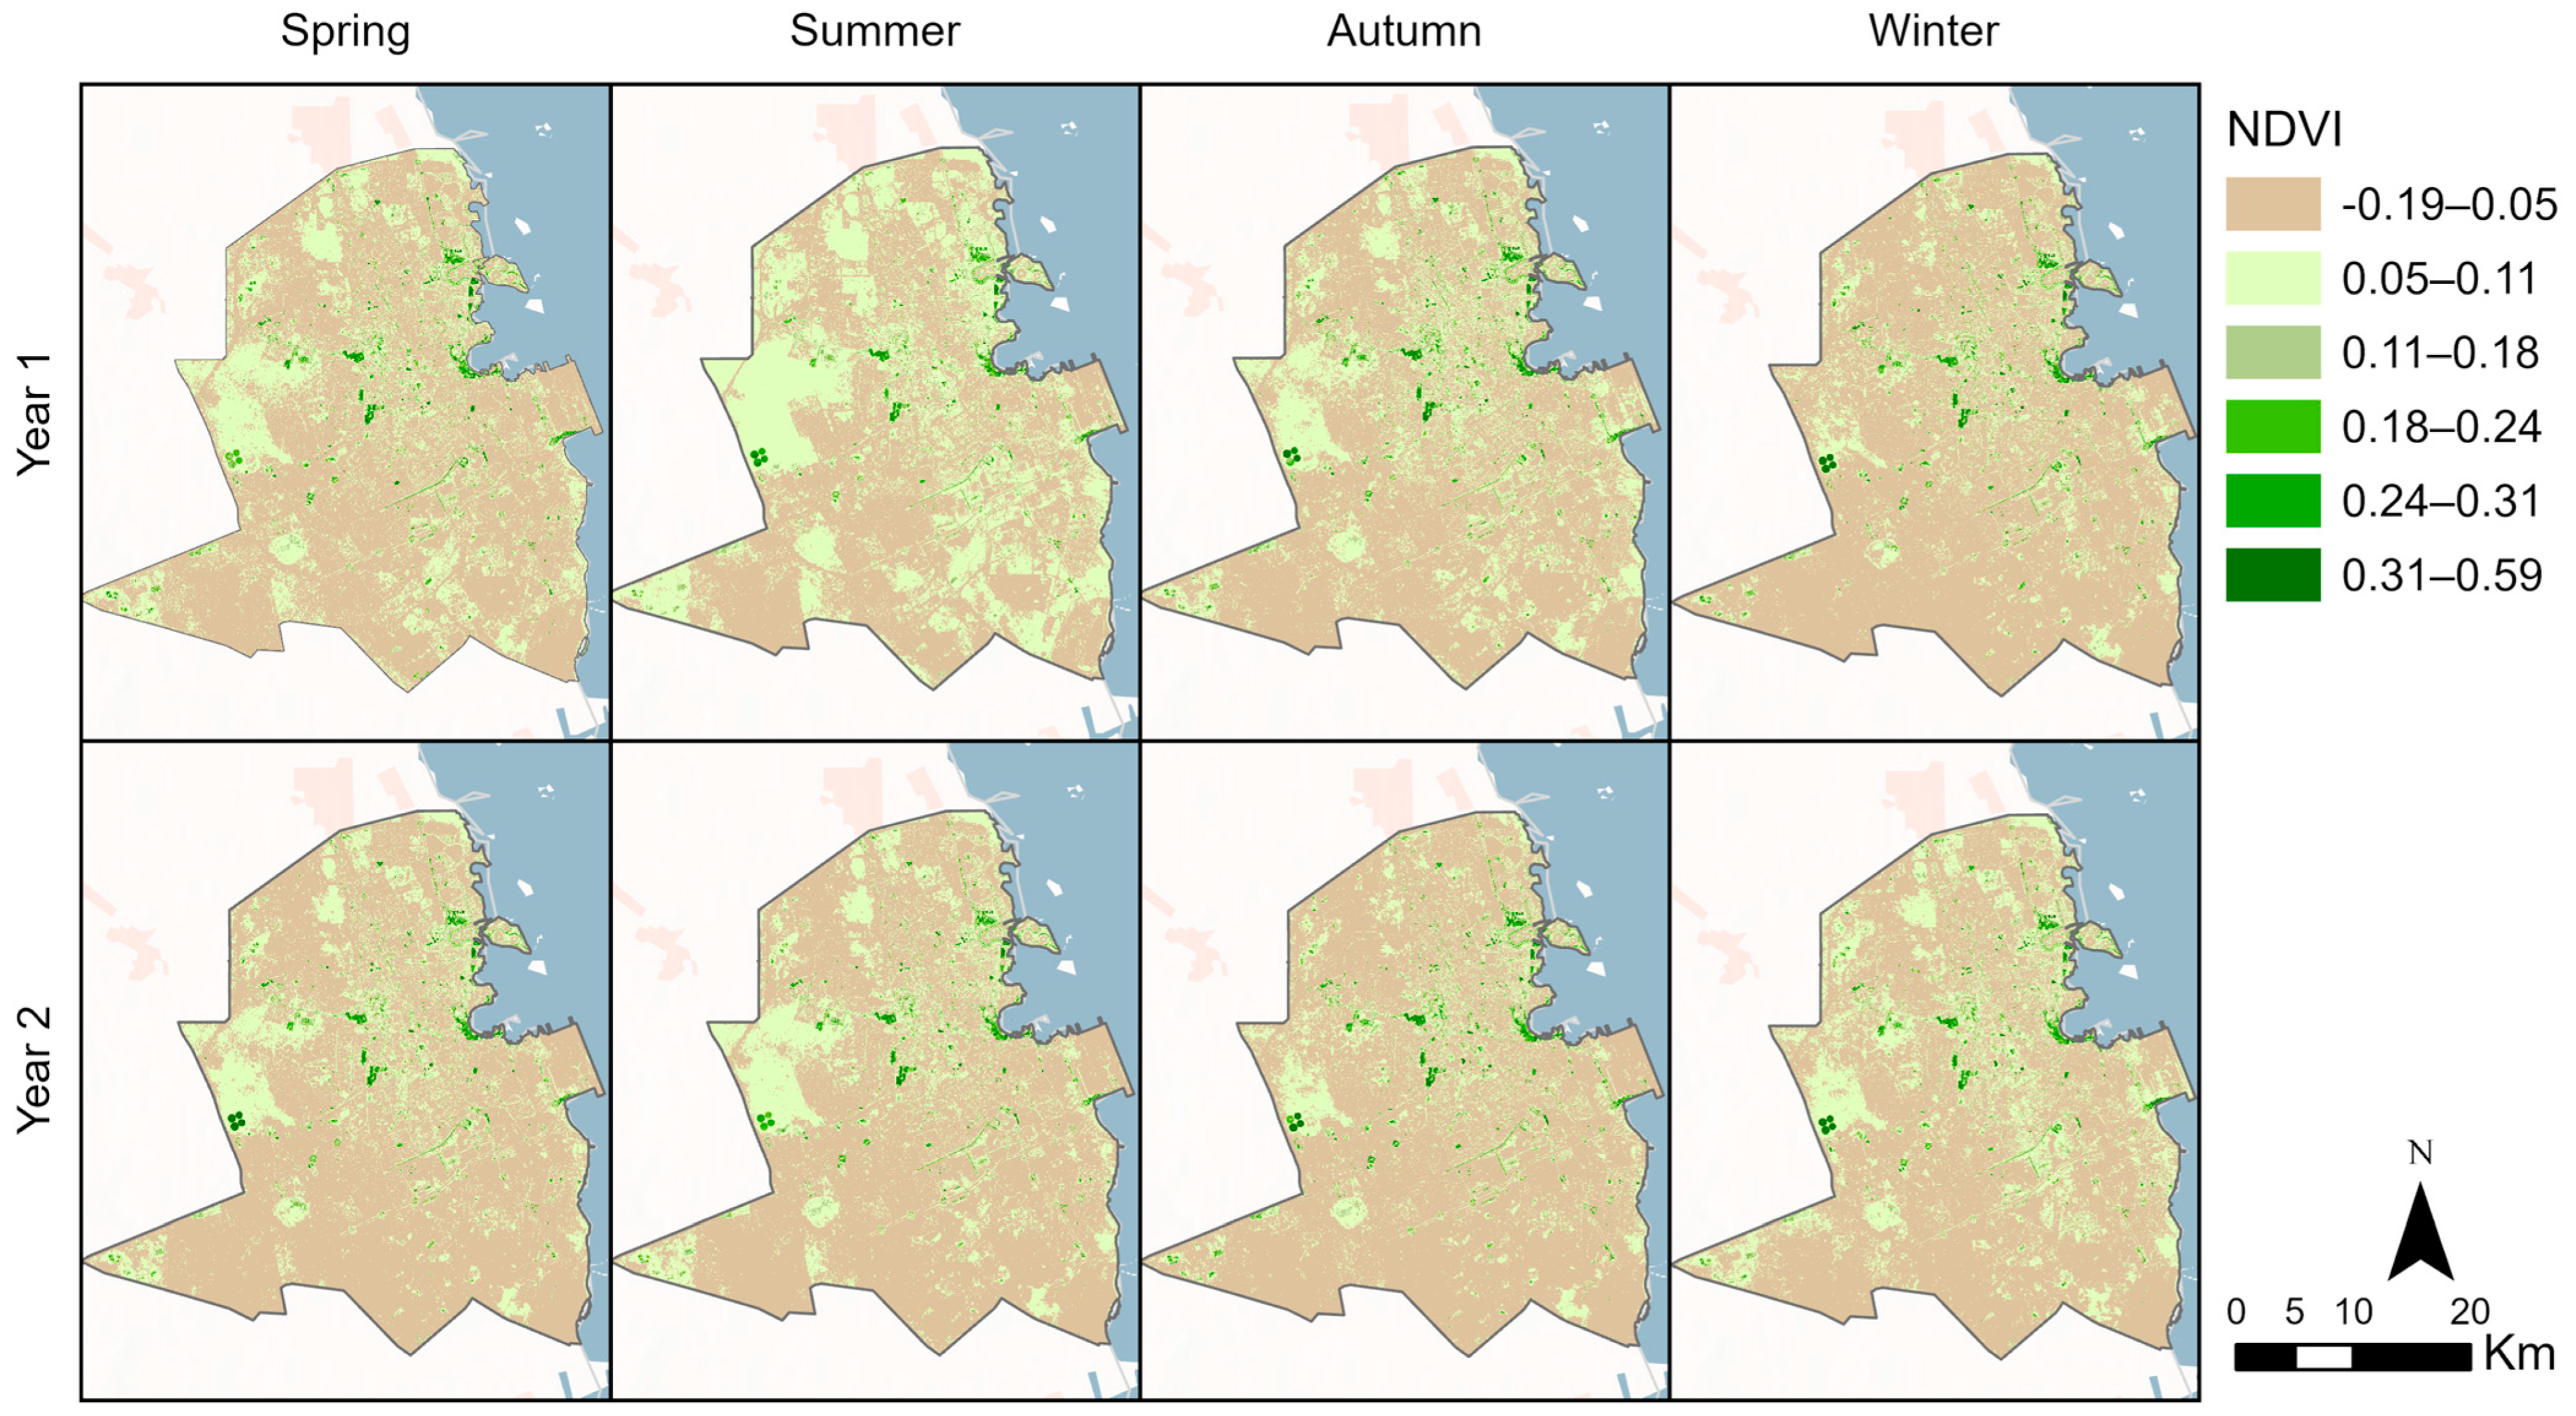
The seasonal NDVI maps indicate a persistent dominance of very low NDVI values across the study area, reflecting the region’s arid environmental conditions (Figure 7). Across all seasons, the lowest NDVI range (−0.192–0.05) occupies the majority of the landscape and corresponds primarily to barren sand, exposed soil, and built-up surfaces. This pattern remains spatially consistent throughout the study period. Higher NDVI values occur only in spatially limited, fragmented patches associated with irrigated and intensively managed landscapes, such as public parks, landscaped residential compounds, institutional campuses, and small agricultural areas. The highest NDVI ranges (>0.246) remain localized and do not form continuous vegetated corridors across the urban landscape.
Seasonal variability is evident, with summer conditions showing the greatest contraction of moderate- and high-NDVI areas, indicating vegetation stress under peak thermal and evapotranspirative conditions. In contrast, winter conditions exhibit the largest spatial extent of moderate NDVI values, reflecting improved vegetation vigor during cooler months. Spring displays patterns similar to winter, but with slightly reduced spatial coverage of higher-NDVI patches, while autumn shows partial recovery from summer stress. Interannual differences between corresponding seasons remain minimal.
Seasonal NDVI greening along transportation corridors can be observed. This demonstrates a positive relationship with rainfall variability, emphasizing the hydro-climatic sensitivity of fragmented green infrastructure in hyper-arid cities. According to the Qatar Meteorology Department, Qatar receives an average annual rainfall of approximately 70–80 mm, with the majority occurring between November and March [45]. This seasonal concentration of precipitation aligns with the observed winter increase in NDVI values along landscaped medians and roadside corridors. Similar relationships between precipitation and NDVI response in arid and semi-arid regions have been widely documented in remote sensing literature, including foundational work by Tucker (1979) [46], who established NDVI as a reliable proxy for vegetation vigor and moisture sensitivity, and later syntheses such as Pettorelli (2013) [47], which highlight precipitation as a dominant driver of NDVI variability in water-limited environments.
The seasonal variability observed in vegetated LCZ classes in Figure 8, particularly the pronounced cooling of bush/scrub during Spring 2025, may partly reflect the influence of antecedent rainfall, soil moisture, and vegetation greenness on surface energy partitioning, though direct soil moisture measurements were not available in this study to confirm this mechanism. Qatar’s seasonal rainfall concentration between November and March [45], evident in the ERA5-Land precipitation profile (Figure 5), is consistent with the observed winter and spring increase in NDVI noted above, aligning with the well-established sensitivity of NDVI to precipitation variability in water-limited environments [46,47]. These patterns suggest that rainfall-driven soil moisture and vegetation greenness may act as transient thermal moderators in vegetated LCZ classes, even where overall vegetation cover remains spatially limited. Conversely, the reduced cooling signal in vegetated classes during summer coincides with the contraction of NDVI extent under peak heat and moisture deficit conditions.

3.5. Relationship Among LST, UHI, NDVI, and LCZ

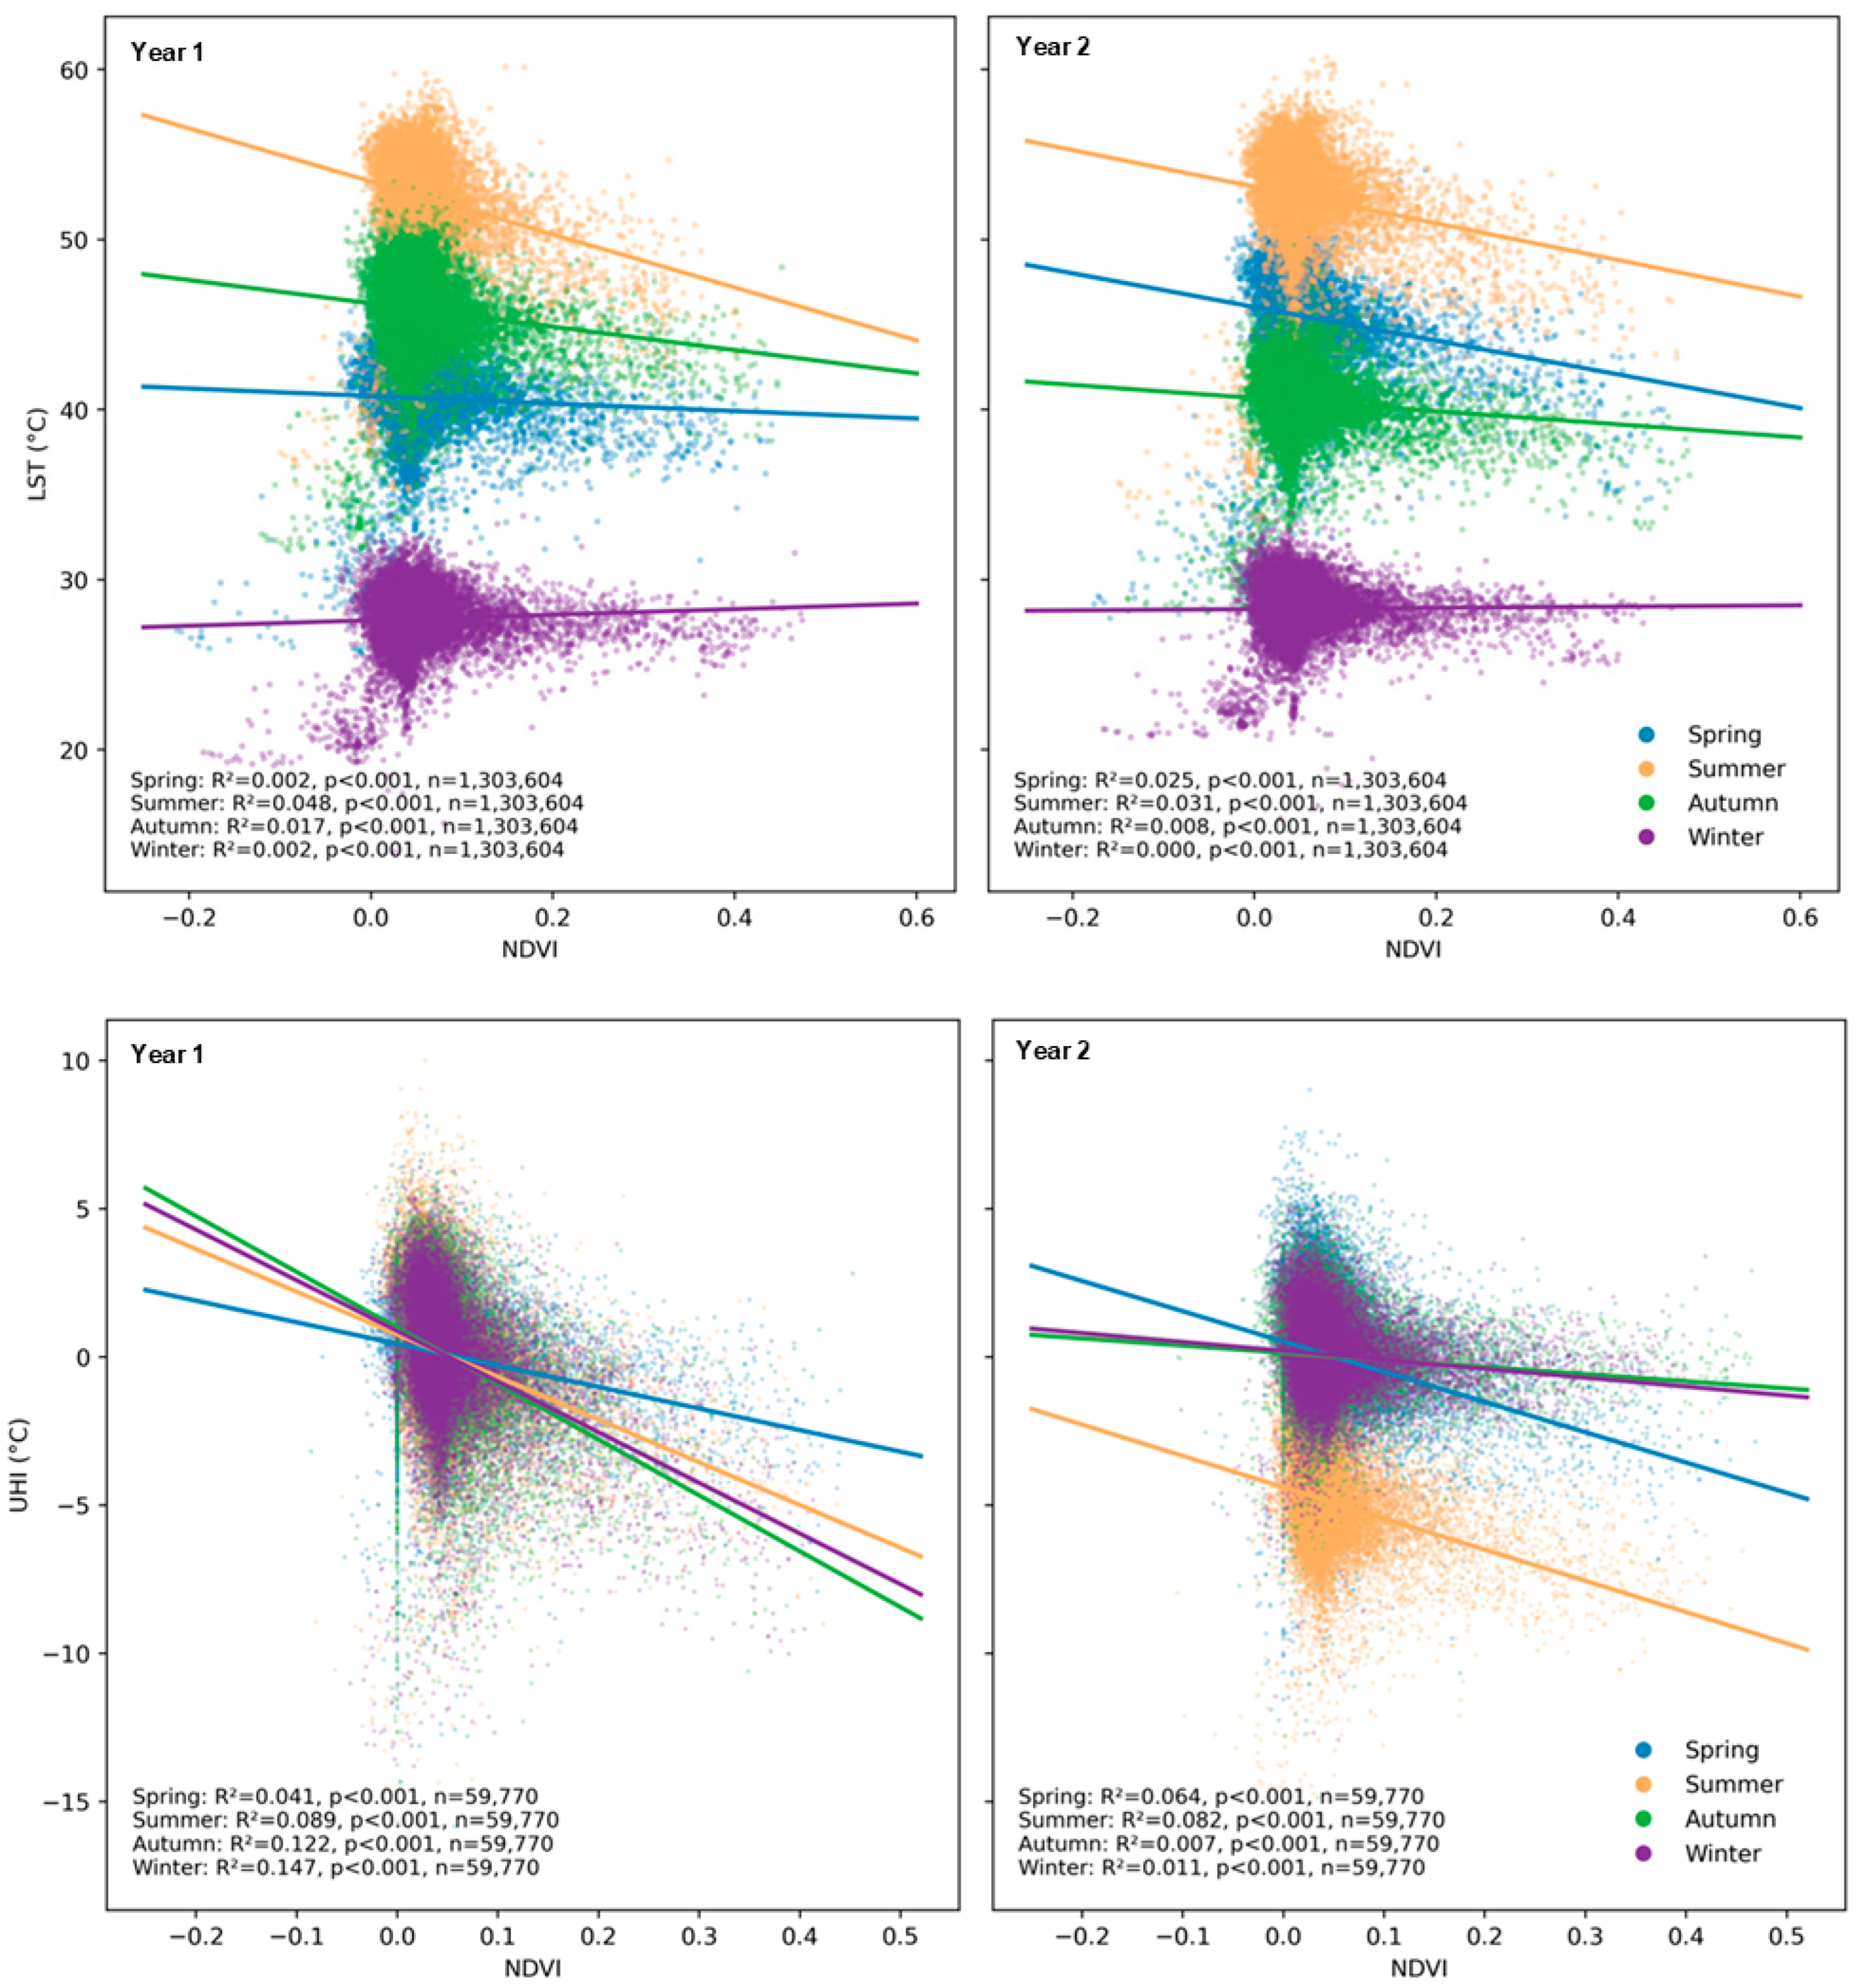
The seasonal relationship between NDVI and LST across the study area was investigated (Figure 8). The steeper negative slopes in both summers show that pixels were measurably cooler during peak heat conditions, possibly due to evapotranspiration and shading effects. However, even in summer, NDVI explains less than 5% of the spatial variability in LST. In Spring 2024, the relationship is negligible (R2 = 0.002), whereas in Spring 2025 it shows a modest strengthening (R2 = 0.025). During Autumn 2024 (R2 = 0.017) and Autumn 2025 (R2 = 0.008), the negative association weakens further as ambient temperatures moderate. In contrast, the relationship becomes negligible and slightly positive in Winter 2025 (R2 = 0.002) and nearly disappears in Winter 2026 (R2 ≈0.000). The statistical significance of these slopes reflects the large pixel-level sample size and the presence of spatial autocorrelation inherent in raster-based datasets, rather than meaningful explanatory power.
Similarly, the seasonal relationship between NDVI and UHI was investigated (Figure 7). The correlation showed that, in the first year, the strength of the relationship varied by season. Winter demonstrates the strongest association (R2 = 0.147), followed by autumn (R2 = 0.122) and summer (R2 = 0.089), while spring exhibits the weakest correlation (R2 = 0.041). The regression slopes consistently show a decrease in UHI intensity with increasing NDVI, suggesting a modest association between vegetation density and urban thermal conditions during this period, though the explanatory power remains limited. The scatter distribution also reveals a dense concentration of points around low NDVI values (approximately 0–0.1).
In the second year, the NDVI–UHI relationship remains statistically significant across all seasons (p < 0.001), although the explanatory strength is generally weaker. Spring shows the highest coefficient of determination (R2 = 0.064), followed by summer (R2 = 0.082), while autumn (R2 = 0.007) and winter (R2 = 0.011) exhibit minimal correlation. The flatter regression slopes during autumn and winter suggest a reduced cooling influence of vegetation during these periods, possibly reflecting seasonal climatic conditions or vegetation stress. Results indicate that vegetation moderates surface thermal intensity, but its explanatory power remains limited, with R2 values below 0.15 across all seasons. Suggesting that while vegetation plays a role in mitigating urban heat, other factors likely exert stronger influences on thermal patterns in the study area.
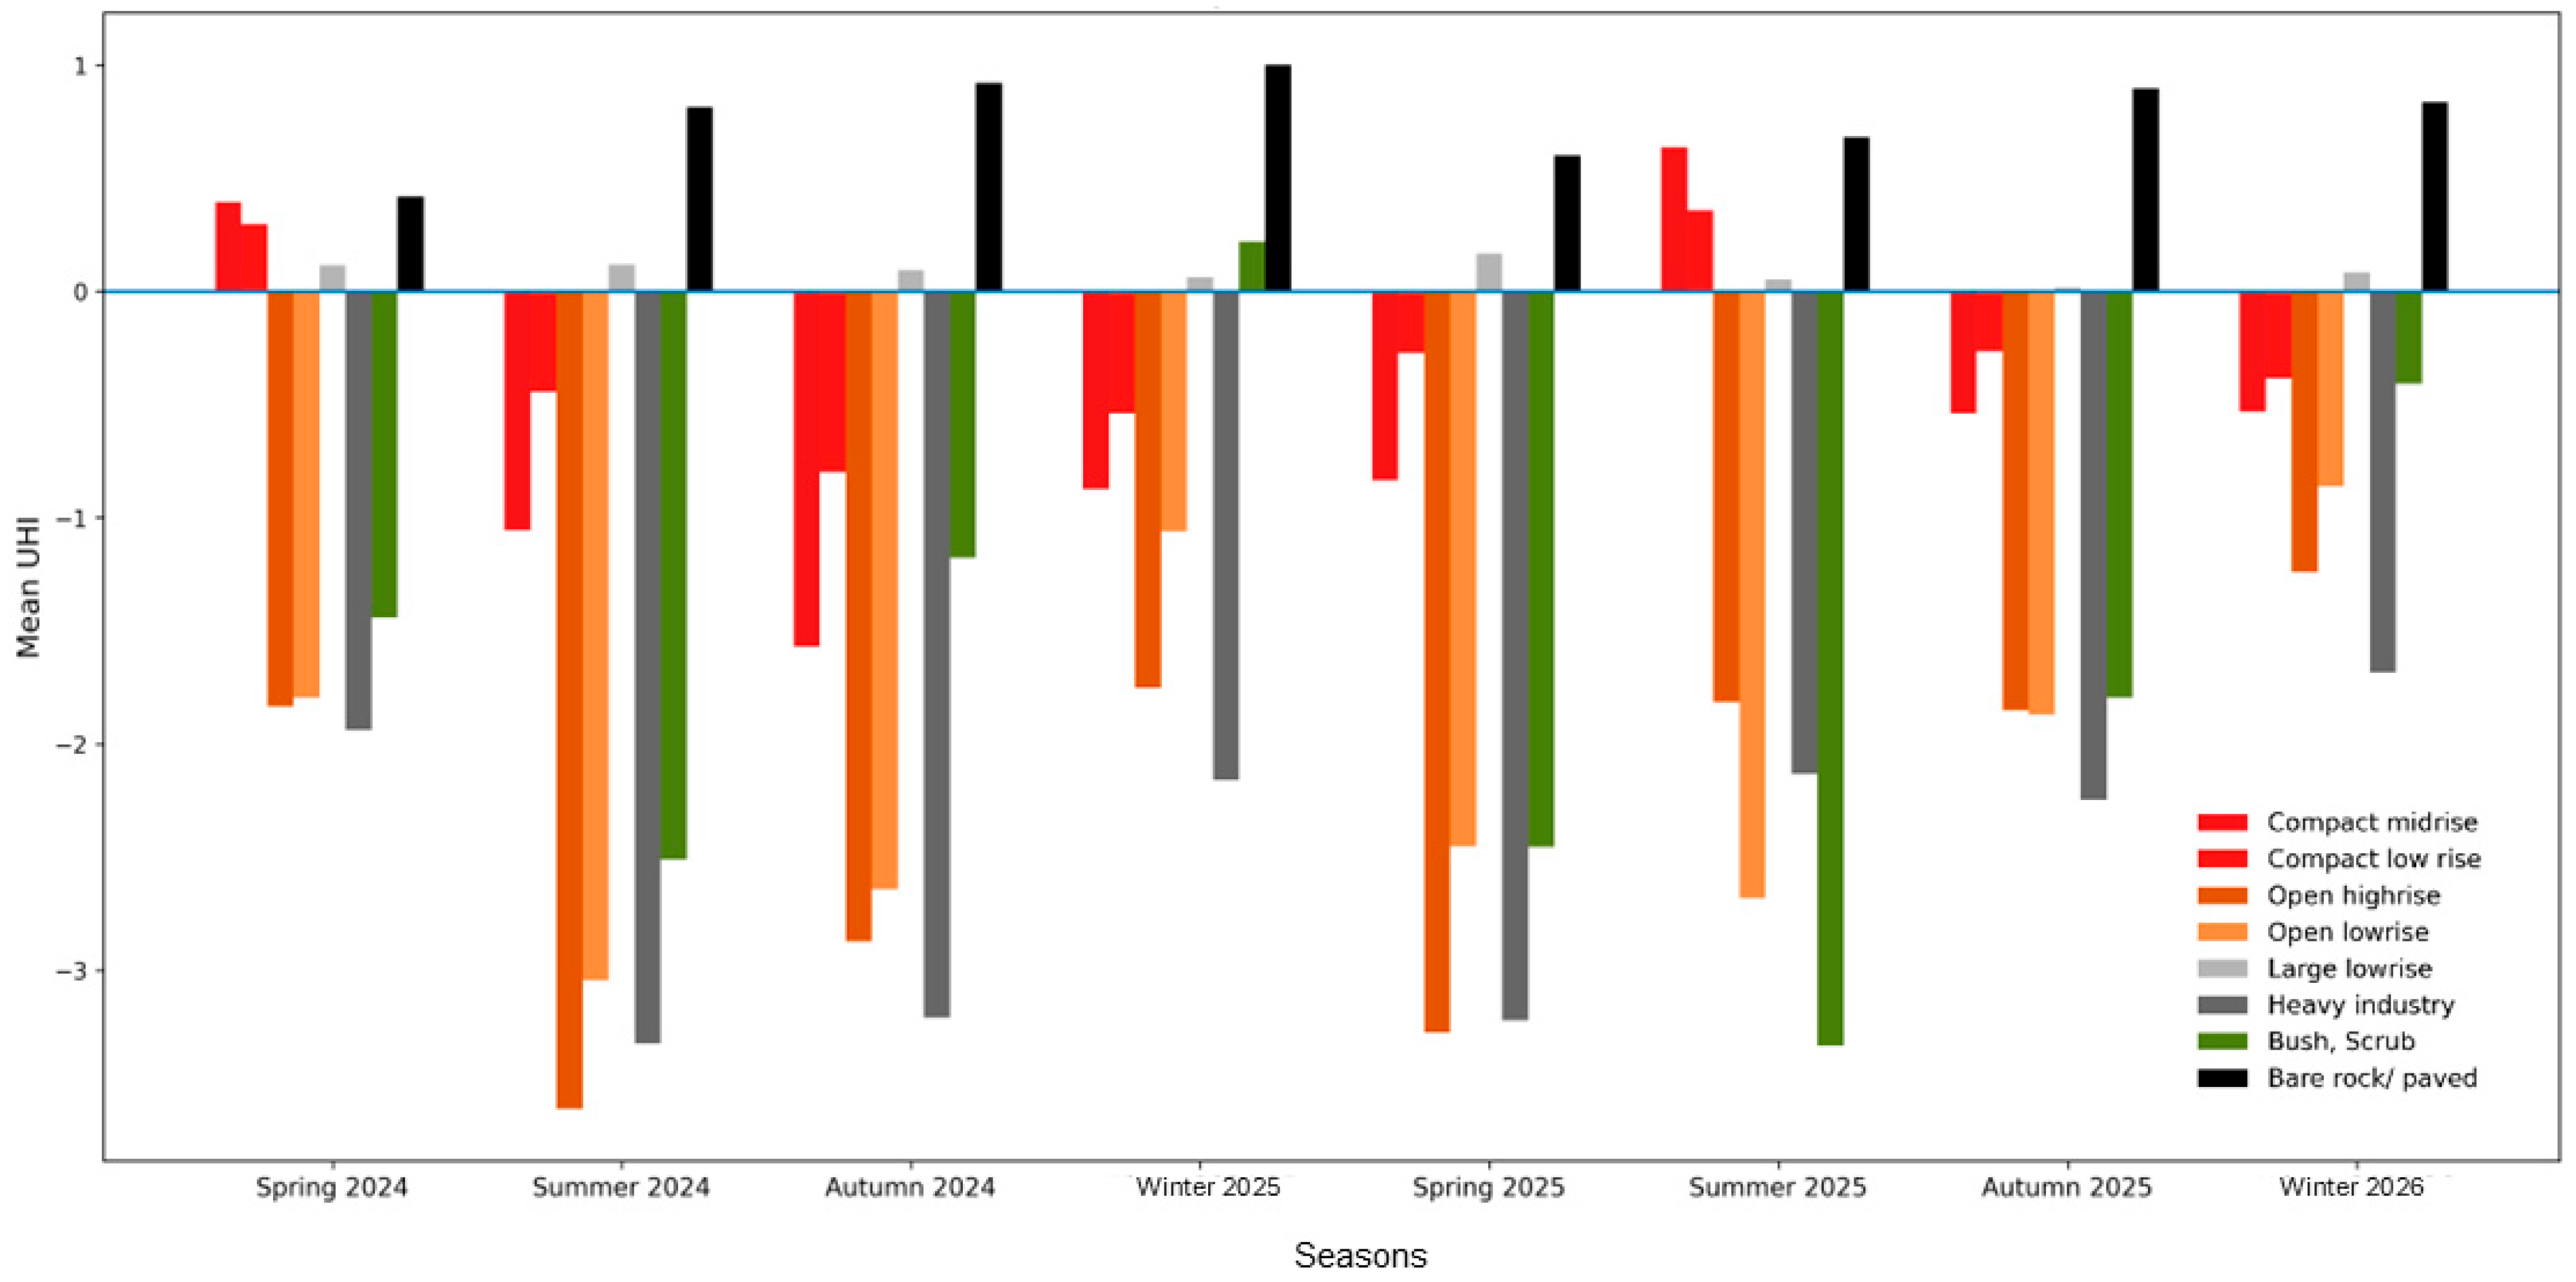
Figure 9 presents the seasonal distribution of mean UHI across LCZ typologies over two consecutive annual cycles to understand how urban morphology affects thermal variability. A clear pattern of thermal differentiation is observed. Open high-rise areas exhibit the strongest cooling effect, with mean UHI values reaching approximately −3.6 °C during Summer 2024 and remaining below −1.8 °C across most seasons. Open low-rise areas show a similar, though less pronounced, cooling trend, particularly during warmer periods. Heavy industrial areas also display consistently negative UHI values (approximately −1.7 °C to −3.3 °C), but with comparatively limited seasonal variability, indicating stable thermal behavior.
Compact mid-rise and compact low-rise districts exhibit more moderate cooling (−0.3 °C to −1.1 °C). In contrast, large low-rise residential areas remain closest to thermal neutrality, with values near zero across most seasons. Bare rock and paved surfaces show the highest positive UHI values, frequently exceeding 0.8 °C and approaching 1.0 °C, indicating strong heat retention. Vegetation classes display greater variability, with bush and scrub showing notable cooling during Spring 2025 (below −3 °C).
The higher UHI intensities in compact mid-rise and compact low-rise zones during Spring 2024 and Summer 2025 can be attributed to prevailing meteorological conditions, including rapid seasonal warming and extreme summer heat. Historical records indicate elevated temperatures and reduced nocturnal cooling, which amplify heat retention in dense urban fabrics with limited ventilation [48].
These patterns must be interpreted in relation to UHI as a deviation from the study area mean. While the spatially weighted average UHI is zero, the class-wise means are not area-weighted. The predominance of negative values across most LCZs reflects the influence of thermally dominant and spatially extensive classes, particularly bare soil/sand and large low-rise areas, with PLAND of 52.8% and 38.6%, respectively (Table 3), which elevate the overall temperature baseline. Consequently, many LCZs appear cooler relative to this elevated mean.
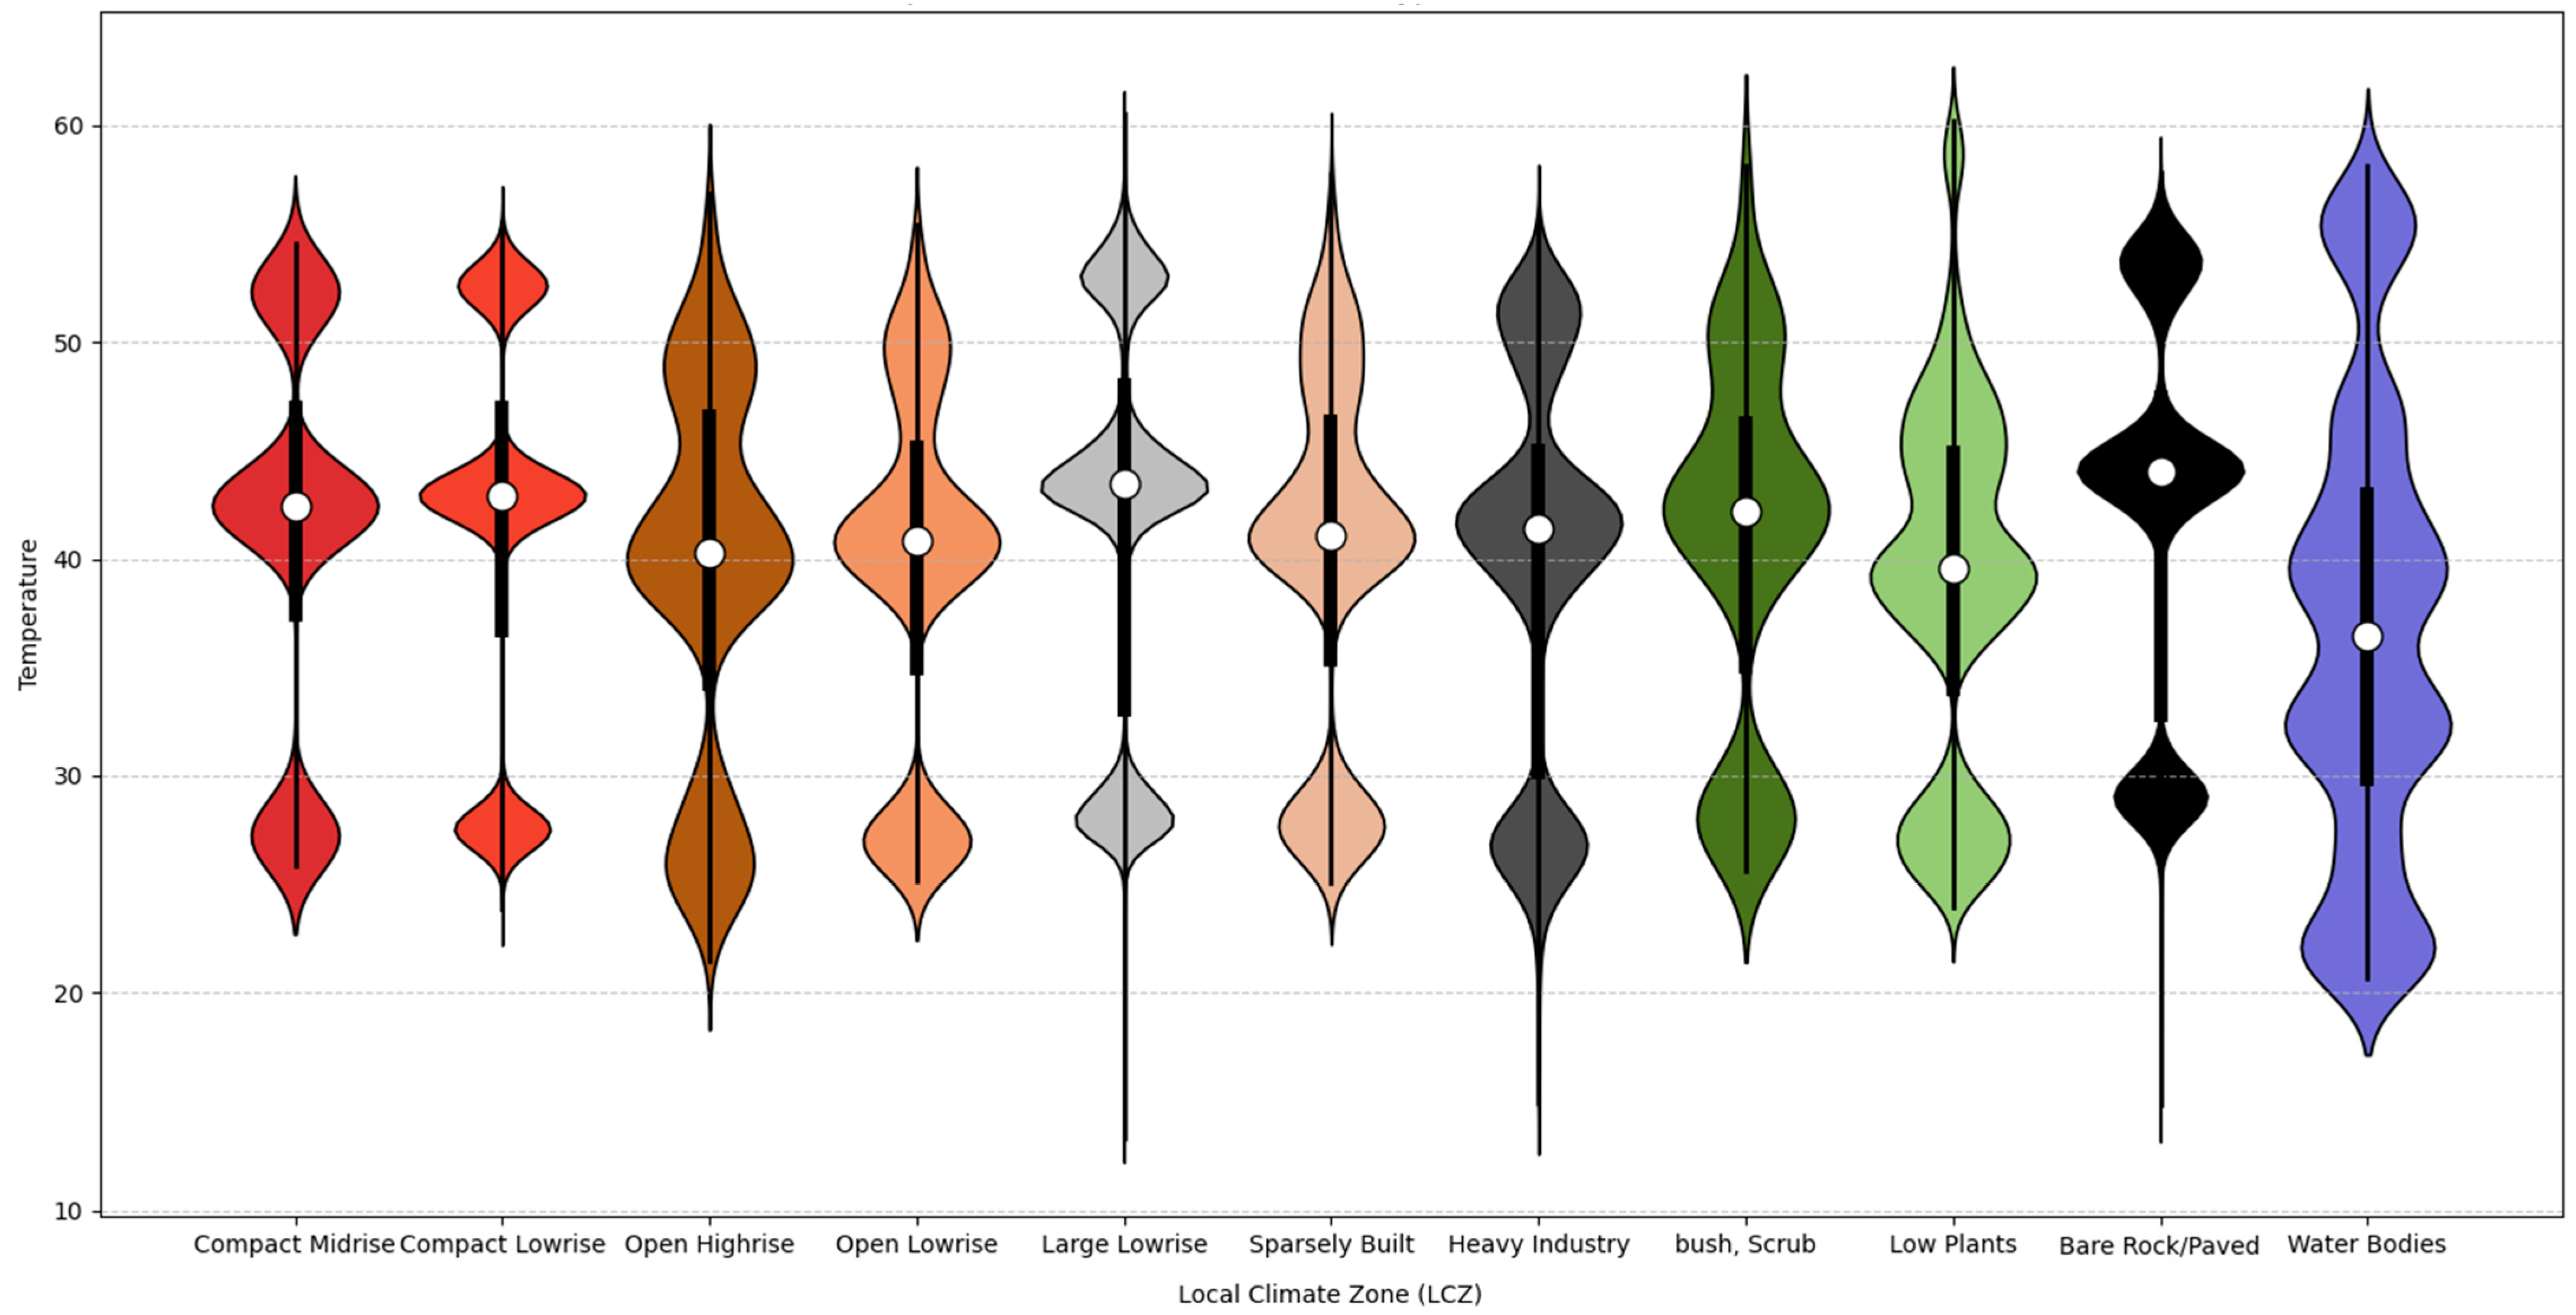
To further examine thermal variability in LST, the distribution of surface temperatures across LCZs shows differences in variability rather than clear separation in absolute temperature levels (Figure 10). While built-up morphologies such as compact mid-rise, compact low-rise, and large low-rise display slightly higher central values, substantial overlap in temperature ranges is observed across all LCZ types.
Differences are more apparent in the spread of the distributions. Compact urban forms tend to exhibit relatively narrower ranges, whereas open and sparsely built classes show wider dispersion. Vegetated classes, including bush/scrub and low plants, occupy intermediate ranges with moderate variability. In contrast, impervious and exposed surfaces, particularly bare rock/paved, extend toward higher temperature ranges relative to other LCZs.
The distributions exhibit a multi-modal structure, with recurring concentrations of values around approximately 25–30 °C, 40–45 °C, and 50–55 °C. These groupings reflect the range of temperatures observed under different seasonal conditions within the dataset. Despite this structure, the distributions across LCZs remain largely overlapping, with most classes spanning comparable temperature intervals.
Water bodies show a comparatively wider distribution relative to other classes. The bare soil/sand LCZ was excluded due to computational constraints associated with its large data volume. Overall, differences across LCZs are more evident in the spread and range of temperatures than in clearly separated temperature levels.
Taken together, the distributions indicate that while central values remain broadly similar across LCZs, greater differentiation emerges in variability and range. Narrower interquartile ranges in compact classes contrast with wider dispersion in open and sparsely built areas, while the overall spread captures the extent of temperature extremes. The presence of multiple peaks reflects seasonal structuring of LST, within which LCZ-related differences are expressed primarily through variability rather than distinct temperature levels.
The elevated thermal response of large low-rise areas observed in Figure 8 and Figure 9 is consistent with patterns of urban sprawl, where extensive impervious surfaces and low-density layouts enhance heat accumulation. Similar relationships between sprawling urban forms and increased UHI/LST have been reported in arid cities such as Riyadh and Jeddah, where rapid urban expansion and land use change significantly intensify thermal conditions [49,50].

3.6. Influence of LCZs Patterns on Thermal Variability

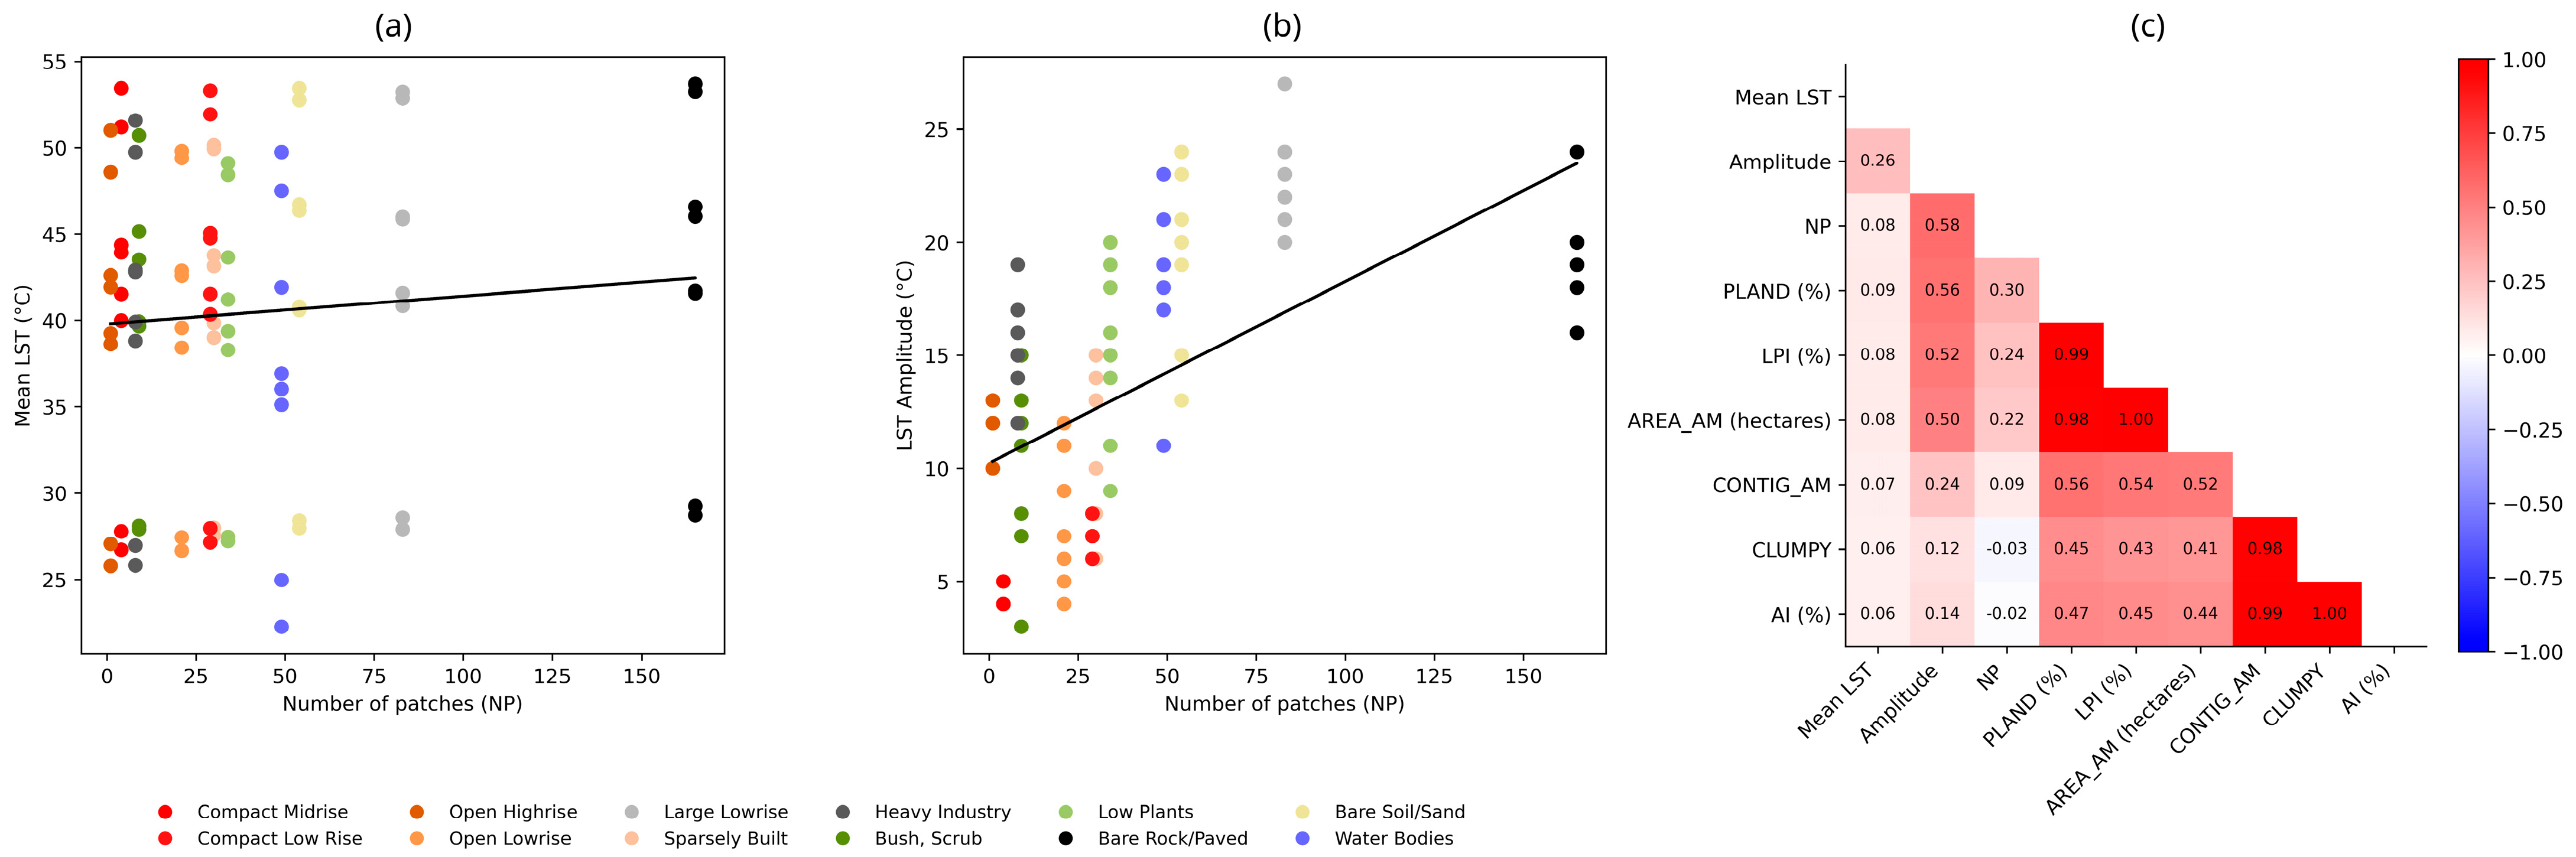
Figure 11 illustrates the relationships between landscape ecological characteristics and intra-urban thermal indicators across different Local Climate Zones (LCZs). Given the limited number of LCZ classes, these relationships are interpreted as exploratory and descriptive, intended to highlight general spatial tendencies rather than statistically robust associations.
Figure 11a examines the association between mean land surface temperature (LST) and landscape composition, represented by the percentage of landscape (PLAND). The results indicate a weak relationship between these variables, with mean LST showing minimal variation across LCZ classes despite differences in land cover dominance. For instance, LCZ classes characterized by high PLAND values, such as large low-rise and bare soil/sand areas, do not consistently correspond to higher mean LST. Similarly, more compact or heterogeneous classes, including compact mid-rise and open low-rise areas, display comparable temperature ranges. This pattern suggests that land cover composition alone does not strongly control baseline thermal conditions at the class level, and that mean LST is likely influenced by additional factors such as material properties and surface characteristics.
Figure 11b explores the relationship between LST amplitude and landscape fragmentation, represented by the number of patches (NP). A moderate positive relationship is observed, indicating that LCZ classes with higher fragmentation tend to exhibit greater seasonal thermal variability. For example, highly fragmented classes, such as bare rock/paved and sparsely built areas, are associated with higher amplitude values, reflecting larger fluctuations in thermal conditions across seasons. In contrast, less fragmented classes demonstrate comparatively lower amplitude, suggesting more stable thermal behavior. These patterns indicate that fragmentation plays a more pronounced role in influencing thermal variability than in determining absolute temperature levels, highlighting the sensitivity of seasonal dynamics to spatial heterogeneity.
Figure 11c presents the Pearson correlation matrix among thermal indicators and class-level metrics. Mean LST shows weak associations with all landscape metrics (|r| < 0.1), indicating limited linear correspondence with PLAND, NP, AREA_AM, and related measures in this dataset. In contrast, a moderate positive correlation is observed between NP and LST amplitude (r ≈ 0.58), consistent with the pattern shown in Figure 11b. Strong intercorrelations are evident among several landscape metrics, including PLAND, LPI, and AREA_AM, as well as among aggregation-related indices such as CONTIG, CLUMPY, and AI, with CLUMPY and AI approaching perfect correlation (r ≈ 1.0). These high correlations reflect overlap in how landscape structure is quantified rather than independent relationships with thermal indicators. Overall, the matrix indicates that associations with mean LST are weak, while stronger relationships are observed among landscape metrics and between NP and LST amplitude.

4. Discussion

The multi-season analysis demonstrates that the interaction between urban morphological composition and seasonal climatic forcing fundamentally shapes the thermal structure of the study area. The integration of LCZ mapping with landscape metrics has been empirically shown to provide a robust framework for linking urban spatial structure with thermal variability. Zhang et al. (2022) [26] demonstrate that both LCZ composition and configuration significantly influence surface urban heat island intensity, with compositional dominance often exerting stronger effects than configurational attributes. Building on this established LCZ–thermal coupling framework, the present study evaluated how the compositional and configurational characteristics of LCZ classes relate to seasonal LST and UHI intensity patterns in the study area The landscape ecological analysis in this study indicates that impervious or semi-impervious materials dominate large, spatially continuous surface matrices. The results suggest that such morphological consolidation corresponds to conditions of persistent heat accumulation and limited thermal dispersion. These findings are consistent with recent research demonstrating that thermal variability across Local Climate Zones can produce substantial intra-urban temperature differences, with implications extending to energy demand and urban climate management [51].

4.1. Seasonal Land Surface Temperature Variation in the Study Area

Seasonal analysis reveals pronounced thermal contrasts across the annual cycle, confirming that regional climatic seasonality remains the dominant temporal driver of surface temperature variability. The study records a seasonal amplitude exceeding 48 °C, with maximum summer LST reaching 61.33 °C and winter minima falling to 12.47 °C. Despite this strong climatic forcing, intra-urban thermal differentiation remains consistently structured by urban morphology. Using mobile vehicle traverses across Doha, Makido et al. (2016) [52] similarly demonstrated strong spatial variability in near-surface air temperature, highlighting the influence of vegetation cover, built surfaces, and urban form on local thermal conditions. Higher LST values are systematically associated with industrial, large low-rise, and compact low-rise LCZ typologies. These classes are characterized by relatively high Largest Patch Index (LPI) values and strong spatial aggregation, indicating large thermally cohesive blocks of impervious surfaces rather than dispersed fragments. For example, large low-rise areas exhibit an LPI of 14.70%, confirming the presence of extensive suburban patches dominated by low-rise buildings and hard surfaces. Comparable patterns have been observed in arid environments, where urban expansion and the replacement of natural surfaces with impervious materials significantly increase LST, while compact traditional forms and vegetated systems provide more effective thermal regulation [53].
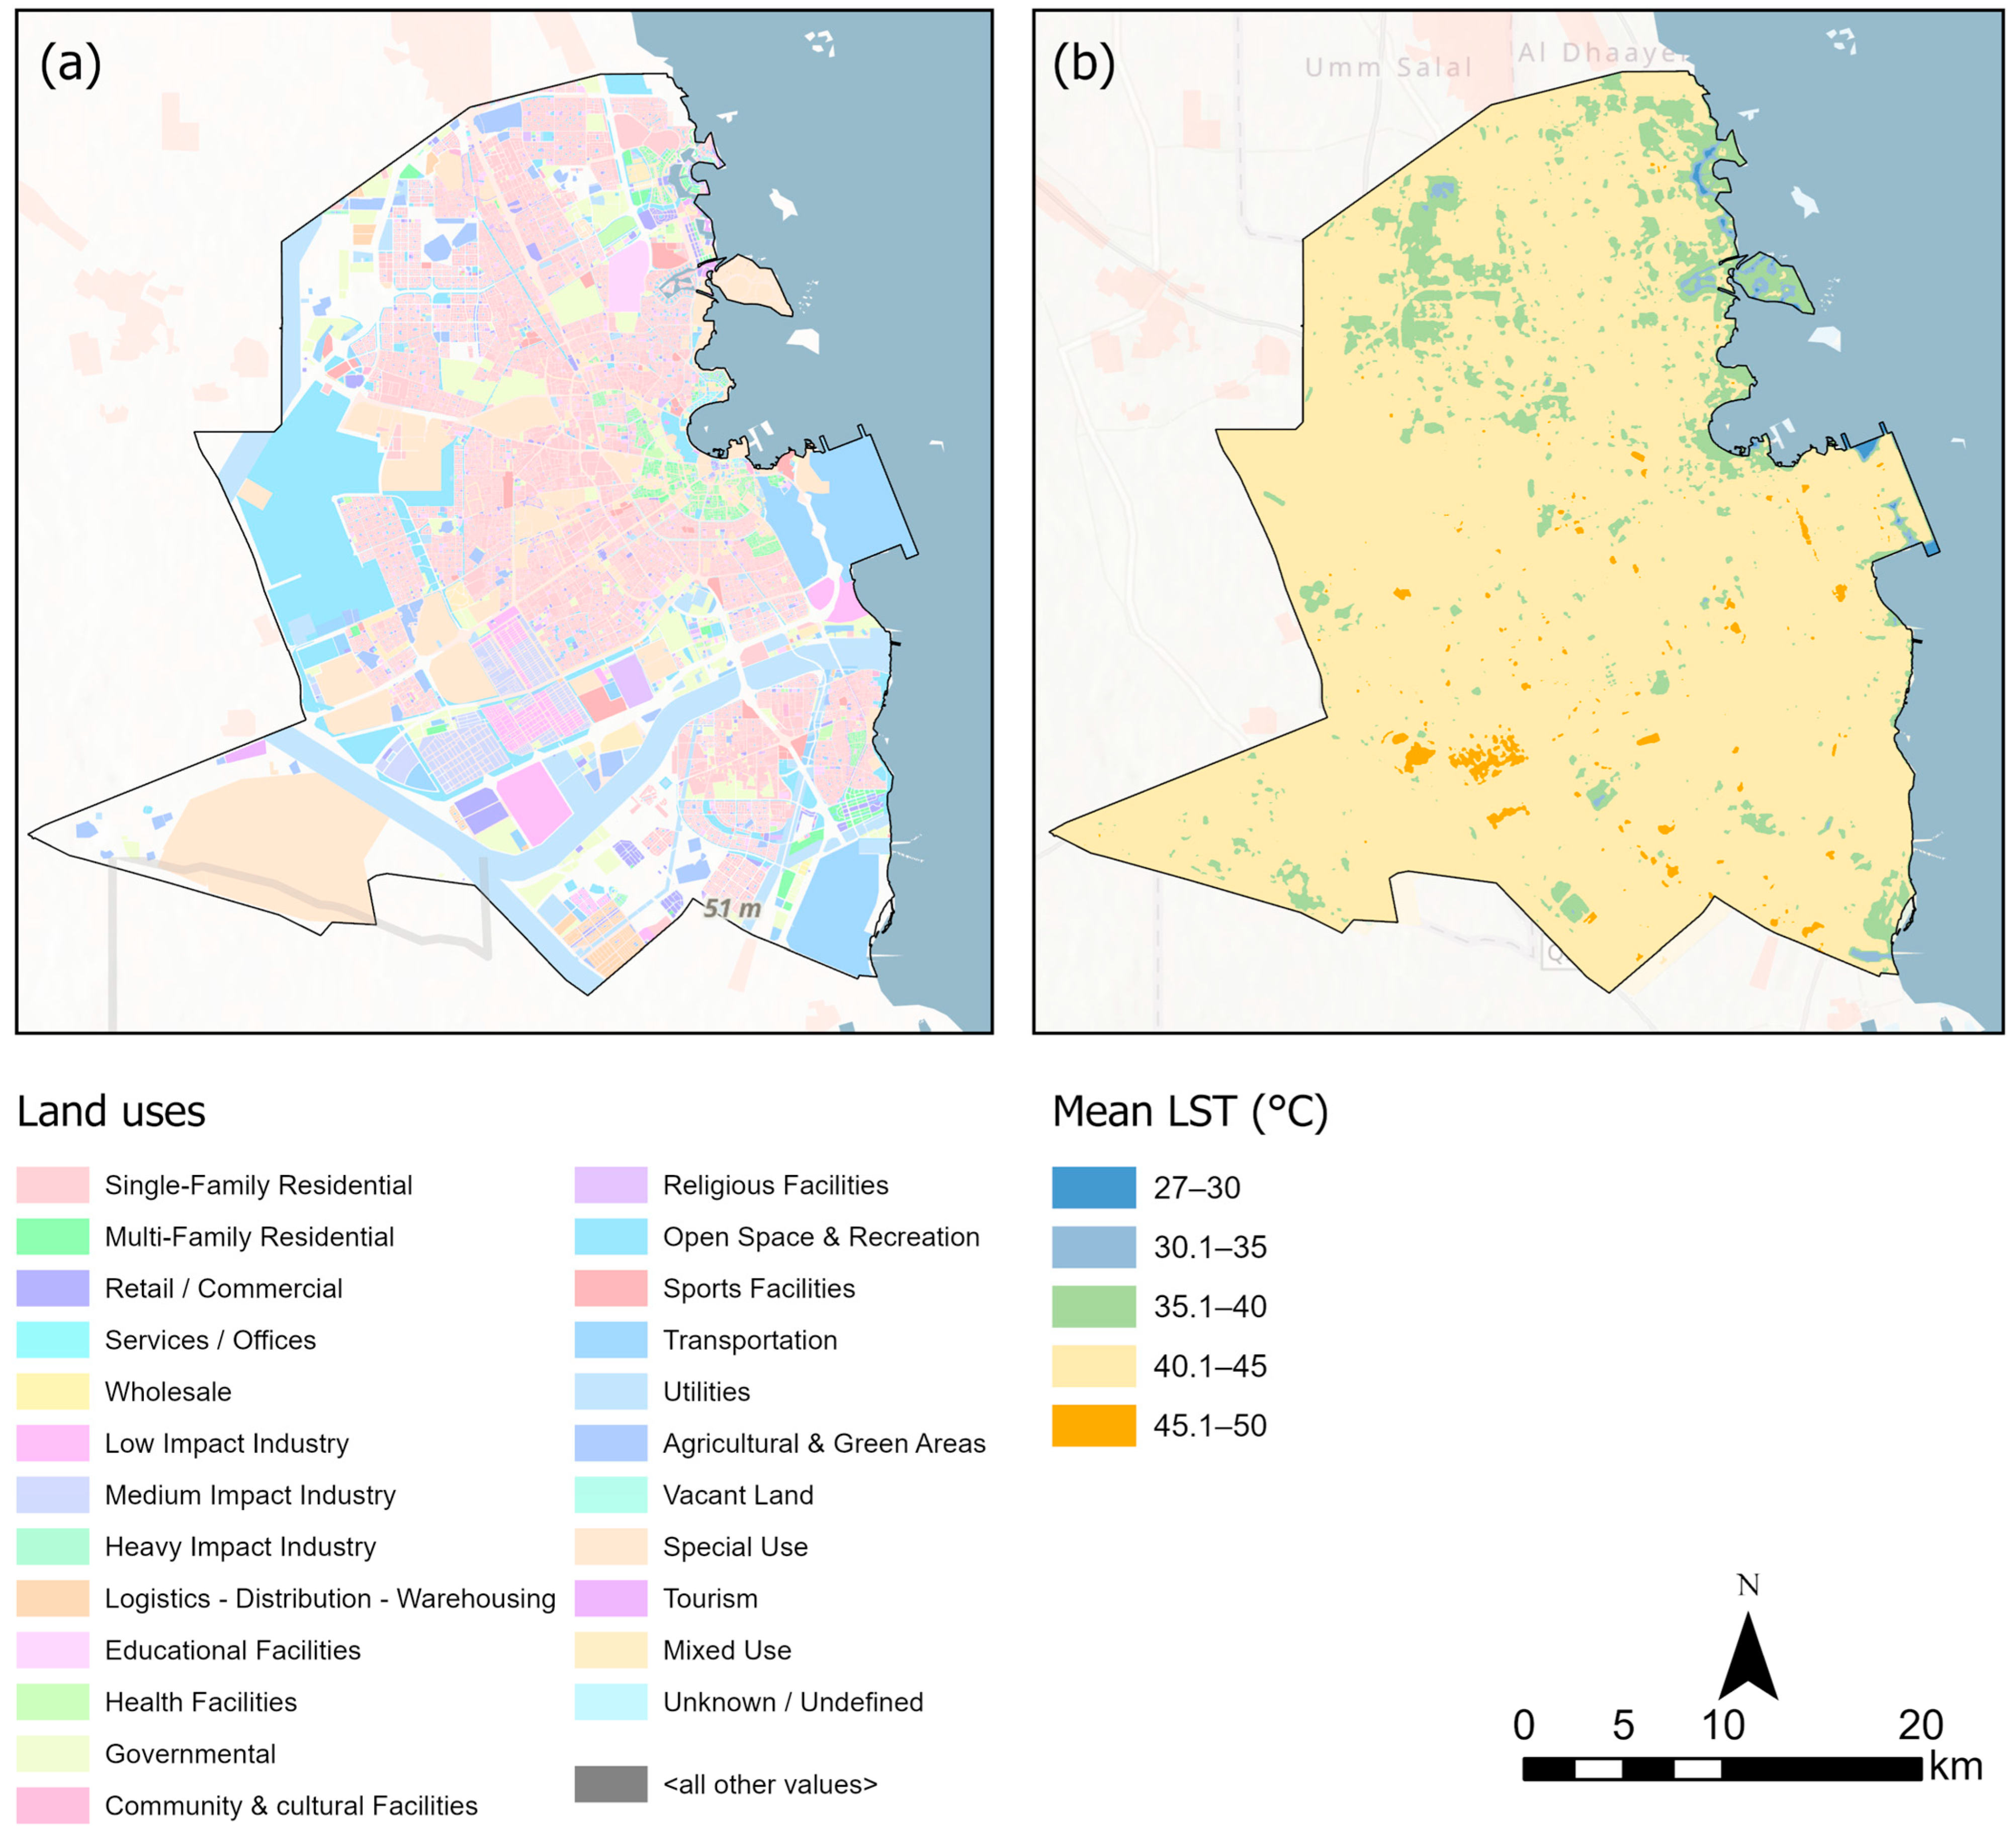
To further contextualize these thermal patterns in relation to planning-relevant land use categories, Figure 12 overlays Qatar National Master Plan zoning with spatially averaged LST, revealing a clear correspondence between land use intensity and thermal magnitude. The most pronounced hotspots (45.1–50 °C) are concentrated over heavy industrial, logistics distribution, and warehousing zones in the southern urban periphery and the Old Airport district, areas of extensive impervious cover and minimal vegetation that function as structurally persistent heat sources. The dominant low-rise residential fabric sustains temperatures of 40.1–45 °C, while cooler zones (35.1–40 °C) coincide with open space and coastal land uses in northern Doha. These cooling areas remain spatially fragmented and surrounded by thermally dominant impervious surfaces, limiting their city-scale effect. Together, the two panels provide a planning-relevant spatial basis for the morphology-sensitive heat management strategies discussed in Section 4.3.
The strongest UHI intensity occurs not during peak summer but during Autumn 2024, when UHI reaches 9.02 °C. This pattern suggests that spatially aggregated impervious typologies retain and redistribute heat, amplifying relative thermal contrasts during transitional seasons when background atmospheric temperatures decline but stored urban heat remains elevated. Similar seasonal behavior has been observed in other arid urban environments, where built surfaces exhibit strong thermal inertia and delayed cooling.
These findings align with earlier research on Doha’s urban climate. Al Kuwari and Ahmed (2015) [7] documented increasing LST trends associated with rapid urban expansion and land cover transformation in Qatar. Analysis conducted across rapidly urbanizing cities have similarly demonstrated that densely built and impervious urban surfaces are strongly associated with elevated land surface temperatures, while vegetation cover and more heterogeneous landscape configurations contribute to measurable cooling effects [54], though its explanatory power in the present study remains limited [54]. The present analysis extends these earlier observations by explicitly linking seasonal thermal behavior to LCZ-based morphological structure and spatial configuration, demonstrating that the intensity and distribution of urban heat are strongly conditioned by landscape composition and patch structure.

4.2. Vegetation, Spatial Continuity, and Thermal Regulation

The spatiotemporal assessment of NDVI reveals selective greening patterns within the study area, primarily concentrated in large, well-established regional parks and select coastal landscapes (Figure 6). Across all seasons, the highest NDVI values were consistently recorded in major coastal parks such as Al Bidda Park and Katara Cultural Village, where winter and autumn values exceeded 0.19, indicating comparatively vigorous vegetation cover. Even during peak summer stress, these parks maintained moderate NDVI levels (approximately 0.116–0.18), suggesting a degree of resilience supported by irrigation management, vegetation maturity, and coastal microclimatic moderation. In contrast, densely built-up districts, including industrial zones, the airport vicinity, and compact commercial sectors, consistently exhibited NDVI values near zero or negative, confirming minimal effective canopy cover and limited greening.
The relationship between NDVI and LST indicates that vegetation density, as represented by NDVI, has limited explanatory power for surface temperature variation in the study area. Even during summer, NDVI accounts for less than 5% of the observed variance in LST, indicating a weak pixel-level association between vegetation density and temperature. These results should therefore be interpreted as reflecting a limited NDVI–LST relationship within this dataset, rather than as evidence of the effects of vegetation extent or spatial configuration, which were not directly analyzed. Higher NDVI values (0.246–0.592) are primarily observed in irrigated landscapes within the study area, including major green spaces such as Aspire Park, Al Bidda Park, and landscaped corridors in Lusail. These patches remain spatially discontinuous and embedded within extensive impervious or desert matrices. As a result, their cooling influence is largely localized and insufficient to generate measurable city-scale thermal mitigation. This behavior is consistent with empirical evidence demonstrating that although urban vegetation contributes to surface cooling through shading and evapotranspiration, its effectiveness is influenced by spatial characteristics, including density, patch size, and connectivity within the urban fabric [55,56]. Consequently, isolated or fragmented green spaces tend to produce only localized cooling effects, with limited influence on broader metropolitan thermal regimes when embedded within extensive impervious surfaces.
Research examining urban microclimates in Middle Eastern cities emphasizes that vegetation-based mitigation strategies are most effective when implemented as integrated green infrastructure networks rather than isolated planting interventions. Urban vegetation can enhance thermal comfort and microclimatic regulation, but its effectiveness increases substantially when tree canopies, parks, and green corridors are spatially interconnected and strategically embedded within urban planning frameworks [57].
Dominant built typologies in the study area, such as heavy industrial zones, exhibit strong spatial cohesion and large patch sizes. This structural imbalance between fragmented vegetation and highly aggregated impervious surfaces reinforces the persistence of metropolitan-scale heat accumulation. Simulation-based studies of hot arid cities demonstrate that urban spatial configuration itself plays a critical role in shaping thermal environments. Modifications in block layout, vegetation placement, and reductions in impervious surfaces can significantly influence neighborhood-scale temperatures, highlighting the importance of integrating morphological design strategies with green infrastructure interventions [58]. Effective urban heat mitigation strategies in arid metropolitan contexts, therefore, require not only increasing vegetated area but also improving spatial continuity, distribution, and integration of green infrastructure within the urban fabric. These findings indicate that vegetation plays a structurally limited role in regulating metropolitan-scale thermal conditions in arid environments, thereby challenging the broader generalizability of vegetation-based UHI mitigation strategies derived from more humid urban contexts.

4.3. Urban Heat Management in Qatar: Structural Implications for Policy

The findings highlight a structural gap in current urban planning practice in Qatar. Existing regulatory approaches largely rely on land use controls and minimum landscaping ratios, which specify the quantity of green space but do not directly evaluate whether these interventions achieve measurable thermal performance outcomes. As demonstrated in this study, intra-urban heat intensity is strongly conditioned by urban morphology (LCZ typology), with NDVI demonstrating a secondary and limited association with thermal variability, suggesting that regulatory frameworks that focus solely on area-based landscape requirements may be insufficient to mitigate localized heat accumulation.
A practical regulatory pathway would therefore be to introduce an Urban Heat Management Overlay Zone within the framework of the Qatar National Master Plan (QNMP). Such an instrument would align with the QNMP’s stated vision of “sustainable urban living and the most livable towns and cities” and its emphasis on integrating environmental sustainability within urban development strategies [43]. Unlike conventional zoning controls, the overlay would function as a performance-oriented planning instrument, targeting areas where thermal risk is spatially concentrated. In operational terms, the overlay could be triggered through high-resolution LCZ classification combined with persistent UHI hotspot identification, as demonstrated in this study. By linking morphological indicators (e.g., dominant LCZ typologies) with thermal metrics (seasonal UHI intensity and vegetation health), municipal planners could identify priority intervention zones where cooling strategies are most urgently required. The overlay could then be formalized through amendments to Municipal Spatial Development Plans and Center Plans within the QNMP statutory hierarchy, enabling targeted thermal mitigation measures within designated urban districts.
Within these overlay areas, development and redevelopment approvals would require the submission of a concise Thermal Impact Statement (TIS) as part of the planning permit process. Similar to environmental or traffic impact assessments, the TIS would demonstrate compliance with quantifiable thermal performance criteria, thereby shifting regulatory evaluation from static design prescriptions to measurable environmental outcomes. These criteria should move beyond conventional landscaping minima and instead assess the functional thermal performance of urban surfaces and streetscapes, including: (i) mandatory shade coverage metrics along pedestrian networks and public edges (e.g., minimum percentage of shaded pathways during peak afternoon hours), consistent with climate adaptation strategies outlined in the QNMP Climate Change Strategy [5]; (ii) tree canopy and structural shading requirements calibrated to neighborhood typology and projected pedestrian activity levels; (iii) cool-surface thresholds, such as minimum Solar Reflectance Index (SRI) values for roofs, façades, and hardscape materials, or equivalent performance indicators recognized within GSAS sustainability frameworks; and (iv) permeable and evapotranspirative surface targets linked to water-efficient planting strategies appropriate to Qatar’s arid climate context [5].
Embedding these requirements within an Urban Heat Management Overlay Zone and linking compliance to development approval, inspection, and enforceable permit conditions in Municipal Spatial Development Plans would operationalize the QNMP’s sustainability and livability objectives. More importantly, it would shift urban climate mitigation from aspirational design guidance to auditable, performance-based planning regulation, ensuring that shading, green infrastructure, and thermal comfort are systematically integrated into the regulatory framework governing urban development in Qatar.

5. Limitations

This study is limited by its reliance on remotely sensed surface temperatures, which may not fully capture near-surface air temperature variations and microclimatic conditions. Secondly, the analysis is constrained to a two-year period, which may not reflect longer-term climatic variability or extreme event patterns. In addition, class-level analyses based on LCZ categories (n ≈ 12) are inherently limited in sample size and are therefore interpreted as descriptive rather than inferential. A further methodological limitation concerns the use of pixel-level Pearson correlations across spatially autocorrelated variables, including LST, NDVI, and LCZ patterns. Spatial autocorrelation reduces the effective sample size below the number of pixels analyzed, which may lead to overestimation of statistical significance. Formal correction for spatial autocorrelation, such as effective sample size adjustment or spatial regression approaches, was not applied in this study. Accordingly, reported significance values should be interpreted with caution, and the correlation analyses presented are intended as exploratory and descriptive rather than inferential.
A further limitation relates to emissivity uncertainty in the LST retrieval. The Landsat Collection 2 product relies on the ASTER GEDv3, a static 2000–2008 emissivity dataset, which carries elevated uncertainty over bare desert soils and in landscapes where vegetation cover has changed substantially since the ASTER era [59]. Validation studies in comparable arid environments report RMSE values of approximately 2–3.5 K [60] and inter-algorithm differences of up to 5 °C [61]. These uncertainties are considered acceptable here given that the analysis is based on spatially relative UHI anomalies rather than absolute temperatures.

6. Directions for Future Research

Future research should incorporate longer temporal datasets and in situ meteorological measurements to capture interannual variability and microclimatic dynamics better. Integrating urban design parameters and simulation-based approaches could further strengthen the translation of thermal patterns into actionable planning strategies.

7. Conclusions

This study provides a multi-season assessment of urban thermal dynamics in the study area by integrating Landsat-derived LST, urban heat island (UHI) patterns, Local Climate Zone (LCZ) classifications, and vegetation indicators (NDVI). The results demonstrate that the thermal structure is shaped by the compositional dominance and spatial aggregation of large, low-rise, and desert typologies, which collectively account for more than 91% of the study area landscape and form highly contiguous surface units that exert a persistent influence on seasonal heat distribution.
Seasonal climatic forcing remains the dominant temporal driver of temperature variability, with a thermal amplitude exceeding 48 °C between summer maxima and winter minima. Within this climatic envelope, however, intra-urban thermal contrasts remain structurally organized by LCZ morphology. Industrial and compact low-rise typologies consistently emerge as thermal hotspots, while more open or vegetated surfaces demonstrate comparatively lower thermal intensity. Although NDVI exhibits a negative relationship with LST and UHI, its explanatory power remains limited (R2 < 0.05), reflecting the small spatial extent and fragmented distribution of vegetated areas across the study area.
These findings highlight the importance of morphology-sensitive planning strategies in rapidly urbanizing desert cities. Urban heat mitigation in Qatar is unlikely to be achieved solely through incremental greening. Instead, effective strategies should prioritize spatial restructuring of highly aggregated low-rise and industrial zones, alongside targeted greening interventions within persistent thermal hotspot areas. Integrating LCZ-based spatial diagnostics into planning and climate adaptation frameworks can support more precise identification of priority intervention zones. This study relied on satellite-derived surface temperature data, which represent radiative surface conditions rather than pedestrian-level air temperatures. Although Landsat Level-2 products provide atmospherically corrected LST, the absence of in situ validation introduces uncertainty in translating surface heat patterns to human thermal exposure. Future research should therefore integrate ground-based microclimate measurements and fine-scale simulation tools (e.g., ENVI-met) to evaluate pedestrian-scale thermal comfort across different LCZ typologies. These approaches can strengthen morphology–climate linkages and support evidence-based strategies to enhance thermal resilience in arid metropolitan environments.

Author Contributions

Conceptualization, R.N.J.; methodology, R.N.J.; software, A.A.; validation, A.A.; formal analysis, R.N.J., M.I., and A.A.; investigation, A.A.; resources, A.A. and R.N.J.; data curation, A.A.; writing—original draft preparation, A.A.; writing—review and editing, R.N.J., M.I., S.F.A.-N., A.H.A.-M., and A.A.; visualization, A.A.; supervision, R.N.J., M.I., and S.F.A.-N.; project administration, M.I.; funding acquisition, M.I. All authors have read and agreed to the published version of the manuscript.

Funding

This research was funded by Qatar University, grant number QUCG-CENG-25/26-671. The APC was also funded by the same grant.

Institutional Review Board Statement

Not applicable.

Informed Consent Statement

Not applicable.

Data Availability Statement

Data available upon request.

Conflicts of Interest

The authors declare no conflicts of interest. The funders had no role in the design of the study; in the collection, analyses, or interpretation of data; in the writing of the manuscript; or in the decision to publish the results.

References

  1. Pal, J.S.; Eltahir, E.A.B. Future temperature in southwest Asia projected to exceed a threshold for human adaptability. Nat. Clim. Change 2016, 6, 197–200. [Google Scholar] [CrossRef]
  2. Guo, Y.; Gasparrini, A.; Armstrong, B.; Li, S.; Tawatsupa, B.; Tobias, A.; Lavigne, E.; Coelho, M.D.S.Z.S.; Leone, M.; Pan, X.; et al. Global variation in the effects of ambient temperature on mortality: A systematic evaluation. Epidemiology 2014, 25, 781–789. [Google Scholar] [CrossRef] [PubMed]
  3. Zittis, G.; Almazroui, M.; Alpert, P.; Ciais, P.; Cramer, W.; Dahdal, Y.; Fnais, M.; Francis, D.; Hadjinicolaou, P.; Howari, F.; et al. Climate change and weather extremes in the Eastern Mediterranean and Middle East. Rev. Geophys. 2022, 60, e2021RG000762. [Google Scholar] [CrossRef]
  4. Lüthi, S.; Fairless, C.; Fischer, E.M.; Scovronick, N.; Coelho, M.D.S.Z.S.; Guo, Y.; Honda, Y.; Huber, V.; Kyselý, J.; Lavigne, E.; et al. Rapid increase in the risk of heat-related mortality. Nat. Commun. 2023, 14, 4894. [Google Scholar] [CrossRef]
  5. Ministry of Municipality and Environment. Qatar National Master Plan—Climate Change Strategy: Stage 04 Strategy Report; Ministry of Municipality and Environment: Doha, Qatar, 2017. Available online: https://www.mme.gov.qa/QatarMasterPlan/Downloads-qnmp/ClimateChange/Stage%204%20-%20Strategy%20Development/Stage%2004%20Strategy%20Report%20English_s.pdf (accessed on 17 April 2026).
  6. Kara, Y.; Yavuz, V. Urban microclimates in a warming world: Land surface temperature (LST) trends across ten major cities on seven continents. Urban Sci. 2025, 9, 115. [Google Scholar] [CrossRef]
  7. Al Kuwari, N.Y.; Ahmed, S.; Kaiser, M.F. Optimal satellite sensor selection utilized to monitor the impact of urban sprawl on the thermal environment in Doha City, Qatar. J. Earth Sci. Clim. Change 2016, 7, 326. [Google Scholar] [CrossRef]
  8. Patel, S.; Indraganti, M.; Jawarneh, R.N. Urban planning impact on summer human thermal comfort in Doha, Qatar. Build. Environ. 2024, 254, 111374. [Google Scholar] [CrossRef]
  9. Jabbar, H.K.; Hamoodi, M.N.; Al-Hameedawi, A.N. Urban heat islands: A review of contributing factors, effects and data. IOP Conf. Ser. Earth Environ. Sci. 2023, 1129, 012038. [Google Scholar] [CrossRef]
  10. Zine El Abidine, E.M.; Mohieldeen, Y.E.; Mohamed, A.A.; Modawi, O.; Al-Sulaiti, M.H. Heat wave hazard modelling: Qatar case study. QScience Connect 2014, 2014, 9. [Google Scholar] [CrossRef]
  11. Vahid, R.; Aly, M.H. A comprehensive systematic review of machine learning applications in assessing land use/cover dynamics and their impact on land surface temperatures. Urban Sci. 2025, 9, 234. [Google Scholar] [CrossRef]
  12. Weng, Q. Thermal infrared remote sensing for urban climate and environmental studies: Methods, applications, and trends. ISPRS J. Photogramm. Remote Sens. 2009, 64, 335–344. [Google Scholar] [CrossRef]
  13. Fang, C.; Li, X.; Li, J.; Tian, J.; Wang, J. Research on the impact of land use and land cover changes on local meteorological conditions and surface ozone in the North China Plain from 2001 to 2020. Sci. Rep. 2025, 15, 2001. [Google Scholar] [CrossRef]
  14. Demuzere, M.; Kittner, J.; Martilli, A.; Mills, G.; Moede, C.; Stewart, I.D.; Van Vliet, J.; Bechtel, B. A global map of local climate zones to support earth system modelling and urban-scale environmental science. Earth Syst. Sci. Data 2022, 14, 3835–3873. [Google Scholar] [CrossRef]
  15. Feng, W.; Liu, J. A literature survey of local climate zone classification: Status, application, and prospect. Buildings 2022, 12, 1693. [Google Scholar] [CrossRef]
  16. Naserikia, M.; Hart, M.A.; Nazarian, N.; Bechtel, B.; Lipson, M.; Nice, K.A. Land surface and air temperature dynamics: The role of urban form and seasonality. Sci. Total Environ. 2023, 905, 167306. [Google Scholar] [CrossRef]
  17. Parece, T.E.; Campbell, J.B. Intra-urban microclimate effects on phenology. Urban Sci. 2018, 2, 26. [Google Scholar] [CrossRef]
  18. World Bank. GDP Per Capita (Current US$)—Qatar. Available online: https://data.worldbank.org/indicator/NY.GDP.PCAP.CD?locations=QA (accessed on 17 April 2026).
  19. Friedlingstein, P.; O’Sullivan, M.; Jones, M.W.; Andrew, R.M.; Bakker, D.C.E.; Hauck, J.; Landschützer, P.; Le Quéré, C.; Luijkx, I.T.; Peters, G.P.; et al. Global carbon budget 2023. Earth Syst. Sci. Data 2023, 15, 5301–5369. [Google Scholar] [CrossRef]
  20. International Energy Agency (IEA). CO2 Emissions in 2023; IEA: Paris, France, 2024; Available online: https://www.iea.org/reports/co2-emissions-in-2023 (accessed on 17 April 2026).
  21. Santamouris, M. Analyzing the heat island magnitude and characteristics in one hundred Asian and Australian cities and regions. Sci. Total Environ. 2015, 512–513, 582–598. [Google Scholar] [CrossRef]
  22. Hoffman, J.S.; Shandas, V.; Pendleton, N. The effects of historical housing policies on resident exposure to intra-urban heat: A study of 108 US urban areas. Climate 2020, 8, 12. [Google Scholar] [CrossRef]
  23. Zhang, P.; Ghosh, D.; Park, S. Spatial measures and methods in sustainable urban morphology: A systematic review. Landsc. Urban Plan. 2023, 237, 104776. [Google Scholar] [CrossRef]
  24. Jatayu, A.; Rustiadi, E.; Juanda, B.; Pribadi, D.O. Metric-based approach for quantifying urban expansion impact on urban form changes in the JBMUR South Conurbation Corridor. Land 2023, 12, 864. [Google Scholar] [CrossRef]
  25. Rinaldi, V.; Ghandehari, M. Characterizing urban form archetypes through landscape and morphology parameterization and dimensionality reduction. Int. J. Digit. Earth 2026, 19, 2616955. [Google Scholar] [CrossRef]
  26. Zhang, L.; Nikolopoulou, M.; Guo, S.; Song, D. Impact of LCZs spatial pattern on urban heat island: A case study in Wuhan, China. Build. Environ. 2022, 226, 109785. [Google Scholar] [CrossRef]
  27. European Space Agency. Global Land Cover Map for 2020 at 10 m Resolution; Zenodo: Geneva, Switzerland, 2021; Available online: https://zenodo.org/records/5571936 (accessed on 17 April 2026).
  28. Planning and Statistical Authority. Main Results of the General Census of Population, Housing and Establishments 2020; State of Qatar: Doha, Qatar, 2021; Available online: https://www.npc.qa/en/statistics/Statistical%20Releases/General/Census/Census_2020_Res_Summary_En.pdf (accessed on 17 April 2026).
  29. U.S. Geological Survey. Landsat 8–9 Collection 2 Level-2 Science Product Guide; U.S. Department of the Interior: Washington, DC, USA, 2023. Available online: https://www.usgs.gov/landsat-missions (accessed on 17 April 2026).
  30. Stewart, I.D.; Oke, T.R. Local climate zones for urban temperature studies. Bull. Am. Meteorol. Soc. 2012, 93, 1879–1900. [Google Scholar] [CrossRef]
  31. McGarigal, K.; Cushman, S.A.; Ene, E. FRAGSTATS v4: Spatial Pattern Analysis Program for Categorical and Continuous Maps; University of Massachusetts: Amherst, MA, USA, 2012; Available online: http://www.umass.edu/landeco/research/fragstats/fragstats.html (accessed on 17 April 2026).
  32. Cook, M.; Schott, J.R.; Mandel, J.; Raqueno, N. Development of an Operational Calibration Methodology for the Landsat Thermal Data Archive and Initial Testing of the Atmospheric Compensation Component of a Land Surface Temperature (LST) Product from the Archive. Remote Sens. 2014, 6, 11244–11266. [Google Scholar] [CrossRef]
  33. Zhou, D.; Xiao, J.; Bonafoni, S.; Berger, C.; Deilami, K.; Zhou, Y.; Frolking, S.; Yao, R.; Qiao, Z.; Sobrino, J.A. Satellite remote sensing of surface urban heat islands: Progress, challenges, and perspectives. Remote Sens. 2014, 11, 48. [Google Scholar] [CrossRef]
  34. Sruthi, S.; Aslam, M.A.M. Agricultural drought analysis using the NDVI and land surface temperature data; a case study of Raichur District. Aquat. Procedia 2015, 4, 1258–1264. [Google Scholar] [CrossRef]
  35. Pervez, S.; McNally, A.; Arsenault, K.; Budde, M.; Rowland, J. Vegetation monitoring optimization with normalized difference vegetation index and evapotranspiration using remote sensing measurements and land surface models over East Africa. Front. Clim. 2021, 3, 589981. [Google Scholar] [CrossRef]
  36. Sonali, P.U.; Prasanna, J.; Atre, A.A.; Pande, C.; Gorantiwar, S.D. Application of NDVI in vegetation monitoring using Sentinel-2 data for Shrirampur region of Maharashtra. Int. J. Curr. Microbiol. Appl. Sci. 2021, 10, 799–806. [Google Scholar] [CrossRef]
  37. Measho, S.; Chen, B.; Pellikka, P.; Guo, L.; Zhang, H.; Cai, D.; Sun, S.; Kayiranga, A.; Sun, X.; Ge, M. Assessment of Vegetation Dynamics and Ecosystem Resilience in the Context of Climate Change and Drought in the Horn of Africa. Remote Sens. 2021, 13, 1668. [Google Scholar] [CrossRef]
  38. Townshend, J.R.G.; Justice, C.O. Analysis of the dynamics of African vegetation using the normalized difference vegetation index. Int. J. Remote Sens. 1986, 7, 1435–1445. [Google Scholar] [CrossRef]
  39. Li, Z.-L.; Wu, H.; Duan, S.-B.; Zhao, W.; Ren, H.; Liu, X.; Leng, P.; Tang, R.; Ye, X.; Zhu, J.; et al. Satellite remote sensing of global land surface temperature: Definition, methods, products, and applications. Rev. Geophys. 2023, 61, e2022RG000777. [Google Scholar] [CrossRef]
  40. Karimi, A.; Mohammad, P.; Gachkar, S.; Gachkar, D.; García-Martínez, A.; Moreno-Rangel, D.; Brown, R.D. Surface urban heat island assessment of a cold desert city: A case study over the Isfahan metropolitan area of Iran. Atmosphere 2021, 12, 1368. [Google Scholar] [CrossRef]
  41. Mohamed, M.; Othman, A.; Abotalib, A.Z.; Majrashi, A. Urban heat island effects on megacities in desert environments using spatial network analysis and remote sensing data: A case study from Western Saudi Arabia. Remote Sens. 2021, 13, 1941. [Google Scholar] [CrossRef]
  42. Muñoz-Sabater, J.; Dutra, E.; Agustí-Panareda, A.; Albergel, C.; Arduini, G.; Balsamo, G.; Boussetta, S.; Choulga, M.; Harrigan, S.; Hersbach, H.; et al. ERA5-Land: A state-of-the-art global reanalysis dataset for land applications. Earth Syst. Sci. Data 2021, 13, 4349–4383. [Google Scholar] [CrossRef]
  43. Ministry of Municipality. Qatar National Master Plan: About QNMP. Available online: https://www.mm.gov.qa/QatarMasterPlan/English/About-QNMP.aspx (accessed on 17 April 2026).
  44. Planning and Statistical Authority. Qatar Atlas; State of Qatar: Doha, Qatar, 2021. Available online: https://gis.psa.gov.qa/qataratlas/about-Atlas (accessed on 17 April 2026).
  45. Qatar Meteorology Department. Climate Statistics and Annual Rainfall Data for the State of Qatar; Ministry of Environment and Climate Change: Doha, Qatar, 2026. Available online: https://caa.gov.qa/en/weather-information (accessed on 17 April 2026).
  46. Tucker, C.J. Red and photographic infrared linear combinations for monitoring vegetation. Remote Sens. Environ. 1979, 8, 127–150. [Google Scholar] [CrossRef]
  47. Pettorelli, N. The Normalized Difference Vegetation Index (NDVI); Oxford University Press: Oxford, UK, 2013. [Google Scholar] [CrossRef]
  48. Weather Underground. Historical Weather Data for Doha, Qatar. Available online: https://www.wunderground.com/history/daily/qa/doha (accessed on 17 April 2026).
  49. Alajizah, S.M.; Altuwaijri, H.A. Assessing the impact of urban expansion on the urban environment in Riyadh City (2000–2022) using geospatial techniques. Sustainability 2024, 16, 4799. [Google Scholar] [CrossRef]
  50. Munir, S.; Habeebullah, T.M.A.; Zamreeq, A.O.; Alfehaid, M.M.A.; Ismail, M.; Khalil, A.A.; Baligh, A.A.; Islam, M.N.; Jamaladdin, S.; Ghulam, A.S. Cooling of maximum temperatures in six Saudi Arabian cities (1994–2024)—Reversal of urban heat islands. Urban Sci. 2025, 9, 445. [Google Scholar] [CrossRef]
  51. Bonilla, M.L.; Nuevo-Gallardo, C.; Lorenzo-Gallardo, J.M.; Montalbán-Pozas, B. Urban Heat Islands: Their Influence on Building Heating and Cooling Energy Demand Throughout Local Climate Zones. Urban Sci. 2026, 10, 43. [Google Scholar] [CrossRef]
  52. Makido, Y.; Shandas, V.; Ferwati, S.; Sailor, D. Daytime Variation of Urban Heat Islands: The Case Study of Doha, Qatar. Climate 2016, 4, 32. [Google Scholar] [CrossRef]
  53. Bokaie, M.; Zarkesh, M.K.; Arasteh, P.D.; Hosseini, A. Assessment of Urban Heat Island Based on the Relationship between Land Surface Temperature and Land Use/Land Cover in Tehran. Sustain. Cities Soc. 2016, 23, 94–104. [Google Scholar] [CrossRef]
  54. Estoque, R.C.; Murayama, Y.; Myint, S.W. Effects of Landscape Composition and Pattern on Land Surface Temperature: An Urban Heat Island Study in the Megacities of Southeast Asia. Sci. Total Environ. 2017, 577, 349–359. [Google Scholar] [CrossRef]
  55. Guedouh, M.S.; Youcef, K.; Hadji, R. Public Garden Environmental Factors Impact on Land Surface Temperatures of the Adjacent Urban Areas in an Arid Region. Urban Sci. 2025, 9, 391. [Google Scholar] [CrossRef]
  56. Bouzir, T.A.K.; Berkouk, D.; Ounis, S.; Melik, S.; Rusli, N.; Gomaa, M.M. Land Cover Transformations and Thermal Responses in Representative North African Oases from 2000 to 2023. Urban Sci. 2025, 9, 282. [Google Scholar] [CrossRef]
  57. Gao, K.; Haddad, S.; Paolini, R.; Santamouris, M. The Use of Green Infrastructure and Irrigation in the Mitigation of Urban Heat in a Desert City. Build. Simul. 2024, 17, 679–694. [Google Scholar] [CrossRef]
  58. Moustafa, Y.; El-Khateeb, S. Impact of Neighborhood Spatial Characteristics on the Microclimate in a Hot Arid Climate—A Field-Based Study. Sustain. Cities Soc. 2021, 75, 103372. [Google Scholar] [CrossRef]
  59. U.S. Geological Survey. Landsat Collection 2 Known Issues; U.S. Geological Survey: Reston, VA, USA, 2023. Available online: https://www.usgs.gov/landsat-missions/landsat-collection-2-known-issues (accessed on 17 April 2026).
  60. Ahmadi, A.; Emami, H.; Darvishi Boloorani, A. Comparison of the Accuracy of Daytime Land Surface Temperature Retrieval Methods Using Landsat 8 Images in Arid Regions. Infrared Phys. Technol. 2021, 115, 103692. [Google Scholar] [CrossRef]
  61. Malakar, N.K.; Hulley, G.C.; Hook, S.J.; Laraby, K.; Cook, M.; Schott, J.R. An operational land surface temperature product for Landsat thermal data: Methodology and validation. IEEE Trans. Geosci. Remote Sens. 2018, 56, 5717–5735. [Google Scholar] [CrossRef]
Figure 1. Local Climate Zones and land use distribution in the study area. (a) spatial distribution of LCZs; (b) land use classification map.
Urbansci 10 00395 g001
Figure 2. Methodology flowchart presenting data collection, analysis, and outcomes.
Urbansci 10 00395 g002
Figure 3. Class-level metrics of Local Climate Zones (LCZs) in the study area. PLAND: percentage of landscape; NP: number of patches; LPI: largest patch index; AREA_AM: area-weighted mean patch area; CONTIG_AM: area-weighted mean contiguity index; CLUMPY: clumpiness index; AI: aggregation index.
Urbansci 10 00395 g003
Figure 4. Seasonal Land Surface Temperature (LST, °C) distribution across the study area for eight consecutive seasons from Spring 2024 to Winter 2026.
Urbansci 10 00395 g004
Figure 5. ERA5-Land monthly mean air temperature (°C) and total precipitation (mm) over the Qatar study area, March 2024–December 2025.
Urbansci 10 00395 g005
Figure 6. Urban Heat Island (UHI) intensity (°C) maps for the study area across spring, summer, autumn, and winter for 2025 and 2026. The analysis is clipped to urban LCZ categories.
Urbansci 10 00395 g006
Figure 7. Seasonal Normalized Difference Vegetation Index (NDVI) across the study area for eight seasons from Spring 2024 to Winter 2026.
Urbansci 10 00395 g007
Figure 8. Seasonal scatter plot of NDVI with LST and UHI.
Urbansci 10 00395 g008
Figure 9. Seasonal mean Urban Heat Island (UHI) intensity (°C) across Local Climate Zone (LCZ) classes in the study area.
Urbansci 10 00395 g009
Figure 10. Seasonal distribution of LST across LCZs in the study area (violin plots; white dots = median, black bars = IQR).
Urbansci 10 00395 g010
Figure 11. Relationships between landscape configuration metrics and urban thermal indicators. (a) Mean LST versus PLAND (%); (b) LST amplitude versus number of patches (NP); (c) Pearson correlation coefficient (PCC) matrix illustrating associations among thermal indicators and class-level landscape metrics.
Urbansci 10 00395 g011
Figure 12. Spatial distribution of mean Land Surface Temperature (LST, °C) in relation to land use across the study area. (a) land use categories; (b) mean LST of all seasons in study area.
Urbansci 10 00395 g012
Table 1. Landsat satellite imageries used to calculate LST, UHI, and NDVI.
YearSeasonAcquisition DateScene ID
2024Spring23 March 2024 LC09_L2SP_163042_20240323_20240324_02_T1
24 April 2024 LC08_L2SP_163042_20240331_20240410_02_T1
10 May 2024 LC08_L2SP_163042_20240331_20240410_02_T1
Summer11 June 2024 LC09_L2SP_163042_20240611_20240612_02_T1
13 July 2024 LC09_L2SP_163042_20240713_20240714_02_T1
14 August 2024 LC09_L2SP_163042_20240814_20240815_02_T1
Autumn7 September 2024 LC08_L2SP_163042_20240907_20240914_02_T1
9 October 2024 LC08_L2SP_163042_20241009_20241018_02_T1
10 November 2024 LC08_L2SP_163042_20241110_20241118_02_T1
2025Winter20 December 2024 LC09_L2SP_163042_20241220_20241221_02_T1
29 January 2025 LC08_L2SP_163042_20250129_20250131_02_T1
22 February 2025 LC09_L2SP_163042_20250222_20250223_02_T1
Spring18 March 2025 LC08_L2SP_163042_20250318_20250327_02_T1
11 April 2025 LC09_L2SP_163042_20250411_20250412_02_T1
29 May 2025 LC09_L2SP_163042_20250529_20250531_02_T1
Summer22 June 2025 LC08_L2SP_163042_20250622_20250630_02_T1
24 July 2025 LC08_L2SP_163042_20250724_20250730_02_T1
25 August 2025 LC08_L2SP_163042_20250825_20250902_02_T1
Autumn26 September 2025 LC08_L2SP_163042_20250926_20251001_02_T1
28 October 2025 LC08_L2SP_163042_20251028_20251122_02_T1
21 November 2025 LC09_L2SP_163042_20251121_20251122_02_T1
2026Winter7 December 2025 LC09_L2SP_163042_20251207_20251209_02_T1
8 January 2026 LC09_L2SP_163042_20260108_20260109_02_T1
1 February 2026 LC08_L2SP_163042_20260201_20260205_02_T1
Table 2. Selected Class-level landscape metrics used in the analysis of Local Climate Zones [31], including Number of Patches (NP), Contiguity Index (CONTIG), Percentage of Landscape (PLAND), Largest Patch Index (LPI), Aggregation Index (AI), Clumpiness Index (CLUMPY), and Area-Weighted Mean (AREA_AM).
IndicatorMetricsFormulaDescription
Density/FragmentationNP N P = n i Measures the total number of patches of class i within the landscape. Higher values indicate greater spatial fragmentation.
Continuity/ConnectivityCONTIG CONTIG   = r = 1 z       c i j r a i j 1 Assesses internal connectedness of patches using a 3 × 3 rule. Values (0–1) indicate patch compactness, with higher values reflecting stronger cohesion.
Landscape DominancePLAND PLAND   = j = 1 n       a i j A × 100 Represents the percentage of total landscape area occupied by class i, indicating compositional dominance.
LPI L P I = m a x a i j A × 100 Indicates the proportion of landscape occupied by the largest patch of class i, reflecting structural dominance.
AggregationAI A I = g i i m a x g i i × 100 Measures the degree of adjacency among patches of the same class. Higher values indicate stronger clustering.
CLUMPY CLUMPY = g i i P i 1 P i   if   g i i P i g i i P i P i   if   g i i < P i
P i = A i A
Evaluates deviation from random distribution (−1 to 1). Values near 1 indicate clustering; near 0 randomness; negative values dispersion.
Area-Weighted StructureAREA_AM A M = j = 1 n       a i j x i j j = 1 n       a i j Computes mean structural metrics weighted by patch size, emphasizing dominant patches and reducing bias from small fragments.
Table 3. Area and percentage of each Local Climate Zones and equivalent category in Doha zoning prepared for the Qatar National Master Plan [44]. Note: R1: low-density residential zone; R2: low medium density residential zone; R3: medium density residential zone; R4: medium high-density residential zone; R5: high-density residential zone; MC: metropolitan center; TC: town center; DC: district center; CF: community facility zone; GB: greenbelt zone; TU: transportation and utility zone; SU: special use zone; LFR: large format retail zone; Lind: low impact industry zone; Mind: medium impact industry zone; Hind: high impact industry zone; LDW: logistics distribution warehousing zone; EC: environmental and conservation zone; RD: rural/desert zone; OSR: open space and recreational zone; S: sports zone.
LCZ Category (Land Use and Land Cover)Percentage AreaCorresponding to Doha Zoning MapRemarks
Compact mid-rise0.12R4, R5, MC, TC, DCMedium–High & High-Density Residential, Residential Towers, and business center
Compact low-rise3.23R2, R3, DCLow–Medium & Medium Density Residential and some District Centers
Open high-rise0.10R2, CF, GBCommunity Facilities, and buffer greenbelt edges.
Large low rise38.60R1, LFR, SU, TUVillas, compounds, large institutional blocks, or logistics edges—overlaps with Low-Density Residential, Large Format Retail, and some Special Use.
Sparsely built0.17RD, SU, Workers AccommodationPeripheral mixed plots: Rural/Desert, some Special Development Areas, or informal settlements near worker housing.
Heavy industry0.72HInd, MInd, LInd, LDWIndustrial Areas, especially Doha Industrial Area, Logistics/Distribution/Warehousing clusters.
Bush/Scrub0.02GB, EC, RDGreenbelt, Environmental/Conservation Zones, or transition to desert edges.
Low plants0.34GB, OSR, SParks, landscaped open spaces, or recreation areas within urban fabric.
Bare rock/paved3.15RD, TU, SUVacant land, desert plots, future development parcels, or infrastructure zones.
Bare soil/sand52.84RDRural/Desert Zone
Water bodies0.37ECCoastal waters and protected coastal edges
Disclaimer/Publisher’s Note: The statements, opinions and data contained in all publications are solely those of the individual author(s) and contributor(s) and not of MDPI and/or the editor(s). MDPI and/or the editor(s) disclaim responsibility for any injury to people or property resulting from any ideas, methods, instructions or products referred to in the content.