Article

Potentials of Different Water-Storage Mats Treating Greywater from a Canteen: From Laboratory to Pilot-Scale Testing


1
Department Systemic Environmental Biotechnology-SUBT, Helmholtz Centre for Environmental Research—UFZ, Permoserstrasse 15, 04318 Leipzig, Germany
2
Sächsisches Textilforschungsinstitut e.V. (STFI), Annaberger Straße 240, 09125 Chemnitz, Germany
3
Blumberg Engineers, Gänsemarkt 10, 37120 Bovenden, Germany
*
Author to whom correspondence should be addressed.
Urban Sci. 2026, 10(7), 361; https://doi.org/10.3390/urbansci10070361
Submission received: 30 April 2026 / Revised: 16 June 2026 / Accepted: 26 June 2026 / Published: 30 June 2026

Abstract

Water scarcity is an increasingly urgent global challenge, prompting the development of new water purification technologies that surpass conventional solutions. Decentralized greywater treatment is emerging as a viable option for enhancing water reuse in multifunctional systems that contribute to microclimate regulation, cooling, and urban climate adaptation. In this context, water-storage mats have been identified as a form of decentralized, roof-based biofilter for greywater treatment. The aim of this study was to assess the performance of newly developed, innovative, bio-based textile mats and assess their effectiveness in treating pre-treated greywater from a canteen (CGW) with a high organic content, in both laboratory- and pilot-scale experiments. The findings from the lab-scale testing revealed that the mats made from polyethylene terephthalate (PET) nonwoven fabric materials had the highest water storage capacity and dried out more slowly in outdoor conditions than mats made from polylactide (PLA) spunbonded fabric and polyhydroxyalkanoate (PHA) spunbonded nonwoven fabric. The PET hydroentangled nonwoven fabric mat (PET-WS) performed better than the other sample mats in the lab-scale experiment, and also outperformed the PHA mat consistently in the pilot-scale experiment when treating CGW. Apparent reductions in the concentration of the macro-pollutant parameters were observed at the outflow of the PET-WS mat compared to the inflow (p < 0.05) at the pilot-scale. Mean concentration reductions were comparatively higher for the five-day biochemical oxygen demand (BOD5), chemical oxygen demand (COD), total nitrogen (TN), and total suspended solids (TSS), with mean reductions of 64%, 54%, 39% and 60%, respectively. This indicated the superior treatment performance of the PET-WS mat compared to the PHA mat, with mean reductions of only 36%, 25%, 6%, and 32%, respectively. However, the lower E. coli counts of 1.1 and 0.5 log reduction for the PET-WS and PHA mats, respectively, indicated that an additional disinfection unit was necessary. The findings of this study may help to determine the performance, stability and reliability of using lightweight, nonwoven fabric mats to treat high-strength GW, which is currently considered as an intermediate treatment step. The study also provides recommendations for process optimization. Additional post-treatment steps are required to produce high-quality treated effluent for non-potable reuse, particularly in urban areas facing high water scarcity, provided that the relevant reuse regulations or discharge criteria are met.

1. Introduction

Around one-third of the world’s population lives in regions where water stress exceeds 50% [1]. Intense water scarcity, caused by climate change, high population growth, rapid urbanization and high economic activity, is putting increasing pressure on natural freshwater resources, which are being depleted at an alarming rate. This has forced many cities and regions around the world to consider alternative water sources [2,3]. Greywater is emerging as a potential solution to this problem and offers strong potential for treatment and reuse in a decentralized approach. It can help preserve high-quality freshwater resources, alleviate water scarcity, reduce the hydraulic load on the sewer systems and minimize pollution in the surrounding environment [4,5]. Greywater (GW) is typically described as household wastewater originating from sources such as the kitchen sinks, washing machines, washbasins and bathtubs, excluding toilet waste, and it accounts for over 65% of total household wastewater [5,6,7]. The relatively large quantity (high volume) and low level of contaminants in GW make it a promising substitute for freshwater resources [4].
Li [8] analyzed the quality parameters of different categories of GW, indicating that the GW from kitchens and laundries contained significantly higher levels of both organic and physical contaminants than bathroom GW and mixed GW. Based on this study, GW from bathrooms and mixed sources was classified as low-strength GW, whereas the GW from washing machines and kitchen sinks was classified as medium-strength GW and high-strength GW, respectively. However, the composition and volume of GW from the kitchen can vary greatly depending on its origin, people’s habits, the types of meals cooked, how much water is used for cleaning, what detergents are used for washing dishes, and the overall management strategy [7,9]. It has been observed that kitchen GW accounts for 26% of the total GW volume and yet contributes over 40% of the TSS, COD, BOD, fats, oils and greases, as well as exhibiting high turbidity and high concentrations of phosphorus [10,11]. Travis et al. [12] also demonstrated that the highest correlation of all parameters with the organic load was found in kitchen GW (treated or untreated).
In general, high-strength GW originates from kitchen sinks in canteens, restaurants, and food service establishments, where water is used to wash dishes, pots and pans that have been used to prepared food containing raw meat, fruit and vegetables, food preservatives, food residues, oil and fats, and dishwashing detergents [13]. This high-strength CGW represents a significant environmental challenge and can potentially cause problems for the ecosystem as it contains a variety of physicochemical and microbial contaminants. These include elevated concentrations of organic carbon, fats, oils, and grease (FOG), suspended solids, salinity, surfactants and pathogenic bacteria such as E. coli. Therefore, it needs to be carefully evaluated from a public health perspective [14,15]. The presence of high levels of oils and greases in CGW has environmental repercussions and represents a serious issue for aquatic and groundwater resources, as it increases the concentration of organic matter, reduces the concentration of dissolved oxygen, and blocks sewer systems, particularly at low water temperatures [16,17].
The treatment of GW aims to provide non-potable water for reuse as service water for purposes such as toilet flushing, fire extinguishing, car washing, lawn irrigation and industrial use. This can potentially reduce the urban infrastructure required for the collection, transport and treatment of urban wastewater [18,19,20]. However, treated GW must meet water quality standards for safe reuse, as well as esthetic and environmental acceptance [19]. Reuse of treated GW could save between 9 and 47% of the high-quality potable water consumed by a household [21,22,23]. Light GW has a high potential for local treatment and reuse due to its low pollutant concentrations [22], but managing high-strength GW in urban contexts is challenging.
Nowadays, GW treatment technologies involve a wide range of various physical and chemical processes, such as granular filtration, coagulation–flocculation, and activated carbon adsorption, as well as biological processes, such as artificial wetlands, rotating biological contactors and membrane bioreactors [6,24,25,26]. There is currently a trend to incorporate various biological processes for GW treatment, particularly in densely populated cities.
In recent times, green roof systems have been widely used as an effective method for treating urban wastewater. These systems utilize various substrates and vegetation to filter and absorb macro-pollutants from wastewater through various mechanisms, providing both environmental and economic advantages for cities [27,28,29]. However, to ensure structural integrity, the added load by the conventional green roof system must be kept as low as possible. Lightweight materials and smaller substrate depths lead to a reduced weight [30]. Recently, different organic materials with excellent water retention capacity, such as cocopeat, wheat straw and wood chips, have been used as biofilters (biological filters) because they are much lighter than traditional substrates like soil, sand, gravel or expanded clay, and they have been tested for wastewater treatment under different experimental conditions [31,32,33]. However, the main disadvantage of using bio-based filter media is that they have a reduced operational lifespan due to physical degradation, which limits their sustainability, and therefore, frequent replacement of such organic filter media is needed compared to the synthetic filter media [31,32].
Textiles designed with various materials or various construction methodologies, and the mats produced from them, can be made to have a high specific surface area. In a research study, Hu et al. [34] developed durable and robust nonwoven fiber mats for coalescence filtrations of oily wastewater and expected that after further modification, these mats could be successfully used for the filtration of oily water from industries. Rahman et al. [35] evaluated the effectiveness of mats made from two different types of textile materials when treating pre-treated wastewater in outside conditions and recommended that apart from being lightweight, using synthetic materials for producing such mats can be used to treat household wastewater on the rooftops of existing buildings in cities. Microbial interaction via attached-growth biofilms, as well as various mechanisms, e.g., sedimentation, adsorption, filtration and oxidation/reduction, are part of the processes of these lightweight textile-based materials for treating domestic wastewater by removing organic matter, nutrients, suspended solids, microorganisms, etc. [35]. The key scientific gap lies in the limited understanding of whether lightweight textile-based materials can effectively treat and improve water quality while meeting the strict structural constraints of existing urban buildings. Unlike conventional green roofs, biofilters, and constructed wetland technologies, the proposed system relies on engineered textile matrices rather than deep substrates, soil-based filtration, or wetland ecosystems. This makes it a low-load alternative for decentralized greywater or wastewater treatment systems on urban rooftops. The novelty of the system lies in highlighting its unique design characteristics, including its lightweight structure, dual functionality for water storage and treatment, suitability for rooftop retrofitting, and the potential integration of engineered textile materials within urban blue–green infrastructure frameworks. This could lead to the development of a distinct category of rooftop solution, offering a more versatile alternative to conventional green roofs, and potentially proving a solution for existing buildings that cannot support the weight or footprint of existing technologies. However, to our knowledge, there are no scientific studies addressing the performance of such a technological solution that integrates lightweight water-storage mats as roof biofilters for the biofiltration (attached-growth biofilm) of high-strength GW from a canteen. The multifunctionalities of the roof biofilters are not only for cleaning GW but also have greater cooling effects on the surrounding environment [35,36,37].
This article presents the findings of a research study that analyzed the properties of various textile-based mats through lab-scale and pilot-scale experiments, and evaluated the treatment performance of selected mats in treating high-strength CGW. However, the present study was designed primarily as a performance-oriented investigation, evaluating the efficiency of removing GW pollutants and the operational feasibility of different textile-based water-storage mats. The specific aims of the paper are as follows: (i) assessing and comparing the physical properties and characteristics of a few selected sample mats made of different nonwoven textile fabric materials, such as water storage capacity, water loss, etc.; (ii) evaluating the treatment performance of the water-storage sample mats in treating CGW in a lab-scale experiment, and selecting the most suitable mats for a pilot-scale experiment; (iii) evaluating and comparing the treatment efficiency of two selected mats made of two different materials in a pilot-scale experiment; and (iv) providing recommendations for optimizing the process of the pilot-scale experiment, in order to produce high-quality treated effluent under the tested conditions. This study demonstrated the effectiveness of the processes essential for removing conventional macro-pollutants from high-strength GW using lightweight, water-storage mats. These mats can be used as roof biofilters on urban rooftops and could be integrated into a potential decentralized GW management system in cities with high population density and a lack of available space within urban water infrastructure.

2. Materials and Methods

2.1. Collection of CGW and Pre-Treatment

The GW used in this study was collected from the basement of a building that is used as a canteen for employees, located on the campus of the research institute “Helmholtz Center for Environmental Research (UFZ)”, in the city of Leipzig, Germany. Therefore, the amount of GW generated from this canteen does not reflect represent typical household’s GW generation pattern. The canteen is open throughout the week, so the primary sources of GW are the kitchen sinks, dishwashing and regular floor-cleaning activities with freshwater consumption. The composition of the CGW varies according to the kitchen activities, the management skills of the canteen employees, the types of meals and the number of people served during the week. The CGW discharge chamber, together with the grease separation and storage facility, was newly constructed and is located in the basement of the building.
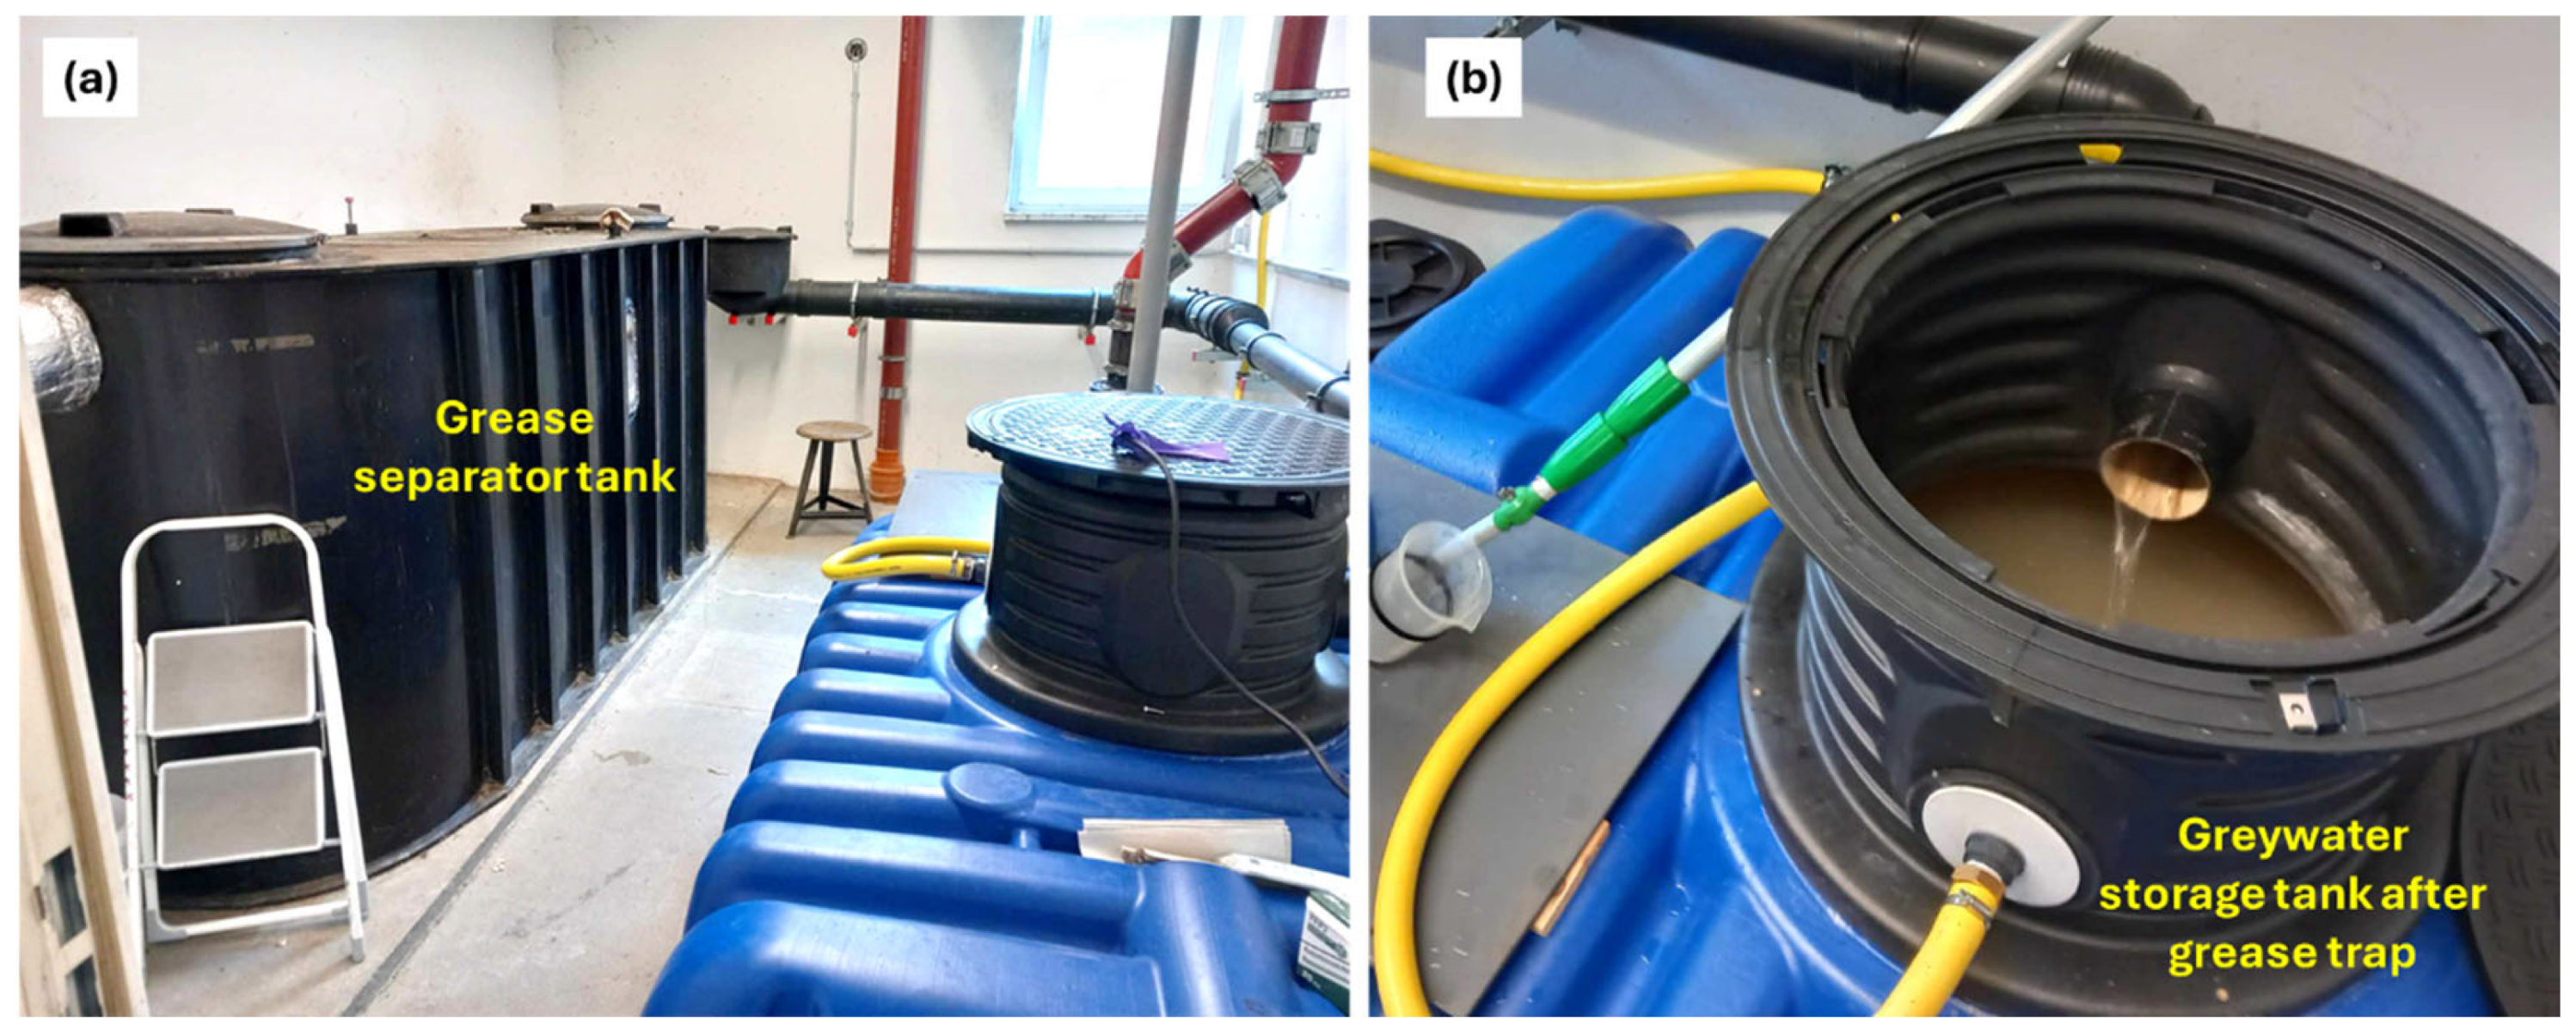
Figure 1 shows the CGW access point with a grease separation tank and a storage tank, where organic-rich high-strength CGW is stored for further treatment. During the monitoring period of this study, CGW generation was relatively consistent, except for the period immediately following maintenance of the grease separation tank, and during the vacation period when generation was lower.
The preliminary treatment of gravity-driven CGW took place in the discharge chamber in the basement of the canteen. This was conducted via a grease trap unit in a grease separation tank. It was then collected in a storage tank for further treatment (Figure 1).

2.2. Lab-Scale Experiment

The lab-scale experiment for the current study consisted of two parts. In the first part, sample mats were tested to measure selected physical properties and specific performance parameters, such as dry and wet weights, water retention, water storage capacity, water loss due to evaporation (EV), etc. The second part involved a lab-scale experiment to investigate the treatment performance of the sample mats when treating high-strength CGW under controlled laboratory conditions.

2.2.1. Sample Mat Testing—Measuring Specific Parameters

Several sample mats were tested to assess their specific physical properties. In this study, the properties of four sample mats made from four different materials are described. These materials are: (1) polyethylene terephthalate needle-punched nonwoven fabric (PET-N), (2) polyethylene terephthalate hydroentangled spunlace nonwoven fabric (PET-WS), (3) polylactic acid (PLA), and (4) polyhydroxyalkanoates spunbonded nonwoven fabric (PHA).
These four materials were selected for testing due to their unique properties and construction methods. PET-N and PET-WS were selected as PET-based mats, where PET-N is a nonwoven fabric made from polyethylene terephthalate (PET) fibers and PET-WS is very fluffy and offers high tensile strength and tear resistance. Both PLA and PHA were selected as organic-based (bio-based) biopolymer mats. PLA is a bio-based, thermoplastic polyester derived from renewable resources. PHA is also a thermoplastic, biodegradable polyester that can potentially break down naturally under diverse environmental conditions.
The water storage capacity of each sample mat was determined by measuring its dry weight, followed by soaking it in tap water overnight. Floating was avoided. The next day, the mats were removed from the trays and placed on a rack to drain properly. Once no water was dripping from the mats, the wet weight of the mats was measured very carefully. Using the wet weight and dry weight values, the water retention (in %) and water storage capacity (in L/m2) of the sample mats were then calculated.
Secondly, an evaporation test was conducted using the same sample mats to investigate the water storage and water loss under outdoor field conditions on consecutive hot summer days (5–8 August 2024; mean air temperature: 30.6 ± 4 °C; mean relative humidity: 42 ± 6%). Using the same method, the mats were soaked and allowed to drain before their wet weight was taken. After taking the total weight of the wet mats with empty photo trays, the mats were placed outside in direct sunlight to dry. They were weighed at regular intervals over a period of 100 h (after 1, 2, 3, 4, 5, 6, 21, 23 and 24 h, and then repeated) to determine water retention and cumulative water loss. It is important to note that the mats were drying on a solid surface (like a flat roof) and were unable to drip freely.

2.2.2. Sample Mat Lab-Scale Testing—Loading with CGW

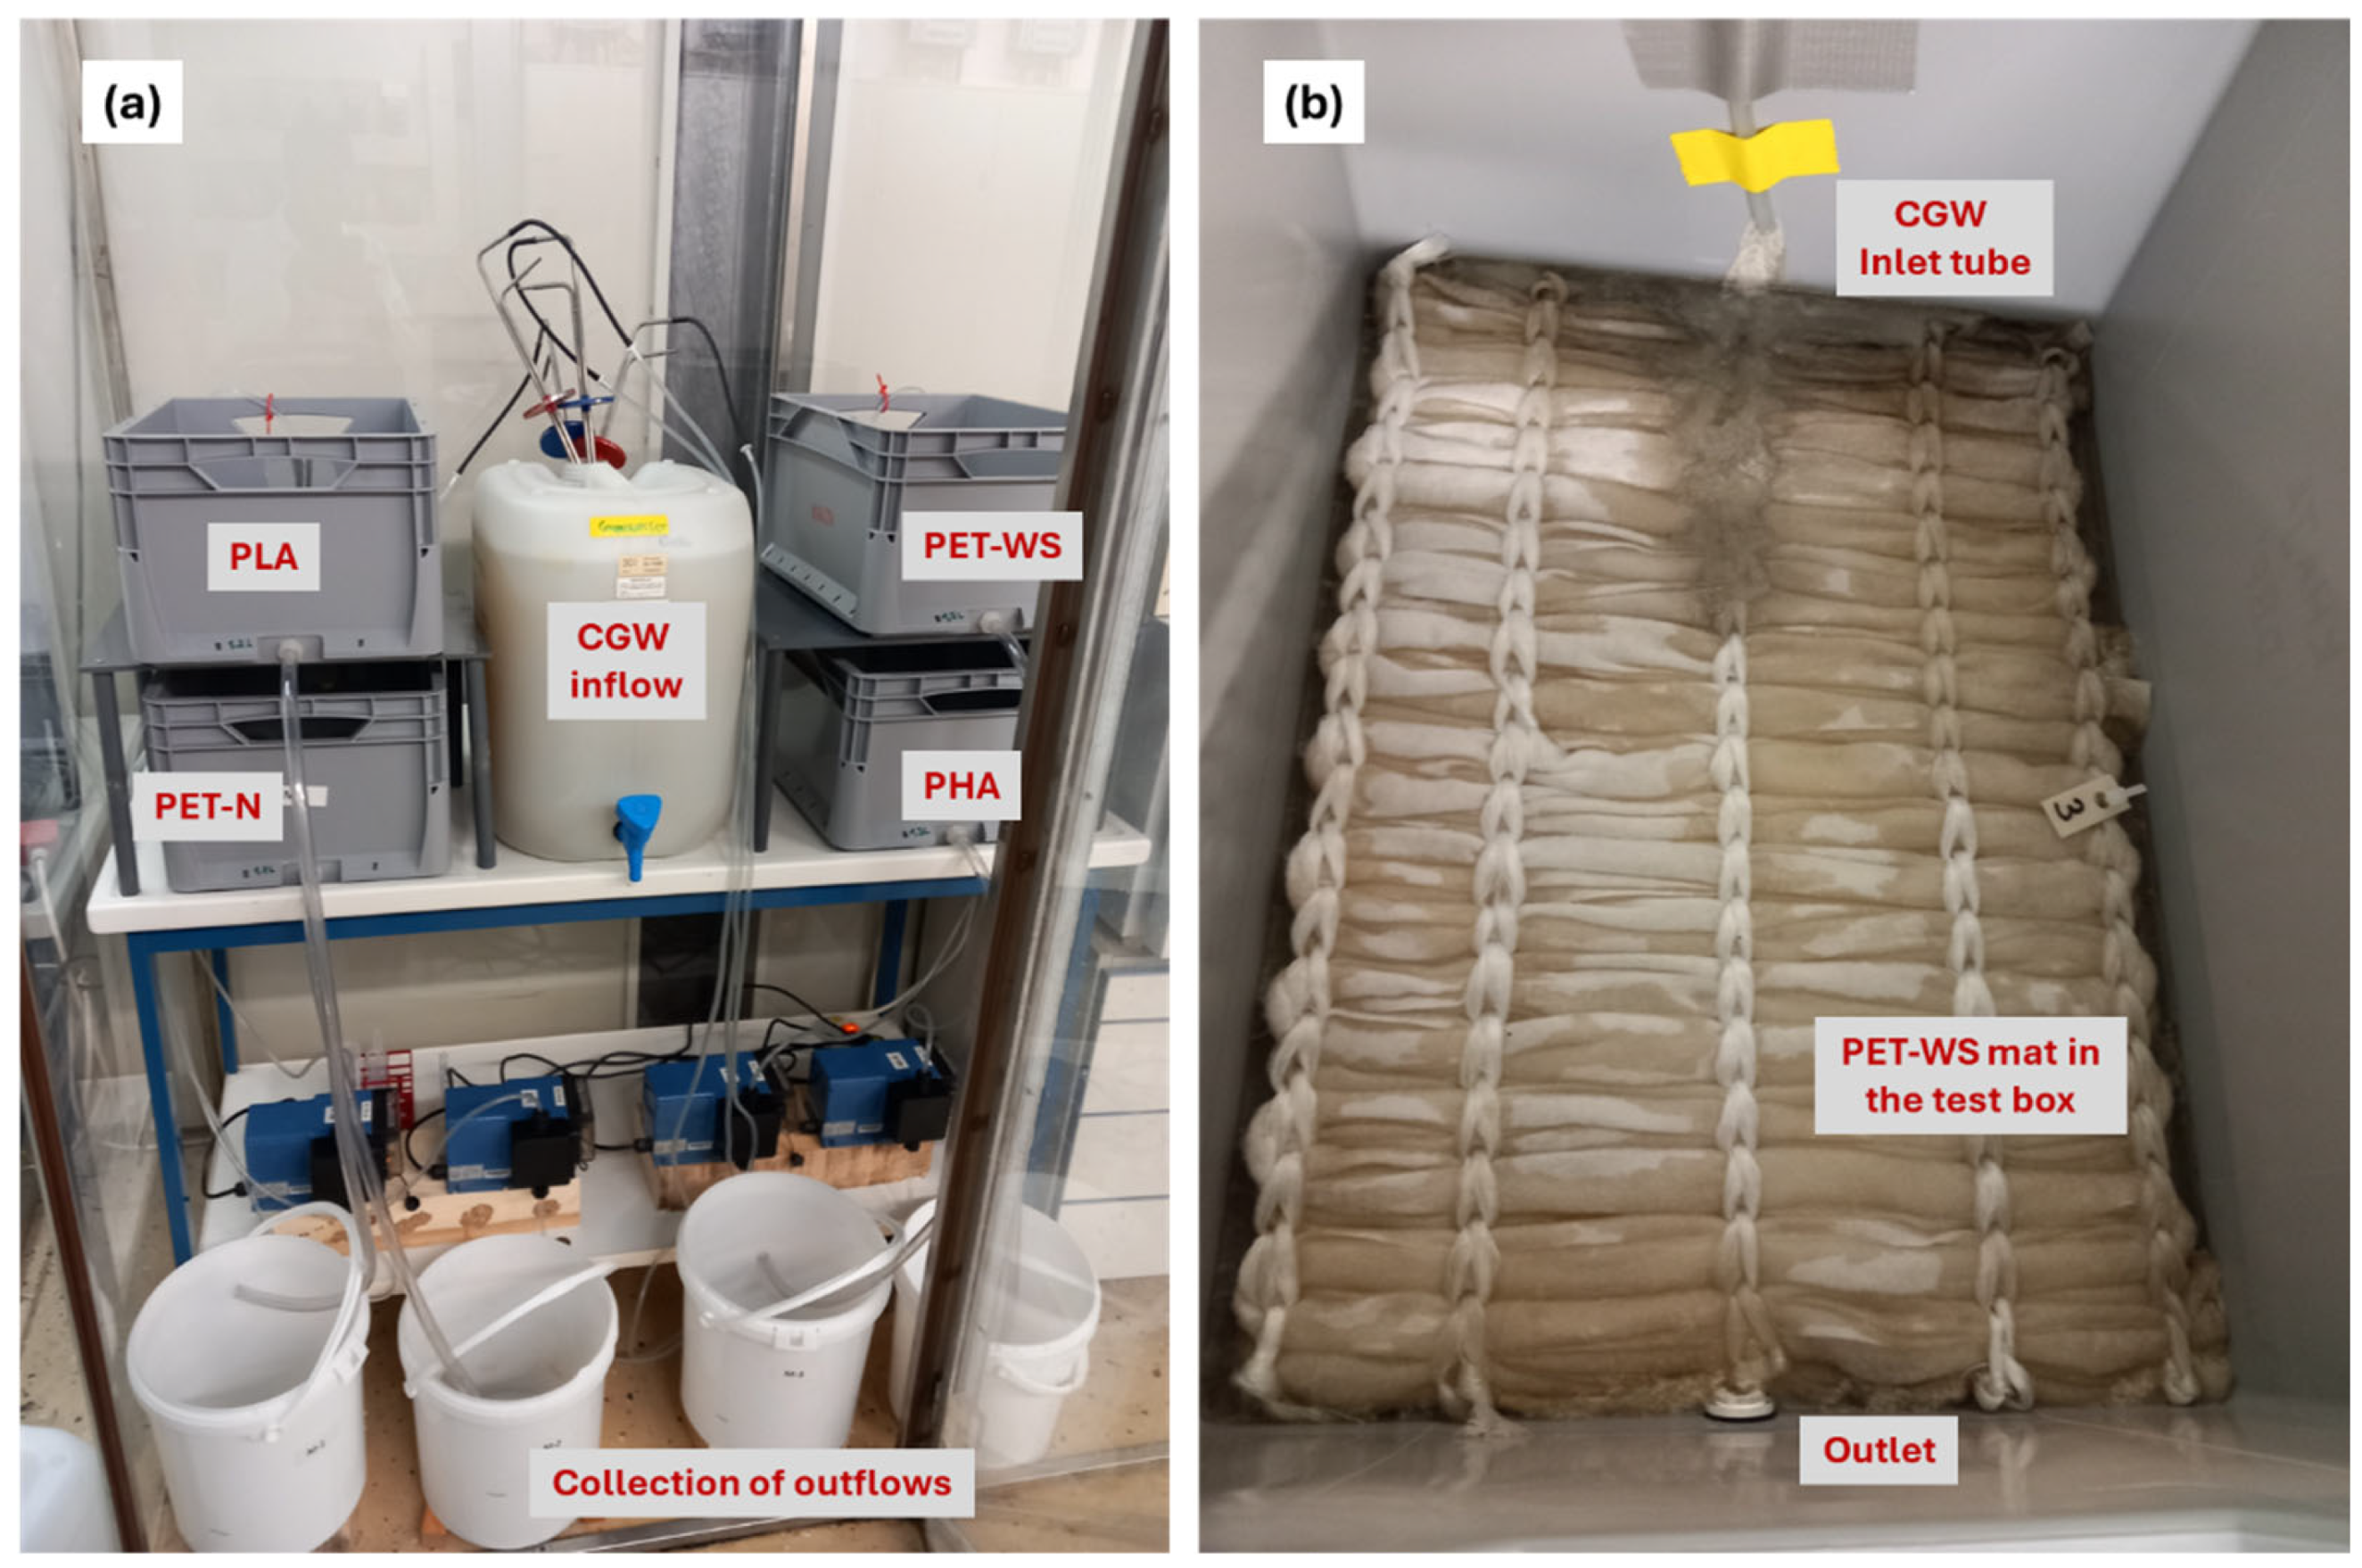
After measuring the specific performance parameters, a comparative lab-scale experiment was conducted using the four sample mats to investigate their filtration and biological purification performance when treating CGW. Four sample mats of the appropriate size were placed at the bottom of four Euro boxes made of polypropylene. Each box (dimensions: 40 cm × 30 cm × 22 cm) was operated in parallel and loaded with the same pre-treated CGW. The experimental setup is shown in Figure 2.
The entire experimental setup consisted of a 50 L inflow CGW container with four hollow metallic pipes integrated with plastic tubing, each connected to a respective inflow pump (Figure 2a). The metallic pipes were perforated at the bottom and submerged in the inflow container. The CGW was collected manually from the storage tank after grease separation and transferred to the inflow container. It was then distributed to the four corresponding boxes containing the mats via four peristaltic pumps, which operated continuously at very low, constant flow rates (1.5–1.8 mL/min; 24–28 L/(m2 × d)). The inflow tubing hung from the sidewall of each box and was used to load the same CGW onto the sample mats from above (Figure 2b).
An outlet was made at the bottom of each box and connected to a plastic tube to collect the effluent from each box. The effluents flowed from the outlets by gravity and the treated water was collected in four corresponding buckets (Figure 2). The entire experimental setup was operated at room temperature to treat CGW for 110 days (from March to June, 2024).
During the monitoring period of this lab-scale experiment, grab samples were collected weekly from the inflow container and the outlets of the four boxes (i.e., the outlet buckets). The system operated continuously throughout this period, with no remarkable changes observed in the composition of the inflow CGW collected from the UFZ canteen. Different physicochemical and bacteriological analyses were performed on a weekly basis, according to the standard methods for measuring various water quality parameters, in order to identify the underlying pollutant removal processes and maximize the treatment capacity of the sample mats.

2.3. Pilot-Scale Experiment

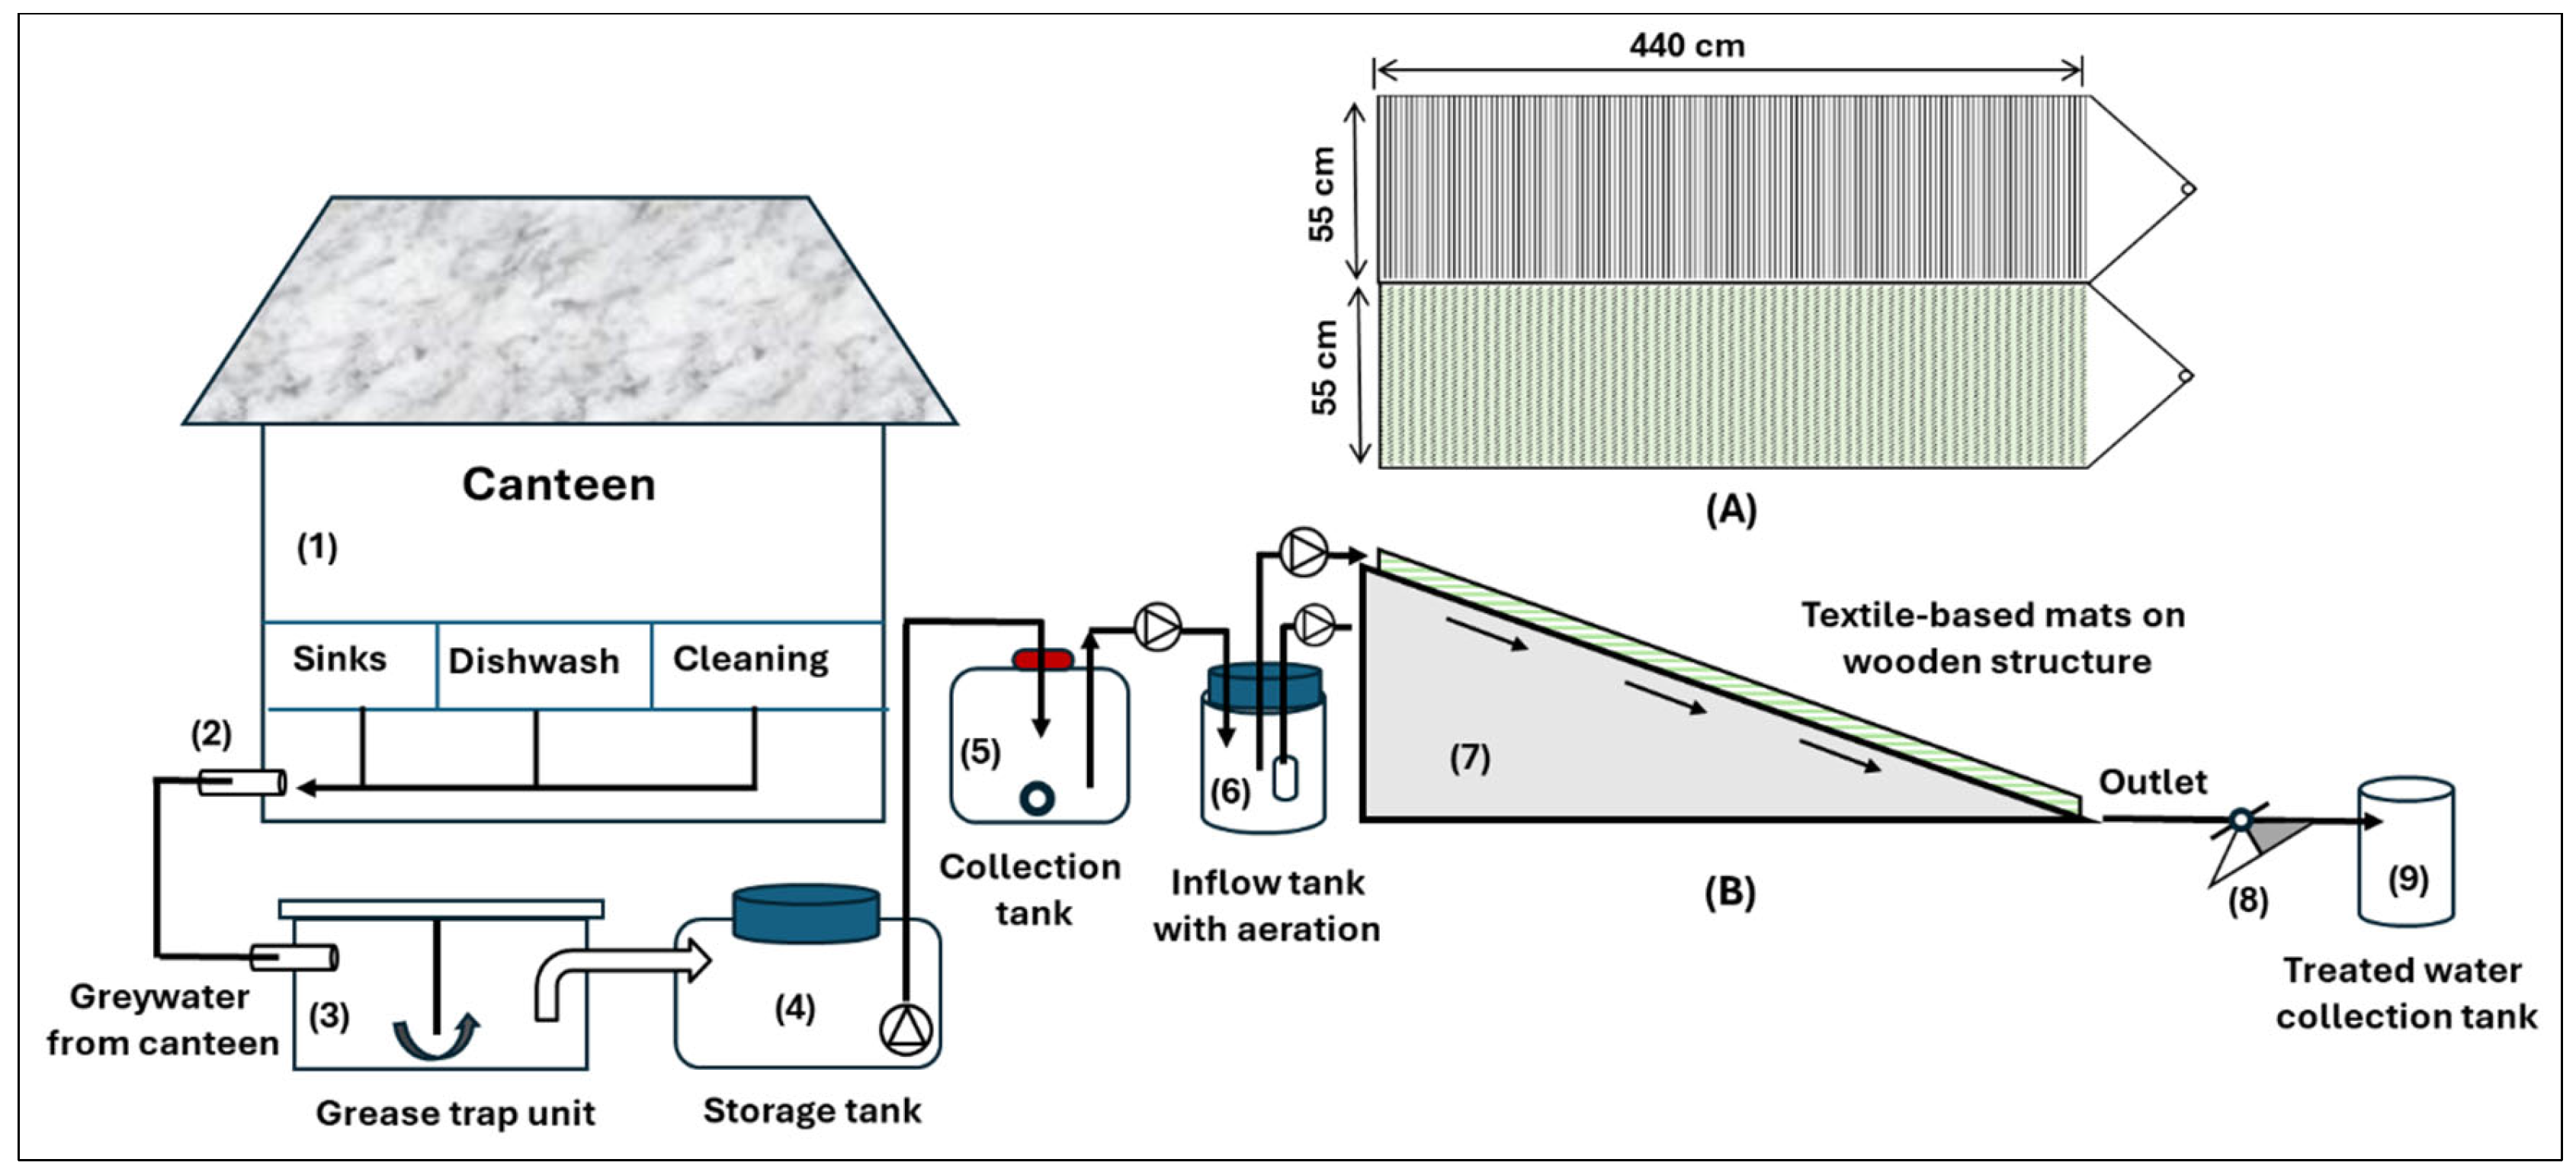
The pilot-scale plant for treating CGW was constructed near the UFZ canteen. A schematic illustration of the pilot plant is provided in Figure 3.
The pilot plant comprised a grease separation unit, a storage tank, a 1 m3 IBC for collecting the pre-treated CGW for further treatment, a 200 L inflow feed tank with active aeration and a pitched-roof wooden structure with biofiltration mats on top. The structure was equipped with a tipping counter for quantifying the outflow and a collection tank for sampling the treated water. After being discharged from the UFZ canteen, the CGW flowed into the grease separation tank by gravity. A grease trap unit was used as a pre-treatment unit for the partial removal of fat, oil and grease from the raw CGW and this pre-treated CGW was then stored in a nearby storage tank (Figure 1). For further treatment, it was then pumped from the storage tank to an IBC, which was located near the pilot plant outside the building.
Instead of an actual roof of a household, a wooden demonstration segment with a pitched roof (slope 15°) was built outside at the ground level to resemble realistic roof conditions as closely as possible. This construction simplified the sampling, operation and maintenance of this study. Rahman et al. [35] described the design specifications and testing of the pilot test rig in detail. Two sections (each with a length of 440 cm and a width of 55 cm) and a raised edge with a height of 10 cm were constructed on the wooden structure in order to test the biofiltration processes of two mats in parallel under the same conditions. The construction supported an equal distribution of inflowing CGW along the full width and length of the mats, starting from the inlet (the upper part) to the outlet (the lower part) of the pitched roof.
Based on the results of the lab-scale experiment involving four different sample mats, two materials were selected for upscaling to a pilot-scale test in outside conditions: PET-WS and PHA. Both prototypes were manufactured at the Sächsisches Textilforschungsinstitut e.V. in Chemnitz, Germany, and with dimensions of 440 cm × 52 cm. The mats were made of a coarse, right–right, warp-knitted fabric with a weft insert of spunbond nonwoven. For the weft insertion, a monomaterial twisted fabric strand that forms a homogeneous, roll-like structure was used. The materials for the pilot test were selected based on higher water storage capacity, lower water loss due to EV and higher treatment performance when treating pre-treated CGW in the lab-scale experiment. Although PET-N exhibited the highest water storage capacity in this study, materials for the pilot-scale applications were not selected based solely on water retention properties. Additional considerations favoring PET-WS over PET-N included consistently higher treatment efficiency under laboratory-scale conditions, mechanical stability, structural behavior during operation, and suitability for long-term pilot-scale implementation. Furthermore, the PET-WS material was selected because it was available from the supplier in the required size for the pilot-scale test.
The PHA mat was intentionally selected for exploratory purposes in the pilot-scale study. Despite its comparatively lower water storage capacity, higher water loss, and weaker GW treatment performance in the laboratory-scale test, the PHA material was selected due to its unique biodegradable and bio-based nature. Furthermore, this was the first time that the PHA material had been processed into a nonwoven fabric. Therefore, it was important to examine the innovative bio-based mat more closely and compare it with synthetic mats. To evaluate the long-term operational performance and environmental benefits of the biodegradable material under real-world (field) conditions, the PHA material was selected and operated in parallel with the PET-WS material during the pilot-scale experiment.
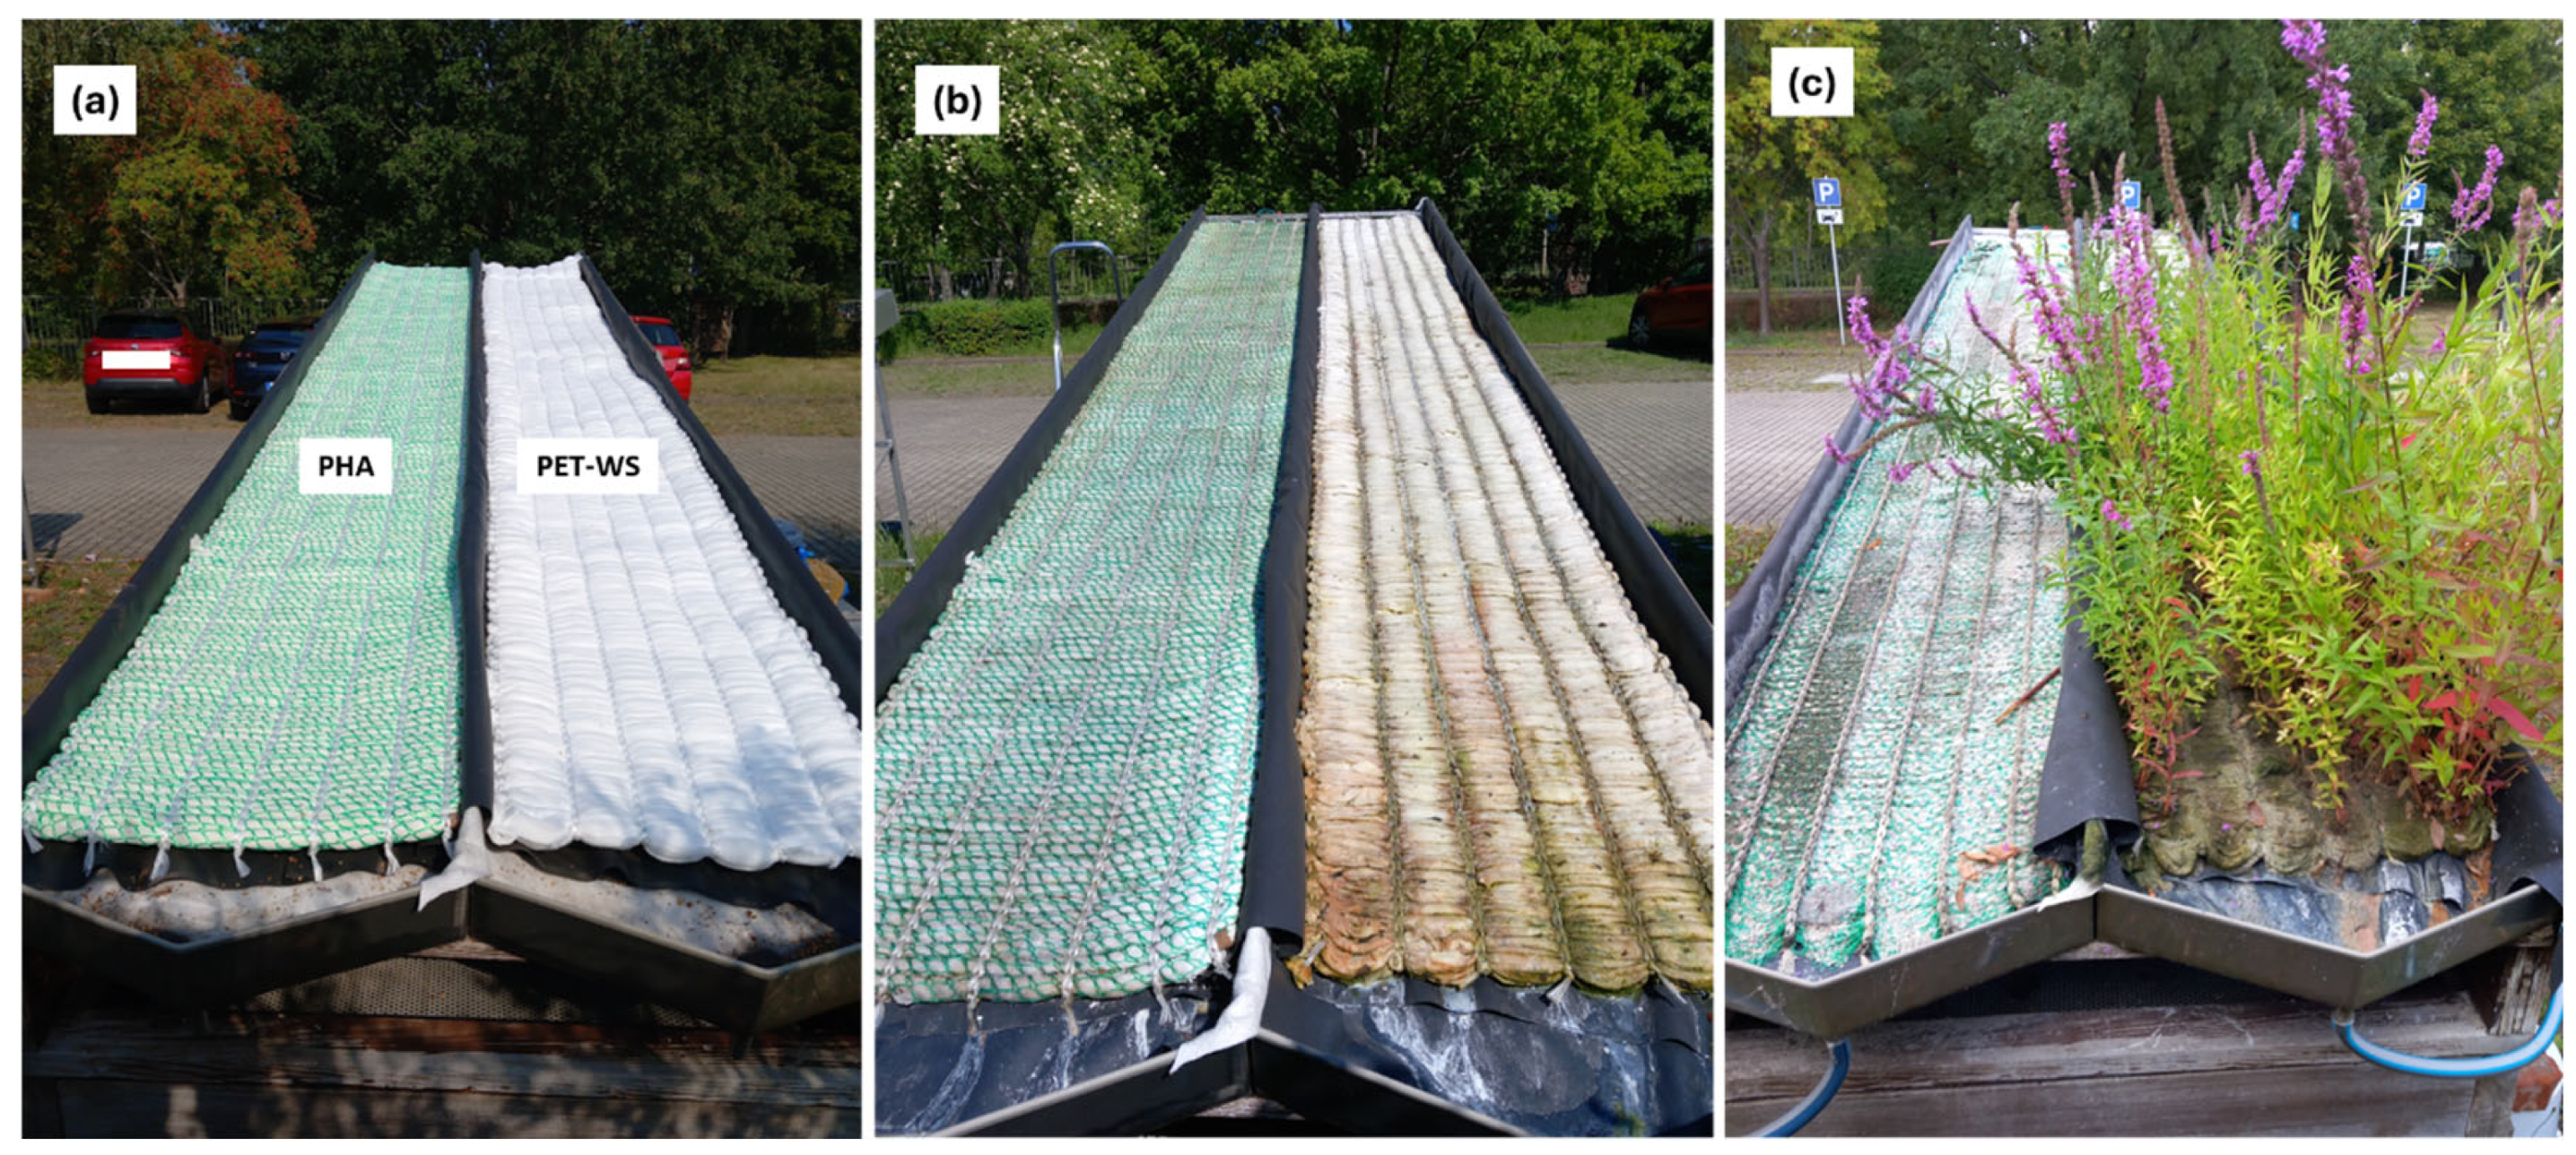
Figure 4 shows the pilot plant integrated with the mats (PET-WS and PHA), which were installed on a pitched-roof wooden structure (divided into two parallel sections separated by a barrier) to carry out the pilot-scale experiment treating CGW under outside conditions.
The pre-treated CGW was first pumped from the IBC collection tank to the 200 L inflow feed tank, and was then pumped into both mats via two feed pumps in the pilot systems. Continuous and intermittent aeration was provided through a perforated tube connected to a timer-controlled aeration pump to increase the available dissolved oxygen for the microorganisms in the inflow feed tank. Rapid aeration also ensured good mixing of the sludge suspension inside the inflow tank, preventing clogging. A level sensor connected to the feed pumps via a level controller system maintained a constant volume in the feed tank to prevent overflow. In this pilot-scale study, the same pre-treated CGW was homogeneously distributed to the mats from the same inflow tank, with or without aeration. Operation of the pilot plant with the PET-WS and PHA mats began in September 2024 and continued until August 2025, except for a complete shutdown during the winter break from November 2024 to March 2025.
The durations of the entire operational strategy, the hydraulic loading rate (HLR) and the different experimental phases, as well as the number of samples taken in each phase, are enlisted in Table 1.
Within this pilot study, the monitoring period was divided into four phases based on flow type (continuous or intermittent), HLRs, and the supply of air to the inflow tank (with and without an aeration facility). In the case of an intermittent flow in phase I, both the pumps for the PET-WS and PHA mats started every two hours and ran for 40 min, resulting in a low HLR of 21 L/ (m2 × d). Phases II and III were carried out with relatively low HLRs and with no aeration or active aeration in the inflow tank, respectively. Phase IV, an experimental phase involving continuous flow and a higher HLR of 49 L/ (m2 × d) with intermittent aeration, lasted nearly 65 days until the end of the pilot study. Grab samples were taken from the inflow and outflow of the PET-WS and PHA mats throughout all experimental phases after filtering through the mats. Physicochemical and bacteriological analyses were performed weekly using the standard methods for analyzing water and wastewater, as described below.

2.4. Sampling and Analysis

Throughout the study, water samples were collected to assess the effectiveness of the mats during CGW treatment and system operation. Each week, sampling was carried out to collect samples from both the inflow and the outflow of each mat as a sampling campaign. The concentrations of the following parameters were measured in the laboratory within less than 24 h: biochemical oxygen demand after five days (BOD5) (DIN EN 1899, OxiTOP®, manufacturer WTW, Weilheim, Germany), chemical oxygen demand (COD) with TNTplusTM 822 ranging concentrations from 20 to 1500 mg/L (manufacturer: Hach Lange, Düsseldorf, Germany), ammonium–nitrogen (NH4-N) concentration (DIN EN ISO 11732 [38]), nitrate–nitrogen (NO3-N) concentration (DIN EN ISO 10304-1 [39]), total phosphorous (TP) content (DIN EN ISO 15681-1 [40], LCK 350 2.0–20.0 mg/L, manufacturer: Hach Lange, Düsseldorf, Germany) and total suspended solids (TSSs) (DIN 38409-1 [41]). The concentrations of filtered and unfiltered total nitrogen (TN) were analyzed using a TN analyzer with automatic sample injection (Shimadzu Deutschland GmbH, Duisburg, Germany). A multi-parameter measurement device (Multi 350i®, manufacturer WTW, Weilheim, Germany) and electrodes were used to measure pH with SenTix® pH (WTW, Weilheim, Germany), redox potential (Eh) with SenTix® ORP (WTW, Weilheim, Germany) without correction, electrical conductivity (EC) with Cond 330i (WTW, Weilheim, Germany), and dissolved oxygen (DO) using ConOx® (WTW, Weilheim, Germany). The turbidity (TU) value was measured with a turbidimeter (2100Q, manufacturer Hach Lange, Düsseldorf, Germany). The quantification of Escherichia coli (E. coli) was carried out with IDEXX Colilert-18 Quanti-Trays (ISO 9308-2 [42], manufacturer: IDEXX, Kornwestheim, Germany).
Calibration was carried out regularly to ensure measurement accuracy.
A weather station near the pilot plant site recorded the precipitation (in mm), temperature (T) in the air (in °C), and relative humidity as a percentage (%).
The removal efficiency of the contaminants in the samples was expressed as a percentage decrease in concentration and was calculated using Equation (1):
Concentration   reduction   ( % )   =   ( C i n C o u t ) C i n × 100
where Cin is the influent concentration [mg/L] and Cout is the effluent concentration [mg/L].
E. coli removal was estimated as the log reduction between the inlet and outlet concentrations.
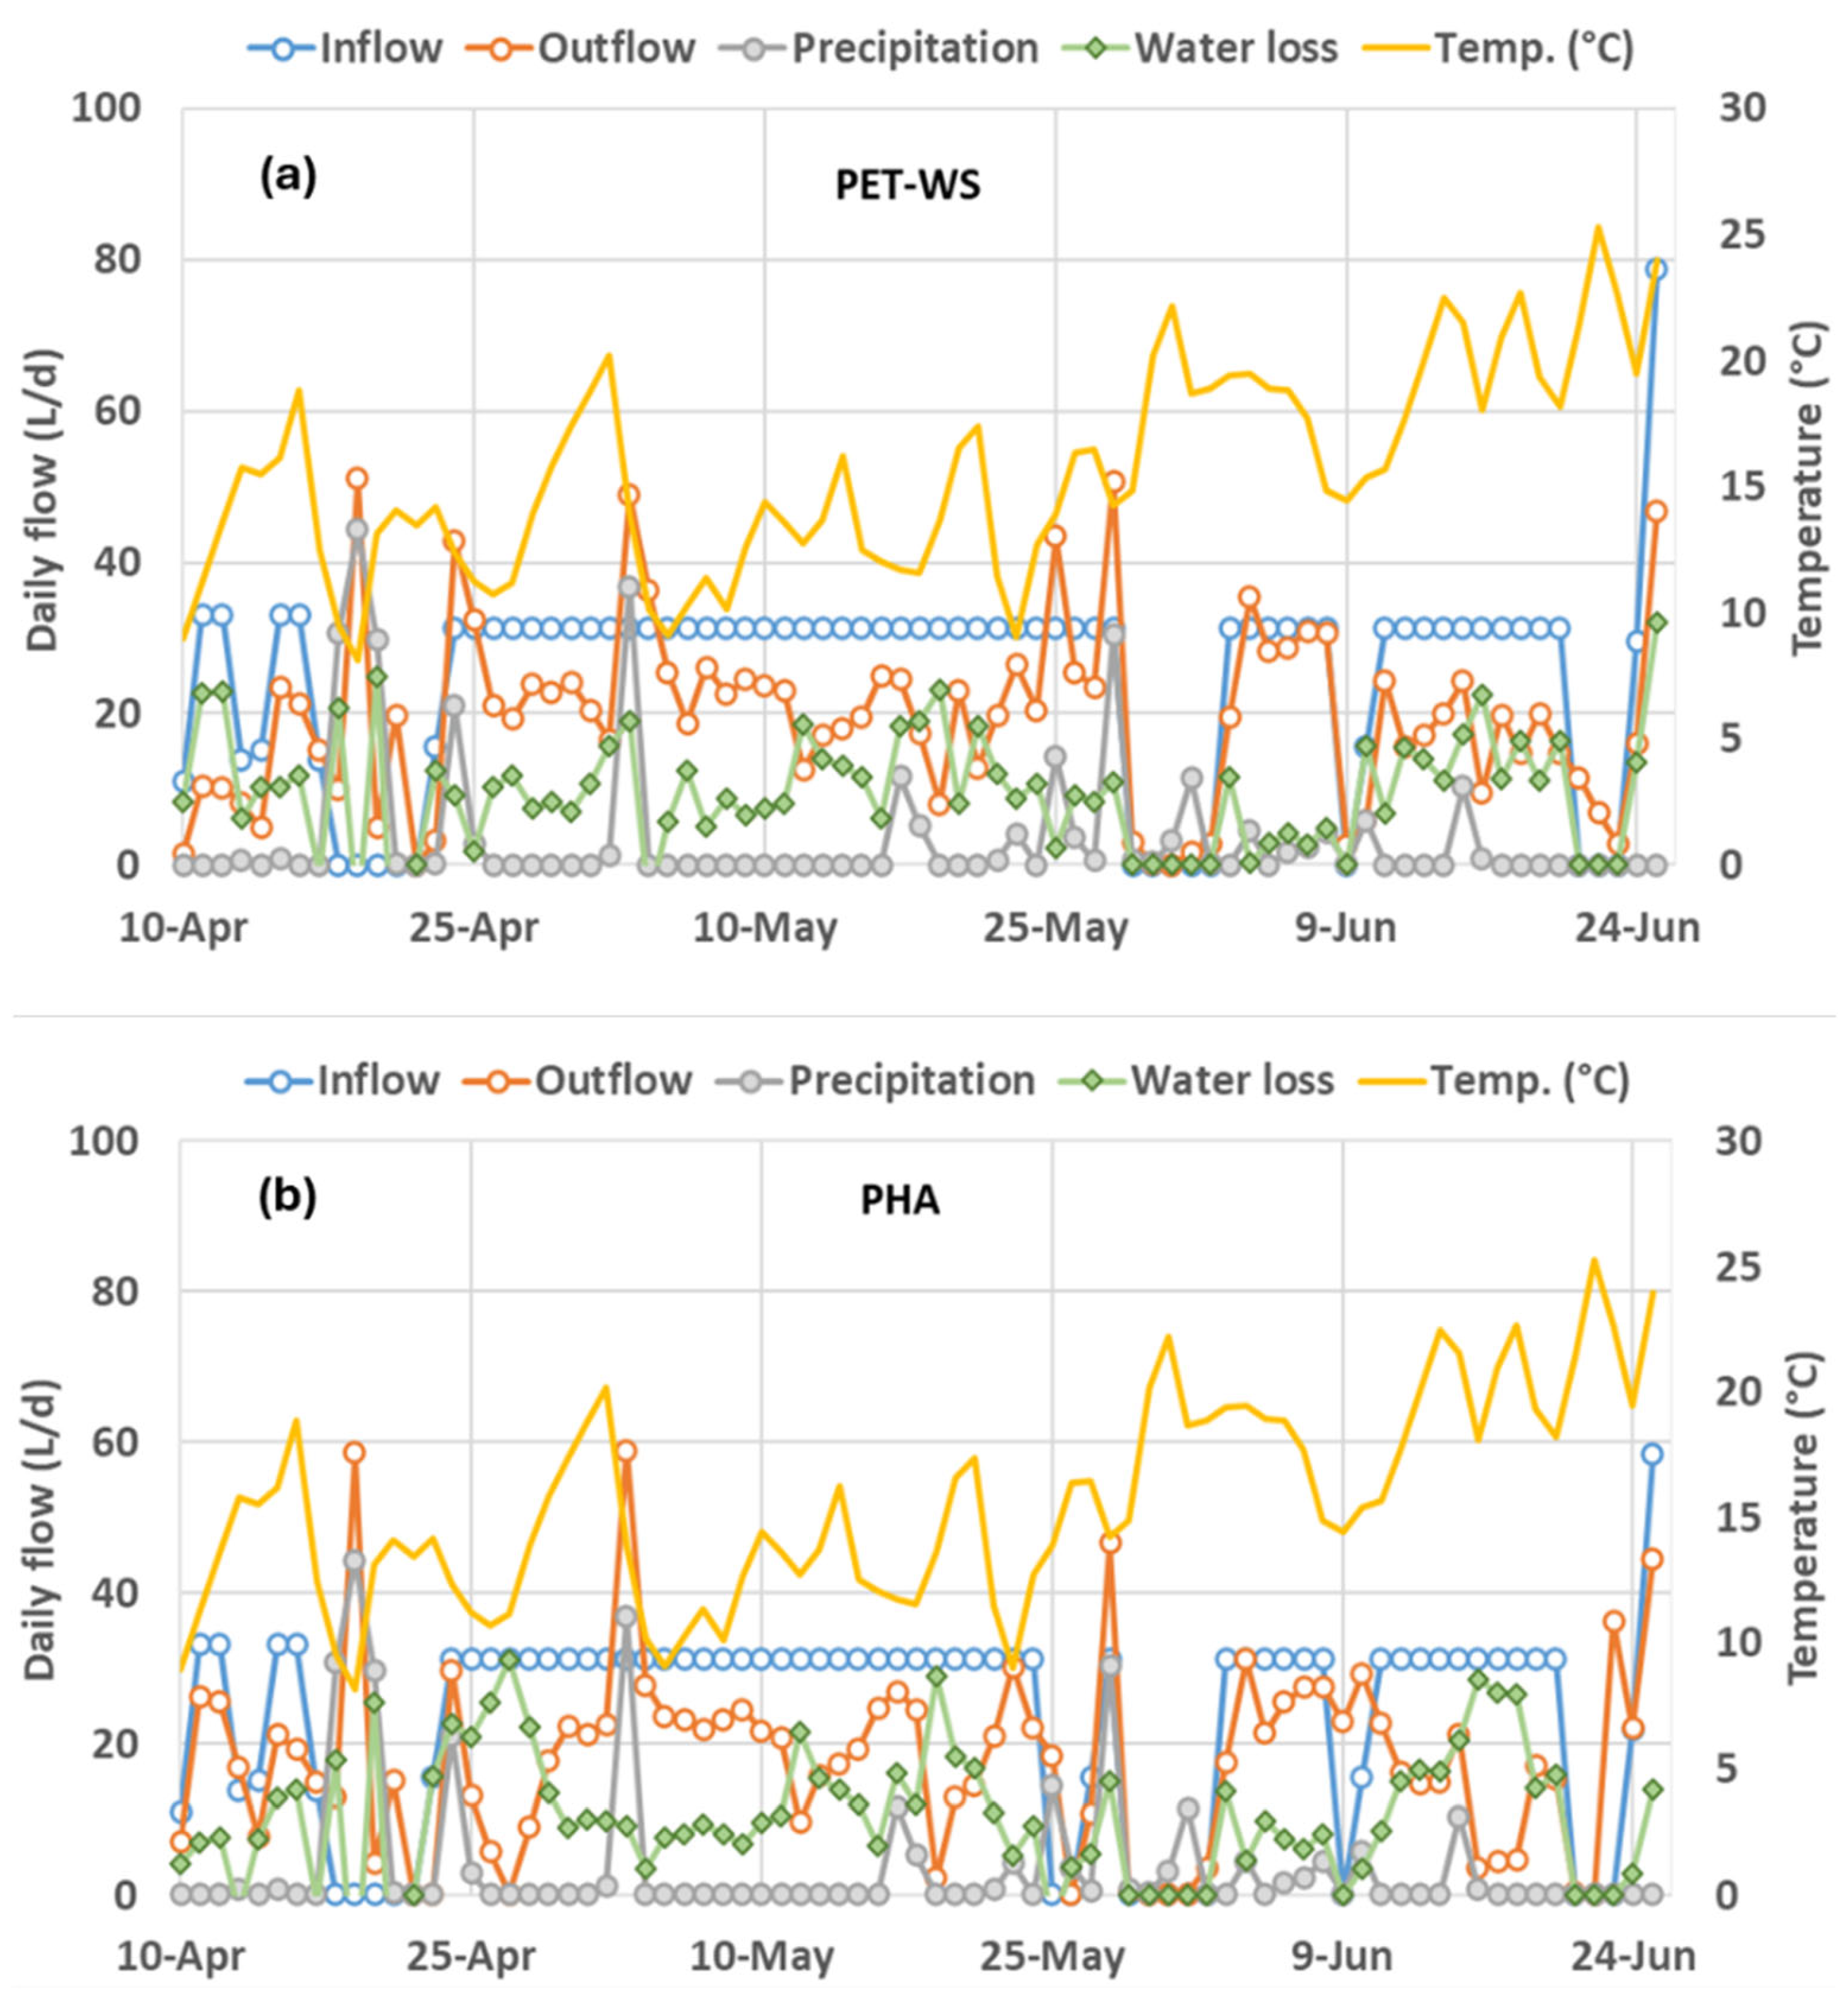
The loss of water through evaporation (EV) from the experimental mats and, when plants are present, through transpiration from vegetation, was estimated using Equations (2) and (3):
EV (L/d) = Fin + RinFout
EV   ( % ) = ( E V ) ( F i n + R i n ) × 100
where Fin is the daily rate of inflow CGW in L/d, Rin represents the daily precipitation or rainfall rate in L/d, and Fout is the daily rate of outflow treated water passing through the mats in L/d.

2.5. Statistical Analysis

The average and standard deviation (SD) of the parameters measured in this study were calculated using the Microsoft Excel 2024 package (Microsoft Office LTSC Standard 2024, Version 2408). Graphs were created using python (version 3.14.2) with the Matplotlib (v 3.10.9) and seaborn (v0.13.2) packages.
Microsoft Excel 2024 was used to carry out statistical analyses with the help of ANOVA—one-way analysis of variance—with a 95% confidence level. The analysis was conducted to compare the concentrations from the inlet, outlet, and average removal efficiencies among different datasets and to evaluate differences in treatment efficiencies among the mats that were used in this research work. Results were considered to be statistically significant when the p-value was below 0.05 (p < 0.05). However, each material was tested in a single pilot-scale experimental unit (one unit for PET-WS and one for PHA), without independent experimental replicates. The temporal samples collected from the same experimental unit during operation were used to evaluate system performance over time and were not intended to represent independent experimental replicates. Moreover, the ANOVA results were used to explore patterns (temporal variation and differences observed) in the data rather than to make strong statistical claims about treatment effects.

3. Results and Discussion

The results in the following sections evaluate the specific properties of several sample mats and their treatment performance in a lab-scale experiment, as well as the performance of two selected mats in a pilot-scale experiment when treating high-strength CGW. Furthermore, the following sections summarize the characteristics of the pre-treated CGW and the different physicochemical processes that are potentially involved in the treatment of high-strength CGW within the mats. It also covers water loss due to EV and/or evapotranspiration (ET), as well as the total water balance for both mats under outdoor conditions. Recommendations for further process optimization and the operational and maintenance requirements and feasibility of lightweight mats with high water storage capacity on the roofs of existing buildings in cities for potential applications are also discussed.

3.1. Specific Parameters of the Sample Mats: Water Storage Capacity, Water Retention and Water Loss Due to EV

Laboratory tests were carried out to measure some specific performance parameters of four sample mats produced from different textile fabrics. The results are shown in Table 2.
A comparison of the four sample mats showed that the PET-N mat had the highest water storage capacity (24.5 ± 1.4 L/m2) and 93% water retention, while the PHA mat had the lowest water storage capacity (12.2 ± 2.3 L/m2) and only 83% water retention (see Table 2). The PET-WS mat ranked second, with a water storage capacity of 18.5 ± 1.8 L/m2 and 93% water retention. The PLA mat ranked third, with a water storage capacity of 17.8 ± 2.0 L/m2 and 9% lower water retention than the best result from the PET-N sample mat.
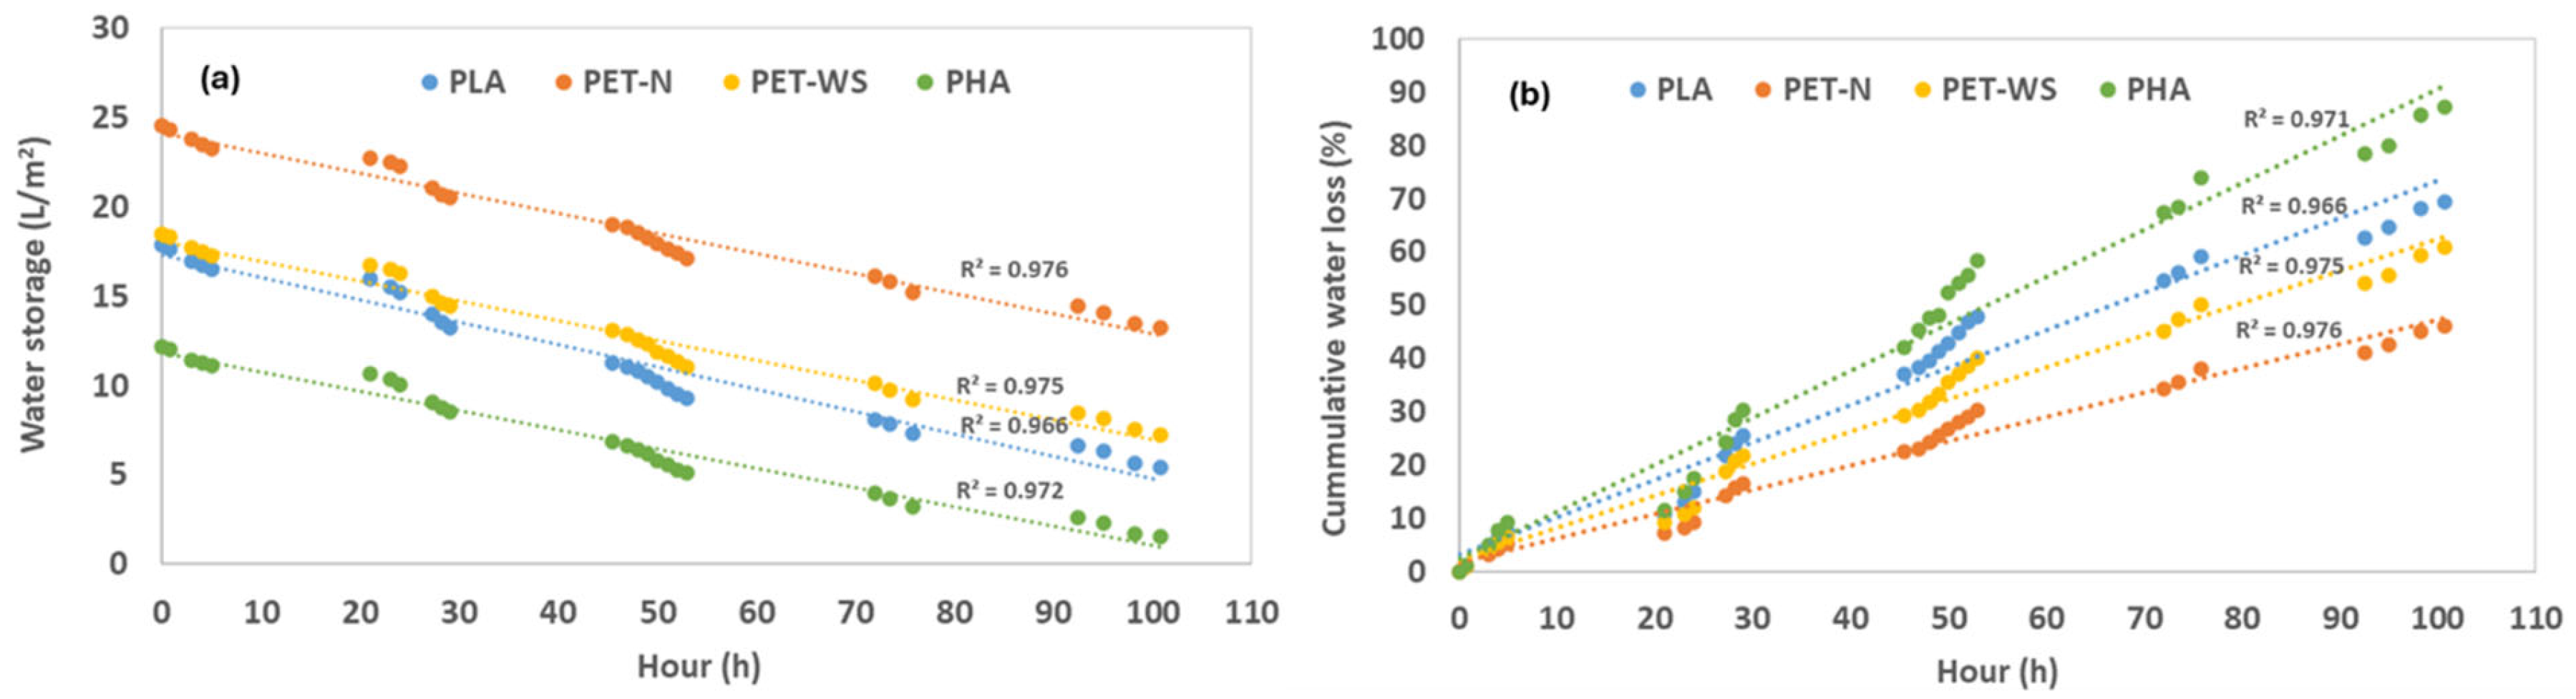
Figure 5 shows how the water storage rate (in L/m2) and cumulative water loss due to EV change over time within the four different mats during a nearly 100 h outdoor drying test.
After nearly 100 h of drying under outdoor conditions on hot summer days, the PET-N mat with the highest water storage capacity (24.5 ± 1.4 L/m2) showed the best water retention, with 13.2 L/m2 (54%) still contained (Figure 5a), and the lowest cumulative water loss (46%) after 100 h of drying compared to the other mats (Figure 5b). These results indicated that the PET-N mat performed better than the other mats, with better absorbency, longer water retention and higher resistance to drying out (lower EV capacity).
The PET-WS mat ranked second, with a moderate decrease in water storage capacity, dropping from 18.5 ± 1.8 L/m2 to 7.22 L/m2 after 100 h of drying, resulting in a cumulative water loss of 61%. The PLA mat came third, with a remaining water storage capacity of 5.4 L/m2 after 100 h of drying, down from an initial water storage capacity of 17.8 ± 2.0 L/m2. It demonstrated a cumulative water loss of 69%.
By contrast, the PHA mat with the lowest water storage capacity (12.2 ± 2.3 L/m2) exhibited the highest cumulative water loss due to EV (>87%) under outdoor conditions and dried out more quickly than any of the other sample mats in this experiment. It contained only 13% water retention, dropping the water storage capacity to just 1.6 L/m2 after 100 h of drying (Figure 5b). Lower final water retention indicates that the PHA material from the biodegradable polymer family releases absorbed water more readily, whereas higher water retention by the other materials suggests a stronger water storage capacity. Overall, the results indicated that the mats made from PET nonwoven fabric materials (PET-N and PET-WS) have the highest water storage capacity. These mats can retain more water and dry more slowly under outdoor conditions than mats made from PLA and PHA.
Over time, all mats showed a steady decrease in water storage, as well as an increase in cumulative water loss due to EV. In both cases, R2 values of >0.96 indicated a strong fit between the observed data and the regression lines (Figure 5a,b), suggesting a strong relationship between the variables. The overall performance ranking can be summarized as follows: PET-N > PET-WS > PLA > PHA. PET-N was shown to be the most effective material under the tested conditions, while PHA has potential for improvement. Both the PET-WS and PLA materials offered moderate performance. However, the results also suggested that these mats could dry out quickly over time due to high water loss, which would make them less effective if used as roof biofilters on urban buildings where water availability is reduced.

3.2. Greywater Characteristics

Before starting the experiment, the GW collected from the canteen was assessed by analyzing the conventional macro-pollutants in it. Table 3 shows the physicochemical and biological parameters of the CGW quality.
Canteen GW is generated from sinks and dishwashers and contains food waste, oils, fats and various detergents. The water quality varies depending on the meal served and the volume of water used for washing and cleaning [43,44]. Storage time also impacts the characteristics of the CGW: the water quality improves within the first day of storage, but then decreases drastically after 48 h [20,45]. In this study, the pre-treated CGW was either collected manually from the storage tank to the inflow tank for the lab-scale experiment, or pumped directly from the storage tank to the inflow feeding tank located outside for the pilot-scale experiment. In both cases, samples collected from the inflow tanks were mixed and, in most cases, had been stored for more than 48 h, as the inflow tanks were not filled daily. As can be seen from Table 3, the overall water quality of the inflow CGW decreased drastically after many hours of storage in the inflow feeding tanks, turning into a high-strength CGW with mean BOD5 and COD concentrations of 866 ± 305 mg/L and 1743 ± 1181 mg/L, respectively. The inflow CGW stands out due to its extremely high and inconsistent BOD5 and COD concentrations, which suggest a much greater amount of biodegradable organic content.

3.3. Lab-Scale Experiment—Overall Treatment Performance of the Sample Mats

3.3.1. BOD5, COD, TSS, and E. coli

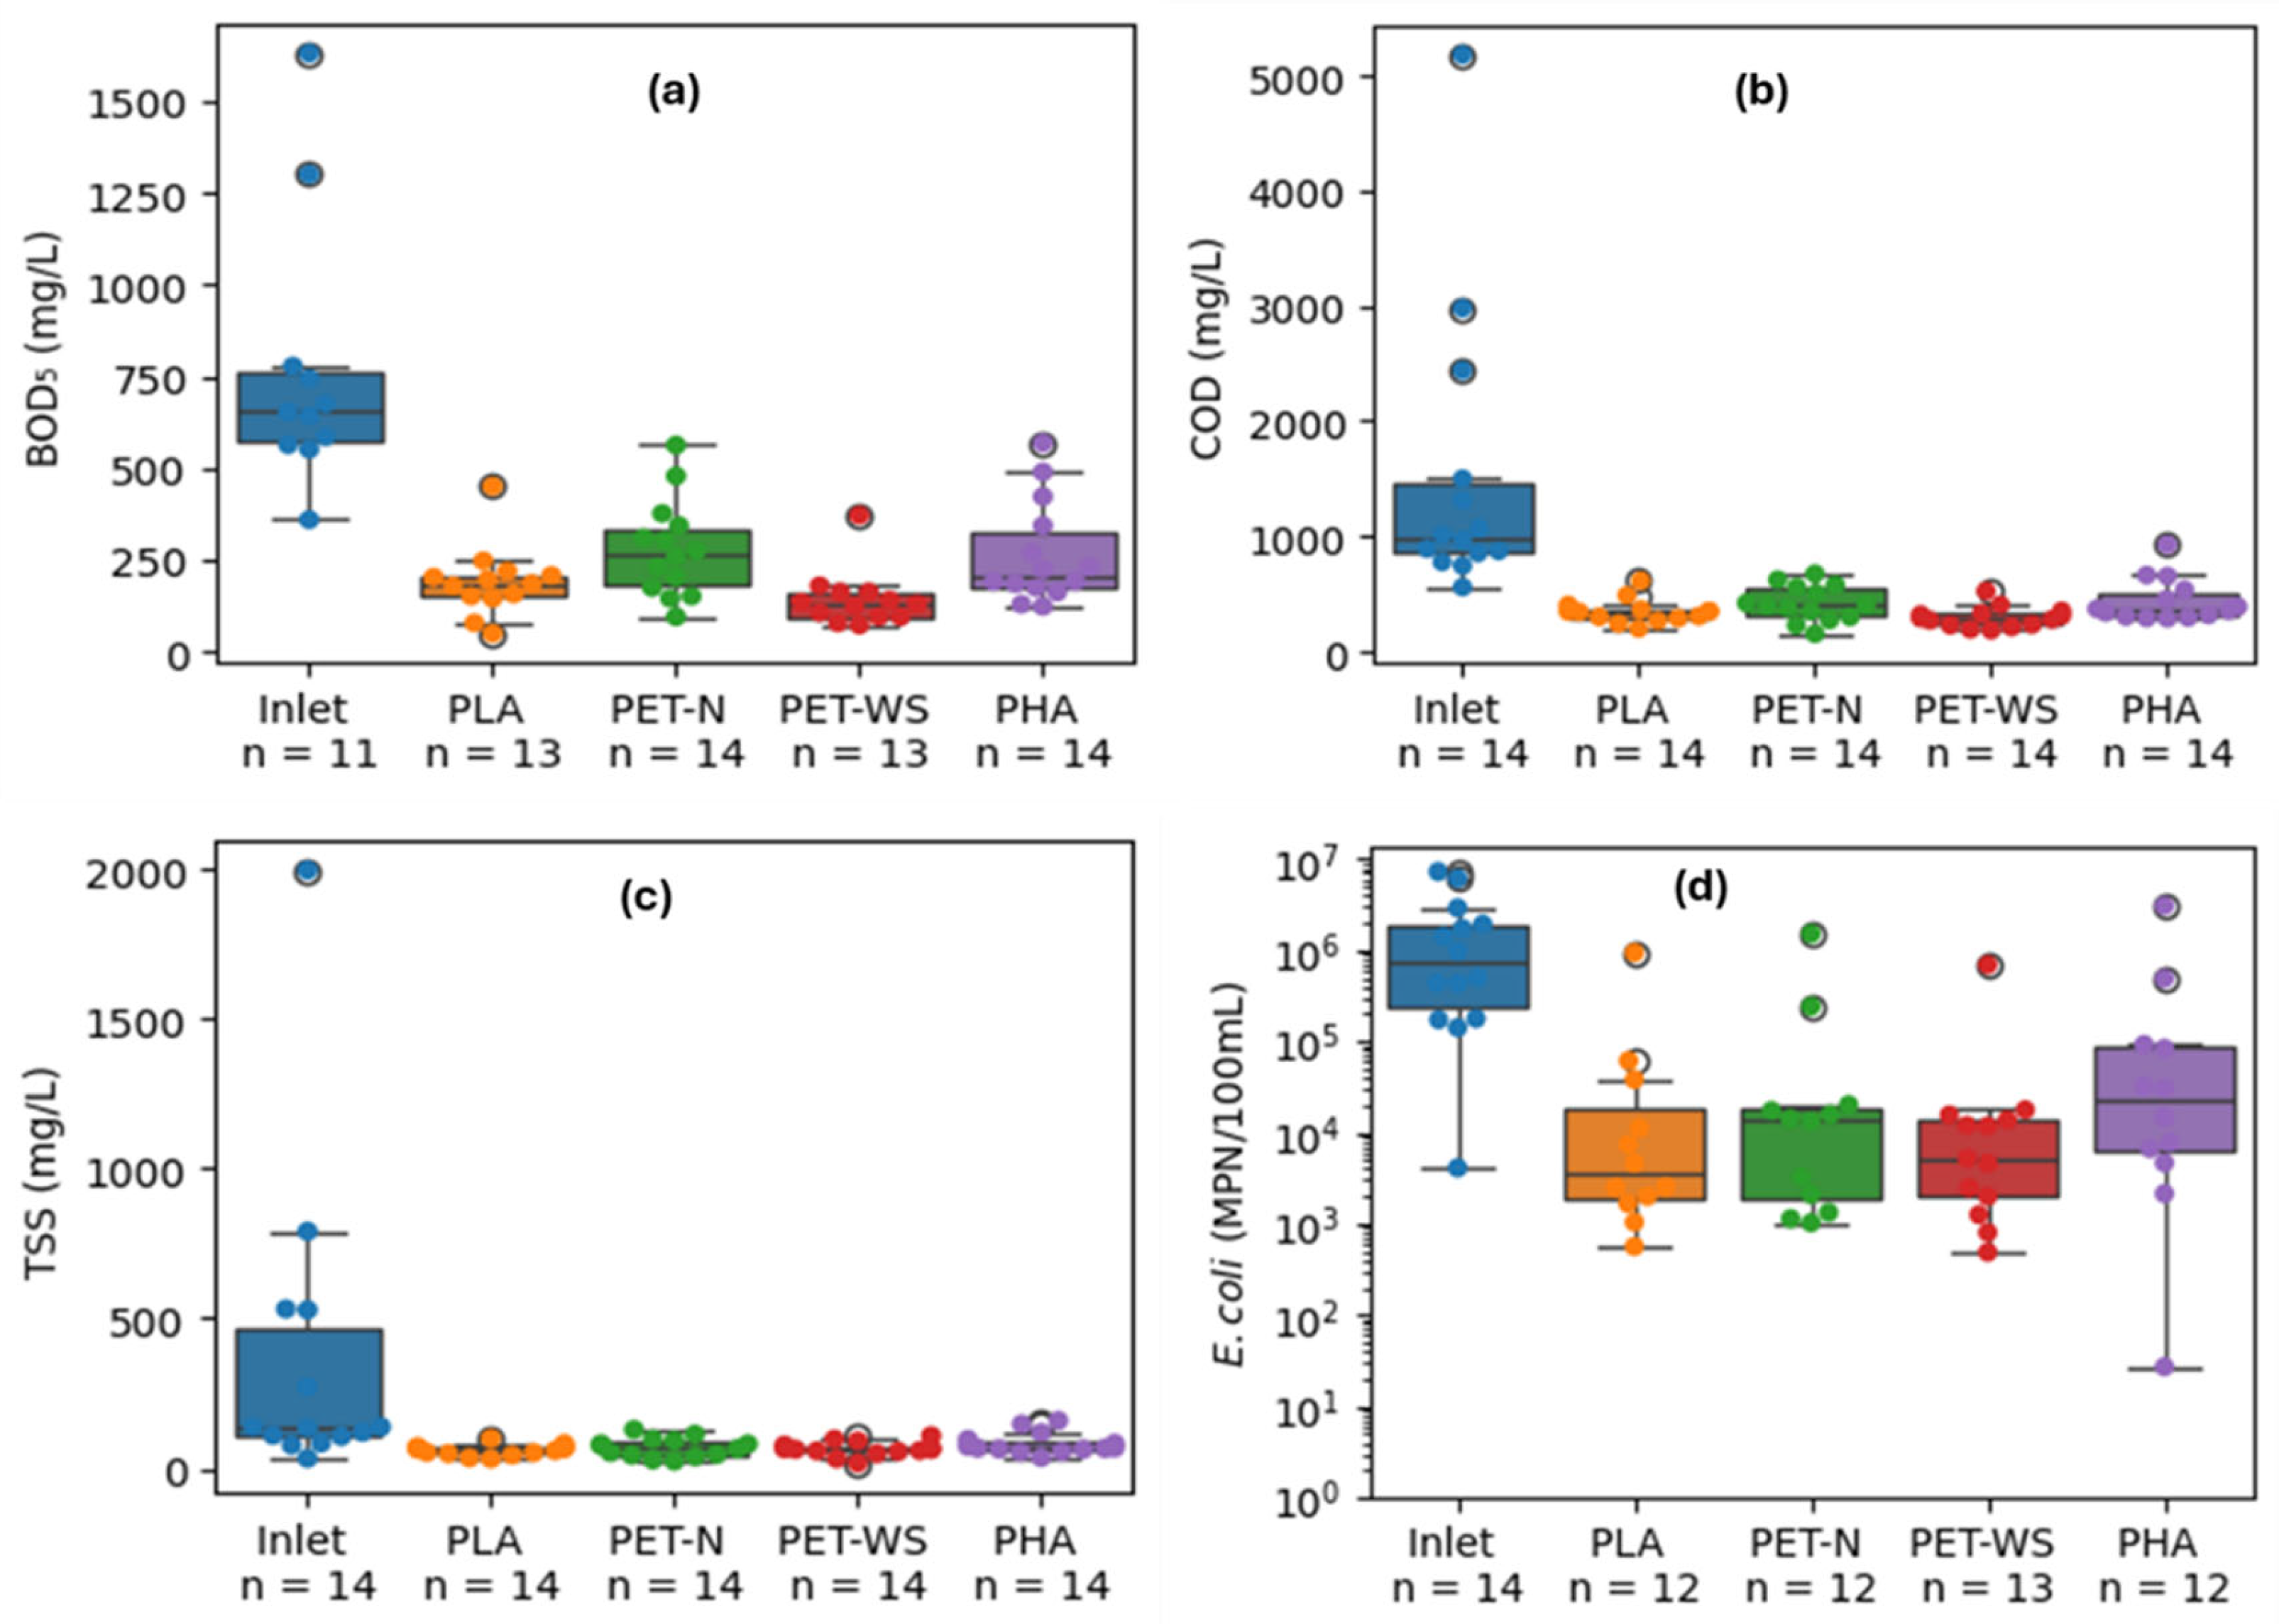
Figure 6 shows a boxplot comparing the concentrations of BOD5, COD, TSS and E. coli counts among the inflow and outflow of the four sample mats, which are made of four different materials (PLA, PET-N, PET-WS, and PHA), during CGW treatment. Each boxplot shows the minimum, maximum and median values, the interquartile range, whiskers, and the outliers for the corresponding parameters.
Overall, the patterns demonstrate that there is a clear gradient in the BOD5, COD, TSS and E. coli levels at the outflow compared to the inflow, with the highest values and variability. In general, a certain cleaning effect was observed for all mats. Mats made from PET-WS and PLA materials showed the lowest values, while those made from PET-N and PHA mats showed moderate values. The inflow BOD5 concentration showed the highest median value of 676 mg/L, with a wide range (approximately 350–800 mg/L), containing extreme outliers above 1300 and 1600 mg/L, indicating a high and very inconsistent organic load.
The PET-WS mat exhibited the lowest median BOD5 concentration of 130 mg/L, demonstrating a consistent pattern of low BOD5 throughout the study, alongside a narrow distribution with a few outliers. The outflow BOD5 concentration from the PLA, PET-N and PHA mats ranged from low to moderate, with a median value between 186 and 267 mg/L. The distribution was relatively tight to wider, with some higher values and occasional spikes (400–550 mg/L). Similarly, the lowest median COD concentration of 285 mg/L, with a few outliers, was observed in the outflow of the PET-WS mat. The strongest outliers were observed in the CGW inflow and were minimal in the outflows of the PET-WS and PLA mats (Figure 6a,b). The outflow BOD5 and COD concentrations from the four mats can be arranged from the highest to lowest median as follows: PET-N > PHA> PLA > PET-WS. These results suggest that PET-WS and PLA are the most efficient materials for treating high-strength CGW and have a lower environmental impact in terms of BOD5.
The TSS concentration results for the four sample mats can be arranged in order of median concentration as follows: PET-N > PHA> PET-WS > PLA. The PLA mat showed the lowest median TSS concentration of 62.5 mg/L and a narrow distribution with a few outliers (Figure 6c). The PET-WS mat ranked second, with the second-lowest median TSS concentration of 64 mg/L. The PHA and PET-N mats ranked third and fourth, respectively.
In terms of E. coli counts, the PHA mat showed the highest median value and performed poorly compared to the numbers of E. coli at the outflows of the other mats. A very wide spread from 101 to 106 MPN/100 mL, with extreme outliers above 106 MPN/100 mL, indicates inconsistent E. coli counts at the PHA mat outflow (Figure 6d). The outflow of the PLA mat showed the lowest median value among all four mats, with an E. coli count of 3.6 × 10³ MPN/100 mL (ranked first). Based on the median E. coli values from the outflows of all four mats, they can be arranged as follows: PHA > PET-N > PET-WS > PLA.

3.3.2. NH4-N, NO3-N, TN, and TP Concentrations

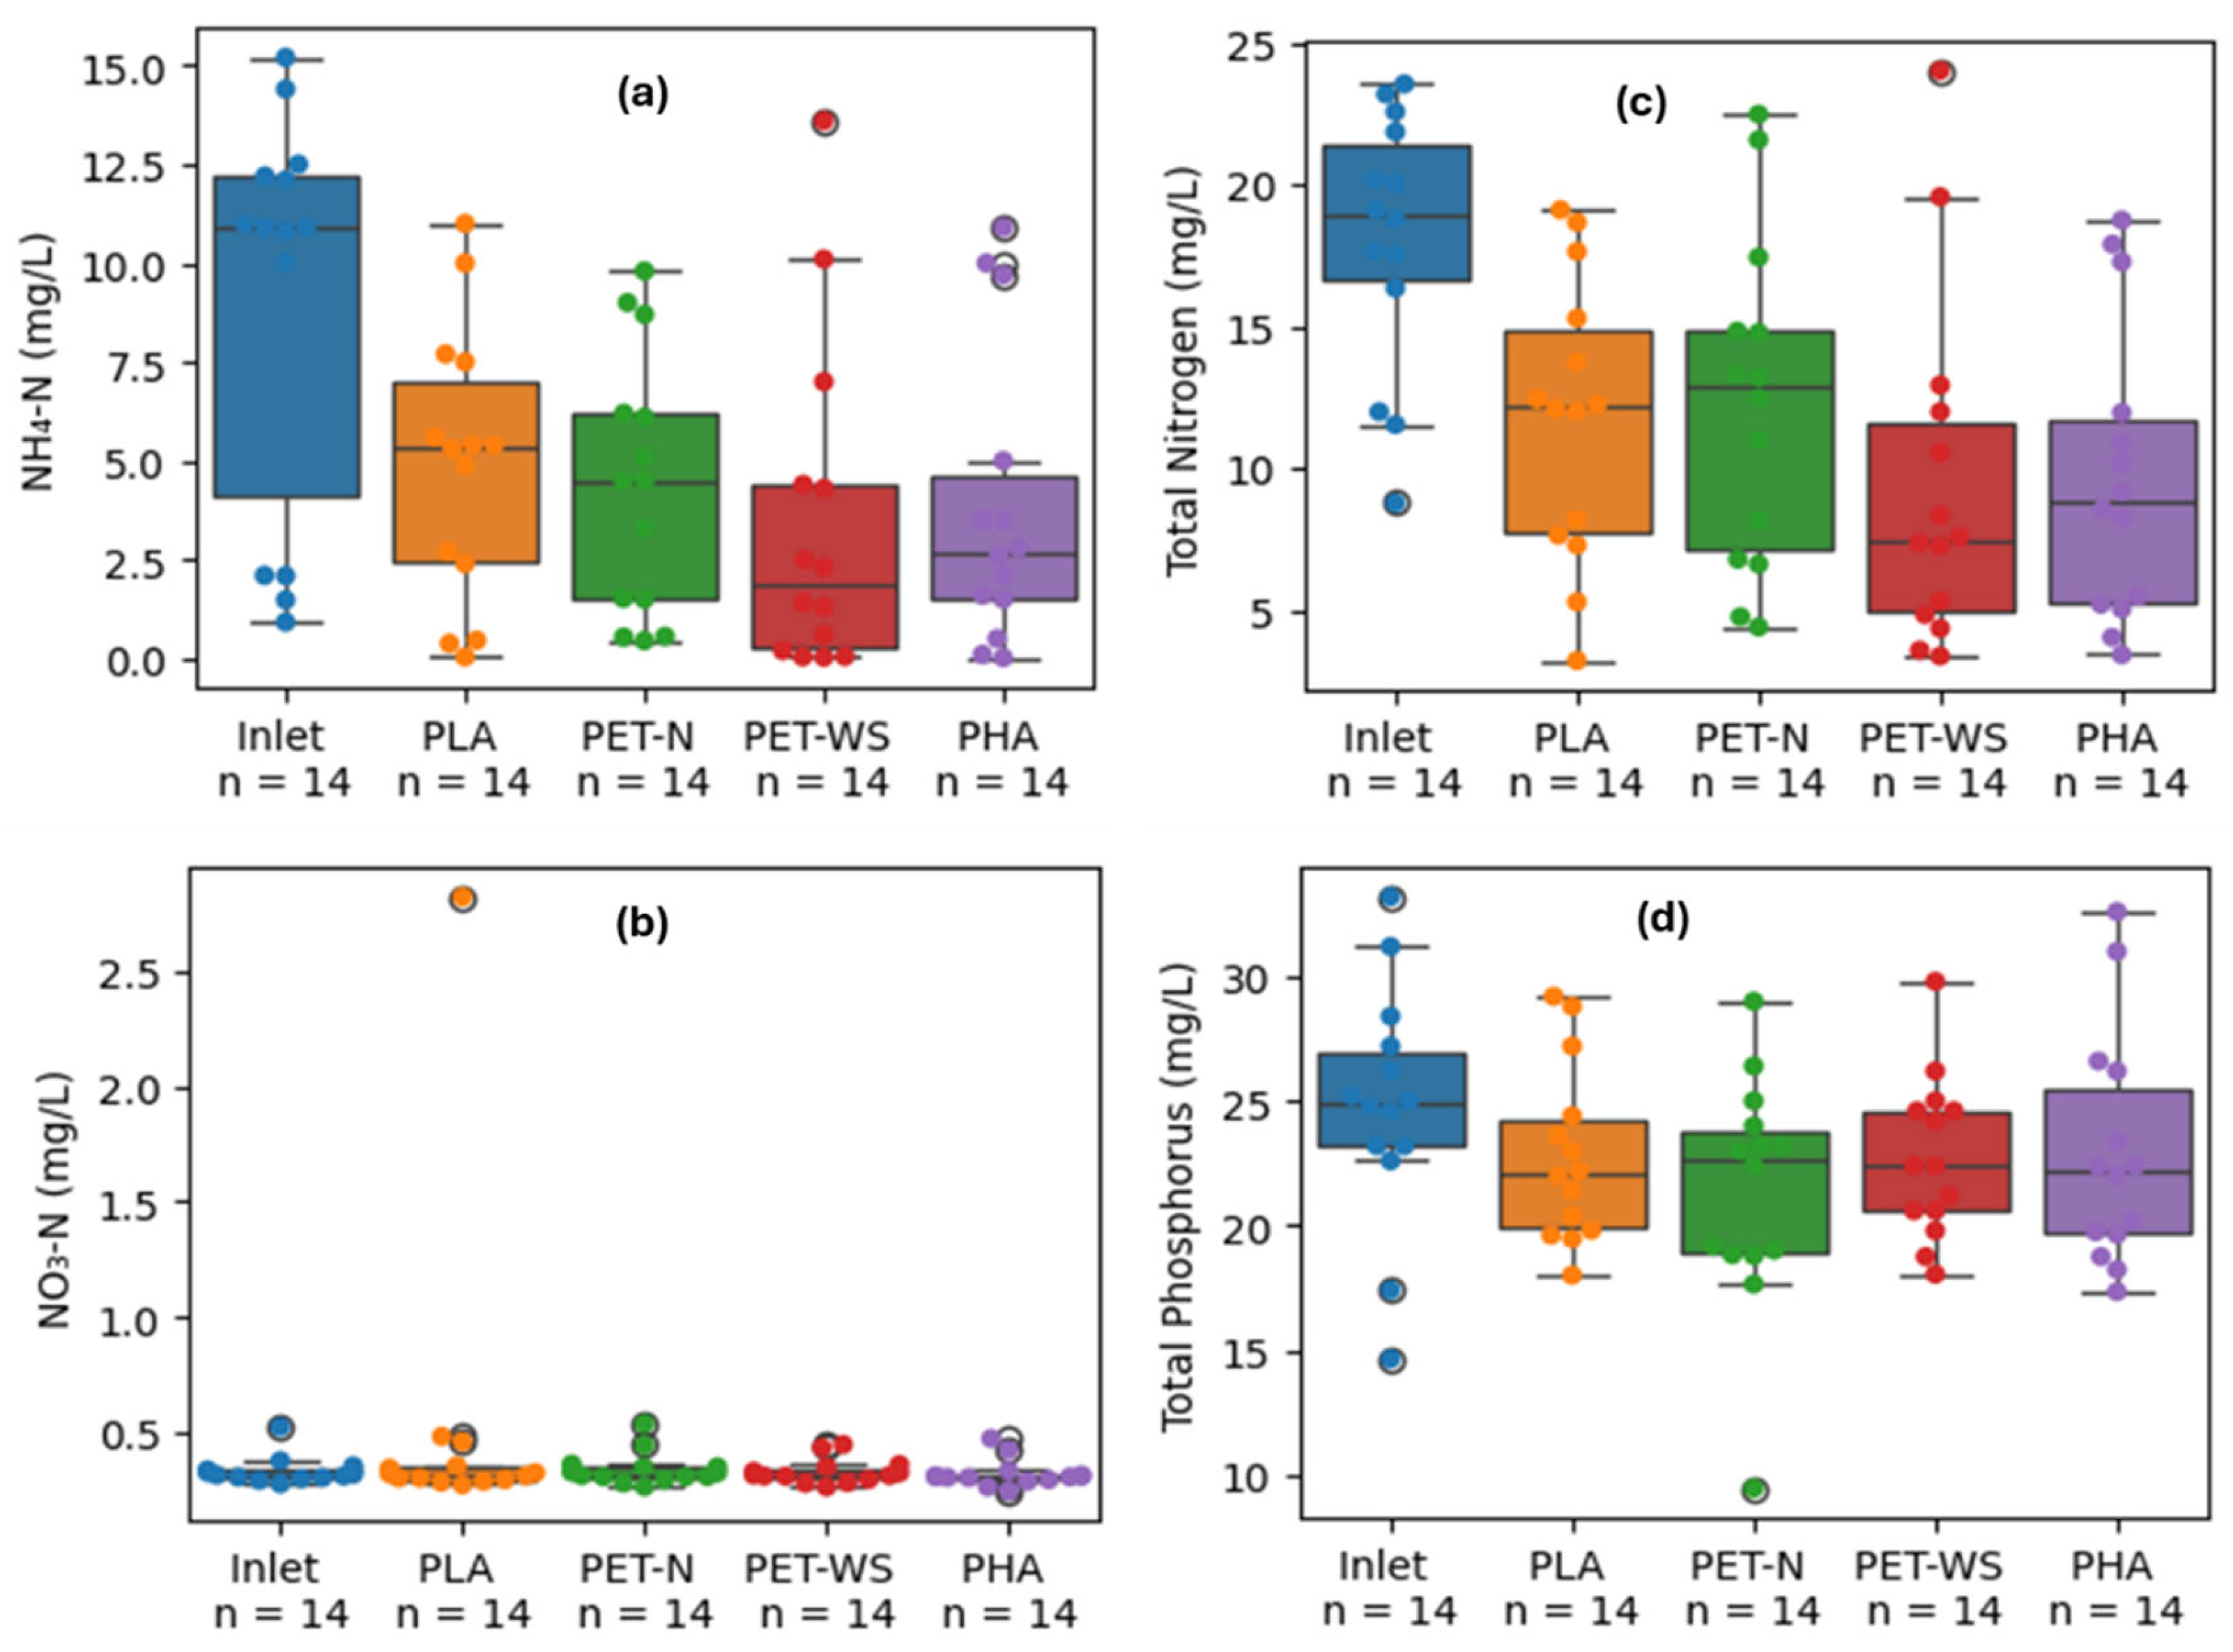
The boxplots in Figure 7 show the concentrations of NH4-N, NO3-N, TN, and TP in the inlet and outlet of the four sample mats in the lab-scale experiment.
A clear gradient is evident in the median concentration values of NH4-N, TN, and TP at the outflows from the four mats in comparison with the inflow, which exhibits very high variability and the highest values. The PET-WS mat showed the lowest median NH4-N concentration of 1.9 mg/L, with only a few outliers, while the PHA mat ranked second, with a median NH4-N concentration of 2.7 mg/L. The other two mats, the PET-N and PLA mats, showed moderate values at the outflow. NO3-N concentrations showed no apparent changes (p > 0.05) in the outflows from the four mats compared with the inflow. In the case of TN concentration, the outlet of the PET-WS mat also showed the lowest median concentration (7.5 mg/L), performing far better than the other three mats. The median TN concentrations in the outflows from the other three mats showed moderate-to-high values, ranging from 8.9 to 12.8 mg/L and showing a relatively wide distribution with some higher values (Figure 7c). Arranging the median TN concentrations at the outflows of the four mats from highest to lowest gives the following order: PET-N > PLA> PHA > PET-WS. There were no statistically detectable (p > 0.05) changes observed in the median concentrations of TP in the outlet of the mats used in this experiment.
The overall treatment performance of the four sample mats used in this lab-scale experiment for treating high-strength CGW is shown in Table 4.
Based on the measured water quality parameters in the inflow and outflow of the four boxes containing the sample mats, it was observed that the PET-WS mat was the most effective at treating CGW compared to the other three mats in this study (Table 4). Compared to the inflow, the outflow of the PET-WS mat showed an apparent decrease (p < 0.05) in most of the parameter concentrations, demonstrating highly efficient treatment performance with mean reductions of 83%, 80%, 62%, 48%, 87%, 72% and 1.8 log for BOD5, COD, NH4-N, TN, TU, TSS and E. coli, respectively.
Statistically detectable changes in the outflow BOD5 and COD concentrations were observed when comparing four mats during 110 days of CGW treatment under laboratory conditions. The PLA mat ranked second in terms of mean BOD5 and COD concentrations at the outflow. The BOD5 and COD concentration reductions were not apparently different (p > 0.05) at the outlet of the PET-N and PHA mats, which suggested that they performed similarly. The four sample mats can be arranged in order of BOD5 and COD concentration reduction from highest to lowest as PET-WS > PLA > PET-N ≥ PHA.
However, in terms of reducing the concentration of NH4-N and TN, the PHA mat performed second best, with relatively high removal rates of 57% and 46%, respectively. Both the PET-WS and PLA mats showed the same reduction in E. coli, with a mean removal of 1.8 log, and performed comparatively better than the other two mats (PET-N and PHA) in this study. In case of TP removal across the four mats, there were no apparent changes or statistically detectable reductions (p > 0.05) measured in this study.
Due to its high creep resistance (even at high temperatures) and excellent tensile properties, PET-based material is a major synthetic fiber used in the manufacture of geotextiles. This fabric can easily degrade in soil with a high pH value [46]. From this perspective, the PET-WS mat’s superior treatment performance demonstrates PET’s potential as a material for roof biofilters in urban buildings for treating moderate-to-high-strength GW. In this context, Touze-Foltza et al. [47] presented an overview of the properties of various geosynthetic liner materials used in numerous environmental applications.

3.4. Pilot-Scale Experiment: Overall Treatment Performance of the Selected Mats

Two materials were selected and scaled up for the pilot-scale experiment. The selection of materials was based on both performance-oriented and exploratory criteria. PET-WS was selected due to its favorable laboratory-scale treatment efficiency and stable operational behavior when treating CGW. Although PET-N exhibited a higher water storage capacity, this parameter alone was not considered sufficient for the selection of materials at the pilot scale. Additional factors, including material robustness, suitability for long-term implementation, and the required size availability for the pilot-scale testing, were also considered. The unique, bio-based PHA material was selected as an exploratory, biodegradable alternative and was used for the first time to create spunbonded nonwovens in an attempt to prolong its service life without compromising its biodegradability. Despite its lower water storage capacity, higher EV, and lower treatment performance during the lab-scale experiment compared to other sample mats, selecting this innovative material aimed to evaluate the feasibility of a bio-based textile material under real-world (field) operational conditions, as well as monitor its treatment performance when treating high-strength CGW.
The pilot-scale system was operated in four experimental phases with different operating conditions (Table 1). These phases included both continuous and intermittent flow, as well as the presence or absence of active aeration (either continuous or intermittent).

3.4.1. Turbidity, EC, pH, and DO

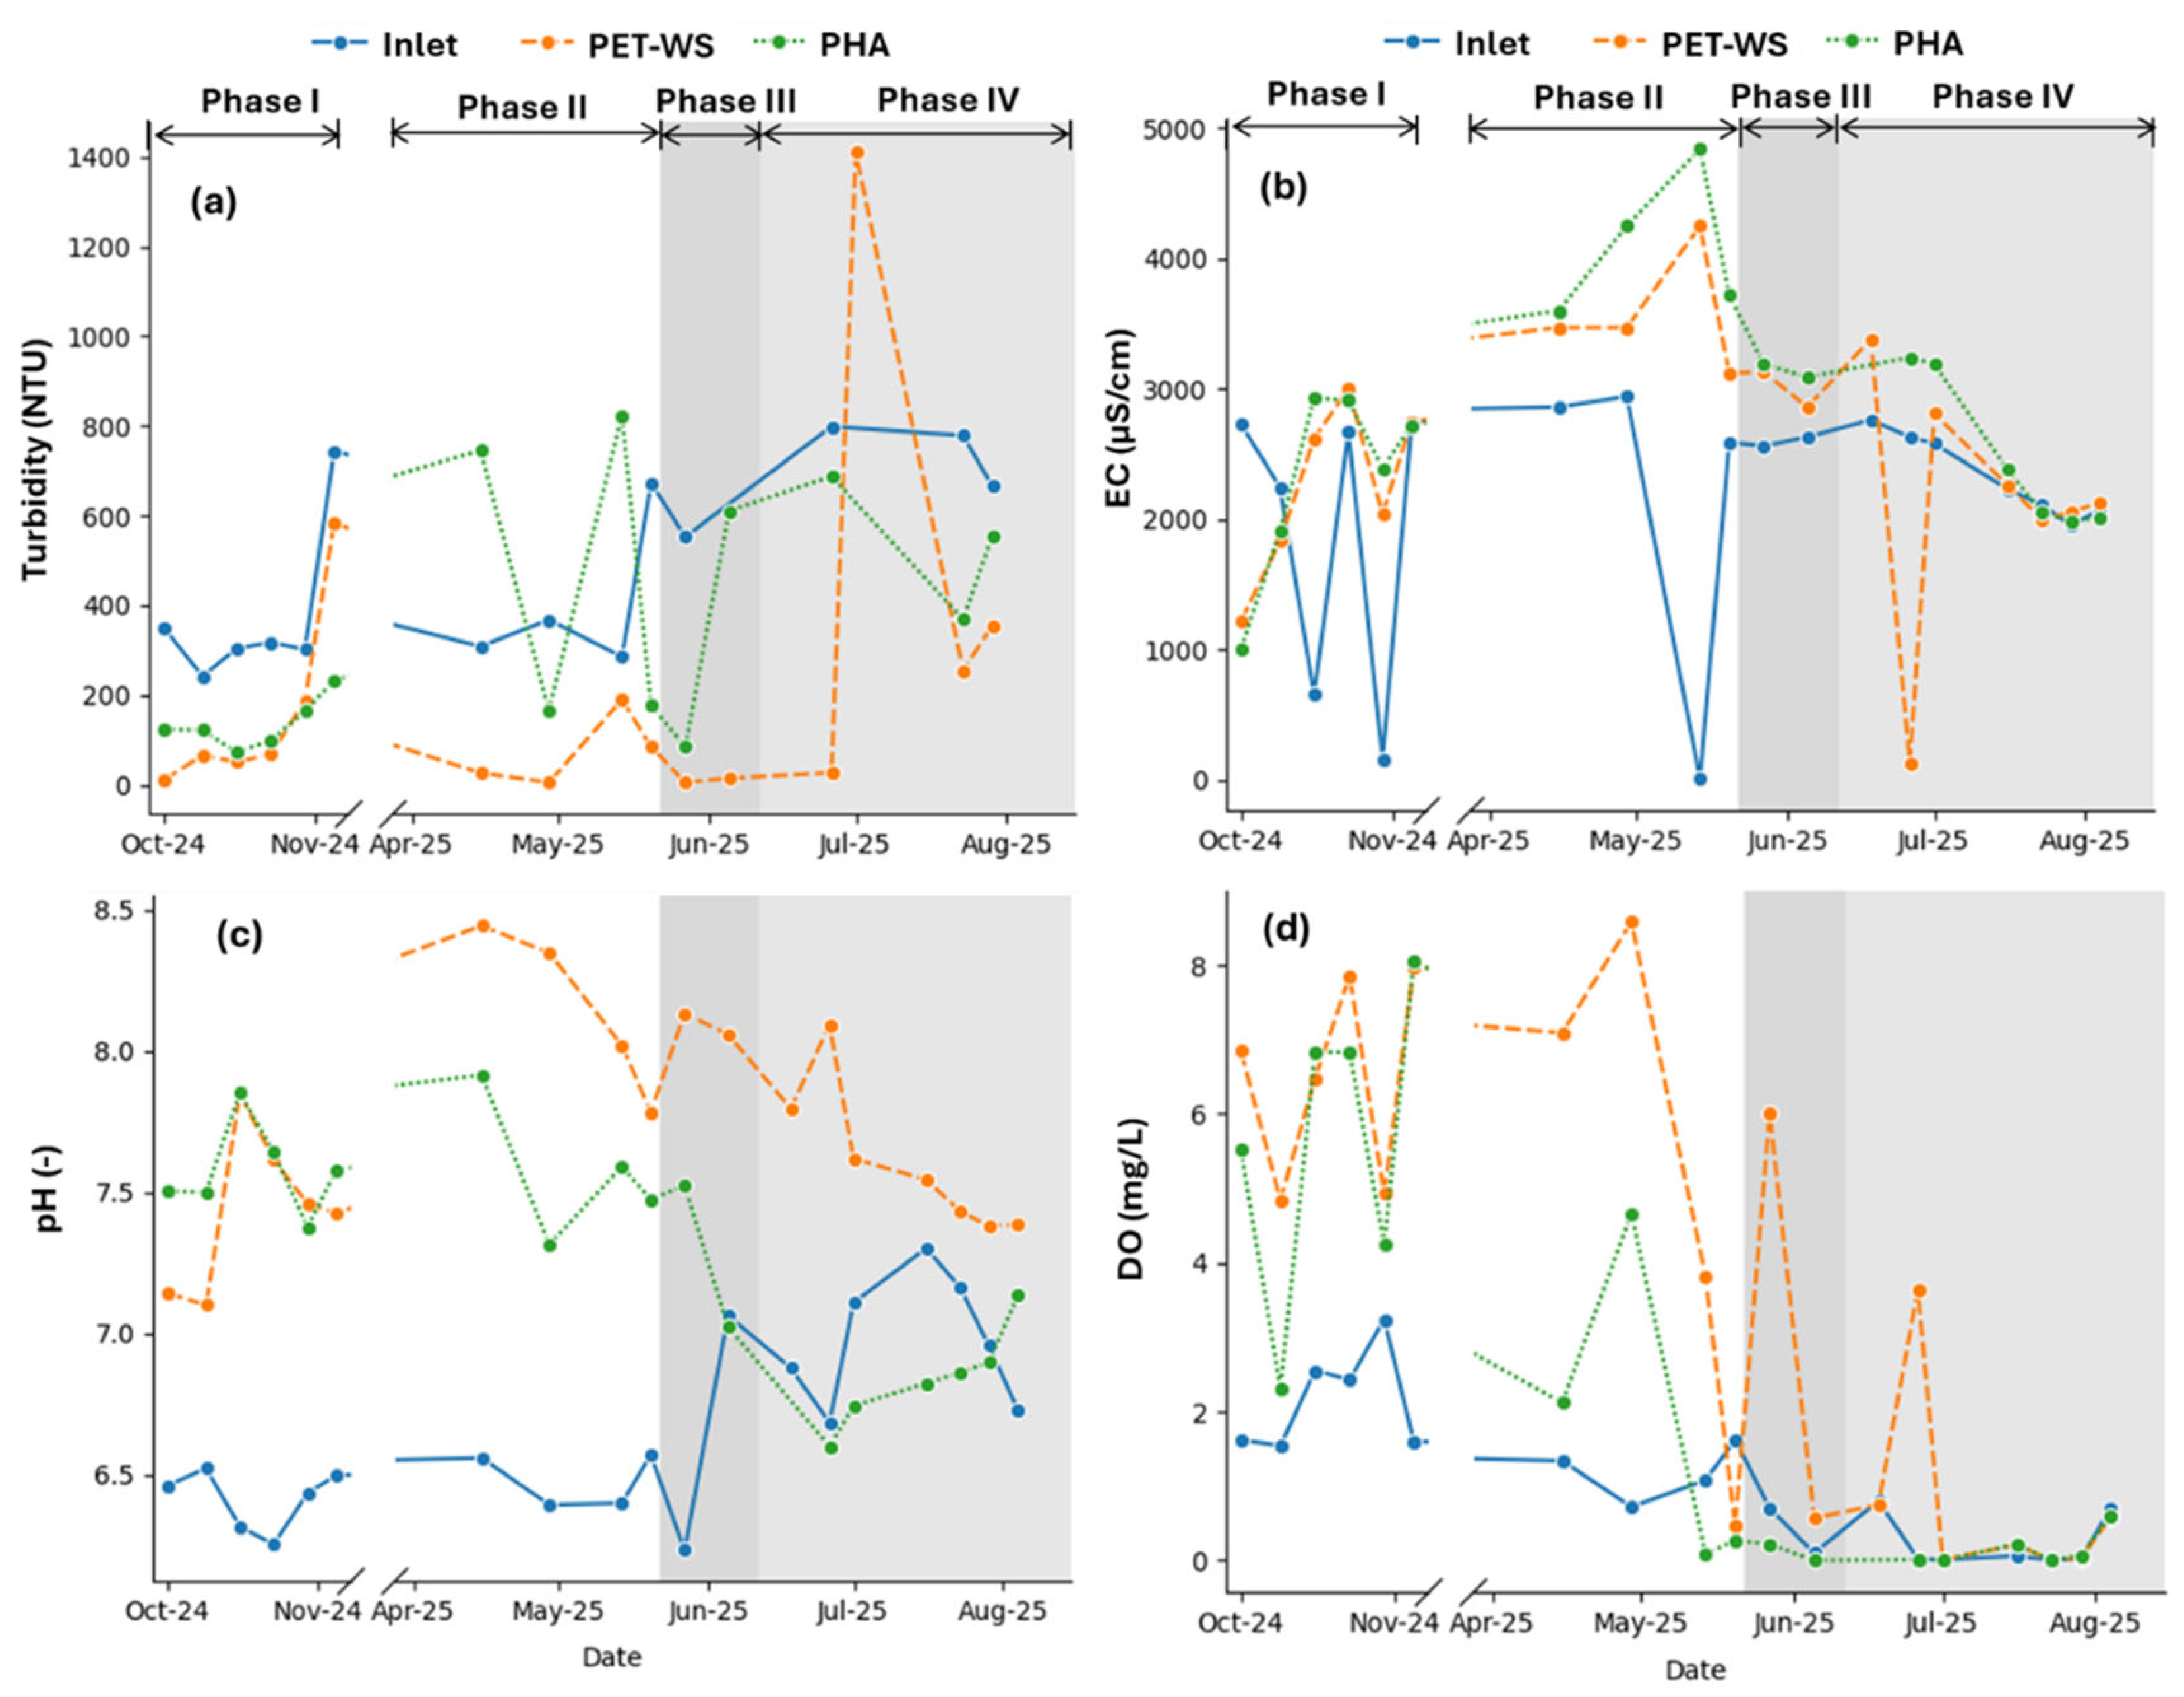
Figure 8 illustrates the dynamics of selected physical parameters, such as TU, EC, pH values and the concentration of DO in the inlet and outlet of the PET-WS and PHA mats during the whole pilot-scale experiment.
Throughout the monitoring period of the pilot-scale experiment in this study, apparent variations and fluctuations were observed in the TU, EC, pH, and DO concentration parameters. During the experimental phase I, which involved no active aeration in the inflow tank and intermittent flow at the inlet, a clear trend of decreasing TU and increasing EC, pH values, and DO concentrations was found at the outlet of the mats compared to the inflow. In phase II, which involved continuous flow and no aeration, TU values fluctuated drastically at the outlet of the PHA mat. The most remarkable increase in pH was observed at the beginning of phase II operation with continuous flow, when the pH values of the effluents from both mats increased to reach 8.1 ± 0.3 at the outlet of the PET-WS mat. However, subsequently, the EC, DO concentration and pH values were showing a decreasing tendency in both the PET-WS and PHA mats (Figure 8). In experimental phase III, with active aeration and continuous flow with a low HLR, the TU value decreased drastically, reaching a mean value of 10 NTU, while the DO concentration showed an increasing trend specifically at the outlet of the PET-WS mat following the continuous addition of air to the inflow tank. A similar trend of increasing DO was observed in phase IV at the outlet of the PET-WS mat, with an intermittent aeration and a higher HLR in the inflow. In general, high DO concentrations after the mats indicate a high level of oxygen within the mats, which does not necessarily confirm homogeneous oxic conditions since potential spatial heterogeneity may influence redox conditions throughout the mats. However, the concentration of DO at the outlet of the PHA mat was exceptionally low, suggesting highly reducing conditions within this mat during this phase with a higher HLR.

3.4.2. BOD5, COD, TSS, and E. coli

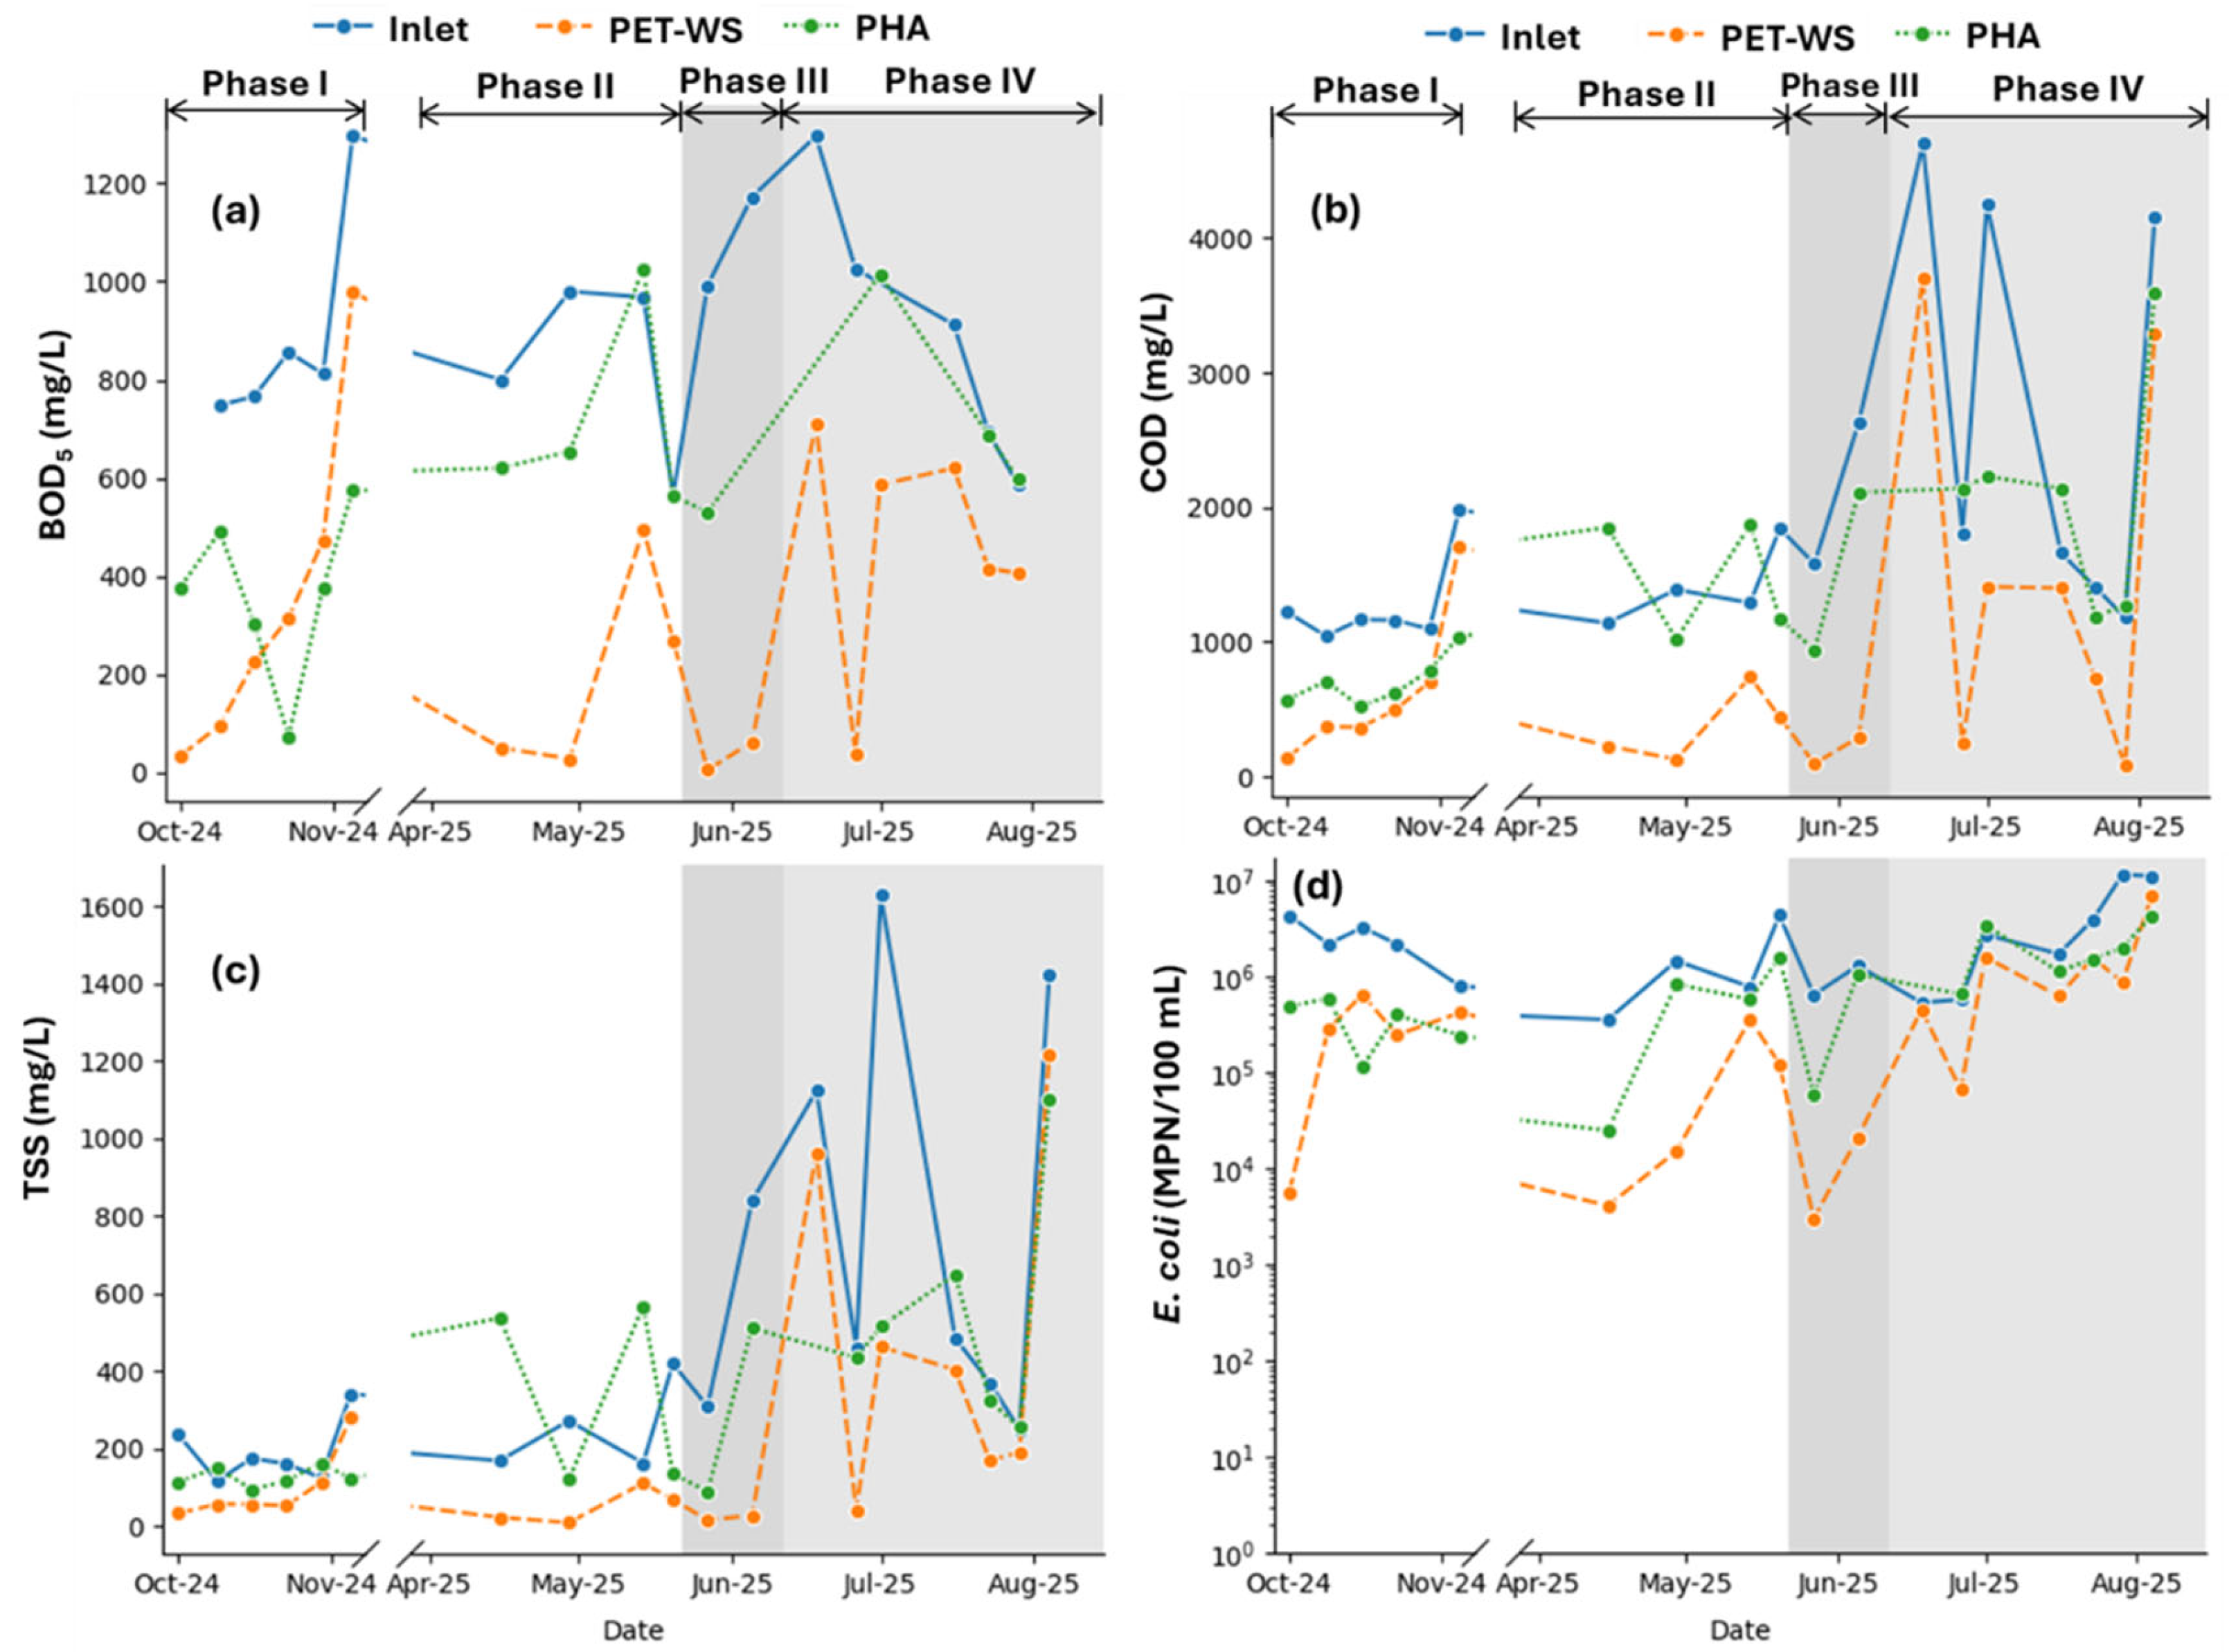
The dynamics of BOD5, COD, and TSS concentrations, as well as the numbers of E. coli that were observed in the inlet and outlet of the PET-WS and PHA mats when loaded with pre-treated CGW under different operating conditions, are shown in Figure 9.
In this pilot-scale study, the parameters BOD5, COD, TSS, and E. coli showed high fluctuations in the inflow and outflow of both mats under different operating conditions. BOD5 in the inflow showed an increasing trend during experimental phase I without aeration and a decreasing trend during phase IV with active aeration. Both outflows from the PET-WS and PHA mats showed increasing trends in BOD5, COD, and TSS concentrations during phase I with intermittent flow and without aeration. Outflow concentrations from the PET-WS mat always showed lower values, in comparison to the inflow concentrations throughout the entire study. No such specific trend could be observed in the outflow of the PHA mat. When comparing phase III with a low HLR and phase IV with a comparatively high HLR (both with aeration in the inflow feeding tank), highly fluctuating values were observed during phase IV. In experimental phase III with a low HLR, the mean BOD5 and COD concentrations decreased down to 33 and 194 mg/L, respectively, at the outflow of the PET-WS mat. Both TSSs and E. coli showed a decreasing tendency under a low HLR in phase III, but fluctuated remarkably and increased considerably during phase IV at the outlets of both mats under a high HLR. It can be concluded that the HLR plays an important role in removing pollutants from high-strength CGW through textile-based mats in a biological treatment process. Hoffmann et al. [48] reported in their study that the HLR can be increased when the GW organic loading is low. They also suggested that a lower HLR is needed to achieve better treatment performance for treating GW with a higher organic load.

3.4.3. NH4-N, NO3-N, TN, and TP Concentrations

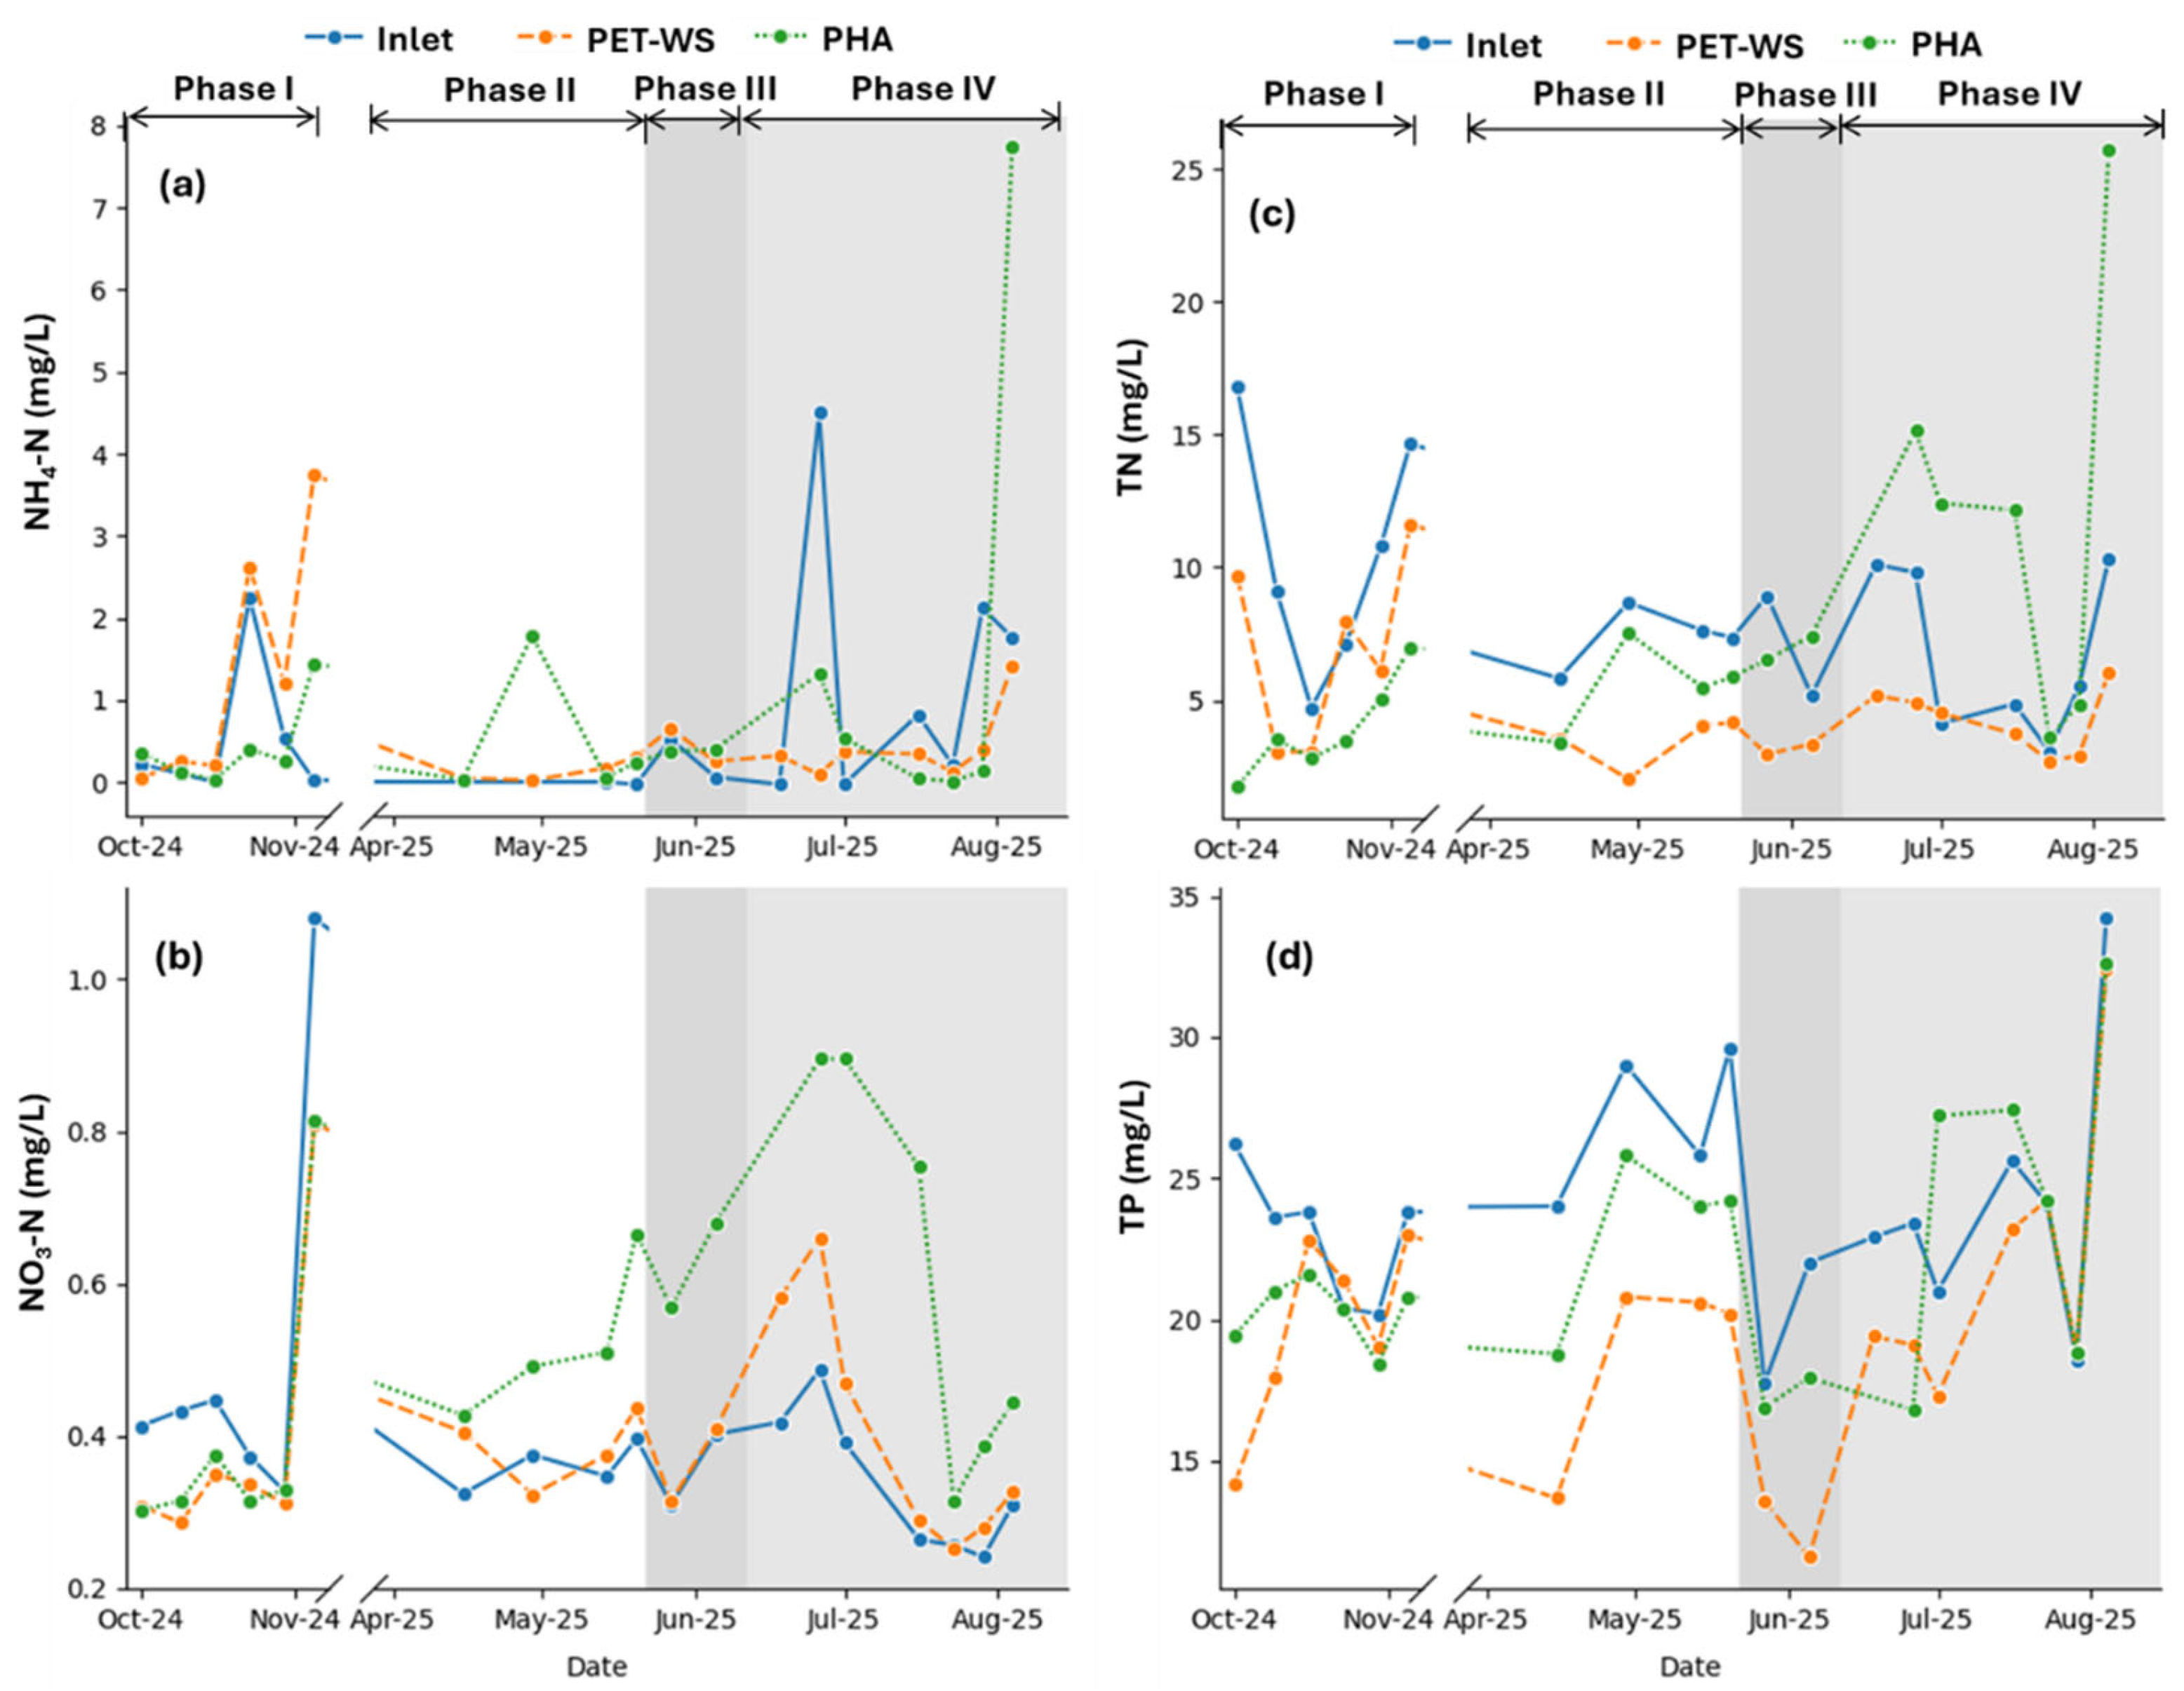
Figure 10 shows the dynamics of the concentrations of NH4-N, NO3-N, TN, and TP in the inflow and outflows of the PET-WS and PHA mats investigated in the pilot-scale experiment in this study.
No clear trend was evident in the concentrations of NH4-N and NO3-N in either outflow compared to the inflow in this study. However, the relatively higher NO3-N concentrations in the outflows of both the PET-WS and PHA mats during phase IV, with aeration in the inflow and a high HLR, resulted in higher NO3-N concentrations within the mats. In comparison with the inflow, the TN and TP concentrations at the outflow of the PET-WS mat showed a decreasing tendency. When phases I (without aeration) and III (with aeration) were compared, a clear trend of decreasing TN and TP concentrations at the outflow of the PET-WS mat was observed, resulting in higher removal performance with aeration in the inflow GW tank. In experimental phase III, with a low HLR and aeration in the inflow, the mean TN and TP concentrations decreased to 3.3 ± 0.3 mg/L and 12.6 ± 1.4 mg/L, respectively, at the outflow of the PET-WS mat (Figure 10c,d). In phase IV, with a comparatively high HLR, highly fluctuating TN and TP concentrations were observed at the outflow of both mats.
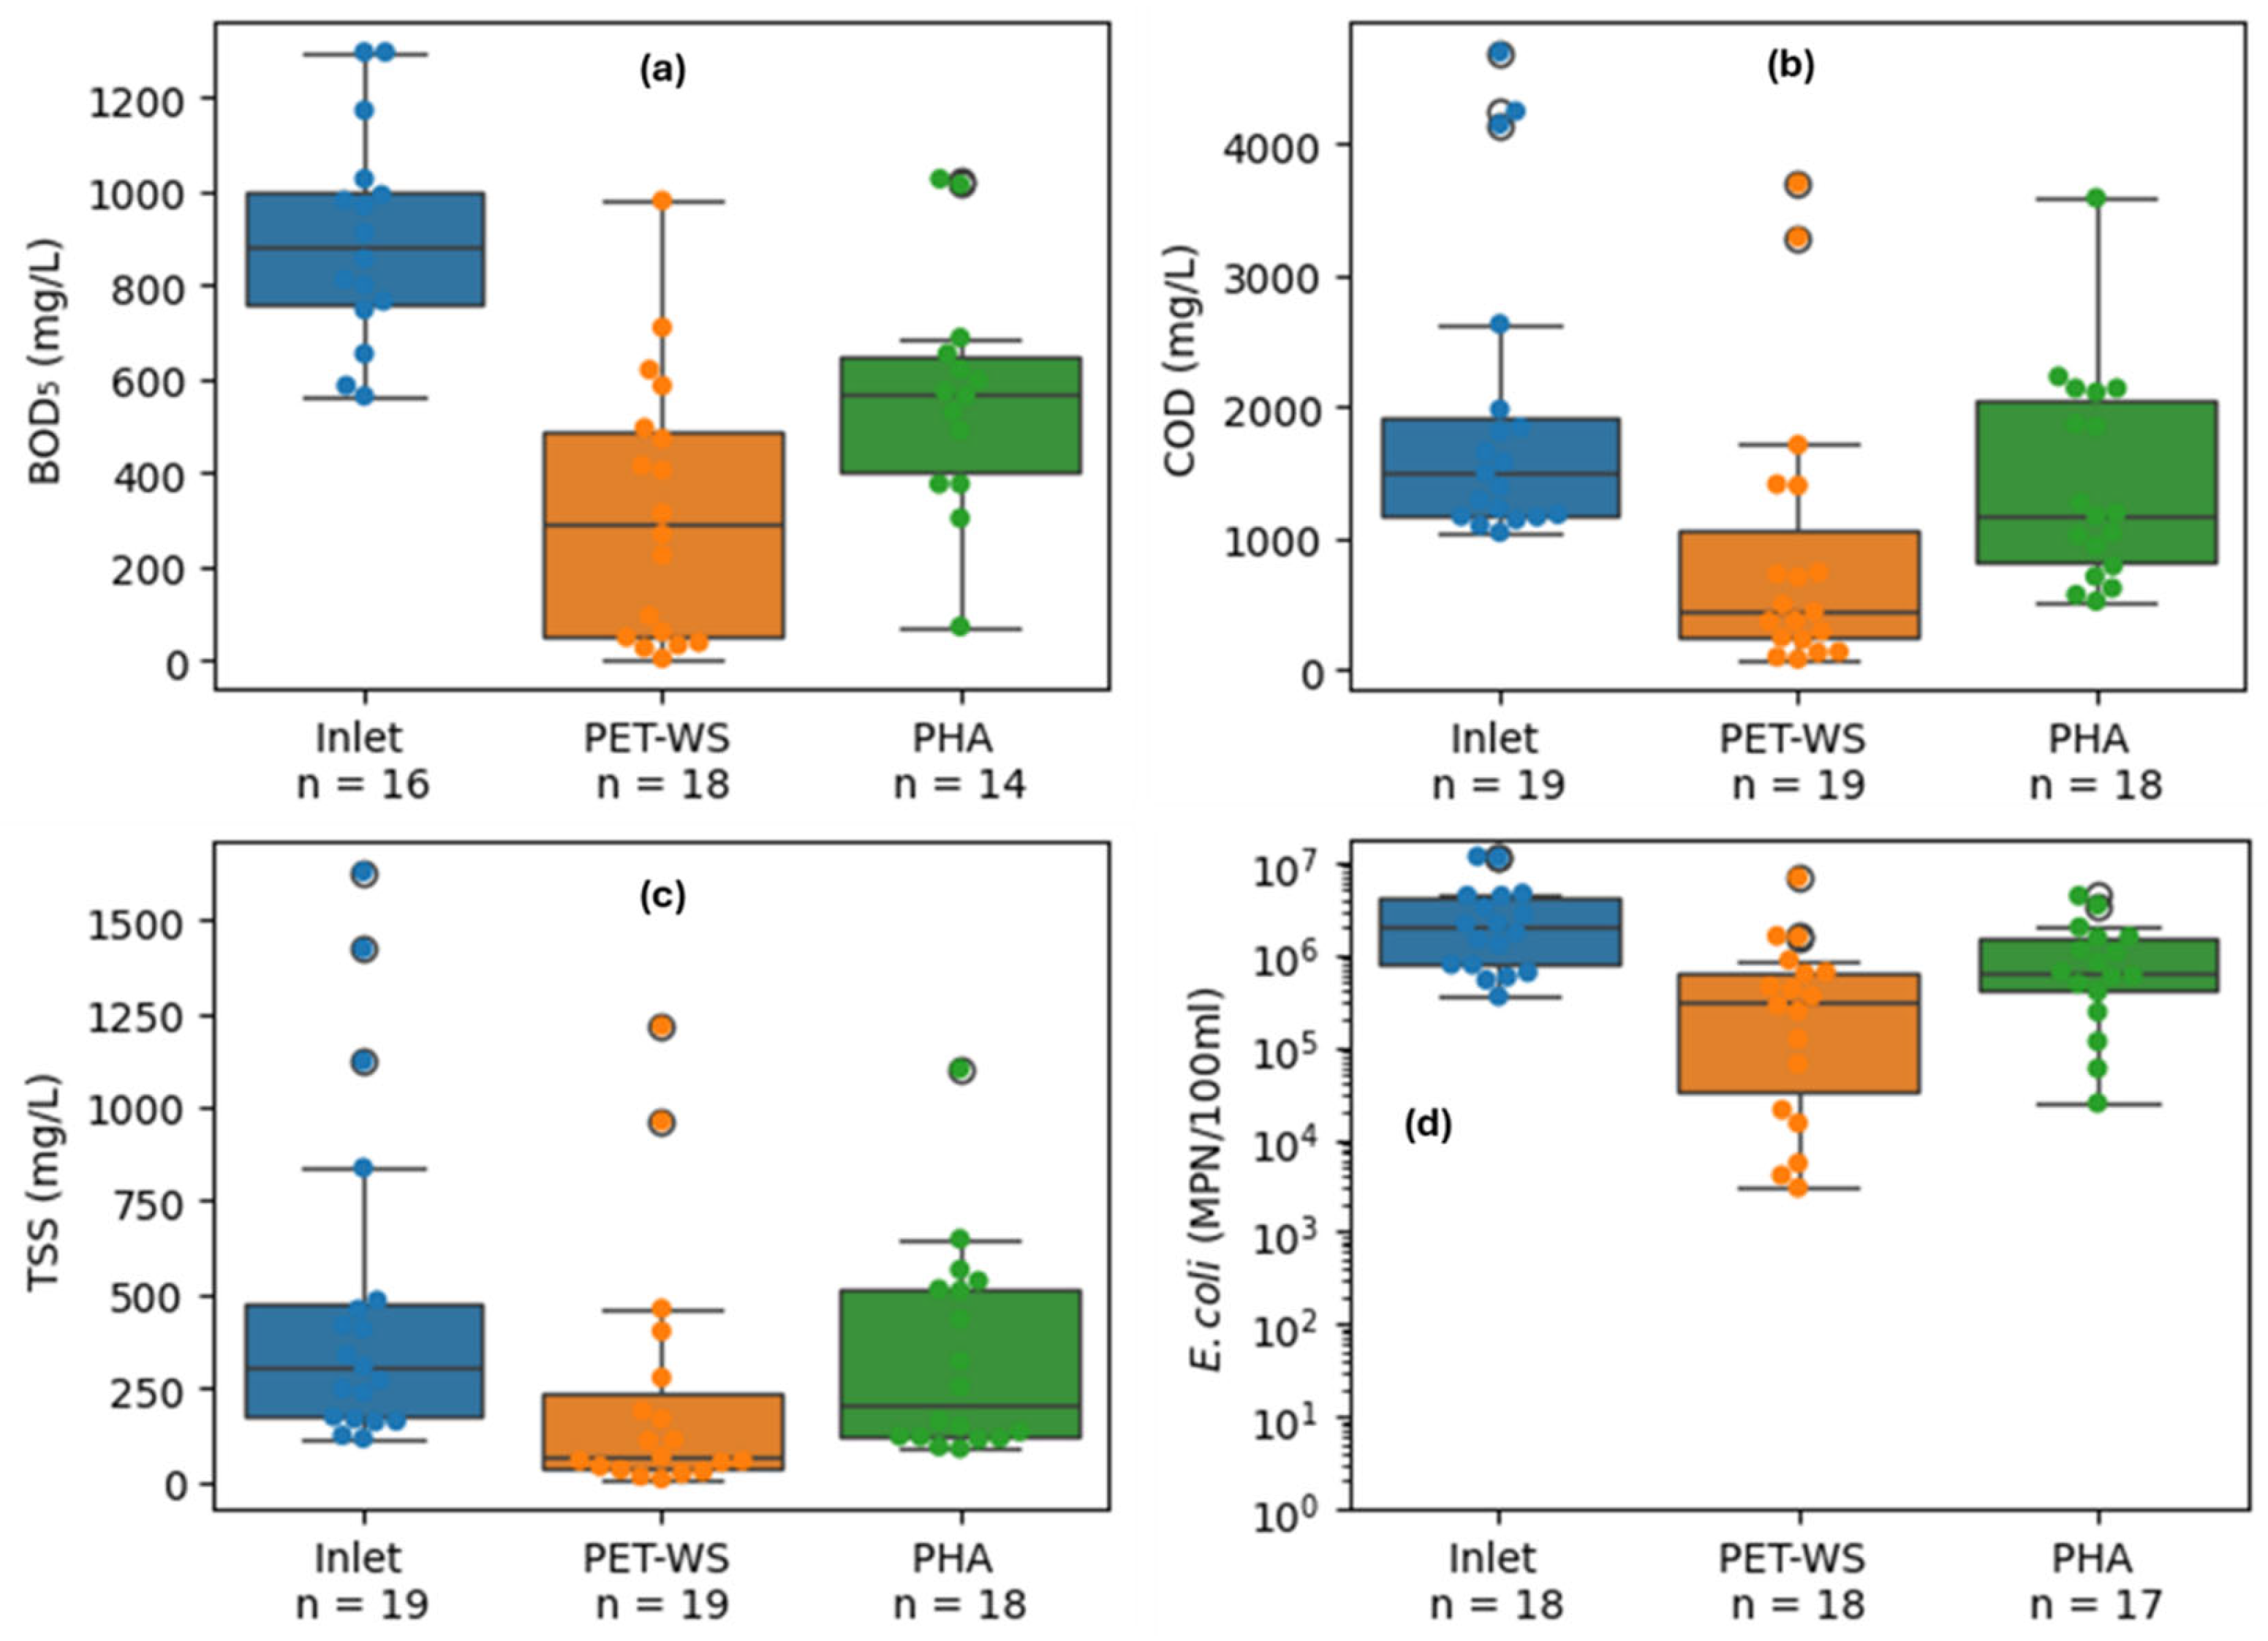
Figure 11 shows boxplots comparing the median values of the BOD5, COD, and TSS concentrations and E. coli counts in the inlet and outlets of the PET-WS and PHA mats, when treating high-strength CGW in this pilot-scale experiment.
The highest median BOD5 concentration, with a value of 834 mg/L, was recorded in the inflow CGW, with a wide range from 564 to 1296 mg/L. This indicated an inconsistent and high organic load, even after pre-treatment. The PET-WS mat demonstrated the lowest median BOD5 concentration of 293 mg/L, with a narrow distribution, and consistently a low BOD5 values at the outflow as compared to the PHA mat. The BOD5 concentration in the outflow of the PHA mat was high at 569 mg/L, with a relatively tight distribution and some values exceeding 1000 mg/L. Similarly, the PET-WS mat had the lowest median COD concentration of 439 mg/L at the outflow, with a few strong outliers. The PHA mat showed a comparatively higher median COD concentration of 1180 mg/L, with minimal outliers in the outflow (Figure 11a,b).
When the TSS concentrations in the inlet and the outlet of the selected mats were compared, the mat with the PET-WS material was found to have the lowest median TSS concentration of 68 mg/L, with a few outliers and a narrow distribution (Figure 11c). In contrast, the mat with the PHA material performed poorly, with a relatively high median TSS concentration of 208 mg/L. Similarly, the results from the E. coli counts demonstrated that the PET-WS mat had the lowest median value of 3.5 x 10⁵ compared to the inflow and outflow of the PHA mat (Figure 11d).
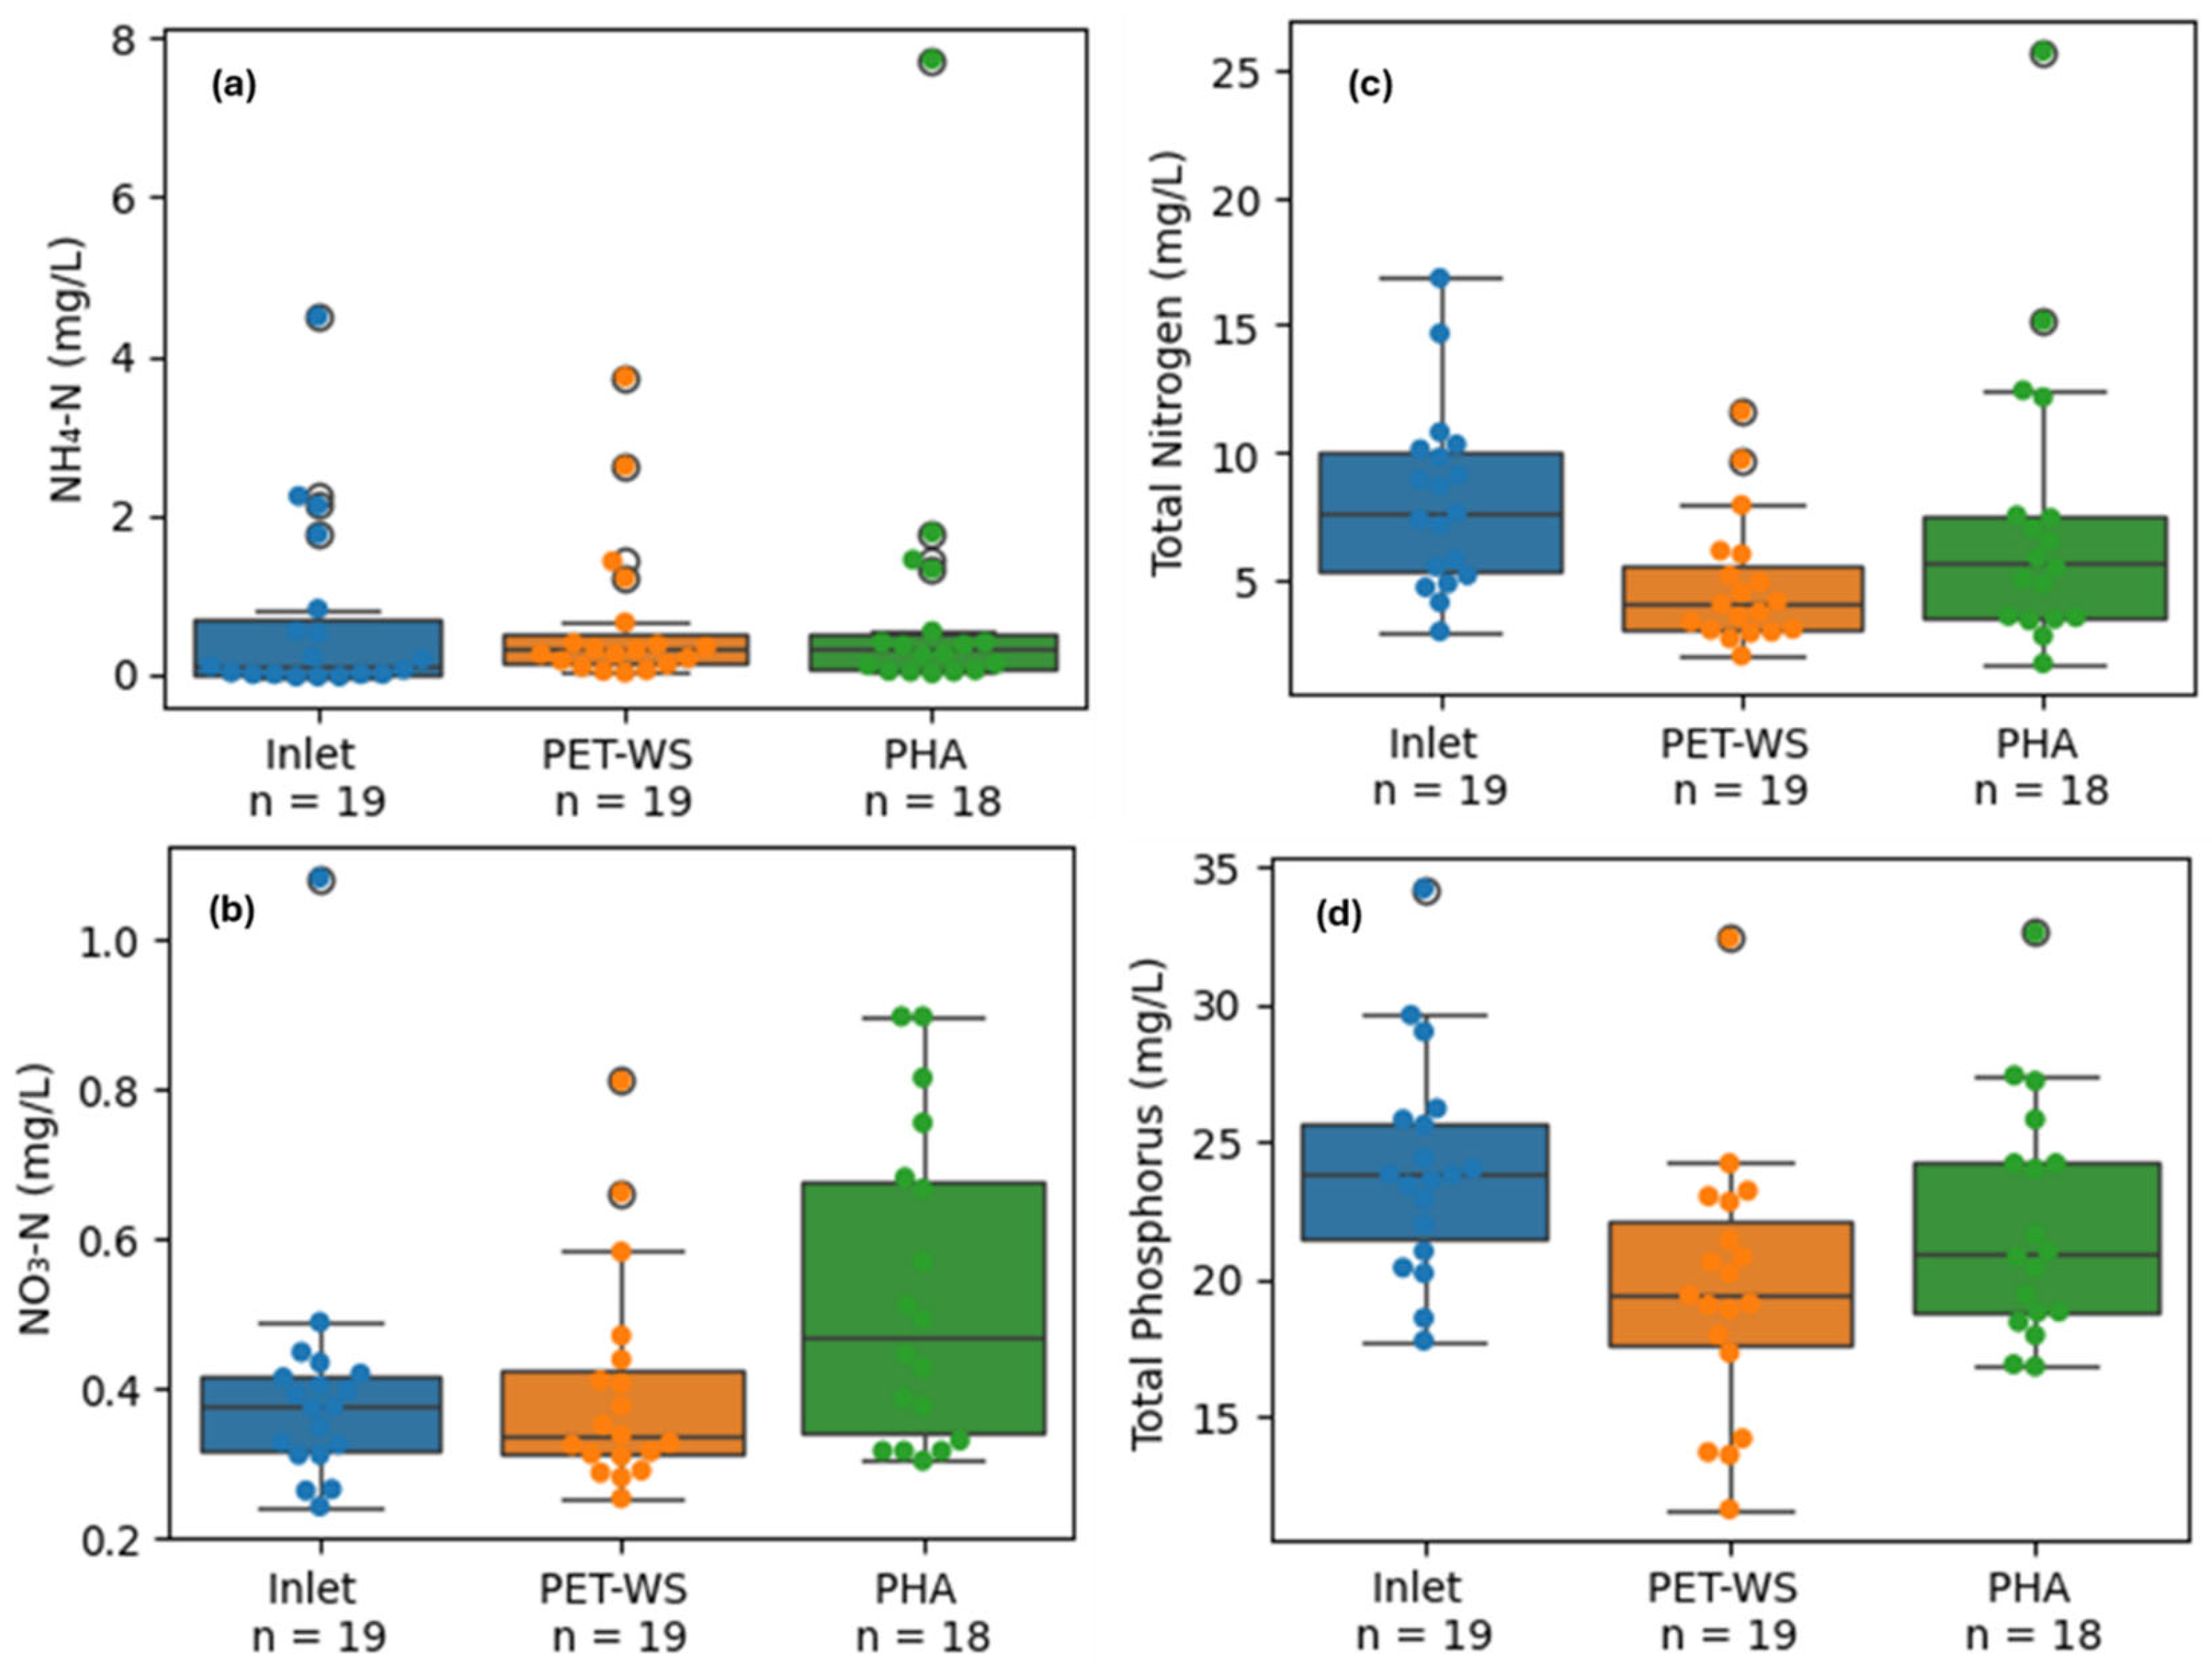
No clear gradient can be seen in the median values of the concentrations of NH4-N and NO3-N at the inflow and outflow of both the PET-WS and PHA mats (Figure 12a,b). The PET-WS mat exhibited the lowest median TN concentration of 4.0 mg/L, with a few outliers, and demonstrated superior treatment performance. In contrast, the outflow from the PHA mat exhibited a moderate median TN concentration of 5.7 mg/L, with a relatively broader distribution and some higher values (Figure 12c). The comparison between the concentration of TP after the PET-WS and PHA mats showed no statistically detectable difference (p > 0.05). The outflow of the PET-WS mat showed a statistically detectable TP reduction (p < 0.05) from the inflow. However, no apparent difference (p > 0.05) was found between the outflow TP concentrations of the PHA mat compared to the inflow in this study.
The overall treatment performance of the PET-WS and PHA mats used in the pilot-scale study for treating high-strength CGW, including the mean concentrations of the parameters at the inlet and outlet and corresponding mean reductions, are shown in Table 5.
The overall treatment performance results shown in Table 5 suggest that the mat with the PET-WS material performed better than the mat with the PHA material when treating CGW in this study. Statistically detectable reductions (p < 0.05) in the concentrations of most parameters were observed at the outflow of the PET-WS mat compared to the inflow, resulting in distinct treatment performance. The mean concentration reductions for BOD5, COD, TN, TU, TSSs and E. coli were 64%, 54%, 39%, 58%, 60% and 1.1 log-removal, respectively.
Throughout the pilot-scale experiment, it was found that easily biodegradable compounds such as BOD5 were apparently reduced (p < 0.05) by 64% through the PET-WS mat, resulting in a mean BOD5 concentration of 323 ± 283 mg/L at the outlet. Similarly, there was a mean COD reduction of 54%, from an initial COD concentration of 1905 ± 1131 mg/L to an effluent concentration of 871 ± 1041 mg/L. However, the BOD5 and COD concentrations in the effluents from both the PET-WS and PHA mats were still very high and recommended for further treatment in order to avoid organic pollution. Arden and Ma [49] suggested that the biodegradable organic compounds could be effectively removed through biological treatment processes. However, operating conditions such as the HLR and the inclusion of aeration in the inflow tank, among other factors, may play a crucial role in the removal of organic content. Nevertheless, the BOD5 and COD values in the pre-treated CGW inflow were much higher than in household GW, as the CGW contained the remaining food waste, oil and fat, and a high number of surfactants from soaps and detergents, as well as potentially low volumes of water in washing basins and dishwashers. Rahman et al. [37] investigated the performance of a pilot wetland roof for treating GW from a household and found that pre-treating the GW improved the water quality at the outlet. In the current study, however, even after pre-treatment in the grease separator chamber and active aeration in the inflow feeding tank, the water quality of the CGW was too poor for biological treatment through both the mats. Therefore, the water quality of the outflow at both outlets was not impressive.
The PET-WS mat showed a higher treatment performance than the mat with PHA material under the tested conditions, with comparatively higher mean concentration reductions in TN (>39%), TP (>18%) and TSS (>60%). However, relatively low phosphorus removal efficiencies were observed, suggesting that the tested textile mats have a low phosphate retention capacity. This could be due to a number of potential factors, such as the limited availability of reactive adsorption sites in the polymeric materials under investigation and the inherent limitations of polymer-based media for phosphorus adsorption compared to mineral sorbents. However, no dominant factor can be identified from the available data unless experimentally confirmed. Incorporating reactive amendments or mineral additives (e.g., metal oxides or calcium- or iron-rich materials) could enhance phosphorus removal efficiencies.
Statistically detectable differences (p < 0.05) were found in the pH, Eh, and TU measurements observed when comparing the inlet and outlet samples of the experimental mats. However, there were no remarkable differences (p > 0.05) in the pH, Eh, and DO concentration at the outflow of the two mats. The mean pH values fell within the range (5.8–9.5) set in some countries for reuse in urban areas for non-potable reuse purposes [6]. EC values from the outlets of both mats were higher than that of the mean inflow value (2161 ± 869 μS/cm). The EC value is a common salinity indicator, and the high EC values from both the PET-WS and PHA mats may be influenced by the various ions present in their materials, thereby increasing the EC values at the outlets [50].
Relatively high DO concentrations prevailed in the PET-WS mat, with mean DO concentrations of 3.7 ± 3.2 mg/L and redox (Eh) values of 4.6 ± 135 mV. This was compared to the inflow and outflow of the PHA mat (Table 5). Apparent changes (p < 0.05) in E. coli removal of were observed between the two mats at the outflow samples. The low removal of E. coli, with only 1.1 and 0.5 log-unit values at the outlet of PET-WS and PHA, respectively, suggested that further polishing of the treated water was required in terms of pathogen removal.
In general, the pilot-scale effluent still contained high concentrations of BOD5, COD, TSS, and E. coli. However, the treated effluent was considered for discharge and not evaluated against specific reuse standards. The overall objective was to demonstrate the feasibility of using textile mats (without plants) as filters for substances contained in GW, as a step toward developing a functional bio-based rooftop biofilter. Additional post-treatment investigations, as well as compliance with relevant reuse standards, would be required before evaluating the suitability of the effluent, specifically because BOD5, COD, TSS, and E. coli remain the main limiting parameters before any potential non-potable reuse application.
Possible pollutant removal pathways through the textile-based water-storage mats can be enlisted as (i) biofilm formation and microbial attachment on textile fibers, (ii) filtration, adsorption and sedimentation, (iii) oxidation/reduction, and (iv) nitrification/denitrification; additionally, the factors influencing treatment processes can be enlisted as (i) textile morphology and pore structure, (ii) oxygen availability and transfer limitations within the mat layers, (iii) hydraulic loading conditions and interactions between flow dynamics, etc. However, no dominant pathway can be identified from the available data, and the abovementioned mechanisms are only potential explanations rather than confirmed pathways.
Nevertheless, the PHA mat showed signs of surface degradation (specifically around the inflow zone and surroundings) during the middle of the pilot-scale experiment, which reduced its treatment performance day by day. This degradation may have limited the lifetime of the PHA material, potentially affecting its stability and overall treatment performance, as well as its cost, counteracting the benefits of its use as a roof biofilter.

3.5. Impact of Outdoor Weather on Water Loss from the Mats

Based on the outdoor weather conditions throughout the pilot-scale experiment, the total water loss from the mats was calculated under spring weather conditions from April to June 2025, with an average air temperature of 16 ± 4 °C and an RH of 73 ± 11%. Figure 13 shows the detailed results of the weather conditions and the corresponding water loss due to EV from the mats, taking into account inflow, outflow and rainfall.
The results showed that, under spring weather conditions, a total of 703 L of water was lost (a 32% loss) from the PET-WS mat, corresponding to a mean daily water loss of 9.1 L/d, i.e., almost 4.3 L/ (m2 × d). In contrast, a total amount of 718 L of water was lost (34% loss) from the PHA mat, resulting in a mean daily water loss of 9.3 L/d, i.e., ca. 4.4 L/ (m2 × d). In terms of daily water loss, both the PET-WS and PHA mats performed similarly, with nearly the same amount of water evaporating daily during this phase of the study. The PET-WS material, which has a higher water storage capacity than the PHA material, showed slightly higher runoff under the same climatic conditions. However, after this time period, naturally growing vegetation emerged and densely covered the bottom-half part of the PET-WS mat, so the influence of vegetation on water loss by ET, meaning EV from the mat, as well as the transpiration, was not investigated. In a previous study, Rahman et al. [35] reported a mean water loss of 8.2–13 L/ (m2 × d) on a daily basis by using such lightweight, textile-based mats to treat pre-treated municipal wastewater under outdoor conditions at a mean air temperature of 17.1 ± 4.6 °C with an RH of 73.6 ± 12.6%. Zehnsdorf et al. [51] suggested that greater daily water loss could lead to more effective cooling of buildings, because an increased amount of heat would be dispersed by the planted or wetland roof systems as moisture.
Daily air temperature and relative humidity can potentially influence natural vegetation growth and plant photosynthesis, as well as improve treated water quality due to higher microbial activity [35]. However, the plants emerged at the very end of the end of this investigation (Figure 4c), so their presence is not a likely reason for the improved effluent quality at the outlet of the PET-WS mat. Due to the PET-WS mat’s high water storage capacity, water was always visible at the outlet, even on days with temperatures that were relatively high in summer, as the mat did not dry out. Nevertheless, no remarkable vegetation growth was observed on the surface of the PHA mat, only a few small seedlings, which died very quickly. This may have been due to more strongly reducing condition prevailing in the PHA mat throughout the entire pilot-scale experiment, or it may have been due to the material itself not facilitating natural plant growth.
Nevertheless, operating under outdoor conditions introduces uncertainties relating to rainfall, EV, and water balance measurements. Rainfall can affect dilution, hydraulic loading, solid mobilization, and effluent volumes. When estimating water losses, the uncertainties associated with inflow, outflow, precipitation, and outflow measurements must be considered. Furthermore, future research work should investigate the potential effects of spontaneous vegetation growth on EV and effluent water quality.

3.6. Comparing Lab-Scale and Pilot-Scale Results

The experimental results from both the laboratory- and pilot-scale experiments showed differences in treatment performance. The sample mats used in the lab-scale experiment performed better than when scaled up for the pilot-scale experiment. The PET-WS mat performed substantially better at the lab-scale than at pilot-scale.
In general, this study involved operating the lab-scale systems under optimized and controlled conditions, whereas the pilot-scale system was subjected to more realistic and variable field conditions. The lower treatment performance observed at the pilot scale compared with the lab scale is likely due to the combined influence of hydraulic, environmental, and operational factors. Unlike the controlled laboratory conditions, the pilot-scale system was exposed to a fluctuating influent composition, variable climatic conditions, and non-uniform flow distribution. The differences in mat installation (flat in the lab-scale versus inclined in the pilot-scale experiment) and flow distribution and an increased hydraulic loading rate (HLR), as well as the potential preferential flow paths, may have reduced the GW retention time within the mats, thereby reducing contact between pollutants, biofilm, and textile media. Long-term operation may have promoted solid accumulation, partial clogging, and material aging, all of which can negatively affect hydraulic conductivity and, consequently, treatment efficiency. Periodic shutdowns for operations and maintenance may have affected biofilm stability and microbial activity, as well as potentially influencing the structural and hydraulic properties of the mats during the pilot-scale experiment. Therefore, the reduced performance after system upscaling likely reflects the complexity of real operating conditions compared with the controlled laboratory conditions of this study.

3.7. PET-WS vs. PHA Mats: Sustainability Assessment

When comparing the sustainability of the PET-WS and PHA mats, treatment efficiency should be considered alongside material durability, lifetime, environmental persistence, recyclability, and potential environmental impact. While the PHA mat showed potential as a biodegradable alternative, its long-term structural stability under biologically active GW treatment conditions is uncertain and requires further investigation. Depending on the application context, the biodegradability of the PHA material may represent both an advantage and a limitation. Although biodegradability reduces long-term environmental persistence, it can also compromise structural stability and operational lifetime in biologically active conditions. While the PET-WS mat showed superior treatment performance and mechanical stability, the use of PET as a synthetic polymer comes with trade-offs, including long-term environmental persistence, the potential release of synthetic fibers or microplastics during long-term operation under high UV exposure on a roof or aging, end-of-life management considerations, and challenges in material recovery and recyclability. The balance between durability and environmental impact must also be considered. This trade-off and durability optimization should also be considered as an important area for future investigations.

3.8. Recommendations for Optimizations

The following recommendations can be made for further optimization of such lightweight water-storage mats when treating high-strength CGW:
(1)
Even after grease separation, a further pre-treatment step is necessary, such as flowing the CGW through a roughing filter containing expanded clay or a similar coarse material.
(2)
Regardless of the flow type (intermittent or continuous), a relatively low HLR and active aeration in the inflow tank are highly recommended. A higher HLR is a limiting factor for achieving higher treatment performance and causes the filtering mats to clog faster than expected.
(3)
Storage time may potentially impact the water quality of the pre-treated GW, so it is recommended that the pre-treated GW is not stored in either the storage tank or the inflow feeding tank without active aeration for more than 48 h to avoid a decline in water quality (e.g., a potential pH shift and depleted DO level turn the water anaerobic, produce foul odors, and cause rapid microbial growth by increasing pathogen levels, etc.). Filling the inflow feeding tank on a daily basis, as well as the supply of aeration, is highly recommended to improve operations and maintenance, and to enhance the performance of the GW treatment through the filtering mats.
(4)
The bio-based PHA material should undergo further engineering or modification to increase its stability, improve its resistance to microbial degradation, and extend its service lifetime. Without further modifications, the PHA material is simply not suitable for treating this type of high-strength GW.
(5)
After the biological treatment of high-strength GW using water-storage mats, tertiary treatment (post-treatment) is necessary before the treated effluent can be considered for non-potable reuse applications, such as toilet flushing and agricultural irrigation, provided there is compliance with relevant reuse regulations or specific reuse/discharge criteria, specifically regarding the concentrations of the main limiting parameters, BOD5, COD, TSS, and E. coli, in the effluent.
(6)
Potential post-treatment steps can be recommended, such as slow sand filtration, disinfection units (ozonation and ultraviolet radiation), activated carbon filtration, etc.

3.9. Limitations of the Study

This study is a part of a research project focused on the development of an innovative bio-based roof biofilter. The research presented here represents the final step of a complex development process. This process began with the selection and customization of components, continued with the development of a process for converting the material into a nonwoven fabric—a procedure that had never been attempted before and required improvements in numerous test runs—and culminated in the production of the final bio-based mat. The mat was then evaluated for its GW treatment performance under harsh conditions, as well as its stability in real-world conditions. Due to the project’s application-oriented focus, this study has certain limitations, which are explicitly acknowledged. The following key limitations have been identified and should be taken into account for future investigations:
(1)
The treated effluent was not evaluated against specific reuse standards as this was not the aim of the project. The feasibility of reuse depends on compliance with application-specific microbial and physicochemical criteria (e.g., limits for BOD5, COD, TSS, nutrients, salinity, pathogens) according to specific regulatory standards. Such compliance assessments would be necessary before implementation in any potential reuse applications in follow-up development stages.
(2)
Quantification of FOG, surfactants, TOC, and detergent-related indicators, all of which are highly relevant for characterizing canteen/kitchen greywater, should be carried out in future studies. There should be a focus on measuring these parameters to improve our understanding of the performance of the pilot system in treating CGW.
(3)
Pilot replication would show the reproducibility of the results. Unfortunately, this was not possible in our study, as no independent biological or technical replicates were available for the pilot phase. Furthermore, this study used a single GW source and collected grab samples, as well as taking a limited number of samples in some phases and lacking controls. Therefore, applying ANOVA to the data may have led to an overestimation of statistical confidence if the temporal measurements were treated as independent replicates. Future studies should include independent replicates of the materials used and the presence of controls.
(4)
Several operational parameters, including the flow regime, HLR, aeration mode, seasonal environmental conditions, temperature, biofilm maturation, and potential material aging, varied concurrently during the pilot-scale operation. Consequently, the individual contribution of each factor to treatment performance could not be quantitatively distinguished. As these factors could not be fully decoupled from the effect of the carrier mat material, the observed performance differences should be interpreted as the combined outcome of material properties and operational conditions.
(5)
The absence of a factorial experimental design, sensitivity analysis, and multivariable statistical evaluation limits causal interpretation of the observed results. Therefore, the reported treatment performance should be interpreted as the integrated response of the system under real-world operating conditions rather than the effect of any single operational variable.
(6)
The analysis is limited to concentration reductions (influent and effluent water quality monitoring) rather than mechanistic mass fluxes. The absence of a complete mass balance restricts the mechanistic interpretation of nutrient (N and P) and organic matter removal pathways. Including a full set of measurements for mass balance calculations (e.g., flow quantification, solid accumulation, and elemental partitioning) in order to identify the dominant removal pathways is an important direction for further investigation.
(7)
Material characterization and analyses, such as SEM imaging, porosity determination, permeability measurements, and biofilm characterization, would bring more valuable information. Additionally, key hydraulic parameters and other important factors are missing, including effective hydraulic retention time, effective water-holding volume, exact effective area measurements for HLR calculations, flow recovery, drainage behavior, flow distribution across the mats, pump calibration procedures, detailed sampling strategy, analytical uncertainty, and pre-washing/conditioning of the mats prior to operation. This information would provide valuable insight into the mechanisms involved and could strengthen our understanding of the relationship between textile structure, hydraulic properties, and treatment performance. Detailed hydraulic investigations (e.g., tracer tests, flow distribution analysis, and wetting profile assessments) and hydraulic characterization, including the evaluation of preferential flow paths, short-circuiting, dry zones, and wetting uniformity, would further improve our understanding of system performance. This is highlighted as vital research work in the future.
(8)
More advanced statistical analyses, including normality and homoscedasticity assessments, confidence interval estimation, correlation and multivariate analyses, regression modeling, and more advanced temporal analyses (e.g., mixed-effects or time-series models), would provide further insights into the dataset and are identified as a major area for future research.
(9)
Analyzing the quality of the influent GW before and after the grease separator, as well as the isolated impact of storage duration, would provide detailed information on pre-treatment. Therefore, systematic monitoring and influent quality analysis are necessary in future research to evaluate the impact of pre-treatment and extended storage time on BOD5, COD, DO, pH, TSS, FOG, and microbial indicators.
(10)
Quantitative characterization of the PHA mat’s surface degradation, such as mass loss measurements, thickness variation, tensile strength retention, porosity changes, and microscopic analysis, should be studied in more detail in the future. Similarly, the PET-WS mat lacks information on long-term durability, UV exposure, biofouling, thermal stress, mechanical stability, possible fiber release, and microplastic-related concerns in this stage.
All of this missing information has been identified as essential future work.

4. Conclusions

The primary aims of this study were to compare the specific performance parameters of selected sample mats made from different nonwoven textile fabrics, and to assess their effectiveness in treating high-strength CGW through laboratory- and pilot-scale experiments.
The results showed that the polyethylene terephthalate (PET)-based nonwoven fabric mats (PET-N and PET-WS mats) had the highest water storage capacity and retained more water within the mats, exhibiting greater resistance to drying out (lower EV capacity) than other mats made of polylactide spunbonded fabric (PLA) and polyhydroxyalkanoate-based spunbonded nonwoven fabric (PHA) materials under outside conditions. The PHA material, which is part of the biodegradable polymer family, had a lower water storage capacity and released absorbed water more readily, while the other materials had a higher water retention capacity.
Results from the lab-scale experiment showed that the PET-WS mat was the most effective at treating high-strength CGW, compared to the other three materials: PLA, PET-N, and PHA.
Similarly, the results from the pilot-scale experiment indicated that the PET hydroentangled nonwoven fabric (PET-WS) mat performed more efficiently in terms of treatment than the polyhydroxyalkanoates spunbonded nonwoven fabric (PHA) mat when treating the same CGW under outdoor climatic conditions. However, the PET-WS effluent still contained high concentrations of BOD5, COD, TSS, and E. coli. Therefore, at its current stage of development, the PET-WS mat can be considered as an effective biofiltration or intermediate treatment step rather than a standalone solution, as it requires improved pre-treatment and additional post-treatment to further reduce organic matter and pathogen concentrations.
The HLR plays an important role in removing pollutants from high-strength CGW through the water-storage mats in the biofiltration process. If the CGW has a high organic load, it is recommended that a lower HLR is used to improve treatment performance.
The PET-WS material, which has a higher water storage capacity than the PHA material, showed a slightly higher outflow rate, i.e., it lost less water through EV under outdoor conditions. However, future investigations should consider comparing water loss in the presence and absence of naturally growing vegetation along the filter mats.
During the middle phase of the pilot-scale experiment, the innovative, bio-based PHA material showed signs of surface degradation on its surface and lower treatment performance than the PET-WS mat. This degradation may limit the lifetime of the PHA material, potentially affecting its stability and overall performance when used as a roof biofilter for treating GW, as well as its cost.
The results of this study demonstrate the specific properties and performance of lightweight, water-storage mats for treating high-strength GW, as well as their potential for optimization and further improvement. However, the specific parameters reported (such as BOD5, COD, TSS, nutrients, pathogens, and other water quality parameters) are presented as indicators of treatment performance and process efficiency. To achieve high- quality treated effluent for non-potable reuse purposes, such as toilet flushing, crop irrigation and gardening in water-scarce regions, optimizing operating conditions, implementing additional post-treatment steps, and complying with relevant reuse standards are highly recommended. Specifically, the concentrations of BOD5, COD, TSS, and E. coli remain the main limiting parameters before any potential non-potable reuse application.
Further research involving real GW from a household with a low organic load, as well as long-term experiments with such lightweight mats, is essential in order to address the limitations of this study with regard to high-strength GW from a canteen. Future research work should also focus on meeting relevant local and international standards and application-specific regulatory requirements, in order to ensure that the treated effluent is suitable for reuse or discharge criteria prior to practical implementation. Factorial experimental designs and advanced statistical analyses are also required to identify and quantify the relative importance of individual operational factors, such as flow regime, HLR, aeration strategy, and seasonal conditions.
Overall, this study demonstrated effective processes for removing conventional pollutants from high-strength GW using mats made of various engineered materials, and compared their treatment performances. The study also examined the stability (visually) of such lightweight mats made of nonwoven textile fabrics during the treatment process, and provided recommendations for achieving high-quality treated effluent. These findings could inform future studies on long-term durability testing, clogging risk analysis, economic analysis, energy consumption assessment, life-cycle assessment, maintenance requirements, and long-term microbial stability investigations. All of these important aspects should be considered before using such lightweight mats for decentralized GW management on rooftops in urban water infrastructure in densely populated cities, where space is very limited.

Author Contributions

Writing—original draft preparation, K.Z.R.; conceptualization, J.M., M.B., R.A.M. and L.M.; methodology, K.Z.R., M.B., L.M. and J.M.; investigation, K.B., E.E. and K.Z.R.; resources, K.B., L.M. and R.A.M.; software, E.E. and K.Z.R.; formal analysis, K.Z.R. and E.E.; data curation, E.E., K.B. and K.Z.R.; supervision, L.M.; visualization, L.M. and K.Z.R.; writing—review and editing, J.M., L.M., E.E. and K.Z.R.; project administration, L.M., J.M., M.B. and R.A.M.; funding acquisition, L.M., M.B. and J.M. All authors have read and agreed to the published version of the manuscript.

Funding

This research received partial financially support from the joint research project “Development and optimization of an innovative roof biofilter—Dachbiofilter” (funding code: KK5081716BA3). This project was funded by the German Federal Ministry for Economic Affairs and Climate Action (BMWK), following a decision of the German Bundestag (Federal Parliament), under the funding program “Central Innovation Program for SMEs (ZIM)”.

Institutional Review Board Statement

Not applicable.

Informed Consent Statement

Not applicable.

Data Availability Statement

The corresponding author will provide all the data presented in this study on request.

Acknowledgments

The authors gratefully acknowledge the valuable cooperation and support provided by the Helmholtz Center for Environmental Research (UFZ), Leipzig, in the areas of system construction and operation, laboratory chemical analysis (Grit Weichert), and data management (Jagdish Manohar Sawlani). This study was conducted as a part of the Integrated Platform Project “Technologies for Water and Heat Management in Urban Space (CityTech)” at the Helmholtz Center for Environmental Research (UFZ), Leipzig. The authors also sincerely thank AiF-Projekt GmbH, Berlin, the sponsor of the joint research project, for coordination and supervision of the “Dachbiofilter” research project.

Conflicts of Interest

Michael Blumberg was employed by the Blumberg Engineers. The remaining authors declare that the research was conducted in the absence of any commercial or financial relationships that could be construed as a potential conflict of interest.

References

  1. FAO. Progress on Level of Water Stress—Global Status and Acceleration Needs for SDG Indicator 6.4.2; FAO: Rome, Italy, 2021. [Google Scholar]
  2. Spychala, M.; Niec, J.; Zawadzki, P.; Matz, R.; Nguyen, T.H. Removal of volatile solids from greywater using sand filters. Appl. Sci. 2019, 770, 2–13. [Google Scholar]
  3. Shi, K.; Wang, C.; Jiang, S. Qualitative microbial risk assessment of greywater on-site reuse. Sci. Total Environ. 2018, 635, 1507–1519. [Google Scholar] [PubMed]
  4. Tapia, N.; Gallardo-Bustos, C.; Rojas, C.; Vargas, I.T. Long-term evaluation of soil-based bioelectrochemical green roof systems for greywater treatment. J. Environ. Manag. 2024, 370, 122643. [Google Scholar]
  5. Nguyen, H.T.; Tran, C.N. The study for greywater treatment by local materials for reuse in scarcity areas. J. Ecol. Eng. 2025, 26, 157–169. [Google Scholar] [CrossRef] [PubMed]
  6. Khajvand, M.; Mostafazadeh, A.K.; Drogui, P.; Tyagi, R.D.; Brien, E. Greywater characteristics, impacts, treatment, and reclamation using adsorption processes towards the circular economy. Environ. Sci. Pollut. Control Ser. 2022, 29, 10966–11003. [Google Scholar] [CrossRef] [PubMed]
  7. Van de Walle, A.; Kim, M.; Alam, M.K.; Wang, X.; Wu, D.; Dash, S.R.; Kim, J. Greywater reuse as a key enabler for improving urban wastewater management. Environ. Sci. Ecotechnol. 2023, 16, 100277. [Google Scholar] [CrossRef] [PubMed]
  8. Li, F. Treatment of Household Grey Water for Non-Potable Reuses. Ph.D. Thesis, Hamburg University of Technology, Hamburg, Germany, 2009. [Google Scholar]
  9. Gurd, C.; Jefferson, B.; Villa, R. Characterisation of food service establishment wastewater and its implication for treatment. J. Environ. Manag. 2019, 252, 109657. [Google Scholar] [CrossRef]
  10. Friedler, E. Quality of individual domestic greywater streams and its implication for on-site treatment and reuse possibilities. Environ. Technol. 2004, 25, 997–1008. [Google Scholar] [CrossRef] [PubMed]
  11. Chrispim, M.C.; Nolasco, M.A. Greywater treatment using a moving bed biofilm reactor at a university campus in Brazil. J. Clean. Prod. 2017, 142, 290–296. [Google Scholar] [CrossRef]
  12. Travis, M.J.; Weisbrod, N.; Gross, A. Accumulation of oil and grease in soils irrigated with greywater and their potential role in soil water repellency. Sci. Total Environ. 2008, 394, 68e74. [Google Scholar] [CrossRef] [PubMed]
  13. Patil, P.D.; Bhange, V.P.; Shende, S.S.; Ghorpade, P.S. Greywater characterisation of an Indian household and potential treatment for reuse. Water-Energy Nexus 2022, 5, 1–7. [Google Scholar] [CrossRef]
  14. Jardak, K.; Drogui, P.; Daghrir, R. Surfactants in aquatic and terrestrial environment: Occurrence, behavior, and treatment processes. Environ. Sci. Pollut. Res. 2016, 23, 3195–3216. [Google Scholar] [CrossRef] [PubMed]
  15. Reang, S.; Nath, H. Grey water treatment with spiral wound UF and RO membranes. Mater. Today Proc. 2021, 46, 6253–6259. [Google Scholar] [CrossRef]
  16. Tabelini, D.B.; Lima, J.P.P.; Borges, A.C.; Aguiar, A. A review on the characteristics and methods of dairy industry wastewater treatment in the state of Minas Gerais, Brazil. J. Water Process Eng. 2023, 53, 103779. [Google Scholar] [CrossRef]
  17. Elkarrach, K.; Omor, A.; Atia, F.; Laidi, O.; Benlemlih, M.; Merzouki, M. Treatment of tannery effluent by adsorption onto fly ash released from thermal power stations: Characterisation, optimisation, kinetics, and isotherms. Heliyon 2023, 9, 12687. [Google Scholar] [CrossRef] [PubMed]
  18. Jefferson, B.; Laine, A.; Parsons, S.; Stephenson, T.; Judd, S. Technologies for domestic wastewater recycling. Urban Water J. 2000, 1, 285–292. [Google Scholar] [CrossRef]
  19. Nolde, E. Greywater reuse systems for toilet flushing in multi-storey buildings over ten years’ experience in Berlin. Urban Water J. 2000, 1, 275–284. [Google Scholar]
  20. Eriksson, E.; Auffarth, K.; Henze, M.; Ledin, A. Characteristics of grey wastewater. Urban Water 2002, 4, 85–104. [Google Scholar] [CrossRef]
  21. Hourlier, F.; Masse, A.; Jaouen, P.; Lakel, A.; Gerente, C.; Faur, C.; Le Cloirec, P. Formulation of synthetic greywater as an evaluation tool for wastewater recycling technologies. Environ. Technol. 2010, 31, 215–223. [Google Scholar] [CrossRef] [PubMed]
  22. Fowdar, S.; Hatt, B.E.; Breen, P.; Cook, P.L.M.; Deletic, A. Designing living walls for greywater treatment. Water Res. 2017, 110, 218–232. [Google Scholar] [CrossRef] [PubMed]
  23. Masi, F.; Rizzo, A.; Regelsberger, M. The role of constructed wetlands in a new circular economy, resource oriented, and ecosystem services paradigm. J. Environ. Manag. 2018, 216, 275–284. [Google Scholar] [CrossRef]
  24. Boano, F.; Caruso, A.; Costamagna, E.; Ridolfi, L.; Fiore, S.; Demichelis, F.; Masi, F. A review of nature-based solutions for greywater treatment: Applications, hydraulic design, and environmental benefits. Sci. Total Environ. 2020, 711, 134731. [Google Scholar] [CrossRef] [PubMed]
  25. Fikri, E.; Zulkarnain, O.F.; Azizah, R.; Latif, M.T.; Firmansyah, Y.W. The application of membrane bioreactor for greywater treatment. J. Ecol. Eng. 2023, 24, 207–213. [Google Scholar] [CrossRef] [PubMed]
  26. Zipf, M.S.; Pinheiro, I.G.; Conegero, M.G. Simplified greywater treatment systems: Slow filters of sand and slate waste followed by granular activated carbon. J. Environ. Manag. 2016, 176, 119–127. [Google Scholar] [CrossRef] [PubMed]
  27. Wooster, E.I.F.; Fleck, R.; Torpy, F.; Ramp, D.; Irga, P.J. Urban green roofs promote metropolitan biodiversity: A comparative case study. Build. Environ. 2022, 207, 108458. [Google Scholar] [CrossRef]
  28. Green Roof Guidelines—Guidelines for the Planning, Construction and Maintenance of Green Roofs. Issue 2018, DIN A 4 Brochure, 150p. Available online: https://shop.fll.de/en/fll-english-publications/green-roof-guidelines-2018-download.html (accessed on 30 April 2026).
  29. Mihalakakou, G.; Souliotis, M.; Papadaki, M.; Menounou, P.; Dimopoulos, P.; Kolokotsa, D.; Paravantis, J.A.; Tsangrassoulis, A.; Panaras, G.; Giannakopoulos, E.; et al. Green roofs as a nature-based solution for improving urban sustainability: Progress and perspectives. Renew. Sustain. Energy Rev. 2023, 180, 113306. [Google Scholar] [CrossRef]
  30. Kader, S.; Chadalavada, S.; Jaufer, L.; Spalevic, V.; Dudic, B. Green roof substrates—A literature review. Front. Built Environ. 2022, 8, 1019362. [Google Scholar] [CrossRef]
  31. Loh, Z.Z.; Zaidi, N.S.; Syafiuddin, A.; Yong, E.L.; Boopathy, R.; Hong Kueh, A.B.; Prastyo, D.D. Shifting from conventional to organic filter media in wastewater biofiltration treatment: A review. Appl. Sci. 2021, 11, 8650. [Google Scholar] [CrossRef]
  32. Nabaterega, R.; Vesuwe, R.N.; Iorhemen, O.T. Statistical evaluation of different filter media and application of multiple criteria analysis to select the best media for pollutants removal in wastewater biofiltration: A review. Sci. Total Environ. 2025, 996, 180104. [Google Scholar] [CrossRef] [PubMed]
  33. Narkhede, H.I.; Handore, A.V.; Deokar, B.K.; Kardile, D.S.; Surana, A.R. Cocopeat Biofilters: A sustainable approach for water purification and nutrient management. Sep. Purif. Technol. 2025, 353, 128558. [Google Scholar]
  34. Hu, D.; Li, X.; Li, L.; Yang, C. Designing high-caliber nonwoven filter mats for coalescence filtration of oil/water emulsions. Sep. Purif. Technol. 2015, 149, 65–73. [Google Scholar]
  35. Rahman, K.Z.; Mählmann, J.; Blumberg, M.; Bernhard, K.; Müller, R.A.; Moeller, L. Performance of Textile-Based Water-Storage Mats in Treating Municipal Wastewater on Urban Rooftops for Climate-Resilient Cities. Clean Technol. 2025, 7, 75. [Google Scholar] [CrossRef]
  36. Zehnsdorf, A.; Willebrand, K.C.U.; Trabitzsch, R.; Knechtel, S.; Blumberg, M.; Muller, R.A. Wetland Roofs as an Attractive Option for Decentralized Water Management and Air Conditioning Enhancement in Growing Cities—A Review. Water 2019, 11, 1845. [Google Scholar] [CrossRef]
  37. Rahman, K.Z.; Chen, X.; Blumberg, M.; Bernhard, K.; Müller, R.A.; Mackenzie, K.; Trabitzsch, R.; Moeller, L. Effect of Hydraulic Loading Rate on Treatment Performance of a Pilot Wetland Roof Treating Greywater from a Household. Water 2023, 15, 3375. [Google Scholar] [CrossRef]
  38. EN ISO 11732; Water Quality—Determination of Ammonium Nitrogen—Method by Flow Analysis (CFA and FIA) and Spectrometric Detection. ISO: London, UK, 2005.
  39. EN ISO 10304-1; Water Quality—Determination of Dissolved Anions by Liquid Chromatography of Ions—Part 1: Determination of Bromide, Chloride, Fluoride, Nitrate, Nitrite, Phosphate and Sulfate. ISO: London, UK, 2007.
  40. EN ISO 15681-1; Water Quality—Determination of Orthophosphate and Total Phosphorus Contents by Flow Analysis (FIA and CFA)—Part 1: Method by Flow Injection Analysis (FIA). ISO: London, UK, 2003.
  41. DIN 38409-1; German Standard Methods for the Examination of Water, Waste Water and Sludge; Parameters Characterizing Effects and Substances (group H); determination of total dry residue, filtrate dry residue and residue on ignition (H 1). DIN Standards Committee Water Practice: Berlin, Germany, 1987.
  42. ISO 9308-2; Water Quality—Enumeration of Escherichia coli and Coliform Bacteria—Part 2: Most Probable Number Method. ISO: London, UK, 2012.
  43. Noah, M. Graywater use Still a Gray Area. J. Environ. Health 2002, 64, 22–25. [Google Scholar] [PubMed]
  44. Ghaitidak, D.M.; Yadav, K.D. Characteristics and treatment of greywater—A review. Environ. Sci. Pollut. Res. 2013, 2795–2809. [Google Scholar] [CrossRef]
  45. Liu, S.; Butler, D.; Memon, F.; Makropoulos, C.; Avery, L.; Jefferson, B. Impacts of residence time during storage on potential of water saving for grey water recycling system. Water Res. 2010, 44, 267–277. [Google Scholar] [CrossRef] [PubMed]
  46. Pelyk, L.V.; Vasylechko, V.O.; Kyrychenko, O.V. Influence of Biodestructors on the Wear Resistance of Polyester Geotextile Materials. Colloids Interfaces 2019, 3, 21. [Google Scholar] [CrossRef]
  47. Touze-Foltza, N.; Bannourc, H.; Barralb, C.; Stoltz, G. A review of the performance of geosynthetics for environmental protection. Geotext. Geomembr. 2016, 44, 656–672. [Google Scholar] [CrossRef]
  48. Hoffmann, H.C.; Platzer, M.; Winker, E.; von Muench, E. Technology Review of Constructed Wetlands—Subsurface Flow Constructed Wetlands for Greywater and Domestic Wastewater Treatment; Deutsche Gesellschaft fur Internationale Zusammenarbeit (GIZ) GmbH: Eschborn, Germany, 2011. [Google Scholar]
  49. Arden, S.; Ma, X. Constructed wetlands for greywater recycle and reuse: A review. Sci. Total Environ. 2018, 630, 587–599. [Google Scholar] [CrossRef] [PubMed]
  50. Abad, M.; Noguera, P.; Puchades, R.; Maquieira, A.; Noguera, V. Physico-chemical and chemical properties of some coconut coir dusts for use as a peat substitute for containerised ornamental plants. Bioresour. Technol. 2002, 82, 241–245. [Google Scholar] [CrossRef] [PubMed]
  51. Zehnsdorf, A.; Blumberg, M.; Muller, R.A. Helophyte mats (wetland roofs) with high evapotranspiration rates as a tool for decentralized rainwater management—Process stability improved by simultaneous greywater treatment. Water Sci. Technol. Water Supply 2019, 19, 808–814. [Google Scholar]
Figure 1. Discharge chamber for the pre-treatment of CGW in the basement of the canteen with access to (a) the grease separator and (b) a storage tank after the grease separator.
Urbansci 10 00361 g001
Figure 2. Lab-scale experiment setup showing (a) all four boxes in operation when treating CGW under controlled conditions, (b) the mat (PET-WS) operating inside the box, as well as the inflow tubing and outflow opening.
Urbansci 10 00361 g002
Figure 3. Schematic diagram of the pilot GW treatment plant showing the pre-treatment and biofiltration process of the CGW using water-storage mats. (A) Plan view and (B) longitudinal view that consists of: (1) canteen building, (2) discharge of GW from the canteen, (3) grease trap unit, (4) storage tank located at the basement of the canteen, (5) pre-treated CGW collection tank (intermediate bulk container—IBC), (6) inflow feeding tank with aeration tubing inside, (7) pitched-roof wooden structure integrated with the mats, (8) tipping counter for outflow quantification and (9) treated GW collection tank (sketch: K.Z.R).
Urbansci 10 00361 g003
Figure 4. Pilot plant integrated a pitched-roof wooden structure together with the mats (PET-WS and PHA), operated under outside conditions at the site: (a) at the beginning of the experiment on 18 September 2024, (b) operating with the CGW as the inflow on 2 May 2025, (c) with the vegetation on mat PET-WS, dated on 29 August 2025.
Urbansci 10 00361 g004
Figure 5. The dynamic reduction in water from the sample mats due to EV, plotted using linear regression lines, as well as their R2 values: (a) the remaining water storage in L/m2 and (b) cumulative water loss after approximately 100 h of drying in hot summer conditions (no sampling at night).
Urbansci 10 00361 g005
Figure 6. Box diagrams showing the variations and median values in the inflow (inlet) and outflow of four mats (PLA, PET-N, PET-WS, and PHA) for the following parameters: (a) BOD5, (b) COD, (c) TSS, and (d) E. coli count; n = number of samples.
Urbansci 10 00361 g006
Figure 7. Box diagrams that show the variations and median values in the inflow (inlet) and outflow of four mats (PLA, PET-N, PET-WS, and PHA) for the concentrations of (a) NH4-N, (b) NO3-N, (c) TN, and (d) TP; n = number of samples.
Urbansci 10 00361 g007
Figure 8. Dynamics (time series) in the inflow and outflow of the PET-WS and PHA mats that were observed for the parameters (a) TU, (b) EC, (c) pH, and (d) DO concentration during the pilot-scale experiment in this study (the grey areas inside the figures show the aeration phases: the dark grey area represents continuous aeration and the light grey area represents intermittent aeration).
Urbansci 10 00361 g008
Figure 9. Dynamic changes observed in the inlet and outlet of the PET-WS and PHA mats for the parameters (a) BOD5, (b) COD, (c) TSSs, and (d) E. coli during the pilot-scale experiment (the grey areas inside the figures show the aeration phases: the dark grey area represents continuous aeration and the light grey area represents intermittent aeration).
Urbansci 10 00361 g009
Figure 10. Dynamic changes in the inflow and outflow of the PET-WS and PHA mats shown for the concentrations of (a) NH4-N, (b) NO3-N, (c) TN, and (d) TP during the pilot test study (the grey areas inside the figures show the aeration phases: the dark grey area represents continuous aeration and the light grey area represents intermittent aeration).
Urbansci 10 00361 g010
Figure 11. Box diagrams showing the variations and median values of the inflow (inlet) and outflow concentration of PET-WS and PHA mats for the parameters (a) BOD5, (b) COD, (c) TSS, and (d) E. coli counts; n = number of samples.
Urbansci 10 00361 g011
Figure 12. Box diagrams showing the variations and median values in the inflow (inlet) and outflow of the PET-WS and PHA mats for the concentrations of (a) NH4-N, (b) NO3-N, (c) TN, and (d) TP; n = number of samples.
Urbansci 10 00361 g012
Figure 13. Outdoor weather conditions in terms of daily mean air temperature and precipitation, as well as the resulting water loss from the (a) PET-WS and (b) PHA mats, investigated under mean air temperature from April to June 2025 during this study.
Urbansci 10 00361 g013
Table 1. Operation strategies and different experimental conditions (hydraulic loading and aeration schedules) for the PET-WS and PHA mats throughout the entire investigation period of the pilot-scale experiment.
Phases Operation Strategies and Different Experimental Phases
Duration
[Date]
Duration in
Days [d]
Inflow HLR
[L/ (m2 × d)]
Flow TypeAerationAeration
Type
Number of
Samples
Phase I20 September–6 November 20244821intermittentno-6
Phase II9 April–22 May 20254416 continuousno-4
Phase III23 May–11 June 20252014continuousyescontinuous2
Phase IV12 June–15 August 20256549continuousyesintermittent 7
Table 2. Physical characteristics and selected specific performance parameters of the sample textile mats that were used in the lab-scale experiment in this study.
Sample MatsPhysical Characteristics of the Sample Mats
Length
[cm]
Width
[cm]
Thickness
[mm]
Dry Weight
[kg]
Surface Area
[m2]
Density
[kg/m2]
Wet Weight
[kg] N
Water Storage
Capacity [L/m2] N
Water Retention
[%] N
PLA A36.024250.2850.0863.311.83 ± 0.9117.8 ± 2.084 ± 3
PET-N B36.52225 0.1500.0801.882.12 ± 0.0524.5 ± 1.4 93 ± 2
PET-WS C37.524200.1350.0901.501.80 ± 0.0218.5 ± 1.893 ± 3
PHA D36.524200.2200.0892.471.31 ± 0.0912.2 ± 2.383 ± 2
Notes: A polylactide spunbonded fabric; B polyethylene terephthalate needle-punched nonwoven fabric; C polyethylene terephthalate waterjet-bonded (hydroentangled) nonwoven fabric; D polyhydroxyalkanoate-based spunbonded nonwoven fabric; N no. of trials, n = 2.
Table 3. Inflow CGW characteristics based on samples collected from the inflow feeding tanks throughout the 11-month lab- and pilot-scale experimental period (from 2024 to 2025).
ParameterUnitValue
MinMaxAverageStdev.N A
BOD5mg/L360163086630531
CODmg/L56051801743118134
NH4-Nmg/L0.115.25.65.525
NO3-Nmg/L0.21.10.40.134
TNmg/L3.023.612.16.534
TPmg/L14.734.224.34.234
E. coliLog10MPN/100 mL3.617.066.070.6733
pH-5.97.36.70.334
DOmg/L0.013.241.00.833
EhmV−289−80−2174834
ECµS/cm1603300259467433
TUNTU3787340326227
TSSmg/L34199642638434
Notes: A number of samples.
Table 4. Water quality parameters in the inlet and the outlet of all four boxes through the mats. The measurements are summarized as the mean (±standard deviations are in brackets). [Caution: Removal efficiencies are based on concentration reductions and do not represent complete mass removal of the pollutants].
ParameterUnitTreatment Performance of the Sample Mats
PLAPET-NPET-WSPHA
InflowOutflowReduction
(%)
OutflowReduction
(%)
OutflowReduction
(%)
OutflowReduction
(%)
N A
BOD5mg/L837 (406)191 (95)77 280 (131)67143 (76)83265 (139)6811
CODmg/L1512 (1255)349 (104)77 419 (154)72296 (92)80443 (190)7114
NH4-Nmg/L9.0 (5.1)4.9 (3.4)46 4.4 (3.3)513.4 (4.2)623.8 (3.7)5714
NO3-Nmg/L0.3 (0.1)0.5 (0.6)-0.3 (0.1)-0.3 (0.1)-0.3 (0.1)-14
TNmg/L18.1 (4.6)11.8 (4.9)3512.3 (5.8)329.4 (6.1)489.7 (5.2)4614
TPmg/L24.8 (4.8)22.8 (3.5)8 21.4 (4.7)1422.7 (3.2)822.9 (4.7)714
E. coliMPN/100 mL1.7 × 106
(2.3 × 10⁶)
2.5 × 10⁵
(6.7 × 10⁵)
1.8 B3.1 × 105
(7.3 × 10⁵)
1.6 B2.3 × 105
(6.5 × 10⁵)
1.8 B4.4 × 105
(9.8 × 10⁵)
1.5 B12
pH-6.7 (0.4)7.9 (0.2)-7.7 (0.3)-8.0 (0.2)-7.7 (0.3)-14
DOmg/L0.9 (0.4)0.8 (0.6)-0.9 (0.8)-0.9 (0.6)-0.6 (0.5)-14
EhmV−230 (43)−3.4 (136)-−79 (121)-40 (117)-−49 (122)-14
ECµS/cm3027 (202)3173 (347)-3236 (224)-3256 (348)-3196 (244)-14
TUNTU285 (270)39 (22)8657 (46)80 38 (19)87 62 (58)78 14
TSSmg/L237 (232)61 (18)7470 (32)7066 (24)7280 (34)6613
Notes: A number of samples; B reduction in log-units.
Table 5. The water quality parameters at the inlet and outlet of the PET-WS and PHA mats, and the mean reductions over the entire pilot-scale experiment. The mean values are shown alongside the standard deviations in brackets. The overall average values and removal efficiencies combine operational phases with different HLRs, flow regimes, and aeration conditions. [Caution: Removal efficiencies are based on concentration reductions and do not represent complete mass removal of the pollutants].
ParameterUnitTreatment Performance
PET-WSPHA
InflowOutflowReduction (%)N AOutflowReduction (%)N A
BOD5mg/L887 (216)323 (283)64 18563 (252)3614
CODmg/L1905 (1131)871 (1041)54 191431 (805)2518
NH4-Nmg/L0.7 (1.2)0.7 (1.0)- 190.8 (1.8)-18
NO3-Nmg/L0.4 (0.2)0.4 (0.1)-190.5 (0.2)-18
TNmg/L7.9 (3.6)4.8 (2.5)39197.4 (5.8)618
TPmg/L24 (4.0)19.6 (4.7)18 1922 (4.3)818
E. coliLog10MPN/100 mL6.3 (0.4)5.2 (0.9)1.1 B195.8 (0.6)0.5 B17
pH-6.7 (0.3)7.4 (1.5)-207.3 (0.4)-18
DOmg/L1.0 (0.9)3.7 (3.2)-202.3 (2.9)-18
EhmV−208 (50)4.6 (135)-20−56 (120)-18
ECµS/cm2161 (869)2554 (930)-202856 (925)-18
TUNTU498 (220)209 (357)5816336 (271)33 15
TSSmg/L421 (386)170 (238)6018287 (200)3218
Notes: A number of samples; B reductions in log-units.
Disclaimer/Publisher’s Note: The statements, opinions and data contained in all publications are solely those of the individual author(s) and contributor(s) and not of MDPI and/or the editor(s). MDPI and/or the editor(s) disclaim responsibility for any injury to people or property resulting from any ideas, methods, instructions or products referred to in the content.