Article

Land-Use Restructuring in Quasi-Industrial Districts Under Deindustrialization: Evidence from Kitakyushu, Japan


1
College of Forestry, Guizhou University, Guiyang 550028, China
2
Faculty of Environmental Engineering, The University of Kitakyushu, Kitakyushu 808-0135, Japan
3
iSMART, Qingdao University of Technology, Qingdao 266520, China
4
Department of Architecture, Institut Teknologi Sepuluh Nopember, Kampus ITS Sukolilo, Surabaya 60117, Indonesia
*
Author to whom correspondence should be addressed.
Urban Sci. 2026, 10(6), 333; https://doi.org/10.3390/urbansci10060333
Submission received: 28 April 2026 / Revised: 16 June 2026 / Accepted: 16 June 2026 / Published: 18 June 2026
(This article belongs to the Section Urban Planning and Design)

Abstract

Quasi-Industrial Districts (QIDs) in Japan allow the coexistence of industrial, residential, and commercial functions. However, under pressures such as deindustrialization, demographic decline, and urban restructuring, their functional balance has been increasingly disrupted. This study investigates the spatiotemporal evolution of QIDs in Kitakyushu and develops a GIS-based framework to quantify changes in land-use structure. Using historical zoning and building floor-area data from 1986 to 2024, ternary diagram analysis is applied to examine relationships among the three functional types and identify transformation trajectories. Results show that while the total QID area expanded by 38.8%, internal structures changed significantly. Industry-dominant districts declined, commerce-oriented districts increased, and residential–industrial mixed types largely disappeared, indicating a shift toward commercial and residential functions. These findings reveal a growing mismatch between zoning designations and actual land use. To address this, the study proposes combining industrial concentration with clearer residential zoning, supported by periodic evaluation based on functional deviation thresholds. The framework provides a quantitative tool for adaptive land-use governance in shrinking industrial cities.

1. Introduction

Differences exist among countries in their land-use zoning systems, particularly in the way relationships among industrial, residential, and commercial functions are regulated. In the United States, zoning emphasizes functional segregation: industrial districts generally prohibit residential use, and commercial districts do not permit industrial activities, with land-use conflicts addressed primarily through physical separation [1]. In Germany, land-use categories are defined based on building functions, including pure residential areas, general residential areas, mixed-use areas, commercial areas, and industrial areas, with a clear separation between industrial and residential districts [2]. In China, land is categorized into five major functional types—residential, commercial, industrial, public administration, and green space. Industrial land is further classified into M1 (light industry), M2 (general industry), and M3 (heavy industry), and residential use is, in principle, not permitted within industrial zones [3]. In contrast, Japan adopts a gradient-compatible zoning system, in which each use district permits a certain degree of functional coexistence.
The promulgation of the Tokyo City Improvement Ordinance in 1888 marked the establishment of Japan’s modern urban planning framework [4]. In 1919, in response to post-earthquake reconstruction needs, the Old City Planning Act and the Urban Building Act were enacted [5]. With rapid economic growth, the New City Planning Act was introduced in 1968, followed by the expansion of Use District categories in 1992, increasing the number of land-use classifications from eight to twelve. A comprehensive revision was carried out in 2000, and a further amendment was implemented in 2006 in response to central urban decline [6,7]. The planning paradigm gradually shifted from an emphasis on expansion and growth management to refined regulatory control. In recent years, greater attention has been paid to compactness and resilience under conditions of demographic shrinkage [8]. According to the Japanese City Planning Act, statutory land-use districts were grouped into three functional categories in this study: residential, commercial, and industrial districts. The residential category includes Category I Low-Rise Residential District (C1-LRD), Category II Low-Rise Residential District (C2-LRD), Category I Medium-to-High-Rise Residential District (C1-MRD), Category II Medium-to-High-Rise Residential District (C2-MRD), Category I Residential District (C1-RD), Category II Residential District (C2-RD), and Quasi-Residential District (QRD). The commercial category comprises Neighborhood Commercial District (NCD) and Commercial District (CD). The industrial category includes Quasi-Industrial District (QID), Industrial District (ID), and Exclusive Industrial District (EID). This reclassification enables a simplified yet structurally meaningful comparison of land-use composition across different periods [9].
The QID represents a transitional zoning category in which industrial, residential, and commercial uses are permitted to coexist. It historically played a coordinating and buffering role, particularly during periods of rapid economic growth and industrialization, when its institutional flexibility allowed for functional compatibility among different land uses [10]. Due to industrial decline, oversupply, facility aging, and constraints on land resources, industrial land has gradually withdrawn from its original production functions and has increasingly faced demands for reuse, redevelopment, or functional replacement [11]. Industrial land transformation has become a global issue, shifting from a narrow focus on the redevelopment of contaminated and derelict land toward greater attention to the continuous changes in industrial land within the urban functional structure [12].
The global transition from production-oriented to consumption- and residence-oriented urban economies has become a widespread phenomenon [13], especially in the central areas of Western cities [14]. Rising land values have encouraged the conversion of factory sites into residential developments [15], while waterfront redevelopment policies have further accelerated the transformation of industrial land into commercial and residential uses [16]. Precisely because QIDs in Japan are characterized by institutional flexibility and transitional capacity, they are more susceptible to functional restructuring during periods of urban transformation, often leading to unidirectional structural shifts in land-use composition [17]. This raises a critical planning question: how should cities respond to such structural imbalances?
Some studies have emphasized the impacts of industrial land redevelopment on real estate prices, environmental risks, public health, energy use, and climate effects. Woo et al. found that the remediation of abandoned industrial land in the United States had a significant positive effect on housing prices in surrounding low- and middle-income communities [18]. van Duijn et al. investigated 36 industrial heritage sites in the Netherlands and also found that redevelopment increased nearby residential property prices [19]. Fujii et al. [20], through a case study of Higashi Osaka, demonstrated that residential development pressure can induce the outward relocation of manufacturing activities, resulting in the gradual displacement of industry within QIDs. They argued that rezoning or refined regulatory control is necessary to mitigate such conflicts. From an ecological perspective, Sacirovic et al. [21] proposed models of industrial–residential symbiosis. Shirokova et al. [22] emphasized the importance of balancing demand, infrastructure, and sustainability in enhancing environmental comfort within mixed residential–industrial areas. Other studies have assessed spatial optimization strategies for residential–industrial coexistence from a health-risk perspective [23]. Wcisło et al. discussed the role of health risk assessment in industrial land transformation planning [24]. Carsjens et al. developed the STEPP tool to assess the environmental impacts of industrial land transformation in terms of noise, odor, dust, and hazards [25]. In addition, Hartmann et al. [26], Hou et al. [27], and Koch et al. [28] examined the assessment of energy and climate impacts in industrial land transformation at both project and urban scales.
However, these studies tend to focus on redevelopment evaluation at the project or case-study level, while paying relatively limited attention to long-term land-use data. Industrial land transformation concerns not only the outcomes of transformation, but also the conditions under which transformation occurs, the pathways through which it unfolds, and its impacts on the surrounding land-use structure. Land-use change is influenced, on the one hand, by natural environmental factors, such as natural conditions and ecological processes [29], and, on the other hand, by socioeconomic factors, including demographic, social, economic, political, and institutional factors [30]. van Schrojenstein Lantman et al. proposed that historical continuity, land suitability, neighborhood interaction, and actor interaction are four core principles of land-use change [31]. Wang et al. further interpreted industrial land transformation as a path-dependent process, arguing that the direction of industrial land transformation can influence subsequent land-use trajectories [32]. Hansen also emphasized that the analysis of long-term changes in land-use composition requires multi-year data that are processed in a consistent manner [33]. Industrial land transformation is characterized by historical continuity. Moreover, land-use transformation is affected by spatial interactions among different functions. Some functions have mutually attractive relationships; for example, industrial uses may be spatially proximate to logistics, retail, and certain public facilities. Other functions have mutually repulsive relationships; for example, heavy industry may generate environmental conflicts with residential uses and sociocultural facilities.
Before optimizing areas characterized by mixed industrial, residential, and commercial uses, it is essential to understand how different functional components are structured and interact [34]. Elgohary et al. [34] proposed a quantitative approach to measuring land-use mix based on the Mixed-Use Development Index (MDI), density matrices, and resident satisfaction indicators. Zhou et al. [35] introduced a residential–employment mix index. Additional studies have employed entropy indices, concentration indices, and balance measures based on proportional distribution [36], as well as indicators for assessing functional differentiation [37] and inter-functional interaction [38]. Common transformation types of industrial land vary across different regions. Based on field data from North Brabant in the Netherlands, Wang et al. found that industrial land was most commonly transformed into residential and retail uses, with industrial-to-retail transformation accounting for 45% and industrial-to-residential transformation accounting for 30% [32]. Lai et al. found that, from 2010 to 2018, 76.82% of industrial land in Shenzhen was transformed into commercial, residential, and new industrial spaces [39]. Therefore, a single universal transformation model should not be applied simplistically; instead, judgments should be made based on data from specific regional contexts.
In the post-industrial era, many former urban industrial spaces are undergoing functional restructuring. Existing studies have mainly examined this process from the perspectives of large-scale redevelopment, land-use mix, and industrial relocation [40,41]. However, the process through which the functional structure of highly compatible QIDs shifts under deindustrialization and urban shrinkage remains insufficiently discussed. In particular, most studies on mixed land use have focused on the degree of land-use mix itself, while paying less attention to the direction of structural transitions among residential, commercial, and industrial functions. Although some areas remain institutionally designated as QIDs, their actual building functions may have gradually shifted from industry-dominant uses toward commercial, residential, or daily-life service functions. To examine this type of functional deviation, it is necessary to quantitatively analyze the composition of residential, commercial, and industrial functions within QIDs.
This research focuses on Kitakyushu, Japan, and examines the QIDs—the least restrictive category within the industrial zoning system. A GIS-based analytical framework was employed to compile and standardize land-use data across multiple years, enabling time-series spatial analysis and ternary land-use composition analysis. The research objectives are as follows: (1) to reveal the spatial expansion, reduction, and locational changes in QIDs in Kitakyushu from 1986 to 2024; (2) to analyze changes in the internal functional composition of QIDs based on residential, commercial, and industrial building floor areas; and (3) to visualize the direction of structural transitions among residential, commercial, and industrial functions using a ternary diagram, and further discuss the planning and governance implications of functional deviation. The transformation of QIDs in Kitakyushu also reflects a gradual functional restructuring occurring within legally designated mixed-use industrial zones in a shrinking post-industrial city. This study aims to reveal the structural pathway through which QIDs have shifted from production-oriented functions toward daily-life and consumption-oriented functions, and to examine the functional restructuring process of flexible industrial zoning in the post-industrial era.

2. Materials and Methods

2.1. Geographic Location of Kitakyushu

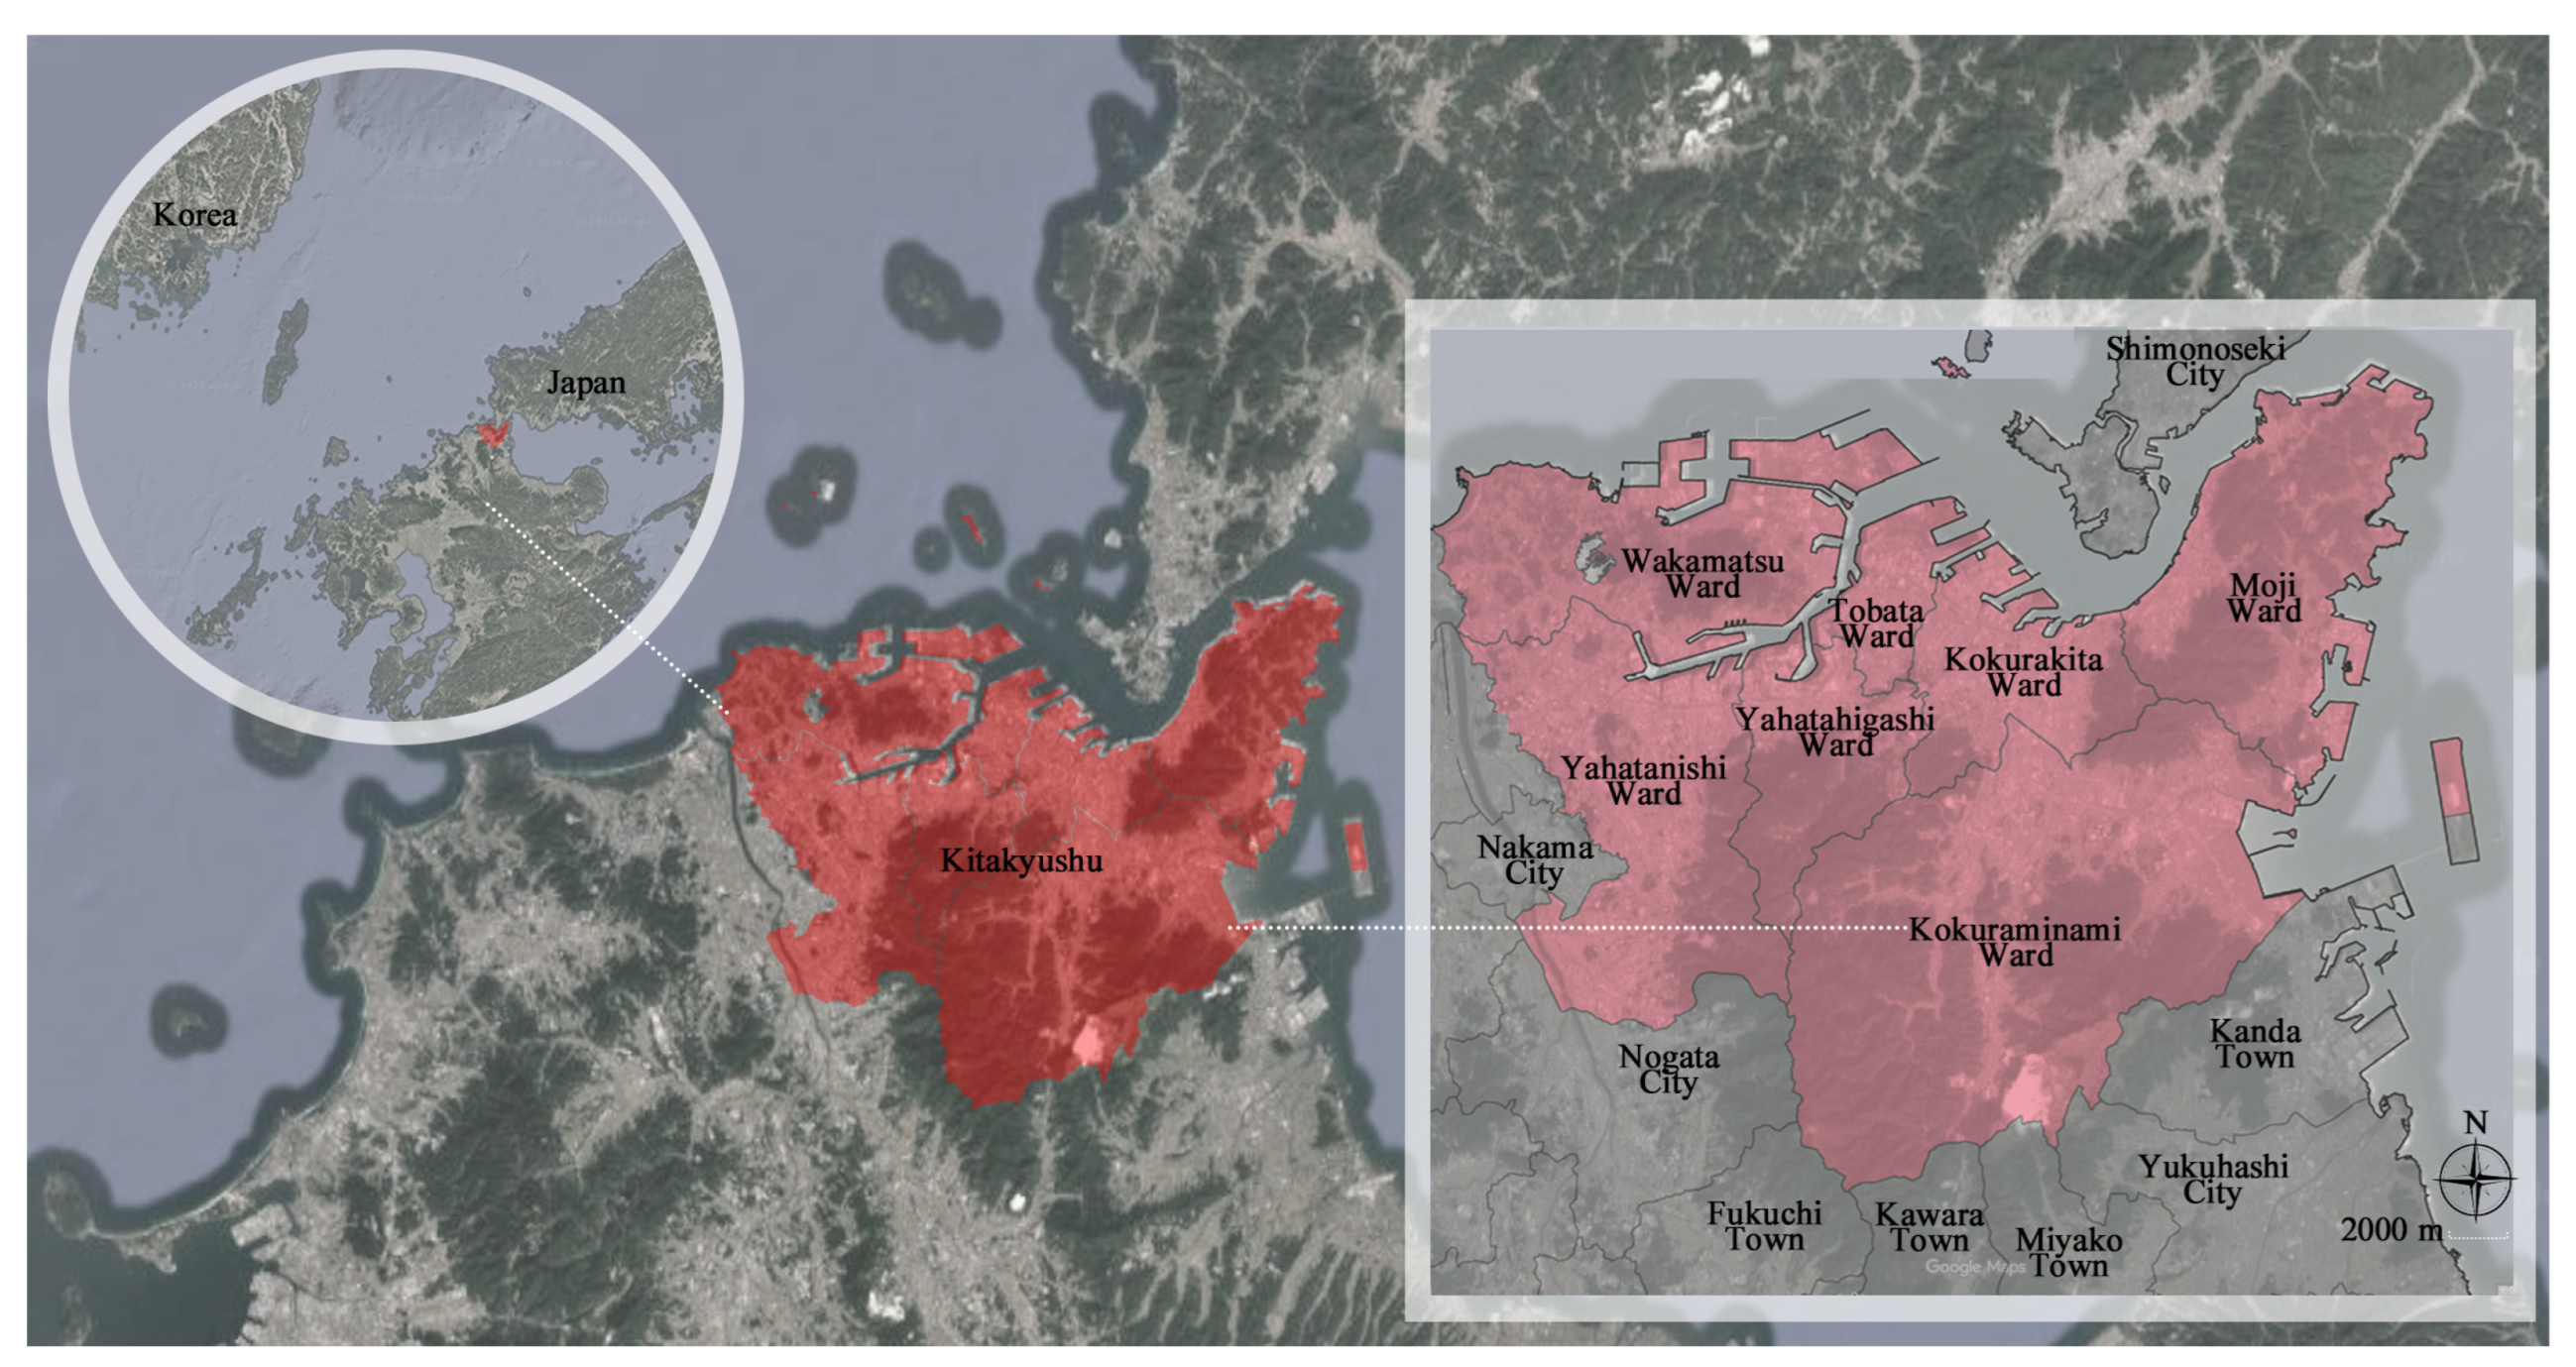
Kitakyushu is located at the northernmost tip of Kyushu Island in southwestern Japan, facing both the Seto Inland Sea and the Sea of Japan (33.883° N, 130.875° E; see Figure 1) [42]. Historically recognized as a major heavy industrial city, Kitakyushu has experienced profound deindustrialization and subsequent urban regeneration. The transformation of its industrial structure has led to industrial decline and increasing industrial land vacancy, highlighting challenges typical of traditional large-scale industrial cities undergoing structural transition [43]. In addition, Kitakyushu faces several urban issues, including the reduction in green spaces due to suburban residential expansion, declining urban vitality caused by population loss in the central city, and the growing presence of underutilized land along coastal industrial zones [44]. Examining the restructuring of land use in this context therefore holds significant practical and planning relevance.

2.2. Historical Development of the QIDs in Kitakyushu

2.2.1. Emergence and Formation Period (1901–1960s)

The establishment of the Yawata Steel Works in 1901 marked the starting point of industrialization in Kitakyushu. During this period, rapid development of port infrastructure, railway networks, coal mining, and steel production promoted the concentration of heavy industries along the coastal zone. Factories were distributed along port areas, while residential settlements developed around industrial facilities. Although the concept of the QID had not yet been formally introduced, a highly mixed industrial urban structure—characterized by the coexistence of production and daily life—had already taken shape [45].

2.2.2. Institutional Establishment Period (1968–2000)

In 1963, the merger of five cities led to the formation of Kitakyushu. Following the enactment of the New City Planning Act in 1968, statutory land-use districts—including Industrial Districts, Exclusive Industrial Districts, and QIDs—were formally designated. During this period, industry remained the dominant economic sector, and QIDs functioned as transitional mixed-use areas where small-scale factories coexisted with residential development. By 2000, the zoning framework had largely stabilized and been consistently implemented.

2.2.3. Deindustrialization and Functional Shift (2000–Present)

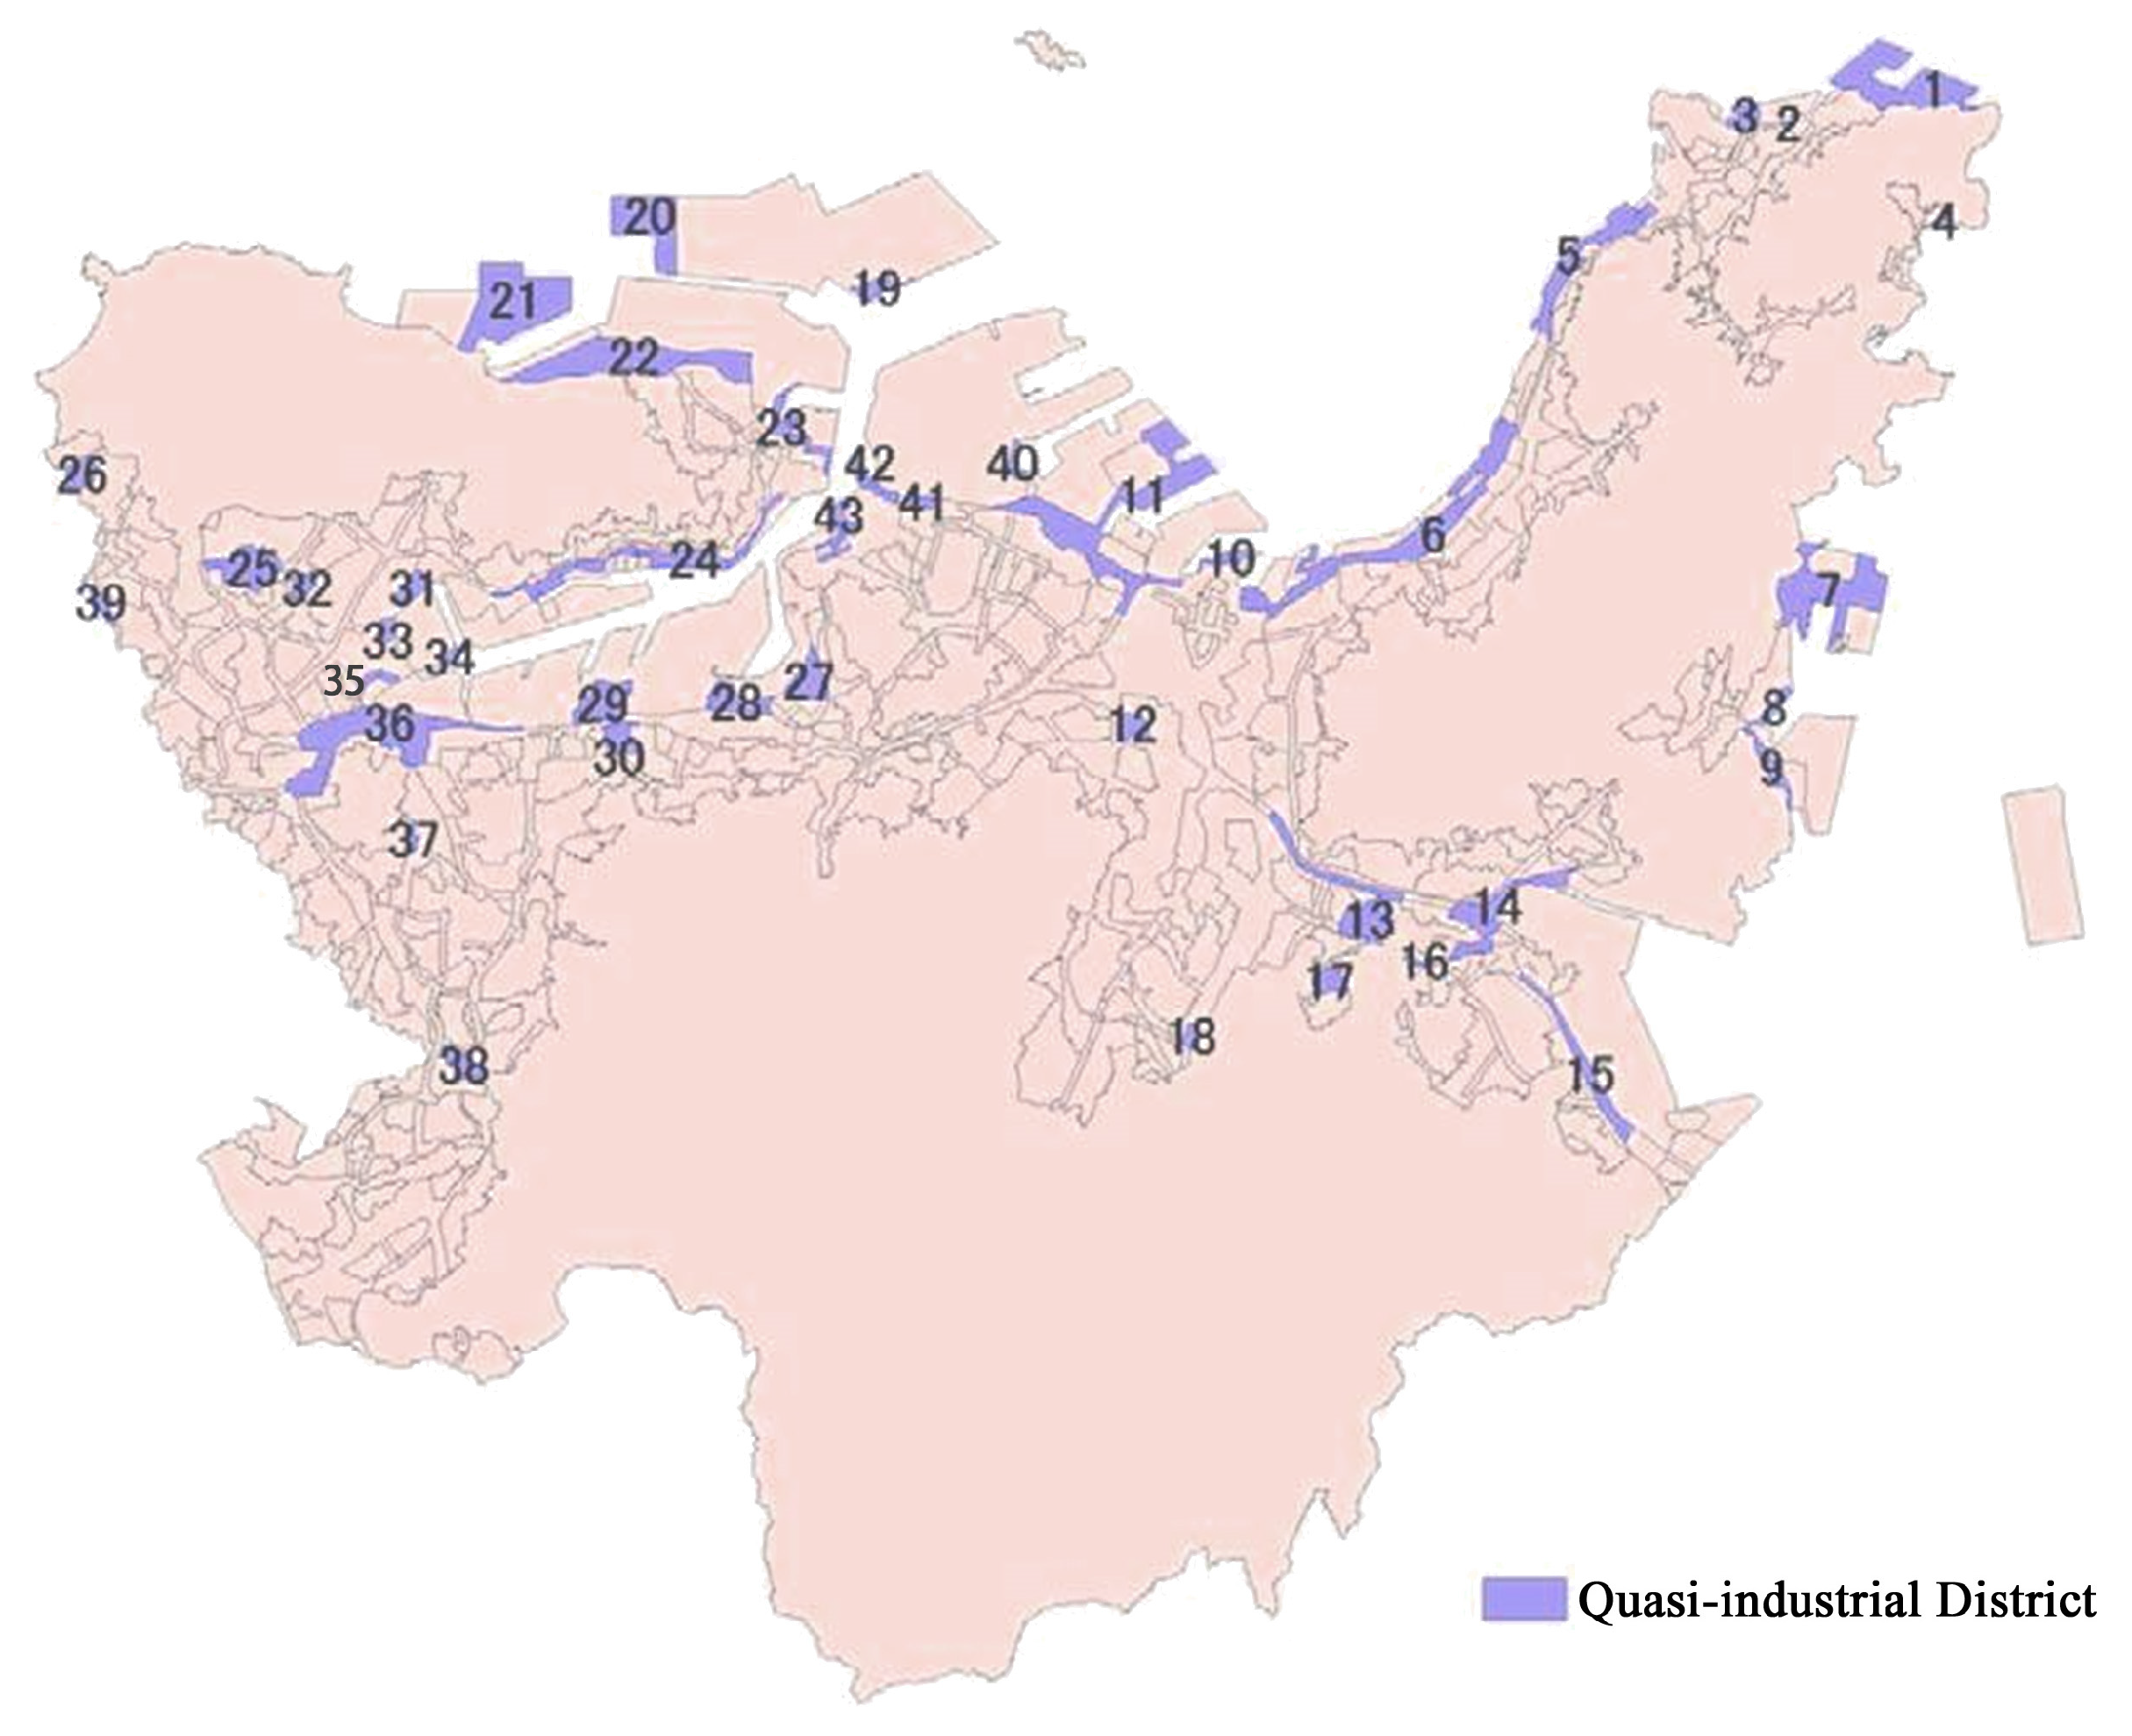
Since 2000, the decline of the steel industry, industrial relocation from port areas, population decrease, and accelerated aging have weakened the industrial character of the city [46]. Currently, Kitakyushu contains 43 QIDs (see Figure 2). According to the latest statistical data (2025), the total area of QIDs amounts to 2055 ha (see Table 1).

2.3. Methodology

This study establishes a GIS-based dynamic analytical framework to examine the spatial evolution and functional restructuring of QIDs. The framework consists of four components: (1) data acquisition and spatial preprocessing, (2) time-series spatial evolution analysis, (3) structural and functional classification, and (4) renewal-oriented policy analysis. Historical maps were scanned at high resolution (600 dpi) and subsequently georeferenced. At least three sets of control points were selected for geometric correction using an Affine transformation model. All spatial data were unified under the JGD2011 coordinate system (UTM Zone 52N) and vectorized for further analysis [47,48]. Spatial overlay analysis was conducted to identify expansion patterns and structural changes in QIDs over time. These procedures were implemented in ArcGIS 10.4 (Esri, Redlands, CA, USA). A ternary diagram was employed to analyze functional composition [49,50]. Building floor area was categorized into three functional types—residential, commercial, and industrial. After normalization, the proportional data were converted into point layers within the GIS environment and plotted in a triangular coordinate system. Corresponding points for the years 2000 and 2024 were connected, and the direction of each line segment represents the trajectory of functional transition. The functional type classification in this study was established based on the structural interpretation logic of the ternary diagram and the planning characteristics of QIDs. A proportion exceeding one-third was used as a benchmark for identifying a function as a significant component, while a proportion below 20% was regarded as indicating a marginal or residual function [51]. To examine the sensitivity of the classification results to threshold settings, a sensitivity analysis was conducted under ±5% threshold adjustments. The results show that although a small number of districts close to the classification boundaries were reclassified, the core trends remained unchanged: industry-dominant districts decreased, commerce-dominant districts increased, and the residential–industrial mixed type no longer appeared in 2024 (Table A1, Table A2 and Table A3). Based on the results of the ternary structural analysis and in consideration of the surrounding land-use context, renewal strategies and planning recommendations were proposed.

3. Results

3.1. Spatiotemporal Evolution Characteristics

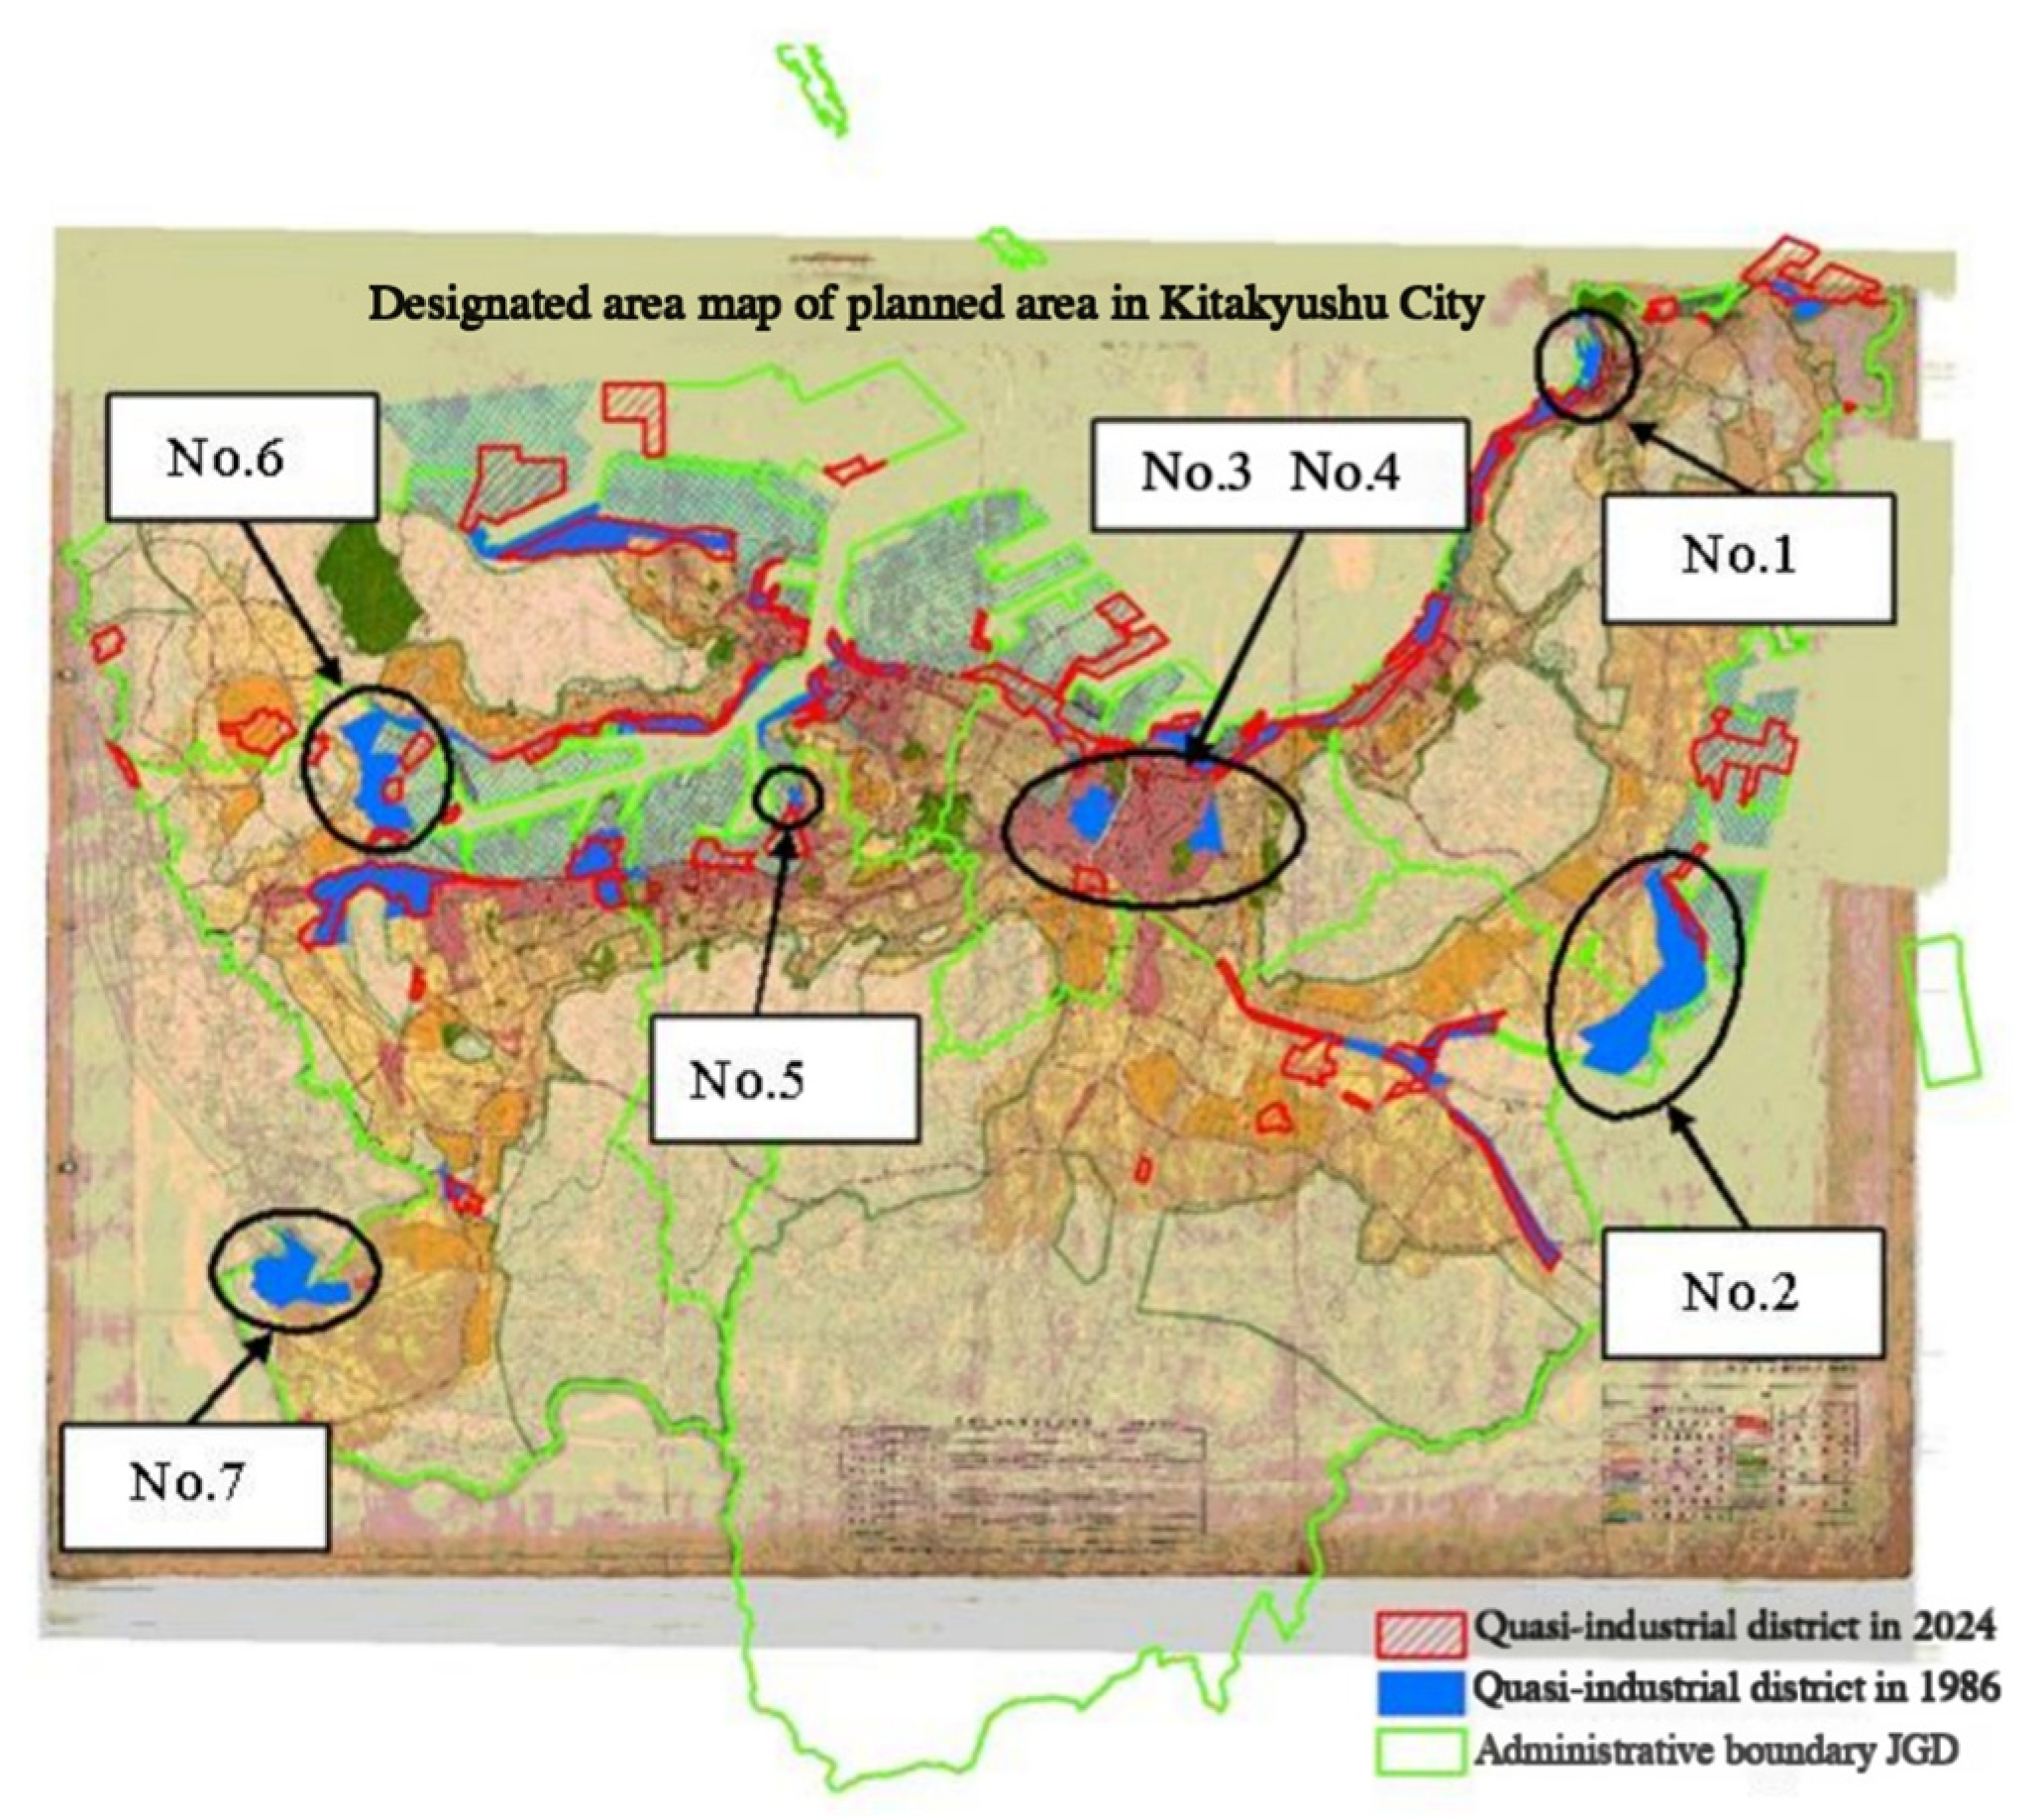
Figure 3 illustrates the spatial distribution changes in QIDs in Kitakyushu between 1986 and 2024. From a macro-spatial perspective, a clear coastal belt pattern is observed. In 1986, QIDs (shown in blue, 1481 ha) were primarily distributed along port areas, forming a typical “port–railway–industrial corridor” structure. Core areas included Moji Port, Wakamatsu Port, and the eastern part of Yahata, reflecting strong port-oriented industrial dependence. By 2024, the QID area (shown in red) had expanded to 2055 ha. The spatial pattern evolved from a relatively continuous coastal belt into multiple scattered and patch-like clusters, gradually extending toward inland transportation corridors. The black circles indicate key areas experiencing significant spatial adjustment or functional conversion. Specifically, No. 1 represents a former port-adjacent industrial area that has been entirely converted to commercial use. No. 2 denotes a southern area that transitioned from quasi-industrial to residential use. No. 3 and No. 4 exhibit evident functional restructuring within the central urban area. No. 6 and No. 7 reflect boundary adjustments and area reconfiguration in the western sector. Overall, these changes demonstrate that QIDs in Kitakyushu have evolved from a continuous industrial belt into a more fragmented transitional zone. They no longer function as the dominant industrial spatial structure. The reliance on port-based heavy industry has weakened, and with ongoing industrial upgrading, former port-centered industrial functions have increasingly been replaced by commercial and service-oriented uses.
Using the 2024 QIDs as the reference baseline, changes in area and spatial location were analyzed (see Figure 2 and Table 2). A total of 23 areas that were not designated as QIDs in 1986 were subsequently newly designated as QIDs by 2024. In contrast, four areas that were classified as QIDs in 1986 were later converted to other land-use categories. Only one area (No. 5) remained unchanged in both area and spatial location throughout the study period. The remaining 18 areas experienced either boundary adjustments or locational shifts, indicating varying degrees of spatial reconfiguration. Overall, these findings suggest that the spatial structure of QIDs has undergone substantial transformation, reflecting an increasing trend toward functional diversification.

3.2. Functional Composition Analysis

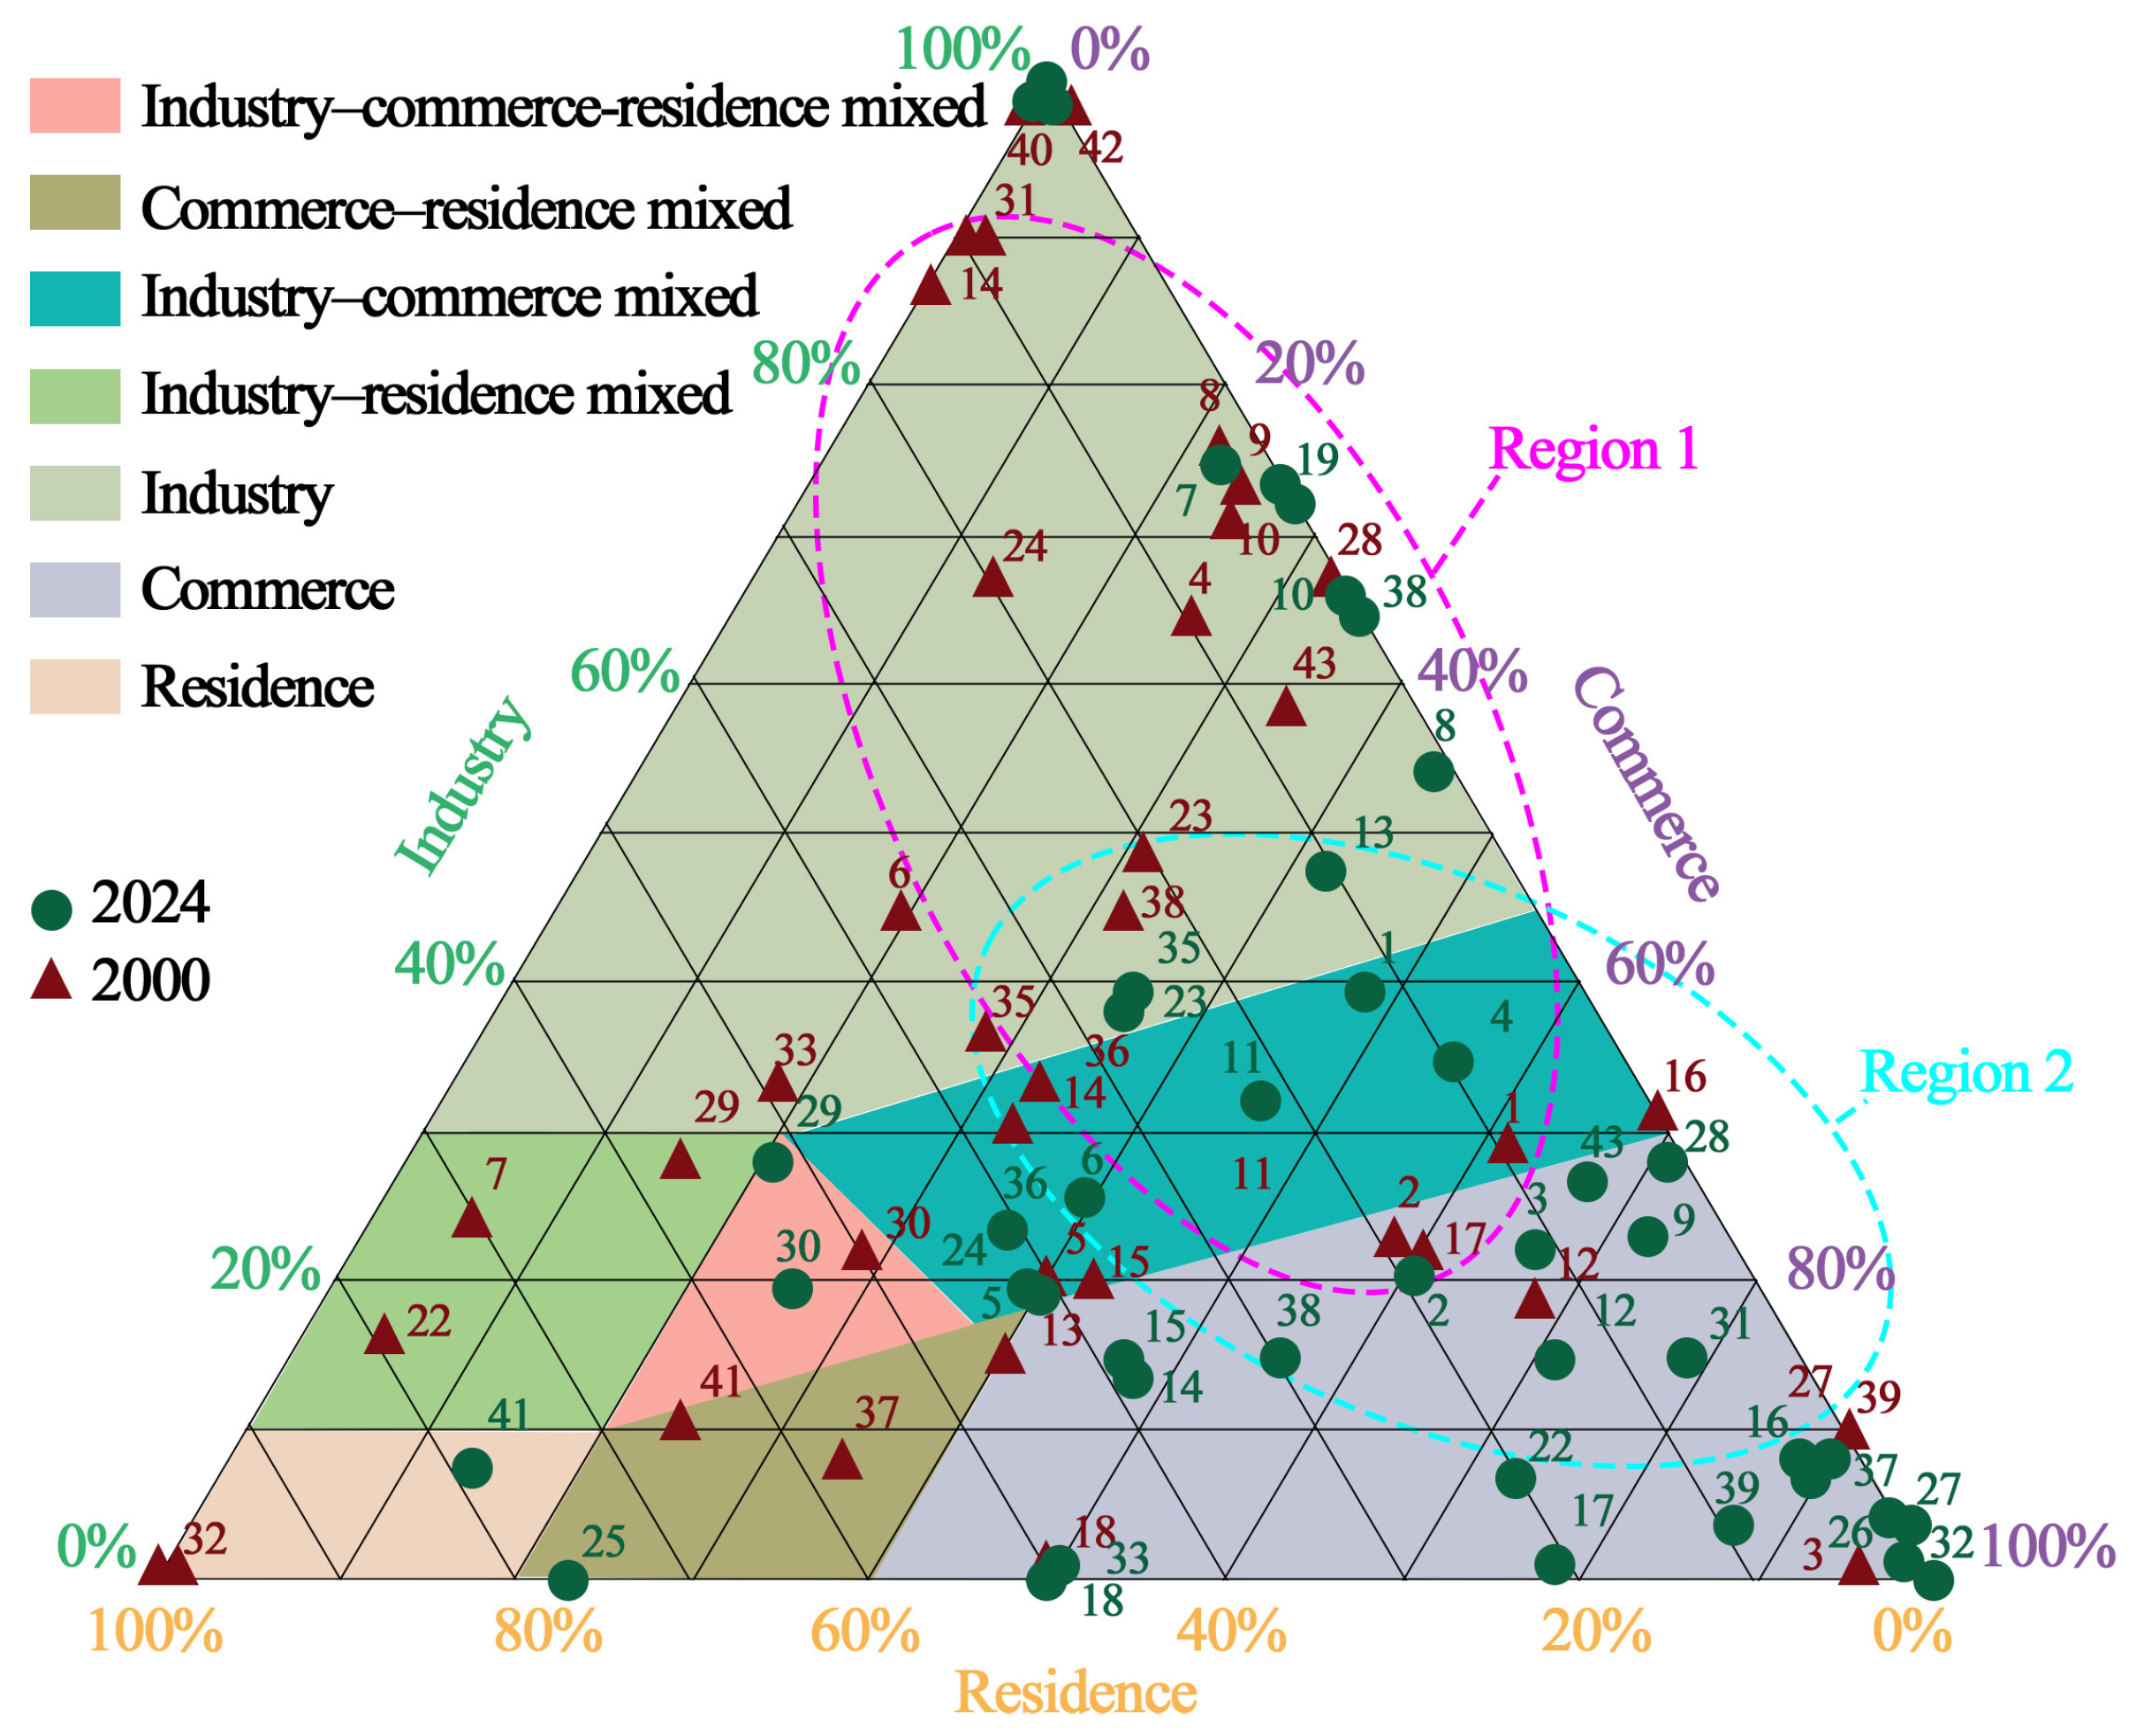
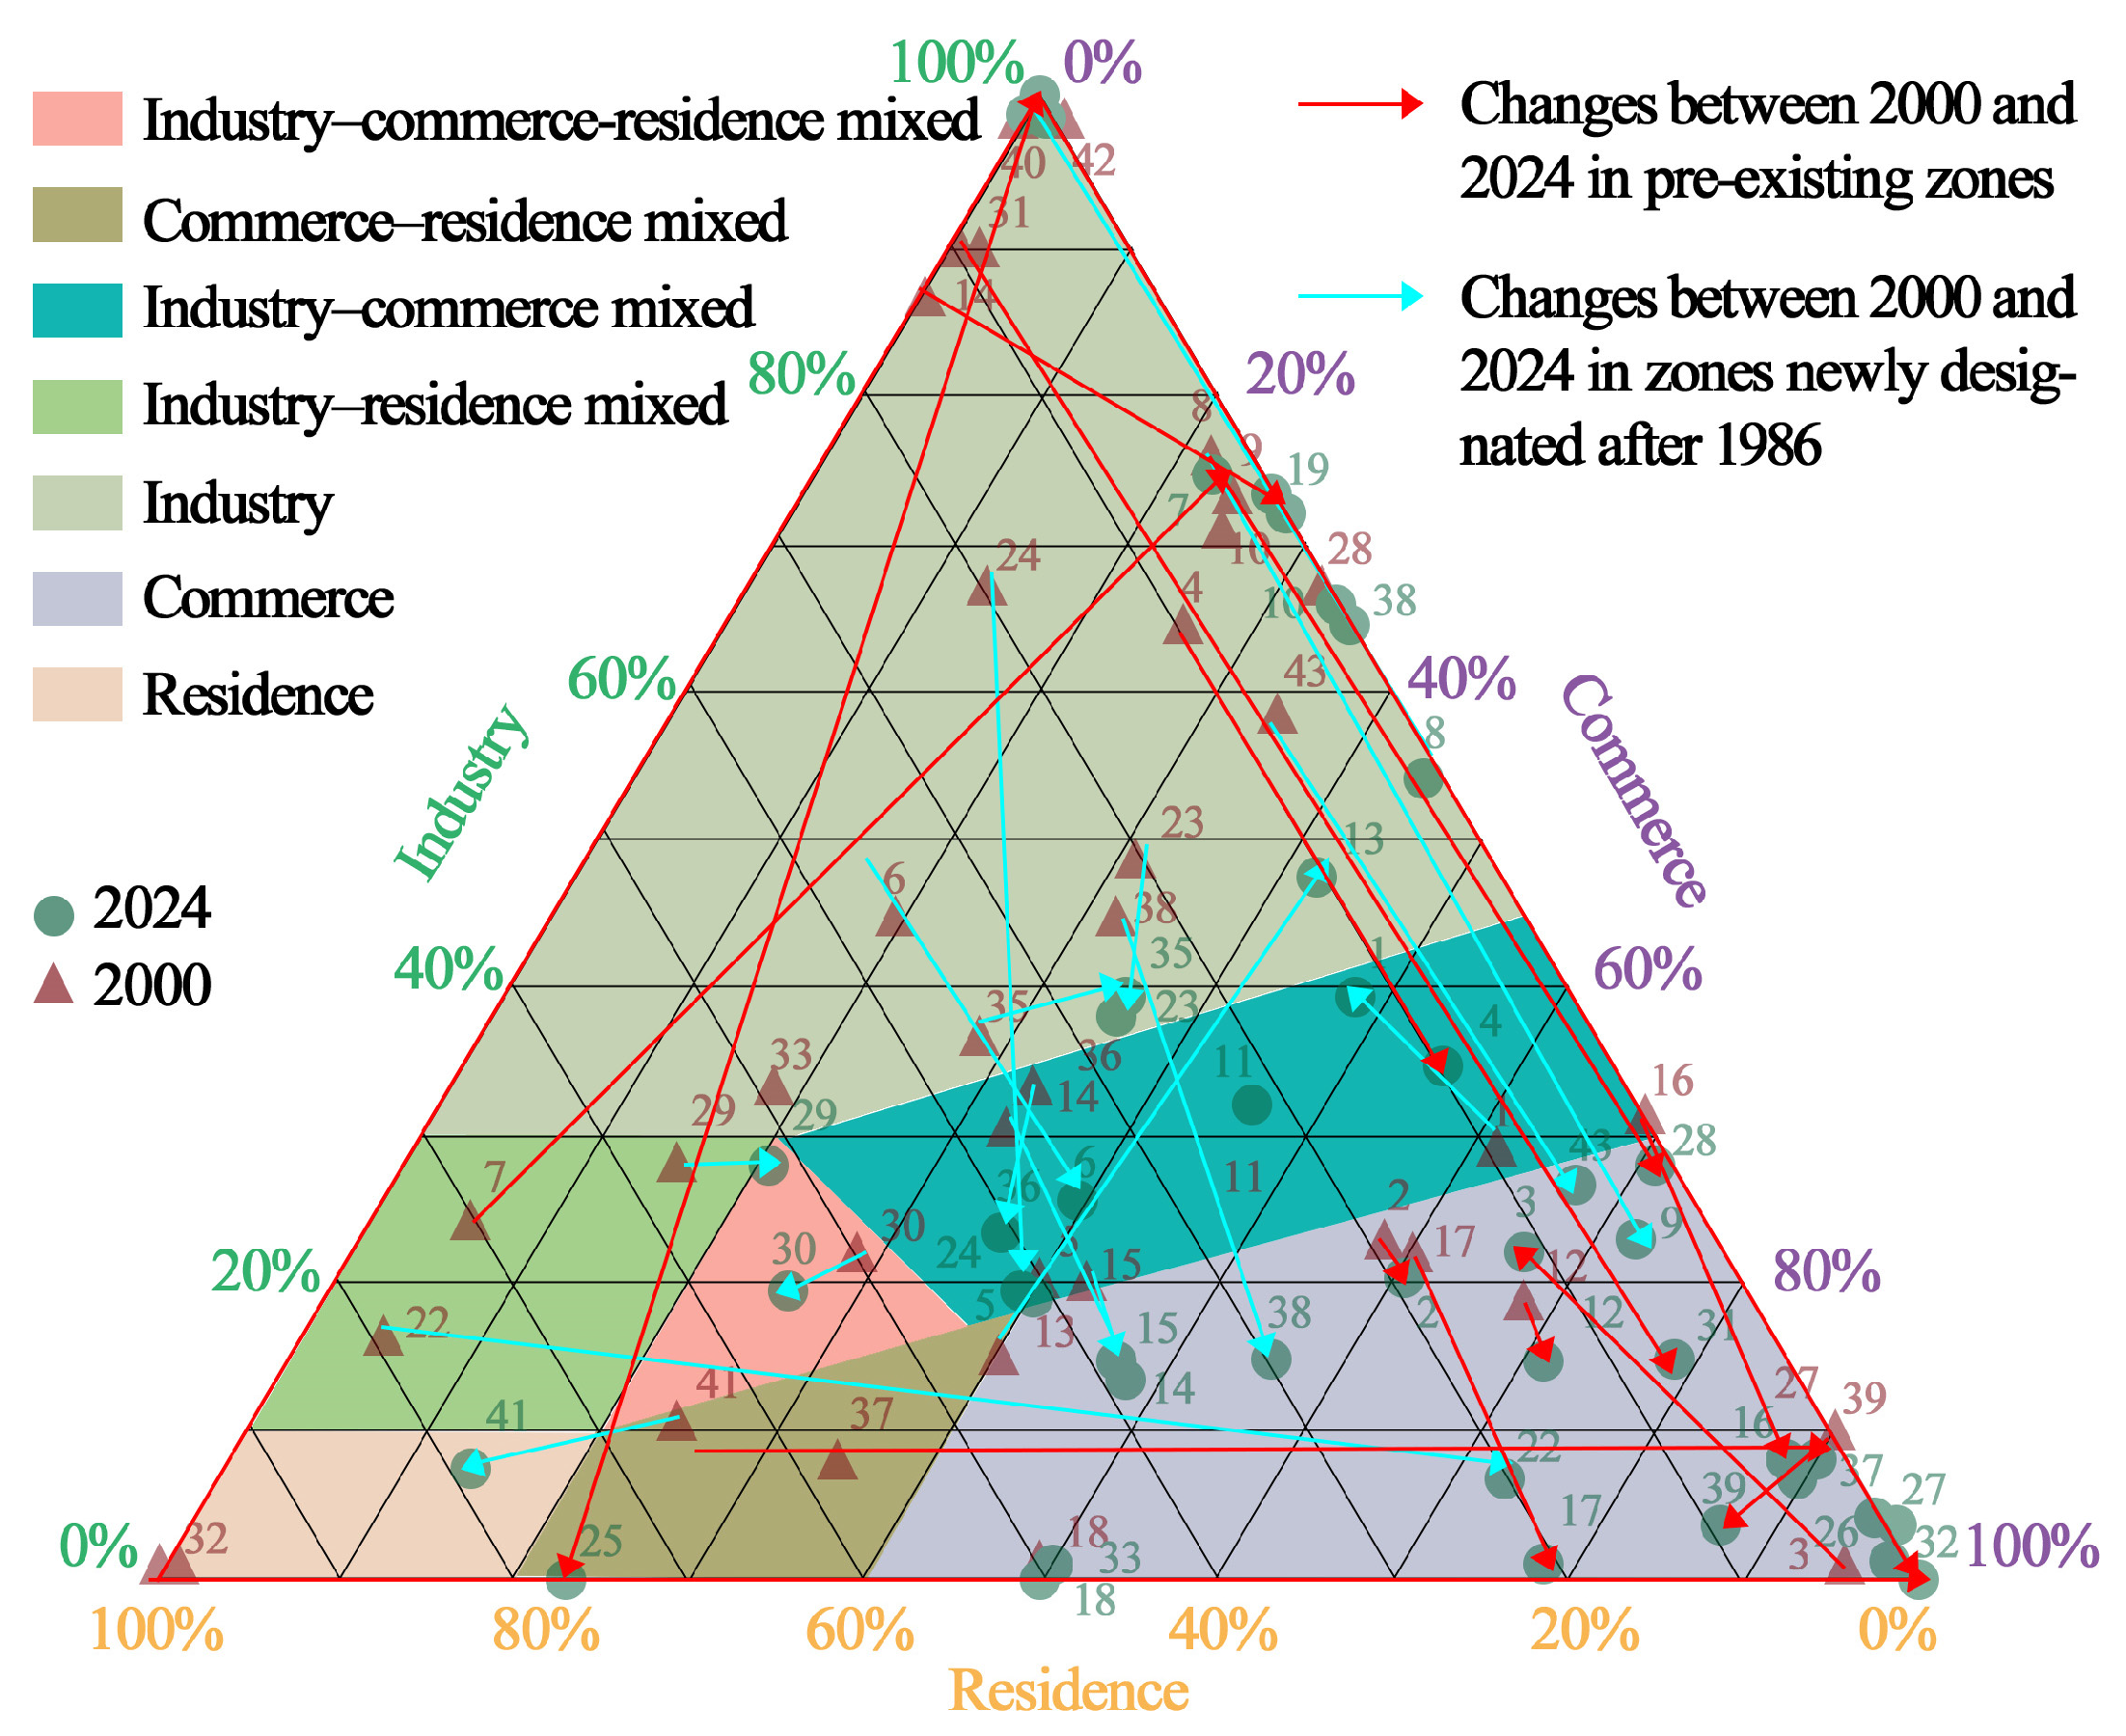
Figure 4 presents a ternary diagram with Residence, Commerce, and Industry as the three vertices, illustrating changes in functional composition across 43 QIDs (QIDs) in Kitakyushu between 2000 (red triangles) and 2024 (green circles). Based on the proportional distribution of residential, commercial, and industrial floor areas, and considering the functional orientation embedded in the statutory zoning system, proportional thresholds were established (see Table 3) to classify the districts into seven structural types. In 2000, 19 districts were classified as industry-dominant, 7 as commerce-dominant, and 7 as industry–commerce mixed. Overall, data points were heavily concentrated near the industry vertex (Region 1), indicating that the internal structure of QIDs remained largely industrially oriented, although early signs of commercialization had emerged. By 2024, the number of commerce-dominant districts had increased to 20 (an increase of 13), while industry-dominant districts decreased to 12 (a reduction of 7). The number of industry–commerce mixed districts remained at 7. Notably, the resident–industry mixed type had completely disappeared. Spatially, the distribution of points shifted markedly toward the Commerce vertex (Region 2). These findings indicate a clear structural transition from an industry-dominant configuration to a commercially oriented pattern. Given that industrial uses are often associated with noise and environmental externalities, the coexistence of residential and industrial functions may generate spatial incompatibility concerns.

3.3. Structural Evolution Pathways

In the ternary diagram (see Figure 5), blue lines represent existing QIDs, while red lines denote newly designated QIDs. The blue lines are predominantly distributed around the central region of the ternary diagram. The relatively short distances between the 2000 and 2024 points indicate limited changes in functional composition, suggesting gradual and moderate structural adjustment. Moreover, most arrows exhibit a downward directional shift, indicating a transition from industry-oriented configurations toward greater commercial influence. In contrast, the red lines corresponding to newly designated QIDs are primarily located near the edges of the ternary diagram. The longer distances between time points reflect a greater magnitude of structural change, and the pronounced directional shifts suggest that these areas experienced more rapid functional transition within a relatively short period. Overall, QIDs in Kitakyushu demonstrate a clear structural trend from industrial-dominant to commercially oriented configurations. Existing districts exhibit relatively stable and incremental functional adjustment, whereas newly designated districts display more substantial restructuring and higher transformation intensity.
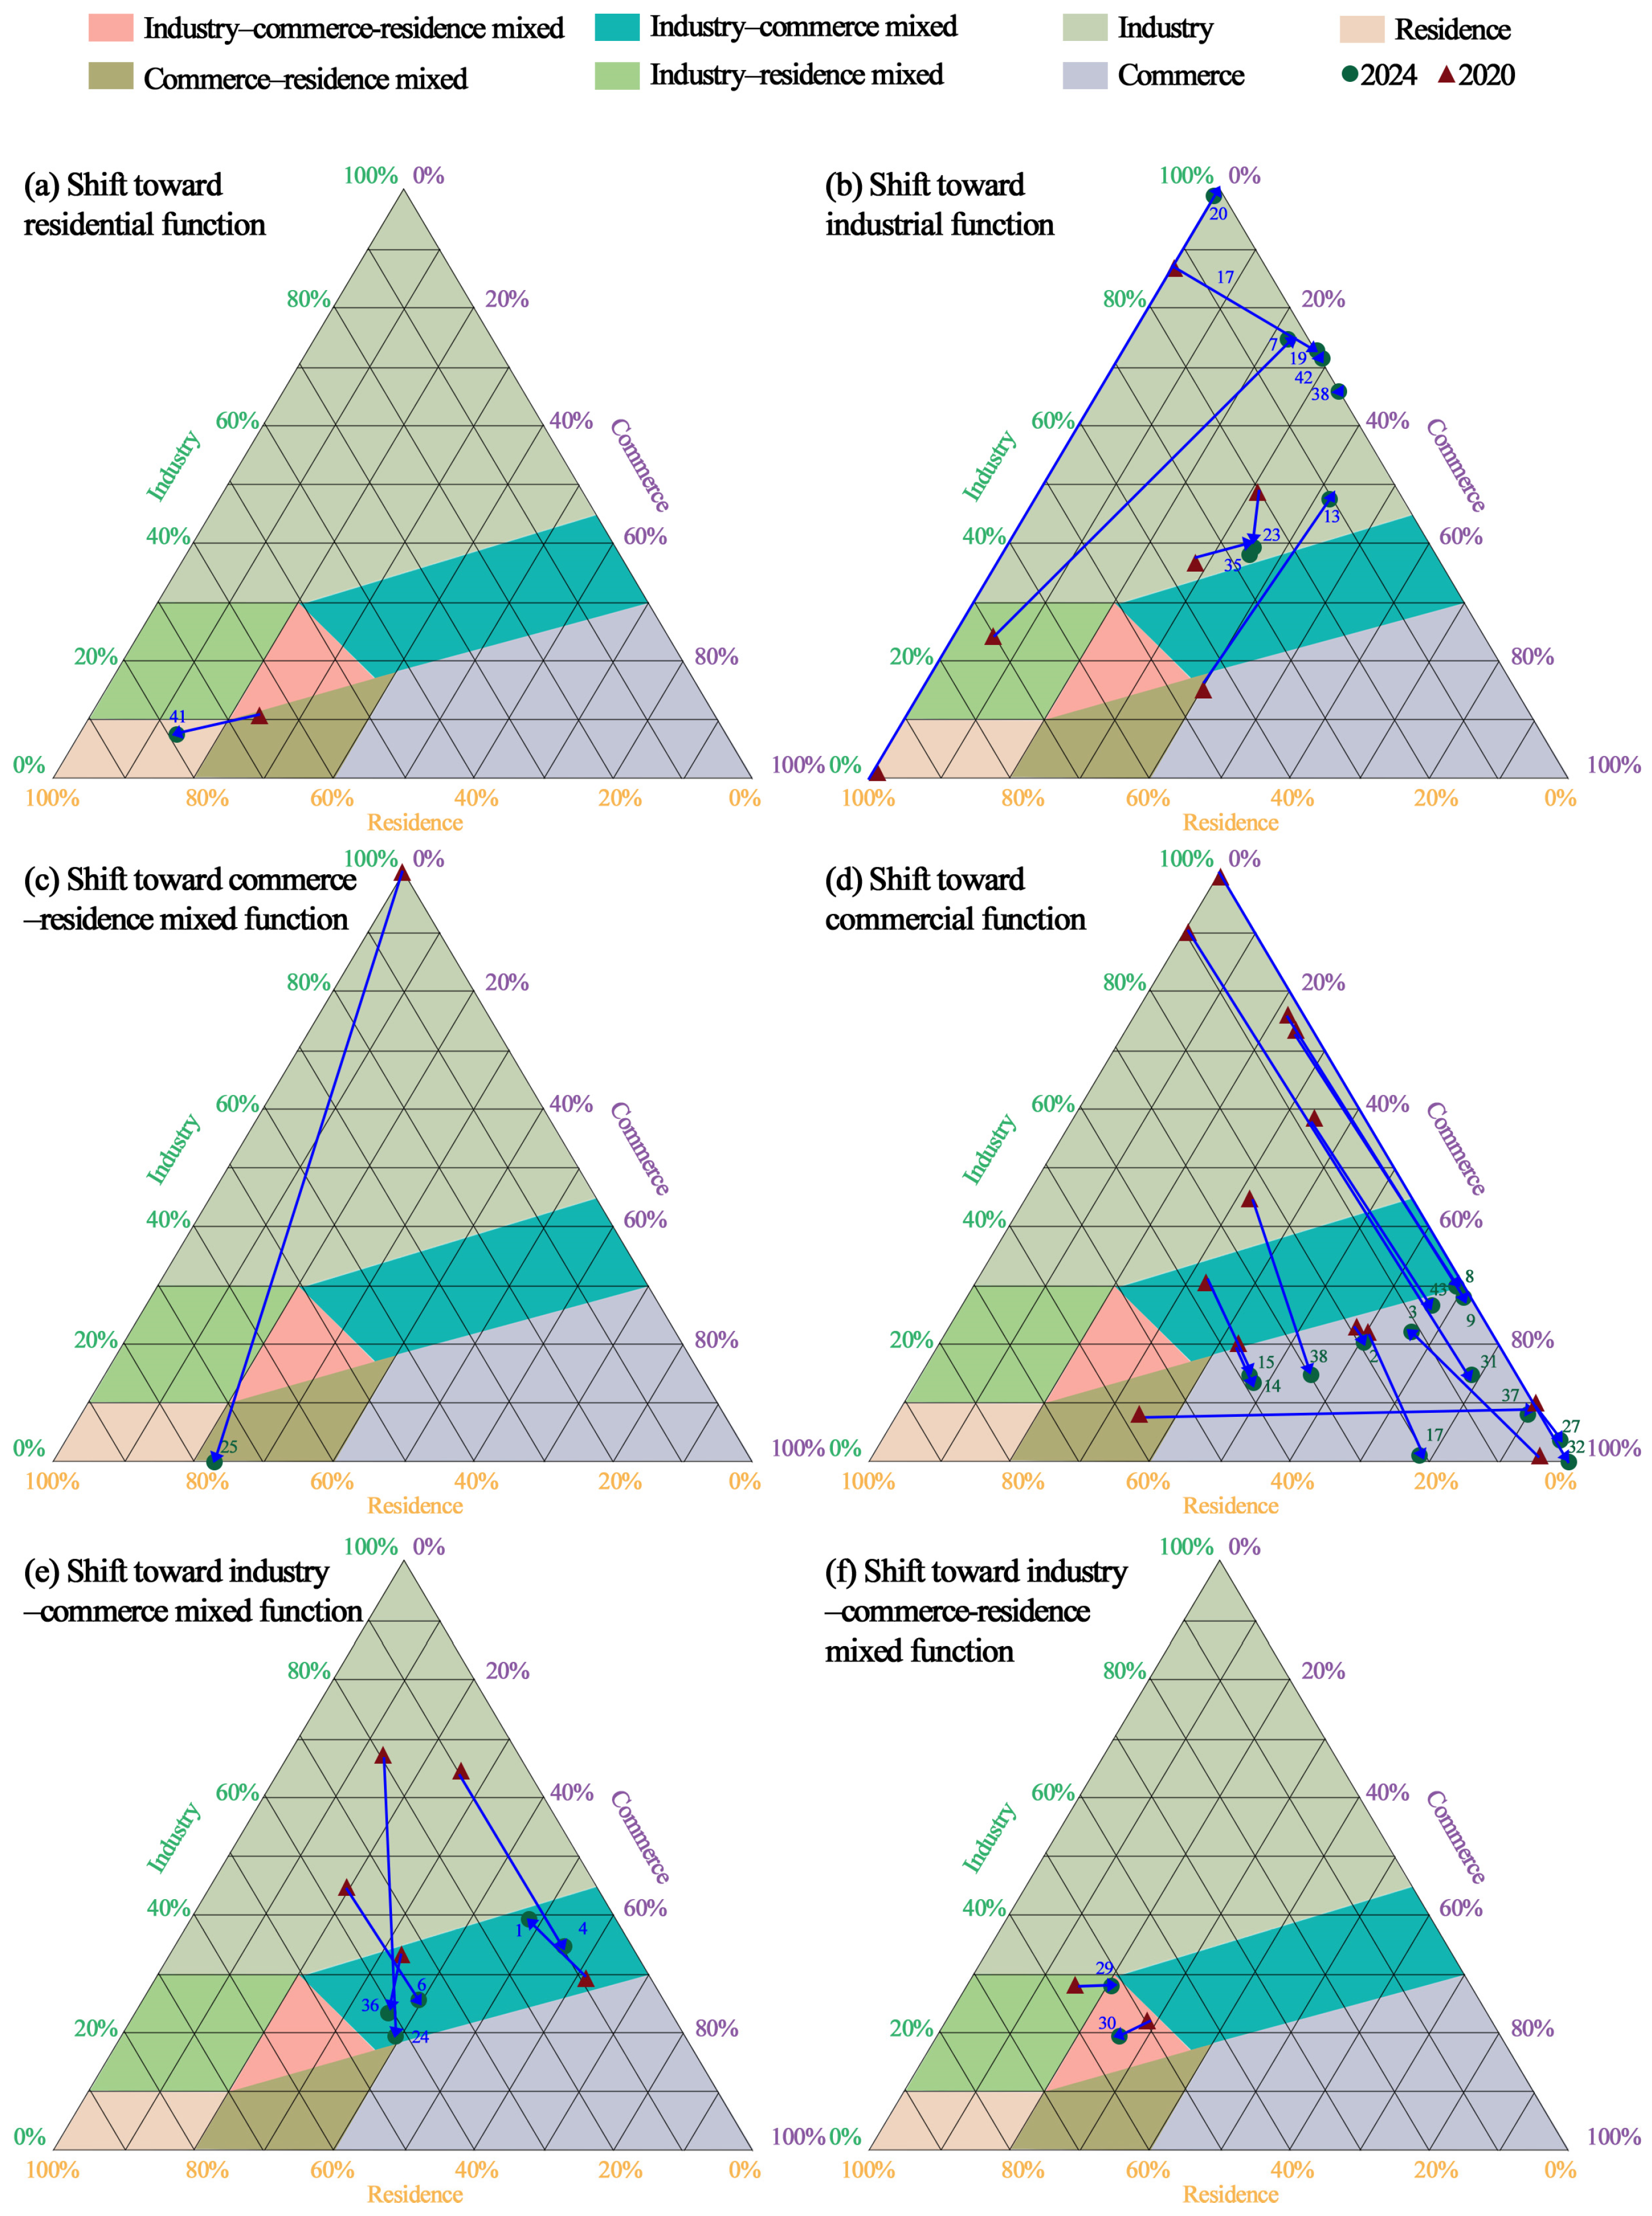
Figure 6 further illustrates detailed structural transitions across different functional types. In Figure 6a, District No. 41 experienced minimal changes in area and spatial location; however, its functional classification shifted to a resident-dominant type. In Figure 6b, two districts transitioned toward an industry-dominant configuration. Although several areas maintained or reinforced their industrial functions, the overall number of industry-dominant districts declined compared with 2000. In Figure 6c, District No. 25 shifted from an industry-dominant type to a residential–commercial mixed-use configuration. In Figure 6d, Districts No. 2, 3, 17, and 27 remained commerce-dominant in both periods. Districts No. 8, 9, 31, 32, 38, and 43 transitioned from industrial-dominant to commerce-dominant configurations, while Districts No. 14, 15, and 37 shifted from mixed-use to commerce-dominant types. In Figure 6e,f, except for Districts No. 1 and 36, Districts No. 4, 6, and 24 transitioned from industry-dominant to industry–commerce mixed configurations, while Districts No. 29 and 30 evolved toward a resident–commerce–industry mixed-use structure. Overall, QIDs in Kitakyushu exhibit pronounced functional restructuring, characterized by a transition from production-oriented spaces toward commercially and residentially integrated mixed-use configurations.

3.4. Key Areas with Significant Structural Shift

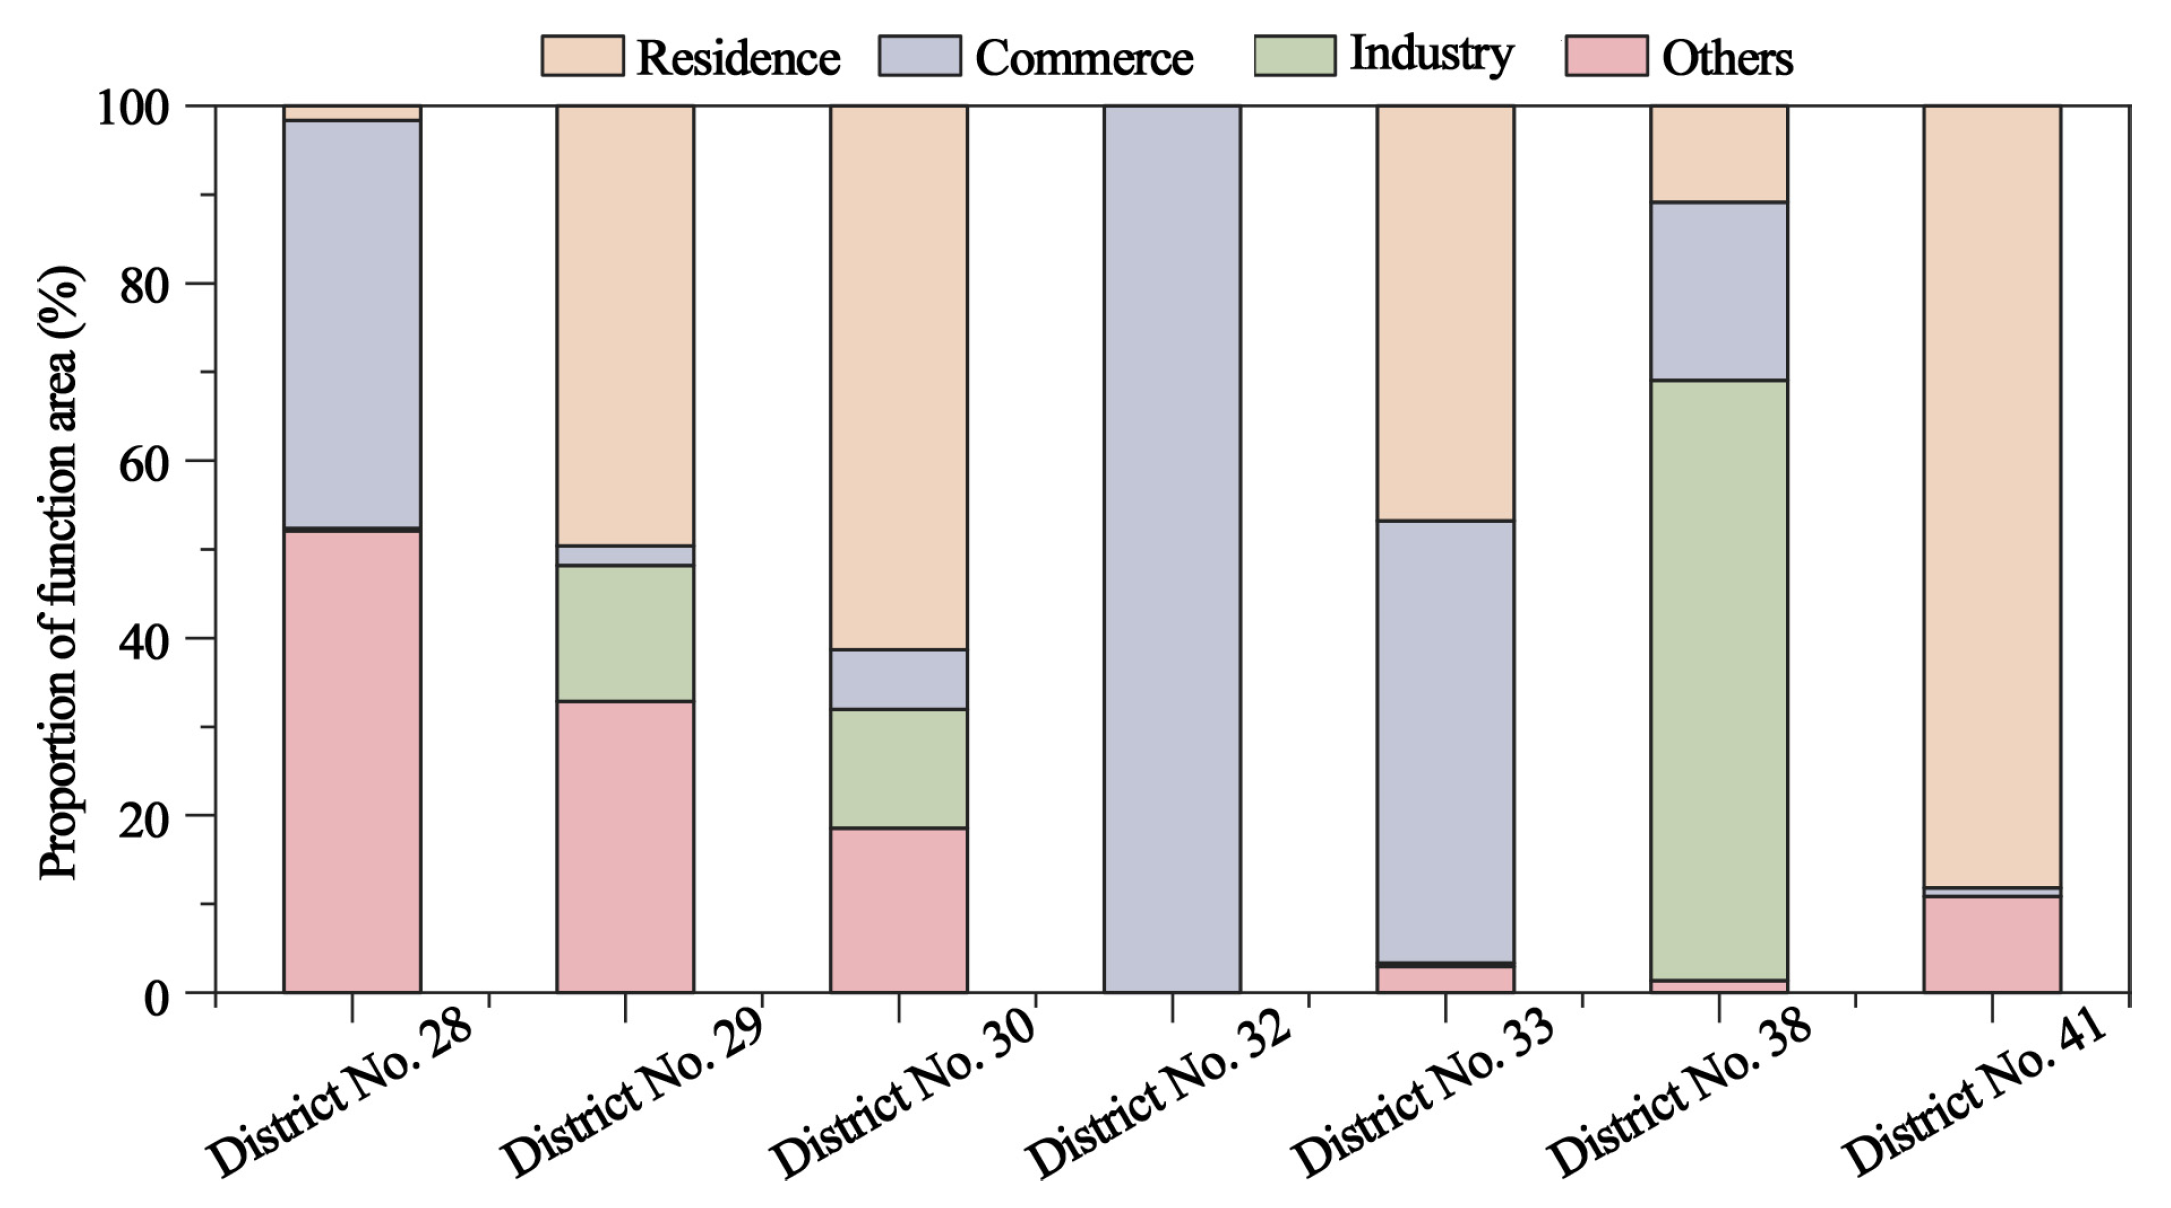
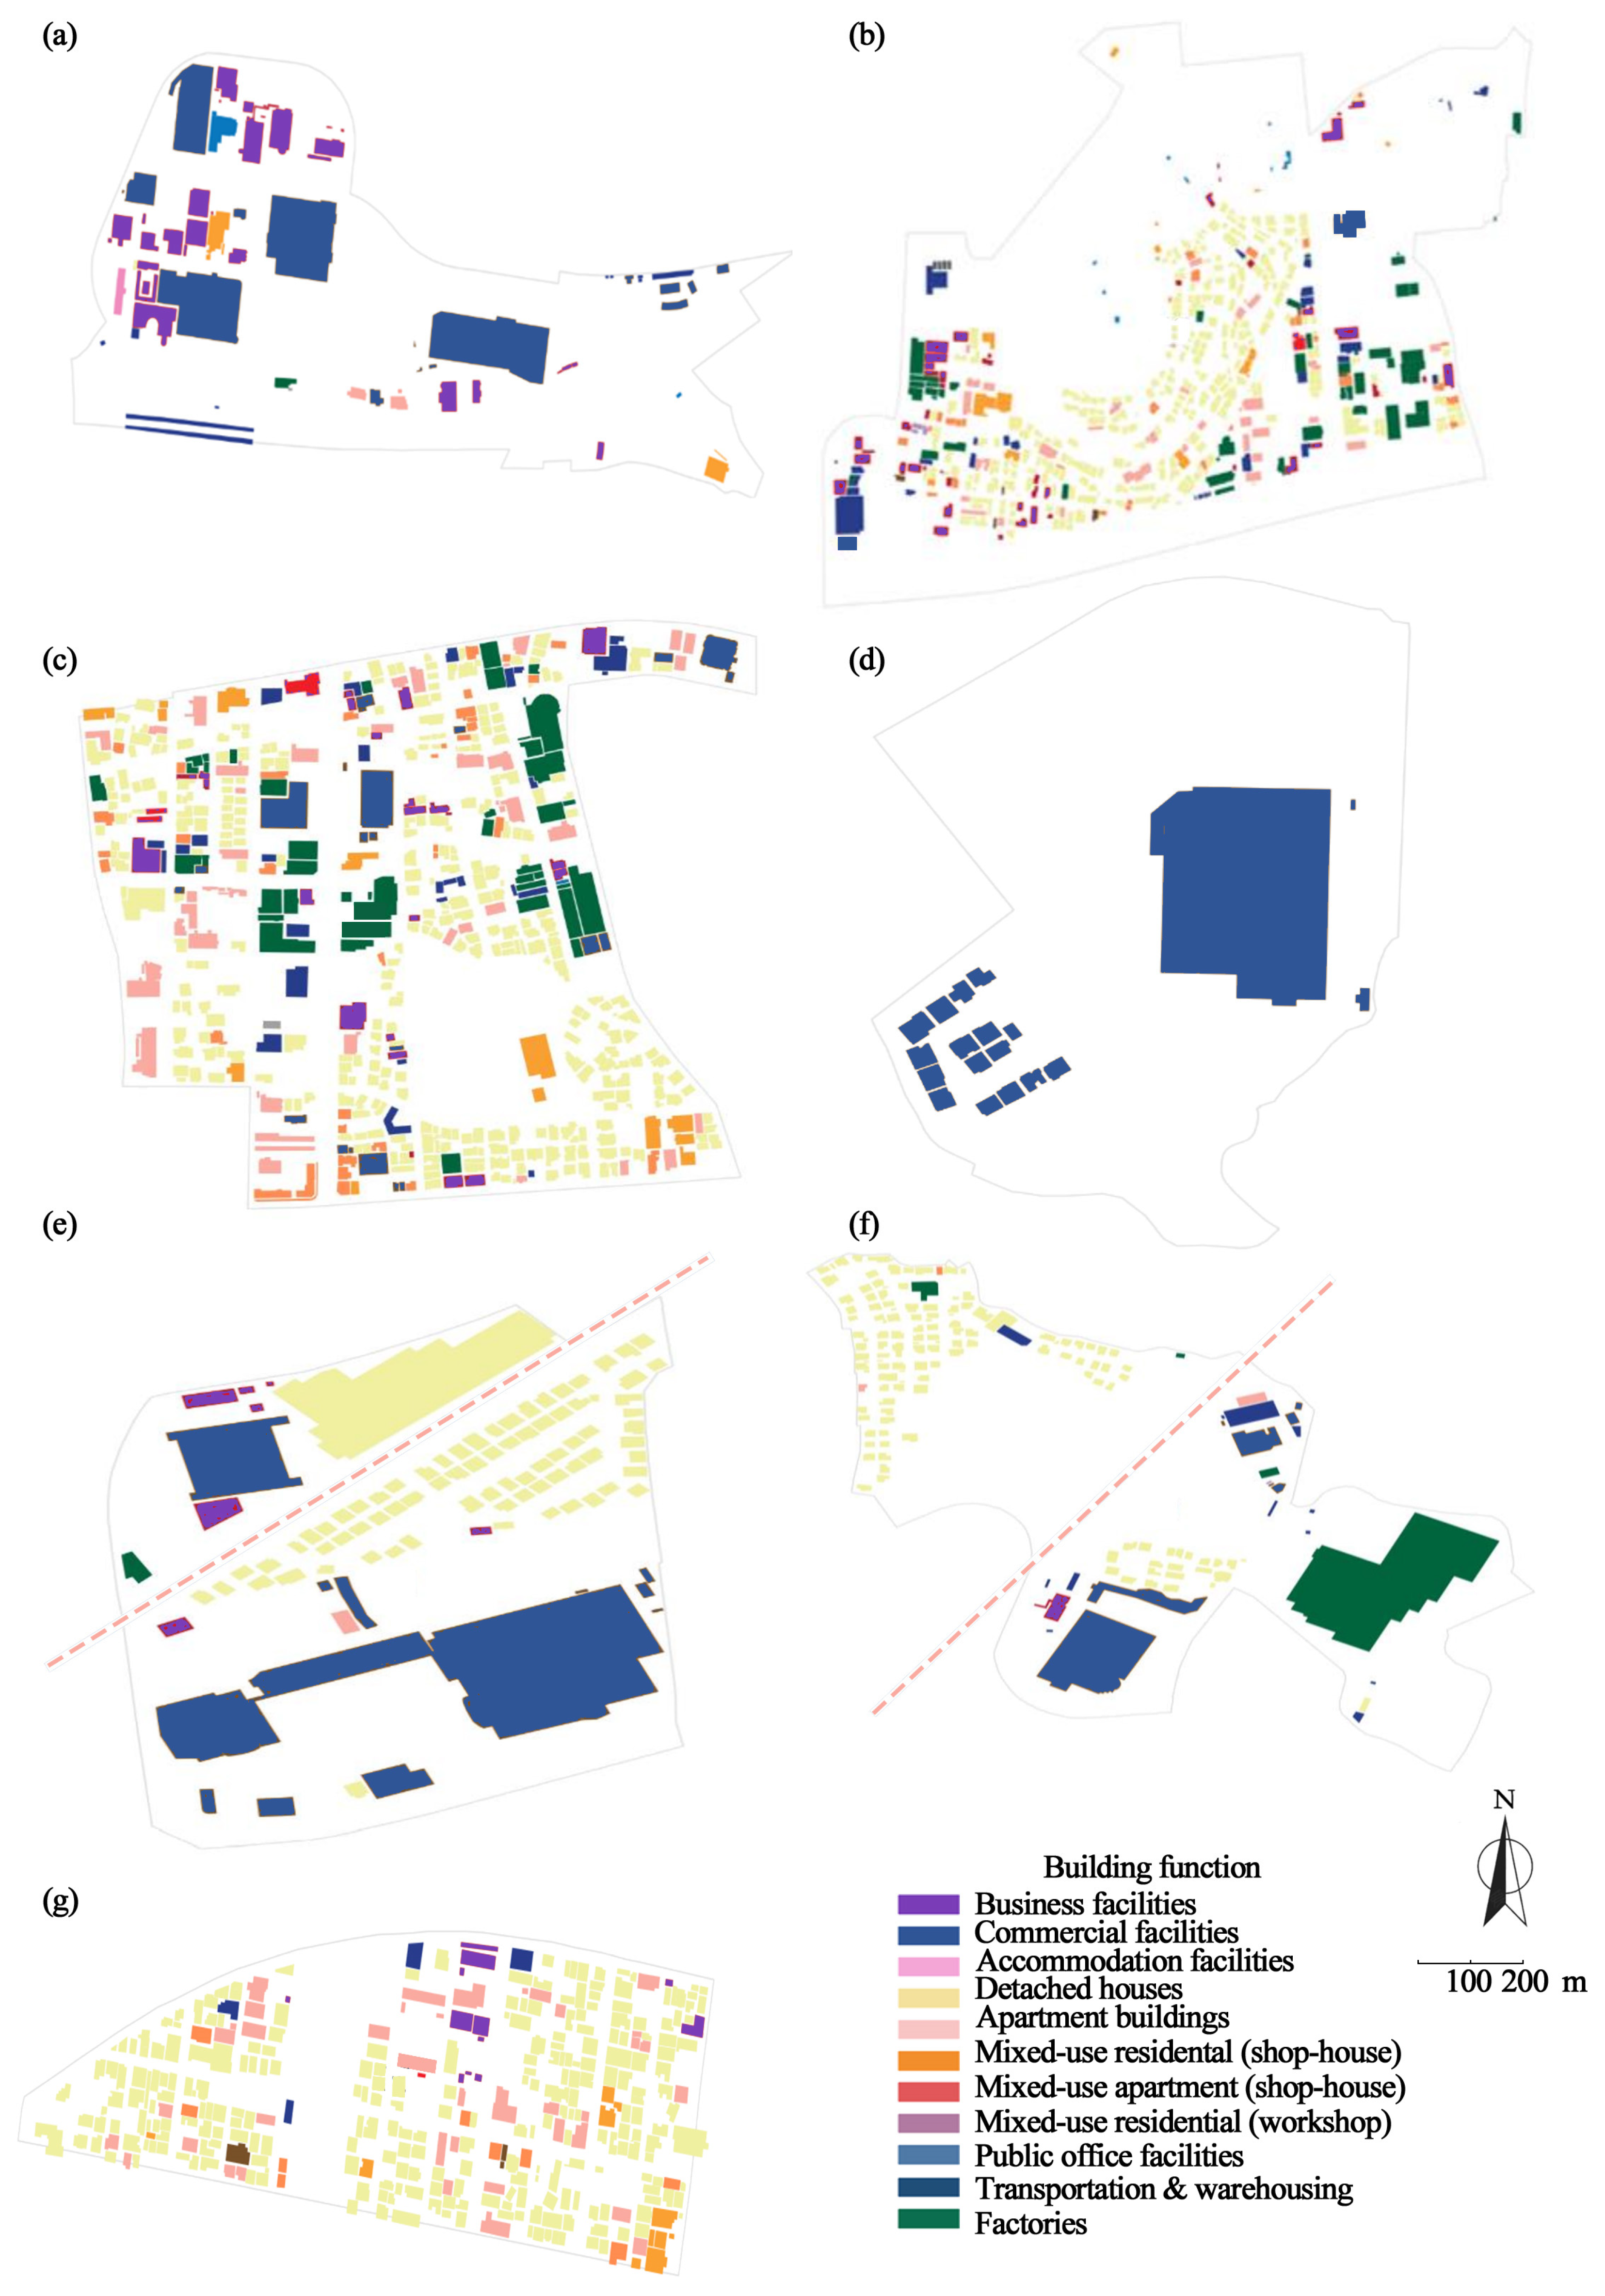
Within the ternary structure, a proportion exceeding one-third indicates that a function constitutes a “significant dominant component,” while proportions below 20% are considered marginal components [51]. Based on this criterion, areas exhibiting substantial attenuation of industrial function were identified as priority adjustment zones. The screening criteria were as follows: (1) the combined proportion of residential and commercial floor area exceeds one-third of the total area (subdivision considered where applicable). This indicates that non-industrial daily-life and consumption-oriented functions are no longer scattered or auxiliary, but have become major components of the district’s functional structure; (2) the proportion of factory use does not exceed one-fifth of the total area, indicating that industrial functions have weakened into marginal or residual functions and that their role in supporting the core function of QIDs has substantially declined; and (3) no excessive multi-functional fragmentation is present. When all of these conditions are met, the district can be considered to have a significant presence of non-industrial functions, while industrial functions have become marginal [36]. 19 districts were identified where the combined residential and commercial floor area exceeded one-third of the total area. Except for District No. 4, the remaining 18 districts had factory proportions below one-fifth of the total area. Ultimately, seven districts met all three criteria (see Figure 7 and Figure 8).
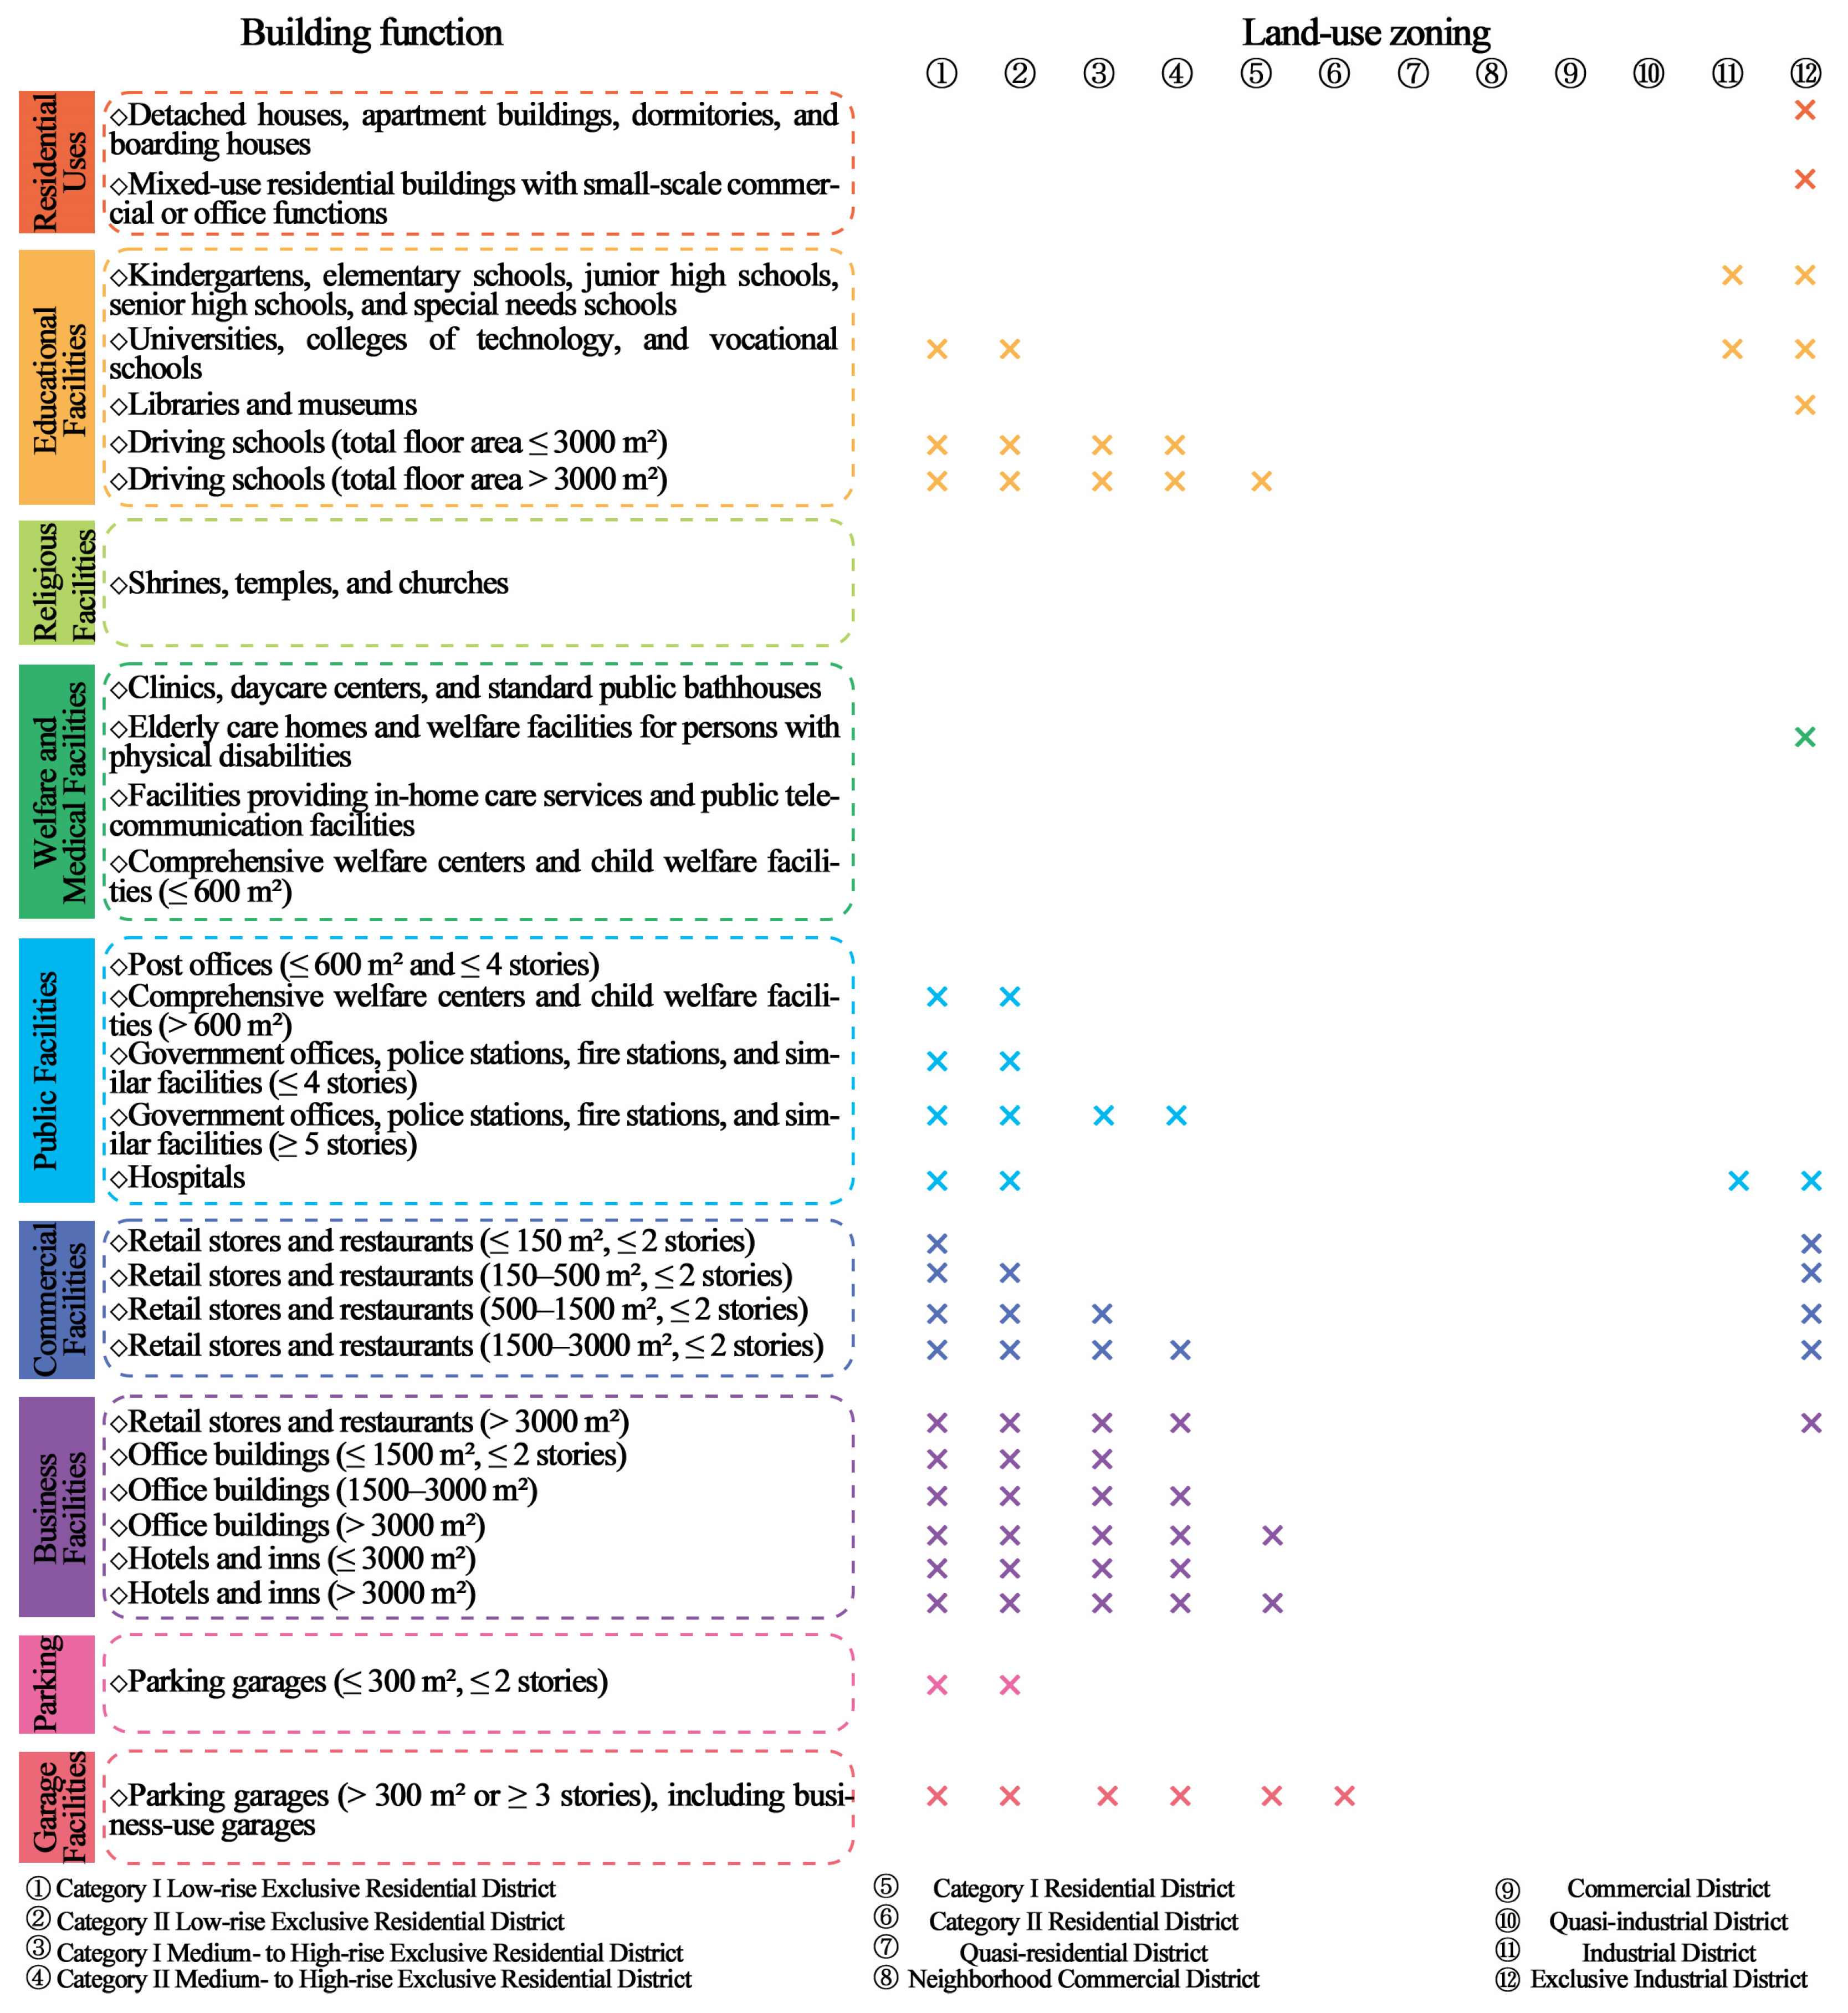
District No. 41 (Figure 8a): Located north of the Kagoshima Main Line and adjacent to a railway station, this district benefits from favorable transportation accessibility. Industrial-use zones are situated to the north, while commercial-use zones surround the other directions. Residential use accounts for 88.15% of total floor area, with detached houses comprising 65.94%, indicating a predominantly low-rise residential character. The area may accommodate small-scale commercial, community-service, and neighborhood office functions. Through the implementation of a District Plan, building height controls can prevent large-scale commercial development. Reclassification to a QRD is recommended. The correspondence between zoning categories and permitted building uses is illustrated in Figure 9.
District No. 30 (Figure 8b): Residential use accounts for approximately 61.29%. It is recommended that the internal core residential area be designated as C1-RD, while peripheral industrial belts may remain as QIDs or be partially reclassified as NCD.
District No. 33 (Figure 8c): The eastern side is adjacent to industrial-use areas, while other directions are predominantly residential. The functional composition is 46.80% residential, 49.86% commercial, and 0.40% industrial. Given that commercial facilities and residential neighborhoods are concentrated east of the central axis, a transitional structure is recommended: C2-RD north of the central axis, QID to the south, and a neighborhood commercial belt in between to mitigate functional conflicts.
District No. 38 (Figure 8d): An urban expressway traverses the central area. The eastern side exhibits diversified land uses with a relatively higher industrial proportion, whereas the western side is predominantly residential. It is recommended that the western portion be reclassified as residential use, with a NCD serving as a transitional buffer between residential and industrial areas to establish a gradient spatial structure.
District No. 29 (Figure 8e): Located south of Kurosaki Castle Ruins, the surrounding area exhibits ring-shaped residential expansion. Residential use accounts for 61.29%, with detached houses representing 38.08%, indicating strong residential attributes. Reclassification as C2-RD is suggested, allowing small-scale commercial facilities.
District No. 28 (Figure 8f): Commercial use accounts for 46.00%, supporting commercial activity along major arterial roads. Reclassification as a NCD is recommended, permitting low-rise residential and commercial mixed use.
District No. 32 (Figure 8g): Business facilities have become concentrated in this district, and it no longer performs the buffering function typical of QIDs. Given its emerging service-oriented economic character, reclassification as a CD or implementation of a business-oriented district plan is recommended.
Based on an integrated analysis of internal land-use composition and surrounding spatial context, the following rezoning principles are proposed:
  • When residential use dominates within a QID and the proportion of industrial function becomes minimal, rezoning to a C1-RD or a QRD is recommended.
  • When residential use is dominant but limited industrial or commercial functions remain, a phased or segmented rezoning strategy should be adopted. Peripheral areas may retain quasi-industrial status or transitional functions to mitigate abrupt land-use conflicts.
  • When commercial use becomes dominant and the district benefits from favorable transportation accessibility, rezoning to a NCD is appropriate.
  • When business facilities are highly concentrated and the district serves a subregional or district-level service function, reclassification as a CD should be considered.
  • For districts exhibiting clear internal spatial differentiation, a gradient transition structure—comprising residential, residential–commercial mixed, and industrial zones—should be established, rather than maintaining a long-term ambiguous mixed-use configuration.
Overall, for districts that still retain an industrial base and locational advantages, industrial space may be protected by clarifying industrial uses and reducing land-use conflicts. For districts that have clearly shifted toward daily-life or commercial functions, rezoning may be considered. For districts that still maintain reasonable mixed-use functions, moderate functional mixing may be maintained through more refined management.
It should be noted that this study identifies the spatial composition of residential, commercial, and industrial functions within QIDs mainly based on building floor-area data. Therefore, the results reflect changes in spatial and functional structure, but do not account for changes in economic structure. Factors such as employment, business activity, and land-market data are closely related to the functional deviation of QIDs, as they can indicate whether land functions have actual economic vitality [52] and help assess the impacts of land-use transformation on local finance and urban governance [53]. Future studies should further incorporate employment density, the number of firms, and changes in land values and rents to evaluate the impacts of QID transformation on land-use efficiency and long-term economic resilience.
To better assist planning authorities in screening priority areas for review from a large number of QIDs, and to provide a spatial basis for subsequent integrated assessment using socioeconomic, environmental, and governance data, this study proposes a three-level set of rezoning-review thresholds based on the proportions of residential, commercial, and industrial building floor areas. These thresholds are intended to serve as early-warning indicators.
When the combined floor area of residential and commercial buildings exceeds one-third and the industrial floor area falls below one-fifth, the QID can be regarded as having a moderate or higher level of zoning–function deviation and should be included in periodic planning review. Within QIDs, industrial functions are usually an important basis for maintaining their institutional character, whereas the increase in residential and commercial functions indicates that the district is shifting toward daily-life and consumption-oriented space.
When the combined floor area of residential and commercial buildings exceeds one-half and the industrial floor area remains below one-fifth, non-industrial functions have become the main structural feature of the district. Such districts can be considered candidates for land-use district reassessment. However, whether they should be reclassified as RDs, QRDs, NCDs, or CDs still requires comprehensive judgment based on surrounding land-use districts, traffic conditions, infrastructure capacity, public service demand, business activity, and residents’ preferences.
When either residential or commercial functions alone exceed two-thirds and the industrial floor area falls below one-tenth, the district can be considered highly residentialized or commercialized, and there may be a strong inconsistency between the current QID designation and the actual building-function composition. Such districts should be prioritized for detailed investigation, including existing firm types, employment scale, changes in land values, development permit records, environmental impacts, and public service provision, in order to determine whether land-use district adjustment or more refined planning management measures, such as a district plan, are necessary.

4. Discussion

4.1. Spatial Manifestation of QIDs and Driving Factors of Land-Use Restructuring

The transformation of QIDs in Kitakyushu can be understood as a process of land-use reorganization shaped by the combined effects of post-industrial urban transformation and spatial restructuring under urban shrinkage. Benefiting from coal resources, port logistics, and related industrial advantages, Kitakyushu was once one of Japan’s major industrial agglomeration areas. As a zoning category with strong land-use compatibility, QIDs historically served as transitional and buffering spaces among production, warehousing, logistics, small factories, commercial facilities, and nearby residential functions [54]. However, after the 1960s, with changes in the energy structure, Kitakyushu’s share of Japan’s manufacturing shipments continued to decline, accompanied by a weakening of industrial functions. At the same time, Kitakyushu has faced declining birth rates, aging, and population decrease [55]. The city’s population peaked in 1979 at 1,086,415, but declined to 972,719 by 2011, representing a 10.5% decrease. By 2020, approximately one in three residents was elderly. Between 2000 and 2020, the total number of workers in Kitakyushu decreased by 12.0%, the number of workers in their 20s decreased by 42.0%, while the number of workers aged 70 and above increased significantly [55]. These changes weakened the demand for traditional manufacturing land while increasing the possibility for daily-life services, commercial facilities, and residential functions to enter former QIDs.
From 1986 to 2024, the total area of QIDs in Kitakyushu increased from 1481 ha to 2055 ha, representing a 38.8% increase. However, this spatial expansion was not accompanied by a corresponding strengthening of industrial functions. Between 2000 and 2024, the number of industry-dominant districts decreased from 19 to 12, whereas the number of commerce-dominant districts increased from 7 to 20. This land-use restructuring is closely related to industrial transformation, demographic change, locational conditions, and the institutional characteristics of the land-use district system in Kitakyushu.
First, deindustrialization weakened the original production functions of QIDs. Kitakyushu’s industrial development had long relied on steel, ports, coal, and heavy and chemical industries, forming a typical coastal industrial belt and a port–railway–industrial spatial structure. With changes in the energy structure, the decline of traditional manufacturing, the relocation of port-related industries, and the shift in the industrial structure toward services, some QIDs that had formerly supported production, warehousing, and logistics no longer required high-intensity industrial use. This process led to a decline in the proportion of industrial buildings [56].
Second, population decline and aging changed the structure of land demand within the city. Under urban shrinkage, demand for traditional industrial employment and production space declined, while demand for daily-life-oriented commercial, service, medical, and residential functions increased. QIDs located near residential neighborhoods or transportation nodes were therefore more likely to be converted into commercial facilities, daily-life service facilities, office facilities, or residential spaces.
Third, locational conditions influenced the direction of functional transformation. QIDs located near transportation nodes or central urban areas generally have higher accessibility and development attractiveness. Once their original industrial functions weakened, these areas were more likely to be reoccupied by commercial, logistics, office, and service functions.
Fourth, the Japanese land-use system itself provides a high degree of land-use compatibility, creating institutional conditions for the gradual functional transformation of QIDs. Unlike EIDs, QIDs allow a certain degree of coexistence among industrial, commercial, and residential functions [57]. Therefore, when industrial demand declines while commercial and residential demand increases, actual building functions can change relatively flexibly.
It is also worth noting that this study found the complete disappearance of the residential–industrial mixed type. This indicates a weakening of the direct mixing relationship between residential and industrial functions within QIDs, with the functional structure becoming more clearly differentiated toward commercialization or daily-life-oriented uses. On the one hand, as traditional manufacturing, warehousing, and logistics functions weakened, areas that originally maintained a certain proportion of industrial use within residential–industrial mixed structures may have gradually shifted toward residential, commercial, or residential–commercial mixed configurations [20]. On the other hand, industrial activities are often associated with noise, freight traffic, safety risks, and environmental externalities. Therefore, when residential functions increase, industrial functions may face stronger neighborhood pressures, complaints, or expansion constraints, which may further encourage their withdrawal from areas with a relatively high residential share [58,59]. In addition, the high land-use compatibility of QIDs makes it easier for former residential–industrial mixed spaces to be replaced by commercial, office, and daily-life service functions under conditions of declining industrial demand and increasing commercial and service demand, thereby shifting toward commerce-dominant or residential–commercial–industrial mixed types [59].

4.2. Implications for Land-Use Governance in Shrinking Industrial Cities

Compared with cities such as Pittsburgh in the United States, where rapid industrial collapse resulted in extensive brownfields and large-scale land abandonment [60], the decline in industrial proportion in Kitakyushu has been relatively gradual. The city has simultaneously pursued spatial restructuring strategies, including the concentration and retention of coastal heavy industries and the increasing residentialization of internal QIDs. Moreover, Japan’s use district system provides a degree of transitional flexibility, offering institutional support for gradual adjustment. However, zoning revisions appear to lag behind spatial realities. When industrial functions decline, zoning classifications should be correspondingly updated; otherwise, a divergence emerges between statutory designation and actual functional composition [61].
In contrast to London, where development corporations and strong policy intervention accelerated large-scale redevelopment [62], rezoning and functional reclassification in Kitakyushu have proceeded more incrementally. Similarly, the Ruhr region in Germany implemented national-level industrial transformation strategies and successfully rebranded industrial heritage as a regional identity, whereas Kitakyushu lacks comparable flagship strategic projects. Instead, spatial renewal has primarily taken the form of localized adjustments. These differences illustrate how institutional frameworks and policy intensity influence land-use transformation processes.
Unlike the transformation of industrial cities in Europe and North America, which is often characterized by large-scale redevelopment of abandoned industrial sites, brownfield regeneration, or the revitalization of old industrial areas led by strong policy agencies, land-use transformation in East Asian post-industrial cities often occurs through small-scale, incremental, and market-driven replacement of building functions. Nagao et al.’s study of Higashi Osaka shows that, in high-density residential–industrial mixed areas, pressure from new apartment construction and residential development may lead to the outward relocation of local manufacturing activities and generate zoning conflicts [20]. Kitakyushu also demonstrates a rebalancing between production functions and residential and commercial functions. However, its transformation is not simply characterized by residential uses displacing industry; rather, it is more clearly reflected in the strengthening of commercial and daily-life service functions. This suggests that, in local industrial cities in Japan, the flexible zoning of QIDs can accommodate multiple functions, but may also gradually weaken production functions during deindustrialization.
East Asian port-industrial cities such as Kaohsiung, Taiwan, have also experienced abandoned industrial land and the decline of surrounding communities during deindustrialization. This reflects a common trend among East Asian industrial cities, in which urban space shifts from production-oriented space toward consumption-, service-, and daily-life-oriented space [63]. However, unlike cases where urban regeneration is promoted through the redevelopment of industrial land, such as industrial heritage reuse or cultural facilities, the transformation of QIDs in Kitakyushu is more dispersed and incremental. It is mainly manifested as continuous changes in building-function composition within statutory zoning.
The transformation of industrial land into residential and mixed uses is not unique to Kitakyushu, but represents a common phenomenon observed in many post-industrial cities. Lai et al. found that, from 2010 to 2018, the area of industrial land in Shenzhen decreased significantly by 881.79 ha during the process of urban renewal [39]. In the Melbourne region of Australia, approximately 2423 ha of industrial land were rezoned between 2000 and 2018, mainly for residential and mixed-use development [59]. However, the increase in commercial and service functions within QIDs does not necessarily mean an improvement in economic vitality. Industrial data for Kitakyushu indicate that, although manufacturing growth has been weak, manufacturing remains an important high-value-added sector in the urban economy [42]. The labor productivity of all industries in Kitakyushu is 4.62 million yen per worker, ranking 17th among the 20 designated cities, whereas manufacturing labor productivity is 6.14 million yen per worker, higher than the average of designated cities. At the same time, Kitakyushu’s manufacturing shipment value is approximately 2.1 trillion yen, ranking 15th nationally, but its growth rate from 2011 to 2020 (−0.7%) was lower than the national average (+6.0%). These data indicate that Kitakyushu has not undergone complete deindustrialization, but is instead at a stage in which the manufacturing base remains important while growth has stagnated. The functional transformation of QIDs may compress manufacturing space that still has relatively high added value, thereby affecting the stability of industrial space and long-term economic resilience [32]. This also suggests that a more refined examination of functional use within QIDs is essential.
Previous studies have shown that industrial functions are more likely to be incompatible with residential and educational functions [20], potentially generating land-use conflicts related to noise, traffic, safety, and environmental risks. Therefore, when residential and commercial functions increase significantly within QIDs while a small amount of industrial function remains, potential risks for planning management may emerge [58]. With industrial neighborhood gentrification, areas that allow residential, commercial, and industrial uses to mix may experience rising rents, real-estate speculation, and land-use conflicts [58]. Noise and traffic impacts in mixed-use areas require special management. Continuing to maintain industrial-related zoning in areas where actual functions have already become daily-life oriented may increase the complexity of environmental management and residential environment coordination [59]. Specially planned industrial zones can, to some extent, protect manufacturing firms from competing and conflicting uses. Therefore, for districts where industrial functions have become clearly marginal, it is necessary to reassess their statutory zoning designation. Functional deviation has thus become an important issue in land-use governance for shrinking industrial cities.
(1) An increase in the area of QIDs does not necessarily indicate a strengthening of industrial functions. Planning management should not judge the actual condition of industrial space solely based on statutory zoning boundaries, but should regularly evaluate the actual composition of residential, commercial, and industrial building functions within each district. Especially under deindustrialization and population shrinkage, QIDs may continue to exist institutionally, while their actual functions may have already shifted clearly toward daily-life and commercial uses [64].
(2) Functional deviation can serve as an important basis for adaptive rezoning. When the proportion of industrial building floor area in a QID declines substantially and residential or commercial functions become dominant, the original planning role of the district as a production-related transitional zone may have weakened. In such cases, adjustment to zoning categories that better reflect actual functions, such as RDs, QRDs, NCDs, or CDs, should be considered in combination with surrounding land-use districts, traffic conditions, infrastructure capacity, and public service demand [65].
(3) For districts that still retain an industrial base, logistics conditions, or agglomerated production activities, industrial functions should be maintained or strengthened in order to reduce residential–industrial conflicts and protect industrial space [60,66]. For districts where industrial functions have become clearly marginal and residential and commercial functions are dominant, formal rezoning should be used to improve planning clarity and avoid the long-term maintenance of ambiguous mixed-use conditions [64]. Differentiated adaptive land-use governance should be implemented, and refined management should be applied to mixed-use districts where functions remain reasonably complementary.
(4) For districts with clear internal functional differentiation, a gradient zoning strategy can be adopted rather than simply maintaining the entire area as a QID [40,67]. For example, areas with concentrated residential functions can be reclassified as Residential Districts; areas along major roads or around stations where commercial facilities are concentrated can be reclassified as Neighborhood Commercial Districts; and peripheral or port-side areas that still retain industrial functions can continue to be maintained as QIDs or industrial uses. By forming a gradient transition structure of “residential–commercial/daily-life service–industrial” functions, land-use conflicts can be reduced while improving the efficiency of infrastructure and public service allocation in shrinking cities.
It is worth noting that existing studies on industrial land transformation often treat industrial land as a single land-use category. In reality, however, there are clear internal differences within industrial land, such as high-tech parks, heavy industry, light industry, and creative industry spaces [32]. The transformation potential and suitable reuse options of different industrial types are not the same. For example, contaminated heavy industrial land is generally not suitable for direct conversion into residential use, whereas light industrial or creative industry spaces may have greater potential for mixed-use development or functional conversion. In this regard, Xue et al. proposed an extended land-use classification coding system [68], Burke et al. examined redevelopment pathways for industrial land subtypes using the coalfields of West Yorkshire in the United Kingdom as a case study [69], and He et al. expanded the direction of industrial space transformation from the perspective of creative industry spaces [70]. Therefore, future research could identify the retention, withdrawal, and reuse pathways of different industrial functions based on more detailed industrial land-use subcategories.

4.3. Limitations and Future Research

Although this study reveals the spatial–functional restructuring process of flexible industrial zoning in Kitakyushu’s QIDs under deindustrialization and urban shrinkage, several limitations remain. (1) this study mainly relies on historical maps and building floor-area data to identify the spatial trend in which QIDs have shifted from industry-dominant functions toward residential, commercial, and daily-life service functions. It does not directly evaluate indicators such as regional economic performance, employment structure, land prices, business activity, residents’ satisfaction, environmental risks, or public service levels. A decline in industrial functions and an increase in commercial and service functions do not necessarily indicate an improvement in economic vitality. Future research should further examine the relationship between functional transformation and economic performance. (2) the functional type classification in this study is based on predefined proportional thresholds. Although this approach is useful for comparing the structural characteristics of different districts, the classification of some districts located close to the threshold boundaries may be affected by the criteria used. (3) this study focuses on Kitakyushu as a case study, and the findings need to be further verified through comparative research with other Japanese and East Asian industrial cities. Future studies could further analyze the evolutionary differences in QIDs or similar flexible industrial zoning categories under different industrial bases, land-use systems, and institutional contexts, in order to more fully explain the influencing mechanisms and specific governance mechanisms behind functional transformation.

5. Conclusions

This study developed a GIS-based quantitative approach to assess structural shift and examined the temporal evolution of functional composition in Quasi-Industrial Districts (QIDs) in Kitakyushu from 1986 to 2024. The results indicate that although the total area of QIDs expanded by 38.8% over the study period, industrial functions declined significantly. Industry-dominant districts decreased markedly, commerce-dominant districts increased substantially, and resident–industrial mixed types gradually disappeared. The functional transformation of QIDs in Kitakyushu is not an isolated land-use change, but rather the result of spatial restructuring shaped by deindustrialization, population decline, aging, and compact city policies. In shrinking industrial cities, adjustments to statutory zoning may lag behind actual functional changes. Therefore, it is recommended that a dynamic evaluation mechanism based on the degree of functional deviation be established to avoid prolonged ambiguous mixed-use conditions and to implement refined management for mixed-use districts with reasonable functional complementarity. Future research should further incorporate data on economic productivity, urban vitality, and public service facilities to analyze the socioeconomic impacts of QID transformation.

Author Contributions

Conceptualization, Y.Z. and N.Z.; methodology, W.G.; software, W.T.; validation, Y.Z., W.G. and N.Z.; investigation, W.T.; writing—review and editing, Y.Z., W.G. and N.Z.; visualization, W.T.; supervision, N.Z. All authors have read and agreed to the published version of the manuscript.

Funding

This research received no external funding.

Institutional Review Board Statement

Not applicable.

Informed Consent Statement

Not applicable.

Data Availability Statement

The data presented in this study are available on reasonable request from the corresponding author.

Acknowledgments

The authors would like to thank all participants for their involvement in this study.

Conflicts of Interest

The authors declare no conflicts of interest.

Appendix A

Table A1. Land-use composition criteria for land-use type classification (Relaxed thresholds).
No.Land-Use TypeResident (%)Commerce (%)Industry (%)
1Resident65–1000–250–15
2Commerce0–6535–1000–35
3Industry0–750–6025–100
4Resident–commerce Mixed40–8515–450–20
5Commerce–Industry Mixed0–5515–7510–50
6Resident–Industry Mixed45–950–255–35
7Resident–Commerce–Industry Mixed40–7515–455–35
Table A2. Land-use composition criteria for land-use type classification (Stricter thresholds).
No.Land-Use TypeResident (%)Commerce (%)Industry (%)
1Resident75–1000–150–5
2Commerce0–5545–1000–25
3Industry0–650–5035–100
4Resident–commerce Mixed50–7525–350–10
5Commerce–Industry Mixed0–4525–6520–40
6Resident–Industry Mixed55–850–1515–25
7Resident–Commerce–Industry Mixed50–6525–3515–25
Table A3. Results of different thresholds.
Land-Use TypeOriginal
Thresholds
Relaxed
Thresholds
Stricter
Thresholds
200020242000202420002024
Resident011101
Commerce720822618
Industry191221131710
Resident–commerce Mixed020213
Commerce–Industry Mixed776588
Resident–Industry Mixed202010
Resident–Commerce–Industry Mixed8150103

References

  1. Jepson, E.J., Jr.; Haines, A.L. Zoning for sustainability: A review and analysis of the zoning ordinances of 32 cities in the United States. J. Am. Plan. Assoc. 2014, 80, 239–252. [Google Scholar] [CrossRef]
  2. Zeitner, R.; Marchionini, M.; Neumann, G.; Irmscher, H. Baunutzungsverordnung (BauNVO). In Flächenmanagement in der ImMobilienwirtschaft: Grundlagen und Konkrete Anwendung; Springer: Berlin/Heidelberg, Germany, 2019; pp. 7–48. [Google Scholar]
  3. Tang, W.-S. Chinese urban planning at fifty: An assessment of the planning theory literature. J. Plan. Lit. 2000, 14, 347–366. [Google Scholar] [CrossRef]
  4. Shapira, P.; Masser, I.; Edgington, D.W. Planning for Cities and Regions in Japan; Liverpool University Press: Liverpool, UK, 1994; pp. 38–42. [Google Scholar]
  5. Alden, J. Some strengths and weaknesses of Japanese urban planning. Town Plan. Rev. 1986, 57, 127–140. [Google Scholar] [CrossRef]
  6. Edgington, D.W. Comprehensive planning in Japanese large cities. Plan. Perspect. 2019, 34, 115–132. [Google Scholar]
  7. Callies, D. Land use planning and control in Japan. In Planning for Cities and Regions in Japan; Liverpool University Press: Liverpool, UK, 1994; pp. 59–70. [Google Scholar]
  8. Miyauchi, T.; Setoguchi, T. Does low urban density increase municipal expenditure? J. Urban Manag. 2023, 12, 375–384. [Google Scholar] [CrossRef]
  9. Sorensen, A. The Making of Urban Japan: Cities and Planning from Edo to the Twenty First Century; Routledge: London, UK, 2005; pp. 67–78. [Google Scholar]
  10. Mano, Y.; Otsuka, K. Agglomeration economies and geographical concentration of industries: A case study of manufacturing sectors in postwar Japan. J. Jpn. Int. Econ. 2000, 14, 189–203. [Google Scholar] [CrossRef]
  11. Huang, Z.; Du, X. Strategic interaction in local governments’ industrial land supply: Evidence from China. Urban Stud. 2017, 54, 1328–1346. [Google Scholar]
  12. Van Der Krabben, E.; Jacobs, H.M. Public land development as a strategic tool for redevelopment: Reflections on the Dutch experience. Land Use Policy 2013, 30, 774–783. [Google Scholar] [CrossRef]
  13. Hamnett, C.; Whitelegg, D. Loft conversion and gentrification in London: From industrial to postindustrial land use. Environ. Plan. A 2007, 39, 106–124. [Google Scholar] [CrossRef]
  14. Curran, W. From the frying pan to the oven: Gentrification and industrial displacement in Williamsburg. Urban Stud. 2007, 44, 1427–1440. [Google Scholar] [CrossRef]
  15. Curran, W. In defense of old industrial spaces: Manufacturing, creativity and innovation in Williamsburg. Int. J. Urban Reg. Res. 2010, 34, 871–885. [Google Scholar] [CrossRef]
  16. Kucera, D.; Milberg, W. Deindustrialization and changes in manufacturing trade. Rev. World Econ. 2003, 139, 601–624. [Google Scholar] [CrossRef][Green Version]
  17. Shelton, B. Learning from the Japanese City: Looking East in Urban Design; Routledge: London, UK, 2012; pp. 89–93. [Google Scholar]
  18. Woo, A.; Lee, S. Illuminating the impacts of brownfield redevelopments on neighboring housing prices: Case of Cuyahoga County, Ohio in the US. Environ. Plan. A Econ. Space 2016, 48, 1107–1132. [Google Scholar] [CrossRef]
  19. Van Duijn, M.; Rouwendal, J.; Boersema, R. Redevelopment of industrial heritage: Insights into external effects on house prices. Reg. Sci. Urban Econ. 2016, 57, 91–107. [Google Scholar] [CrossRef]
  20. Nagao, K.; Edgington, D.W. Local industrial displacement, zoning conflicts and monozukuri planning. Land Use Policy 2023, 134, 106937. [Google Scholar] [CrossRef]
  21. Sacirovic, S.; Ketin, S.; Vignjevic, N. Eco-industrial zones in the context of sustainability development of urban areas. Environ. Sci. Pollut. Res. 2019, 26, 24346–24356. [Google Scholar]
  22. Shirokova, M.I.; Slepnev, P.A. Reorganization of industrial zones into a comfortable urban environment. E3S Web Conf. 2023, 457, 03002. [Google Scholar] [CrossRef]
  23. Chen, H.; Zhan, C.; Liu, S.; Zhang, J.; Liu, H.; Liu, Z.; Liu, T.; Liu, X.; Xiao, W. Pollution characteristics and human health risk of heavy metals. Int. J. Environ. Res. Public Health 2022, 19, 10970. [Google Scholar] [CrossRef] [PubMed]
  24. Wcisło, E.; Bronder, J.; Bubak, A.; Rodríguez-Valdés, E.; Gallego, J.L.R. Human health risk assessment in restoring safe and productive use of abandoned contaminated sites. Environ. Int. 2016, 94, 436–448. [Google Scholar] [CrossRef] [PubMed]
  25. Carsjens, G.J.; Ligtenberg, A. A GIS-based support tool for sustainable spatial planning in metropolitan areas. Landsc. Urban Plan. 2007, 80, 72–83. [Google Scholar] [CrossRef]
  26. Hartmann, B.; Török, S.; Börcsök, E.; Groma, V.O. Multi-objective method for energy purpose redevelopment of brownfield sites. J. Clean. Prod. 2014, 82, 202–212. [Google Scholar] [CrossRef]
  27. Hou, D.; Song, Y.; Zhang, J.; Hou, M.; O’Connor, D.; Harclerode, M. Climate change mitigation potential of contaminated land redevelopment: A city-level assessment method. J. Clean. Prod. 2018, 171, 1396–1406. [Google Scholar] [CrossRef]
  28. Koch, F.; Bilke, L.; Helbig, C.; Schlink, U. Compact or cool? The impact of brownfield redevelopment on inner-city micro climate. Sustain. Cities Soc. 2018, 38, 31–41. [Google Scholar] [CrossRef]
  29. Ma, X.; Chen, H.; Lu, Y.; Luo, Q.; Yan, F.; Li, T.; Zhao, J.; Ding, H. Evaluating blue-green infrastructure for outdoor thermal comfort and energy efficiency in a university campus microclimate: A case study from Xi’an, China. Energy Build. 2025, 350, 116640. [Google Scholar]
  30. Briassoulis, H. Land-use policy and planning, theorizing, and modeling: Lost in translation, found in complexity? Environ. Plan. B Plan. Des. 2008, 35, 16–33. [Google Scholar] [CrossRef]
  31. Van Schrojenstein Lantman, J.; Verburg, P.H.; Bregt, A.; Geertman, S. Core principles and concepts in land-use modelling: A literature review. In Land-Use Modelling in Planning Practice; Springer: Dordrecht, The Netherlands, 2011; pp. 35–57. [Google Scholar]
  32. Wang, T.; Kazak, J.; Han, Q.; de Vries, B. A framework for path-dependent industrial land transition analysis using vector data. Eur. Plan. Stud. 2019, 27, 1391–1412. [Google Scholar] [CrossRef]
  33. Hansen, H.S. Empirically derived neighbourhood rules for urban land-use modelling. Environ. Plan. B Plan. Des. 2012, 39, 213–228. [Google Scholar] [CrossRef]
  34. Elgohary, A.S.; Samra, M.; El-Madawy, A.E.-T. Sustainable urban treatments for mixed-use areas. Civ. Eng. Archit. 2024, 12, 1124–1142. [Google Scholar] [CrossRef]
  35. Zhou, X.; Yeh, A.G.; Yue, Y.; Li, W. Residential-employment mixed use and jobs-housing balance. Land Use Policy 2022, 119, 106201. [Google Scholar] [CrossRef]
  36. Im, H.N.; Choi, C.G. The hidden side of the entropy-based land-use mix index: Clarifying the relationship between pedestrian volume and land-use mix. Urban Stud. 2019, 56, 1865–1881. [Google Scholar]
  37. Song, Y.; Merlin, L.; Rodriguez, D. Comparing measures of urban land use mix. Comput. Environ. Urban Syst. 2013, 42, 1–13. [Google Scholar] [CrossRef]
  38. Zhao, X.; Xia, N.; Li, M. 3-D multi-aspect mix degree index. Comput. Environ. Urban Syst. 2023, 104, 102005. [Google Scholar] [CrossRef]
  39. Lai, Y.; Chen, K.; Zhang, J.; Liu, F. Transformation of industrial land in urban renewal in Shenzhen, China. Land 2020, 9, 371. [Google Scholar] [CrossRef]
  40. Duan, J.; Wang, H.; Liu, L.; Zhang, J. Attraction gradient of urban functions and urban vitality. Cities 2025, 156, 105516. [Google Scholar] [CrossRef]
  41. Liang, J.; Chenal, J.; Xia, N.; Pan, S.; Wang, Z.; Chen, W.; Li, M. Rethinking mixed land use measurement and its driving mechanisms: Beyond traditional frameworks and linear assumptions. Cities 2026, 170, 106681. [Google Scholar] [CrossRef]
  42. Nakanishi, H.; Shibata, H. Kitakyushu, Japan. In Partnerships for the Sustainable Development of Cities in the APEC Region; APEC Policy Support Unit: Singapore, 2017; pp. 183–201. [Google Scholar]
  43. Thompson, J.H. Manufacturing in the Kitakyushu industrial zone of Japan. Ann. Assoc. Am. Geogr. 1959, 49, 420–442. [Google Scholar] [CrossRef]
  44. Shiroyama, H.; Kajiki, S. Eco-town project in Kitakyushu. In Governance of Urban Sustainability Transitions; Springer: Tokyo, Japan, 2016; pp. 113–132. [Google Scholar]
  45. Zhao, Z.; Liu, Z. Development path of industrial heritage tourism in Kitakyushu. Sustainability 2021, 13, 12099. [Google Scholar] [CrossRef]
  46. Herrador, M.; De Jong, W.; Nasu, K.; Granrath, L. Circular cities in Japan. Sci. Total Environ. 2023, 894, 165052. [Google Scholar] [CrossRef] [PubMed]
  47. Gregory, I.N.; Healey, R.G. Historical GIS: Structuring and analysing geographies of the past. Prog. Hum. Geogr. 2007, 31, 638–653. [Google Scholar] [CrossRef]
  48. Herrault, P.A.; Sheeren, D.; Fauvel, M.; Monteil, C.; Paegelow, M. A comparative study of geometric transformation models for the historical “Map of France” registration. Geogr. Tech. 2013, 1, 34–46. [Google Scholar]
  49. Zahari, M.A.Z.; Majid, M.R.; Ho, C.S.; Kurata, G.; Nadhirah, N.; Irina, S.Z. Land use composition and PM10 concentrations. Clean Technol. Environ. Policy 2016, 18, 2429–2439. [Google Scholar] [CrossRef]
  50. Ye, Y.; Van Nes, A. Quantitative tools in urban morphology. Urban Morphol. 2014, 18, 97–118. [Google Scholar] [CrossRef]
  51. Watari, K. Evaluation and Utilization of Land Use and Public Transport in Kitakyushu by Using Geographic Information System. Ph.D. Thesis, The University of Kitakyushu, Kitakyushu, Japan, March 2015. Available online: https://kitakyu.repo.nii.ac.jp/records/438 (accessed on 17 May 2026).
  52. Luo, J.; Wu, Y.; Zhang, L. Prediction and evaluation of industrial land intensive use: Adding policy impact to system dynamics model. Systems 2024, 12, 464. [Google Scholar] [CrossRef]
  53. Paulsen, K. The effects of land development on municipal finance. J. Plan. Lit. 2014, 29, 20–40. [Google Scholar]
  54. Nagahara, M. A research project of Society 5.0 in Kitakyushu, Japan. In Proceedings of the 2019 IEEE Conference on Control Technology and Applications (CCTA), Hong Kong, China, 19–21 August 2019; IEEE: Piscataway, NJ, USA, 2019; pp. 56–74. [Google Scholar]
  55. Peng, W.; Fan, Z.; Duan, J.; Gao, W.; Wang, R.; Liu, N.; Li, Y.; Hua, S. Assessment of interactions between influencing factors on city shrinkage based on geographical detector: A case study in Kitakyushu, Japan. Cities 2022, 131, 103958. [Google Scholar] [CrossRef]
  56. Ortiz-Moya, F.; Moreno, N. Filming industrial Japan: Kitakyushu, rise and decline of the iron town. Reg. Stud. Reg. Sci. 2015, 2, 480–488. [Google Scholar] [CrossRef]
  57. Takeuchi, A.; Motoki, H. Environmental symbiosis and renewal of old industrial districts in Japan: Cases of Kawasaki and Kitakyushu. In New Economic Spaces: New Economic Geographies; Routledge: London, UK, 2017; pp. 146–153. [Google Scholar]
  58. Lechner, C.; Kirisits, C. The effect of land-use categories on traffic noise annoyance. Int. J. Environ. Res. Public Health 2022, 19, 15444. [Google Scholar] [CrossRef] [PubMed]
  59. Grodach, C.; Martin, D. A productive mix? Urban manufacturing in planned industrial zones and mixed-use districts. J. Plan. Educ. Res. 2025, 45, 401–413. [Google Scholar]
  60. Green, J.W. Manufacturing in Place: Industrial Preservation in the US; Portland State University: Portland, OR, USA, 2019; pp. 60–70. [Google Scholar]
  61. Coupland, A. Reclaiming the City: Mixed Use Development; Routledge: London, UK, 2005; pp. 101–106. [Google Scholar]
  62. Hamnett, C. Unequal City: London in the Global Arena; Routledge: London, UK, 2004; pp. 39–43. [Google Scholar]
  63. Chan, H.H.; Hu, T.-S.; Fan, P. Social sustainability of urban regeneration led by industrial land redevelopment in Taiwan. Eur. Plan. Stud. 2019, 27, 1245–1269. [Google Scholar] [CrossRef]
  64. Geyer, H., Jr. The theory and praxis of mixed-use development: An integrative literature review. Cities 2024, 147, 104774. [Google Scholar] [CrossRef]
  65. Ferm, J.; Jones, E. Mixed-use “regeneration” of employment land in the post-industrial city: Challenges and realities in London. Eur. Plan. Stud. 2016, 24, 1913–1936. [Google Scholar] [CrossRef]
  66. Grodach, C.; Taylor, E.; Hurley, J.; Martin, D. Industrial district transitions: Agglomeration and gentrification in urban industrial zones. Int. J. Urban Reg. Res. 2026, 50, 170–190. [Google Scholar]
  67. Kong, W.; Huang, J.; Niu, L.; Chen, S.; Zhou, J.; Zhang, Z.; Guo, S. Innovative framework for identification and spatiotemporal dynamics analysis of industrial land at parcel scale with multidimensional attributes. Cities 2025, 162, 105958. [Google Scholar] [CrossRef]
  68. Xue, B.; Zhang, L.; Geng, Y.; Mitchell, B.; Ren, W. Extended land-use coding system and its application in urban brownfield redevelopment: Case study of Tiexi district in Shenyang, China. J. Urban Plan. Dev. 2016, 142, 05015014. [Google Scholar] [CrossRef]
  69. Burke, H.; Hough, E.; Morgan, D.; Hughes, L.; Lawrence, D. Approaches to inform redevelopment of brownfield sites: An example from the Leeds area of the West Yorkshire coalfield, UK. Land Use Policy 2015, 47, 321–331. [Google Scholar] [CrossRef]
  70. He, J.-L.; Gebhardt, H. Space of creative industries: A case study of spatial characteristics of creative clusters in Shanghai. Eur. Plan. Stud. 2014, 22, 2351–2368. [Google Scholar]
Figure 1. Geographic Location of Kitakyushu.
Urbansci 10 00333 g001
Figure 2. Distribution of QIDs in Kitakyushu (2024). Numbers 1–43 denote the 43 quasi-industrial districts (QIDs) analyzed in this study.
Urbansci 10 00333 g002
Figure 3. Spatial distribution changes in QIDs in Kitakyushu (1986–2024).
Urbansci 10 00333 g003
Figure 4. Functional Composition Analysis of QIDs in Kitakyushu.
Urbansci 10 00333 g004
Figure 5. Structural Evolution Pathways of QIDs in Kitakyushu.
Urbansci 10 00333 g005
Figure 6. Structural Evolution Pathways of Different Functional Blocks within QIDs in Kitakyushu. Blue arrows indicate the direction of functional change from 2000 to 2024.
Urbansci 10 00333 g006
Figure 7. Proportional Distribution of Functional Areas in Key Structural Shift QIDs.
Urbansci 10 00333 g007
Figure 8. Functional Distribution of Key Structural Shift QIDs. Subfigures (ag) show typical spatial configurations of building functions in the selected districts. The red dashed lines in (e) and (f) indicate the dividing boundary between different functional clusters.
Urbansci 10 00333 g008
Figure 9. Building Permission Conditions under Different Functional Districts. Colors represent different building function categories. A colored × indicates that the corresponding building function is allowed in the respective land-use zoning category.
Urbansci 10 00333 g009
Table 1. Land-Use Zoning Areas.
Land-Use DistinctArea (ha)Perception (%)Land-Use DistinctArea (ha)Perception (%)
C1-LRD346916.9NCD7883.8
C2-LRD3031.5CD11805.7
C1-MRD298814.5QID205510.0
C2-MRD70.0ID6203.0
C1-RD452522.0EID389118.9
C2-RD7313.5Total20,582100.0
QRD250.1
Table 2. Classification of Changes in QIDs Based on Time-Series Analysis (1986–2024).
Change TypeNumber of
Districts
Sub-Classification
TypeDistrict ID
Newly designated (Absent in 1986 → Present in 2024)23Port area2,3,4,7,8,19,20,21,27,28,31,33,34,40
Inland area12,18,25,26,32,37,39
Railway/expressway corridor16,17
No change1 5
Area changed19Significant area increase1,6,11,13
Significant area decrease9,10,43
Minor change14,15,22,23,24,29,30,35,36,38,41,42
Table 3. Land-use composition criteria for land-use type classification.
No.Land-Use TypeResident (%)Commerce (%)Industry (%)
1Resident70–1000–200–10
2Commerce0–6040–1000–30
3Industry0–700–5530–100
4Resident–commerce Mixed45–8020–400–15
5Commerce–Industry Mixed0–5020–7015–45
6Resident–Industry Mixed50–900–2010–30
7Resident–Commerce–Industry Mixed45–7020–4010–30
Disclaimer/Publisher’s Note: The statements, opinions and data contained in all publications are solely those of the individual author(s) and contributor(s) and not of MDPI and/or the editor(s). MDPI and/or the editor(s) disclaim responsibility for any injury to people or property resulting from any ideas, methods, instructions or products referred to in the content.