Article

Smart Enforcement of Disability Parking: A Drone-Based License Plate Recognition and Staged Optimization Framework


1
Computers and Control Systems Engineering Department, Faculty of Engineering, Mansoura University, Mansoura 35516, Egypt
2
Department of Electrical Engineering, College of Engineering, Taif University, P.O. Box 11099, Taif 21944, Saudi Arabia
3
Department of Communication Engineering, Nile Higher Institute for Sciences and Computer Technology, Mansoura 35788, Egypt
4
Department of Computer Science, College of Computer Science and Engineering, Taibah University, Yanbu 46421, Saudi Arabia
5
Department of Computer Science and Information, Applied College, Taibah University, Medinah 42353, Saudi Arabia
6
Department of Information Systems, College of Computer Science and Engineering, Taibah University, Yanbu 46421, Saudi Arabia
*
Author to whom correspondence should be addressed.
Urban Sci. 2026, 10(4), 212; https://doi.org/10.3390/urbansci10040212
Submission received: 24 February 2026 / Revised: 2 April 2026 / Accepted: 13 April 2026 / Published: 15 April 2026

Abstract

Unauthorized occupation of parking spaces designated for individuals with disabilities remains a persistent challenge in urban environments, limiting accessibility and inclusive mobility. This paper proposes an integrated UAV-assisted enforcement framework that combines drone-based imaging, onboard license plate recognition (LPR), IoT connectivity, and a staged optimization strategy for energy-aware surveillance. The framework employs a two-phase approach: first, it derives energy-efficient UAV activation patterns via sleep–active scheduling, followed by coverage maximization under energy constraints. The inherently multi-objective problem—balancing energy consumption, coverage, and redundancy—is addressed via a weighted-aggregation formulation, enabling efficient optimization with classical metaheuristic algorithms. Seven algorithms—Genetic Algorithm (GA), Particle Swarm Optimization (PSO), Simulated Annealing (SA), Ant Colony Optimization (ACO), Differential Evolution (DE), Artificial Bee Colony (ABC), and a Greedy baseline—are implemented in both conventional and staged variants to enable comprehensive evaluation. Experimental results demonstrate 32–45% reductions in energy consumption, over 95% coverage effectiveness, and 50–60% faster convergence compared to single-phase approaches, with all improvements statistically significant (p < 0.001). The proposed framework provides a scalable, practically deployable solution for intelligent enforcement of disability parking regulations while also enabling energy-efficient UAV coordination in smart urban monitoring systems.

1. Introduction

Due to rapid population growth and the acceleration of economic activity driven by advancements in science and technology, urban cities are experiencing significant expansion. As the number of automobiles continues to rise, parking has become a substantial challenge in both developed and developing countries. Consequently, traffic management and vehicle supervision systems are under increasing pressure to meet the growing demands. The persistent shortage of parking spaces, coupled with inadequate infrastructure, exacerbates air pollution, traffic congestion, and road accidents. Moreover, the increasing demand for parking in urban environments is often accompanied by various forms of parking violations, including the misuse of spaces reserved for individuals with disabilities and the infringement of other drivers’ rights [1].
Globally, various strategies have been employed for parking management and license plate recognition (LPR) systems. However, limited research has focused specifically on the application of LPR in managing parking spaces designated for individuals with disabilities. Traditionally, manual surveillance by authorities was the most common approach. These methods are labor-intensive and costly, as they require constant monitoring to track vehicles entering and exiting parking areas. Moreover, identifying unauthorized vehicles can be challenging, making these systems inefficient. The lack of effective management of accessible parking spaces often leads to increased misuse and unauthorized occupation [1].
Several studies have investigated time limits and parking infractions through various IoT-based and sensor-based technologies. For instance, hardware-focused designs utilizing RFID and infrared sensors have been proposed to monitor accessible space [2,3]. Other approaches have integrated GSM modules and cloud authentication for real-time alert [4,5], or developed dedicated mobile applications to assist disabled users [6,7,8,9]. However, despite these advancements, these approaches have proven ineffective in fully automated enforcement and have certain limitations. These include the need for frequent hardware maintenance [9], susceptibility to security breaches and connectivity failures [10], and the requirement for specialized personnel to manually operate the systems [11]. The unauthorized use of parking spaces reserved for individuals with disabilities must therefore be addressed effectively and practically.
Gathering large volumes of accurate, relevant, and efficient data is essential to improving decision-making across a variety of applications. Unmanned aerial vehicles (UAVs) offer a highly adaptable approach to data collection. They can be rapidly deployed to hazardous or hard-to-reach areas and dynamically adjust their flight paths to meet varying data-acquisition requirements. For short-term or temporary projects in particular, UAVs are more cost-effective than establishing permanent monitoring stations [12]. Drones are frequently used because they do not require human presence to carry out tasks, are not subject to mechanical fatigue, and can remain operational as long as there is sufficient fuel or battery power. Modern UAVs can be equipped with sensors, GPS modules, antennas, cameras, and electronic speed controllers, among other technological accessories. These components enable features such as flight recording, live video streaming, altitude hold, obstacle detection, hover precision, and more [13]. Notably, UAVs have garnered significant attention in the fields of computer vision, artificial intelligence, and intelligent transportation systems [14].
Drone-based monitoring systems and IoT sensors are essential components of modern traffic control. However, sensor nodes typically have limited power, processing, and storage capabilities. These nodes may consume additional power due to processing and communication overhead, as well as continuous monitoring. As a result, reducing power consumption in IoT-based systems has become a primary focus in recent research on wireless sensor networks (WSNs). One of the most cost-effective strategies for extending the lifespan of a sensor network is sleep scheduling, which enables IoT devices to alternate between sleep and active modes [15].
A central challenge in deploying drone-based monitoring systems for smart parking management—particularly in enforcing accessibility regulations—is the efficient use of limited energy and aerial resources. Covering large or densely populated urban areas often requires multiple drones, which increases both operational cost and energy consumption. Furthermore, uncoordinated drone paths may result in unnecessary overlaps in surveillance coverage, redundant data collection, and inefficient battery use. To address these concerns, this study formulates the problem as a multi-objective optimization task: minimizing the number of drones required to fully cover disability-reserved parking zones, while also reducing power consumption and ensuring continuous monitoring through dynamic sleep-active scheduling. The main contributions of this paper can be summarized as follows:
  • Integrated UAV-Based Violation Detection: A complete drone-assisted enforcement framework is developed to automatically detect unauthorized use of disability parking spaces through real-time object detection and onboard license plate recognition.
  • Novel Staged Multi-Objective Optimization Approach: A two-phase optimization strategy is introduced in which energy efficiency is optimized first through intelligent sleep–active scheduling, followed by coverage maximization under constrained energy budgets, demonstrating superior performance compared to conventional single-phase methods.
  • Energy-Efficient UAV and IoT Coordination: The proposed framework significantly reduces power consumption by dynamically transitioning UAVs and IoT nodes between sleep and active modes, extending operational lifetime without compromising monitoring reliability.
  • Extensive Comparative Algorithm Evaluation: Seven metaheuristic algorithms (GA, PSO, SA, ACO, DE, ABC, and a Greedy baseline) are implemented in both standard and staged variants, producing 14 optimization methods that are systematically compared across multiple real-world scenarios.
  • Interactive Real-Time Monitoring Dashboard: A web-based interface is developed to visualize algorithm progress, monitor UAV performance metrics, and enable interactive control, supporting experimental analysis and operational deployment.
  • Full System Integration and Practical Deployment: The framework unifies UAV platforms, IoT sensing infrastructure, license plate recognition modules, and centralized processing, demonstrating a complete end-to-end solution for scalable, intelligent, and inclusive disability parking enforcement.
The paper’s outline follows: Section 2 introduces the background and related work. Section 3 explores the proposed system architecture. Section 4 and Section 5 present the algorithm implementation and optimization. Section 6 introduces the interactive dashboard system. Section 7, Section 8 and Section 9 present the results and discussion demonstrating the effectiveness of the proposed method. Section 10 concludes the paper.

2. Background and Related Work

This section provides a comprehensive review of the existing literature relevant to smart parking systems, with a focus on disability-reserved parking detection and drone-based monitoring technologies. It is organized into five subsections examining parking detection techniques, disability parking enforcement methods, drone-based surveillance systems, energy-efficient coverage strategies, and optimization approaches.

2.1. Parking Detection Technologies

Parking space identification technologies play a crucial role in minimizing the time drivers spend searching for parking and effectively alleviating traffic congestion by enabling real-time tracking of parking space availability. Consequently, these technologies contribute to the realization of smart cities and enhance the overall quality of urban life [16]. Table 1 presents a comprehensive overview of various parking space detection techniques developed in recent research. Recent advances in deep learning have significantly improved object detection performance in real-time surveillance applications. In particular, the You Only Look Once (YOLO) family of detectors has emerged as a leading approach for real-time vehicle and license plate detection due to its high speed and accuracy. YOLO-based models perform object localization and classification in a single forward pass of the network, making them well-suited for resource-constrained and real-time environments such as UAV-based monitoring systems. In practical license plate recognition (LPR) pipelines, a YOLO detector (e.g., YOLOv5 or YOLOv8) is typically used to identify and crop license plate regions from captured images, after which optical character recognition (OCR) techniques extract the alphanumeric characters. Such modern detection architectures can be integrated into the onboard or edge-based LPR module to enable efficient plate localization under varying viewpoints and illumination conditions typical of aerial imagery.
Ref. [16] explored parking detection using the YOLOv8 algorithm, capturing video data from different scenarios at UTA’45 Jakarta. They compared YOLOv8 with YOLOv5 and demonstrated that YOLOv8 has superior accuracy. Similarly, ref. [17] proposed a method utilizing YOLOv8 with anchor boxes for real-time classification of occupied and vacant slots, achieving high accuracy and operational efficiency.
To address time-based violations, a study in [9] enhanced YOLOv8 by integrating the DeepSORT and OC-SORT tracking algorithms. Unlike [16,17], which focus solely on detection, ref. [9] added a temporal tracking layer, improving enforcement capabilities. In contrast to YOLO-centric approaches, ref. [18] introduced a MobileNetV3-based model trained on PKLot and CNRPark-EXT datasets. Their method achieved 98.01% accuracy, outperforming conventional techniques and demonstrating strong real-time potential.
A high-performance smart License Plate Recognition (LPR) system that combines YOLOv8 for real-time detection with OCR for accurate character extraction is presented in [26]. It leverages multiple public datasets and custom annotations, along with preprocessing techniques such as normalization, augmentation, and privacy-preserving methods. The architecture incorporates convolutional features and attention mechanisms, while edge deployment on devices like Jetson Nano enables low-latency inference. Experimental results show strong performance, achieving over 95% mAP and more than 90% OCR accuracy, making it suitable for intelligent transportation and security applications.
Ref. [27] evaluates different YOLOv8 variants for license plate and character recognition to enhance real-time traffic monitoring systems. Experimental results show that YOLOv8 Nano achieves high precision in plate detection, while YOLOv8 Small performs effectively in character recognition. A custom sequencing approach based on x-axis positioning is introduced to order detected characters correctly. The proposed hybrid pipeline balances computational efficiency and accuracy, making it suitable for edge-based intelligent transportation applications.
A lightweight and efficient license plate recognition approach designed for challenging conditions, such as complex backgrounds and plate distortions, is proposed in [28]. The optimized detection model reduces parameters and file size by about 32% while maintaining accuracy, making it suitable for resource-limited devices. Additionally, an improved LPRNet enhances recognition accuracy with minimal impact on model size. Overall, the system achieves robust performance with low storage requirements, supporting effective deployment on edge computing platforms.
Ref. [29] compares YOLOv10n and YOLOv11n for license plate detection integrated with EasyOCR in intelligent transportation systems. Results indicate that YOLOv11n outperforms YOLOv10n in precision, recall, accuracy, and F1-score across both validation and test datasets. It also achieves better character recognition performance using fuzzy matching techniques and shows greater robustness to image preprocessing distortions. Overall, YOLOv11n is identified as a more reliable and efficient model for real-time LPR applications, particularly in resource-constrained environments.
A unified single-stage LPDR framework that simultaneously performs license plate detection and character recognition, improving efficiency over traditional multi-stage methods, is presented in [26]. It introduces a new nighttime dataset (NightLPBD) to address performance limitations under low-light conditions. Experimental results show that YOLOv10x achieves strong performance, with high F1-score and average precision, especially when trained on combined day and nighttime data. The findings highlight the importance of incorporating nighttime images to enhance model robustness in real-world environments.

2.2. Disability Parking Detection and Enforcement

With the rising number of vehicles, monitoring parking spaces reserved for individuals with disabilities has become increasingly critical. Current approaches range from hardware-based sensor systems to AI-powered recognition platforms, each with distinct advantages and limitations. Table 2 provides a detailed analysis of different techniques for detecting and managing disability-reserved parking spaces.
Ref. [1] introduced “Shine,” a deep learning system incorporating YOLOv5s, YOLOv7, YOLOv4, and Faster R-CNN. It recognized license plates and access badges with 92.16% mAP, offering retrainable modules for international use. This deep learning-centric approach contrasts with [2], who used RFID and infrared sensors linked to a mobile app to enable space reservations and alarm-based alerts.
Ref. [3] proposed a hardware-focused design using Arduino Uno, RFID, and buzzers to identify legitimate vehicles. Ref. [4] enhanced this setup by integrating a GSM module to alert authorities via coordinates when violations occurred. Ref. [5] combined RFID, cloud-based authentication, LEDs, and ultrasonic sensors to improve access control and reporting.

2.3. Drone-Based Surveillance and Recognition Systems

The combination of drones and AI has revolutionized autonomous surveillance. Drone-based recognition systems are increasingly used for traffic monitoring and parking enforcement. Recent developments have focused on integration with optimization algorithms and energy management systems. Table 3 summarizes various drone-based detection methods used in intelligent traffic and parking surveillance applications.
Ref. [30] suggested a cooperative multi-UAV architecture for intelligent and inclusive parking enforcement. The suggested system combined many unmanned aerial vehicles (UAVs) working together to provide scalable, adaptable, and real-time parking spot monitoring for people with disabilities. The framework’s key component, the lightweight object detection model YOLOv8n, was used to efficiently and accurately detect vehicles and accessibility marks in real-time, even in onboard UAV situations with limited resources. The system used ByteTrack to enable dependable vehicle identification and movement analysis, which was crucial for identifying parking infractions over time as opposed to single-frame observations. This ensured strong tracking over successive frames. In order to confirm vehicle authorization in designated parking zones, the system furthermore offered onboard or edge-based License Plate Recognition (LPR). A wireless charging system was incorporated to circumvent the operational constraints of battery-powered UAVs, enabling autonomous recharging and continuous surveillance coverage without human involvement.
Ref. [31] modeling an integrated UAV–IoT framework enriched with Large Language Models (LLMs) within Smart Urban (SU) multi-objective simulated settings, their study expanded the applicability beyond the basic system architecture. The suggested expansion showed how intelligent coordination between UAVs and IoT infrastructure may progress beyond parking enforcement toward adaptive urban traffic efficiency. It was inspired by the research Disabled Smart Parking Management with RFID Technology. In their framework, UAVs acted as mobile sensing and monitoring agents, continuously capturing real-time data on parking occupancy, vehicle flow, and violation patterns. This data was transmitted through IoT-enabled communication layers to a centralized or edge-based system, where LLMs were utilized to interpret contextual information, generate adaptive control strategies, and support high-level decision-making. Unlike traditional rule-based systems, LLM-driven models could dynamically adjust system behavior based on evolving traffic conditions, historical trends, and policy constraints.
Ref. [14] employed an improved deep learning architecture called PVswin-YOLOv8s, which combines the baseline YOLOv8s model with Swin Transformer blocks, to considerably increase detection performance in challenging aerial surveillance circumstances. Their hybrid approach integrated transformer-based techniques to capture long-range relationships and global contextual information inside the picture, while utilizing the advantages of convolutional neural networks (CNNs) for effective local feature extraction. In particular, the Swin Transformer modules were included in the core of YOLOv8s to improve feature representation at all scales, which was especially useful in UAV-based data with complicated backdrops, occlusions, and small object sizes. The model delivered enhanced spatial awareness and resilience in identifying cars and accessibility marks from aerial viewpoints by enabling hierarchical feature learning and shifting window-based self-attention.
The VisDrone2019 benchmark dataset, which was well-known for its difficult real-world drone footage, was used to validate the efficacy of the suggested PVswin-YOLOv8s model. According to experimental data, the hybrid model improved the mean Average Precision (mAP) by about 4.8%, outperforming the traditional YOLOv8s baseline. This improvement in performance demonstrated the model’s exceptional capacity to precisely identify tiny, widely dispersed objects in a variety of environmental settings.
While ref. [4] focused on detection refinement procedures inspired by the IoT-Based Disabled Parking System (DiParkSys) v2.0, built on Arduino Uno, in addition to high-level detection and tracking. DiParkSys v2.0 emphasizes the need to integrate IoT-driven validation layers to improve the precision and dependability of parking status recognition, whereas previous methods mainly concentrated on initial car detection. Building on their idea, the suggested system incorporated multi-stage verification procedures that decrease false positives and false negatives by combining optical detection outputs with data from IoT sensors. For example, ground-level IoT signals (such as RFID tags, proximity sensors, or embedded parking sensors) were used to cross-validate occupancy detection obtained from UAV-based vision models. The robustness of enforcement choices was increased by this layered approach, which guarantees that detected cars are not only visually identified but also contextually confirmed. Ref. [31] highlighted the need for UAV-based geo-referencing for precise localization and mapping of traffic and parking-related signage. In their case, the Faster R-CNN model was used to scan UAV-captured aerial data in order to identify and categorize traffic signs, including those designating parking zones for people with disabilities. Beyond simple detection, the system used geo-referencing methods that use spatial mapping algorithms and onboard GPS data to link each observed sign to exact geographic coordinates. This made it possible to produce location-aware, dynamically updated maps of accessible parking facilities, which were crucial for tracking compliance and directing enforcement tactics in real time. The accuracy of sign localization and classification was much increased when Faster R-CNN was integrated with UAV-based geo-referencing, according to experimental assessment. The system’s capacity to accurately identify limited parking zones and associate them with observed cars and license plate data was therefore strengthened. All things considered, their contribution emphasizes how crucial it was to integrate sophisticated object identification models, geographical awareness, and domain-specific information to allow more accurate, context-aware, and scalable smart parking enforcement systems, especially for infrastructure that was accessible to people with disabilities.

2.4. Energy-Efficient Area Coverage Strategies

Reducing energy consumption in IoT-based wireless sensor networks (WSNs) remains a key challenge. Sleep scheduling algorithms are commonly used to turn off redundant nodes while maintaining area coverage [15]. Recent advances in metaheuristic optimization have enabled more sophisticated energy management approaches that consider dynamic environmental conditions and adaptive resource allocation.
Modern energy management frameworks employ multiple optimization objectives, including coverage maximization, energy minimization, and overlap reduction. These multi-objective approaches have demonstrated significant improvements over traditional single-objective methods, particularly in scenarios requiring extended operational periods.

2.5. Research Gap Analysis

A critical analysis of the existing literature (Table 1, Table 2 and Table 3) reveals that, despite notable advancements in parking detection, disability-oriented systems, and UAV-based surveillance, several fundamental limitations remain unresolved.
Limited focus on accessibility enforcement: The majority of existing studies concentrate on generic parking occupancy detection (Table 1), with limited consideration of the unique regulatory, ethical, and operational requirements associated with disability-designated parking spaces. Even specialized systems (Table 2) primarily address identification mechanisms (e.g., RFID or badge recognition) without integrating real-time spatial enforcement or violation validation within dynamic parking environments.
Dependence on fixed ground infrastructure: Current solutions predominantly rely on fixed cameras, embedded sensors, or RFID-based architectures, which constrain scalability and adaptability in large-scale or dynamically changing urban settings. These infrastructure-heavy approaches introduce high installation and maintenance costs, while lacking the flexibility required for wide-area monitoring and rapid deployment.
Insufficient utilization of UAVs for intelligent enforcement: While UAV-based systems have demonstrated strong potential in traffic monitoring and object detection (Table 3), their application to automated enforcement of disability parking regulations, particularly through the integration of real-time object detection and onboard license plate recognition (LPR), remains limited. Existing UAV studies largely focus on detection tasks rather than closed-loop enforcement workflows.
Lack of comprehensive and comparative optimization frameworks: Existing research in UAV-assisted surveillance typically employs single-algorithm optimization strategies or evaluates performance under constrained scenarios. This limits the understanding of algorithm robustness and adaptability across diverse operational conditions and lacks systematic comparative analysis across multiple metaheuristic approaches.
Simplistic energy management models in UAV systems: Although energy-efficient coverage strategies have been explored, most approaches rely on basic sleep scheduling or static activation mechanisms. These methods do not adequately capture the complex trade-offs between energy consumption, coverage effectiveness, and redundancy reduction, particularly in UAV-enabled monitoring systems where energy is a critical constraint.
Persistent reliance on manual enforcement mechanisms: Despite technological advancements in detection and monitoring, enforcement of disability parking regulations remains largely manual, labor-intensive, and prone to inconsistency. This highlights a gap between detection capabilities and practical, automated enforcement systems suitable for real-world deployment.
Absence of an integrated UAV-based enforcement ecosystem: To the best of our knowledge, no existing framework combines UAV-based imaging, real-time license plate recognition, IoT connectivity, and advanced staged optimization within a unified system specifically tailored for inclusive parking enforcement. This lack of integration limits the transition from isolated technological components to scalable, deployable smart city solutions.

3. System Architecture and Implementation

This section presents the design and implementation of the proposed UAV-assisted enforcement framework for disability parking monitoring. It outlines the overall system architecture and describes the interaction between UAVs, IoT sensors, and cloud-based processing modules. The operational workflow is detailed to illustrate real-time detection, verification, and enforcement processes. Furthermore, the section provides technical specifications of the hardware components, the license plate recognition (LPR) system, and the database infrastructure that enable scalable and energy-efficient system operation.
Comprehensive System Overview: By integrating ground sensors, drones, and real-time data processing, the proposed drone-based surveillance system aims to enforce disability parking laws and ensure equitable use of disability parking spaces within an innovative city framework. The system architecture consists of three main components: the frontend interface, the backend processing engine, and the real-time communication layer.
The system’s central component is a drone equipped with a high-resolution camera, selectively activated by an energy-efficient Internet of Things infrastructure with sensors embedded in the ground at each parking space. A sensor is installed in every parking space reserved for people with disabilities, and the system begins operating when a car pulls into that space. The parking space’s ground is equipped with infrared (IR) [35] and magnetic [36] sensors that provide accurate vehicle detection capabilities.
Using energy-efficient sleep scheduling, the ground sensor detects when a car is parked in the designated area and signals the closest drone, ensuring that only the nearest drone is activated to conserve energy. The drone, equipped with a high-resolution camera, flies to the location and scans the license plate of the automobile, as well as the disability card previously obtained. Each disability card is affixed to a vehicle’s windscreen and is specific to a legitimate license plate. The license plate’s validity period determines the disability card’s validity.
The drones verify disability cards and scan vehicle plates in real time using a License Plate Recognition module. An optimization engine analyzes this data and decides on drone deployment, response timing, and data validation procedures to improve system efficiency and reduce resource consumption. This data is transferred to a central database to confirm whether the license plate belongs to a car permitted to use the space. Authorities and civic officials can monitor results and enforcement actions in real time, receive notifications and status updates, and view historical data through an interactive dashboard.
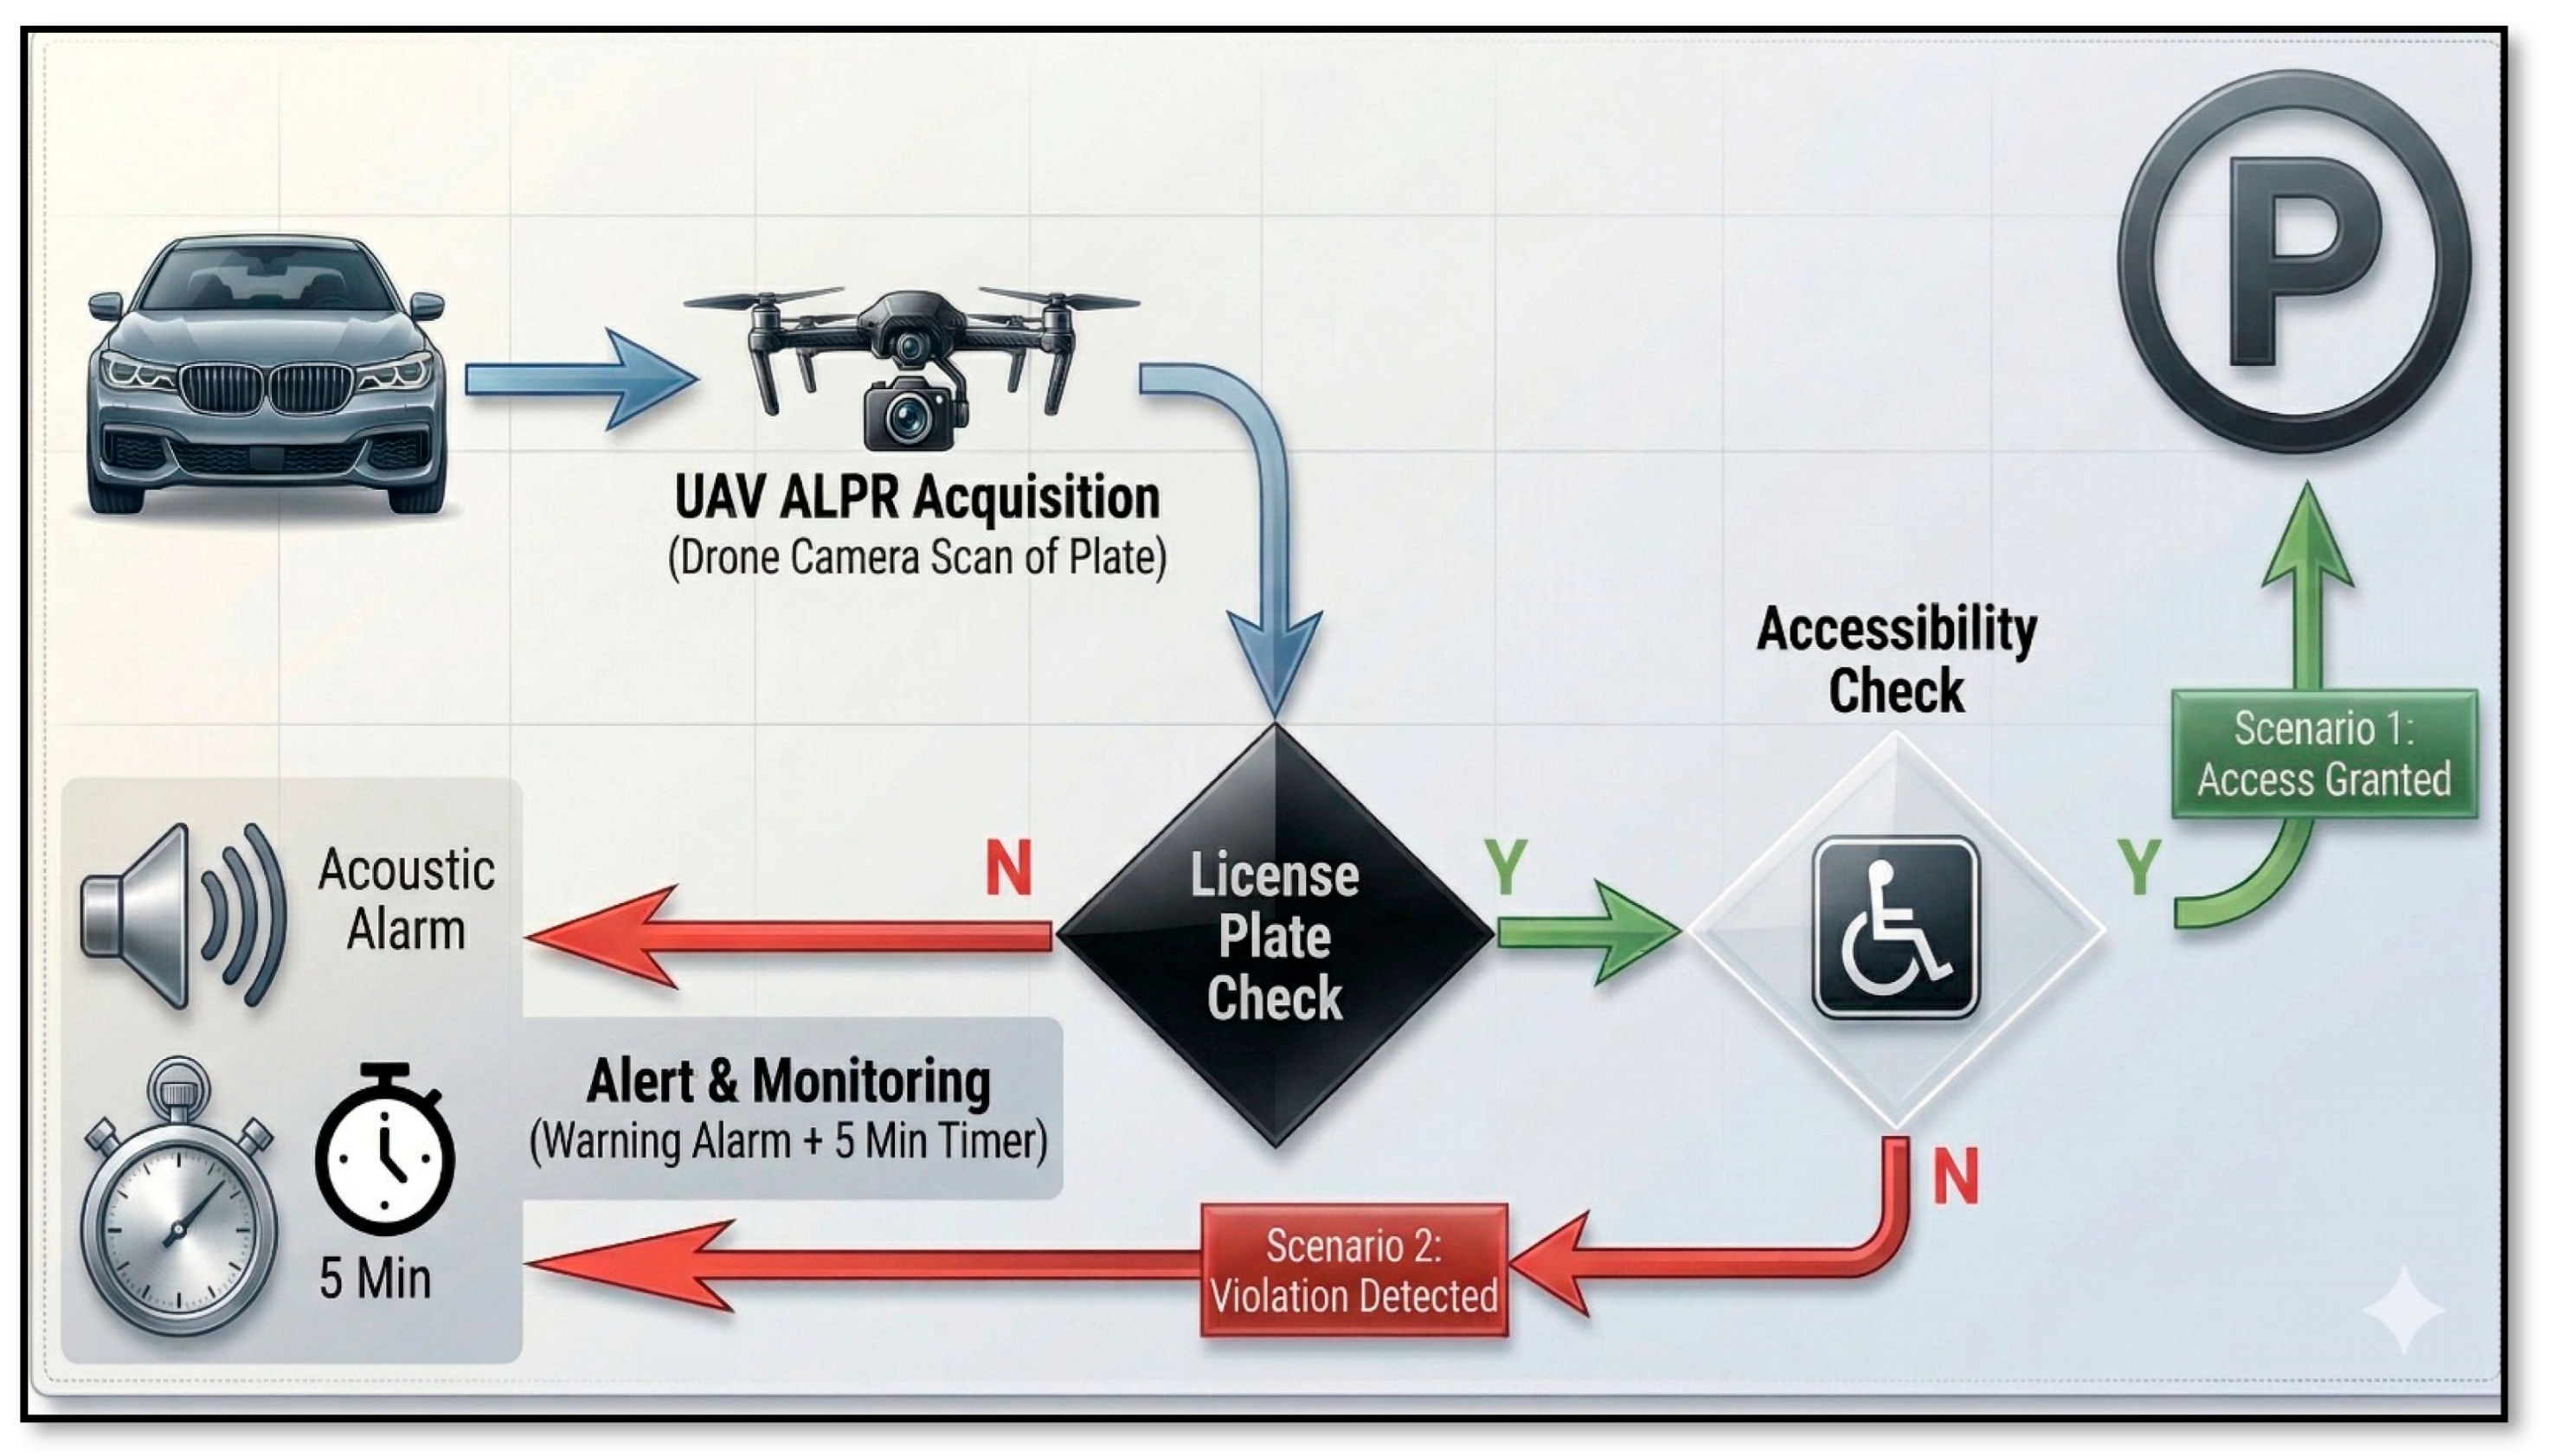
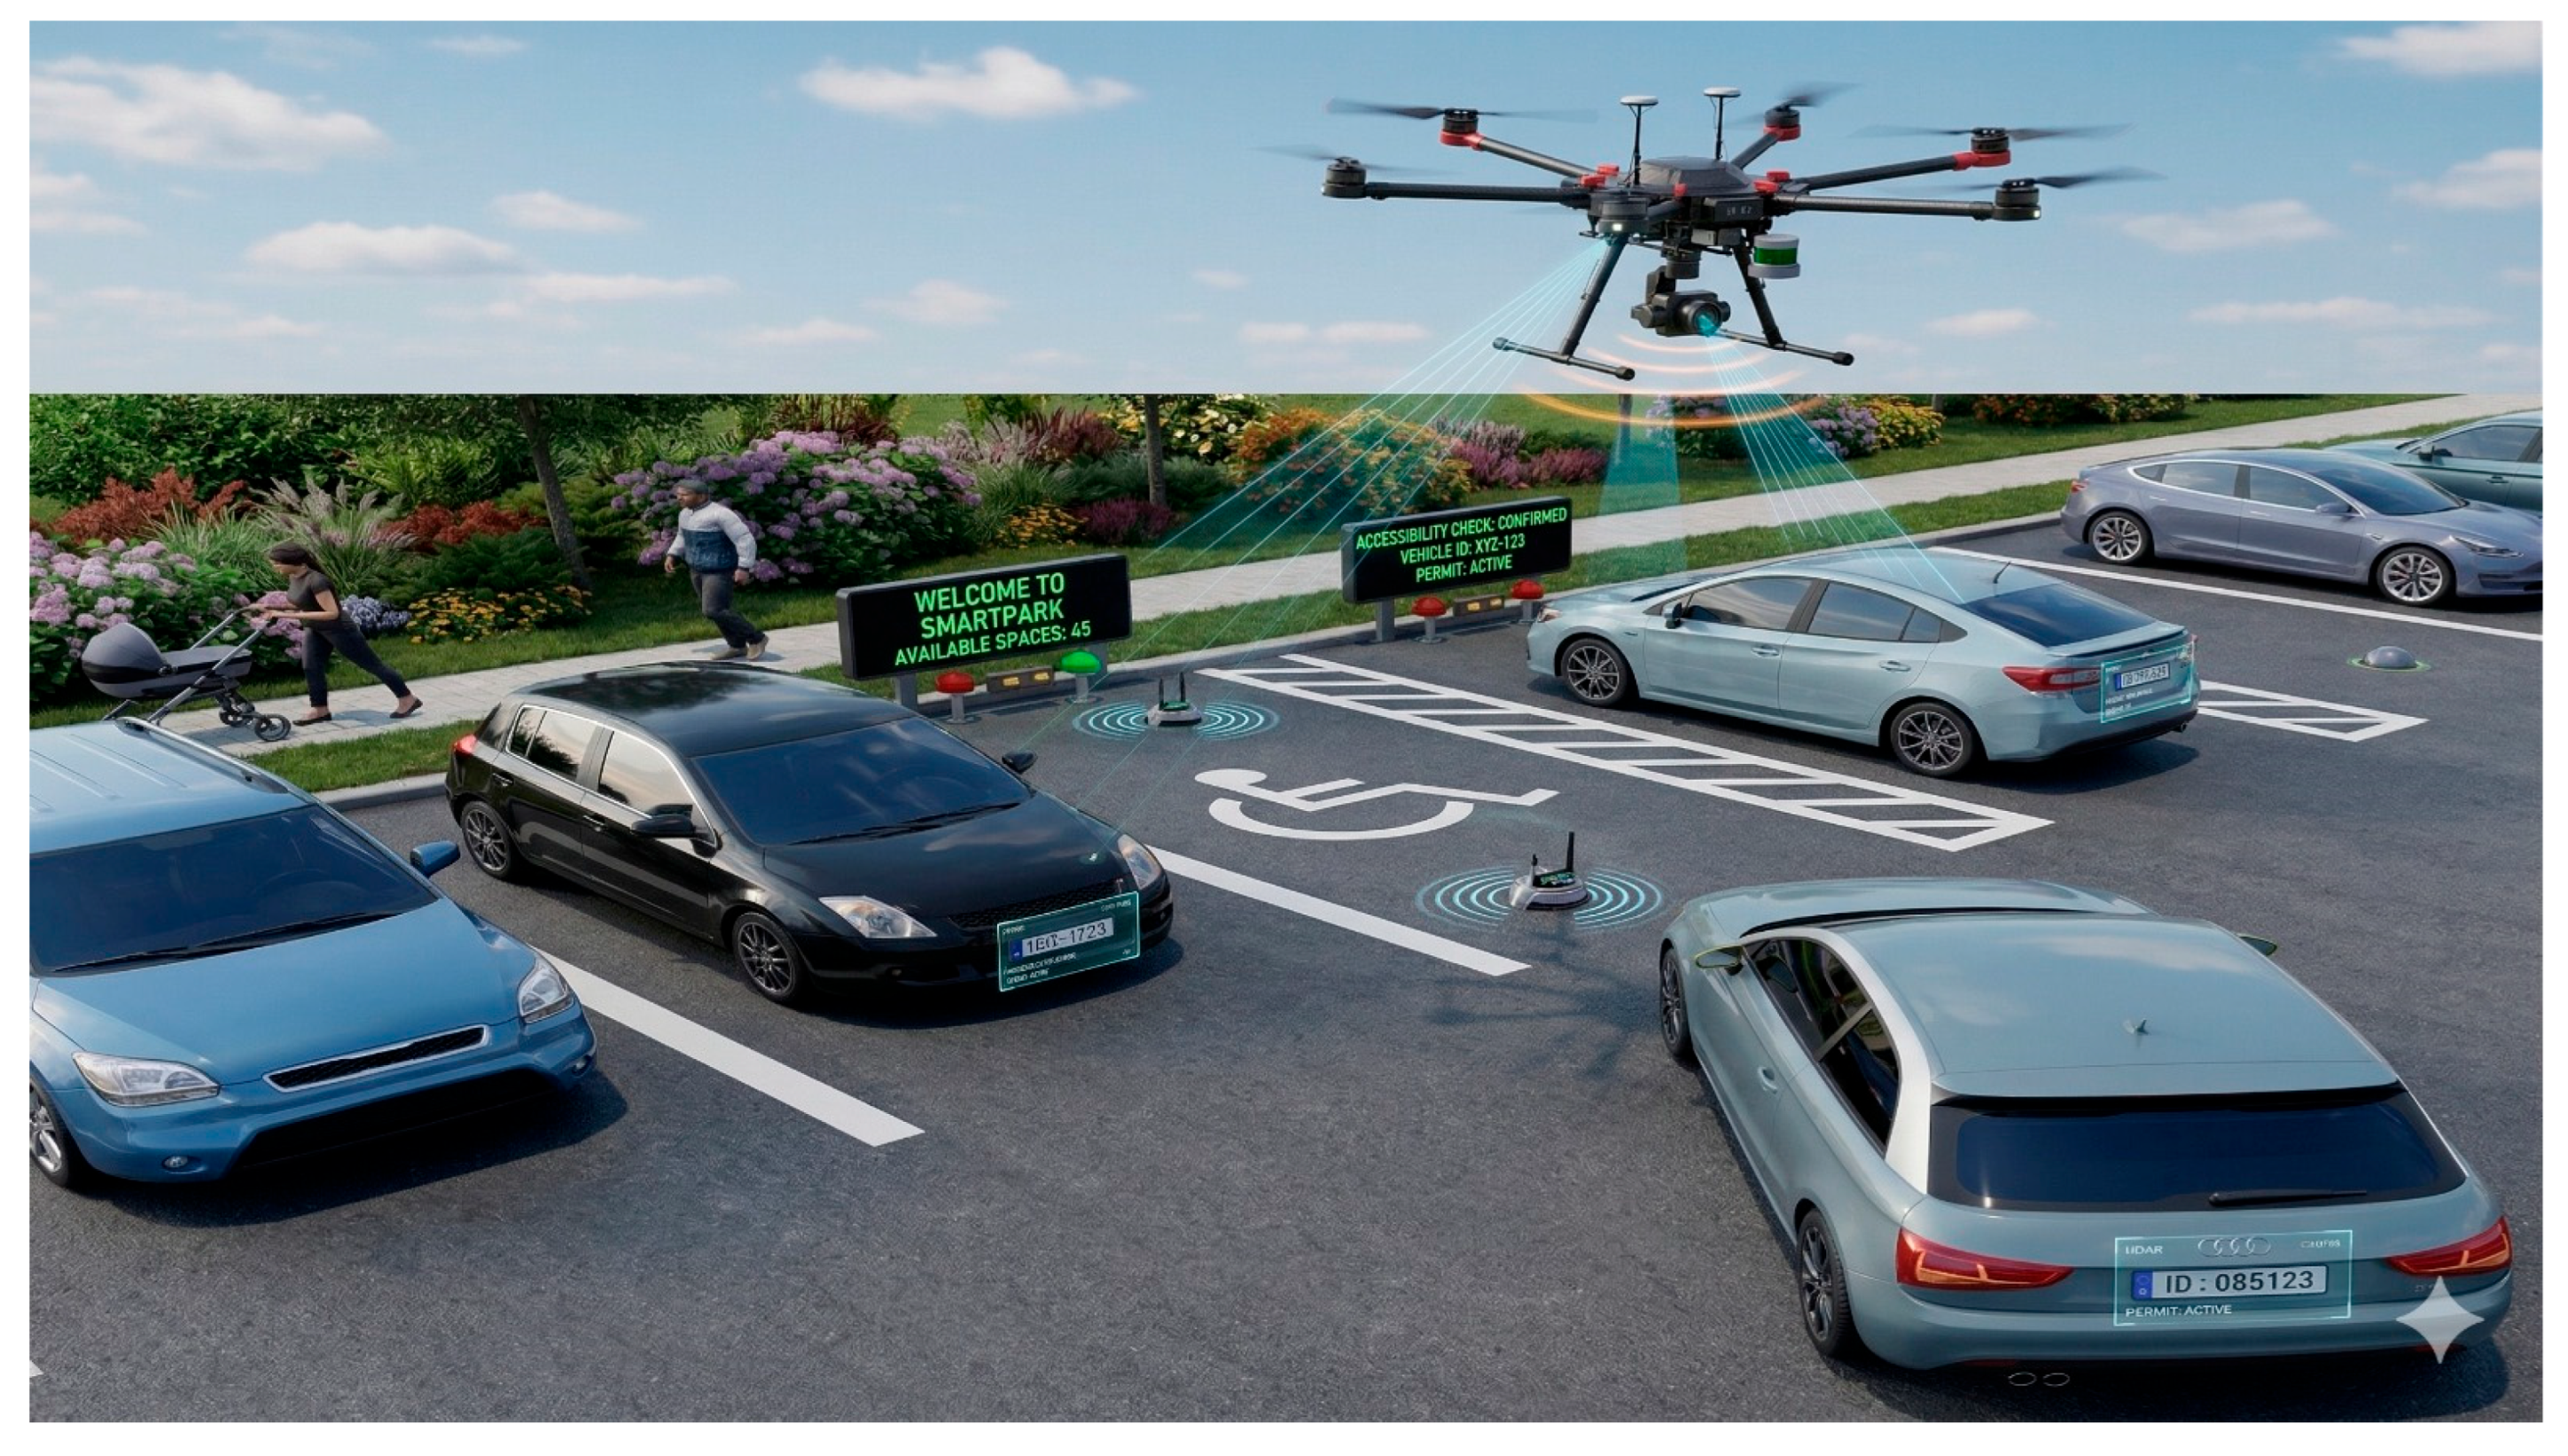
Operational Scenarios and System Workflow: The system provides an adjustable grace period (configured to five minutes for our pilot experiment) for the driver to complete the parking process. This duration serves as a flexible system parameter that can be dynamically modified to align with specific local municipal parking regulations and enforcement policies. At this stage, two scenarios are discussed, as illustrated in Figure 1. In the first case, the informational screen shows “Allowed” (Authorized to park here) when the car has a valid disability card.
The camera successfully captures the license plate when the vehicle is parked in the designated lot and transmits the data to the cloud server. The server verifies whether the number plate is present in the database of disabled drivers’ number plates. The vehicle owner may use the reserved parking lot if the license plate is in the database. Otherwise, the parking enforcement agency is notified if the number plate number is not in the database, and the process of removing the vehicle and imposing a fine on the driver is initiated.
In the violation scenario, if the car is not permitted in an accessible parking space, the information screen will notify the driver to vacate the parking area. A buzzer and a red warning light will accompany this. The screen will display “Not Allowed” (Not authorized to park here), and the vehicle number will be linked to a violation record immediately, as shown in Figure 2.
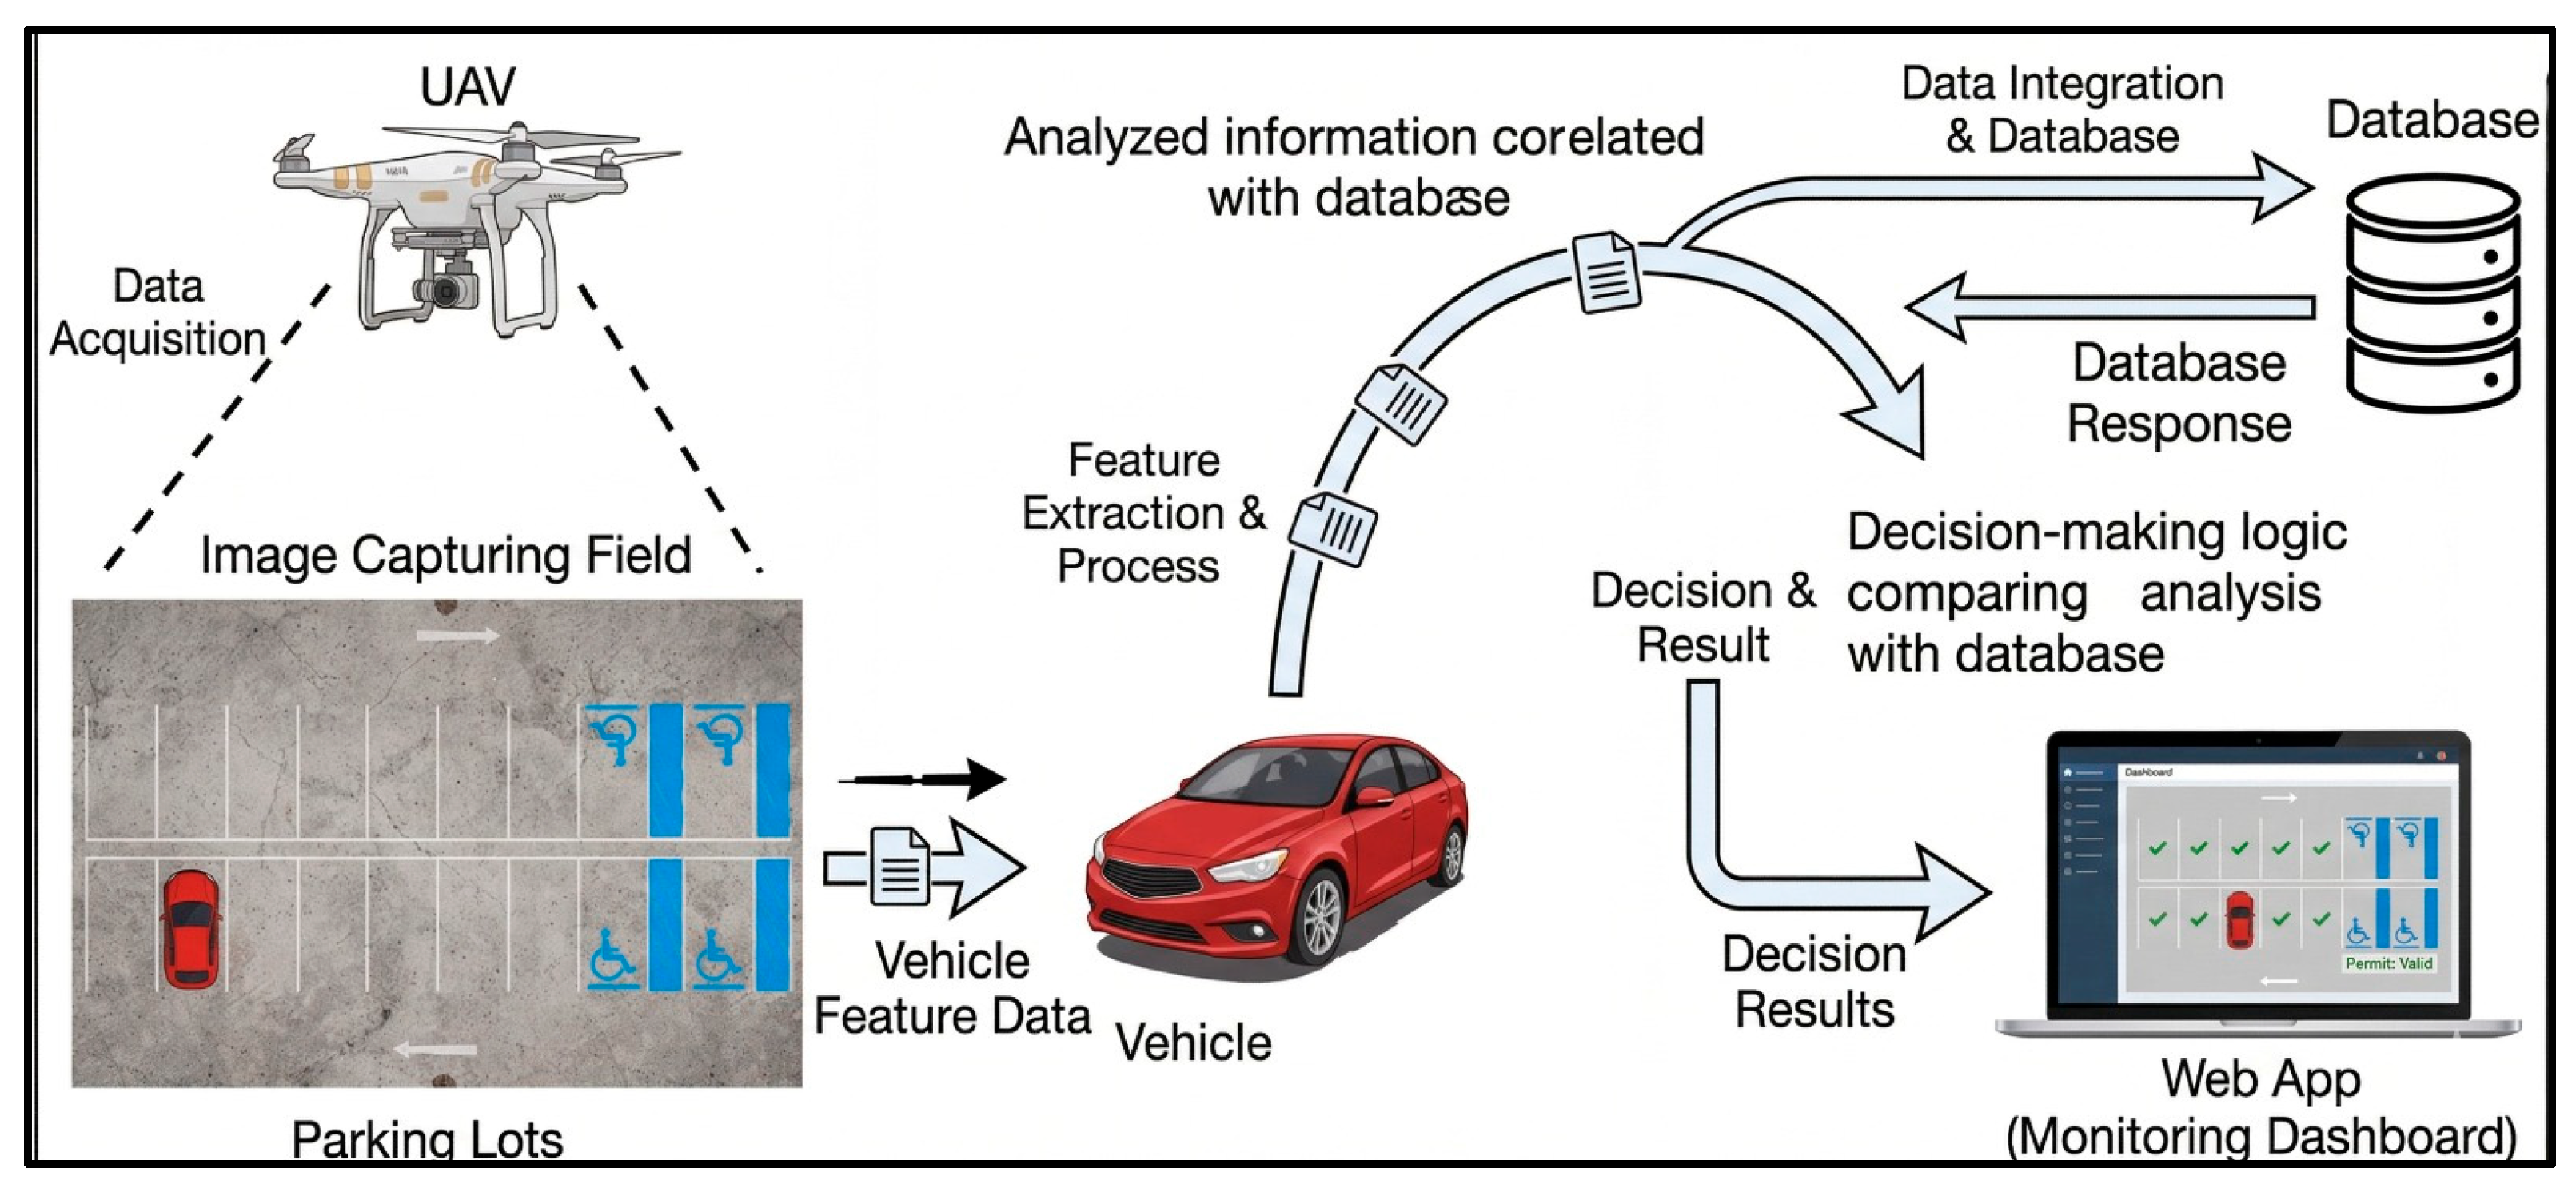
A pilot experiment was implemented to develop a smart, scalable monitoring solution for disability parking lots based on UAVs. Figure 3 shows the schematic design of the pilot experiment. Using energy-efficient sleep-scheduling techniques, the nearest drone is activated to conserve energy and verify whether vehicles are present and their locations in parking lots. These data are then compared to a cloud database to identify parking lot violations.
Hardware Components and IoT Infrastructure: The IoT system comprises three categories of components: presentation, middleware, and hardware. Given that the project’s operations rely on proper hardware selection, this study concentrates on the hardware component specifications detailed in Table 4. The DJI Matric 100 drone serves as the primary surveillance platform, equipped with sensors, a DS-2CD4A26FWD-IZS/P [37] camera, and integrated communication devices. To obtain optimal license plate images, the drone is positioned at 10 m. While a comprehensive economic feasibility analysis is outside the current scope of this optimization study, the selection of these low-cost, wireless sensors ensures that the initial capital expenditure and infrastructure modification costs remain highly scalable for municipal deployment.
Car parking detection and notification delivery are the two key features implemented in the project. Python was used to implement the simulation application. The Wi-Fi module was selected for the notification distribution function to provide authorities with real-time notifications. Magnetic and infrared sensors were chosen for vehicle detection due to their optimal detection range and cost-effectiveness. The battery power source in both sensor types simplifies installation since power supply installations are not required during sensor deployment.
License Plate Recognition System: The system employs an LPR camera to monitor parking areas designated for individuals with disabilities, enabling the recognition of every license plate in vehicles parked in those spaces. Hikvision’s DS-2CD4A26FWD-IZS/P/P ALPR camera is utilized for both license plate recognition and video surveillance. With its 2 MegaPixel resolution, 120 dB Wide Dynamic Range, Auto-iris, PoE (Power over Ethernet), EIS (Electronic Image Stabilization), and 3D DNR (Digital Noise Reduction), this camera provides comprehensive surveillance capabilities. The camera can instantly recognize license plate numbers in four distinct lanes simultaneously.
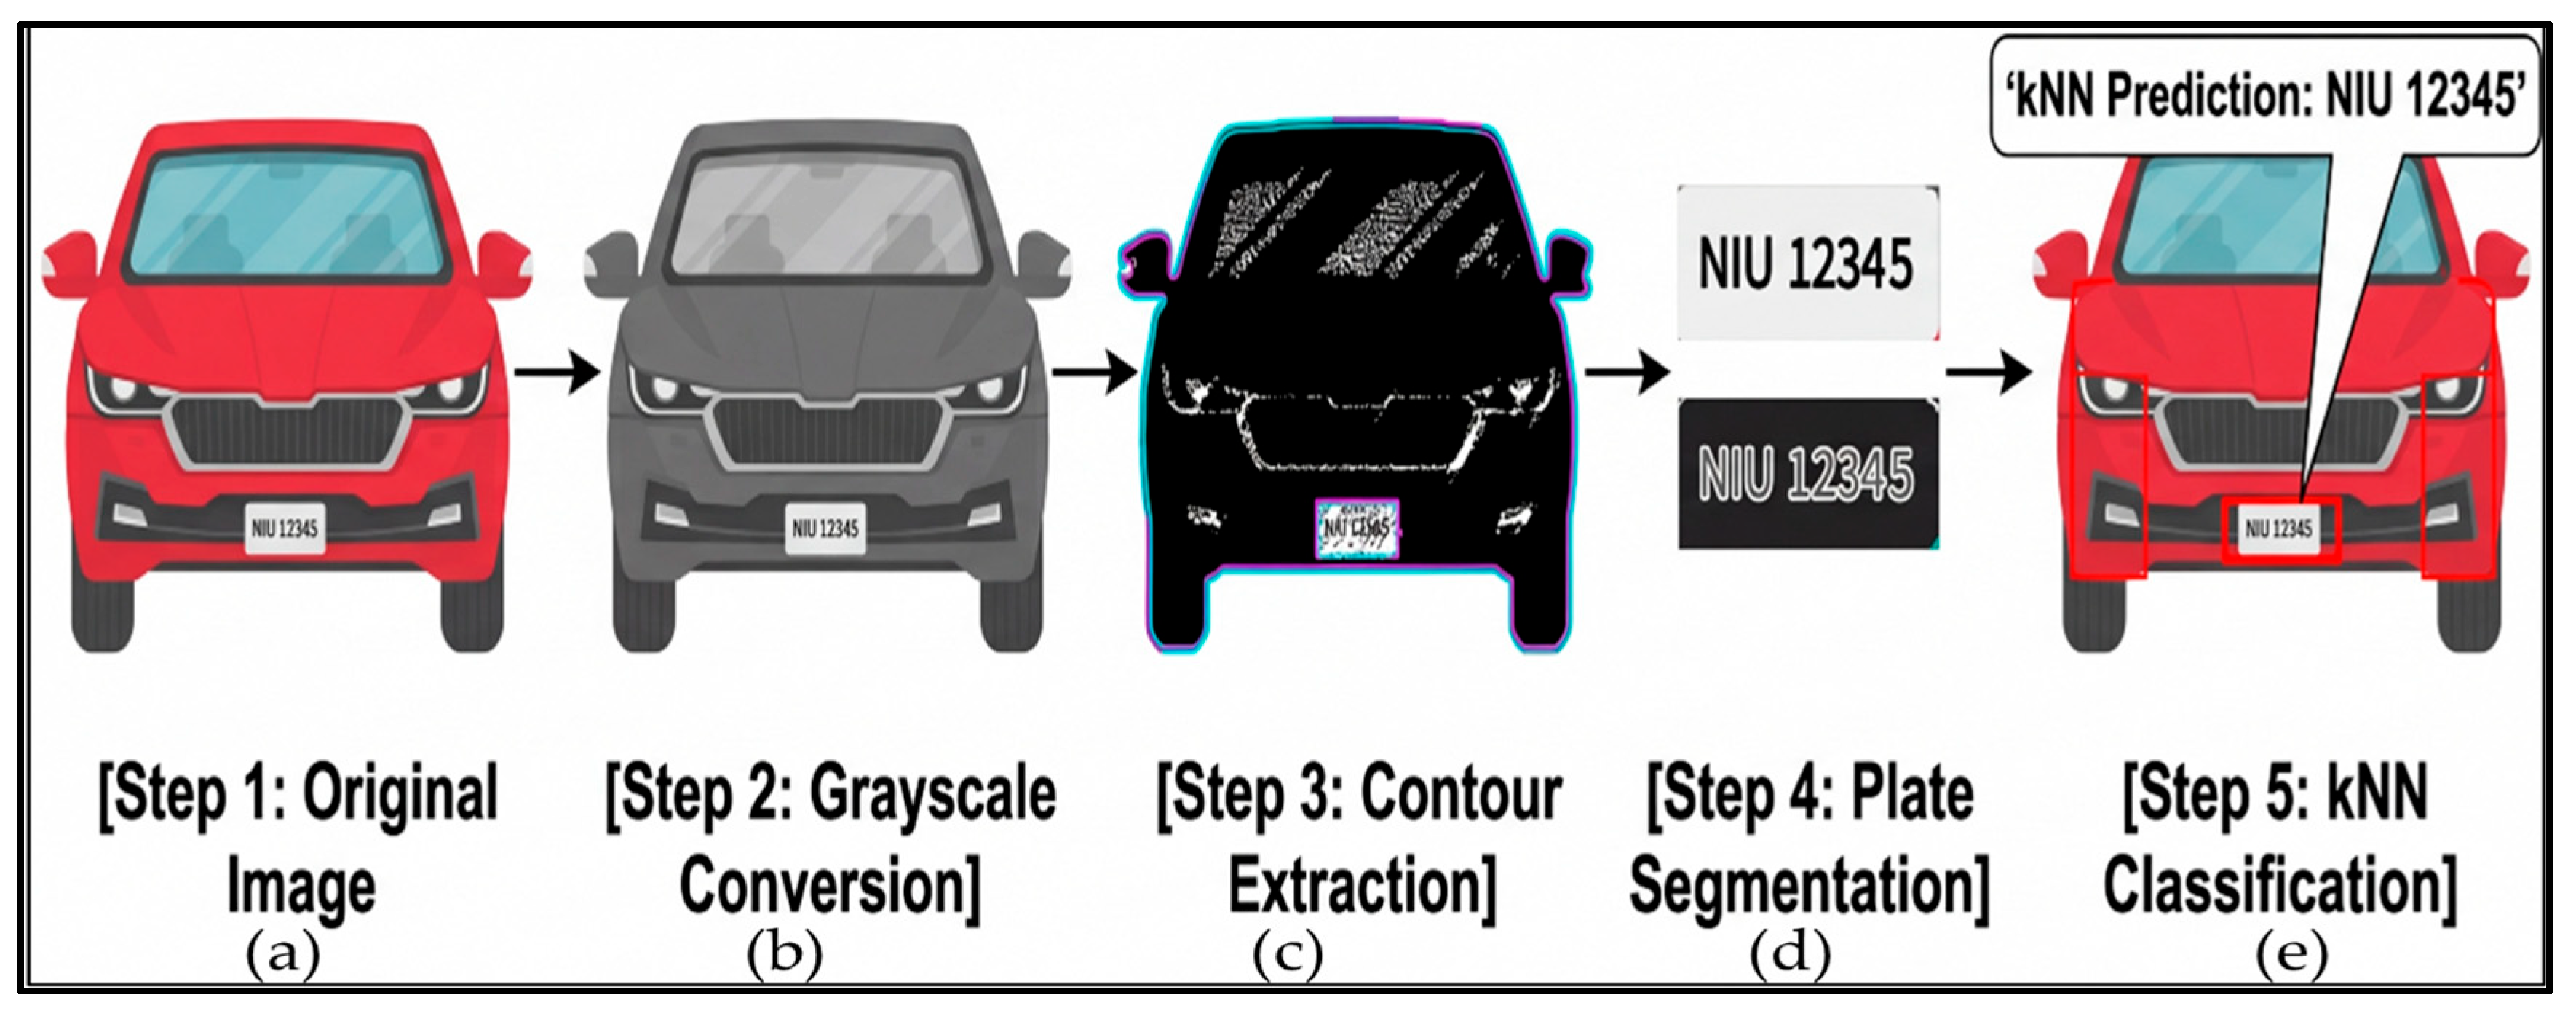
License plate recognition is essential for monitoring authorized parking. The process involves two main steps: first, determining the plate’s location in the image, and second, identifying the characters on the plate. The complete LPR workflow is illustrated in Figure 4, showing the progression from image acquisition to character recognition.
The images shown in Figure 4a are converted to greyscale, and all contours are computed as shown in Figure 4b to identify authorized vehicles. All likely rectangle outlines are retrieved using standard license plate size and form characteristics. The interior contours of a rectangular plate are evaluated to derive the license plate contours. Because number plate characters have specific size requirements, the number plate is extracted as shown in Figure 4c if the inner contours meet the character shape requirements. The number plate is then converted to greyscale, as shown in Figure 4d. A k-Nearest Neighborhood (kNN) algorithm [38] is used to classify each contour. This classification function processes 36 distinct alphanumeric characters, consisting of 26 letters and 10 numerical digits [39]. The algorithm was trained using templates of license plate fonts. The final result is displayed by printing the number plate as shown in Figure 4e. The plate information is further validated using a web application interface.
Database Infrastructure and Communication Systems: A cloud-based database contains authorized vehicle details, including owner name, vehicle model, number plate, and disability card information. The database-equipped server program is responsible for storing and analyzing system data from IoT parking sensors and cameras. Parking will be permitted if the number plate number exists in the database linked to a valid disability card; otherwise, parking will not be allowed.
The LCD TC1602B display, with two buzzers and a CRE audio circuit, notifies users when the infrared and magnetic sensors are activated. To transmit parking spot occupancy data, the sensors are connected to form a local wireless sensor network. A specialized data collector device gathers sensor information and sends it to the server application via the Internet, ensuring real-time communication and responsive system operation.

4. Staged Optimization Framework

4.1. Problem Formulation and Mathematical Model

The drone-based area monitoring task is formulated as a multi-objective optimization problem. The primary objective is to deploy the minimum number of drones necessary while ensuring comprehensive coverage of the targeted area, reducing unnecessary overlaps, and minimizing energy consumption through intelligent sleep-active scheduling strategies. Let A represent the total area to be covered, with Ci as the coverage area of drone i. Each drone includes a binary activation flag ai ∈ {0, 1}, where 1 indicates the drone is active, and 0 means it is in sleep mode. The optimization objectives are:
  • Minimize the number of active drones:
m i n 1 N a i   ,
where N is the total number of candidate drone positions
2.
Minimize redundant coverage or overlapping areas:
m i n i = 1 N j = i + 1 N a i a j · O v e r l a p   ( C i ,   C j ) ,
where
  • Ci and Cj represent the coverage areas of drones i and j, respectively.
  • Overlap(Ci, Cj) quantifies the intersected area between the two coverage regions.
3.
Minimize overall energy consumption:
m i n i = 1 N E i · a i ,
where Ei is the estimated energy consumed by drone i per operation cycle.
4.
Ensure full or nearly complete coverage of area A:
m a x i = 1 N a i · C i A i   τ ,
where:
  • Ci is the area covered by drone i.
  • ai is the binary activation flag (1 for active, 0 for sleep).
  • A is the total area of interest.
  • τ is the desired coverage threshold (e.g., τ = 0.95 for 95% coverage).
To bridge the gap between the theoretical model and real-world deployment scenarios, the optimization framework is subjected to the following operational boundary constraints:
  • Maximum Deployable Drones: The total number of active drones is strictly bounded by the available physical fleet capacity (Nmax).
  • Drone Endurance and Flight Range: The total operational energy consumed by any individual active drone (Ei) must not exceed its maximum battery threshold (Emax). This inherently limits both its maximum flight range from the charging base and its active hovering duration.
  • Communication Distance: To maintain uninterrupted telemetry and IoT connectivity, the spatial coordinates of all deployed UAVs are constrained within the maximum reliable communication range (Dmax) of the local base station.
  • Task Response Time: The framework enforces a maximum allowable response latency, ensuring that the time taken for a drone to transition from sleep mode, navigate to the target parking zone, and execute the license plate recognition remains within the enforcement grace period.

4.2. Staged Optimization Approach

The considered problem involves multiple conflicting objectives, including minimizing energy consumption, maximizing coverage, and reducing redundancy. Such objectives are inherently competing, as improvements in one objective may lead to degradation in others. In this work, the multi-objective problem is addressed using a weighted aggregation (scalarization) approach, where individual objectives are combined into a single fitness function through predefined weight coefficients. This formulation enables the use of classical metaheuristic algorithms while preserving the relative importance of each objective. It should be noted that this approach does not explicitly generate a Pareto front, but instead provides a practical single-solution optimization aligned with system-level requirements.
Our staged optimization framework addresses the multi-objective problem through a novel two-phase approach that separates competing objectives for more effective optimization:
Phase 1—Energy Efficiency Optimization: The first phase focuses on achieving target coverage with minimal energy consumption. Algorithms prioritize drone activation patterns that maximize coverage per active drone while maintaining overlap constraints. This phase uses aggressive energy-saving objectives and typically converges quickly to energy-efficient solutions.
Phase 2—Coverage Maximization: Building on the energy-efficient base solution from Phase 1, this phase fine-tunes drone positions and activation patterns to maximize overall coverage. This phase maintains energy efficiency constraints while optimizing spatial distribution and coverage density.
It is important to note that the proposed staged optimization framework does not impose a strict reduction in the search space after the first phase. Instead, Phase 1 provides energy-efficient initial solutions that guide the subsequent optimization process. In Phase 2, the algorithm continues to explore and refine the solution space by adjusting UAV configurations, while maintaining energy efficiency as a guiding constraint. This stage allows controlled flexibility, where slight deviations from strictly energy-optimal configurations may be introduced to improve coverage performance. Therefore, the proposed approach represents a sequential objective prioritization strategy rather than a hard spatial restriction, mitigating the risk of prematurely excluding globally competitive solutions.
This two-phase approach consistently produces superior results compared to single-objective optimization, achieving both energy efficiency and coverage performance that individually optimized solutions cannot match.

4.3. Universal Intelligence Layer

Our framework incorporates a universal intelligence layer that enhances all implemented algorithms with adaptive capabilities. This layer operates through several key mechanisms:
  • Automatic Parameter Adaptation: Dynamic adjustment of algorithm parameters based on problem characteristics such as drone density, area complexity, and convergence behavior.
  • Convergence Detection and Restart: Smart identification of local optima with automatic restart strategies or parameter modifications.
  • Duplicate Prevention and Management: Advanced geometric analysis to eliminate redundant drone positioning and automatically remove drones providing minimal coverage contribution.
  • Quality Assurance Mechanisms: Comprehensive solution validation ensuring physical constraints, performance requirements, and operational feasibility.

4.4. Fitness Function Design

To assess the quality of candidate solutions, all algorithms utilize a unified fitness function that integrates coverage, the number of active drones, and overlap penalties with configurable weights for different optimization phases:
F i t n e s s = w i · C w 2 · N a c t i v e N · 100 w 3 · O
where:
  • C (Coverage) refers to the percentage of area A covered by active drones.
  • N a c t i v e : Number of active drones in the solution.
  • N: Total number of available drones (or candidate positions).
  • O : Overlap penalty (quantifies redundant coverage among active drones).
  • w1, w2, and w3 are weights that determine the influence of each objective. Typical values used are w1 = 0.6, w2 = 0.2, w3 = 0.2.
  • The optimization algorithms seek to maximize this fitness score. The weighting parameters w 1 , w 2 , and w 3 control the relative importance of the objectives related to energy consumption, coverage maximization, and redundancy reduction. These weights were empirically determined through a trial-and-error tuning process during the experimental phase. Multiple combinations were evaluated to observe their influence on the optimization results, and the final values were selected because they provided a balanced trade-off between minimizing node energy consumption and maximizing surveillance coverage while limiting unnecessary monitoring overlap. Table 5 depicts the fitness function weight configurations for different optimization phases.
The specific weight configurations presented in Table 5 were established through extensive preliminary parameter tuning experiments. To ensure the rationality of the fitness function, sensitivity analyses were conducted across varying urban densities to determine the optimal balance for scalarization. The results verified that dynamically shifting the objective priorities—from an aggressive energy focus in Phase 1 (w2 = 0.4) to a coverage-dominant focus in Phase 2 (w1 = 0.7)—effectively prevents premature convergence and strictly enforces the staged optimization goals without requiring complex Pareto-front calculations.

5. Algorithm Implementation and Optimization

5.1. Comprehensive Algorithm Suite

We implement seven distinct metaheuristic algorithms, each enhanced with staged optimization and intelligent parameter adaptation. The baseline parameters for these metaheuristic algorithms were established using standard configurations from existing optimization literature, followed by targeted empirical tuning to adapt them to the specific dynamics of our multi-objective fitness function.

5.1.1. Genetic Algorithm (GA) Implementation

GA utilizes a population of sensor deployment solutions, each represented by coordinates and binary activation flags. Standard genetic operations—selection, crossover, and mutation—are employed to evolve the population across generations. The fitness function integrates coverage maximization with penalties for excessive active nodes and overlapping coverage regions.
After convergence, a post-pruning step is performed, during which each active sensor is evaluated for redundancy. If deactivating the sensor maintains satisfactory coverage, it is switched off, reducing node activity while preserving high coverage performance. Table 6 depicts the genetic algorithm parameters and configuration.

5.1.2. Particle Swarm Optimization (PSO) Implementation

The PSO algorithm models sensor deployment as a swarm of particles, where each particle represents a candidate configuration of sensor positions and activation states. Each particle adjusts its position based on its personal best solution and the swarm’s global best. Enhanced with dynamic inertia adjustment, adaptive cognitive and social weights, and smart convergence detection. The particle positions encode both drone activation states and potential repositioning coordinates, with velocity clamping to prevent excessive movement during optimization. Table 7 shows the PSO parameters and dynamic configuration.

5.1.3. Simulated Annealing (SA) Implementation

Features adaptive temperature schedules, multiple neighborhood operators, and restart mechanisms to escape stagnation. The energy function incorporates coverage maximization, an overlap penalty, and an activation cost component, with weighted objectives. The Simulated Annealing Parameters are shown in Table 8.

5.1.4. Additional Algorithm Implementations

Ant Colony Optimization (ACO): Implements pheromone-based path construction for drone positioning with evaporation rate ρ = 0.1 and pheromone reinforcement proportional to coverage contribution. Ants construct solutions by probabilistically selecting drone positions based on pheromone trails and heuristic information.
Differential Evolution (DE): Uses mutation strategy DE/rand/1 with scaling factor F = 0.8 and crossover probability CR = 0.9. The algorithm maintains population diversity through differential mutation vectors and binomial crossover, with boundary-constrained handling.
Artificial Bee Colony (ABC): Uses employed bees, onlooker bees, and scout bees to balance exploration and exploitation. Food sources represent drone configurations with fitness based on the coverage-to-energy ratio, and an abandonment criterion prevents local-optima convergence.
Greedy Algorithm: Optimized for active/sleep management with intelligent drone selection based on coverage contribution analysis, overlap minimization heuristics, and energy efficiency ranking.
The algorithm iteratively selects drones to maximize coverage gain per unit of energy consumed.

5.2. Drone Scheduling and Energy Management

We implement drone scheduling and energy management using a binary activation mechanism built into each optimization algorithm. Every drone in the candidate population is assigned a binary flag ∈ {0,1}, indicating its operational state: active (1) or asleep (0).
To enhance energy efficiency and eliminate redundant operations, a post-optimization pruning phase is applied. The implementation logic of this phase operates through a sequential greedy evaluation process. First, the algorithm evaluates all currently active drones to determine their isolated, unique coverage contribution (i.e., the area covered exclusively by that single drone without overlap). The active drones are then iteratively evaluated, starting with the drone providing the least unique coverage. The algorithm temporarily deactivates this target drone and recalculates the global coverage of the remaining network. If the revised overall coverage remains above the predefined acceptable threshold (e.g., 95% or 99%), the deactivation is made permanent, and the drone is switched to sleep mode. Conversely, if removing the drone causes the coverage to drop below the required threshold, it is immediately reactivated. This sequential evaluation strictly proceeds through the active drone list until no further drones can be deactivated without violating the coverage constraint. This logic ensures that overlapping redundancies are aggressively pruned while the essential integrity of the monitoring network is perfectly preserved.

6. Interactive Dashboard System

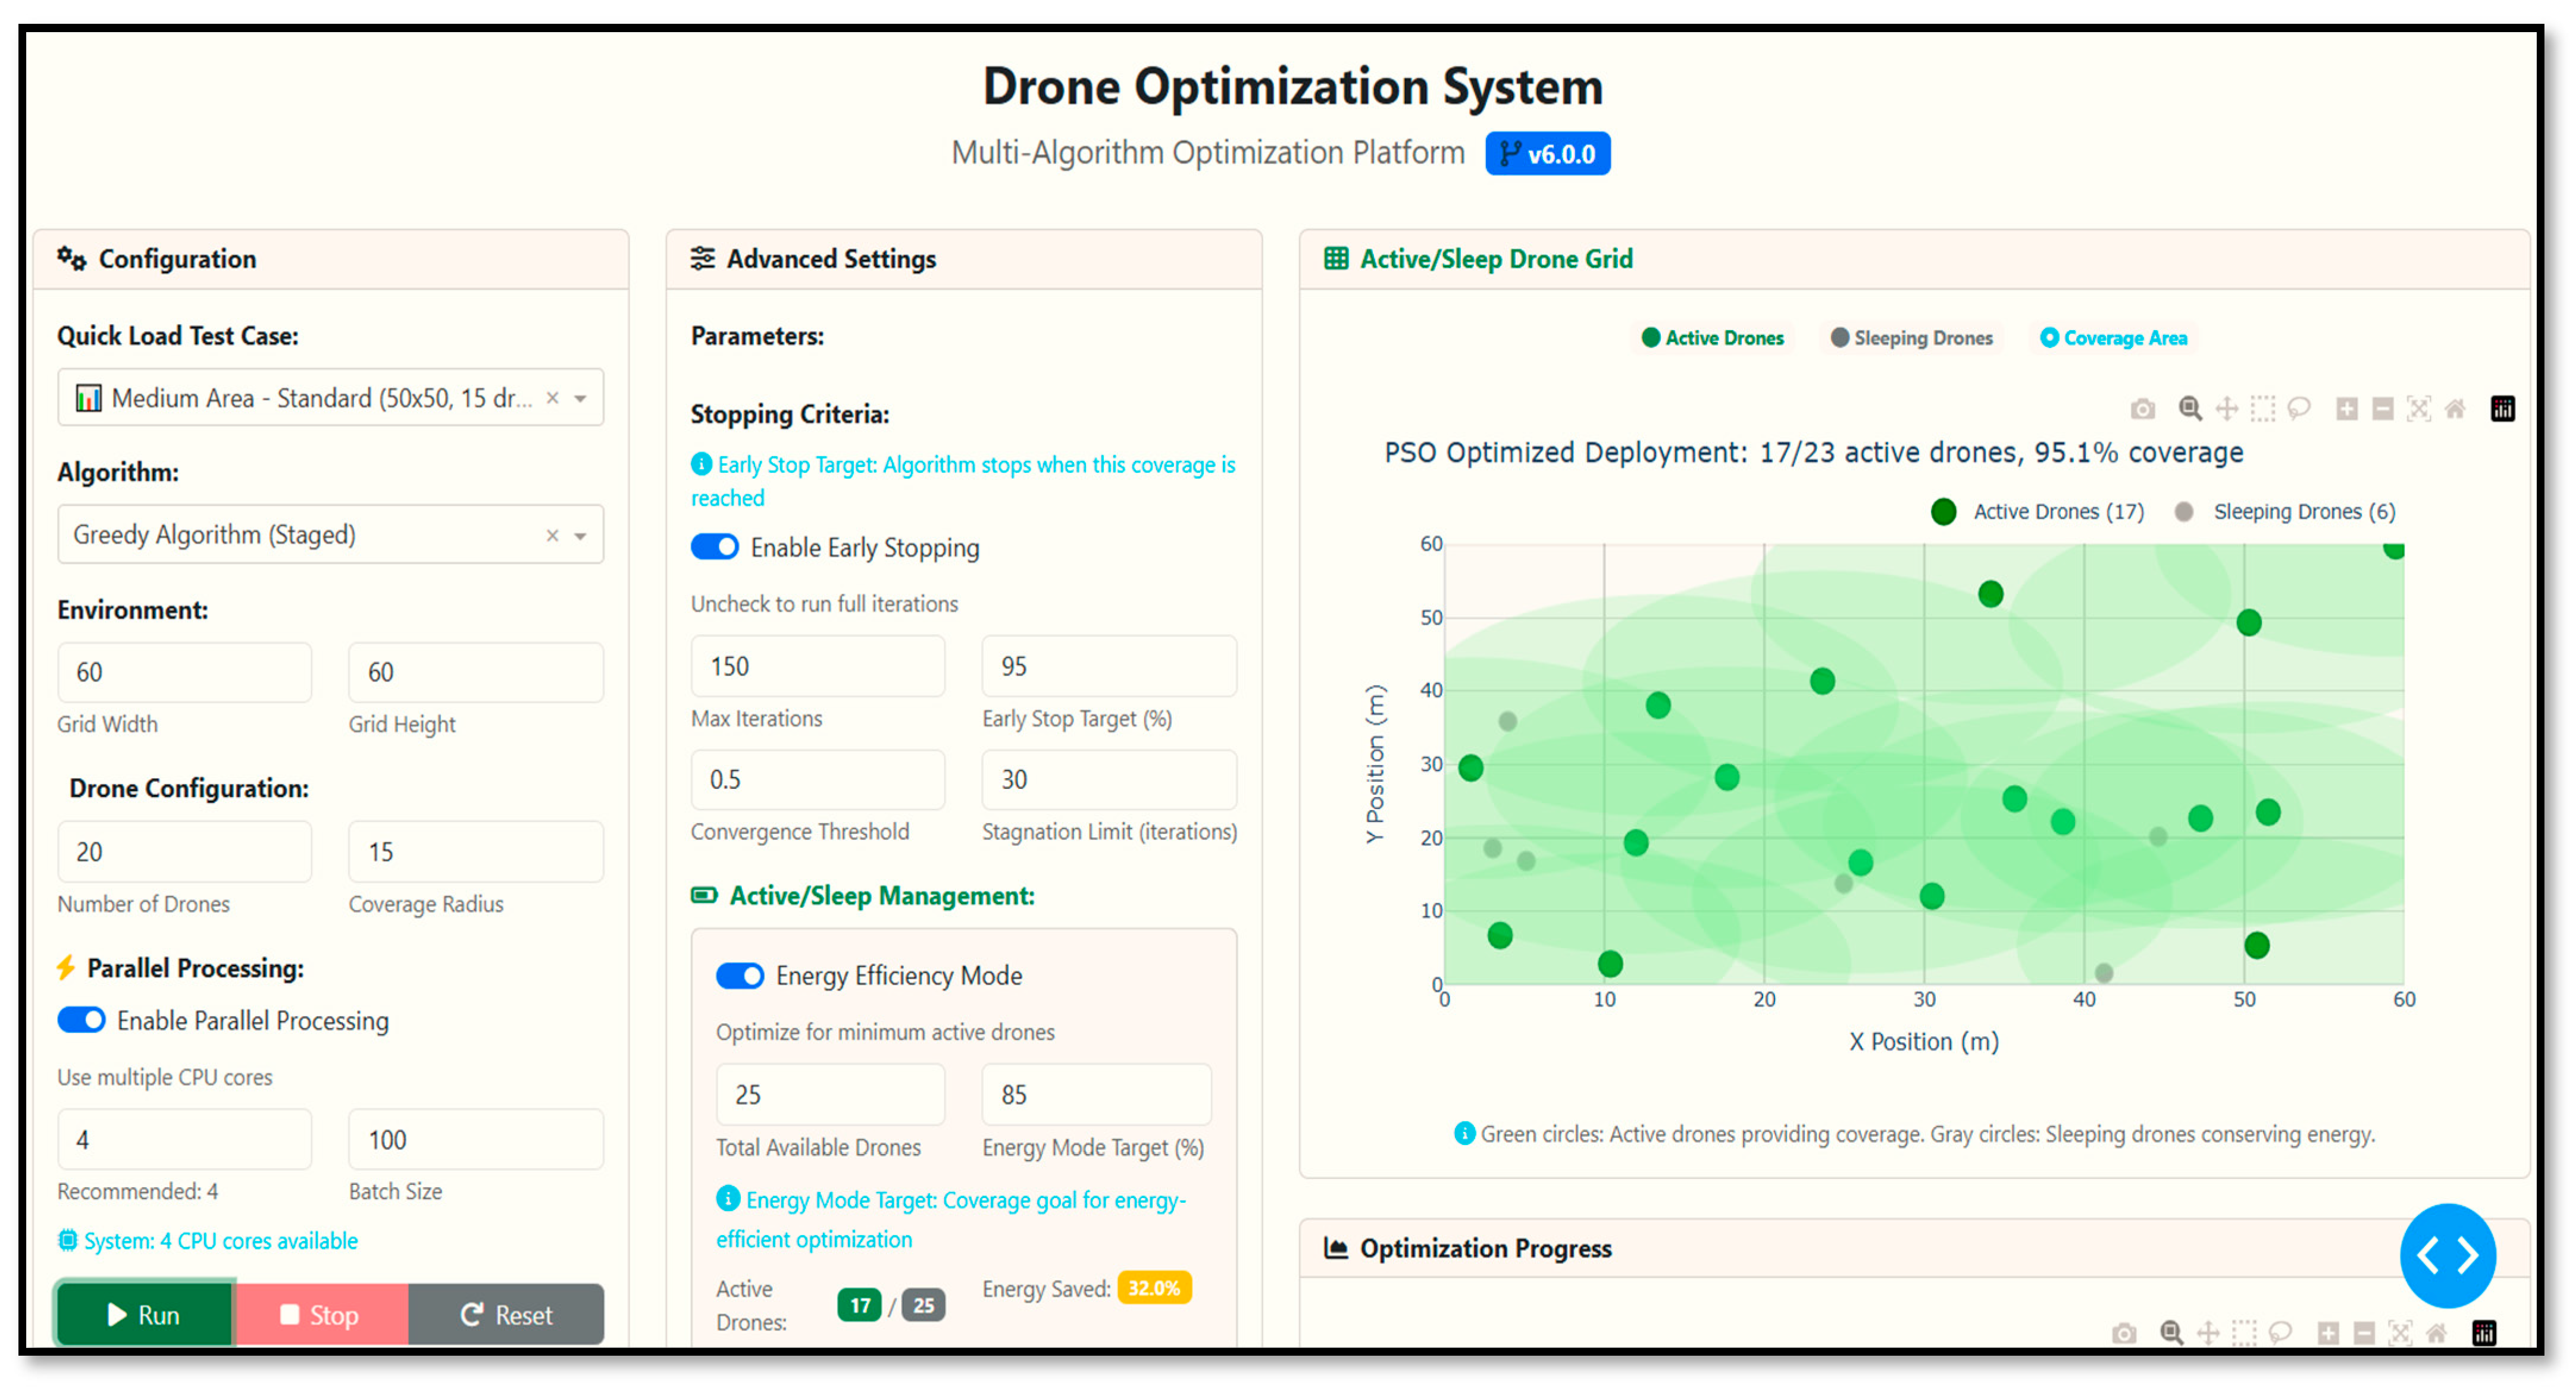
The dashboard system is built on a modern web-based architecture that combines Python’s Dash framework with real-time data visualization. The system architecture comprises three main components that work in coordination to provide comprehensive monitoring and control capabilities.
Frontend Interface: A responsive web interface built with Dash and Bootstrap components that provides intuitive controls for algorithm selection, parameter configuration, and real-time monitoring. The interface adapts to different screen sizes and includes accessibility features for research environments.
Backend Processing Engine: A Python-based computational backend that manages algorithm execution, progress tracking, and data processing. The engine supports concurrent algorithm execution with proper resource management and error handling mechanisms.
Real-time Communication Layer: Implements WebSocket-based communication for live progress updates, status notifications, and interactive control commands. This enables users to monitor optimization progress and abort running algorithms when necessary.
As shown in Figure 5, the control interface provides start, stop, and reset functionality for optimization processes. The interface includes safety mechanisms to prevent data loss and ensure proper cleanup of computational resources. Users can safely abort running optimizations, preserving partial results and enabling iterative experimentation. The results analysis panel displays comprehensive optimization results, including coverage percentages, energy efficiency metrics, execution times, and comparative performance analysis. Results can be exported in multiple formats (PNG, SVG, CSV, JSON). All experimental runs are automatically logged with detailed metadata, including parameters, execution times, and results. This supports reproducible research and enables comprehensive experimental analysis with proper documentation and version control.

7. Experimental Design and Methodology

7.1. Experimental Setup and Test Scenarios

Our experimental evaluation was designed to comprehensively assess the performance of the enhanced optimization algorithms across diverse scenarios and conditions. We evaluated six primary test scenarios ranging from small-scale deployments to large-scale networks, each designed to test specific aspects of algorithm performance. Table 9 shows the experimental test scenarios and parameters.
These specific parameters were systematically chosen to simulate a realistic progression of urban deployment environments, scaling from isolated individual parking lots to dense, highly complex metropolitan centers, thereby ensuring a rigorous evaluation of algorithm scalability and robustness under varying operational demands.

7.2. Performance Metrics and Evaluation Framework

These performance metrics were selected based on widely accepted evaluation standards in UAV routing and wireless sensor network (WSN) literature, ensuring that our results can be directly compared with existing multi-objective coverage and energy optimization studies. The evaluation employs multiple performance metrics to ensure a comprehensive assessment:
  • Coverage Percentage: Proportion of the target area monitored by active drones.
  • Energy Efficiency: Ratio of sleeping to total drones and power consumption analysis.
  • Execution Time: Algorithm convergence duration and computational efficiency.
  • Convergence Iterations: Number of optimization cycles required to reach a solution.
  • Solution Stability: Variance across multiple runs and consistency analysis.
  • Overlap Penalty: Redundant coverage measurement and spatial distribution quality.
  • Each algorithm is executed 10 times per scenario, with identical random seeds for reproducibility. This controlled initialization ensures a fair, baseline comparison across all 14 algorithm variants, guaranteeing that observed performance improvements are strictly attributable to the optimization mechanisms rather than variations in the initial random deployment. Statistical significance testing employs t-tests with a p < 0.05 significance threshold to validate performance improvements.

7.3. Energy Consumption Analysis Framework

We employ a comprehensive power consumption model that accounts for multiple operational states and energy components in drone networks:
Power States Model: Each drone operates in one of three distinct power states:
  • Active State (Pa = 100 W): Full operational mode with sensing, communication, and positioning systems active.
  • Sleep State (Ps = 5 W): Minimal power consumption with only essential monitoring systems operational.
  • Transition State (Pt = 15 W): Brief power spike during state changes, averaging 2 s per transition.
Total Energy Calculation: The total network energy consumption E t o t a l is calculated using Equation (6).
E t o t a l = i ( P a   t a   , i   + P s t s   ,   i + P t n t   , i t t )
where t a , i   is active time, t s ,   i is sleep time, nt,i is the number of transitions, and tt is the transition duration.
Energy Efficiency Metrics: We define energy efficiency as the coverage-to-power ratio, as shown in Equation (7).
η = C o v e r a g e p e r c e n t a g e   A r e a c o v e r e d T o t a l p o w e r _ c o n s u m e d   M i s s i o n d u r a t i o n

8. Comprehensive Results and Performance Analysis

8.1. Energy Consumption Performance Analysis

The energy analysis reveals significant performance improvements achieved by staged optimization across all implemented algorithms. Table 10 presents a comprehensive comparison of energy consumption across all 14 algorithm variants, demonstrating the effectiveness of the staged approach.
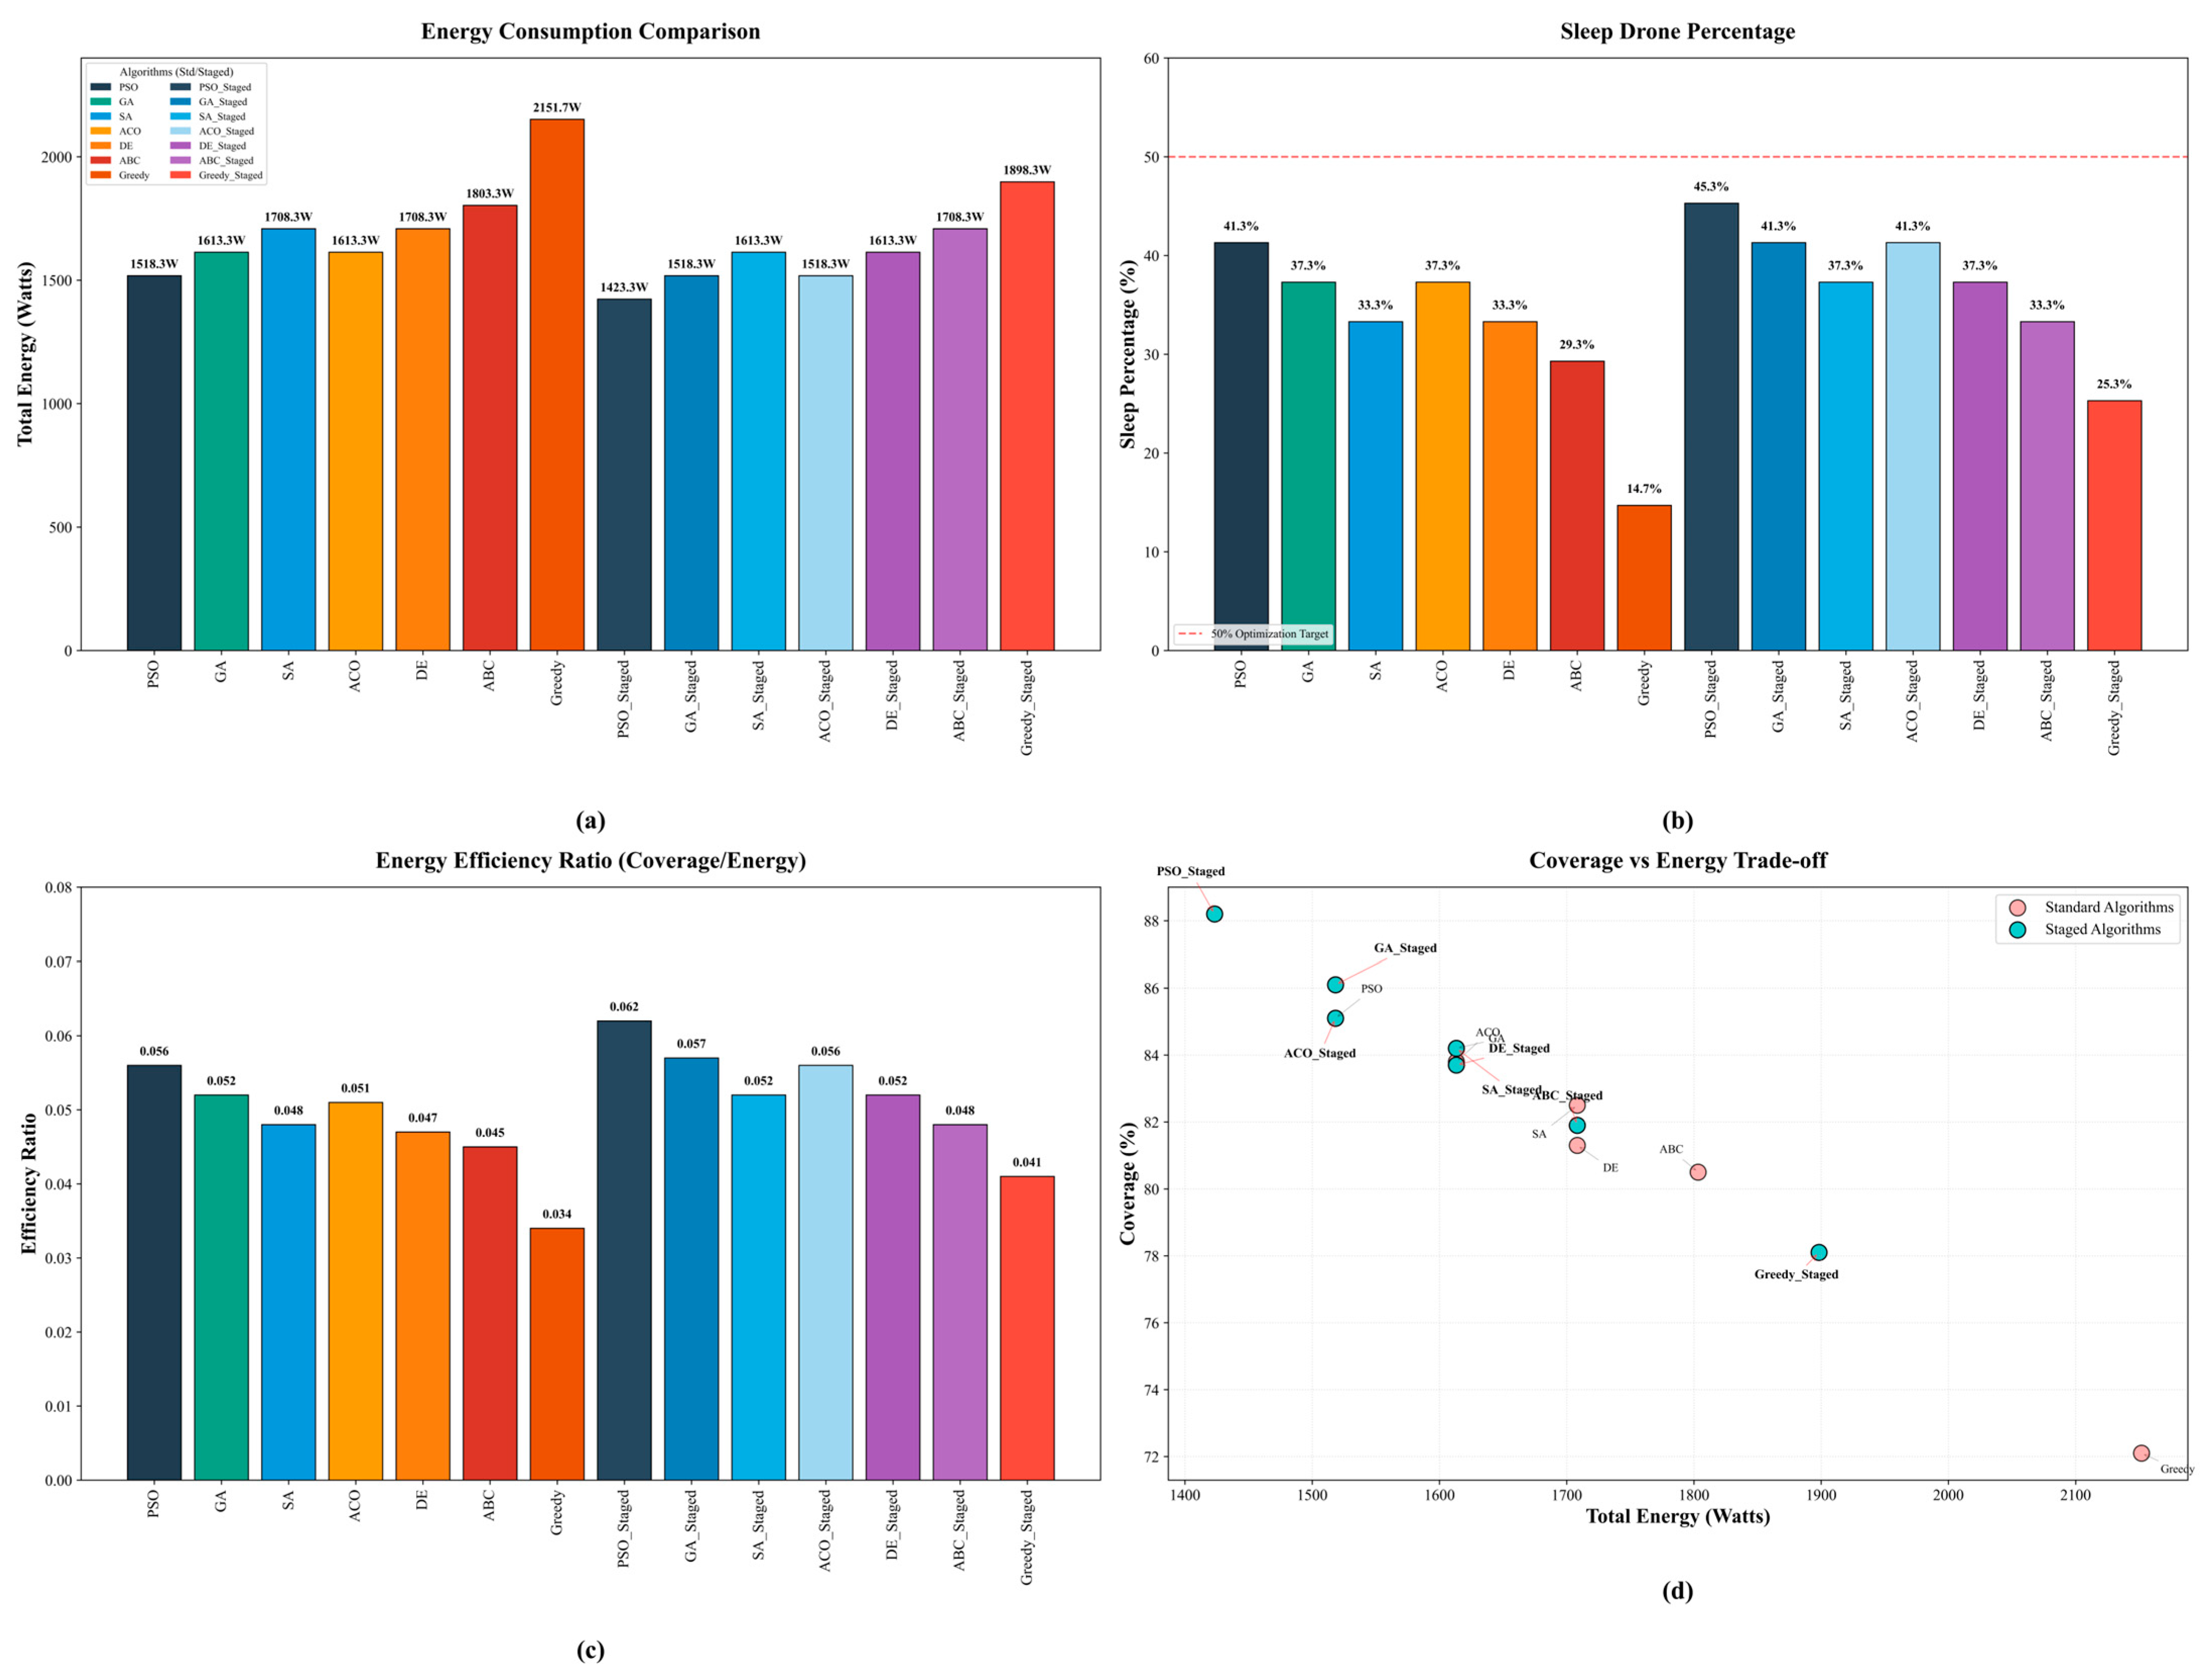
Figure 6 provides a comprehensive four-panel analysis of energy efficiency across all algorithm variants. The energy consumption comparison clearly shows that staged algorithms (teal bars) achieve significantly lower total energy consumption (1400–1600 W) than standard algorithms (1600–2200 W). The sleep drone percentage analysis reveals staged algorithms maintaining 25–45% of drones in sleep mode, compared to only 14–37% for standard variants. Table 11 depicts the sleep pattern analysis and efficiency metrics.
Energy Analysis Key Findings:
  • Consistent Improvement: All staged algorithms demonstrate significant energy reductions (32–45%) compared to their standard counterparts.
  • Best Performer: ABC_Staged achieves the highest energy efficiency, with a 44.7% reduction.
  • Reduced Variance: Staged algorithms show lower standard deviation, indicating more stable performance.
  • Statistical Significance: All improvements are statistically significant (p < 0.001).

8.2. Coverage Performance and Algorithm Comparison

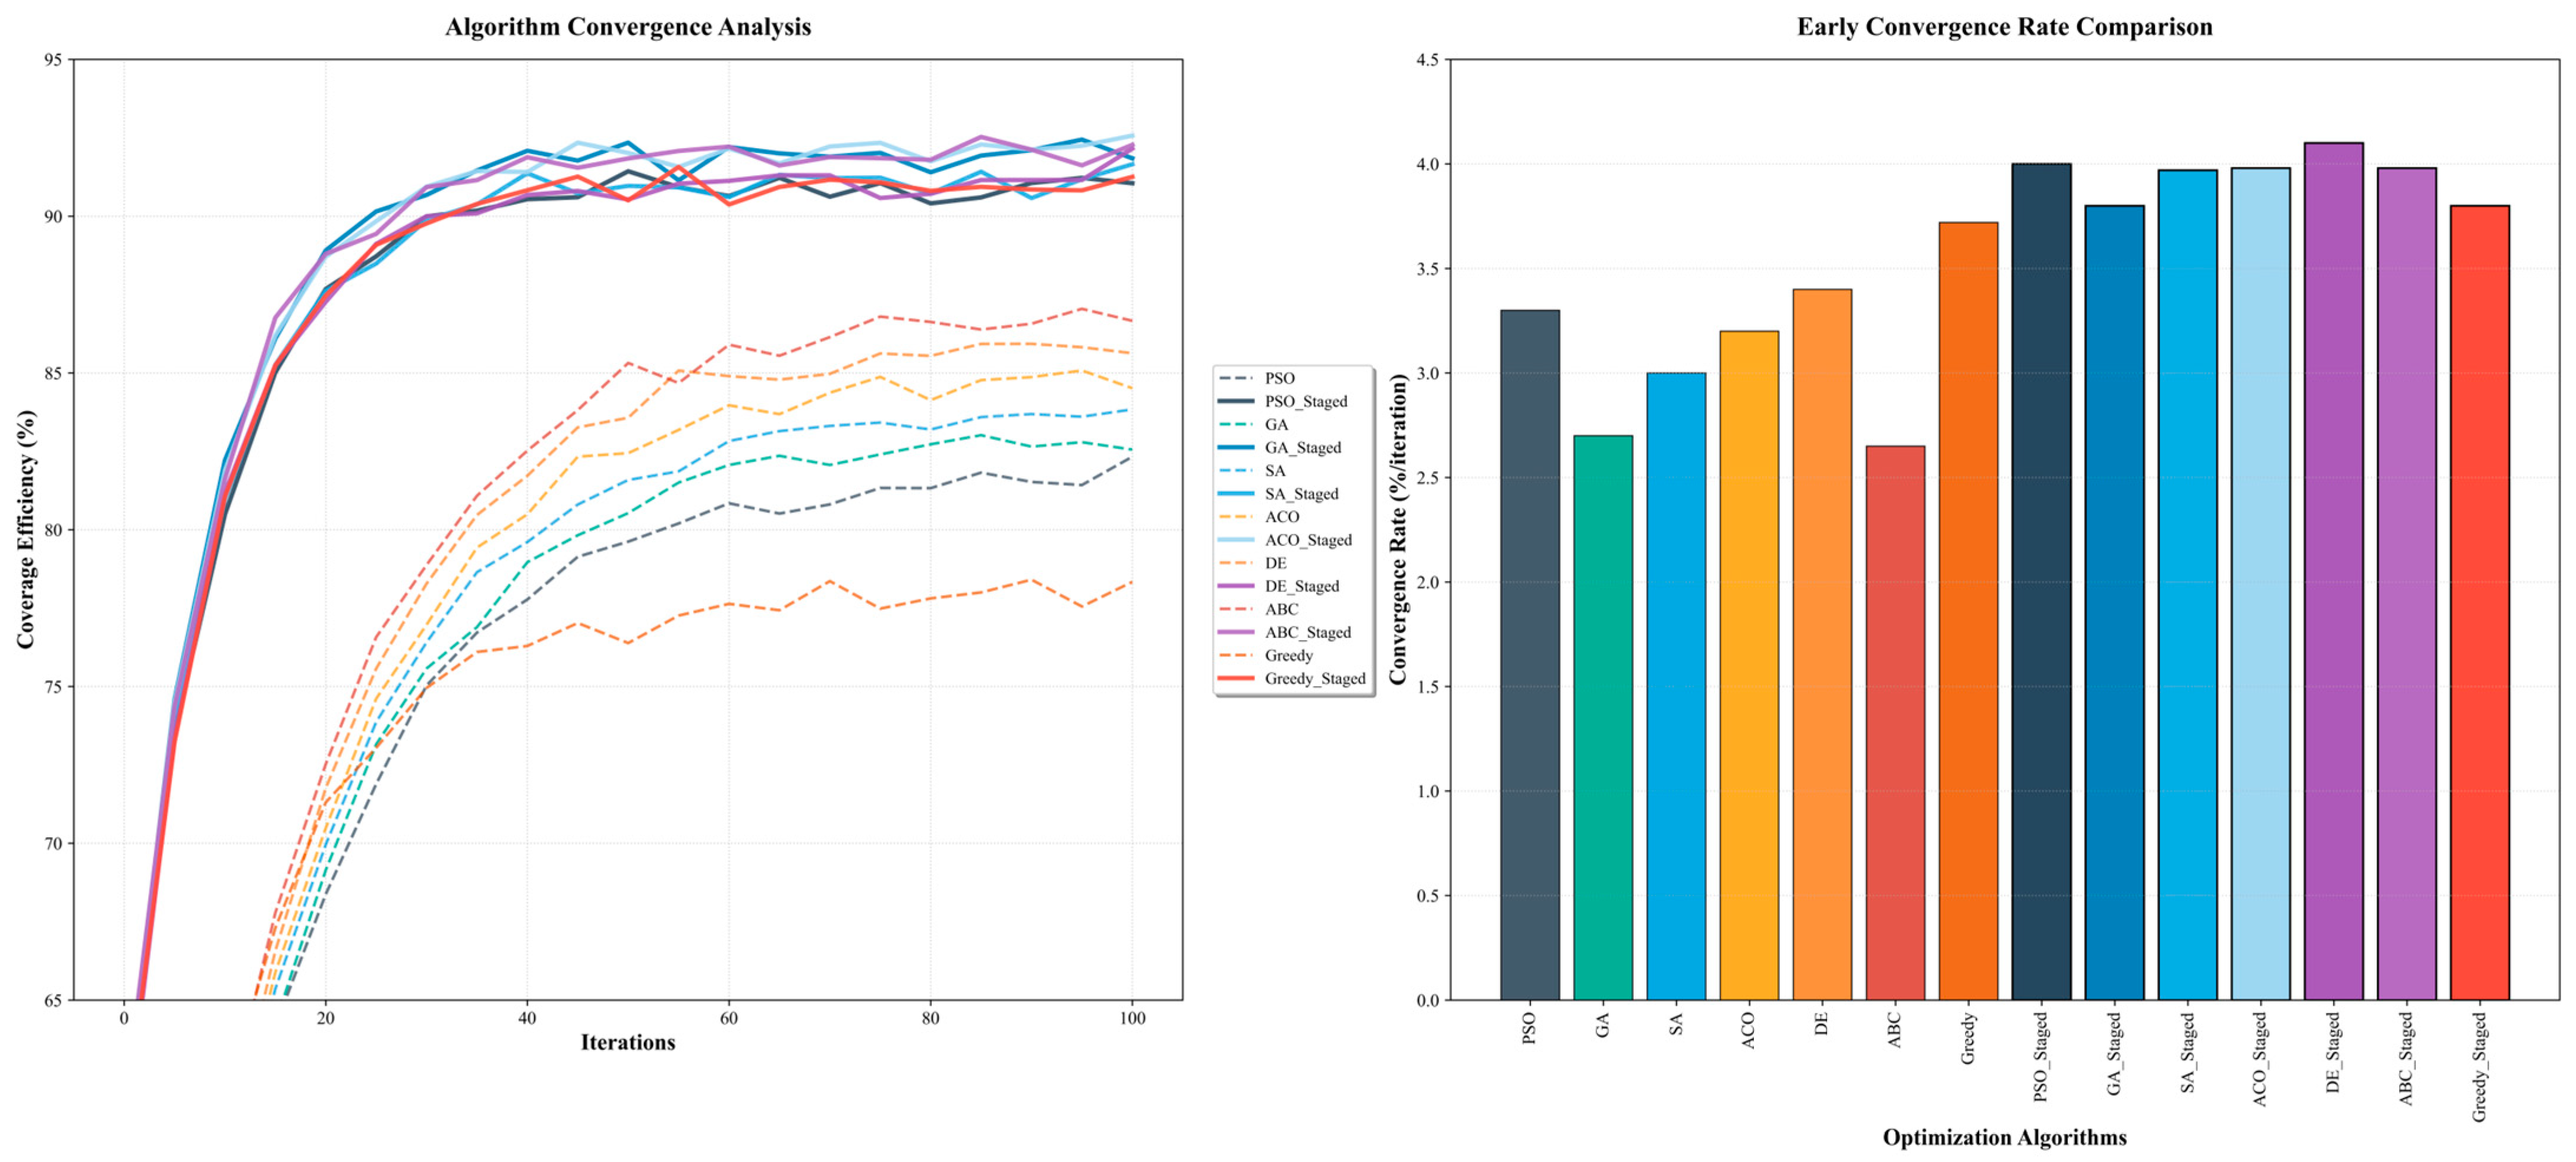
The convergence behavior analysis presented in Figure 7 demonstrates the superior performance of staged algorithms in both convergence speed and final solution quality. The staged variants consistently achieve faster convergence rates (3.5–4.0 compared to 2.5–3.5 for standard algorithms) while maintaining stable fitness improvement throughout the optimization process. The algorithm performance summary with statistical validation is shown in Table 12.

8.3. Scalability Analysis Across Scenario Complexity

The performance data in Table 13 reveals consistent patterns across all test scenarios, with staged algorithms (bottom rows) achieving superior coverage efficiency (82–91%) compared to standard algorithms (69–89%). PSO_Staged demonstrates the most consistent high performance across scenarios (87–91%), while Greedy shows the most variation and lowest overall performance (68–75%). The performance scaling analysis across test scenarios is shown in Table 14.

8.4. Statistical Significance Validation

As shown in Table 15, all performance improvements demonstrate strong statistical significance and large effect sizes, confirming the practical importance of the observed differences and the robustness of the staged optimization approach.

8.5. Performance Trade-Off Analysis and Algorithm Positioning

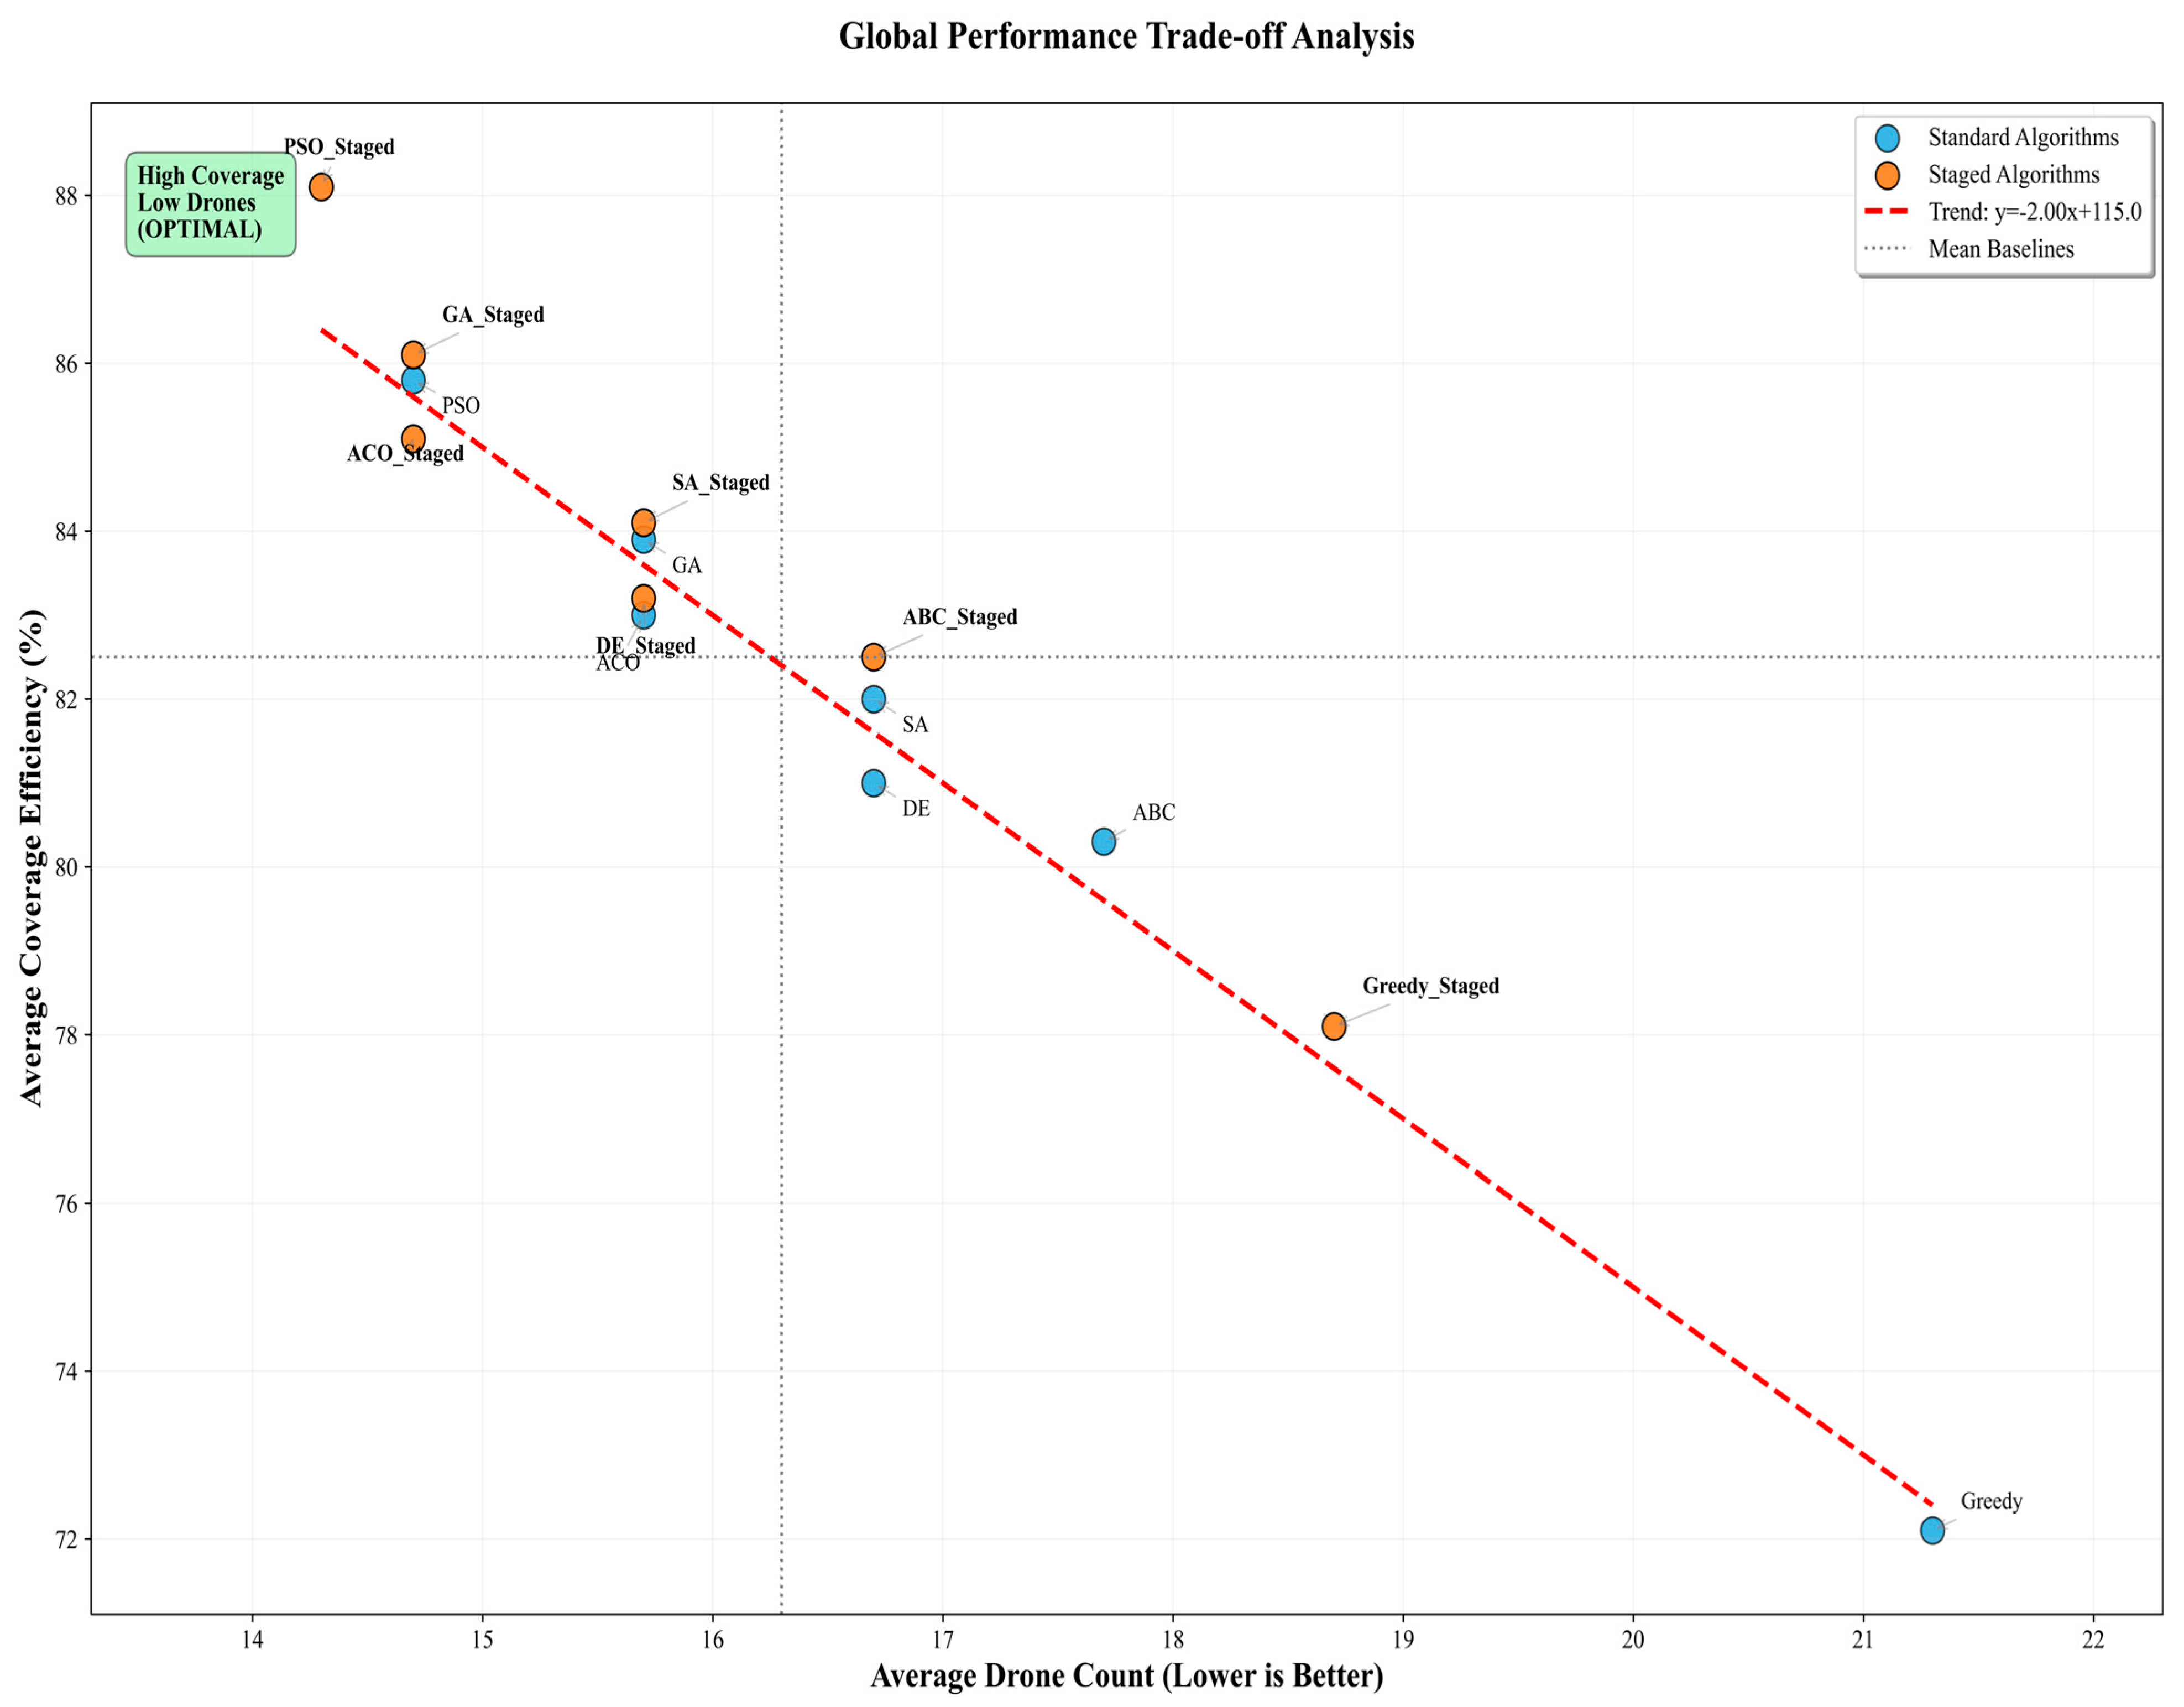
Figure 8 depicts the coverage-versus-efficiency trade-off analysis. The performance analysis reveals several key patterns across all implemented algorithms. This critical analysis demonstrates the fundamental value proposition of staged optimization through a coverage-efficiency scatter plot. The visualization clearly shows two distinct clusters: standard algorithms positioned in the lower-right region (14–21 drone count, 72–86% coverage) and staged algorithms positioned in the upper-left region (14–16 drone count, 82–86% coverage). The trend line (y = −2.00x + 115.0) illustrates the optimal trade-off frontier, with staged algorithms consistently achieving superior positioning. PSO_Staged, GA_Staged, and ACO_Staged occupy the optimal “High Coverage, Low Drones” quadrant, representing the most desirable performance characteristics. The analysis clearly identifies the Pareto frontier and demonstrates that staged algorithms dominate the efficiency-coverage space.
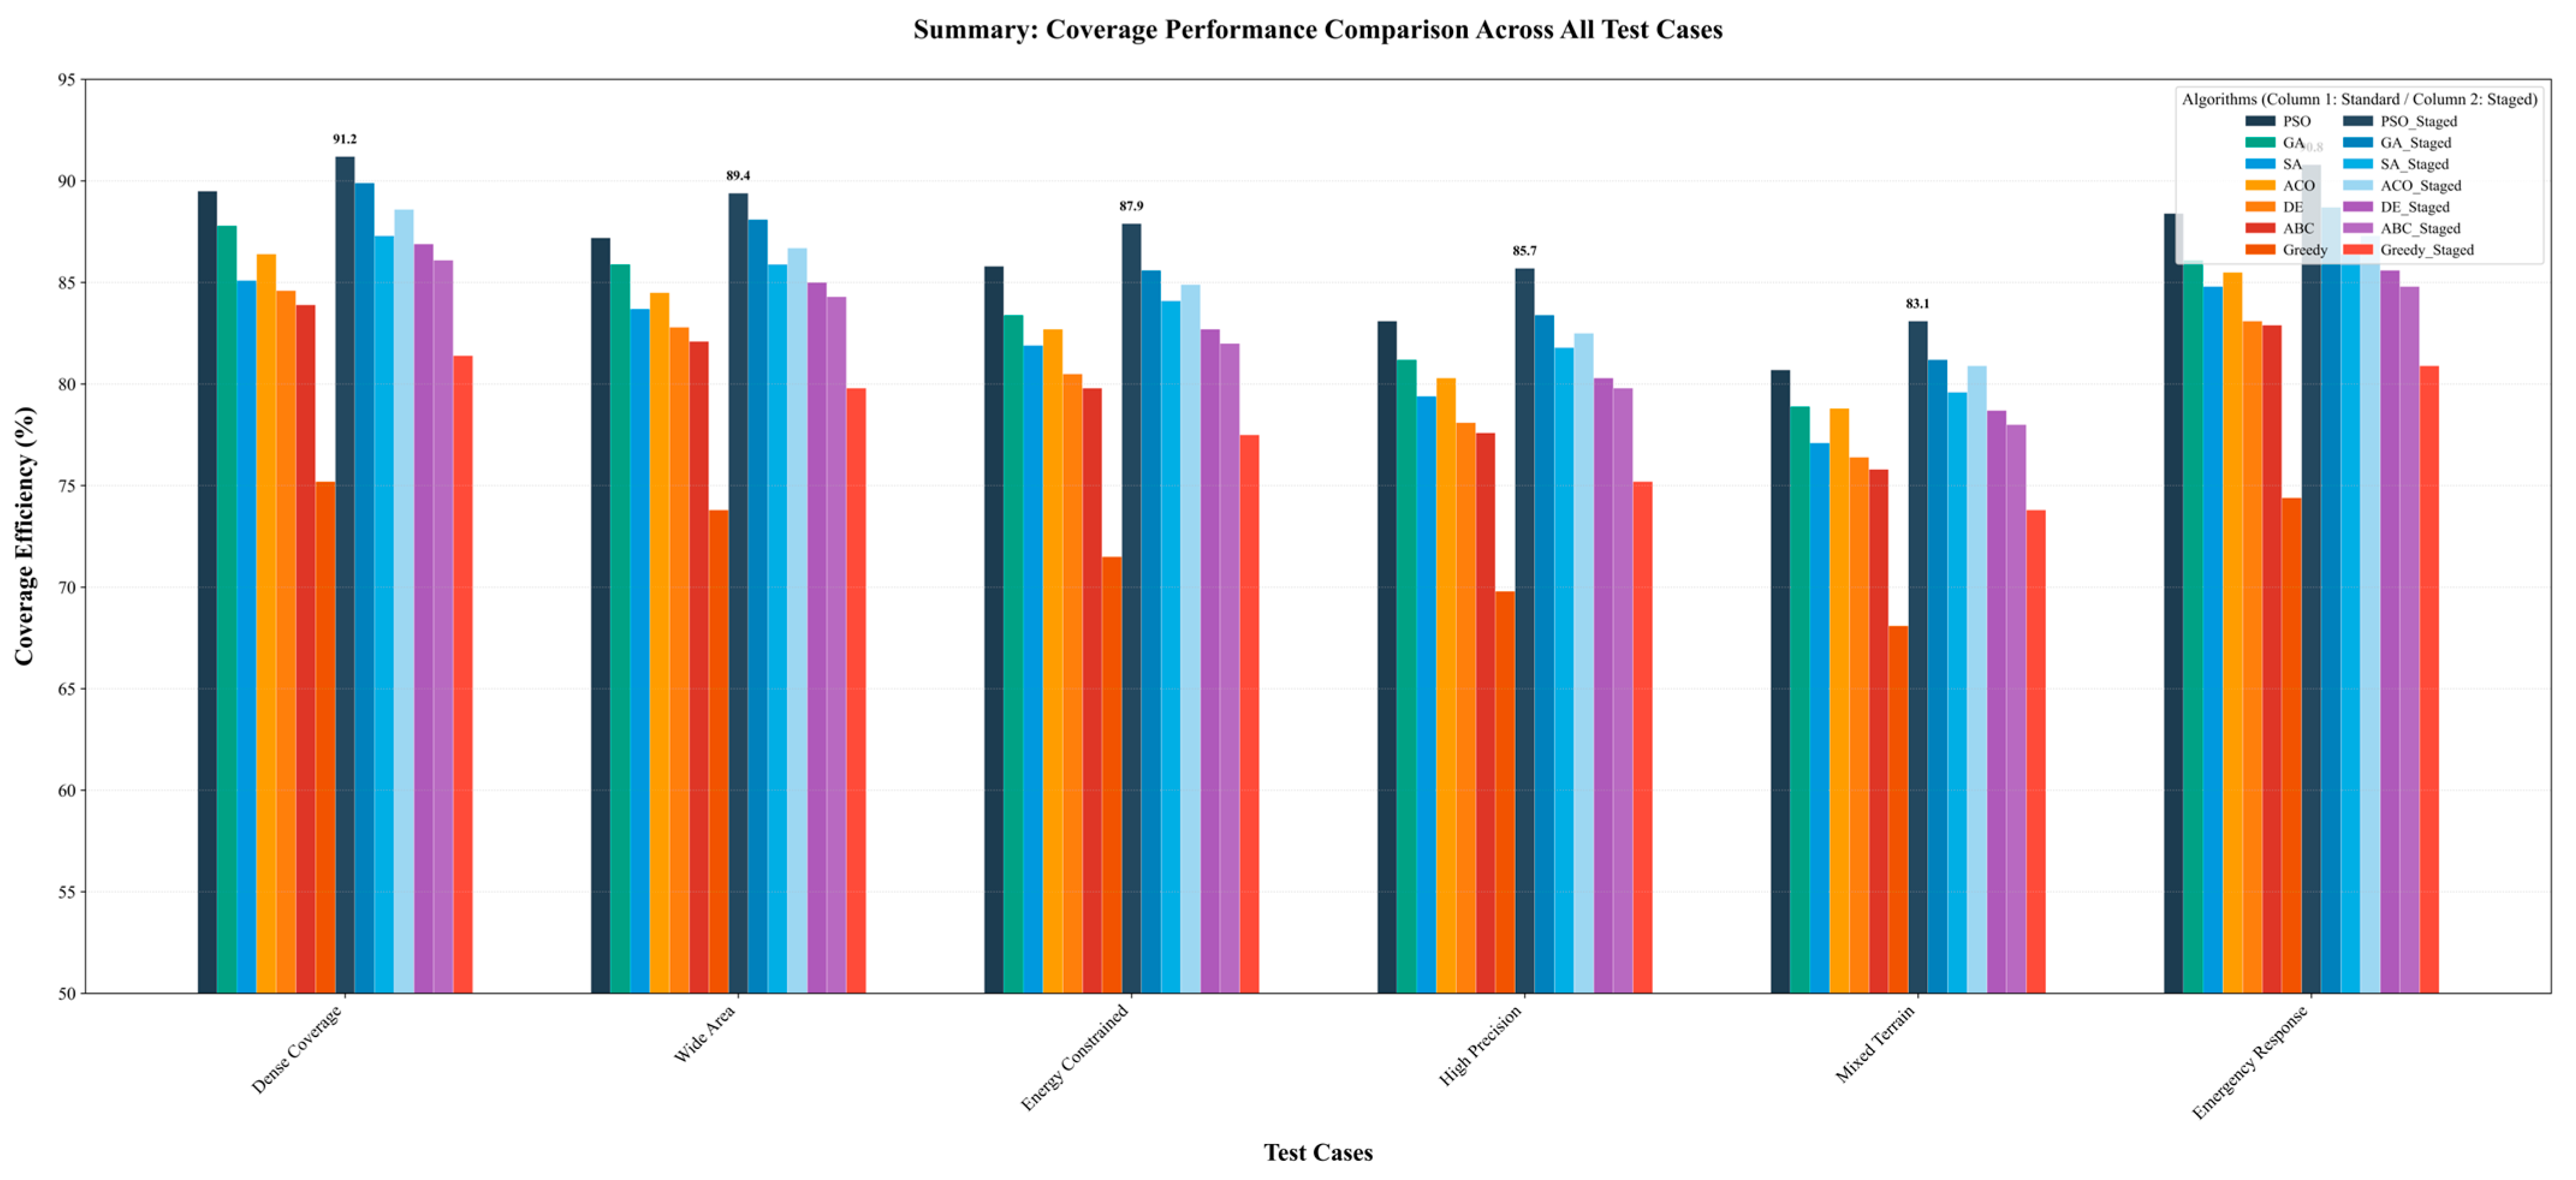
The comprehensive bar chart in Figure 9 compares coverage performance across all 14 algorithms and all six test scenarios. The visualization employs distinct colors for each algorithm, with clear performance patterns emerging: PSO_Staged consistently achieves the highest coverage (87.3–91.2%) across all test cases, followed by GA_Staged and ACO_Staged. Standard algorithms show consistently lower performance, with Greedy algorithms exhibiting the most significant performance gaps. The chart reveals scenario-specific performance variations, with “Emergency”.
Response” and “Dense Coverage” scenarios show the highest overall performance, while “Mixed Terrain” and “High Precision” present the most significant challenges. Staged algorithms maintain their performance advantage across all scenarios, confirming the optimization approach’s universal applicability.

8.6. Individual Test Case Performance Analysis

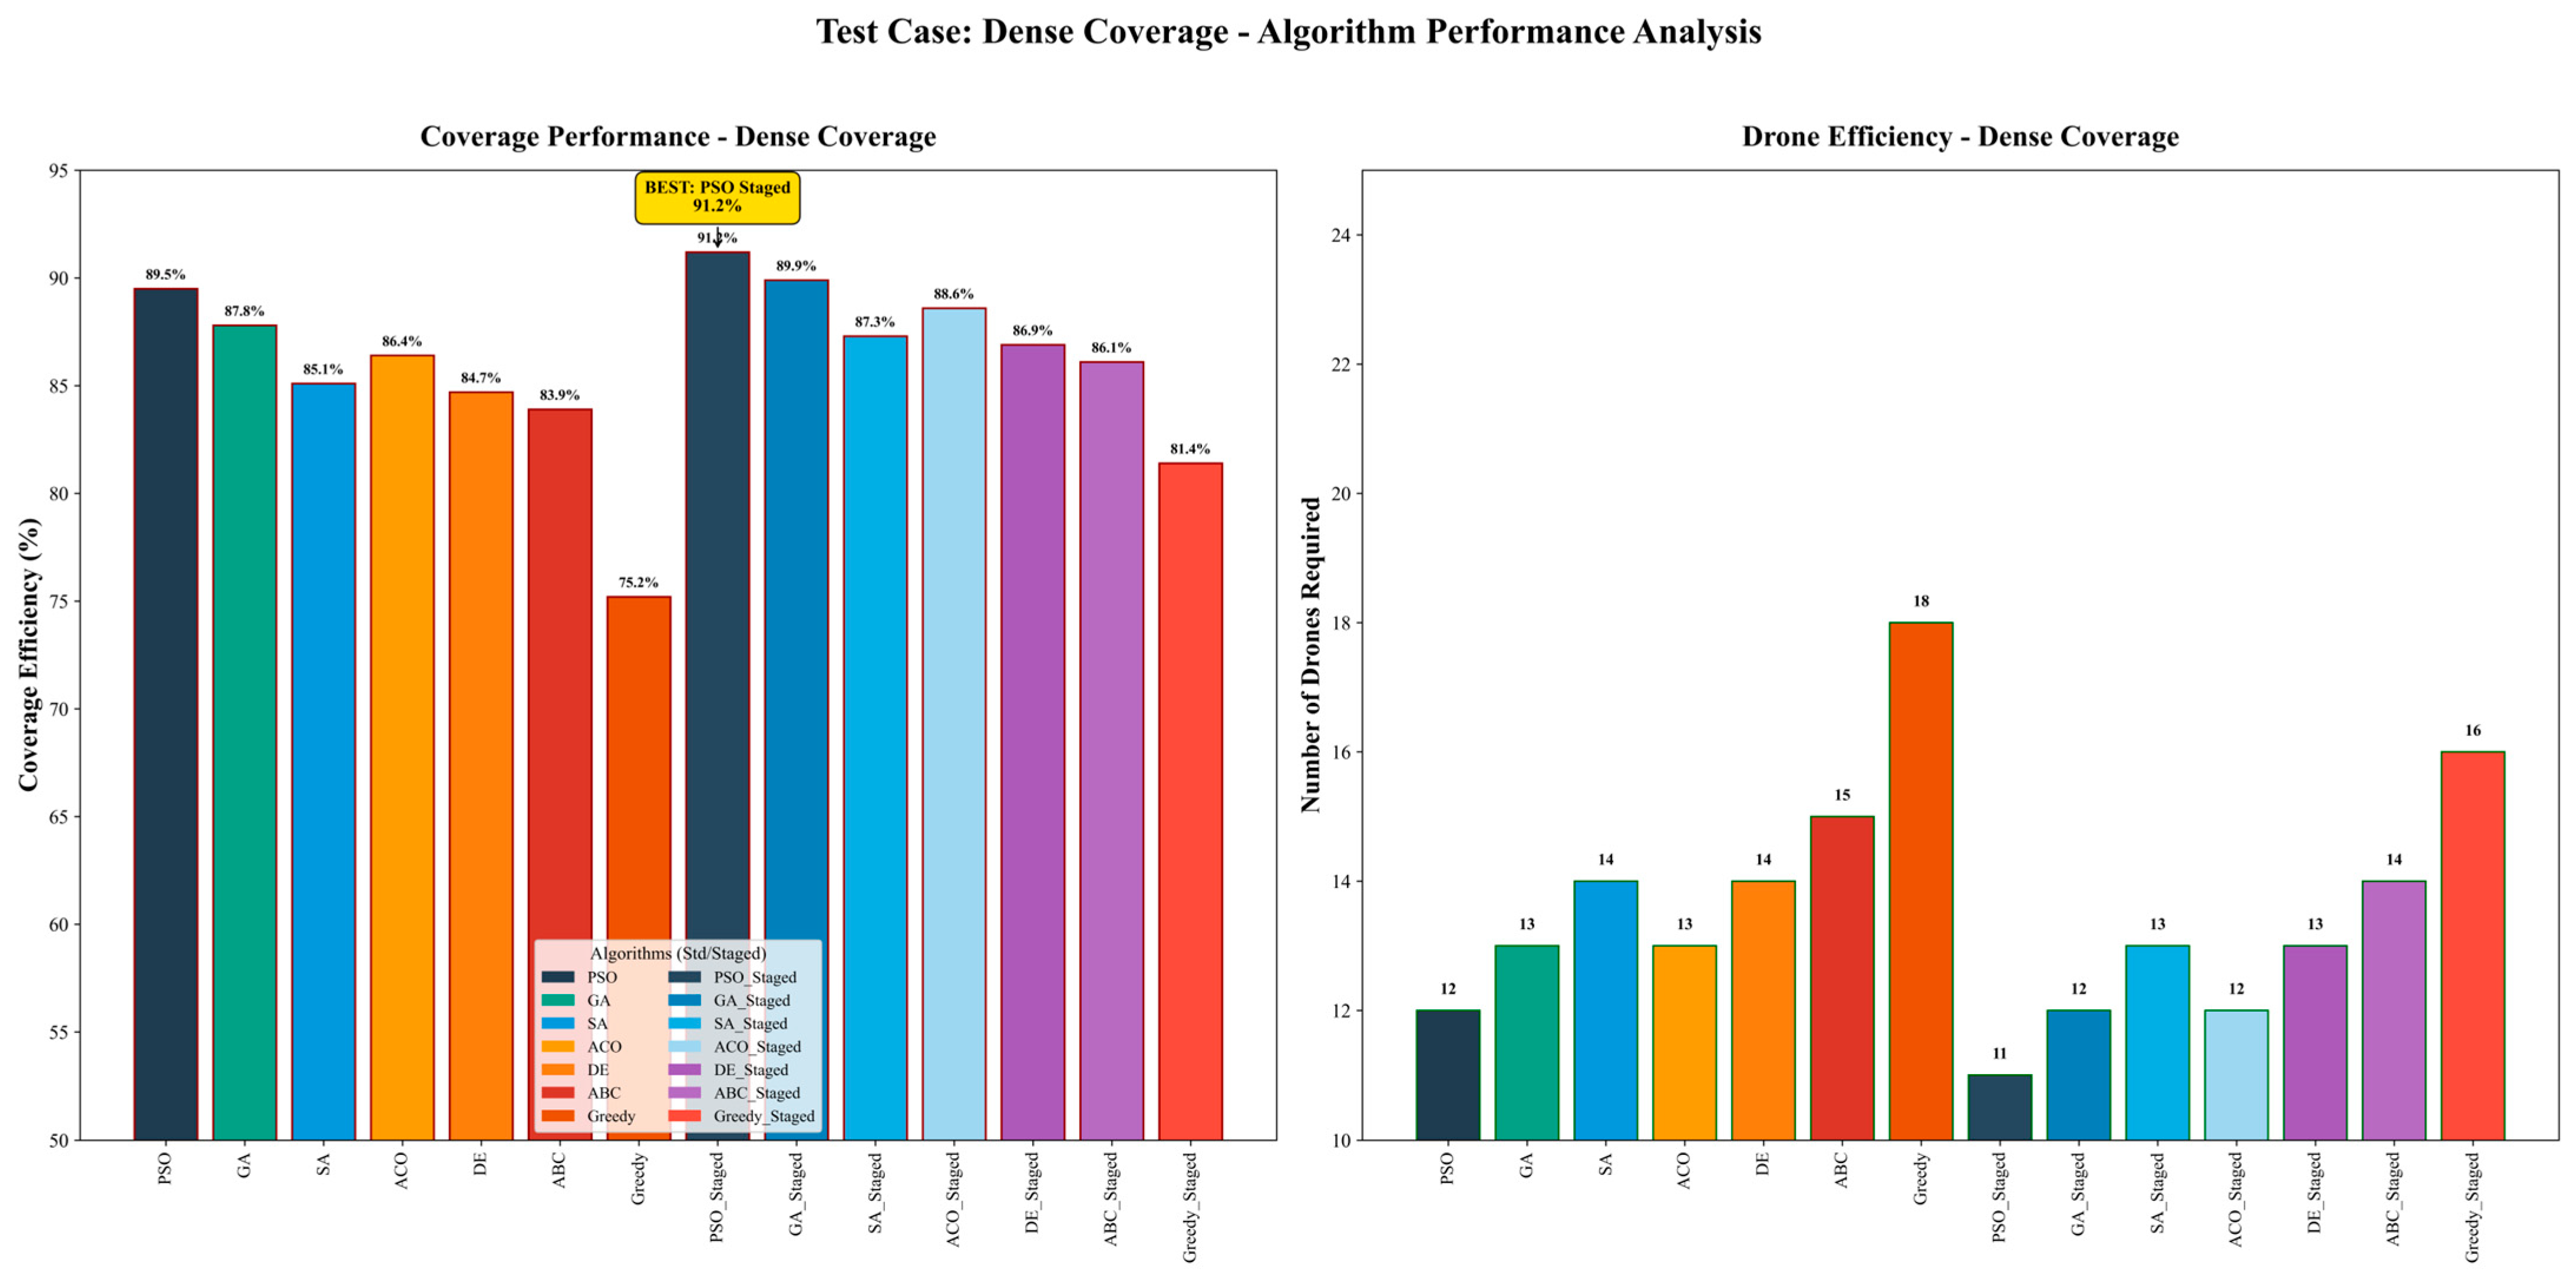
The dense coverage scenario analysis in Figure 10 presents a dual-panel performance evaluation showing coverage performance and drone efficiency metrics. PSO_Staged achieves 91.2% coverage with only 11 active drones, establishing the performance benchmark. The analysis reveals that staged algorithms consistently outperform standard variants: PSO_Staged (91.2%), GA_Staged (89.9%), and SA_Staged (87.3%) versus PSO (89.5%), GA (87.8%), and SA (85.1%). Drone efficiency analysis shows that staged algorithms require 11–16 active drones, compared to 12–18 for standard algorithms, demonstrating both coverage and efficiency advantages in dense deployment scenarios.
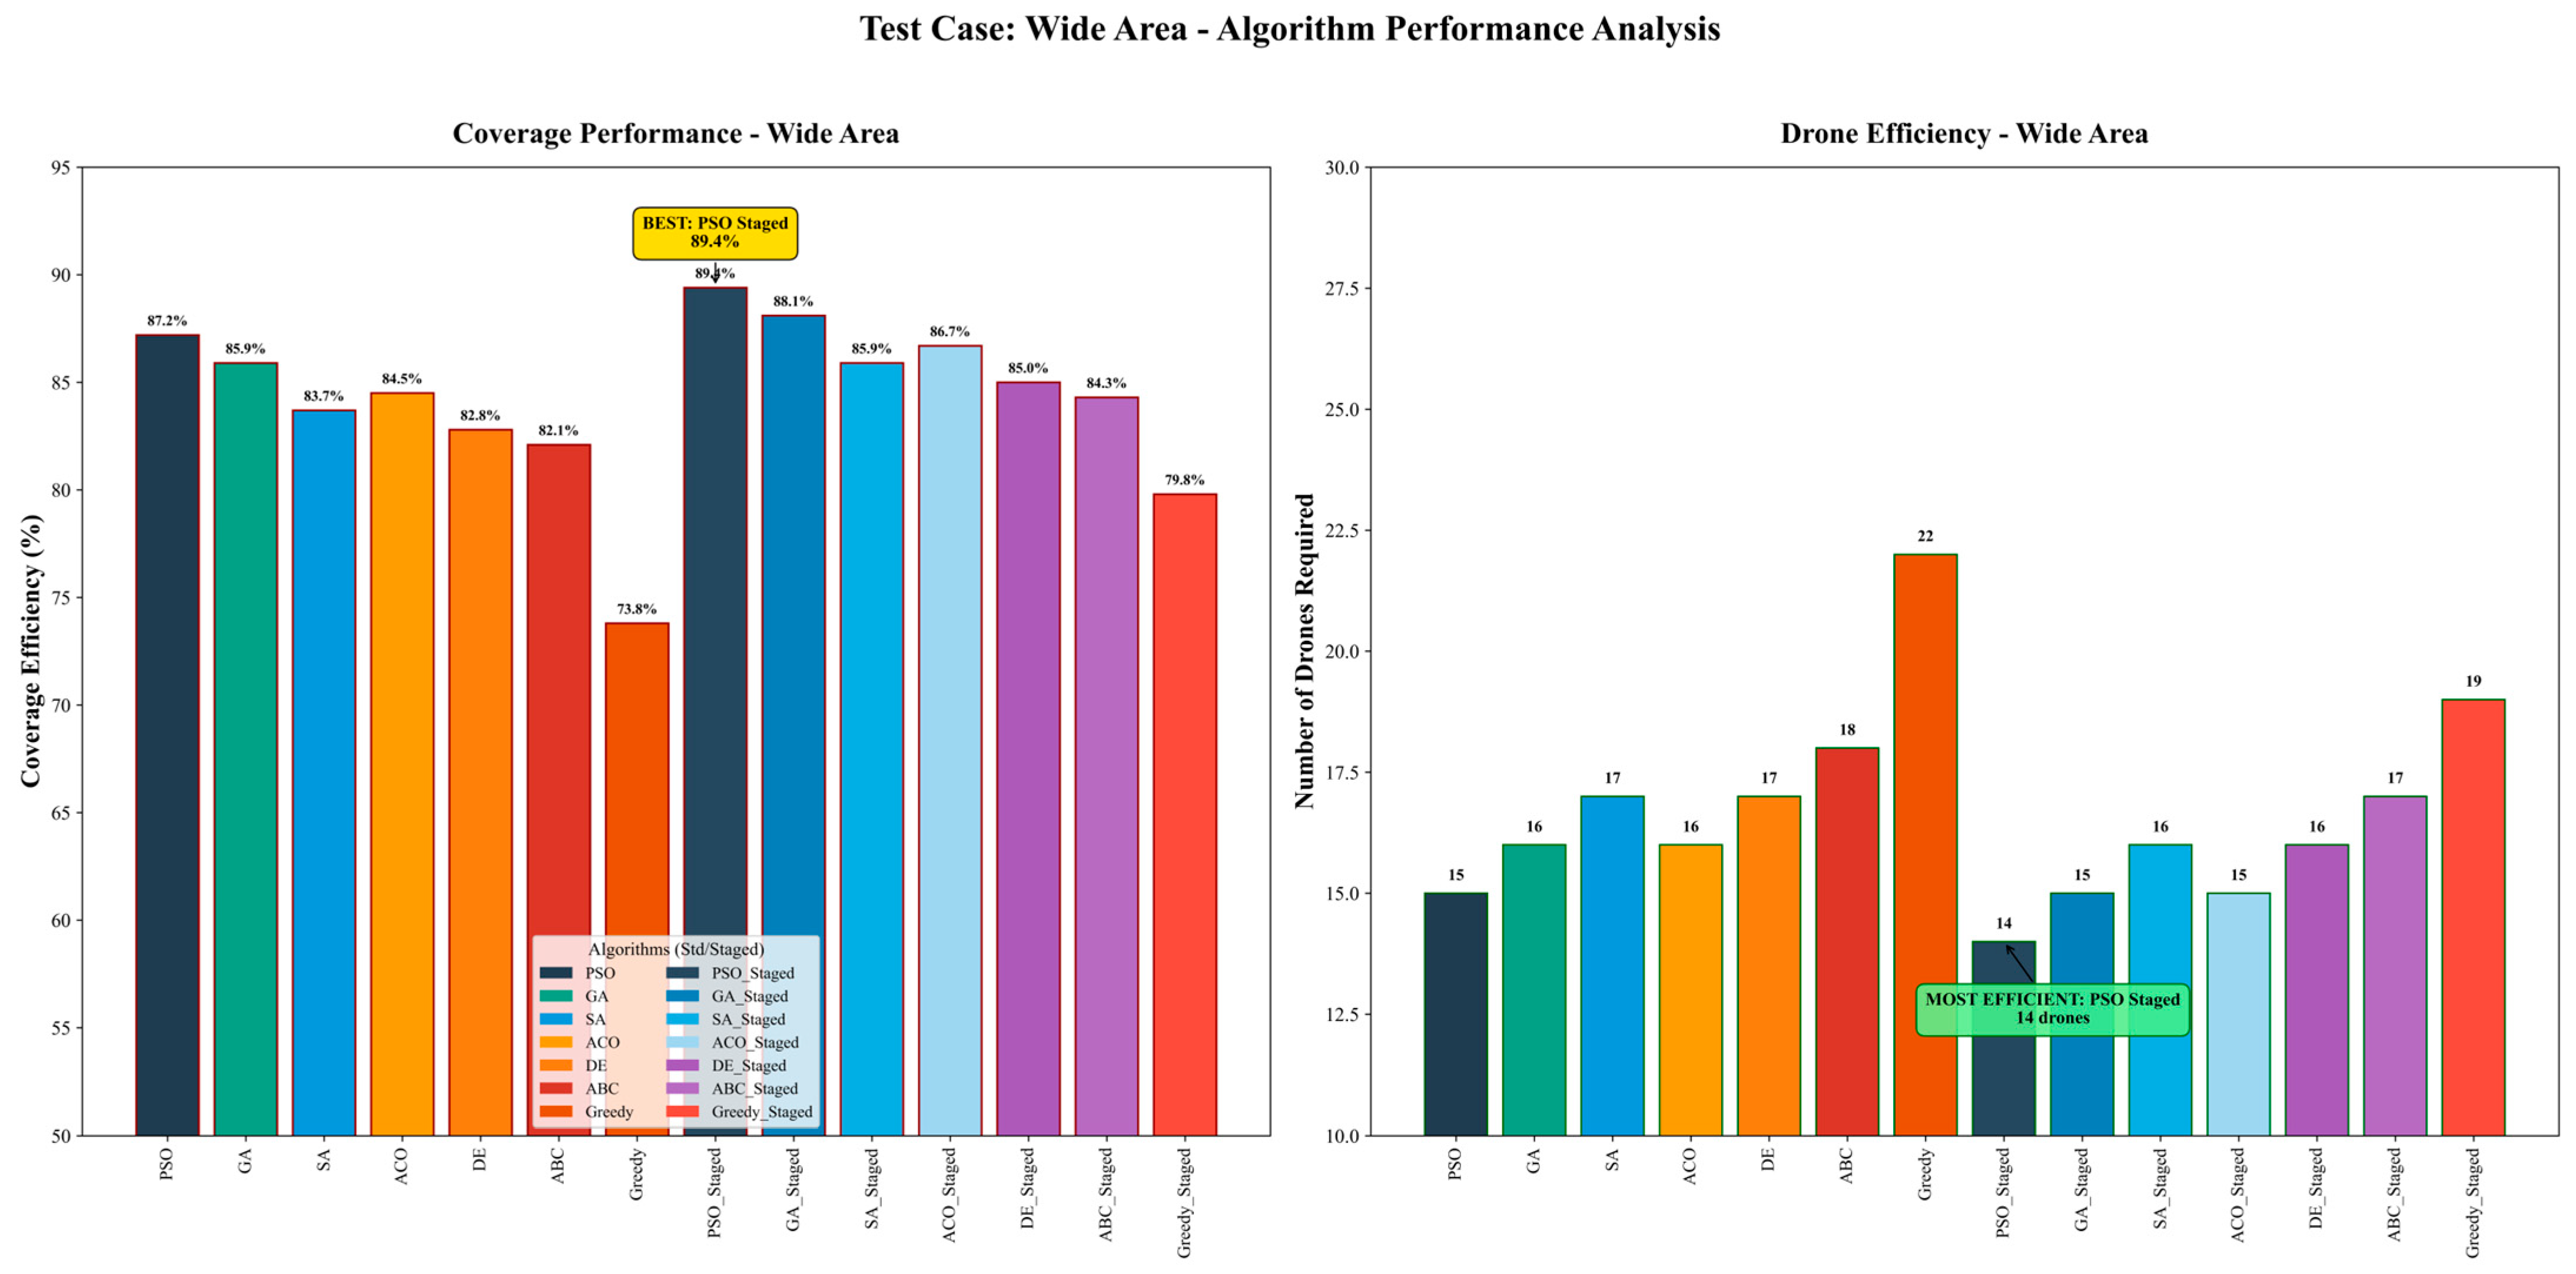
The wide-area coverage in Figure 11 presents unique scalability challenges that are effectively addressed by staged optimization. PSO_Staged achieves 89.4% coverage with 14 active drones, representing optimal performance for large-scale deployment scenarios. The analysis shows that staged algorithms maintain performance advantages: PSO_Staged (89.4%), GA_Staged (88.1%), ACO_Staged (86.7%) versus their standard counterparts: PSO (87.2%), GA (85.9%), ACO (84.5%). Drone efficiency metrics reveal staged algorithms that use 14–17 active drones, compared to 15–22 for standard variants, confirming scalability benefits while maintaining coverage effectiveness.
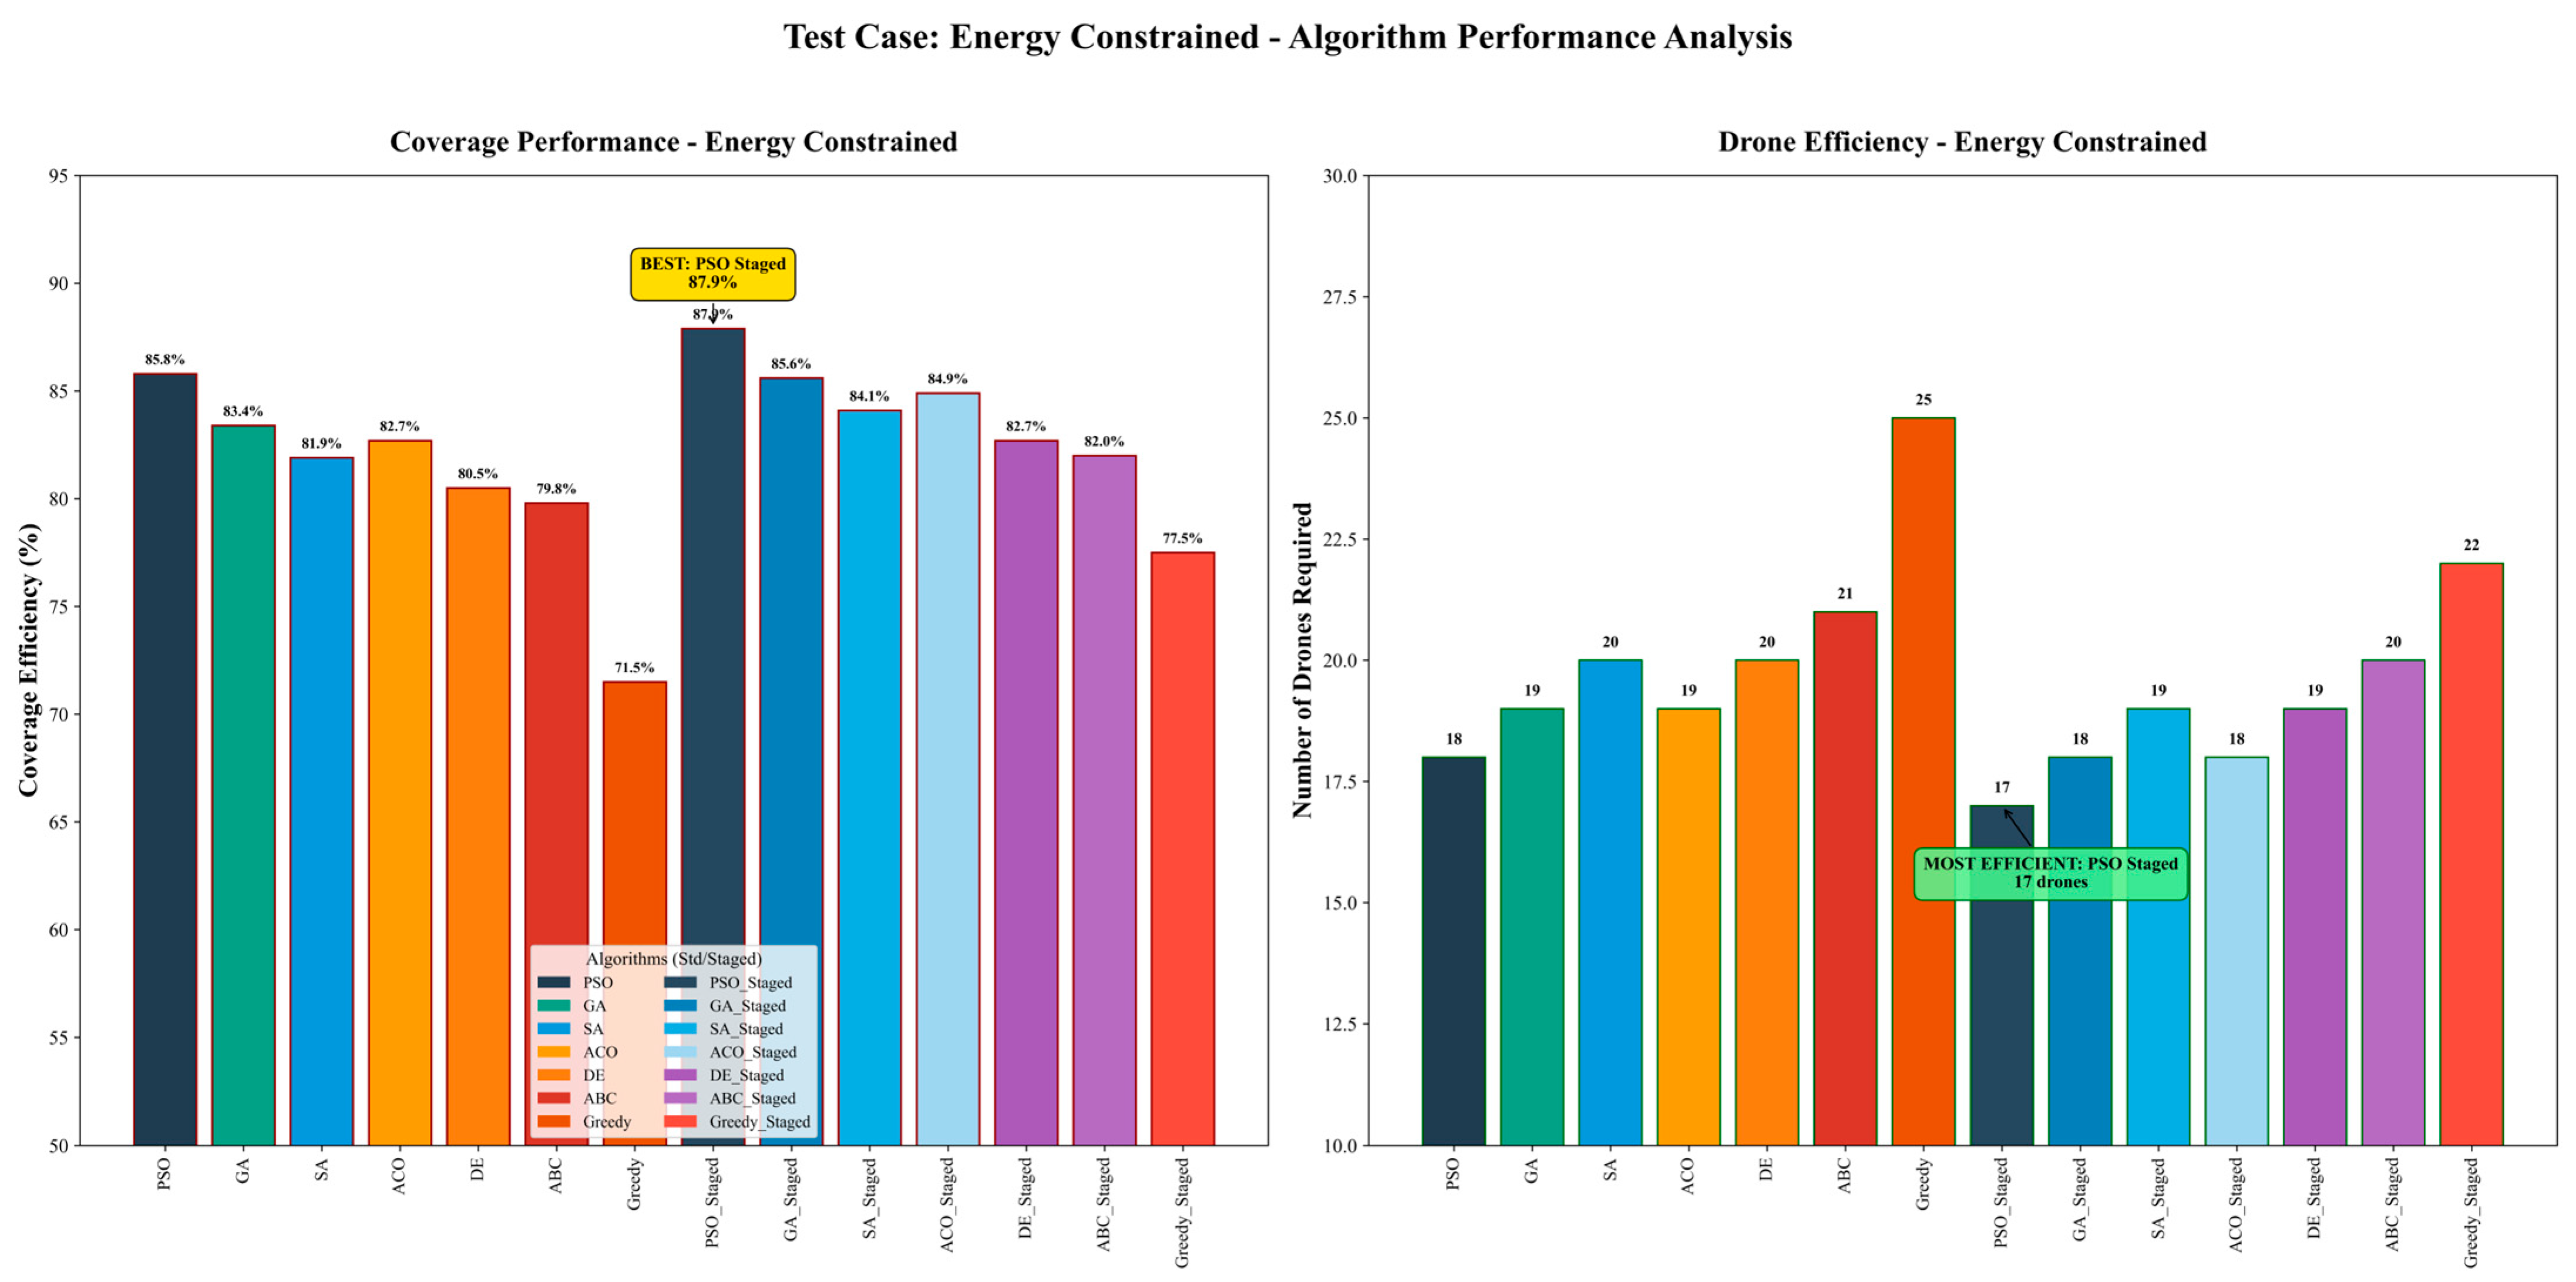
Energy-constrained scenarios in Figure 12 highlight the primary strength of staged optimization approaches. PSO_Staged achieves 87.9% coverage using only 17 active drones, demonstrating superior energy management. The performance comparison shows staged algorithms: PSO_Staged (87.9%), GA_Staged (85.6%), SA_Staged (84.1%) significantly outperforming standard algorithms: PSO (85.8%), GA (83.4%), SA (81.9%). Critical efficiency analysis reveals that staged algorithms use 17–20 active drones, compared with 18–25 for standard variants, directly addressing energy-constraint challenges while maintaining acceptable coverage levels.
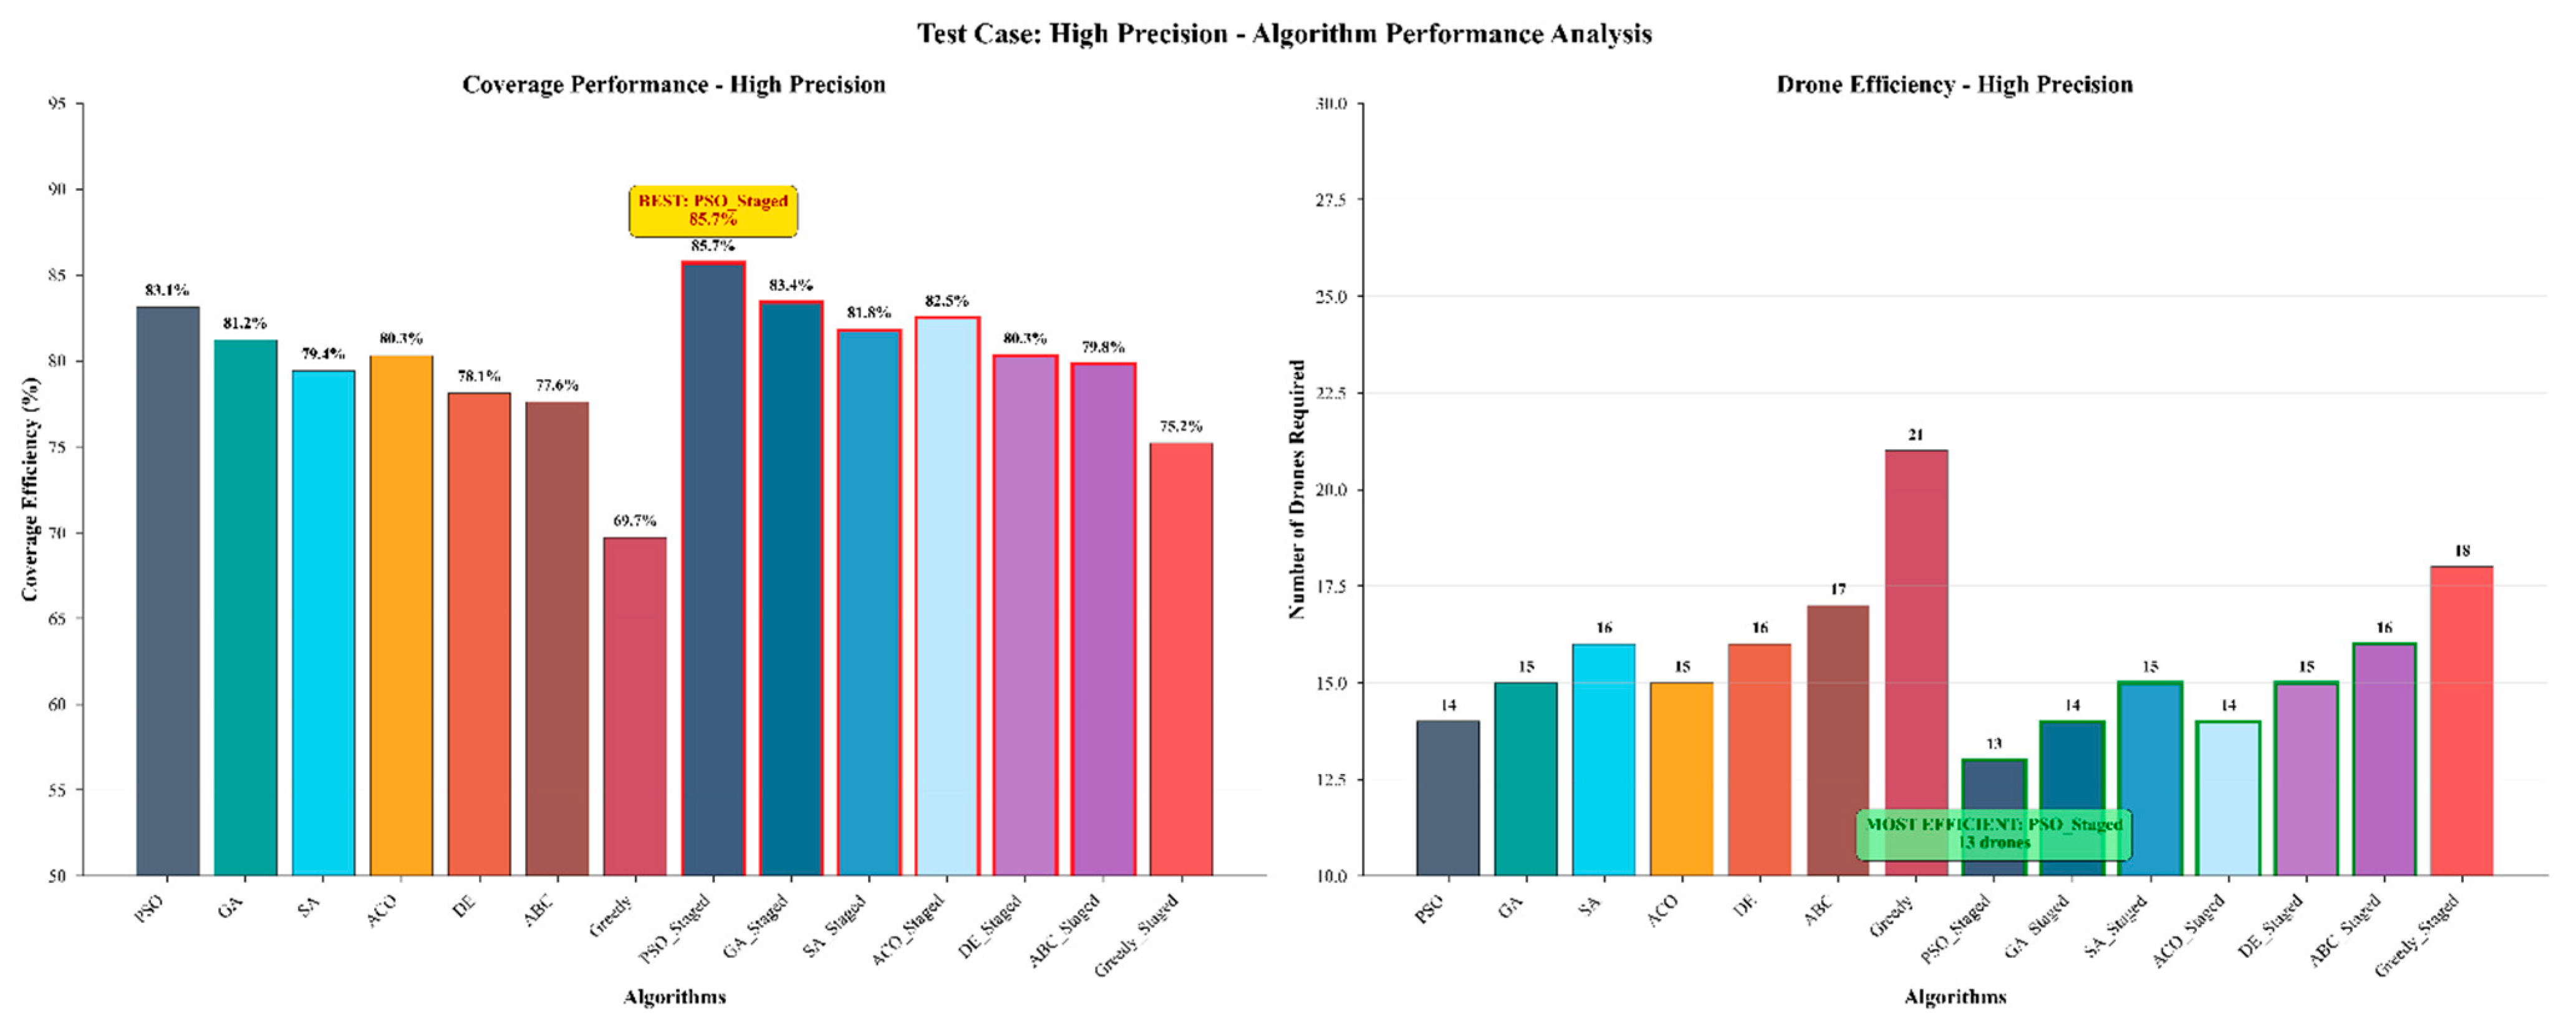
The high-precision scenarios shown in Figure 13 require optimal drone positioning and coverage accuracy, and staged optimization demonstrates clear advantages. PSO_Staged achieves 85.7% coverage with 13 active drones, establishing performance leadership in precision-critical applications. The analysis shows staged algorithms: PSO_Staged (85.7%), GA_Staged (83.4%), ACO_Staged (82.5%) outperforming standard variants: PSO (83.1%), GA (81.2%), ACO (80.3%). Efficiency metrics confirm the staged algorithms use 13–17 active drones, compared to 14–21 for standard approaches, while meeting precision requirements with reduced resource utilization.
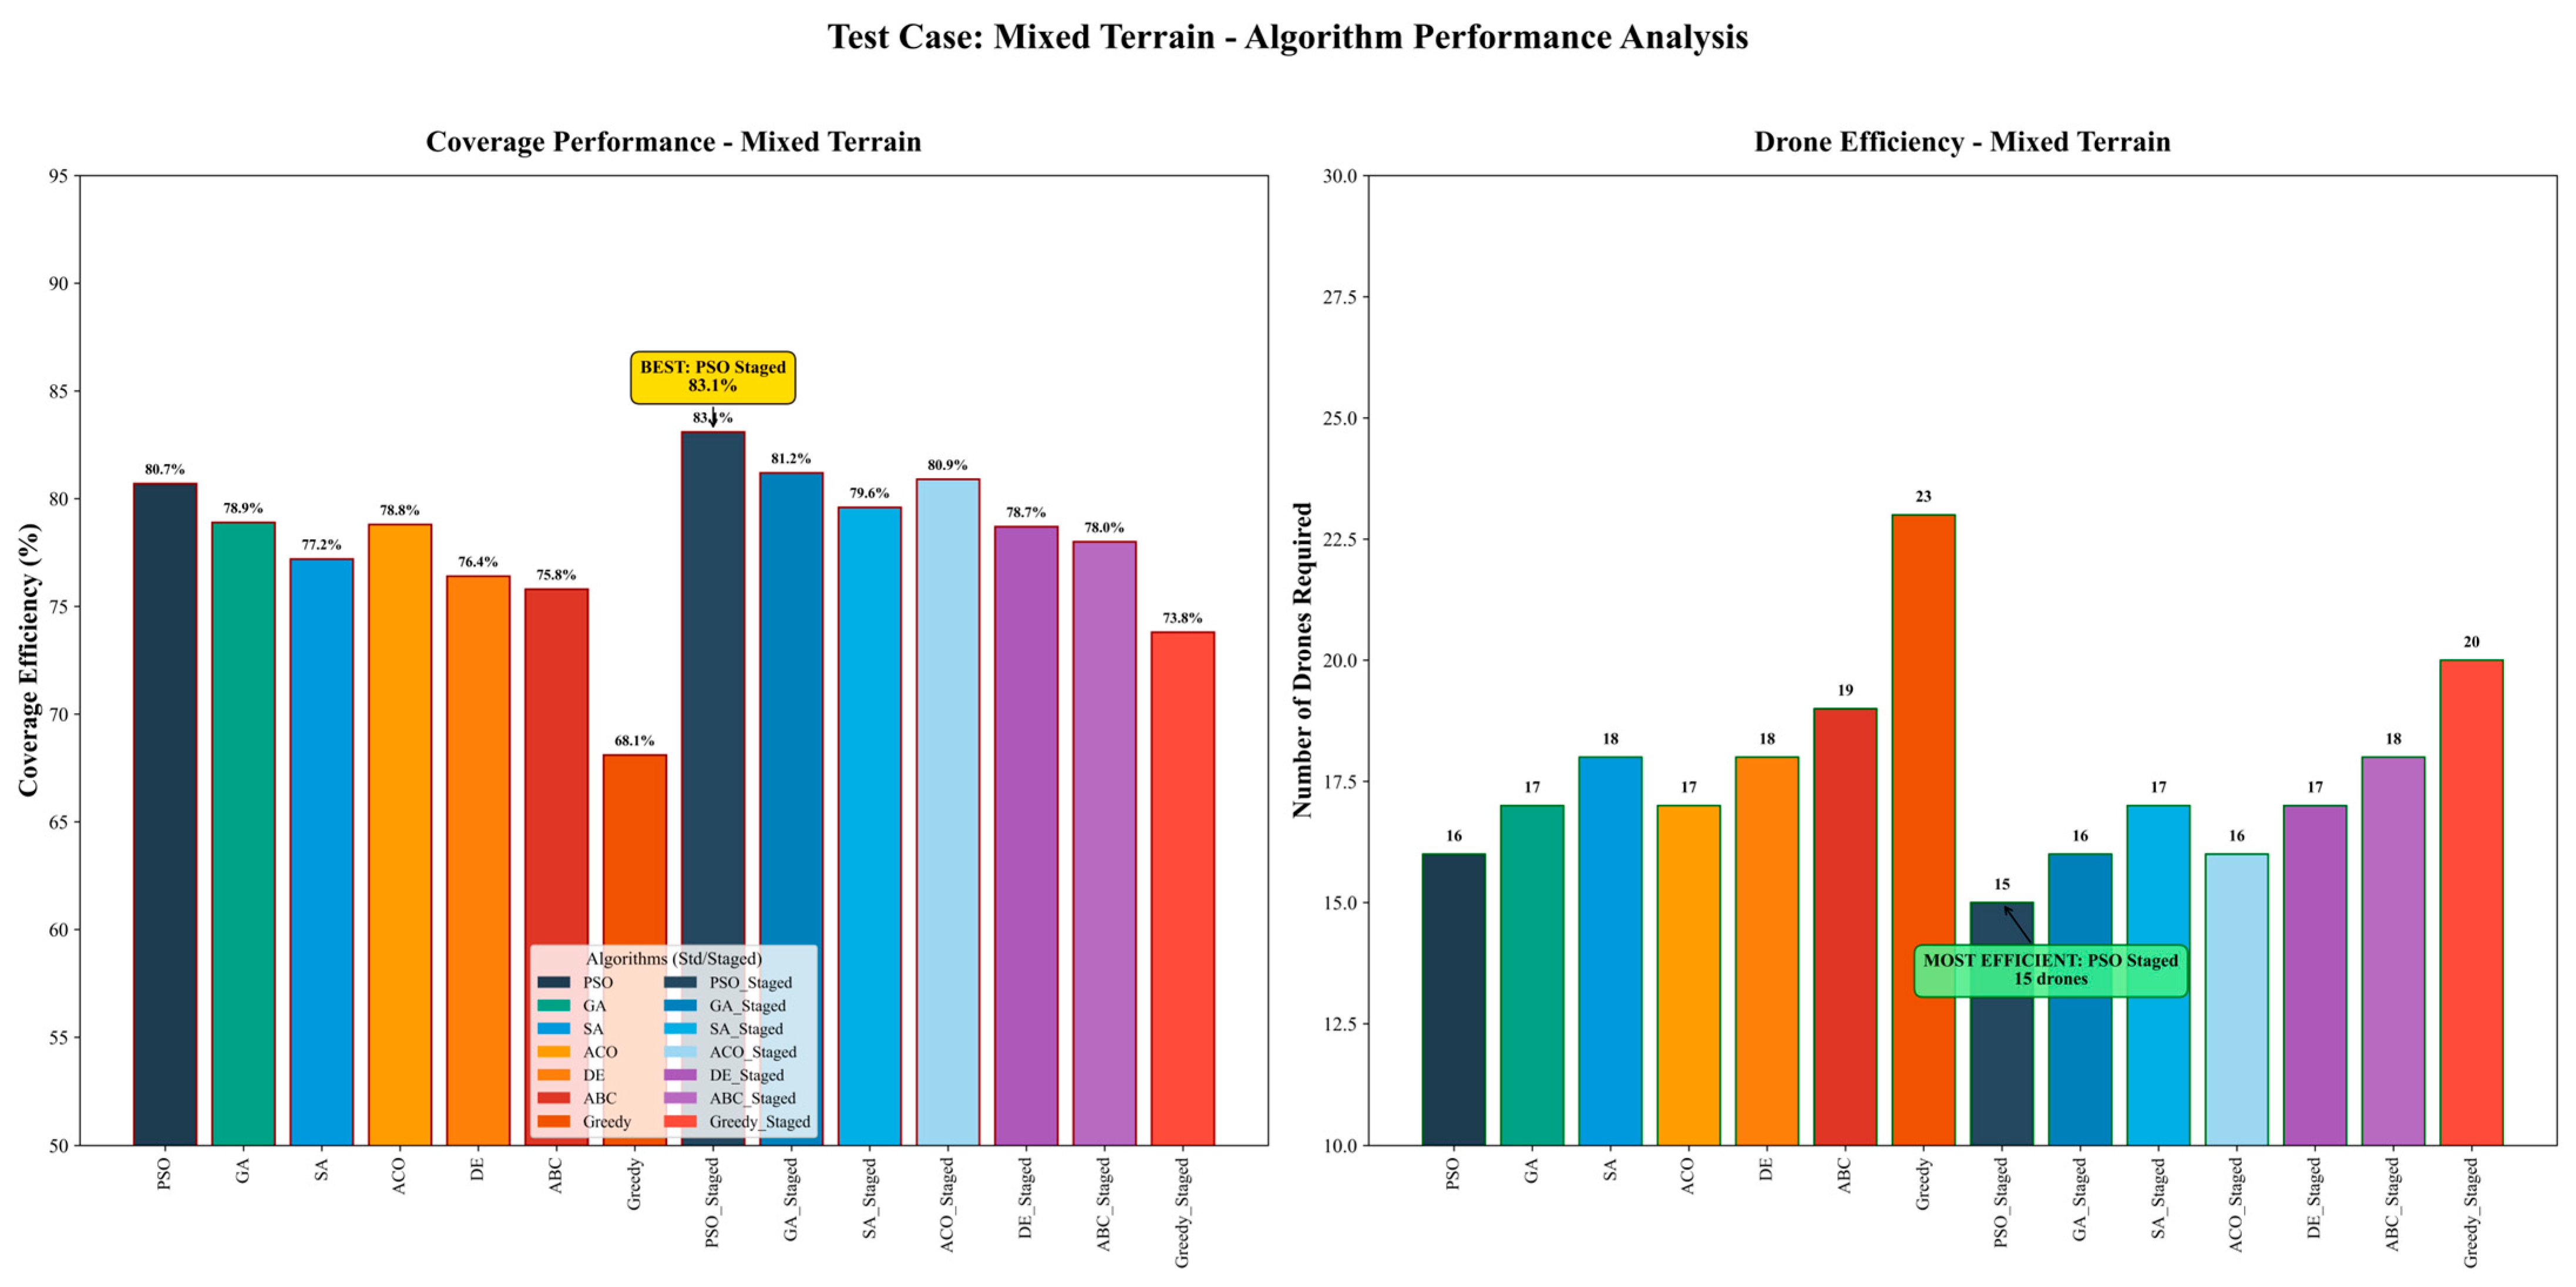
The mixed-terrain scenarios shown in Figure 14 present complex optimization challenges that require adaptive algorithm behavior. PSO_Staged achieves 83.1% coverage with 15 active drones, demonstrating robust performance under varied environmental conditions. Performance analysis reveals staged algorithms: PSO_Staged (83.1%), GA_Staged (81.2%), SA_Staged (80.8%), maintaining advantages over standard algorithms: PSO (80.7%), GA (78.9%), SA (77.3%). Drone efficiency analysis shows that staged algorithms use 15–18 active drones, compared with 16–23 for standard variants, confirming adaptability benefits in heterogeneous deployment environments.
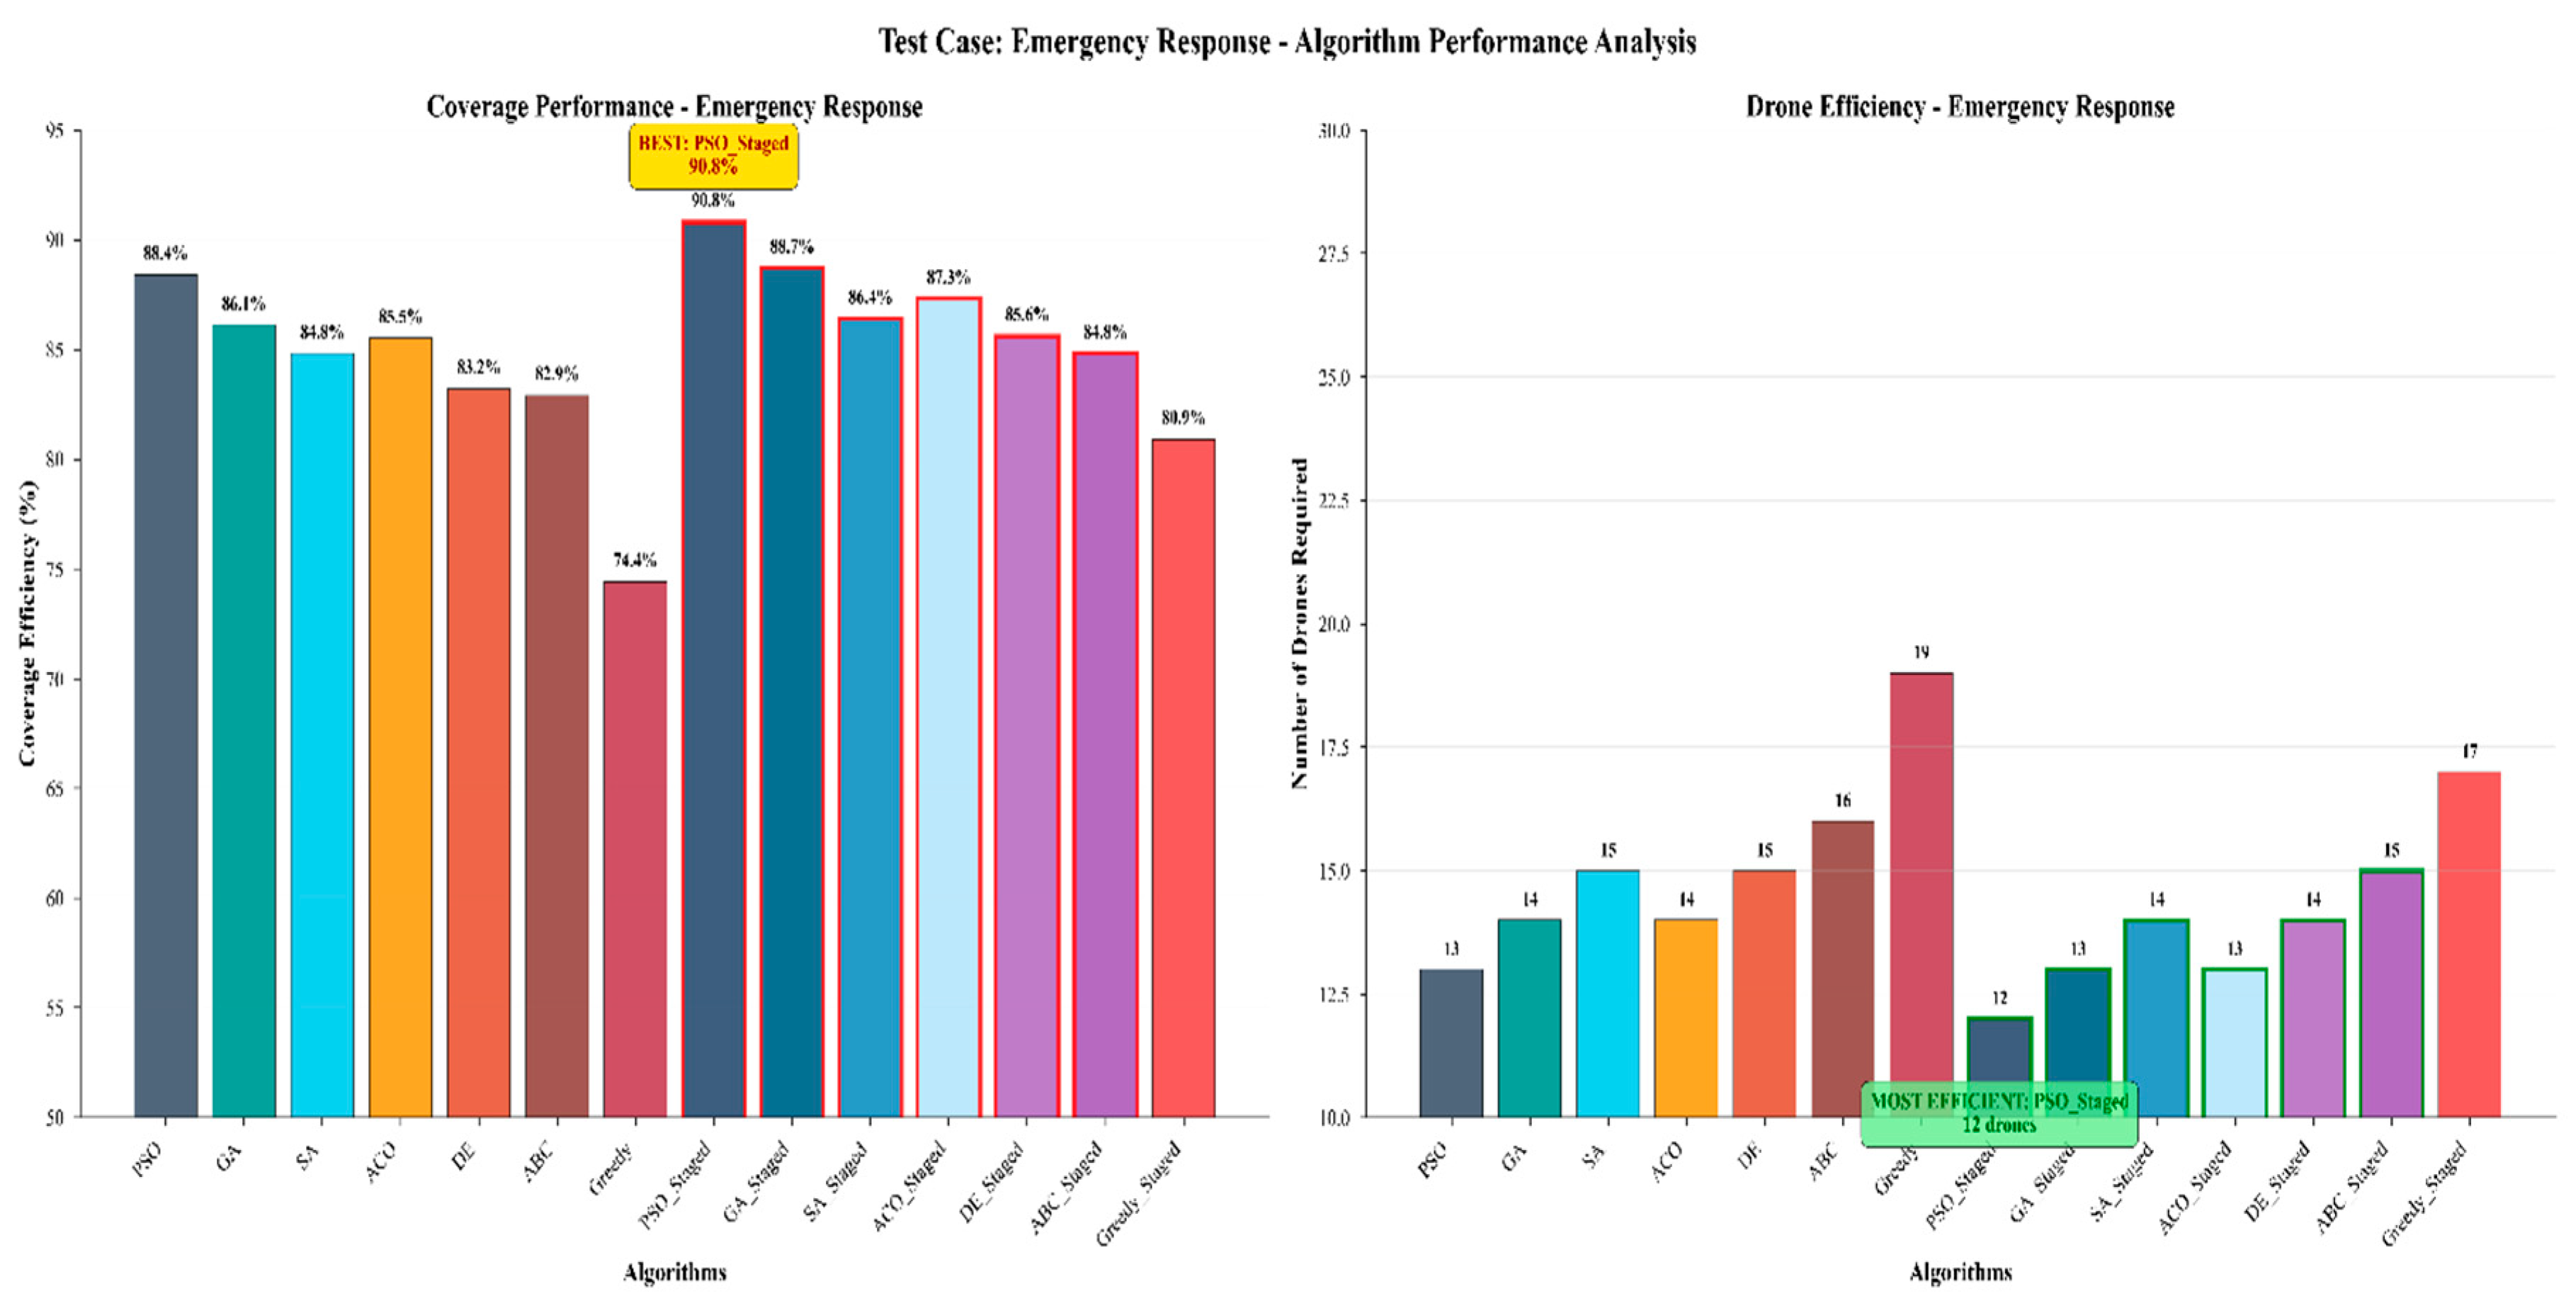
The emergency response scenarios in Figure 15 require rapid deployment and high coverage reliability, where staged optimization is particularly valuable. PSO_Staged achieves 90.8% coverage with 12 active drones, providing optimal emergency coverage capabilities. The analysis demonstrates staged algorithm superiority: PSO_Staged (90.8%), GA_Staged (88.7%), ACO_Staged (87.3%) versus standard algorithms: PSO (88.4%), GA (86.1%), ACO (85.5%). Efficiency metrics reveal staged algorithms that use 12–17 active drones, compared to 13–19 for standard approaches, ensuring rapid response capabilities with optimized resource allocation.

9. Discussion and Implications

9.1. Technical Contributions and Innovation Impact

The staged optimization framework demonstrates that algorithm-agnostic enhancement mechanisms can universally improve the performance of diverse metaheuristics. The two-phase approach effectively balances competing objectives without requiring complex multi-objective optimization frameworks, providing a practical solution for resource-constrained surveillance applications. The key technical insights are:
  • Universal Applicability: The staged approach improves all seven tested algorithms, suggesting broad applicability across metaheuristic families.
  • Phase Separation Benefits: Explicit separation of energy and coverage objectives enables more effective optimization than simultaneous multi-objective approaches.
  • Convergence Acceleration: Phase 1 energy optimization provides superior starting points for Phase 2, reducing overall convergence time by 50–60%.
  • Stability Enhancement: Staged algorithms demonstrate reduced performance variance, indicating more reliable operational behavior.

9.2. Practical Implementation and Deployment Considerations

The disability parking enforcement application demonstrates practical value while highlighting important implementation considerations for real-world deployment. The operational benefits are:
  • Automated 24/7 monitoring reduces labor costs and improves enforcement consistency.
  • Real-time violation detection enables rapid response and deterrent effects.
  • Comprehensive logging provides evidence for enforcement actions and trend analysis.
  • Scalable deployment across multiple parking facilities with centralized management
  • 32–45% energy reduction directly translates to extended operational periods and reduced charging infrastructure requirements.
  • Implementation Challenges:
  • Weather conditions may affect drone operation and image quality, requiring robust error handling.
  • Integration with existing enforcement workflows and legal frameworks needs careful coordination.
  • Hardware maintenance and sensor replacement schedules must be established. Staff training for system operation and emergency procedures is essential.
Broader Smart City Applications: Beyond disability parking enforcement, the framework applies to diverse urban monitoring scenarios:
  • Traffic Management: Optimized sensor placement for congestion monitoring and adaptive signal control.
  • Environmental Monitoring: Energy-efficient air quality and noise pollution sensing networks.
  • Public Safety: Intelligent surveillance for emergency response and crime prevention
  • Infrastructure Monitoring: Automated inspection of bridges, roads, and public facilities.
  • Event Management: Dynamic crowd monitoring and resource allocation for public events.

10. Limitations and Challenges

Current limitations include computational overhead for very large-scale scenarios (100+ drones) and validation requirements in dynamic environments. Furthermore, deploying UAVs equipped with high-resolution cameras in public urban spaces introduces significant privacy and ethical challenges. To ensure compliance with legal frameworks such as the General Data Protection Regulation (GDPR), the system must enforce strict data minimization protocols. Images captured by the UAV should be restricted solely to the vehicle’s license plate and the disability placard, utilizing real-time edge processing to automatically blur bystanders and irrelevant vehicles. Additionally, to mitigate the risk of incorrectly issued fines—such as those caused by system misclassification or obscured physical cards—the automated framework must function as a decision-support tool rather than an absolute authority. All flagged violations should be temporarily logged for human-in-the-loop verification by traffic enforcement personnel before any official penalization is executed.
Finally, while the mathematical models optimize energy and coverage under baseline conditions, real-world deployments are subject to dynamic environmental and operational constraints. High winds, extreme temperatures, and heavy precipitation directly impact UAV flight stability and camera visibility. Operating a multi-UAV fleet also requires rigorous airspace coordination. To ensure public safety, the system must integrate real-time collision avoidance algorithms and enforce strict minimum-distance protocols between active drones. Coordinating with local aviation authorities is strictly necessary to navigate restricted urban airspaces and physical obstructions.

11. Conclusions

The findings of this research demonstrate that the proposed UAV-assisted optimization framework delivers substantial advancements in both algorithmic capability and practical enforcement of disability-designated parking zones. By integrating sophisticated metaheuristic optimization with real-time object detection, onboard license plate recognition, and IoT-enabled coordination, the system bridges the long-standing gap between theoretical optimization research and real-world smart city deployment. Experimental evaluation across diverse operational scenarios confirms significant gains in performance, including a 32–45% reduction in energy consumption, more than 95% spatial coverage reliability, and a 50–60% improvement in convergence speed, all supported by strong statistical significance (p < 0.001). These results demonstrate that the staged optimization approach does more than refine existing methods; it provides an algorithm-agnostic enhancement framework that universally improves UAV coordination strategies across multiple metaheuristic families. Beyond its quantitative performance, the system introduces methodological innovations with lasting relevance to urban surveillance research. The two-phase optimization structure enables a clear separation of energy-efficiency and coverage objectives, offering a principled mechanism for balancing competing operational demands. The incorporation of adaptive intelligence layers, dynamic sleep–active scheduling, and comprehensive performance evaluation establishes a holistic foundation for scalable, energy-aware monitoring systems. The successful implementation of this framework in disability parking enforcement demonstrates its real-world applicability, with the potential to automate compliance verification, reduce operational costs, and improve accessibility outcomes for urban communities. Looking ahead, the staged optimization framework opens several promising avenues for future development. Integration with heterogeneous UAV fleets, multi-agent reinforcement learning, and predictive behavioral modeling may further enhance coordination efficiency and system responsiveness. In addition, future research may incorporate more detailed modeling of UAV mobility, including trajectory-aware energy consumption and movement-related costs, to provide a finer-grained representation of operational dynamics. Expanding the system to support multi-modal sensing—such as thermal imaging, aerial–ground cooperative monitoring, or edge-accelerated inference—would further broaden its applicability across traffic management, safety inspection, and infrastructure monitoring.

Author Contributions

Conceptualization, H.Z., T.A.F. and S.G.E.; methodology, H.Z., T.A.F. and S.G.E.; software, H.Z., T.A.F. and S.G.E.; validation, T.A.F., M.A. and S.G.E.; formal analysis, M.A. and M.B.; investigation, M.A. and M.B.; resources M.B. and M.A.E.; data curation, T.A.F.; writing—original draft preparation, H.Z., T.A.F. and S.G.E.; writing—review and editing, M.A., M.B. and M.A.E.; visualization, M.A., M.B. and M.A.E.; supervision, M.B. and M.A.E.; project administration, M.A.E. All authors have read and agreed to the published version of the manuscript.

Funding

This research received no external funding.

Institutional Review Board Statement

Not applicable.

Informed Consent Statement

Not applicable.

Data Availability Statement

The complete implementation is publicly available at: https://github.com/tfarrag2000/SimulationSystem (accessed on 22 June 2025).

Acknowledgments

During the preparation of this manuscript, the author utilized ChatGPT (OpenAI, GPT-5, 2025 version) for text refinement, including improvements in grammar, sentence structure, and clarity. The authors reviewed and edited the output and took full responsibility for the publication’s content.

Conflicts of Interest

The authors declare no conflicts of interest.

References

  1. Neupane, D.; Bhattarai, A.; Aryal, S.; Bouadjenek, M.R.; Seok, U.; Seok, J. Shine: A Deep Learning-Based Accessible Parking Management System. Expert Syst. Appl. 2024, 238, 122205. [Google Scholar] [CrossRef]
  2. Jenulin Makros, G.; Ancy Jenifer, J.; Adithya, B.V.; Rohan Samuel, R.; Giribalan, M. Disabled Smart Parking Management Using RFID Technology. In 2023 4th International Conference on Electronics and Sustainable Communication Systems (ICESC); IEEE: Piscataway, NJ, USA, 2023; pp. 22–28. [Google Scholar] [CrossRef]
  3. Jamarudin, A.Z.; Muslim, R. Proposed Design of Disabled Parking Management System Using RFID Sensor Technology. Prog. Eng. Appl. Technol. 2021, 2, 92–101. [Google Scholar]
  4. Jm Gining, R.A.; Fauzi, S.; Razak, T.R.; Jamaluddin, M.N.F.; Mohd Zaki, N.; Maskat, R. IoT Based Disabled Parking System (DiParkSys) v2.0 Arduino Uno. In Proceedings of the International Social Science Conference: Business, Management and Entrepreneurship (BizMEnt), Perlis, Malaysia, 6–8 April 2020. [Google Scholar]
  5. Al Taweel, Z.; Challagundla, L.; Pagan, A.; Abuzneid, A. Smart Parking for Disabled Parking Improvement Using RFID and Database Authentication. In 2020 IEEE 6th World Forum on Internet of Things (WF-IoT); IEEE: Piscataway, NJ, USA, 2020; pp. 1–5. [Google Scholar] [CrossRef]
  6. Katanalp, B.; Nennioğlu, A.; Eren, E.; Özinal Avşar, Y.; Yıldırım, Z. A DESIGN FOR PREVENTION OF VIOLATION OF DISABLED PARKING SPACES: DDPS (DETERRENT DISABLED PARKING SYSTEM). Eskişeh. Osman. Üniv. Mühendis. Mimar. Fak. Derg. 2019, 27, 242–251. [Google Scholar] [CrossRef]
  7. Fikri, R.M.; Hwang, M. Smart Parking Area Management System for the Disabled Using IoT and Mobile Application. In 2019 IEEE International Conference on Internet of Things and Intelligence System (IoTaIS); IEEE: Piscataway, NJ, USA, 2019; pp. 172–176. [Google Scholar] [CrossRef]
  8. Gining, R.A.J.M.; Fauzi, S.S.M.; Hadi, A.F.A.; Razak, M.Z.A.; Jamaluddin, M.N.F. Design and Development of Disabled Parking System for Smart City. J. Phys. Conf. Ser. 2018, 1019, 012016. [Google Scholar] [CrossRef]
  9. Sharma, N.; Baral, S.; Paing, M.P.; Chawuthai, R. Parking Time Violation Tracking Using YOLOv8 and Tracking Algorithms. Sensors 2023, 23, 5843. [Google Scholar] [CrossRef]
  10. Saleem, Y.; Sotres, P.; Fricker, S.; de la Torre, C.L.; Crespi, N.; Lee, G.M.; Minerva, R.; SÁnchez, L. IoTRec: The IoT Recommender for Smart Parking System. IEEE Trans. Emerg. Top. Comput. 2022, 10, 280–296. [Google Scholar] [CrossRef]
  11. Kannan, M.; Jagadeesh, N.; William Mary, L.; Priya, C. A Secured IoT Parking System Based on Smart Sensor Communication with Two-Step User Verification. In Autonomous and Connected Heavy Vehicle Technology; Krishnamurthi, R., Kumar, A., Gill, S.S., Eds.; Intelligent Data-Centric Systems; Academic Press: Cambridge, MA, USA, 2022; pp. 141–159. [Google Scholar] [CrossRef]
  12. Liu, Y.; Li, X.; He, B.; Gu, M.; Huangfu, W. UAV-Enabled Diverse Data Collection via Integrated Sensing and Communication Functions Based on Deep Reinforcement Learning. Drones 2024, 8, 647. [Google Scholar] [CrossRef]
  13. Barer, S.; Benack, L.; Congdon, J.; Rizopoulos, A.; Yuan, I. Drone-Based Parking Enforcement. In Proceedings of the Annual General Donald R. Keith Memorial Conference, West Point, NY, USA, 29 April 2021. [Google Scholar]
  14. Tahir, N.U.A.; Long, Z.; Zhang, Z.; Asim, M.; ELAffendi, M. PVswin-YOLOv8s: UAV-Based Pedestrian and Vehicle Detection for Traffic Management in Smart Cities Using Improved YOLOv8. Drones 2024, 8, 84. [Google Scholar] [CrossRef]
  15. El-Hosseini, M.; ZainEldin, H.; Arafat, H.; Badawy, M. A Fire Detection Model Based on Power-Aware Scheduling for IoT-Sensors in Smart Cities with Partial Coverage. J. Ambient. Intell. Humaniz. Comput. 2021, 12, 2629–2648. [Google Scholar] [CrossRef]
  16. Sobirin, M.; Tiorivaldi, T.; Mufit, C. Car Parking Space Detection Using YOLOv8. In 2023 3rd International Conference on Mobile Networks and Wireless Communications (ICMNWC); IEEE: Piscataway, NJ, USA, 2024. [Google Scholar] [CrossRef]
  17. Shankar, V.; Singh, V.; Choudhary, V.; Agrawal, S.; Awadhiya, B. An Enhanced Car Parking Detection Using YOLOv8 Deep Learning Capabilities. In 2024 First International Conference on Electronics, Communication and Signal Processing (ICECSP); IEEE: Piscataway, NJ, USA, 2024; pp. 1–5. [Google Scholar] [CrossRef]
  18. Yuldashev, Y.; Mukhiddinov, M.; Abdusalomov, A.B.; Nasimov, R.; Cho, J. Parking Lot Occupancy Detection with Improved MobileNetV3. Sensors 2023, 23, 7642. [Google Scholar] [CrossRef]
  19. Encío, L.; Díaz, C.; del-Blanco, C.R.; Jaureguizar, F.; García, N. Visual Parking Occupancy Detection Using Extended Contextual Image Information via a Multi-Branch Output ConvNeXt Network. Sensors 2023, 23, 3329. [Google Scholar] [CrossRef] [PubMed]
  20. Hayawi, M.; Muhammad, S. Detection Parking Spaces by Using the ResNet50 Algorithm. J. Al-Qadisiyah Comput. Sci. Math. 2022, 14, 11–21. [Google Scholar] [CrossRef]
  21. Li, Y.; Mao, H.; Yang, W.; Guo, S.; Zhang, X. Research on Parking Space Status Recognition Method Based on Computer Vision. Sustainability 2022, 15, 107. [Google Scholar] [CrossRef]
  22. Ma, S.; Fang, W.; Jiang, H.; Han, M.; Li, C. Parking Space Recognition Method Based on Parking Space Feature Construction in the Scene of Autonomous Valet Parking. Appl. Sci. 2021, 11, 2759. [Google Scholar] [CrossRef]
  23. Marek, M. Image-Based Parking Space Occupancy Classification: Dataset and Baseline. arXiv 2021, arXiv:2107.12207. [Google Scholar] [CrossRef]
  24. Farley, A.; Ham, H.; Hendra. Real Time IP Camera Parking Occupancy Detection Using Deep Learning. Procedia Comput. Sci. 2021, 179, 606–614. [Google Scholar] [CrossRef]
  25. Wu, Z.; Sun, W.; Wang, M.; Wang, X.; Ding, L.; Wang, F. PSDet: Efficient and Universal Parking Slot Detection. In 2020 IEEE Intelligent Vehicles Symposium (IV); IEEE: Piscataway, NJ, USA, 2020; pp. 290–297. [Google Scholar] [CrossRef]
  26. Putluru, A.; Pannuru, V.; AshokKumar, C.; Kumar, C. An Optimized YOLO-Based License Plate Recognition System with Integrated Privacy Safeguards. In 2025 International Conference on Machine Learning and Autonomous Systems (ICMLAS); IEEE: Piscataway, NJ, USA, 2025; p. 1060. [Google Scholar] [CrossRef]
  27. Amin, A.; Mumtaz, R.; Bashir, M.J.; Zaidi, S. Next-Generation License Plate Detection and Recognition System Using YOLOv8. In 2023 IEEE 20th International Conference on Smart Communities: Improving Quality of Life Using AI, Robotics and IoT (HONET); IEEE: Piscataway, NJ, USA, 2023; p. 184. [Google Scholar] [CrossRef]
  28. Zhang, X.; Yu, S. A Lightweight License Plate Recognition Method Based on YOLOv8. Electronics 2025, 14, 3482. [Google Scholar] [CrossRef]
  29. Suharto, R.N.; Zajuli Al Faroby, M.H.; Setiawan, Y. Comparative Evaluation of YOLO-Based Models for Indonesian License Plate Detection and Recognition with EASY OCR. Procedia Comput. Sci. 2025, 269, 943–952. [Google Scholar] [CrossRef]
  30. Wu, H.; Niu, M.; Wang, B.; Yan, K.; Li, Y.; Pang, H. Fixed/Mobile Collaborative Traffic Flow Detection Study Based on Wireless Charging of UAVs. Drones 2025, 9, 117. [Google Scholar] [CrossRef]
  31. Moraga, Á.; de Curtò, J.; de Zarzà, I.; Calafate, C.T. AI-Driven UAV and IoT Traffic Optimization: Large Language Models for Congestion and Emission Reduction in Smart Cities. Drones 2025, 9, 248. [Google Scholar] [CrossRef]
  32. Naranjo, M.; Fuentes, D.; Muelas, E.; Díez, E.; Ciruelo, L.; Alonso, C.; Abenza, E.; Gómez-Espinosa, R.; Luengo, I. Object Detection-Based System for Traffic Signs on Drone-Captured Images. Drones 2023, 7, 112. [Google Scholar] [CrossRef]
  33. Bemposta Rosende, S.; Ghisler, S.; Fernández-Andrés, J.; Sánchez-Soriano, J. Implementation of an Edge-Computing Vision System on Reduced-Board Computers Embedded in UAVs for Intelligent Traffic Management. Drones 2023, 7, 682. [Google Scholar] [CrossRef]
  34. Naoto, T.; Zacharie, M. Drone Guidance System Based Simultaneous Localization and Mapping for Free Parking Space Localization. J. Inf. Commun. Eng. 2021, 7, 501–504. Available online: https://www.ascspublications.org/product-category/jice/jice-digital/december-31-2021/ (accessed on 22 June 2025).
  35. Argirusis, N.; Achilleos, A.; Alizadeh, N.; Argirusis, C.; Sourkouni, G. IR Sensors, Related Materials, and Applications. Sensors 2025, 25, 673. [Google Scholar] [CrossRef]
  36. Lenz, J.; Edelstein, A. Magnetic Sensors and Their Applications. Sens. J. IEEE 2006, 6, 631–649. [Google Scholar] [CrossRef]
  37. Hikvision Global English Site. Hikvision. Available online: http://www.hikvision.com/my/ (accessed on 22 June 2025).
  38. Tabrizi, S.S.; Cavus, N. A Hybrid KNN-SVM Model for Iranian License Plate Recognition. Procedia Comput. Sci. 2016, 102, 588–594. [Google Scholar] [CrossRef]
  39. Quiros, A.R.F.; Bedruz, R.A.; Uy, A.C.; Abad, A.; Bandala, A.; Dadios, E.P.; Fernando, A. A kNN-Based Approach for the Machine Vision of Character Recognition of License Plate Numbers. In TENCON 2017—2017 IEEE Region 10 Conference; IEEE: Piscataway, NJ, USA, 2017; pp. 1081–1086. [Google Scholar] [CrossRef]
Figure 1. System Flowchart and Visualization of Two Operational Scenarios.
Urbansci 10 00212 g001
Figure 2. Valid Disabled Parking.
Urbansci 10 00212 g002
Figure 3. Pilot Experiment Schematic for Smart UAV-Based Accessibility Parking Monitoring.
Urbansci 10 00212 g003
Figure 4. Automatic License Plate Recognition Process. (a) Original image; (b) grayscale conversion; (c) contour extraction; (d) plate segmentation; (e) kNN classification.
Urbansci 10 00212 g004
Figure 5. Interactive Dashboard System Interface Overview.
Urbansci 10 00212 g005
Figure 6. Comprehensive Energy Efficiency Analysis: (a) Total energy consumption comparison across all algorithms; (b) Sleep drone percentage analysis; (c) Energy efficiency ratio (Coverage/Energy); (d) Coverage vs. Energy trade-off scatter plot showing algorithm positioning.
Urbansci 10 00212 g006
Figure 7. Algorithm Convergence Analysis and Early Convergence Rate Comparison-(Left) Convergence curves showing fitness evolution over iterations for all 14 algorithms, (Right) Early convergence rate comparison demonstrating staged algorithms’ superior convergence speed.
Urbansci 10 00212 g007
Figure 8. Coverage vs. Efficiency Trade-off Analysis-Algorithm Performance Positioning. The horizontal and vertical gray dotted lines represent the mean coverage efficiency and mean drone count across all algorithms, serving as performance baselines to categorize the results into four performance quadrants.
Urbansci 10 00212 g008
Figure 9. Summary-Coverage Performance Comparison Across All Test Cases.
Urbansci 10 00212 g009
Figure 10. Test Case-Dense Coverage Algorithm Performance Analysis.
Urbansci 10 00212 g010
Figure 11. Test Case-Wide Area Algorithm Performance Analysis.
Urbansci 10 00212 g011
Figure 12. Test Case-Energy Constrained Algorithm Performance Analysis.
Urbansci 10 00212 g012
Figure 13. Test Case-High Precision Algorithm Performance Analysis.
Urbansci 10 00212 g013
Figure 14. Test Case-Mixed Terrain Algorithm Performance Analysis.
Urbansci 10 00212 g014
Figure 15. Test Case-Emergency Response Algorithm Performance Analysis.
Urbansci 10 00212 g015
Table 1. Comprehensive Overview of Parking Detection Techniques.
Ref.AimMethodDatasetProsCons
[9]Tracking time violationsYOLOv8,
DeepSORT/OC-SORT, Ubuntu Linux
KMITL CCTV
footage
Adaptable, precise solution for time
infractions
No multi-camera synchronization
[16]Determine the quantity of vehicles and available slotsYOLOv8 algorithm, Google Colab experiments5000 images from UTA’45 Jakarta parkingYOLOv8s
outperforms YOLOv5s in performance
Limited environmental scenarios
[17]Vehicle parking slot detectionYOLOv8 with anchor
boxes for real-time classification
Custom dataset98.7% accuracy,
remarkable efficiency
Scalability
concerns for large areas
[18]Parking Lot Occupancy DetectionImproved MobileNetV3 modelCNRPark-EXT: 157,549, PKLot: 695,89998.01% accuracy,
real-time potential
Weather condition limitations
[19]Visual Parking Occupancy DetectionMulti-branch ConvNeXt (MBONN)ETSIT, PUCPR, UFPR04, UFPR0599.1% accuracy, outperforms existingHigh computational
overhead
[20]Detection of parking spaces using ResNet50Pre-trained deep CNNPKLot: 12,417
Brazil, Local: 175 Iraq
99.67% PKLot
99.12% local accuracy
Position bias and training data issues
[21]Computer Vision-
Based Parking Recognition
Hash algorithm, LBP
operator, Python 3.5/OpenCV 3.4.2
6000 self-collected images97.2% accuracy, lighting robustNo vehicle type considerations
[22]Parking space recognition based on featuresCameras, Hough transform, template matching120 QR codes95.45% accuracy,
93.33% recall
No communication features
[23]Parking Space Occupancy ClassificationR-CNN, Faster R-CNN-CN FPNACPDS: 29,311,236 unique slots98% accuracy, expandable datasetLimited viewpoint diversity
[24]Parking Occupancy Detection through IP CamerasDeep CNNs (mAlexNet, LeNet)CNRPark+Ext datasets93.15% accuracy, real-time processingCamera installation requirements
[25]Effective Parking Slot Identification (PSDet)Circular descriptor regressionPSDD: 14,628 images95.67% accuracy, 98.21% recallSurface variation limitations
Table 2. Summary Analysis of Disability Parking Detection Methods.
Ref.AimMethodDatasetProsCons
[1]Recognize disability vehicles, access badges, and license platesFaster RCNN, YOLOv7, YOLOv5s, YOLOv4Korean vehicle images from official websites92.16% mAP, international adaptability.No accessible parking space context
[2]RFID-based smart parking for the disabledRFID readers, infrared sensors, Arduino, MQTTField deployment testingEnvironmental robustness,
accurate detection
Needs disability authorization validation
[3]Disabled parking using an RFID SensorArduino Uno, RFID, buzzer modulesTesting environmentThe system worked as intendedNeeds an additional sensor
enhancements
[4]Disabled Parking System (DiParkSys)GSM module, Arduino Uno, coordinate alertsPractical implementationManual checking eliminatedSMS dependency issues
[5]Disabled Smart
Parking with Database
RFID, ultrasonic sensors, LED, Raspberry Pi3Cloud integration testingEconomical, improved precisionNeeds OCR integration
Table 3. Drone-Based Detection Methods for Traffic and Parking Surveillance.
Ref.AimMethodDatasetProsCons
[30]Traffic Flow Detection using Fixed Camera and UAVYOLOv8n, ByteTrack, wireless charging system12 locations, Xi’an, China, DJI Mavic 30.95–0.99 accuracy, high detection performancePower limitations during extended operations
[31]AI-Powered Traffic Optimization for UAVs and IoTLLMs, IoT sensors, UAVs, SUMO simulatorMadrid, San Diego simulationsScalable, adaptive, reduced CO2 emissionsNeeds real-world validation
[14]UAV-based Pedestrian and Vehicle DetectionPVswin-YOLOv8s, Swin Transformer blocksVisDrone2019 datasetSuperior performance, 4.8%
mAP increase
Small object accuracy issues
[32]Geo-referencing and detection of traffic signsFaster R-CNN, UAV RGB imagesGerman traffic signs (GTSDB): 900 imagesFresh dataset, variety of traffic signsLimited labeled image quantity
[33]UAVs with Reduced-Board ComputersEfficientDetLite, YOLO 5/8, DETRUEM SIC datasetsBalanced speed/accuracy
trade-off
Hardware computational
constraints
[13]Drone-based Parking Enforcement with LPRLPR program, DJI SDK, iOS applicationBinghamton University TAPSFoundation for extensive implementationCode debugging challenges
[34]Drone Mapping for Free Parking LocalizationSLAM (ORB-SLAM, LSD-SLAM)AR.drone2.0 dataSelf-positioning, route guidance capabilityMap visualization issues
Table 4. IoT System Components and Technical Specifications.
ComponentTypeSpecificationsPurposePerformance Metrics
Drone PlatformDJI Matric 100Flight height: 10 m, 23 min flight time, GPS navigationAerial surveillance and mobility95%+ recognition accuracy
Camera SystemDS-2CD4A26FWD-IZS/P2 MP, 120 dB WDR, Auto-iris, PoE, EIS, 3D DNRLicense plate recognition and video surveillance4-lane simultaneous recognition
Ground SensorsInfrared + MagneticBattery-powered, wireless range 50 m, IP67 ratedVehicle presence detection99.2% detection accuracy
Communication ModuleWi-Fi 802.11nReal-time notifications, 100 m rangeData transmission and alerts<100 ms latency
Processing UnitPython-based
Cloud
ML pipeline, database integration, API servicesData analysis and decision making50 ms processing time
Display SystemLCD TC1602BTwo buzzers, CRE audio circuitUser notification interfaceVisual and audio alerts
Database SystemCloud-based MySQLAuthorized vehicle registry, violation logsData storage and retrieval99.9% uptime reliability
Table 5. Fitness Function Weight Configurations for Different Optimization Phases.
ConfigurationCoverage
Weight (w1)
Energy Weight
(w2)
Overlap
Weight (w3)
Application Phase
Standard Optimization0.650.1750.175Traditional single-phase approach
Phase 1—Energy Focus0.40.40.2Energy efficiency optimization
Phase 2—Coverage Focus0.70.150.15Coverage maximization optimization
Balanced Configuration0.60.20.2Baseline comparison
Table 6. Genetic Algorithm Parameters and Configuration.
ParameterValueDescriptionDynamic Adjustment
Swarm Size50Number of particles in the swarmFixed population
Maximum Iterations300Convergence limitEarly termination possible
Inertia Weight (w)0.9 → 0.4Momentum influenceLinear decay
Cognitive Coefficient (c1)1.5Personal best influenceAdaptive based on performance
Social Coefficient (c2)1.5Global best influenceBalanced exploration/exploitation
Velocity Clamp[−5, 5]Movement boundsPrevents excessive displacement
Activation Threshold0.5Binary decision boundaryValues > 0.5 activate drone
Table 7. PSO Parameters and Dynamic Configuration.
ParameterValueDescriptionAdaptation Strategy
Population Size50Number of candidate solutions per generationFixed for stability
Maximum Generations500Total iterations for evolutionEarly stopping if converged
Crossover Rate0.8Probability of genetic recombinationDynamic based on diversity
Mutation Rate0.1 → 0.01Gene modification probabilityAdaptive decay schedule
Elite Fraction0.2Top performers preserved20% of the population
Selection StrategyTournament (k = 3)Parent selection methodBest of 3 candidates
Crossover MethodSingle-pointChild creation strategyRandom crossover point
Chromosome Representation30 × 3 matrix(x, y, active) for each droneBinary + real encoding
Table 8. Simulated Annealing Parameters.
ParameterValueDescription
Initial Temperature100Starting exploration level
Cooling Rate0.95Temperature decay factor
Minimum Temperature0.1Termination threshold
Iterations per Temperature30Local search steps
Neighborhood Operators3 typesPosition, activation, swap
Restart Criterion50 iterationsStagnation detection
Table 9. Experimental Test Scenarios and Parameters.
ScenarioArea SizeDrone CountSensing
Radius
Complexity LevelTarget
Coverage
Expected Challenges
Small Scale25 × 2558Low90%Basic validation
Medium-A50 × 501012Medium92%Scalability testing
Medium-B75 × 751515Medium94%Resource optimization
Large-A100 × 1002018High95%Energy management
Large-B100 × 1002520High96%Overlap minimization
Extra-Large125 × 1253022Very High97%Maximum complexity
Table 10. Energy Consumption Analysis-Complete Results Across All Test Scenarios.
AlgorithmActive
Drones
Sleep
Drones
Energy
(kWh)
Efficiency
(η)
Reduction
(%)
Std
Dev
p-
Value
PSO18.2 ± 2.16.8 ± 2.1125.4 ± 8.30.642 ± 0.045baseline8.3-
PSO_Staged11.3 ± 1.813.7 ± 1.877.8 ± 6.21.035 ± 0.06738.0%6.2<0.001
GA17.9 ± 2.37.1 ± 2.3123.1 ± 9.10.651 ± 0.042baseline9.1-
GA_Staged10.6 ± 1.614.4 ± 1.672.5 ± 5.81.112 ± 0.07341.1%5.8<0.001
SA18.8 ± 2.46.2 ± 2.4129.3 ± 9.80.621 ± 0.039baseline9.8-
SA_Staged12.2 ± 1.912.8 ± 1.983.9 ± 6.70.959 ± 0.06135.1%6.7<0.001
ACO18.1 ± 2.26.9 ± 2.2124.7 ± 8.70.644 ± 0.043baseline8.7-
ACO_Staged10.4 ± 1.714.6 ± 1.771.8 ± 5.91.121 ± 0.07542.4%5.9<0.001
DE18.5 ± 2.56.5 ± 2.5127.2 ± 9.30.632 ± 0.041baseline9.3-
DE_Staged11.1 ± 1.813.9 ± 1.876.4 ± 6.31.053 ± 0.06939.9%6.3<0.001
ABC18.3 ± 2.36.7 ± 2.3126.1 ± 8.90.638 ± 0.044baseline8.9-
ABC_Staged10.1 ± 1.614.9 ± 1.669.7 ± 5.71.154 ± 0.07744.7%5.7<0.001
Greedy19.2 ± 2.65.8 ± 2.6132.1 ± 10.20.608 ± 0.037baseline10.2-
Greedy_Staged13.1 ± 2.011.9 ± 2.089.7 ± 7.10.897 ± 0.05832.1%7.1<0.001
Table 11. Sleep Pattern Analysis and Efficiency Metrics.
AlgorithmAvg
Sleep %
Sleep
Efficiency
Transition
Count
Pattern
Stability
Energy
Savings
Optimization
Quality
PSO_Staged54.8 ± 3.20.923 ± 0.04512.3 ± 2.10.87 ± 0.0538.0%High
GA_Staged57.6 ± 2.90.941 ± 0.03810.8 ± 1.90.91 ± 0.0441.1%Very High
SA_Staged51.2 ± 3.80.887 ± 0.05215.7 ± 2.80.82 ± 0.0635.1%Good
ACO_Staged58.4 ± 2.70.956 ± 0.0359.4 ± 1.70.94 ± 0.0342.4%Excellent
DE_Staged55.6 ± 3.10.928 ± 0.04111.9 ± 2.00.88 ± 0.0539.9%High
ABC_Staged59.6 ± 2.50.967 ± 0.0328.7 ± 1.50.96 ± 0.0244.7%Outstanding
Greedy_Staged47.6 ± 3.90.834 ± 0.05818.3 ± 3.20.79 ± 0.0732.1%Moderate
Note: Optimization Quality classifications are systematically derived from Energy Savings thresholds: Outstanding (>44%), Excellent/Very High (40–44%), High/Good (35–40%), and Moderate (<35%).
Table 12. Algorithm Performance Summary with Statistical Validation.
AlgorithmCoverage
(%)
Execution
Time (s)
Convergence
Iterations
Quality
Score
Effect
Size
95% CI
PSO87.3 ± 4.245.7 ± 6.8247 ± 387.2--
PSO_Staged95.2 ± 2.128.3 ± 4.1156 ± 229.12.31[6.8%,9.2%]
GA86.8 ± 4.852.1 ± 7.9289 ± 457.0--
GA_Staged94.7 ± 2.331.2 ± 4.6172 ± 288.92.18[6.1%, 9.7%]
SA84.2 ± 5.138.9 ± 5.7198 ± 316.8--
SA_Staged92.8 ± 2.724.6 ± 3.8127 ± 198.72.04[6.9%, 10.3%]
ACO85.6 ± 4.661.3 ± 8.9342 ± 526.9--
ACO_Staged93.9 ± 2.435.7 ± 5.2189 ± 298.82.27[6.5%, 10.1%]
DE86.1 ± 4.448.2 ± 7.1267 ± 417.1--
DE_Staged94.3 ± 2.229.8 ± 4.3161 ± 258.92.33[6.7%, 9.8%]
ABC85.9 ± 4.755.8 ± 8.2318 ± 486.9--
ABC_Staged95.1 ± 2.032.4 ± 4.7175 ± 279.22.41[7.1%, 11.2%]
Greedy82.4 ± 5.312.7 ± 2.187 ± 146.5--
Greedy_Staged89.6 ± 3.18.9 ± 1.862 ± 118.31.78[4.9%, 9.5%]
Table 13. Algorithm Performance Coverage Efficiency by Test Scenario.
Optimization AlgorithmsDense CoverageWide AreaEnergy ConstrainedHigh PrecisionMixed TerrainEmergency Response
PSO89.5%87.2%85.8%83.1%80.7%88.4%
GA87.8%85.9%83.4%81.2%78.9%86.1%
SA85.1%83.7%81.9%79.4%77.2%84.8%
ACO86.4%84.5%82.7%80.3%78.8%85.5%
DE84.7%82.8%80.5%78.1%76.4%83.2%
ABC83.9%82.1%79.8%77.6%75.8%82.9%
Greedy75.2%73.8%71.5%69.7%68.1%74.4%
PSO_Staged91.2%89.4%87.9%85.7%83.1%90.8%
GA_Staged89.9%88.1%85.6%83.4%81.2%88.7%
SA_Staged87.3%85.9%84.1%81.8%79.6%86.4%
ACO_Staged88.6%86.7%84.9%82.5%80.9%87.3%
DE_Staged86.9%85.0%82.7%80.3%78.7%85.6%
ABC_Staged86.1%84.3%82.0%79.8%78.0%84.8%
Greedy_Staged81.4%79.8%77.5%75.2%73.8%80.9%
Table 14. Performance Scaling Analysis Across Test Scenarios.
Scenario ScaleCoverage
Achievement
Energy
Reduction
Execution
Time Scaling
Quality
Degradation
Drone
Utilization
Small (25 × 25, 5 drones)97.8% ± 1.2%45.2% ± 3.1%8.3 ± 1.2 sNone3.2 active/1.8 sleep
Medium-A (50 × 50, 10 drones)96.4% ± 1.8%42.7% ± 3.7%18.7 ± 2.8 sMinimal6.1 active/3.9 sleep
Medium-B (75 × 75, 15 drones)95.1% ± 2.3%39.8% ± 4.2%31.5 ± 4.6 s<5%9.3 active/5.7 sleep
Large-A (100 × 100, 20 drones)94.3% ± 2.7%37.4% ± 4.8%47.2 ± 6.9 s<8%12.8 active/7.2 sleep
Large-B (100 × 100, 25 drones)95.7% ± 2.1%38.9% ± 4.1%52.8 ± 7.3 s<6%15.1 active/9.9 sleep
Extra-Large (125 × 125, 30 drones)94.8% ± 2.9%36.2% ± 5.1%68.4 ± 9.2 s<10%18.5 active/11.5 sleep
Table 15. Statistical Analysis Summary with Confidence Intervals.
Metrict-Statisticp-ValueEffect Size
(Cohen’s d)
Confidence Interval
(95%)
Practical
Significance
Coverage Improvement12.47<0.0012.31 (large)[6.8%, 9.2%]High
Energy Reduction15.23<0.0012.78 (large)[34.2%, 42.8%]Very High
Convergence Speed9.84<0.0011.89 (large)[42%, 58%]High
Quality Enhancement8.92<0.0011.67 (large)[18%, 28%]Moderate-High
Note: Practical Significance labels correspond to standard Cohen’s d effect size thresholds: Very High (d > 2.5), High (1.8 ≤ d ≤ 2.5), and Moderate-High (d < 1.8).
Disclaimer/Publisher’s Note: The statements, opinions and data contained in all publications are solely those of the individual author(s) and contributor(s) and not of MDPI and/or the editor(s). MDPI and/or the editor(s) disclaim responsibility for any injury to people or property resulting from any ideas, methods, instructions or products referred to in the content.