Article

Land Cover Transformations and Thermal Responses in Representative North African Oases from 2000 to 2023

1
Department of Architecture, University Mohamed Khider of Biskra, Biskra 07000, Algeria
2
Department of Architecture, Dar Al-Hekma University, Jeddah 22246, Saudi Arabia
3
Department of Urban and Regional Planning, Universiti Teknologi Malaysia, Johor Bahru 81310, Johor, Malaysia
4
Department of Architectural Engineering, Faculty of Engineering, Aswan University, Aswan 81542, Egypt
*
Authors to whom correspondence should be addressed.
Urban Sci. 2025, 9(7), 282; https://doi.org/10.3390/urbansci9070282
Submission received: 11 June 2025 / Revised: 12 July 2025 / Accepted: 15 July 2025 / Published: 18 July 2025
(This article belongs to the Special Issue Geotechnology in Urban Landscape Studies)

Abstract

Oases in arid regions are critical ecosystems, providing essential ecological, agricultural, and socio-economic functions. However, urbanization and climate change increasingly threaten their sustainability. This study examines land cover (LULC) and land surface temperature (LST) dynamics in four representative North African oases: Tolga (Algeria), Nefta (Tunisia), Ghadames (Libya), and Siwa (Egypt) over the period 2000–2023, using Landsat satellite imagery. A three-step analysis was employed: calculation of NDVI (Normalized Difference Vegetation Index), NDBI (Normalized Difference Built-up Index), and LST, followed by supervised land cover classification and statistical tests to examine the relationships between the studied variables. The results reveal substantial reductions in bare soil (e.g., 48.10% in Siwa) and notable urban expansion (e.g., 136.01% in Siwa and 48.46% in Ghadames). Vegetation exhibited varied trends, with a slight decline in Tolga (0.26%) and a significant increase in Siwa (+27.17%). LST trends strongly correlated with land cover changes, demonstrating increased temperatures in urbanized areas and moderated temperatures in vegetated zones. Notably, this study highlights that traditional urban designs integrated with dense palm groves significantly mitigate thermal stress, achieving lower LST compared to modern urban expansions characterized by sparse, heat-absorbing surfaces. In contrast, areas dominated by fragmented vegetation or seasonal crops exhibited reduced cooling capacity, underscoring the critical role of vegetation type, spatial arrangement, and urban morphology in regulating oasis microclimates. Preserving palm groves, which are increasingly vulnerable to heat-driven pests, diseases and the introduction of exotic species grown for profit, together with a revival of the traditional compact urban fabric that provides shade and has been empirically confirmed by other oasis studies to moderate the microclimate more effectively than recent low-density extensions, will maintain the crucial synergy between buildings and vegetation, enhance the cooling capacity of these settlements, and safeguard their tangible and intangible cultural heritage.

1. Introduction

An oasis is a complex Saharan socio-ecological system in which water resources, mainly groundwater or flows extracted from ephemeral streams, date palm groves, and human settlements function as an integrated unit. Within this arid context, the oasis generates a distinctive microclimate that moderates regional climatic extremes and creates the conditions required for sustainable living [1,2,3]. This biophysical framework supports a resilient socio-economic system [2,3,4,5,6,7]. Despite their significance, oases face growing challenges due to the combined pressures of climate change and urbanization, which threaten their ecological balance and sustainability [1,2,8,9,10]. North Africa is predominantly characterized by arid and semi-arid climatic conditions, a trend that is intensifying due to ongoing desertification and climate change [11,12]. In this context, oases serve as critical interfaces between human and natural systems, where climatic, hydrological, and anthropogenic factors converge to shape land use, atmospheric conditions, and environmental characteristics. These ecosystems play a pivotal role in supporting environmental stability, preserving cultural heritage, and sustaining local livelihoods [8,13,14,15].
Over the past decades, urbanization has profoundly altered the structure and function of many oases, leading to significant changes in land use [8,9,10,16,17,18]. Built-up areas have expanded into regions traditionally covered by vegetation or bare soil, replacing natural cooling surfaces with heat-absorbing infrastructure, exacerbating the urban heat island (UHI) effect [17,19]. At the same time, climate change has intensified aridity, further straining vegetation and water resources [20,21,22,23]. These forces contribute to the increase in land surface temperature (LST), a key indicator of environmental health and human impact. The rise in LST not only worsens thermal stress and public health challenges but also disrupts agricultural productivity, threatens water resource availability in already limited regions, and increases energy consumption. This, in turn, leads to higher carbon emissions, creating a vicious cycle that further intensifies the situation [19,22,24,25,26,27].
Remote sensing has become an essential technology for studying large-scale environmental dynamics, particularly the impacts of urbanization and land use changes on environmental characteristics such as land surface temperature (LST) [28,29,30,31]. With the increasing availability of multi-temporal satellite data, researchers can analyze thermal and spatial trends over extended periods using images from satellite missions such as Landsat, MODIS, and Sentinel [32,33,34,35].
To quantify environmental and urban dynamics, several remote sensing indices have been developed to assess the interactions between land use and thermal dynamics. The Normalized Difference Vegetation Index (NDVI), which measures vegetation density and health, is commonly used to analyze changes in vegetated areas. The Normalized Difference Built-up Index (NDBI), on the other hand, identifies urban zones and their expansion, while the proportion of vegetation (Pv), derived from the NDVI, plays a central role in calculating thermal emissivity (ϵ), a crucial parameter for estimating surface temperature. Finally, LST, obtained from satellite thermal bands, provides a direct measurement of temperature variations, often linked to surface thermal properties and land use. These indices, combined with supervised classification techniques, enable a thorough analysis of land use changes and their impacts on urban and natural environments [36,37,38,39].
In recent years, numerous studies have been published analyzing the transformations of urban environments, considering not only morphological changes but also other essential characteristics such as the microclimate dynamics [40,41,42], the urban heat island effect [30,43,44,45], the vegetation health, and shifts in ecosystem services [46,47,48,49] offering a comprehensive understanding of the environmental and societal impacts of urban growth. However, this technology has been widely applied to study oases in regions like Asia (particularly in China and India) [21,22,23,24,30,37,39,50]. Despite a few notable studies conducted in countries such as Morocco, Iraq, Egypt, and Saudi Arabia [17,20,26,51,52,53], research on North African and Middle Eastern oases remains limited and fragmented. This gap highlights the need for further investigation and serves as a key motivation for the present study, which aims to provide a comprehensive comparative analysis of selected representative oases in the region.
This study focuses on four North African oases: (1) Tolga (Algeria), (2) Nefta (Tunisia), (3) Ghadames (Libya), and (4) Siwa (Egypt), to evaluate changes in land use and land surface temperature (LST) over 23 years (2000–2023). These oases were selected for their environmental, agricultural, and cultural significance, as well as their representativeness of broader trends in arid and semi-arid regions. More details about the key features of the selected oases and their relevance to this study are provided in Table 1. This study aims to answer key questions: How have land use patterns evolved in these oases? What are the implications of these changes on LST? And what do these trends reveal about the broader impacts of urbanization and climate change on oasis ecosystems?
By linking land use change dynamics to land surface temperature (LST) trends, this study aligns with the findings of numerous other research efforts conducted in oases across various regions of the world, including China, India, Saudi Arabia, and the United States [8,16,17,24,50,54,55,56]. These converging results underscore the environmental and climatic challenges faced by oases, emphasizing the universal importance of climate-resilient urban planning strategies, vegetation restoration, and sustainable land management practices. Such measures are essential for mitigating rising temperatures and ensuring the long-term viability of these critical ecosystems.

2. Study Area

This study focuses on four major and representative oases in North Africa (Figure 1): Tolga (Algeria), Nefta (Tunisia), Ghadames (Libya), and Siwa (Egypt). These oases were selected based on their geographic, climatic, and socio-economic characteristics, ensuring both diversity and representativeness for understanding land cover and land surface temperature (LST) dynamics in arid and semi-arid regions. Table 1 summarizes the criteria used for selecting these oases, while Figure 1 illustrates their geographic locations.
To facilitate a consistent and comparable analysis of land surface temperature (LST) dynamics and land use changes across diverse oases, circular study areas were defined for each site [51,57]. Each area was designed to encompass the urban core, surrounding vegetated zones, and adjacent bare soil, thereby capturing the key land cover types influencing thermal patterns. The diameter of each circle was adjusted to reflect the specific spatial configuration and environmental context of each oasis while also minimizing edge effects and avoiding the inclusion of nearby settlements. The selected diameters were 3.5 km for Tolga and Ghadames, 5 km for Nefta, and 7 km for Siwa. These differences account for variations in oasis morphology, urban sprawl, and land cover heterogeneity. This methodology ensures a standardized yet context-sensitive spatial framework, allowing for robust inter-site comparisons while preserving the unique ecological and thermal characteristics of each oasis [58].

3. Materials and Methods

3.1. Data Collection and Pre-Processing

This study utilized satellite imagery from Landsat 7 ETM+ (2000), Landsat 8 OLI/TIRS, and Landsat 9 OLI-2/TIRS-2 (2023) as the primary data sources [31,59]. The spatial resolution of the datasets varied by band: Reflective bands had a resolution of 30 m. In comparison, thermal bands had a resolution of 60 m for Landsat 7 and 100 m for Landsat 8/9, respectively. Thermal bands were later resampled to match the reflective bands (30 m) for consistency. Resampling is the process of adjusting the spatial resolution of a raster dataset (such as satellite imagery) to match the resolution or grid alignment of another dataset. This is especially important when combining data from multiple sources or bands that have different spatial resolutions. All images were acquired at the Level 1 Terrain Precision (L1TP) correction level, which includes both geometric and radiometric corrections, ensuring high data quality. Atmospheric corrections were also applied using ArcGIS Pro to the images to reduce atmospheric effects and ensure greater accuracy in the derived index calculations [60].
The images utilized in this study were chosen to represent the summer period, specifically the month of July, characterized by extreme summer climate conditions and minimal seasonal vegetation, which could otherwise influence NDVI calculations [53,54,55]. To ensure the accuracy of the analyses and reduce errors caused by cloud cover or atmospheric interference, only cloud-free scenes were included. Ten images meeting these criteria (details summarized in Table 2) were selected to enable reliable multi-temporal comparisons between the years 2000 and 2023.

3.2. Variable Calculations

The methodology employed in this study consisted of three main steps: NDVI and NDBI calculation, estimation of land surface temperature (LST), and land cover classification. Each step was carried out using ArcGIS Pro, which provided a robust and integrated platform for data processing, analysis, and visualization. This approach ensured reliable and accurate results for analyzing vegetation density, surface temperature dynamics, and land cover changes across the selected oases. Table 3 summarizes the key processes, formulas, and tools used in the analysis [37,53,61,62,63,64,65].

3.3. Land Cover Classification

Land cover classification was performed using a supervised classification approach using ArcGIS Pro [52,62,68]. The classification focused on three primary land cover types: urban, vegetation, and bare soil [51,69] (Table 4).
To evaluate the accuracy of the land cover classification, which was used to calculate the area and rate of change for the three classes between 2000 and 2023, 50 random points per class were validated using Google Earth imagery [62,70]. The Accuracy Assessment tool in ArcGIS Pro was employed to calculate the overall accuracy and Cohen’s kappa coefficient (Table 5) [52,71,72].

3.4. Statistical Analysis

Correlation and regression analyses were conducted using IBM SPSS Statistics, version 15.0, to explore the relationships between land surface temperature (LST), the Normalized Difference Vegetation Index (NDVI), and the Normalized Difference Built-up Index (NDBI) for each oasis and year. For the correlation analysis, Pearson correlation coefficients were calculated to determine the strength and direction of the relationships between LST, NDVI, and NDBI. In the multiple linear regression analysis, LST was designated as the dependent variable, while NDVI and NDBI were treated as independent variables. The regression model’s performance was assessed using the coefficient of determination (R2) to evaluate the model’s fit [73].

4. Results

4.1. Land Cover Classification Accuracy Assessment

The accuracy of the land cover classification was assessed using Overall Accuracy (OA) and Cohen’s Kappa Coefficient (Table 5). Overall Accuracy ranged from 91.00% to 95.00% in 2000 and 2023 (OA above 85.00%). Similarly, Cohen’s Kappa Coefficient values ranged from 0.85 to 0.93 in 2000 and 0.87 to 0.92 in 2023 (Kappa above 0.70), reflecting strong agreement between the classified maps and the reference data [51,74,75,76], with minor variations observed across the oases due to the complexity of land cover variation.

4.2. Temporal and Spatial Analysis of LST and Land Cover

4.2.1. Area Change Analysis

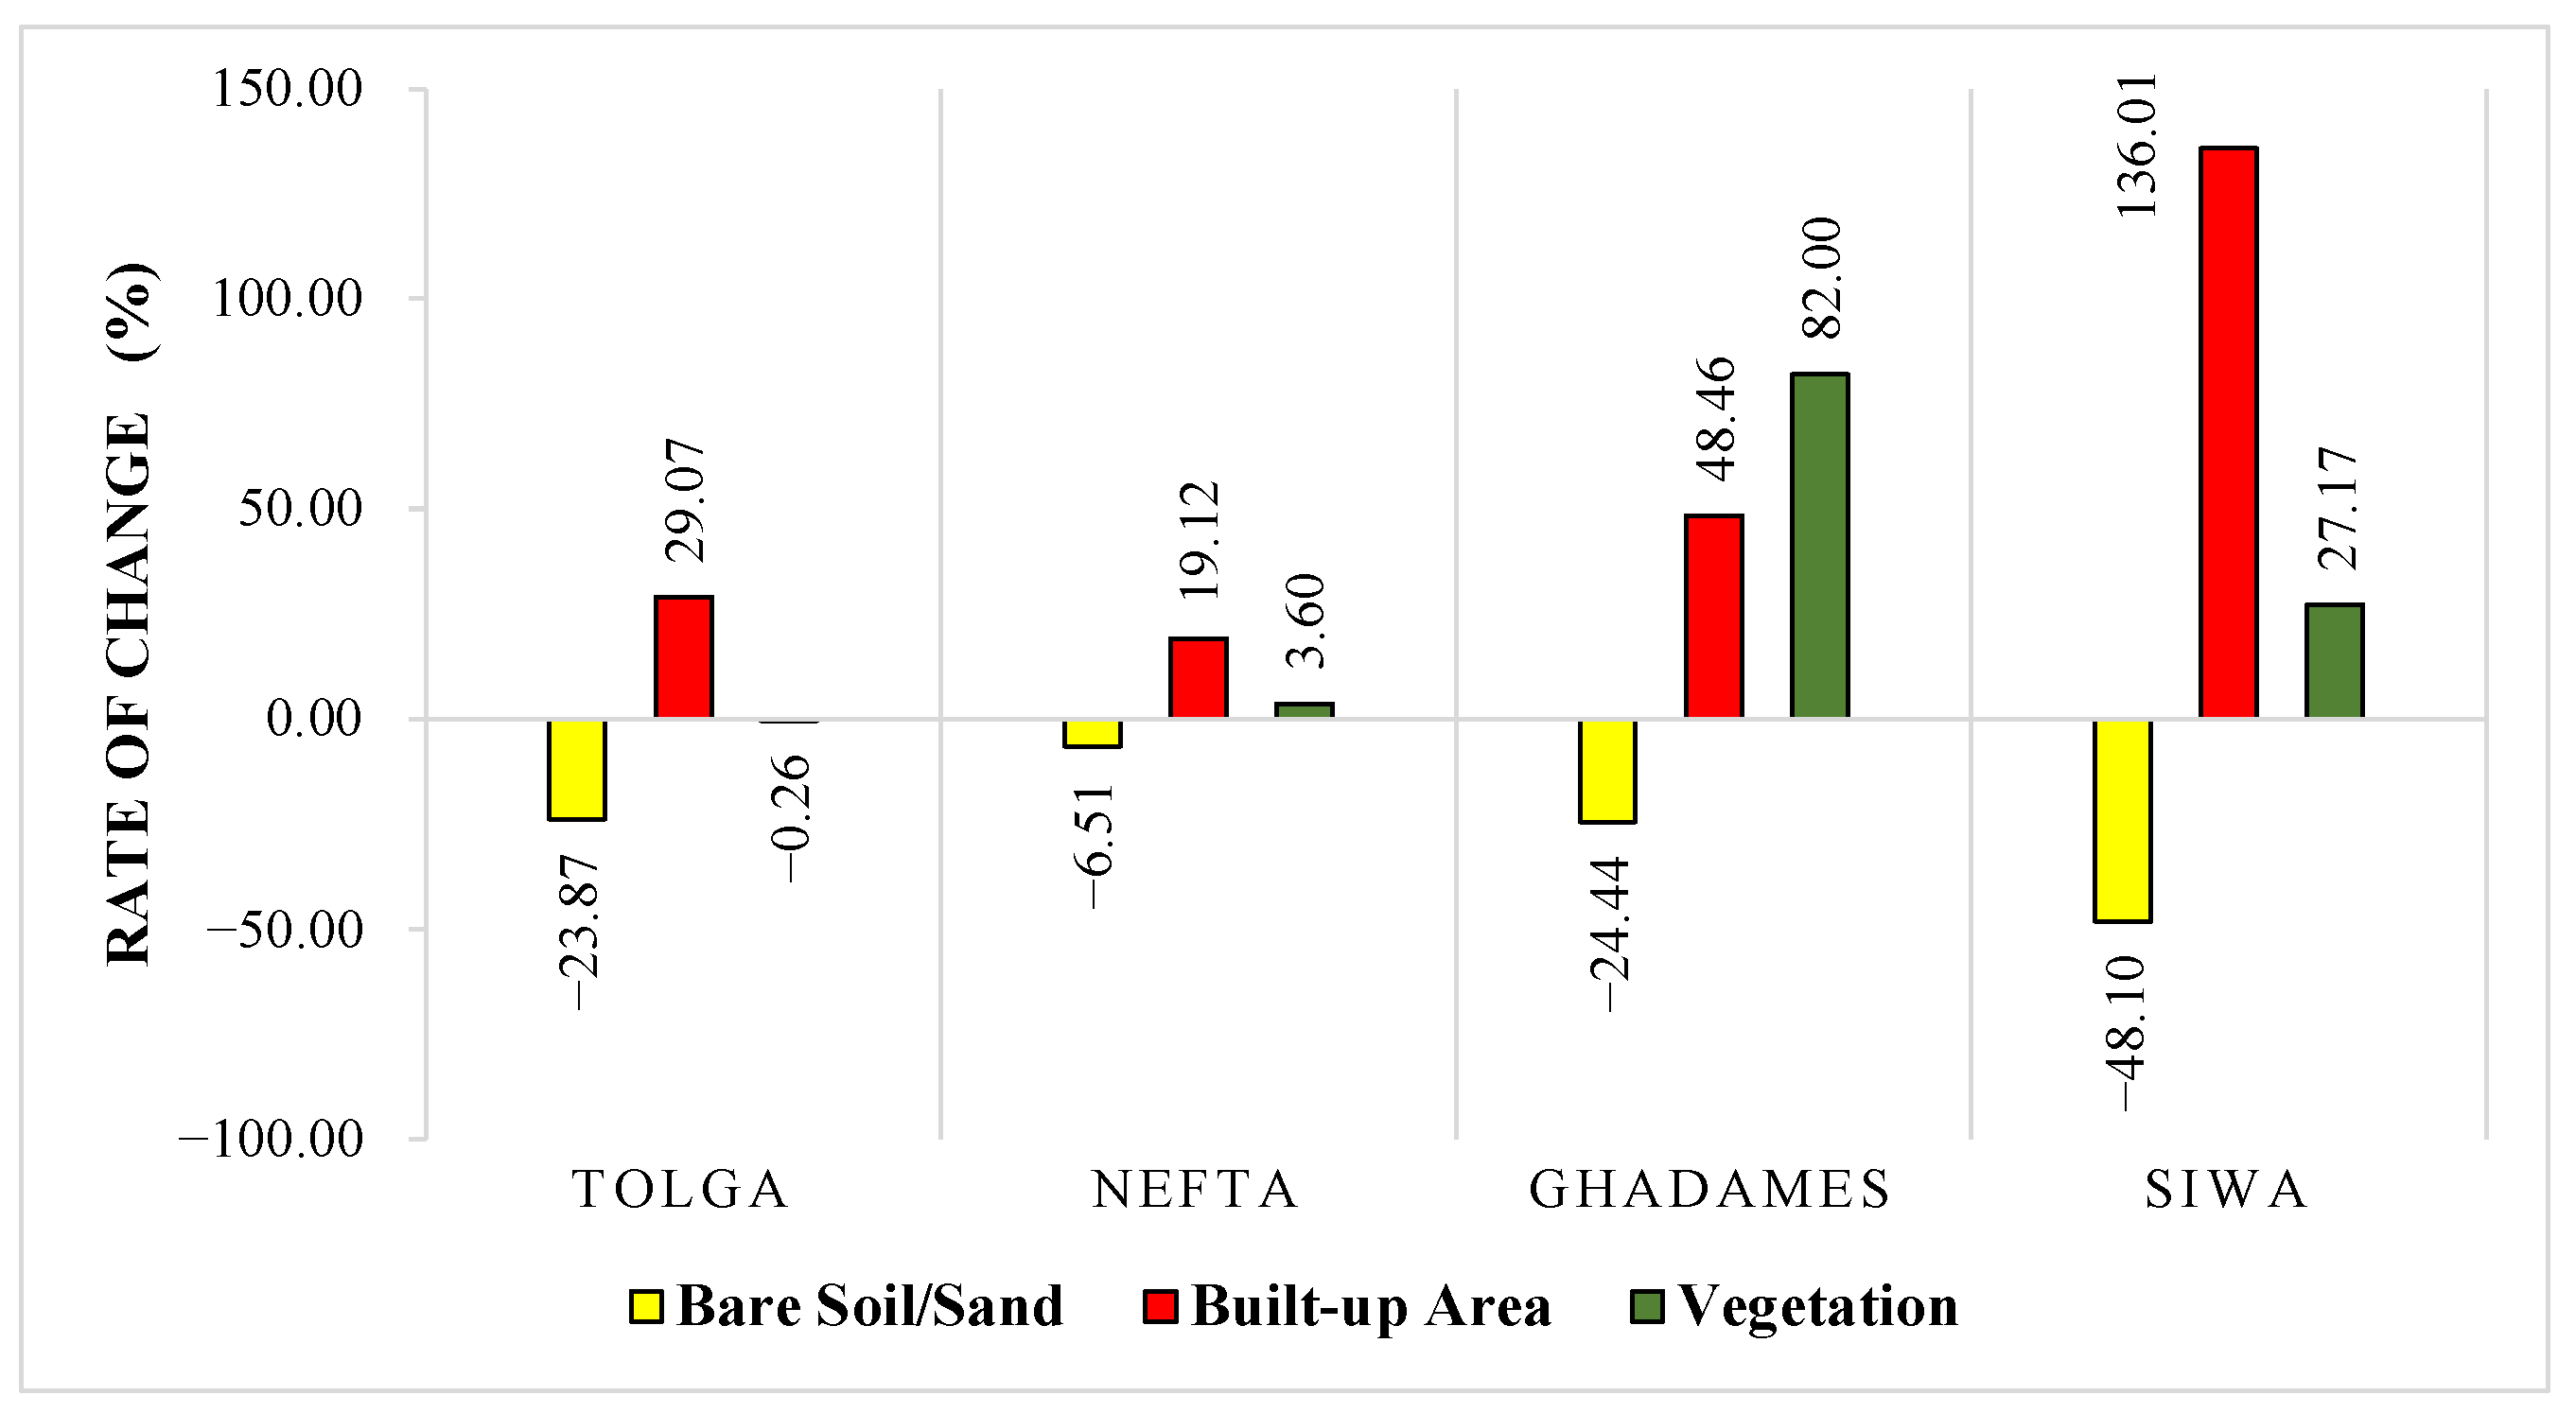
Figure 2 and Figure 3 illustrate the area changes and the rate of change observed in the three studied classes across the four oases between 2000 and 2023.
(a)
Transformation of bare soil areas
The results highlight a significant reduction in bare soil across all four oases, reflecting a consistent trend of land conversion to urban or vegetative uses. Siwa showed the most substantial decrease, with a loss of 48.10%, driven by extensive urban development and agricultural expansion in response to increasing economic and demographic pressures. Tolga and Ghadames also experienced considerable reductions of 23.87% and 24.44%, respectively. These changes reflect the conversion of barren land into more productive areas, particularly for urbanization and agriculture. In contrast, Nefta experienced a more modest reduction of 6.51%, indicating a slower rate of land transformation, likely due to relatively stable socio-economic conditions.
(b)
Transformation of built-up areas
Siwa recorded the most substantial expansion in built-up areas, with a 136.01% increase over the study period. This rapid growth corresponds with a demographic increase of over 60.60% between 2000 and 2015, which represents the period for which data is available for all oases [77], reflecting intense pressure on land for housing and infrastructure. Ghadames experienced a notable 48.46% increase in urban land cover, despite a more moderate population growth of 27.40% between 2000 and 2015 [77]. This expansion may be explained by the prevailing urbanization model, characterized by a low-density urban fabric that contrasts sharply with the compact, traditional settlement patterns.
Tolga, on the other hand, exhibited a 29.07% increase in built-up areas, which is relatively modest considering its higher population growth rate of 43.50% between 2000 and 2015 [77]. This contrast may reflect spatial constraints imposed by the dominance of highly productive agricultural land, particularly the economically valuable date palm groves, which have persisted over time and act as a barrier to urban sprawl. Alternatively, the slower urban expansion could indicate more deliberate and controlled urban planning, shaped by the local knowledge and practices of residents and the regulatory oversight of local authorities.
Nefta showed the most modest growth in urban areas, with a 19.12% increase, which is consistent with its relatively low population growth of 8.60% between 2000 and 2015 [77]. This pattern likely reflects a stable socio-economic context and limited external development pressures.
(c)
Transformation of vegetation areas
Vegetation changes varied across the oases, reflecting differences in land management practices and environmental conditions. Ghadames and Siwa exhibited the most significant gains in vegetative cover, with increases of 82.00% and 27.17%, respectively. These increases suggest an intensification of agricultural activity, potentially supported by the development of irrigation systems and the reclamation of previously unused land. Nefta experienced a slight increase of 3.60%, indicating stable agricultural practices. Conversely, Tolga recorded a modest decline of 0.26%, which may reflect the steady nature of its agricultural system. However, this slight reduction also highlights the encroachment of urban areas on palm groves, likely due to the scarcity of vacant land and the legal protection of agricultural zones under Algerian land use policy [78].

4.2.2. Land Surface Temperature (LST) Variations

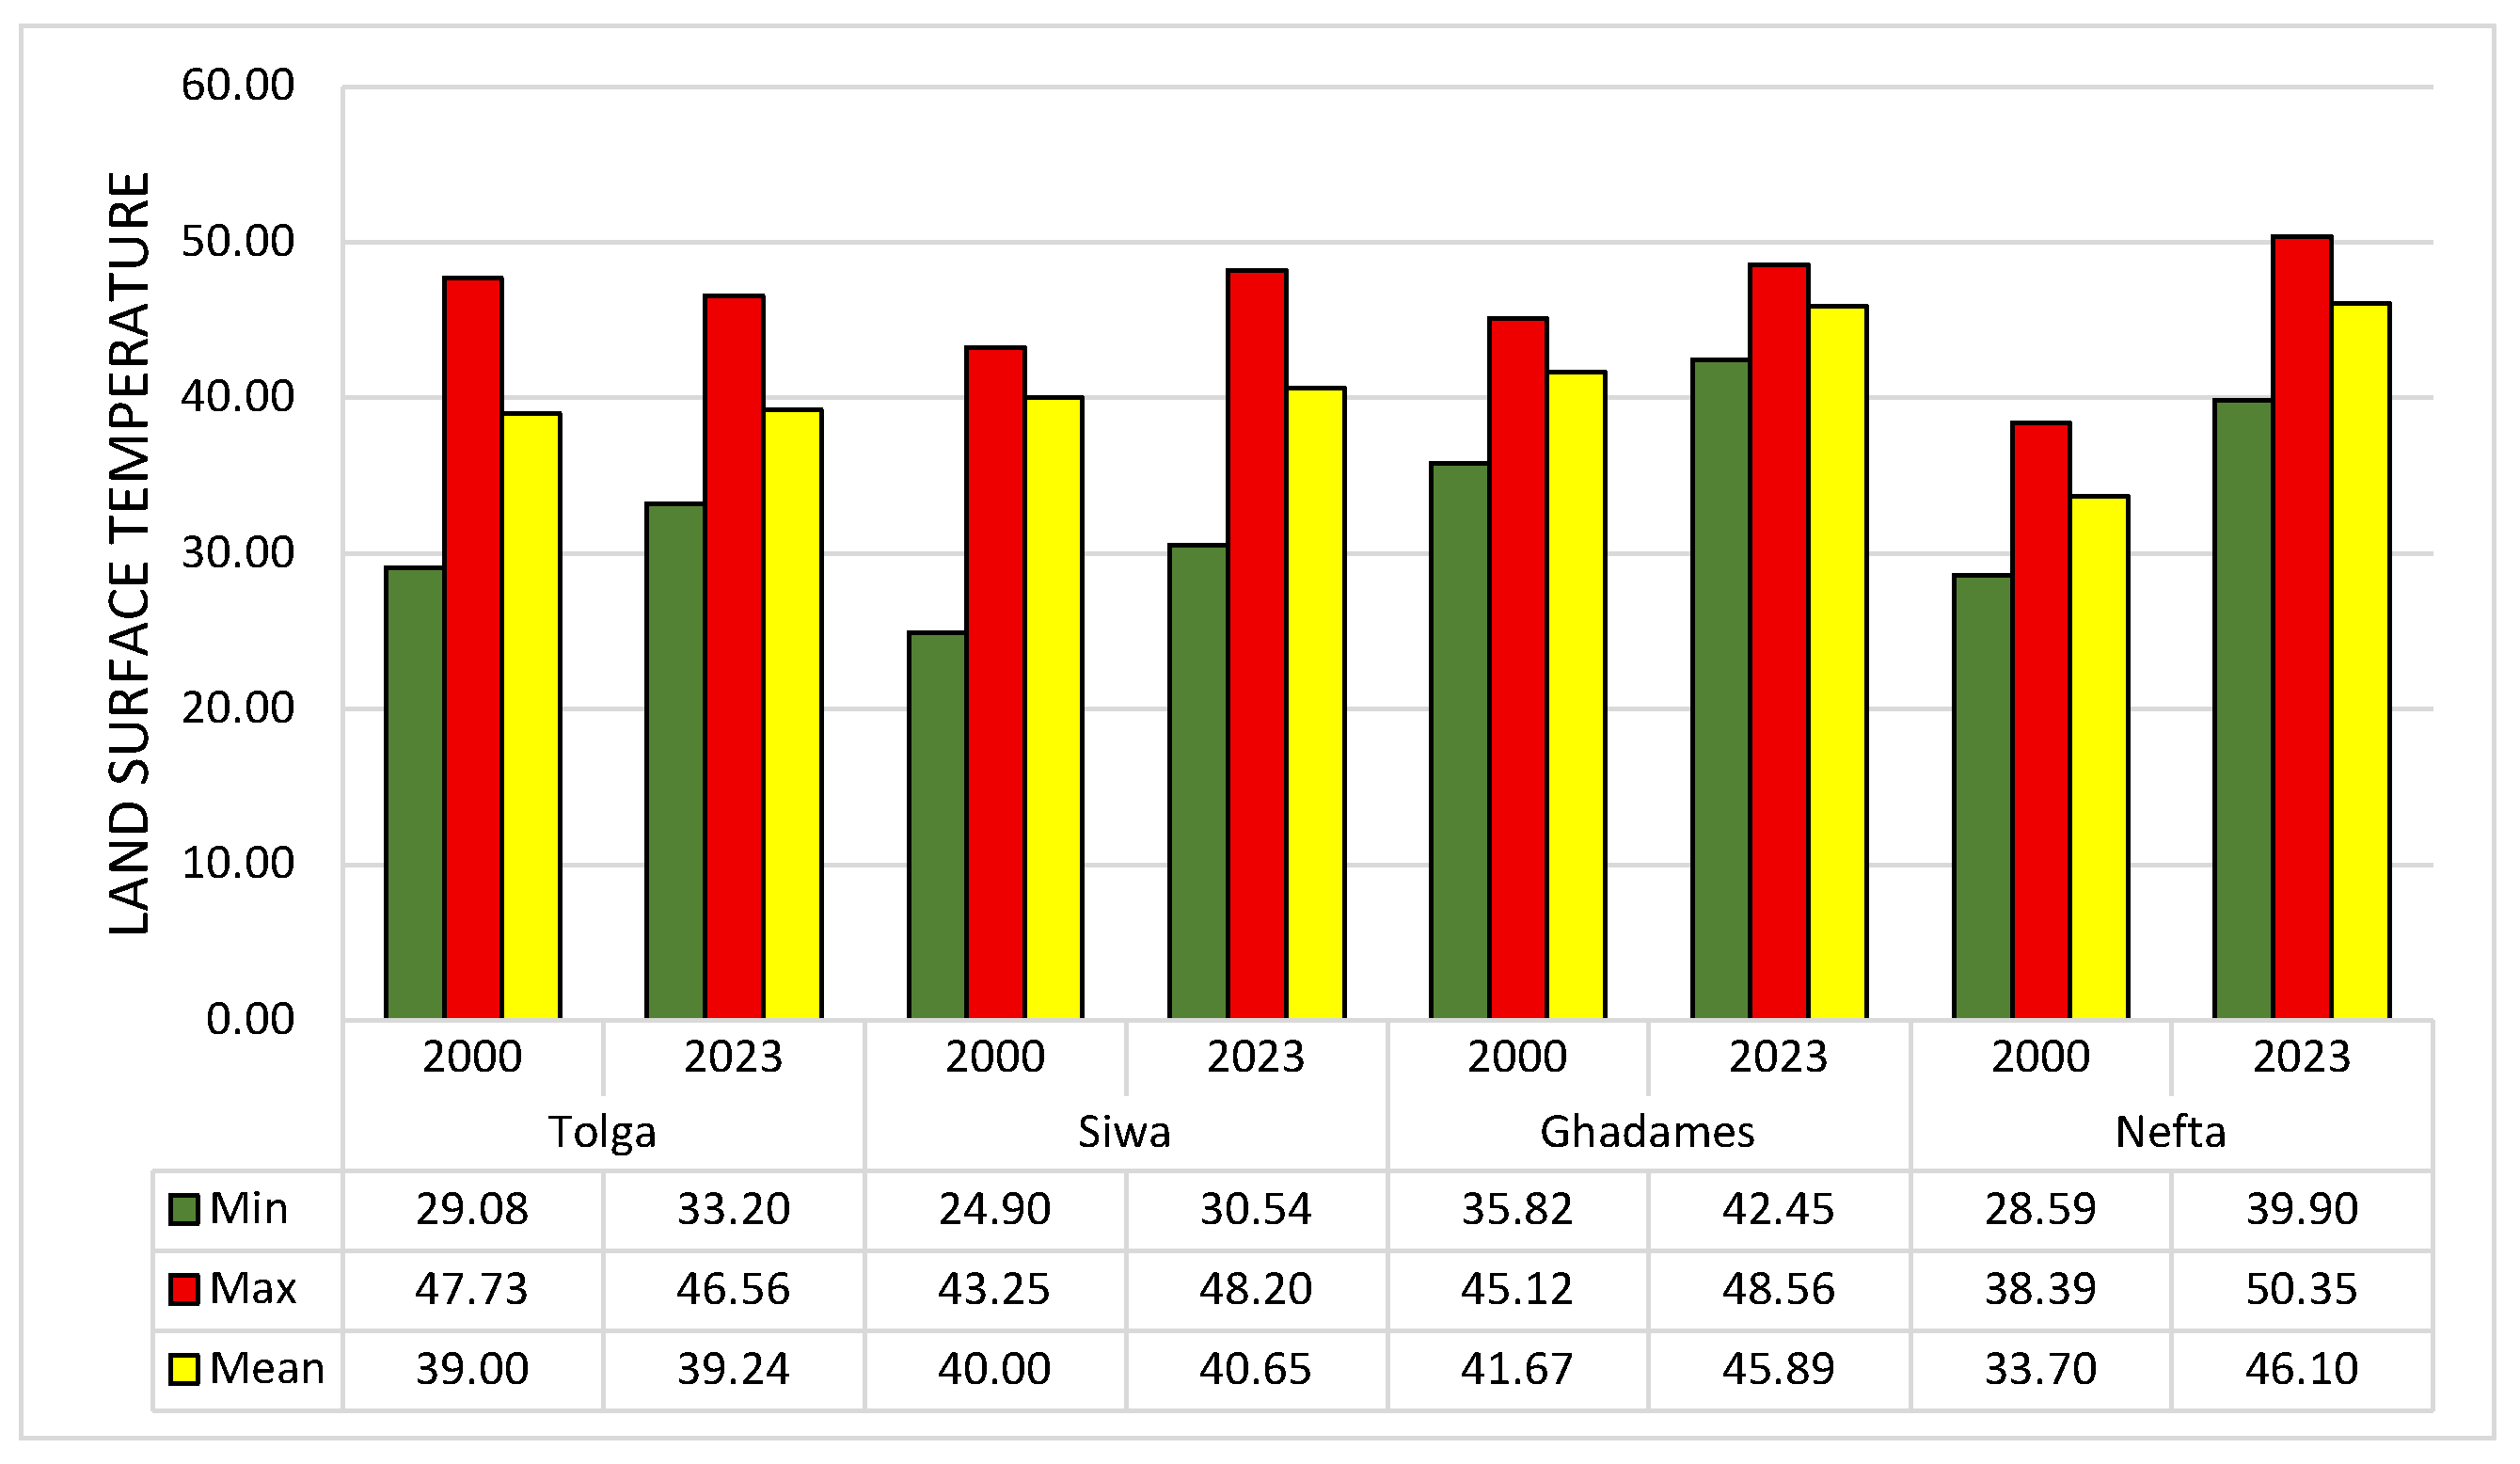
The analysis of land surface temperature (LST) variations between 2000 and 2023, based on the data presented in Figure 4, reveals significant changes across the studied oases, reflecting the impact of land use changes.
Minimum temperatures increased across all oases, highlighting a general warming trend. In Tolga, they rose from 29.00 °C in 2000 to 33.00 °C in 2023. Ghadames experienced a particularly pronounced increase, with minimum temperatures rising from 35.82 °C to 42.45 °C, reflecting the growing pressures on these vulnerable ecosystems. Nefta and Siwa also recorded significant increases, rising from 28.59 °C to 39.9 °C and from 24.90 °C to 30.54 °C, respectively.
Maximum temperatures exhibited distinct trends across the oases. In Tolga, they remained relatively stable, decreasing slightly from 47.00 °C in 2000 to 46.00 °C in 2023. Conversely, moderate increases were observed in Ghadames and Siwa, with maximum temperatures reaching 48.56 °C and 48.20 °C, respectively, in 2023. Nefta, however, showed the most significant rise, with maximum temperatures climbing from 38.39 °C to 50.35 °C, indicating accelerated warming in this region. Finally, average temperatures revealed varied dynamics. In Tolga and Siwa, they remained relatively stable, around 39.00 °C in Tolga and increasing modestly from 40.00 °C to 40.65 °C in Siwa, suggesting a certain degree of thermal resilience. In contrast, Ghadames showed a notable increase, from 41.67 °C to 45.89 °C. Nefta recorded the most pronounced change, with average temperatures rising sharply from 33.70 °C in 2000 to 46.10 °C in 2023.

4.3. Analysis of Land Cover and LST Relationship Through Maps (2000–2023)

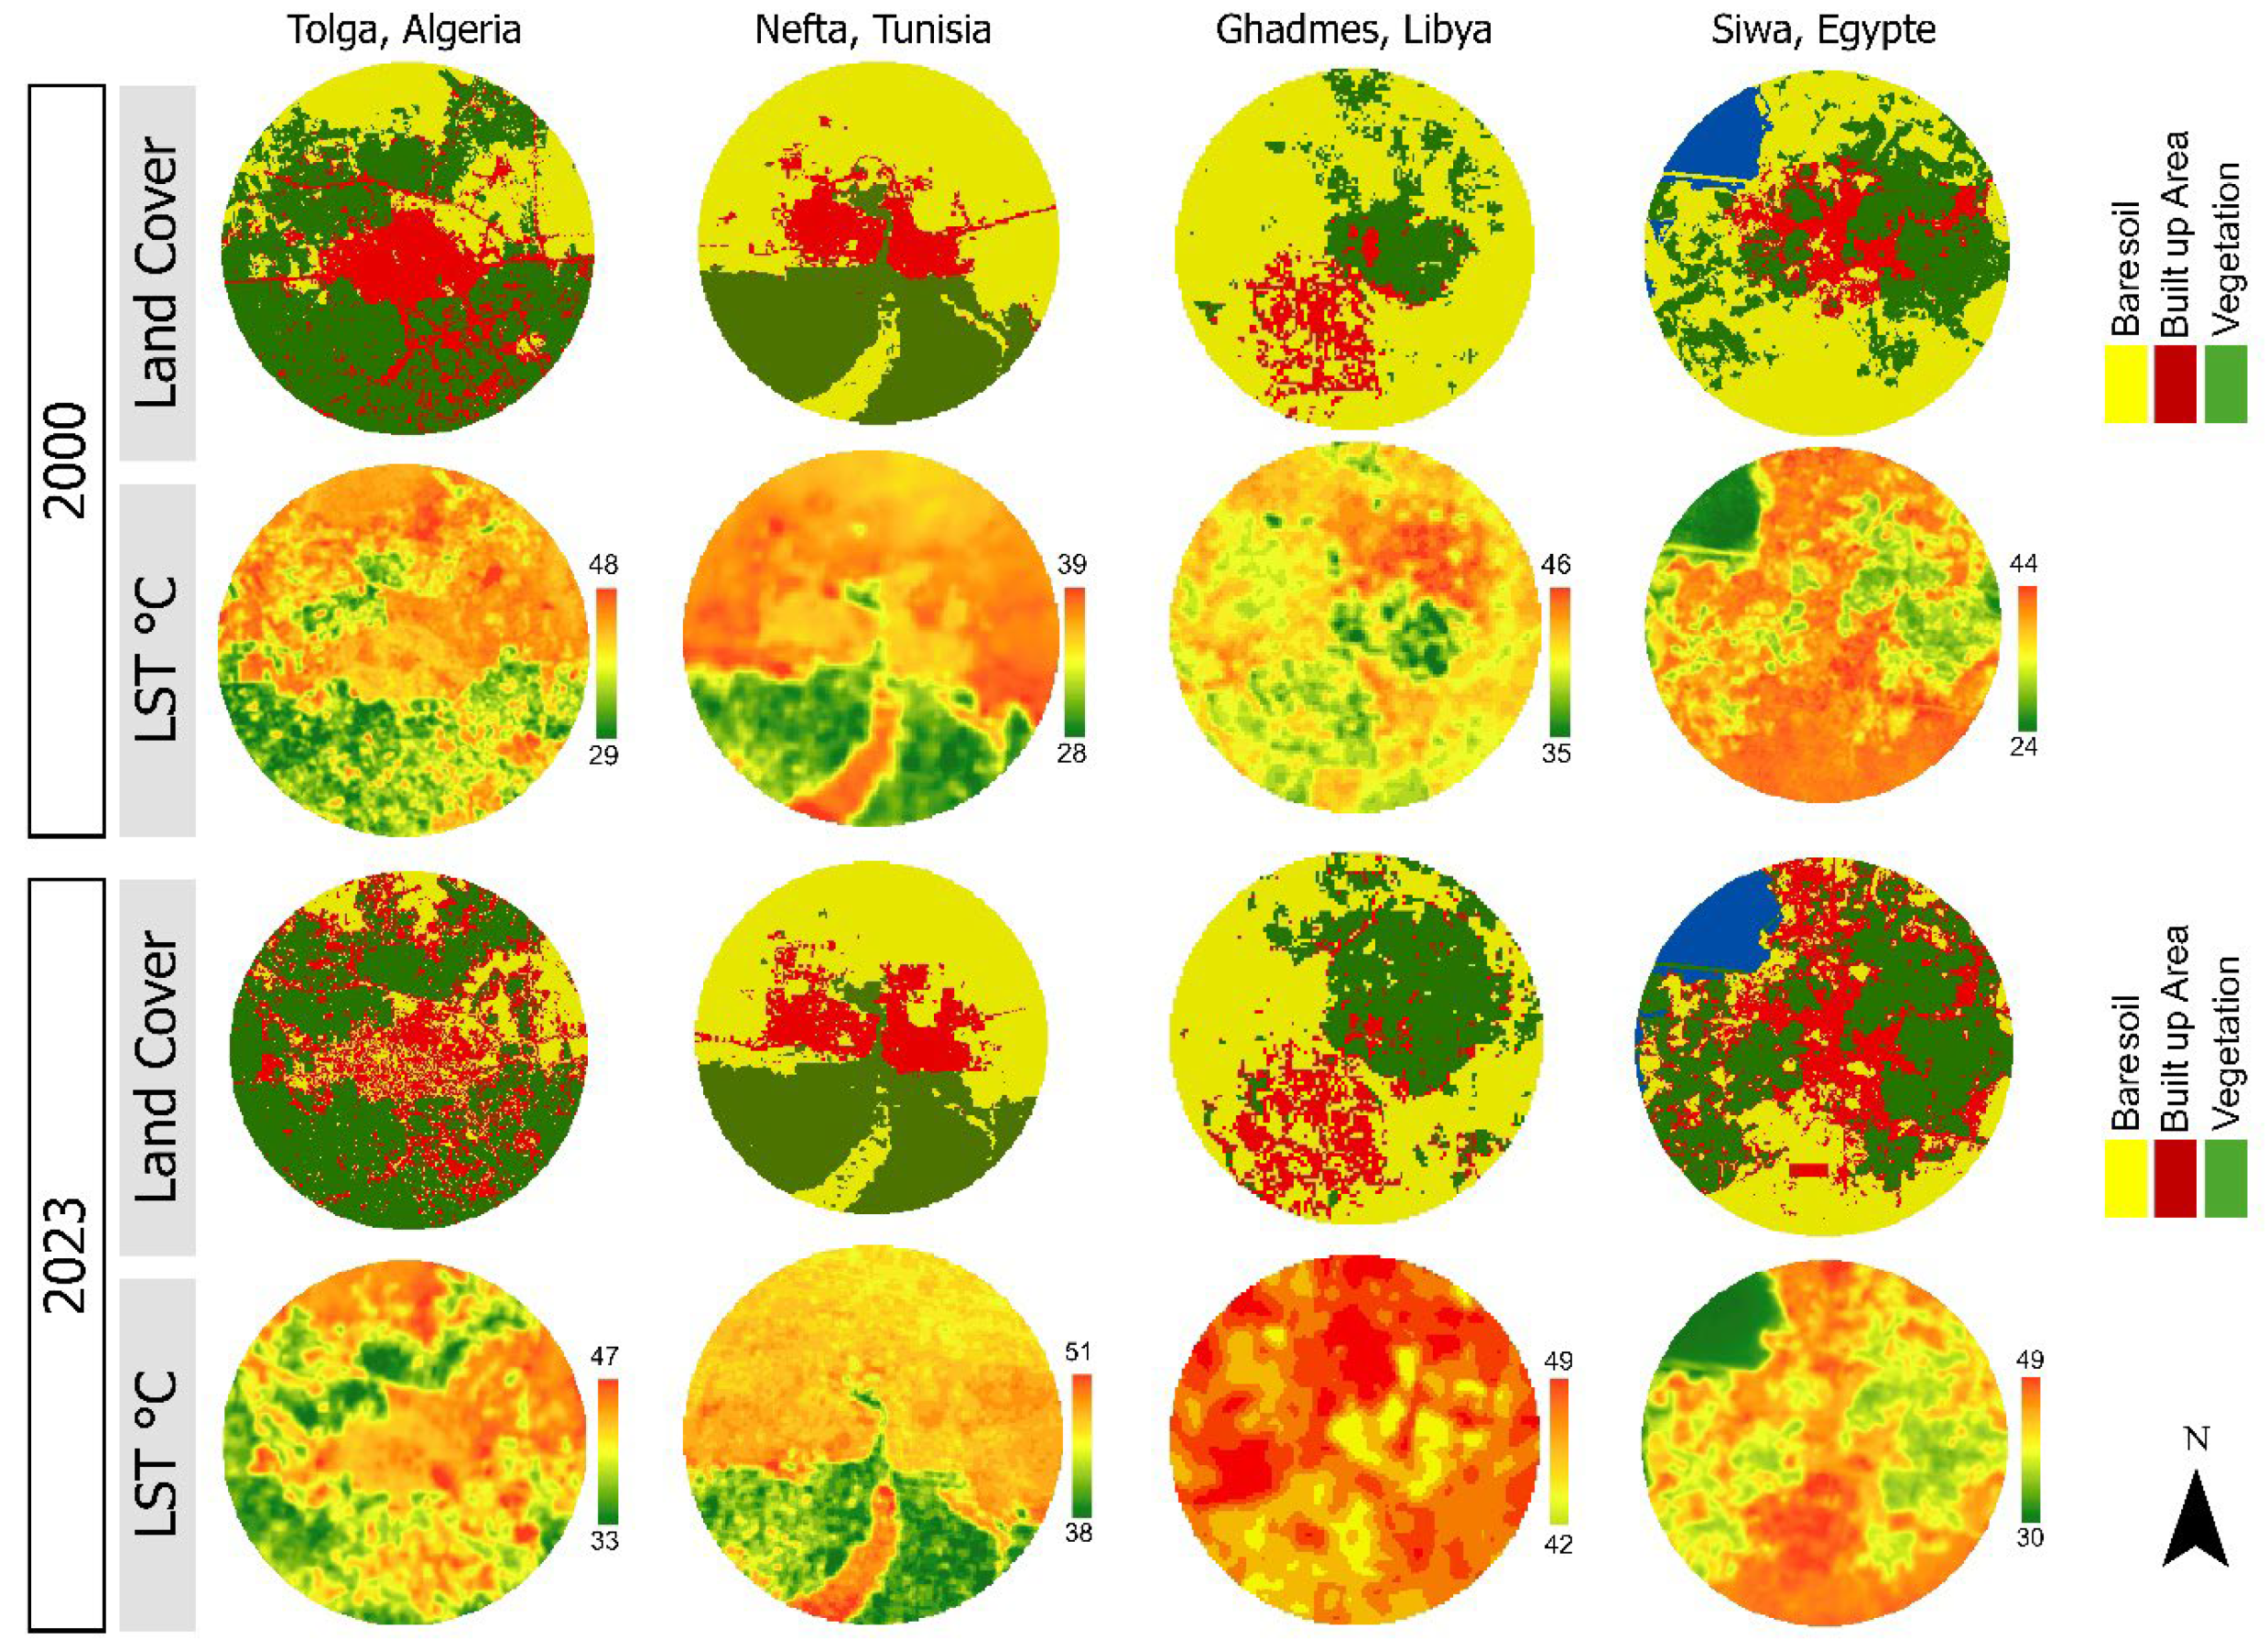
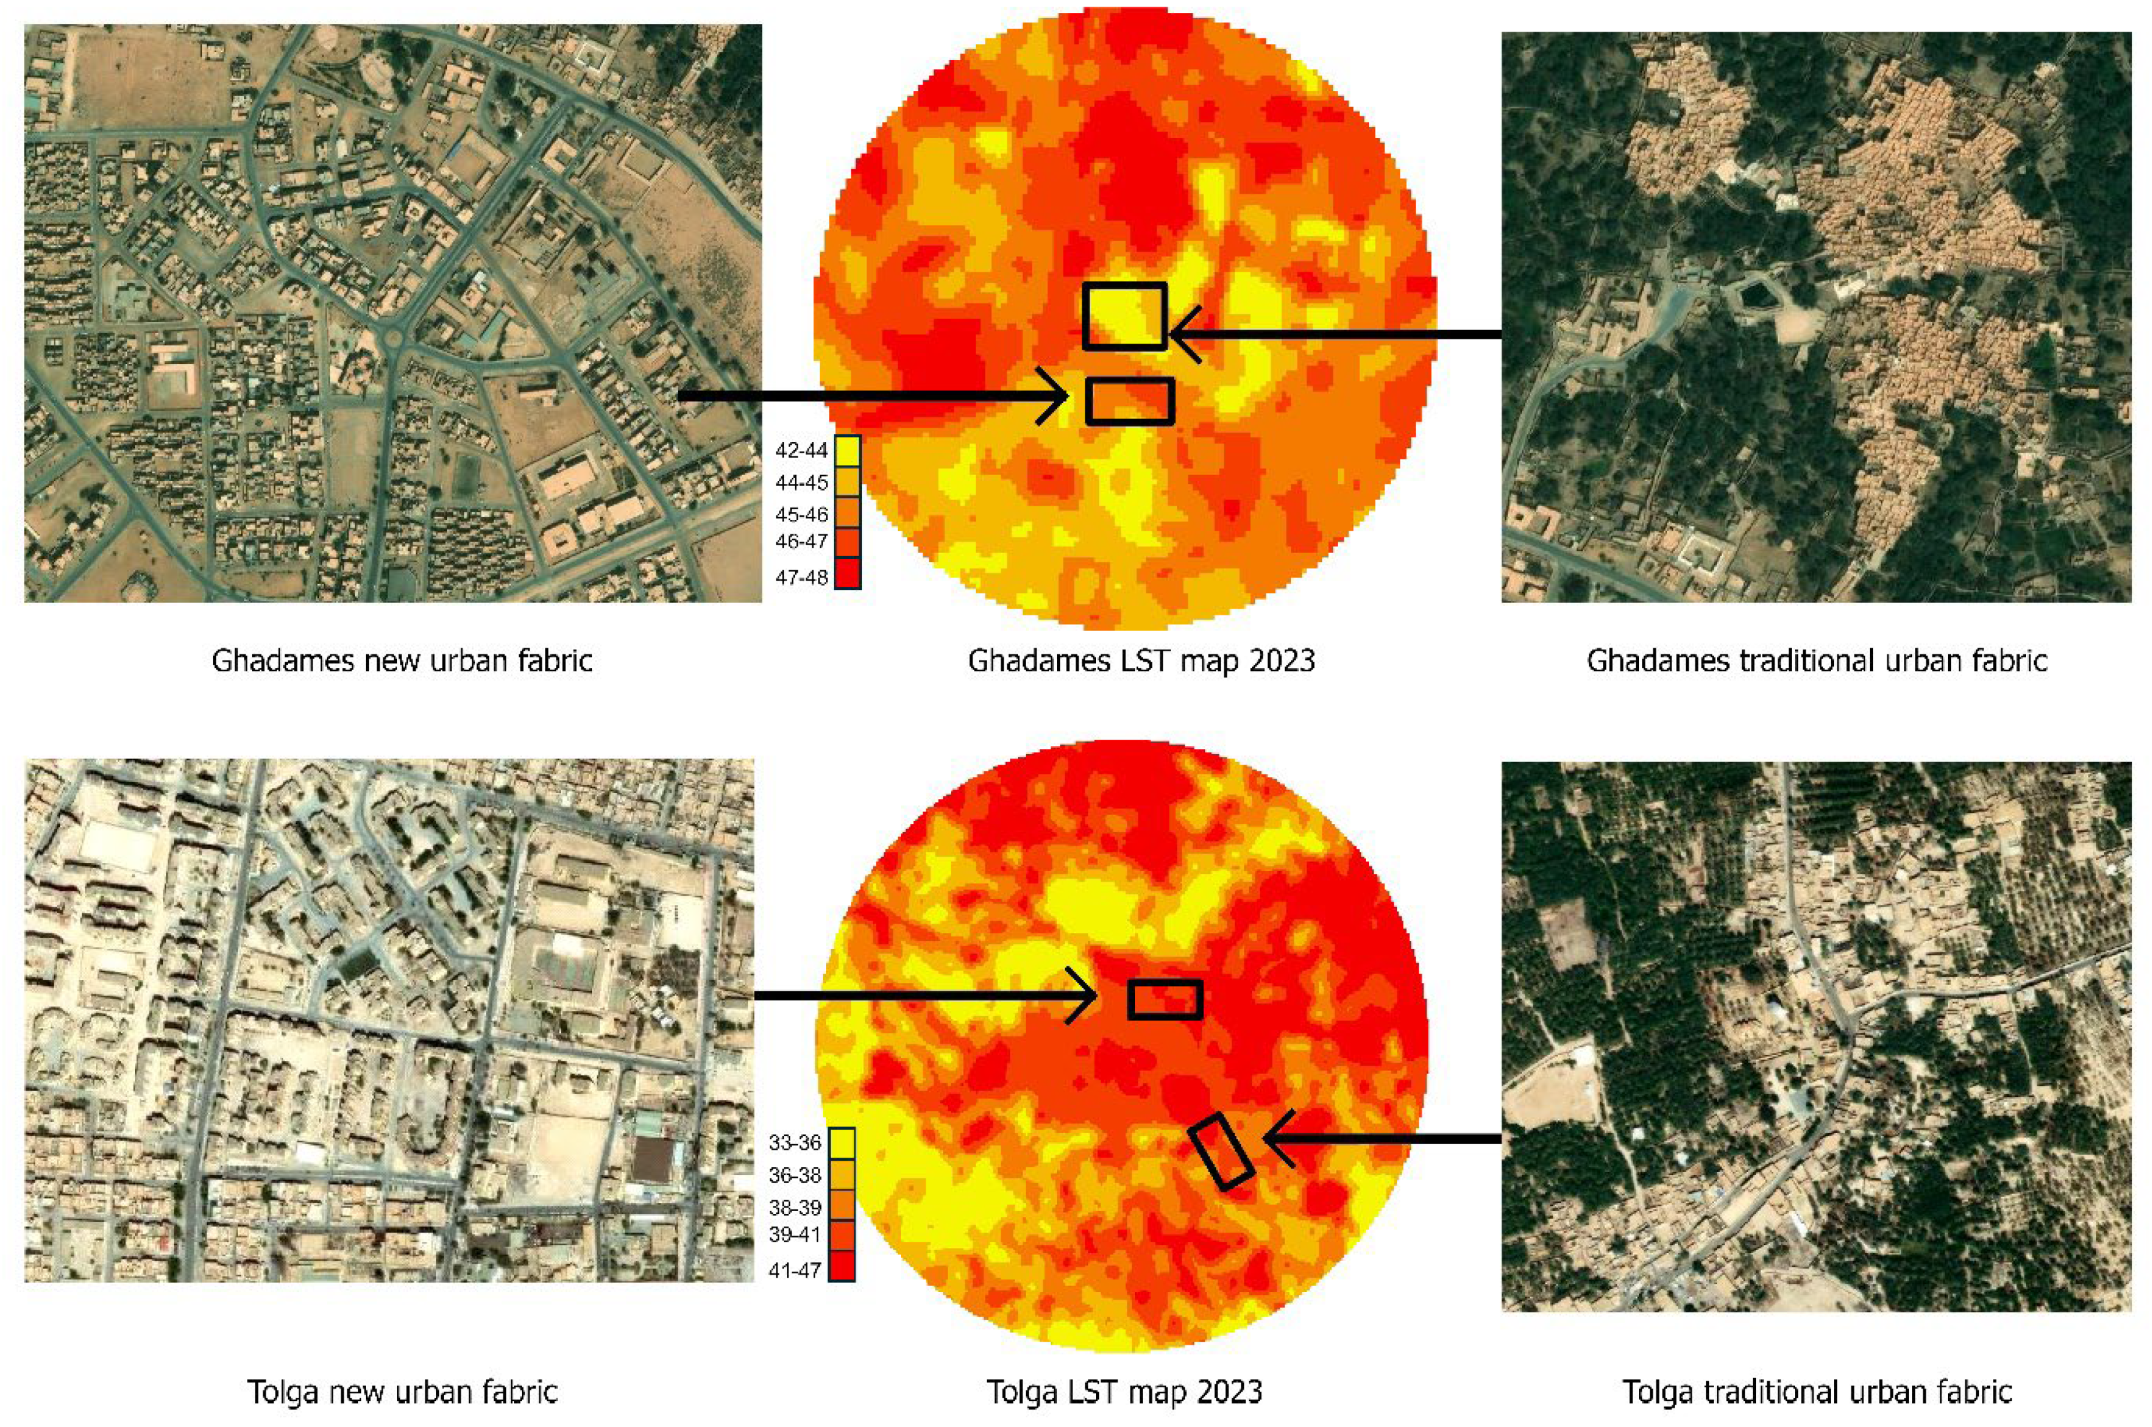
The analysis of the LC and LST maps of the four oases for the years 2000 and 2023 (Figure 5) reveals a significant relationship between the distribution of surface temperatures (LST) and land cover (LC). The lowest temperatures are consistently associated with vegetated areas, represented as green patches on the LST maps. This cooling effect is attributed to evapotranspiration and the vegetation’s ability to absorb heat. In contrast, bare soil areas exhibit higher temperatures, often exceeding those of urban areas. This observation is explained by the thermal properties of bare soil, which, in the absence of vegetation or shade, accumulates and releases heat more efficiently than built surfaces. Urban areas generally show higher temperatures than vegetated zones but are slightly cooler than bare soil in some cases. This may be due to the shading effect created by urban structures or the dissipation of heat within these areas. The evolution between the two dates shows varied dynamics depending on the oasis, with urban expansion observed in some cases. However, there is no generalized decrease in vegetative cover. These variations highlight the importance of considering local specificities when analyzing the impacts of urban development and land use changes on the microclimate of each oasis. Notably, the temperature in the historical cores of the oases, where the urbanization system is traditional and integrated with the palm groves, is lower than in the new extensions that adopt an imported urbanization model, foreign to these oases. These new extensions, with generally lower built density, contrast with the traditionally dense construction of local systems. This contrast results in an increase in exposed open spaces subject to solar radiation, contributing to a significant rise in land surface temperature (LST).

4.4. Analysis of LST, NDVI, and NDBI Relationships Through Statistical Tests

4.4.1. Pearson Correlation Analysis Between LST, NDVI, and NDBI

Pearson correlation analysis was used to examine the strength and direction of potential linear relationships between LST, NDVI, and NDBI. Correlation coefficients (r) were calculated for each oasis and the two study years (2000 and 2023). This approach allowed for the identification of both global trends and site-specific patterns. The results are presented in Table 6, providing a detailed overview of the correlation values for each oasis and period.
The Pearson correlation analysis reveals differentiated dynamics between land surface temperature (LST), vegetation (NDVI), and built-up areas (NDBI) across the four studied oases. Strong negative correlations between LST and NDVI confirm the cooling effect of vegetation. In contrast, positive correlations between LST and NDBI highlight the contribution of built-up areas to surface temperature increases. However, these relationships vary among the oases, reflecting local specificities in urbanization, vegetation cover, and land management practices.
In oases such as Tolga and Nefta, the results show strong negative correlations between LST and NDVI, indicating a clear association between increased vegetation cover and lower surface temperatures. Simultaneously, high positive correlations between LST and NDBI suggest that urban expansion plays a significant role in surface warming, underscoring the urban heat island effect in these more anthropogenically altered environments. Conversely, in Ghadames and Siwa, the correlations are more moderate. In Ghadames, this reflects limited urbanization and sparse vegetation, which reduces the influence of human-induced transformations on surface temperatures. In Siwa, the relationships appear more stable over time, likely due to a relatively balanced coexistence between agricultural practices and the gradual growth of built-up areas.

4.4.2. Multiple Linear Regression Analysis

Multiple linear regression was used to evaluate the effect of NDVI and NDBI on land surface temperature (LST), defined as the dependent variable, with NDVI and NDBI as independent predictors. This method quantified the relative contribution of each index to temperature variations and identified potential interactions between these variables, highlighting the combined impacts of environmental and anthropogenic dynamics in the studied oases. The results are summarized in Table 7.
The coefficient of determination indicates a strong fit for Tolga (R2 = 0.87 in 2000 and 0.74 in 2023) and Nefta (0.83 in 2000 and 0.84 in 2023). At Siwa, the model still performs well in 2023 (R2 = 0.72) but poorly in 2000 (0.13). In contrast, Ghadames shows an adjusted R2 of only 0.04 in 2023, which implies that factors not captured by NDVI and NDBI, such as vegetation quality, irrigation practice, soil reflectance, or building morphology, dominate surface-temperature variability that year.
NDVI is usually negatively correlated with LST, confirming the cooling role of vegetation, as illustrated by Tolga 2000 where NDVI equals −23.316 p < 0.001. However, three cases diverge from this pattern. At Nefta 2023, the NDVI coefficient is small and not statistically significant, B = 2.156, p = 0.075; such a weak signal may reflect limited NDVI variance, pixel mixing of irrigated plots and bare soil. Higher-resolution imagery, for example, drone data, together with in situ measurements of surface temperature, soil moisture, and leaf density, will be needed to clarify the relationship. In Ghadames 2023, NDVI appears positive, B = 5.02, p < 0.001, yet the model explains almost none of the variance, adjusted R2 = 0.04, collinearity with NDBI is high, and VIF > 8; ridge regression lowers the slope to about 1.3 °C, p ≈ 0.04, indicating that the initial value is mostly a statistical artefact. Detailed landscape segmentation and ground-based radiative measurements will be required to isolate the true effect of the residual vegetation. Finally, Siwa 2023 shows a strongly positive NDVI coefficient, B = 20.66, p < 0.001, a pattern consistent with intensively irrigated yet unshaded vegetable fields where wet soil heats rapidly despite high greenness; simultaneous records of air temperature, humidity, and surface albedo will help quantify this behavior.
The variations observed between 2000 and 2023 reveal specific temporal dynamics in the studied oases. In Tolga, the relationship between NDVI and LST appears to have stabilized, while the influence of NDBI on surface temperatures has become more pronounced. Contrary to the common assumption that vegetation inevitably declines with urbanization, the results suggest that vegetative cover has remained relatively stable in certain oases. However, this stability has not been sufficient to counterbalance the significant expansion of built-up areas. The resulting imbalance has weakened the natural thermal regulation of these environments and disrupted the ecological equilibrium of oasis ecosystems.

5. Discussion

Urbanization and changes in vegetation cover significantly influence variations in land surface temperature (LST) within oases. The strong negative correlations between LST and NDVI, particularly observed in Tolga, where dense palm groves dominate the landscape [79,80], and in Nefta, characterized by dense palms associated with agricultural crops [81], highlight the cooling effect of traditional palm groves (Figure 6). In contrast, in oases such as Ghadames, where isolated palms coexist with scattered agricultural plots [82], and Siwa, which combines palms, olive trees, and vegetable crops [83], mixed vegetation and sparse seasonal crops, characterized by their low height and limited shading, predominate. These oases exhibit a weaker correlation between LST and NDVI, indicating a relatively limited ability of the vegetation to mitigate surface temperature increases.
This difference can be attributed to the ability of palm groves, adapted to arid conditions, to provide permanent shade, maintain relative humidity, and reduce solar absorption, even during the extreme heat of summer, unlike the superficial crops found in Ghadames. These findings underscore the vital importance of preserving traditional palm grove systems, which serve as crucial thermal regulators for oases. However, the gradual replacement of these groves by urbanized areas or seasonal crops, often considered more profitable, risks exacerbating the urban heat island effect and compromising the sustainability of oases in the face of increasing challenges posed by urbanization and climate change. It is also important to note that the palm groves themselves are under threat from climate change and rising temperatures, which, according to several studies, promote the spread of diseases affecting date palms and degrade the quality of dates [84,85,86,87,88]. This situation makes date farming increasingly unprofitable, driving many farmers to turn to other types of vegetation, which could further disrupt the ecological and thermal balance of oases.
Urbanization patterns in oases also shape their microclimate. Two contrasting fabrics stand out. The traditional fabric in the historic core is compact, built with locally adapted materials, and merges seamlessly with surrounding palm groves. This configuration creates shade and encourages natural ventilation. Measured daytime LST averages confirm the cooling benefit: In Tolga, Nefta, and Ghadames, the historic quarters record mean values of 38.8, 45.1, and 43.6 °C, respectively, while the adjacent modern extensions reach 41.3, 47.1, and 45.3 °C. The resulting thermal gaps are 2.5 °C in Tolga, 2.1 °C in Nefta, and 1.7 °C in Ghadames (Table 8; Figure 7).
LST measures the skin temperature of roofs and exposed ground surfaces, not the air temperature experienced by pedestrians, although the two are closely related. Narrow shaded streets, arcades, and covered passages that characterize many historic cores in the oasis can remain several degrees cooler than the roof surfaces detected by satellite sensors. The actual microclimate gap between traditional and modern quarters is therefore likely larger than the surface temperature difference reported here
Modern extensions, often designed to external planning standards, are laid out at low density with large open spaces fully exposed to solar radiation. They also break the physical and functional link between the built environment and the palm groves. This lack of integration explains the higher surface temperatures in the newer quarters (Table 9). This study does not report a traditional versus modern LST contrast for Siwa because its urban fabric is distinctive. Much of the settlement has been rebuilt in a uniform architectural style, and the recent extensions largely replicate the existing street network. Consequently, the physical characteristics are too similar for the current indicators to identify two morphologically distinct zones, making a comparative analysis uninformative. Detecting any microclimatic gradient within Siwa would require a dedicated ground-based survey, which is proposed as an objective for future research.
These findings highlight the critical importance of preserving and integrating traditional urban planning practices, which are particularly well-suited to arid climatic conditions, into the urban management strategies of oases; neglecting these lessons risks undermining the sustainability of oases while amplifying the negative effects of climate change and urban heat islands.

Limitations and Future Implications

This study provides valuable insights into the relationship between land cover transformations and land surface temperature dynamics in North African oases, a region that remains relatively underexplored in the literature. It offers a robust and replicable methodological framework, previously applied to oases in other continents. However, several limitations should be acknowledged. This study relies exclusively on remote sensing data, without complementary in situ validation of land surface temperature or vegetation condition, which may affect the accuracy of the interpretations. The use of a circular study area, although methodologically consistent, may not fully reflect the spatial complexity of irregular urban and agricultural forms. Additionally, the land cover classification was limited to three broad categories, which may obscure more specific land use types such as water bodies, seasonal vegetation, or degraded zones. The analysis was based solely on summer imagery, particularly from July, which restricts the exploration of seasonal variations in microclimatic behavior. Moreover, the absence of socio-economic variables, including population growth, land management practices, and policy frameworks, due to a lack of available data, limits the ability to assess the full scope of drivers behind oasis transformation.
Another key limitation of the present work is the lack of very high-resolution imagery needed to quantify greenery within the built environment of the four case studies. Features such as narrow palm grove strips, courtyard gardens, and street trees fall below the thirty-meter Landsat pixel size. This constraint applies only to intra urban vegetation estimation and does not affect the accuracy of our other land cover metrics. Future research should combine sub meter multispectral data acquired by drones or PlanetScope satellites with field-based canopy surveys. Such a workflow would allow calculation of an urban green space ratio for each oasis, facilitate completion of vegetation thresholds derived from remote sensing, and support scenario testing of blue and green infrastructure designed to mitigate thermal stress.
To overcome these limitations, future research should incorporate in situ observations, multi-seasonal and diurnal satellite data, and higher-resolution imagery to enhance both spatial and temporal accuracy. Expanding the land cover classification to include more detailed categories would improve the granularity of analysis. Comparative studies across a broader range of North African oases are also recommended to inform the development of context-sensitive strategies for sustainable land use and climate-resilient urban planning in arid regions.

6. Conclusion

This study highlights the complex interactions between land surface temperature (LST), vegetation cover, and urbanization in arid oases, emphasizing the environmental impacts of anthropogenic activities. The findings demonstrate the significant cooling effect of traditional palm groves, the warming influence of built-up areas, and the critical role of urbanization and urban morphology in shaping these dynamics. The variability of these relationships across regions and study periods reflects the diverse challenges faced by oases.
The temporal analysis reveals an increasing influence of urbanization on LST, as evidenced by the high NDBI coefficients between 2000 and 2023 in most cases. While Tolga appears to have maintained a certain thermal balance through a relatively stable relationship between urban expansion and vegetation, other oases such as Ghadames and Siwa face more complex challenges. These challenges suggest the need to consider additional factors beyond NDVI and NDBI to understand their thermal dynamics fully.
In response to the growing challenges posed by rising temperatures and urban heat islands, this study proposes sustainable management strategies tailored to the specific needs of oases. These strategies include preserving and strengthening traditional palm groves, which serve as vital thermal regulators, creating urban green spaces designed to address the climatic constraints of arid regions, and promoting a dense urbanization model harmonized with the environment. These measures are essential to mitigating thermal impacts, preserving ecological balance, and ensuring the long-term resilience of oases in the face of urbanization and climate change.
To deepen this understanding, future research should integrate complementary variables such as microclimatic characteristics and the type and health of vegetation cover. Remote sensing analyses would also benefit from being complemented by in situ studies. Furthermore, comparative studies conducted across different arid regions could refine management approaches, providing practical and targeted recommendations for policymakers and stakeholders involved in the sustainable development of oases.

Author Contributions

Conceptualization, T.A.K.B., D.B., S.O., S.M. and M.M.G.; methodology, T.A.K.B. and D.B.; software, T.A.K.B., D.B. and S.M.; validation, T.A.K.B., D.B., S.O. and S.M.; formal analysis, T.A.K.B. and D.B.; investigation, T.A.K.B., D.B., S.O., S.M. and M.M.G.; resources, T.A.K.B., D.B., S.O., S.M. and M.M.G.; data curation, T.A.K.B., D.B., S.O., S.M. and M.M.G.; writing—original draft preparation, T.A.K.B., D.B., S.O., S.M., N.R. and M.M.G.; writing—review and editing, T.A.K.B., D.B., S.O., S.M., N.R. and M.M.G.; visualization, T.A.K.B., D.B., S.O., S.M., N.R. and M.M.G.; supervision, T.A.K.B., D.B. and M.M.G.; project administration, T.A.K.B. and D.B.; funding acquisition, T.A.K.B., D.B. and M.M.G. All authors have read and agreed to the published version of the manuscript.

Funding

This research was funded by the Division of Graduate Studies, Research and Business (GRB) at Dar Al-Hekma University, Jeddah, under grant no. (RFC/24-25/01). The author, therefore, acknowledges the technical and financial support of the GRB with thanks.

Data Availability Statement

The remote sensing data used in this study was obtained from publicly available sources, specifically Landsat 7, Landsat 8, and Landsat 9 imagery provided by the United States Geological Survey (USGS). These datasets can be freely accessed and downloaded from the USGS Earth Explorer platform at https://earthexplorer.usgs.gov (accessed on 10 October 2024). Processed data is available from the corresponding author upon reasonable request.

Conflicts of Interest

The authors declare no conflicts of interest.

References

  1. Farhi, A. Biskra: De l’oasis à la ville saharienne (Note). Méditerranée 2002, 99, 77–82. [Google Scholar] [CrossRef]
  2. Bouzir, T.A.K.; Berkouk, D.; Zemmouri, N. Evaluation and Analysis of the Algerian Oases Soundscape: Case of El Kantara and Sidi Okba. Acoust. Aust. 2020, 48, 131–140. [Google Scholar] [CrossRef]
  3. Santoro, A. Traditional oases in Northern Africa as multifunctional agroforestry systems: A systematic literature review of the provided Ecosystem Services and of the main vulnerabilities. Agrofor. Syst. 2023, 97, 81–96. [Google Scholar] [CrossRef]
  4. Berkouk, D.; Bouzir, T.A.K.; Maffei, L.; Masullo, M. Examining the associations between oases soundscape components and walking speed: Correlation or causation? Sustainability 2020, 12, 4619. [Google Scholar] [CrossRef]
  5. Liu, Y.; Zhang, X.; Lei, J.; Zhu, L. Urban expansion of oasis cities between 1990 and 2007 in Xinjiang, China. Int. J. Sustain. Dev. World Ecol. 2010, 17, 253–262. [Google Scholar] [CrossRef]
  6. Fargette, M.; Loireau, M.; Sghaier, M.; Raouani, N.; Libourel, T. The Future of Oases in North Africa Through the Prism of a Systemic Approach: Towards Which Type of Viability and Coviability? In Coviability of Social and Ecological Systems: Reconnecting Mankind to the Biosphere in an Era of Global Change; Barrière, O., Behnassi, M., David, G., Douzal, V., Fargette, M., Libourel, T., Loireau, M., Pascal, L., Prost, C., Ravena-Cañete, V., et al., Eds.; Springer International Publishing: Cham, Switzerland, 2019; pp. 19–59. ISBN 978-3-319-78110-5. [Google Scholar]
  7. Bouzir, T.A.K. Oasis View from the Sky: Exploration Through Satellite Maps, 1st ed.; Sajed House for Publishing and Distribution: Biskra, Algeria, 2024; ISBN 9789969509755. [Google Scholar]
  8. Leal Filho, W.; Stojanov, R.; Matsoukas, C.; Ingrosso, R.; Franke, J.A.; Pausata, F.S.; Grassi, T.; Landa, J.; Harrouni, C. An assessment of climate change impacts on oases in northern Africa. Ecol. Indic. 2024, 166, 112287. [Google Scholar] [CrossRef]
  9. Ali, A.M.; Salem, H.M. Salinity-induced desertification in oasis ecosystems: Challenges and future directions. Environ. Monit. Assess. 2024, 196, 696. [Google Scholar] [CrossRef]
  10. Chen, Y.; Fang, G.; Li, Z.; Zhang, X.; Gao, L.; Elbeltagi, A.; Shaer, H.E.; Duan, W.; Wassif, O.M.A.; Li, Y.; et al. The Crisis in Oases: Research on Ecological Security and Sustainable Development in Arid Regions. Annu. Rev. Environ. Resour. 2024, 49, 1–20. [Google Scholar] [CrossRef]
  11. Carvalho, D.; Pereira, S.C.; Silva, R.; Rocha, A. Aridity and desertification in the Mediterranean under EURO-CORDEX future climate change scenarios. Clim. Chang. 2022, 174, 28. [Google Scholar] [CrossRef]
  12. Ziadat, F.M.; Zdruli, P.; Christiansen, S.; Caon, L.; Abdel Monem, M.; Fetsi, T. An overview of land degradation and sustainable land management in the near East and North Africa. Sustain. Agric. Res. 2022, 11, 11–24. [Google Scholar] [CrossRef]
  13. Boualem, R.; Rabah, K. The foggara in the Arab world. Geogr. Tech. 2012, 1, 1–7. [Google Scholar]
  14. Abdel Galil, I.; Ali, A. Vulnerability of Oases in Hyper-Arid Areas in The Arabian Peninsula and Northern Africa to Climate Change. J. Desert Environ. Agric. 2022, 2, 1–11. [Google Scholar] [CrossRef]
  15. Bouzir, T.A.K.; Djihed, B.; Theodore, S.E.; Dietrich, S.; Nader, A. Soundscapes in Arab cities: A systematic review and research agenda. Sound Vib. 2023, 58, 046723. [Google Scholar] [CrossRef]
  16. Lavie, E.; Marshall, A. (Eds.) Oases and Globalization: Ruptures and Continuities; Springer Geography; Springer International Publishing: Cham, Switzerland, 2017. [Google Scholar]
  17. Dechaicha, A.; Daikh, A.; Alkama, D. Monitoring and landscape quantification of uncontrolled urbanisation in oasis regions: The case of adrar city in Algeria. J. Contemp. Urban Aff. 2021, 5, 209–219. [Google Scholar] [CrossRef]
  18. Bouzir, T.A.K.; Berkouk, D.; Boucherit, S.; Khelil, S.; Matallah, M.E.; Zemmouri, N. Evaluation of soundscape variations through the open public spaces in saharan cities: A case of Biskra, Algeria. Environ. Res. Eng. Manag. 2022, 78, 39–51. [Google Scholar] [CrossRef]
  19. Derdouri, A.; Wang, R.; Murayama, Y.; Osaragi, T. Understanding the links between LULC changes and SUHI in cities: Insights from two-decadal studies (2001–2020). Remote Sens. 2021, 13, 3654. [Google Scholar] [CrossRef]
  20. Al-Rowali, M.; Belaid, M.A.; Nadir Musa, N.M. Investigation of the impact of urbanization on land use categories in Al-Ahsa Oasis using RS and GIS techniques. Arab. Gulf J. Sci. Res. 2004, 22, 86–95. [Google Scholar]
  21. Gong, B.; Liu, Z. Assessing impacts of land use policies on environmental sustainability of oasis landscapes with scenario analysis: The case of northern China. Landsc. Ecol. 2021, 36, 1913–1932. [Google Scholar] [CrossRef]
  22. Zhang, J.; Zhou, Q.; Cao, M.; Liu, H. Spatiotemporal Change of Eco-Environmental Quality in the Oasis City and Its Correlation with Urbanization Based on RSEI: A Case Study of Urumqi, China. Sustainability 2022, 14, 9227. [Google Scholar] [CrossRef]
  23. Zhuang, Q.; Shao, Z.; Li, D.; Huang, X.; Altan, O.; Wu, S.; Li, Y. Isolating the direct and indirect impacts of urbanization on vegetation carbon sequestration capacity in a large oasis city: Evidence from Urumqi, China. Geo-Spat. Inf. Sci. 2023, 26, 379–391. [Google Scholar] [CrossRef]
  24. Zhang, F.; Tiyip, T.; Kung, H.; Johnson, V.C.; Maimaitiyiming, M.; Zhou, M.; Wang, J. Dynamics of land surface temperature (LST) in response to land use and land cover (LULC) changes in the Weigan and Kuqa river oasis, Xinjiang, China. Arab. J. Geosci. 2016, 9, 499. [Google Scholar] [CrossRef]
  25. Al-Hameedi, W.M.M.; Chen, J.; Faichia, C.; Al-Shaibah, B.; Nath, B.; Kafy, A.-A.; Hu, G.; Al-Aizari, A. Remote sensing-based urban sprawl modeling using multilayer perceptron neural network Markov chain in Baghdad, Iraq. Remote Sens. 2021, 13, 4034. [Google Scholar] [CrossRef]
  26. Hassaballa, A.; Salih, A. A Spatio-Temporal Analysis of Heat Island Intensity Influenced by the Substantial Urban Growth between 1990 and 2020: A Case Study of Al-Ahsa Oasis, Eastern Saudi Arabia. Appl. Sci. 2023, 13, 2755. [Google Scholar] [CrossRef]
  27. Liu, Z.; Wang, J.; Ding, J.; Xie, X. Analysis of spatial–temporal evolution trends and influential factors of desert-oasis thermal environment in typical arid zone: The case of Turpan–Hami region. Ecol. Indic. 2023, 154, 110747. [Google Scholar] [CrossRef]
  28. Navalgund, R.R.; Jayaraman, V.; Roy, P.S. Remote sensing applications: An overview. Curr. Sci. 2007, 93, 1747–1766. [Google Scholar]
  29. Zhu, L.; Suomalainen, J.; Liu, J.; Hyyppä, J.; Kaartinen, H.; Haggren, H. A review: Remote sensing sensors. Multi-Purp. Appl. Geospat. Data 2018, 19, 19–42. [Google Scholar]
  30. Almeida, C.R.D.; Teodoro, A.C.; Gonçalves, A. Study of the urban heat island (UHI) using remote sensing data/techniques: A systematic review. Environments 2021, 8, 105. [Google Scholar] [CrossRef]
  31. Nega, W.; Balew, A. The relationship between land use land cover and land surface temperature using remote sensing: Systematic reviews of studies globally over the past 5 years. Env. Sci Pollut. Res 2022, 29, 42493–42508. [Google Scholar] [CrossRef]
  32. Tomlinson, C.J.; Chapman, L.; Thornes, J.E.; Baker, C. Remote sensing land surface temperature for meteorology and climatology: A review. Meteorol. Appl. 2011, 18, 296–306. [Google Scholar] [CrossRef]
  33. Ban, Y. Multitemporal Remote Sensing: Current Status, Trends and Challenges. In Multitemporal Remote Sensing; Ban, Y., Ed.; Remote Sensing and Digital Image Processing; Springer International Publishing: Cham, Switzerland, 2016; Volume 20, pp. 1–18. ISBN 978-3-319-47035-1. [Google Scholar]
  34. Tamiminia, H.; Salehi, B.; Mahdianpari, M.; Quackenbush, L.; Adeli, S.; Brisco, B. Google Earth Engine for geo-big data applications: A meta-analysis and systematic review. ISPRS J. Photogramm. Remote Sens. 2020, 164, 152–170. [Google Scholar] [CrossRef]
  35. Fu, Y.; Zhu, Z.; Liu, L.; Zhan, W.; He, T.; Shen, H.; Zhao, J.; Liu, Y.; Zhang, H.; Liu, Z.; et al. Remote Sensing Time Series Analysis: A Review of Data and Applications. J. Remote Sens. 2024, 4, 285. [Google Scholar] [CrossRef]
  36. Aggarwal, S.; Misra, M. Comparison of NDVI, NDBI as indicators of surface heat island effects for Bangalore and New Delhi: Case Study. In Proceedings of the Remote Sensing Technologies and Applications in Urban Environments III; SPIE: Bellingham, WA, USA, 2018; Volume 10793, pp. 178–186. [Google Scholar]
  37. Malik, M.S.; Shukla, J.P.; Mishra, S. Relationship of LST, NDBI and NDVI using landsat-8 data in Kandaihimmat watershed, Hoshangabad, India. Indian J. Geo-Mar. Sci. 2019, 48, 25–31. [Google Scholar]
  38. Kaur, R.; Pandey, P. A review on spectral indices for built-up area extraction using remote sensing technology. Arab. J. Geosci. 2022, 15, 391. [Google Scholar] [CrossRef]
  39. Keerthi Naidu, B.N.; Chundeli, F.A. Assessing LULC changes and LST through NDVI and NDBI spatial indicators: A case of Bengaluru, India. GeoJournal 2023, 88, 4335–4350. [Google Scholar] [CrossRef]
  40. Bechtel, B.; Langkamp, T.; Böhner, J.; Daneke, C.; Oßenbrügge, J.; Schempp, S. Classification and modelling of urban micro-climates using multisensoral and multitemporal remote sensing data. Int. Arch. Photogramm. Remote Sens. Spat. Inf. Sci. 2012, 39, 463–468. [Google Scholar] [CrossRef]
  41. Singh, R.B.; Grover, A. Remote sensing of urban microclimate with special reference to urban heat island using Landsat thermal data. Geogr. Pol. 2014, 87, 555–568. [Google Scholar] [CrossRef]
  42. Schaefer, M.; Salari, H.E.; Köckler, H.; Thinh, N.X. Assessing local heat stress and air quality with the use of remote sensing and pedestrian perception in urban microclimate simulations. Sci. Total Environ. 2021, 794, 148709. [Google Scholar] [CrossRef] [PubMed]
  43. Lo, C.P.; Quattrochi, D.A.; Luvall, J.C. Application of high-resolution thermal infrared remote sensing and GIS to assess the urban heat island effect. Int. J. Remote Sens. 1997, 18, 287–304. [Google Scholar] [CrossRef]
  44. Sobrino, J.A.; Oltra-Carrió, R.; Sòria, G.; Jiménez-Muñoz, J.C.; Franch, B.; Hidalgo, V.; Mattar, C.; Julien, Y.; Cuenca, J.; Romaguera, M.; et al. Evaluation of the surface urban heat island effect in the city of Madrid by thermal remote sensing. Int. J. Remote Sens. 2013, 34, 3177–3192. [Google Scholar] [CrossRef]
  45. Zhou, D.; Xiao, J.; Bonafoni, S.; Berger, C.; Deilami, K.; Zhou, Y.; Frolking, S.; Yao, R.; Qiao, Z.; Sobrino, J.A. Satellite remote sensing of surface urban heat islands: Progress, challenges, and perspectives. Remote Sens. 2018, 11, 48. [Google Scholar] [CrossRef]
  46. Andrew, M.E.; Wulder, M.A.; Nelson, T.A. Potential contributions of remote sensing to ecosystem service assessments. Prog. Phys. Geogr. Earth Environ. 2014, 38, 328–353. [Google Scholar] [CrossRef]
  47. De Araujo Barbosa, C.C.; Atkinson, P.M.; Dearing, J.A. Remote sensing of ecosystem services: A systematic review. Ecol. Indic. 2015, 52, 430–443. [Google Scholar] [CrossRef]
  48. Lausch, A.; Bastian, O.; Klotz, S.; Leitão, P.J.; Jung, A.; Rocchini, D.; Schaepman, M.E.; Skidmore, A.K.; Tischendorf, L.; Knapp, S. Understanding and assessing vegetation health by in situ species and remote-sensing approaches. Methods Ecol. Evol. 2018, 9, 1799–1809. [Google Scholar] [CrossRef]
  49. Soubry, I.; Doan, T.; Chu, T.; Guo, X. A systematic review on the integration of remote sensing and GIS to forest and grassland ecosystem health attributes, indicators, and measures. Remote Sens. 2021, 13, 3262. [Google Scholar] [CrossRef]
  50. Bruelheide, H.; Jandt, U.; Gries, D.; Thomas, F.M.; Foetzki, A.; Buerkert, A.; Wang, G.; Zhang, X.; Runge, M. Vegetation changes in a river oasis on the southern rim of the Taklamakan Desert in China between 1956 and 2000. Phytocoenologia 2003, 33, 801–818. [Google Scholar]
  51. Mohammed, J. Rapid urban growth in the city of Duhok, Iraqi Kurdistan Region: An integrated approach of GIS, remote sensing and Shannon entropy application. Int. J. Geomat. Geosci. 2013, 4, 325. [Google Scholar]
  52. El-Zeiny, A.M.; Effat, H.A. Environmental monitoring of spatiotemporal change in land use/land cover and its impact on land surface temperature in El-Fayoum governorate, Egypt. Remote Sens. Appl. Soc. Environ. 2017, 8, 266–277. [Google Scholar] [CrossRef]
  53. Lamqadem, A.A.; Saber, H.; Pradhan, B. Quantitative assessment of desertification in an arid oasis using remote sensing data and spectral index techniques. Remote Sens. 2018, 10, 1862. [Google Scholar] [CrossRef]
  54. Allbed, A.; Kumar, L.; Sinha, P. Mapping and modelling spatial variation in soil salinity in the Al Hassa Oasis based on remote sensing indicators and regression techniques. Remote Sens. 2014, 6, 1137–1157. [Google Scholar] [CrossRef]
  55. Bie, Q.; Xie, Y.; Wang, X.; Wei, B.; He, L.; Duan, H.; Wang, J. Understanding the attributes of the dual oasis effect in an arid region using remote sensing and observational data. Ecosyst. Health Sustain. 2020, 6, 1696153. [Google Scholar] [CrossRef]
  56. Xiang, Y.; Meng, J. Research into ecological suitability zoning and expansion patterns in agricultural oases based on the landscape process: A case study in the middle reaches of the Heihe River. Environ. Earth Sci. 2016, 75, 1355. [Google Scholar] [CrossRef]
  57. Ramachandra, T.V.; Aithal, B.H.; Sreekantha, S. Spatial metrics based landscape structure and dynamics assessment for an emerging Indian megalopolis. Int. J. Adv. Res. Artif. Intell. 2012, 1, 1. [Google Scholar] [CrossRef]
  58. Yu, J.; Peng, S.; Zhang, W.; Kang, S. Index for the consistent measurement of spatial heterogeneity for large-scale land cover datasets. ISPRS Int. J. Geo-Inf. 2020, 9, 483. [Google Scholar] [CrossRef]
  59. Myint, S.W.; Wentz, E.A.; Brazel, A.J.; Quattrochi, D.A. The impact of distinct anthropogenic and vegetation features on urban warming. Landsc. Ecol. 2013, 28, 959–978. [Google Scholar] [CrossRef]
  60. Vahidi, S.; Hatamzadeh, V.; Nouri, P.; Far, A.A. Monitoring land cover changes in Tehran city over 5 years (2018 to 2022) using remote sensing based spatial information. Asian J. Environ. Ecol. 2023, 20, 24–35. [Google Scholar] [CrossRef]
  61. Chen, L.; Li, M.; Huang, F.; Xu, S. Relationships of LST to NDBI and NDVI in Wuhan City based on Landsat ETM+ image. In Proceedings of the 2013 6th International Congress on Image and Signal Processing (CISP), Hangzhou, China, 16–18 December 2013; Volume 2, pp. 840–845. [Google Scholar]
  62. Sresto, M.A.; Siddika, S.; Fattah, M.A.; Morshed, S.R.; Morshed, M.M. A GIS and remote sensing approach for measuring summer-winter variation of land use and land cover indices and surface temperature in Dhaka district, Bangladesh. Heliyon 2022, 8, e10309. [Google Scholar] [CrossRef]
  63. Alademomi, A.S.; Okolie, C.J.; Daramola, O.E.; Akinnusi, S.A.; Adediran, E.; Olanrewaju, H.O.; Alabi, A.O.; Salami, T.J.; Odumosu, J. The interrelationship between LST, NDVI, NDBI, and land cover change in a section of Lagos metropolis, Nigeria. Appl. Geomat. 2022, 14, 299–314. [Google Scholar] [CrossRef]
  64. Cardone, B.; Di Martino, F.; Mauriello, C.; Miraglia, V. A GIS-Based Framework to Analyze the Behavior of Urban Greenery During Heatwaves Using Satellite Data. ISPRS Int. J. Geo-Inf. 2024, 13, 377. [Google Scholar] [CrossRef]
  65. Artis, D.A.; Carnahan, W.H. Survey of emissivity variability in thermography of urban areas. Remote Sens. Environ. 1982, 12, 313–329. [Google Scholar] [CrossRef]
  66. Carlson, T.N.; Ripley, D.A. On the relation between NDVI, fractional vegetation cover, and leaf area index. Remote Sens. Environ. 1997, 62, 241–252. [Google Scholar] [CrossRef]
  67. Yu, X.; Guo, X.; Wu, Z. Land surface temperature retrieval from Landsat 8 TIRS—Comparison between radiative transfer equation-based method, split window algorithm and single channel method. Remote Sens. 2014, 6, 9829–9852. [Google Scholar] [CrossRef]
  68. Lillesand, T.; Kiefer, R.W.; Chipman, J. Remote Sensing and Image Interpretation; John Wiley & Sons: Hoboken, NJ, USA, 2015. [Google Scholar]
  69. Anderson, J.R. A Land Use and Land Cover Classification System for Use with Remote Sensor Data; U.S. Government Printing Office: Washington, DC, USA, 1976; Volume 964.
  70. Congalton, R.G.; Green, K. Assessing the Accuracy of Remotely Sensed Data: Principles and Practices; CRC Press: Boca Raton, FL, USA, 2019. [Google Scholar]
  71. Cohen, J. A Coefficient of Agreement for Nominal Scales. Educ. Psychol. Meas. 1960, 20, 37–46. [Google Scholar] [CrossRef]
  72. Campbell, J.B.; Wynne, R.H. Introduction to Remote Sensing; Guilford Press: New York, NY, USA, 2011. [Google Scholar]
  73. Howitt, D.; Cramer, D. First Steps in Research and Statistics: A Practical Workbook for Psychology Students; Routledge: Oxfordshire, UK, 2003. [Google Scholar]
  74. Al-Ahmadi, F.S.; Al-Hames, A.S. Comparison of four classification methods to extract land use and land cover from raw satellite images for some remote arid areas, Kingdom of Saudi Arabia. Earth Sci. 2009, 20, 167–191. [Google Scholar] [CrossRef]
  75. Yousefi, S.; Khatami, R.; Mountrakis, G.; Mirzaee, S.; Pourghasemi, H.R.; Tazeh, M. Accuracy assessment of land cover/land use classifiers in dry and humid areas of Iran. Environ. Monit. Assess. 2015, 187, 641. [Google Scholar] [CrossRef] [PubMed]
  76. Jensen, J.R.; Lulla, K. Introductory digital image processing: A remote sensing perspective. Geocarto Int. 1987, 2, 65–65. [Google Scholar] [CrossRef]
  77. City Fact. Available online: https://www.city-facts.com (accessed on 29 May 2025).
  78. Laoubi, K.; Yamao, M. The challenge of agriculture in Algeria: Are policies effective. Bull. Agric. Fish. Econ. 2012, 12, 65–73. [Google Scholar]
  79. Bouguedoura, N.; Bennaceur, M.; Babahani, S.; Benziouche, S.E. Date Palm Status and Perspective in Algeria. In Date Palm Genetic Resources and Utilization; Al-Khayri, J.M., Jain, S.M., Johnson, D.V., Eds.; Springer: Dordrecht, The Netherlands, 2015; pp. 125–168. ISBN 978-94-017-9693-4. [Google Scholar]
  80. Belghemmaz, S.; Fenni, M.; Chomontowski, C.; Louadj, Y.; Afrasinei, M.G.; Degui, N. Typology characterisation and monitoring of arid soils in an agroecosystem environment: Case of Ziban oasis, Algeria. J. Water Land Dev. 2024, 61, 213–226. [Google Scholar] [CrossRef]
  81. Guedria, A.; Driss, H.; Kharrat, F. Nefta, la ville et l’oasis de la continuité à la rupture. In Proceedings of the Actes du Colloque International Les Oasis Dans la Mondialisation: Ruptures et Continuités, Paris, France, 16–17 December 2013; p. 159. [Google Scholar]
  82. Abdulac, S. Ghadames, Libya. A traditional earthen settlement, resilient to crises and environmental challenges. In Proceedings of the HERITAGE 2022-International Conference on Vernacular Heritage: Culture, People and Sustainability; Editorial Universitat Politècnica de València, València, Spain, 15–17 September 2022; pp. 1015–1022. [Google Scholar]
  83. Abo-Ragab, S.E. Sustainable agriculture development of Siwa Oasis, Western Desert, Egypt. Minufiya J. Agric. Res. 2014, 39, 1–14. [Google Scholar]
  84. Hamamouche, M.F.; Kuper, M.; Amichi, H.; Lejars, C.; Ghodbani, T. New reading of Saharan agricultural transformation: Continuities of ancient oases and their extensions (Algeria). World Dev. 2018, 107, 210–223. [Google Scholar] [CrossRef]
  85. Ait-El-Mokhtar, M.; Boutasknit, A.; Ben-Laouane, R.; Anli, M.; El Amerany, F.; Toubali, S.; Lahbouki, S.; Wahbi, S.; Meddich, A. Vulnerability of oasis agriculture to climate change in Morocco. In Research Anthology on Environmental and Societal Impacts of Climate Change; IGI Global: Hershey, PA, USA, 2022; pp. 1195–1219. [Google Scholar]
  86. Mrabet, R. Advanced and emerging agricultural innovations for securing food, climate and ecosystems in Moroccan oasis. J. OASIS Agric. Sustain. Dev. 2022, 4, 6–15. [Google Scholar] [CrossRef]
  87. Abul-Soad, A.A.; Mohamed, N.H.; Salomón-Torres, R.; Al-Khayri, J.M. Cultivation of Date Palm for Enhanced Resilience to Climate Change. In Cultivation for Climate Change Resilience; CRC Press: Boca Raton, FL, USA, 2023; Volume 2, pp. 138–169. [Google Scholar]
  88. Dhawi, F.; Aleidan, M.M. Oasis agriculture revitalization and carbon sequestration for climate-resilient communities. Front. Agron. 2024, 6, 1386671. [Google Scholar] [CrossRef]
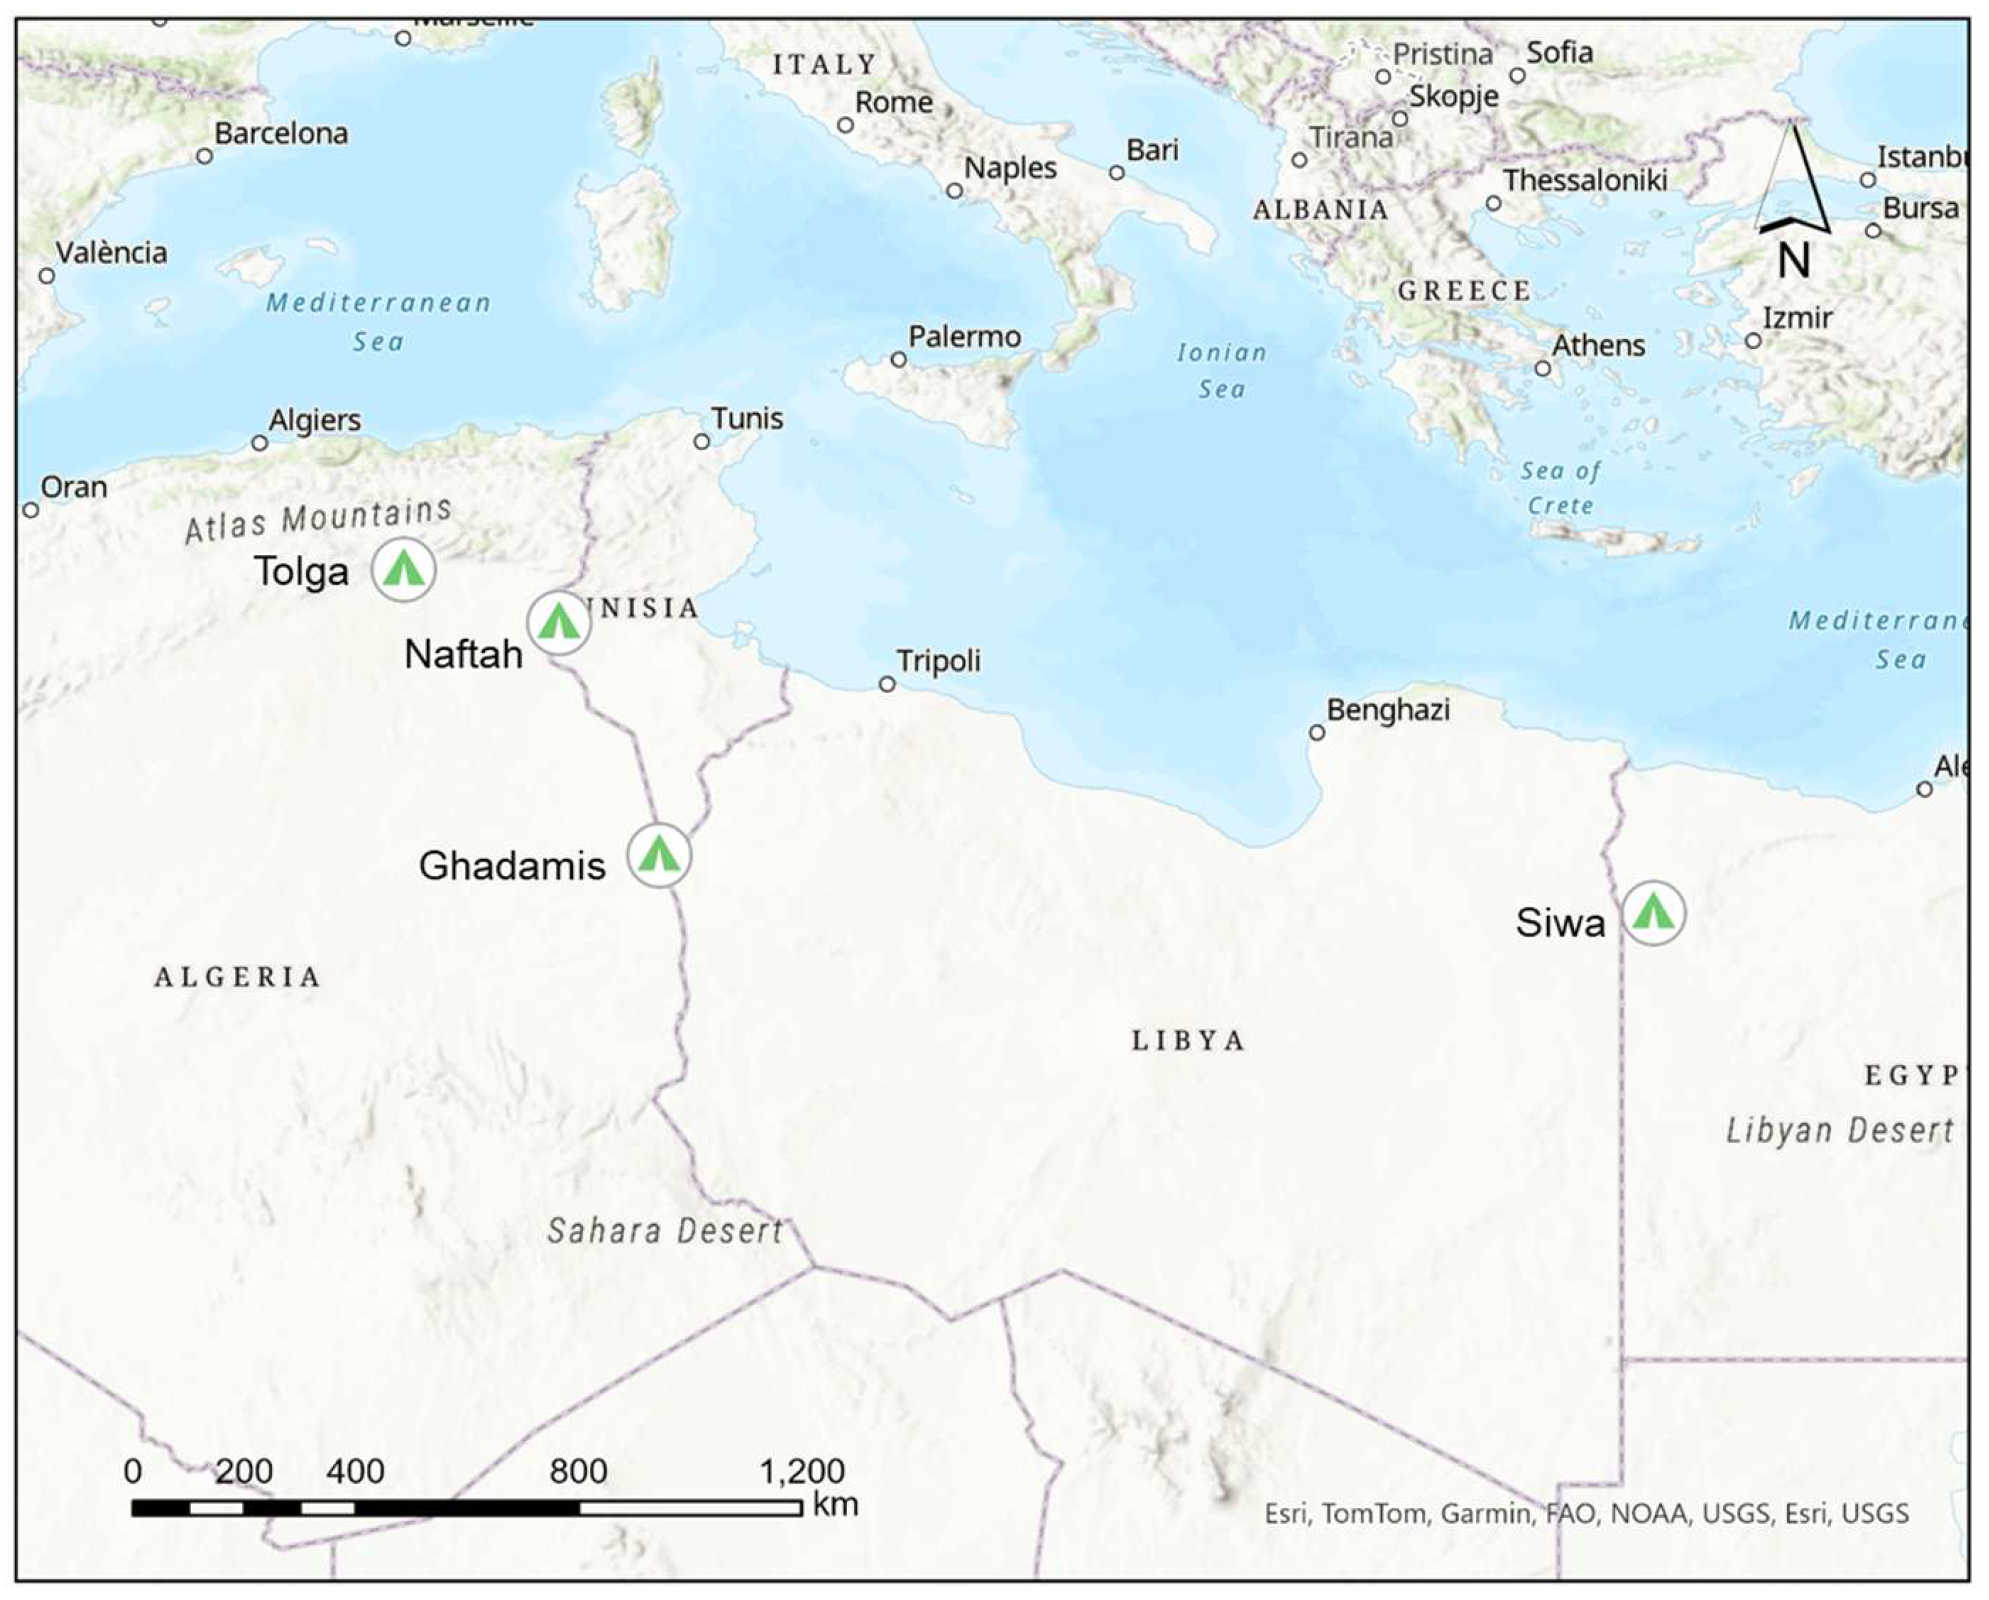
Figure 1. Location of the studied oasis.
Urbansci 09 00282 g001
Figure 2. Land cover changes in area between 2000 and 2023.
Urbansci 09 00282 g002
Figure 3. Rate of change (%) in land cover classes across the four oases between 2000 and 2023.
Urbansci 09 00282 g003
Figure 4. Temporal dynamics of land surface temperature (LST) in the studied oases (2000–2023).
Urbansci 09 00282 g004
Figure 5. Land cover and land surface temperature (LST) maps of the four oases for 2000 and 2023.
Urbansci 09 00282 g005
Figure 6. Zoom on representative vegetation patterns in the four oases. (A): Tolga (dense palm); (B): Nefta (dense palms and agricultural crops); (C): Ghadames (isolated palms with scattered agricultural plots); and (D): Siwa (palms combined with olives and vegetable crops).
Urbansci 09 00282 g006
Figure 7. Comparison of traditional and new urban fabrics in relation to LST distribution (2023).
Urbansci 09 00282 g007
Table 1. Key features of the selected oases and their relevance to this study.
FeatureDescription and Relevance to this Study
Climatic ContextAll selected oases lie in arid or semi-arid regions within the Sahara Desert, offering a coherent climatic setting to assess LST and land cover dynamics under extreme conditions.
Ecological and Agricultural ImportanceEach oasis is historically and ecologically significant, especially in terms of palm-based agriculture and localized biodiversity, making them critical for analyzing vegetation–temperature interactions.
Land Use Variation and Urban PressureThese oases represent different stages of urban growth and agricultural expansion, providing the diversity necessary for assessing land cover–LST relationships using NDVI and NDBI.
Environmental VulnerabilityAll oases are increasingly threatened by rising temperatures, desertification, and water scarcity, positioning them as priority zones for climate resilience analysis.
Satellite Data AvailabilityConsistent availability of cloud-free Landsat imagery across all sites ensures robust, standardized long-term analysis (2000–2023).
Topographic ConsistencyAll oases are located in relatively flat landscapes (with minimal elevation variation), reducing the impact of topography on LST measurements.
Table 2. Details of remote sensing images utilized in this study.
OasisYearLandsat SensorSpatial
Resolution (m)
Bands UsedCloud Cover (%)Acquisition Date
Tolga (Algeria)
(34.7225° N, 5.3783° E)
2000Landsat 7 ETM+30 (Reflective), 60 (Thermal)Band 6 (Thermal), Band 3 (Red), Band 4 (NIR)0.004 July 2000
2023Landsat 8 OLI/TIRS30 (Reflective), 100 (Thermal)Band 10 (Thermal), Band 5 (NIR), Band 4 (Red)0.0012 July 2023
Siwa (Egypt)
(29.2032° N, 25.5196° E)
2000Landsat 7 ETM+30 (Reflective), 60 (Thermal)Band 6 (Thermal), Band 3 (Red), Band 4 (NIR)0.0018 July 2000
2023Landsat 9 OLI/TIRS30 (Reflective), 100 (Thermal)Band 10 (Thermal), Band 5 (NIR), Band 4 (Red)0.0018 July 2023
Nefta (Tunisia)
(33.8736° N, 7.8780° E)
2000Landsat 7 ETM+30 (Reflective), 60 (Thermal)Band 6 (Thermal), Band 3 (Red), Band 4 (NIR)0.0022 July 2000
2023Landsat 9 OLI/TIRS30 (Reflective), 100 (Thermal)Band 10 (Thermal), Band 5 (NIR), Band 4 (Red)0.002023 July 22
Ghadames (Libya) (30.1333° N, 9.5000° E)2000Landsat 7 ETM+30 (Reflective), 60 (Thermal)Band 6 (Thermal), Band 3 (Red), Band 4 (NIR)0.0015 July 2000
2023Landsat 8 OLI/TIRS30 (Reflective), 100 (Thermal)Band 10 (Thermal), Band 5 (NIR), Band 4 (Red)0.0016 July 2023
Table 3. Key methodological steps, formulas, and tools used.
StepDescriptionFormula/Details
1. Radiance CalculationDN values from the thermal band were converted to radiance using metadata parameters.Lλ = ML · Qcal + AL [39]
ML: Radiance Mult Band,
AL: Radiance Add Band,
Qcal: DN values.
2. (BT)Radiance was converted to brightness temperature (Kelvin).BT = K2/ln ((K1/Lλ) + 1) [39]
K1, K2: Thermal constants (from metadata)
3. Proportion of Vegetation (Pv)Proportion of vegetation was derived from NDVI.Pv = ((NDVI − NDVImin)/(NDVImax − NDVImin))2 [66]
4. Emissivity (ϵ)Emissivity was computed based on Pv to account for surface properties.Landsat 7: Ev = 0.004⋅Pv + 0.986
Landsat 8, 9: Ev = 0.00149⋅Pv + 0.98481 (updated equation) [67]
5. LST CalculationLST was calculated from BT and emissivity.LST = BT/(1 + (λBT/ρ) ln(ϵ)) [61,63]
λ: Thermal band wavelength,
ρ = 1.438⋅10−2
6. NDVI CalculationNDVI was computed to assess vegetation density using the Red and NIR bands.NDVI = (NIR − Red)/(NIR + Red) [66]
Landsat 7: NIR (Band 4), Red (Band 3);
Landsat 8/9: NIR (Band 5), Red (Band 4).
7. NDBI CalculationNDBI was computed to identify built-up areas using the SWIR and NIR bands.
NDBI = (SWIR − NIR)/(SWIR + NIR) [38]
Landsat 7: SWIR (Band 5), NIR (Band 4);
Landsat 8/9: SWIR (Band 6), NIR (Band 5).
8. Land Cover ClassificationSupervised classification (Maximum Likelihood) [68] was employed to classify land cover types: urban, vegetation, and bare soil.
Table 4. Land cover classes and corresponding land use types.
ClassDescription
Built-up (Urban)Residential areas, settlements, industrial zones, commercial areas, and roads.
Bare Land (Bare Soil)Open spaces, barren soil, abandoned lands, and uncultivated areas.
VegetationPalm groves, crop fields, cultivated lands, fruit orchards, gardens, vegetative areas.
Table 5. Classification accuracies of land cover maps.
Oasis2000202320002023
Overall Accuracy (%)Kappa Coefficient
Tolga0.910.940.860.90
Nefta0.950.950.910.92
Ghadames0.930.950.850.90
Siwa0.950.910.930.87
Table 6. Correlation analysis between LST, NDVI, and NDBI for selected oases (2000 and 2023).
OasisYearLST-NDVI Correlation (r)Sig. (2-tailed)LST-NDBI Correlation (r)Sig. (2-tailed)
Tolga2000−0.931 **0.0000.850 **0.000
2023−0.838 **0.0000.858 **0.000
Ghadames2000−0.385 **0.0000.409 **0.000
2023−0.132 **0.0000.193 **0.000
Nefta2000−0.896 **0.0000.911 **0.000
2023−0.900 **0.0000.915 **0.000
Siwa2000−0.359 **0.0000.348 **0.000
2023−0.290 **0.0000.288 **0.000
** Correlation is significant at the 0.01 level (2-tailed).
Table 7. Results of multiple linear regression analysis for LST, NDVI, and NDBI.
OasisYearRR2Adjusted R2F-ValueSigNDVI
Coefficient (B)
NDVI
Sig
NDBI
Coefficient (B)
NDBI
Sig
Tolga
20230.860.740.742861.340.00−7.670.0015.340.00
20000.930.870.876514.500.00−23.320.002.060.00
Ghadames
20230.210.040.0440.760.005.020.000.830.23
20000.440.190.19211.080.00−4.370.007.920.00
Nefta
20230.920.840.845085.920.002.160.0821.060.00
20000.910.830.834839.490.002.570.0014.800.00
Siwa
20230.850.720.722517.630.0020.660.0043.040.00
20000.360.130.13144.490.00−1.580.00−11.160.00
Table 8. Comparative summary of demographic change, land cover dynamics, vegetation patterns, and thermal trends in four North African oases (2000 to 2023).
Criterion (2000–2023)TolgaNeftaGhadamesSiwa
Population change (%)+43.50+8.60+27.40+60.60
Built-up area change (%)+29.07+19.12+48.46+136.01
Vegetation cover change (%)−0.26+3.6+82.00+27.17
Bare-soil change (%)−23.87−6.51−24.44−48.10
Mean LST rise (°C)+0.24+12.4+4.22+0.65
Representative Vegetation PatternsDense palmDense palms and agricultural cropsIsolated palms with scattered agricultural plotsPalms combined with olives and vegetable crops
Table 9. LST 2023 comparison of traditional vs. modern urban fabric.
OasisLST Moyenne Tissu Traditionnel (°C)LST Moyenne Extension Moderne (°C)ΔLST (°C)
MinMaxmoyenneMinMaxmoyenne
Tolga33.6343.2738.8036.2846.5541.302.5
Nefta42.0647.8545.0746.6049.6147.122.05
Ghadames42.2145.6943.5543.6647.0245.251.7
Siwa///////
Disclaimer/Publisher’s Note: The statements, opinions and data contained in all publications are solely those of the individual author(s) and contributor(s) and not of MDPI and/or the editor(s). MDPI and/or the editor(s) disclaim responsibility for any injury to people or property resulting from any ideas, methods, instructions or products referred to in the content.