Article

Multimodal Deep Learning Framework for Profiling Socio-Economic Indicators and Public Health Determinants in Urban Environments


1
Department of Computer Science, School of Information Communication Technology, College of Science and Technology, University of Rwanda, Kigali P.O. Box 4285, Rwanda
2
Research and Innovation Center, African Institute for Mathematical Sciences (AIMS), Kigali P.O. Box 6428, Rwanda
3
Department of Spatial Planning, School of Architecture and Built Environment, College of Science and Technology, University of Rwanda, Kigali P.O. Box 3900, Rwanda
4
African Center of Excellence in Internet of Things (ACEIoT), College of Science and Technology, University of Rwanda, Kigali P.O. Box 3900, Rwanda
*
Author to whom correspondence should be addressed.
Urban Sci. 2026, 10(4), 177; https://doi.org/10.3390/urbansci10040177
Submission received: 23 December 2025 / Revised: 9 February 2026 / Accepted: 6 March 2026 / Published: 25 March 2026
(This article belongs to the Topic Geospatial AI: Systems, Model, Methods, and Applications)

Abstract

Urbanization significantly enhances socio-economic conditions, health, and well-being for many by improving access to services, education, and economic opportunities. However, socio-economic and public health disparities are also being exacerbated by urbanization. The reliable data required to monitor these conditions are often unavailable, outdated, or inconsistent. This study introduces a multimodal deep learning framework that integrates satellite imagery with street network datasets to predict urban socio-economic indicators and public health determinants at the sector level as a political administrative unit of public health planning in Rwanda. We extracted latent visual and topological embeddings of the urban built environment, using a Convolutional Neural Network (CNN) and Graph Neural Network (GNN). These embeddings were fused through an attentional mechanism to train a multi-task regression model that simultaneously predicts multiple socio-economic indicators and public health determinants. This framework was applied to the City of Kigali in Rwanda. Overall, the multimodal fusion model achieved the best average performance across targets, with an average correlation of 0.68 and MAE of 1.26 for socio-economic indicators, and 0.68 and 1.46 for public health determinants, demonstrating the benefit of integrating visual and topological information. The learned fused embedding space arranges socio-economic indicators and public health determinant deciles along a continuous morphological gradient from sparsely built rural settings to dense urban settings, demonstrating that the urban form encodes latent signals that capture socio-economic indicators and health determinants. Moreover, the study reveals a strong relationship between socio-economic indicators and the public health index, with education, cooking materials, and floor materials exhibiting a correlation above 0.96. This work demonstrates the utility of an integrated framework for socio-economic indicator profiling and public health planning in data-scarce urban contexts, offering a scalable approach for monitoring the indicators of Sustainable Development Goals in rapidly changing urban environments.

1. Introduction

The current trend of urbanization is enhancing the socio-economic conditions, health, and general well-being of urban residents [1,2]. However, urbanization also poses significant socio-economic and health challenges, including social exclusion of the poor dwellers, insecurity, diseases, and an inadequate sanitation environment [3,4]. These challenges induce inequalities [5] and expose vulnerable urban dwellers to socio-economic and health challenges [4,6]. These challenges are particularly severe in the global south, where governments often lack resources to implement urbanization policies and strategies that improve the well-being of urban dwellers [7]. Addressing these challenges has been at the forefront of the Sustainable Development Goals (SDGs): specifically, goal 11 on sustainable settlements and cities, and its target 11.3, which attempts to improve inclusive and sustainable urbanization [8]. These challenges also increase the need to monitor sustainable urban development while ensuring the protection and improvement of well-being [9,10].
More accurate data and insights are needed to support and make comprehensive, informed policy decisions to address urbanization challenges. There is a need for reliable and updated information regarding urban conditions, as it is critical for effective management and monitoring. In addition, cities need structured methods to collect and analyze data into insights that are necessary for policies and actions [11,12]. These are data and information which are essential for understanding urbanization patterns for profiling urban socio-economic indicators and public health determinants. This requires integrated data and methods that make it possible to holistically comprehend the urban socio-economic environment, public health, and their complex interrelations. By leveraging data, policymakers can create an inclusive, sustainable, and healthy urban environment that caters to the needs of all residents through ensuring that resources are efficiently allocated, interventions are targeted effectively, and urban development promotes both socio-economic well-being and public health [11]. The available data are often obtained through censuses, surveys, health information systems, and administrative records. However, obtaining these data is costly, time-consuming, and complex, usually leading to the data being absent, incomplete, or outdated [13].
Moreover, variability in data collection methods, inconsistency in spatial resolution, limited temporal coverage, and difference in definitions across various regions and disciplines hinder their usage [14]. Thus, robust socio-economic and public health data, which are critical for identifying needs, planning interventions, monitoring progress, and evaluating impacts, are missing. Emerging technologies like satellite imagery and machine learning provide promising solutions to data-related problems. Satellite imagery provides large-scale data on housing conditions, infrastructure, and environmental factors [15,16,17,18], offering a cost-effective and scalable data source for monitoring urban development and living conditions.
In this study, the city is considered as a complex urban system where socio-economic, health and environmental processes interact, as depicted in [1,19]. Accordingly, the study introduces a multimodal deep learning framework that integrates high-resolution satellite imagery and street network data to model urban socio-economic indicators and public health determinants in data-scarce environments. By combining visual and topological information, the framework captures the complex interactions underlying urban inequalities and provides interpretable, actionable insights for profiling urban socio-economic and health conditions. This approach not only addresses the challenges of limited and inconsistent urban data but also enables the quantification, monitoring, and modeling of urban dynamics to inform evidence-based planning and policy. We demonstrate the applicability of the framework in Kigali, Rwanda, a rapidly urbanizing city in the global south.

2. Related Works

The combination of satellite imagery and machine learning models has created a new opportunity for the extraction of insights at a large scale. For instance, Yeh et al. [20], in their breakthrough study, utilized CNN to measure asset wealth across Africa by analyzing multispectral satellite images. Their model demonstrated high accuracy, capturing 70% of the wealth variation, as validated against ground-based data. Li et al. [21] proposed an approach for predicting various socio-economic indicators, including population and consumption, utilizing street view and satellite imagery, which outperformed baseline models in accuracy by over 10%. Castro and Álvarez [22] estimated parameters like average income, Gross Domestic Product (GDP) per capita, and water index for Brasilia at the city level, using transfer learning on both day- and nighttime satellite imageries, with a 64% prediction accuracy. A study by Jean et al. [23] proposed a deep neural network model-based approach that estimates poverty levels in Sub-Saharan countries using day- and nighttime satellite imageries. It establishes a relationship between the image characteristics and economic conditions, emphasizing areas that are illuminated as important indicators.
Satellite imagery can also be integrated with diverse datasets, offering a holistic view of socio-economic and health conditions. For instance, Liu et al. [24] proposed a machine learning-based approach that used satellite images, street-view images, and street networks to predict the population, education, crime, and other economic activities. Their model demonstrated a superior performance, with 30% improvements compared to the baseline models. Xi et al. [25] applied satellite images, points of interest, and an unsupervised learning model to predict indicators such as the population and number of takeaway orders. Their model was able to estimate socio-economic indicators with an R2 of 0.874. Fan et al. [26] applied street view images to model and measure travel behavior at 83%, crime occurrence at 64%, and 68% of the population lacking physical activities at their variations. Chong et al. [27] extracted information on various amenities from open points of interest to predict the mobility and economic productivity. The above studies, alongside the existing studies, leverage satellite images and machine learning to enable large-scale monitoring of urban socio-economic conditions. However, limitations persist in modeling complex urban environments in most of the global south at a fine spatial scale due to sparse and outdated data [13]. The existing studies are rooted in unimodal learning frameworks, where a single data modality, satellite imagery, is used to capture specific urban features such as population [28,29], urbanization [30], poverty and well-being [17,20], and disparities [31]. While they were proven to be effective for capturing specific urban features, they are limited in their abilities to represent the complex multidimensional nature of the urban environment holistically, since they cannot learn and integrate more socio-economic indicators and public health determinants [32]. In addition, quantitative assessment of how socio-economic well-being influences public health is often ignored. Prior studies treat socio-economic modeling and public health analysis as separate modeling tasks, rather than integrating them into a cohesive modeling framework. This results in a critical gap and limits the actionable value of current integrated urban planning, health equity, and policy interventions [4,32].

3. Socio-Economic Indicators, Public Health Determinants and Their Associations

Socio-economic indicators and public health determinants evolve from socio-economic development and public health, which are two distinct yet interrelated fields [33]. On one side, socio-economic development involves enhancing quality of life by addressing various indicators such as education, employment, income, housing, and access to clean energy [33,34,35,36]. It strives toward improved living standards, reduced poverty and inequality, and enhanced social inclusion and cohesion, as well as promoting sustainable economic growth. For instance, high employment rates reflect economic stability and job opportunities and suggest a thriving economy, which is a critical factor influencing an individual’s quality of life and economic well-being [37]. Educational attainment is another crucial indicator, whereby it plays a significant role in social and economic development by enhancing individuals’ skills and knowledge, which, in turn, contributes to better job prospects, higher incomes, and social stability [38]. Housing conditions, including the type and quality of housing and ownership status, are essential for understanding living standards in urban areas whereby adequate housing reduces exposure to environmental hazards and improves mental and physical health [39,40]. Access to clean cooking fuels reflects the reduced indoor air pollution, which is linked to respiratory diseases, which is crucial for reducing health issues related to smoke and toxins from solid fuels [41].
On the other side, public health aims to reduce health disparities and enhance the quality of healthcare services, targeting entire populations rather than individuals [42]. While public health is observed by considering outcomes, such as life expectancy, mortality rates and disease prevalence, public health determinants consider conditions or factors that influence these outcomes, and include determinants such as sanitation and water access, health insurance coverage and disease prevalence [31,34]. For instance, access to improved sanitation facilities and safe drinking water is critical for maintaining public health and is essential for preventing waterborne diseases such as cholera, typhoid, and hepatitis, and promoting hygiene [43]. Health insurance coverage is a crucial indicator of public health, as it reflects the population’s ability to access medical services without facing financial hardship. Higher health insurance coverage rates indicate better access to healthcare services, which can lead to improved health outcomes [44]. Disease prevalence measures the number of cases of a particular disease present in a population at a given time [45]. Focusing on malaria, this indicator provides insights into the health challenges faced by urban populations, especially in regions where malaria is endemic. Malaria is a significant public health concern, particularly in regions where high malaria prevalence requires targeted interventions to control and reduce the disease burden [46].
While socio-economic development and public health have distinct goals and components, they are highly interconnected and understanding their associations is crucial for designing policies that improve both fields simultaneously, as shown by several studies [34,47,48,49,50]. For instance, higher employment rates lead to better income and job security, contributing to better health outcomes because employed individuals are more likely to afford healthcare, live in healthier environments, and experience lower stress levels [37]. Similarly, higher educational attainment is linked to better health literacy and healthier lifestyle choices, as educated individuals are more likely to understand health information, engage in preventive care, and have lower rates of chronic diseases [38]. Quality housing prevents overcrowding, reduces exposure to pollutants, and provides a stable environment that is conducive to good health. Urban poor communities are disproportionately exposed to health risks, due to the lack of proper infrastructure and poor access to healthcare, information and knowledge networks [39]. Furthermore, access to clean cooking fuels reduces indoor air pollution, leading to lower respiratory diseases [41].

4. Materials and Methods

4.1. Study Area

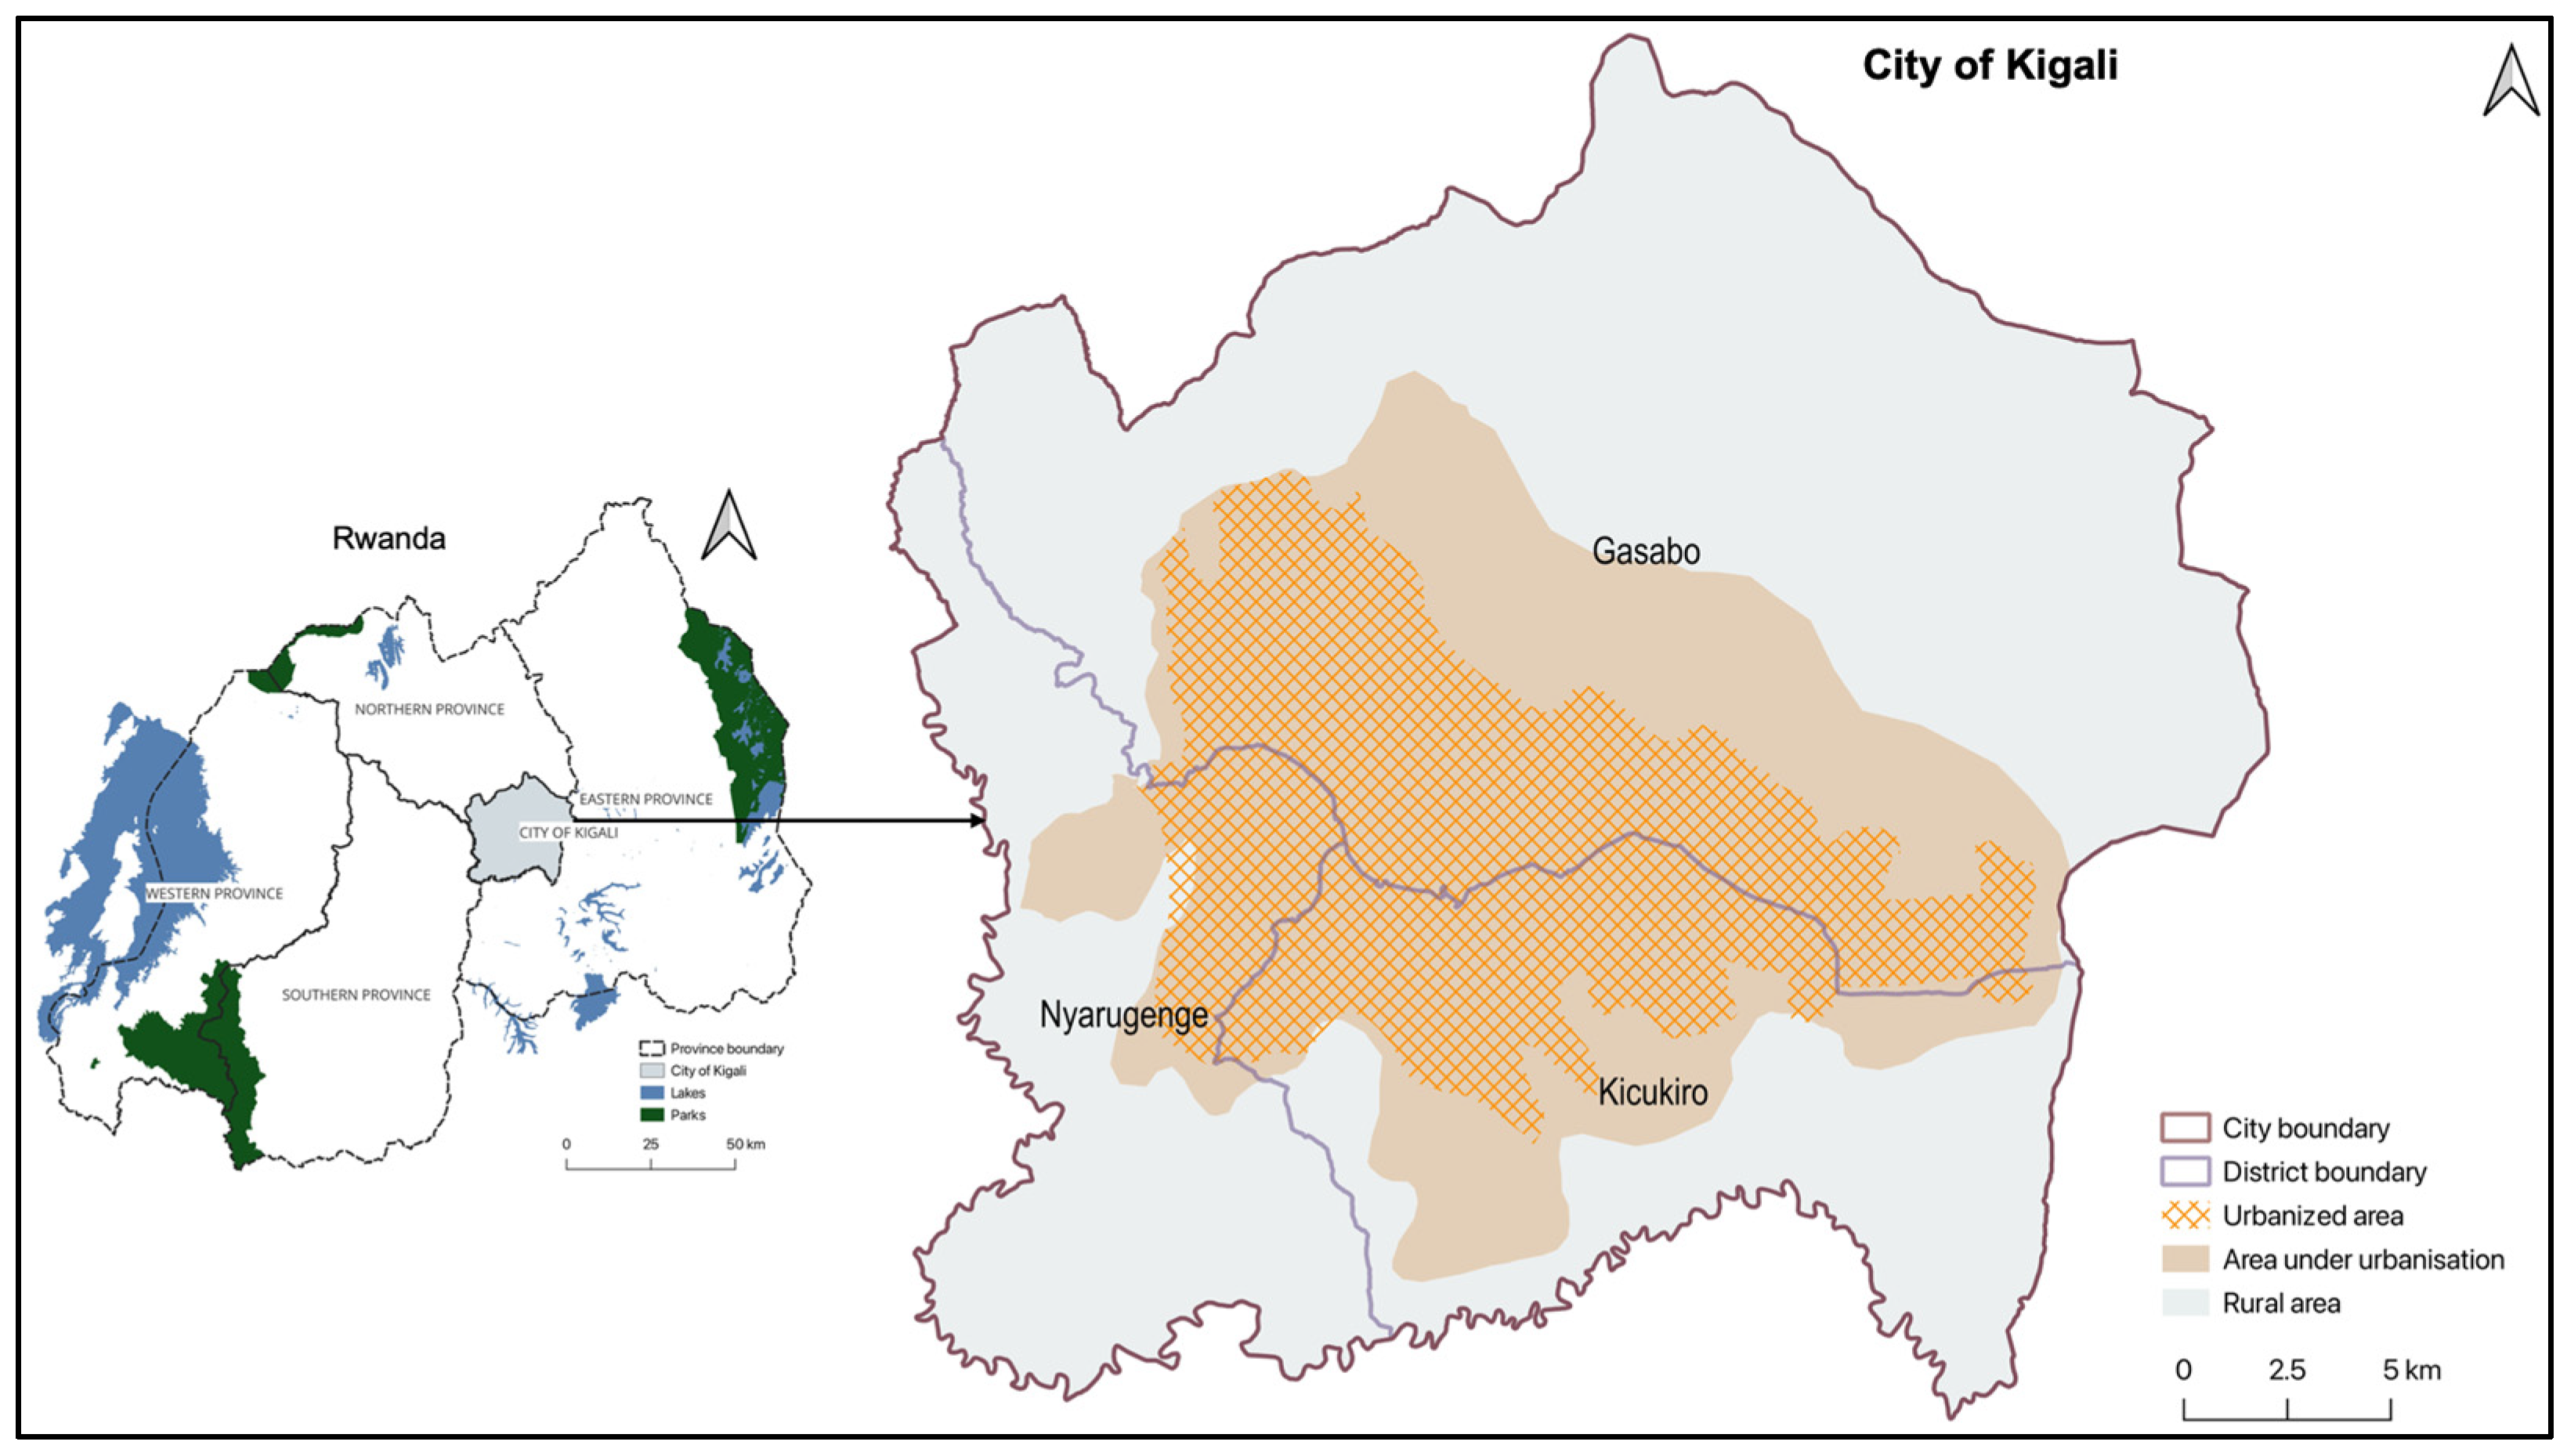
The study proposed, tested and evaluated a framework for profiling socio-economic indicators and public health determinants. Testing and evaluation of the framework was done based on Kigali, Rwanda’s capital and largest city. Kigali occupies an area of around 730 km2 and is home to roughly 1.7 million people [51]. The city consists of 3 administrative districts, Gasabo, Kicukiro and Nyarugenge, comprising urbanized areas and areas under urbanization, which are all surrounded by rural areas (See Figure 1). The city’s urbanized areas and areas under urbanization are characterized by a blend of planned neighborhoods, transitional mixed neighborhoods, and informal settlements [52,53,54]. Transitional mixed neighborhoods are made of a mixture of both planned and informal settlements, and are created by growing planned communities or progressively enhancing informal settlements. Informal settlements are made of cramped and tiny housing units that lack proper access to urban facilities and services. Planned neighborhoods exhibit well-planned road systems and enhanced access to urban facilities and services. In addition, the City of Kigali presents a significant number of inadequate high-density informal settlement areas, which make up 60% of residential buildings [55,56,57].

4.2. Proposed Framework for Urban Socio-Economic and Public Health Profiling

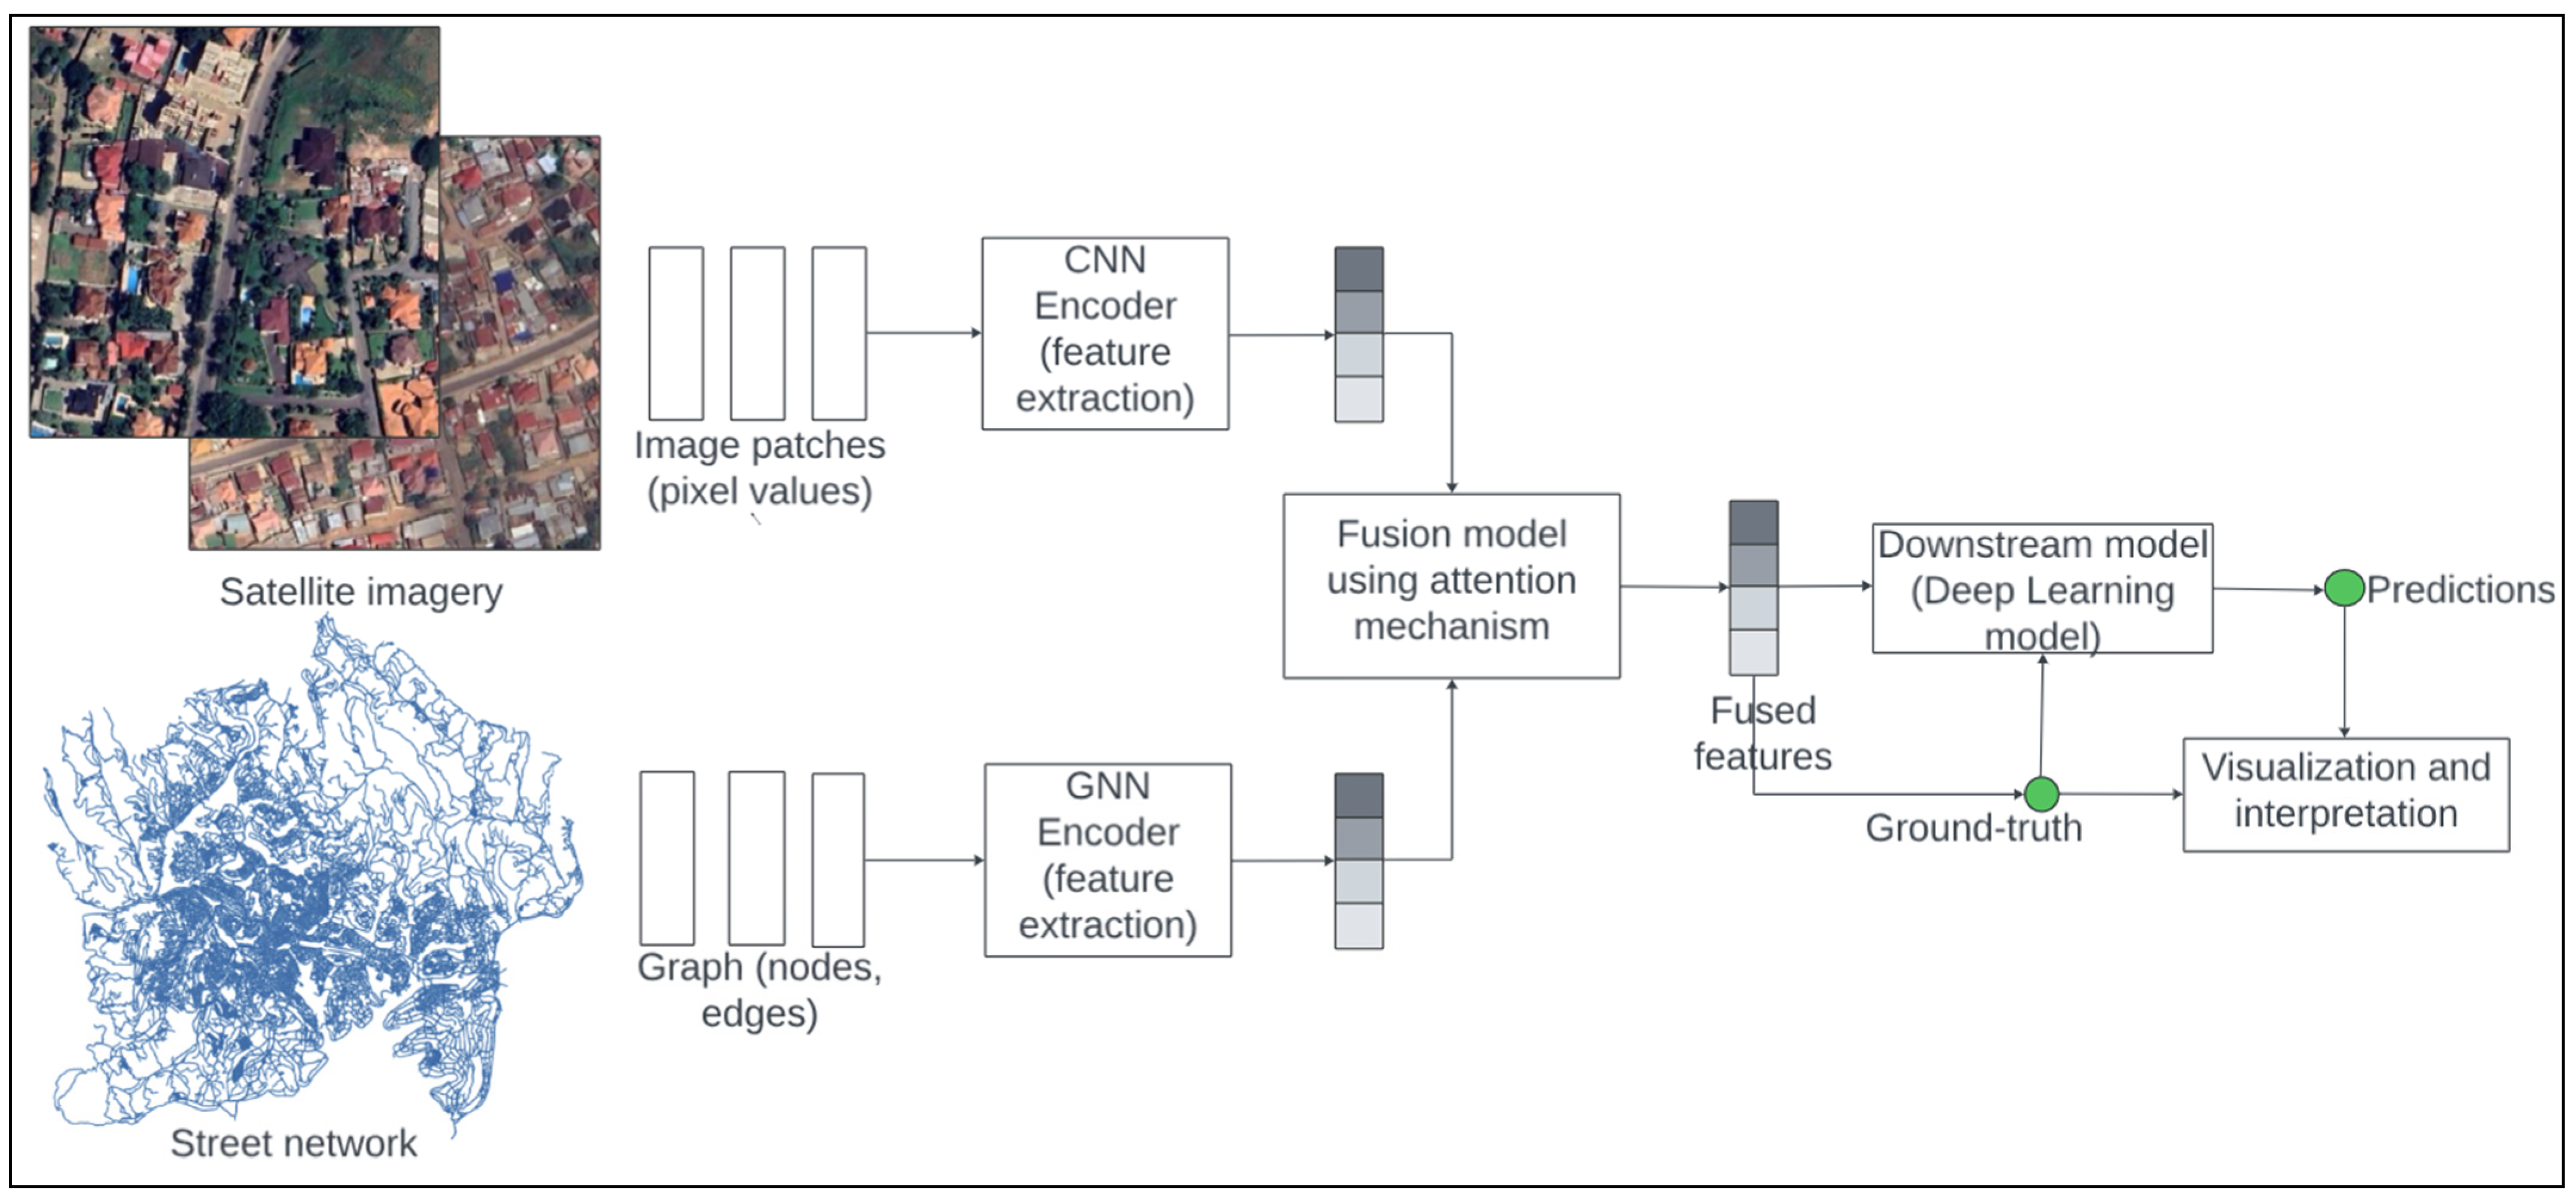
Building upon a review of recent studies in earth observation, computer vision, spatial graph learning, and urban analytics, we proposed a multimodal and multi-model deep learning framework (illustrated in Figure 2) for profiling socio-economic indicators and public health in data-scarce urban environments [17,20,23,39,50,58,59,60,61,62,63]. The framework explores and integrates the complementary strengths of satellite imagery and street network data. The satellite imagery is processed through a CNN [64] encoder to capture morphological and visual cues from the built urban environment, such as settlement density, rooftop texture, and neighborhood structure [20,31,65]. The street network, represented as graphs of nodes and edges, is processed through GNN [66] encoder to learn the latent topological features that reflect street connectivity, spatial accessibility, and urban movement [67,68,69,70,71]. All learned embeddings are fused using an attention-based mechanism, which adaptively learns the relative importance of each modality during joint encoding [72]. The resulting multimodal embeddings are passed into a downstream feedforward neural network (MLP) to perform multi-target regression on urban socio-economic indicators and public health determinants. In addition, the framework features interpretation and visualization that assess associations between socio-economic indicators and public health determinants (see details in Section 4.6).

4.3. Data

The study used high-resolution optical satellite imagery and street networks to train the foundational models. The spatial resolution of the used imagery was 0.5 m, allowing for the capture of urban surface details. It was acquired from the Rwanda National Land Authority. The imagery was composed of three spectral bands corresponding to the visible spectrum: red, green, and blue. It was sliced into a fixed size of 512 × 512 pixels, equivalent to about 256 × 256 m on the ground. This patch size allowed for easily identifying visual features such as buildings, roads, and capturing their surrounding environment. Street network datasets were obtained from OpenStreetMap (OSM), https://www.openstreetmap.org/ (accessed on 22 June 2024). OSM is a global open-source database that maps the world’s geographical features using volunteers [62]. The street network was used to capture additional human factors, such as connectivity, which might not be fully captured by satellite imagery. In addition, the study used nine socio-economic indicators and six public health determinants from the 2022 national population census data available from the National Institute of Statistics of Rwanda [51]. They were available at a sector level for a sampled population of 10% of the entire population of Kigali, which is 1.7 million inhabitants. The socio-economic indicators used in this study are: education, school attendance, employment, occupation, urbanization, floor materials, wall material, cooking energy, and tenure type. At the same time, public health determinants were health insurance, access to drinking water, access to water for general usage, sewage mode, toilet facilities, and waste disposal. Detailed information on each socio-economic indicator and public health determinant is presented in Appendix A.1.

4.3.1. Satellite Image Data Preparation

A total of 10,236 satellite image patches, each representing a distinct area, were used in this study, covering all 35 administrative sectors of the City of Kigali. This total was obtained after a preliminary analysis through which patches overlapping more than one sector were removed. These patches were then labeled based on socio-economic indicators and public health determinant data. For each indicator and determinant, we computed its proportion to obtain the continuous scores, based on the available data per sector. We then transformed these continuous scores into deciles to enable standardized comparisons. The deciles rank each sector on a scale of 1–10, indicating the worst-off to better-off socio-economic indicators and public health determinants. Following Suel et al. [49] and Yeh et al. [20], deciles were used to standardize heterogeneous socio-economic and public health indicators, reduce sensitivity to extreme values, and allow comparisons across variables with different units. Although deciles are ordinal, they were treated as approximately continuous, because the ten-level scale provides sufficient granularity to model gradual socio-economic and public health gradients, enabling the regression models to capture the relative differences between sectors while preserving their ranking, rather than their class boundaries.
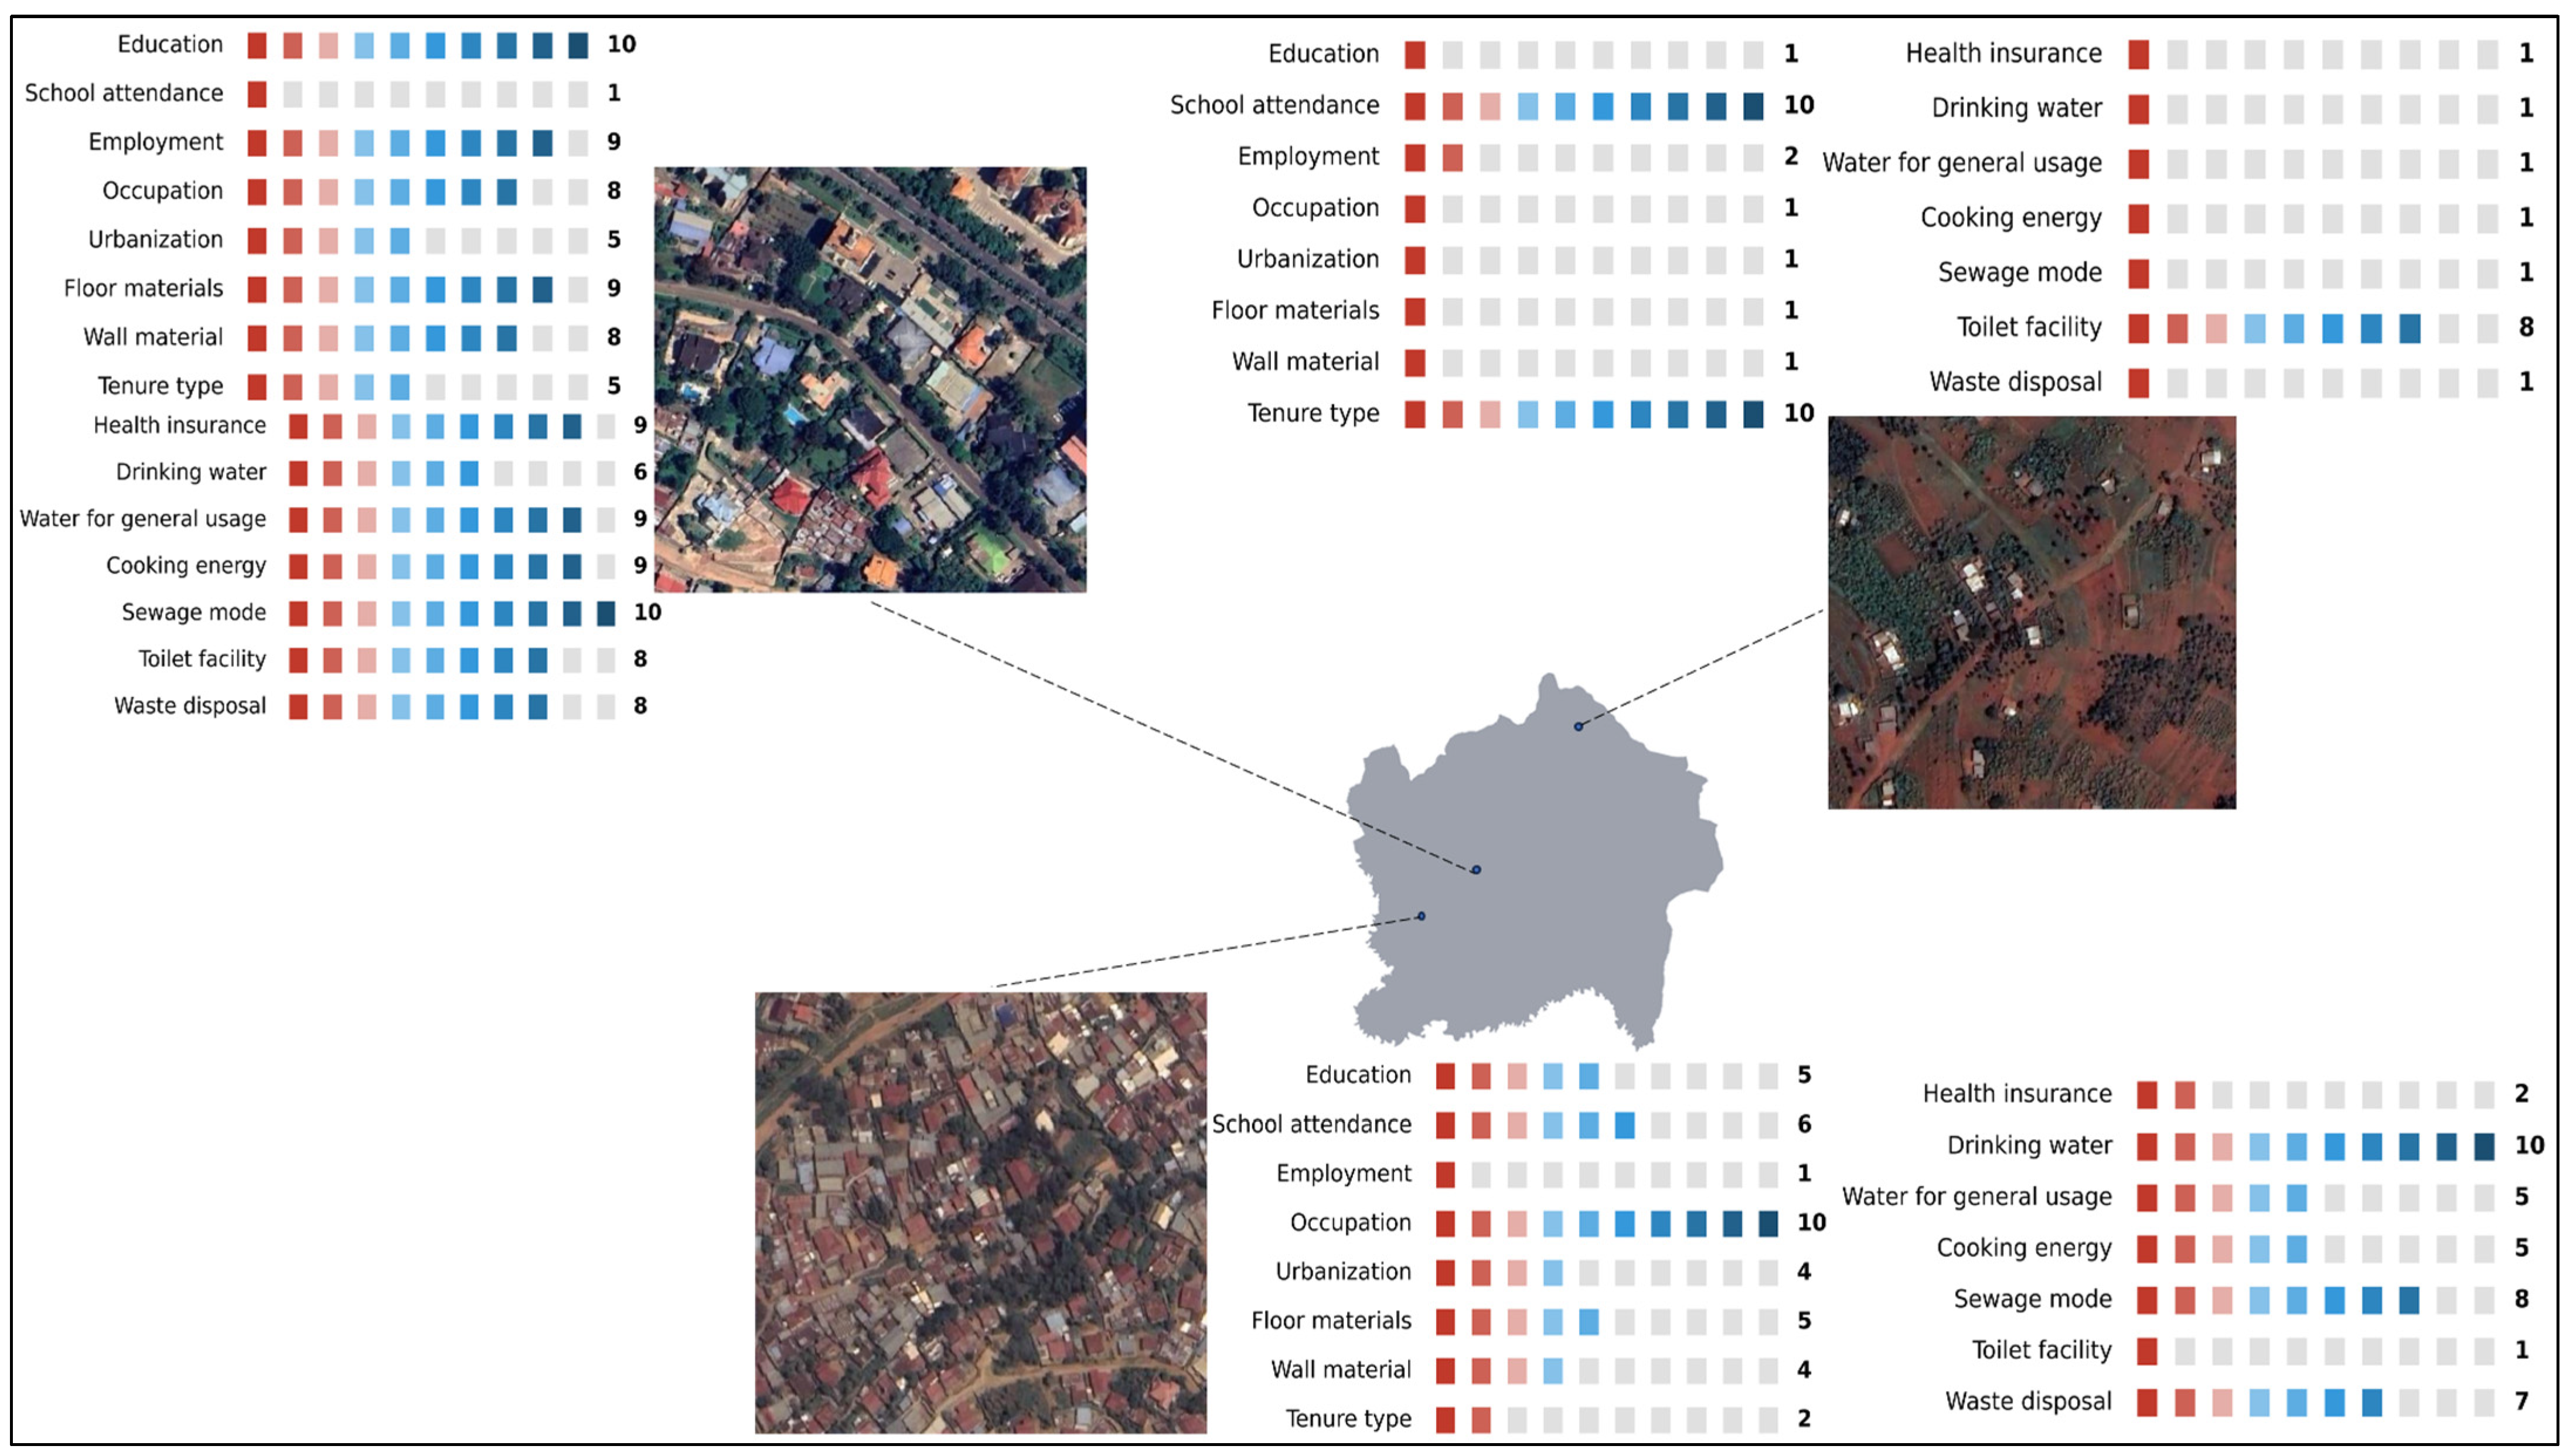
Therefore, systematic labeling was applied to associate satellite image patches with sector-level deciles of socio-economic indicators and public health determinants. For each image patch whose centroid fell within a sector boundary, a corresponding label was assigned using non-geometric attributes (e.g., deciles of education, employment, water access). A visualization was implemented to display the image patch and a stacked bar of decile scores across all the outcomes to qualitatively inspect the distribution of socio-economic indicators and public health determinants at the image level. Figure 3 illustrates a sample of image patches alongside the labels.

4.3.2. Street Network Data Preparation

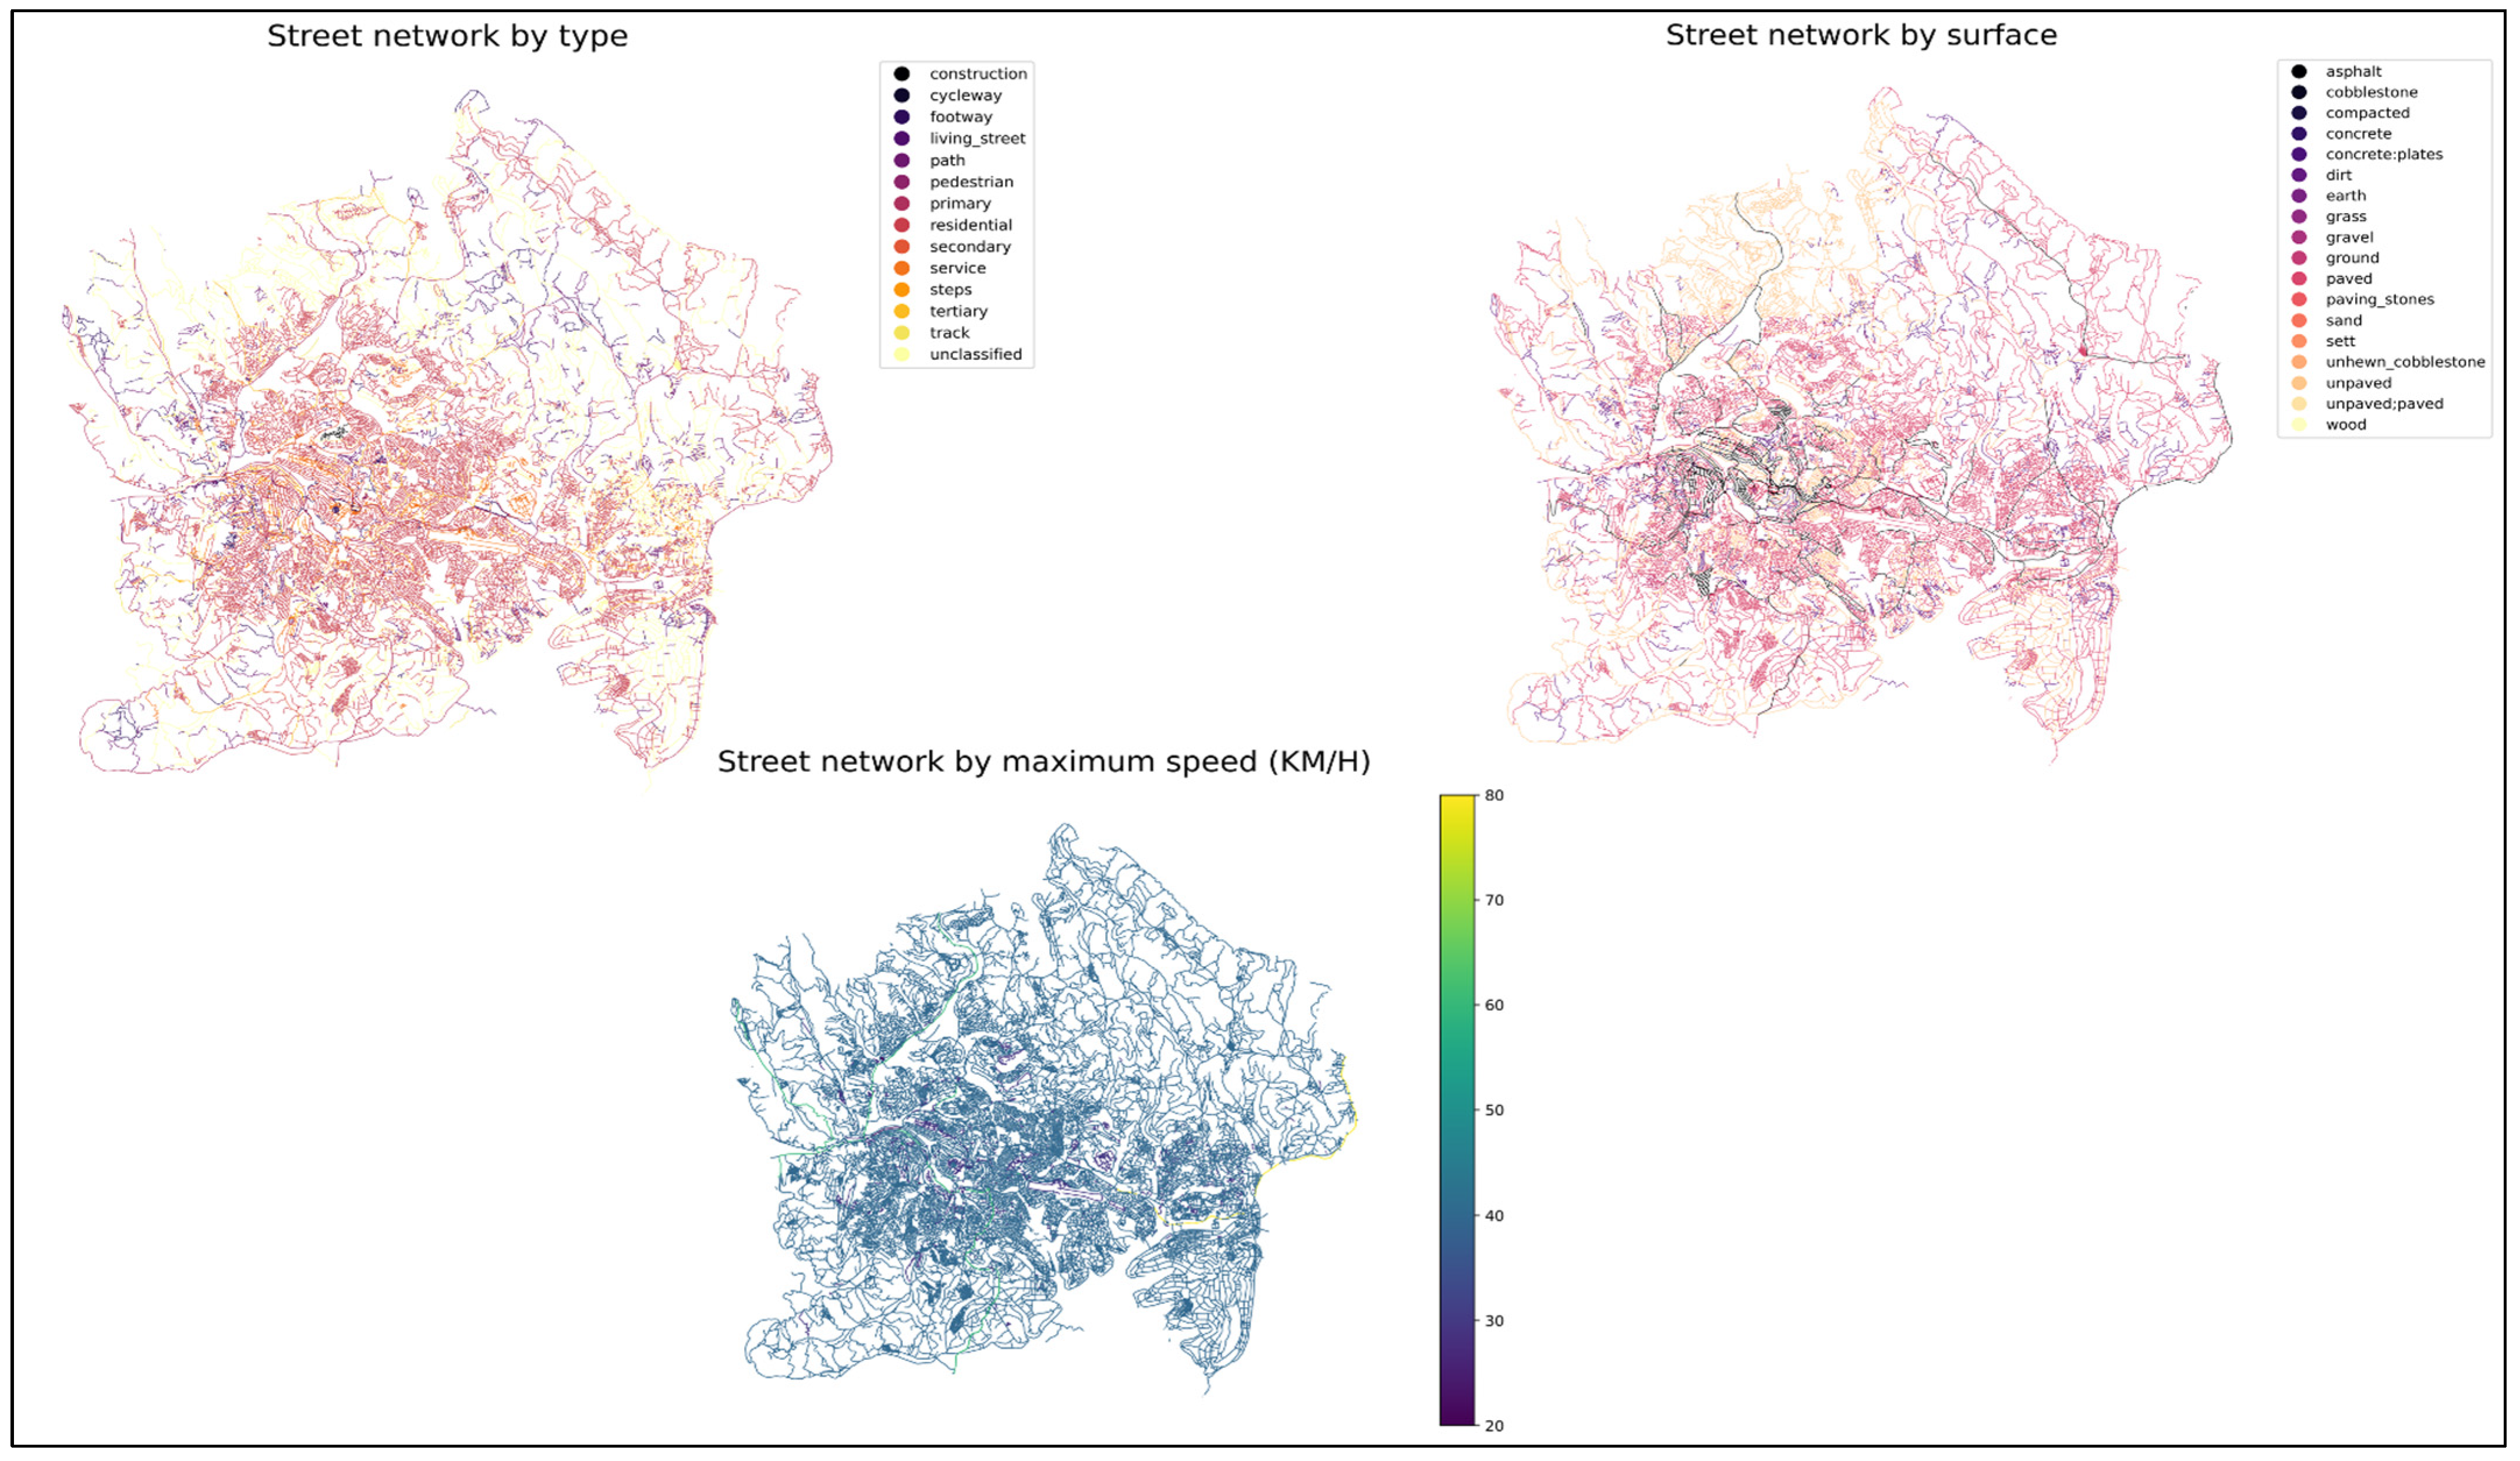
The street network dataset was interpreted based on its structure as a graph, where each road junction is represented by a node, and nodes are connected by their edges as a road segment. The street network dataset has attributes including length, speed limit, surface type, and functional class [62]. Figure 4 illustrates the road type, surface type, and maximum speed for the street network.
We applied a graph-based learning pipeline [66,67] integrating geospatial street network features (attributes) with census-derived socio-economic and health outcomes. The street network dataset was split based on the size of the image patch, whereby each was considered as a patch-specific graph. Thus, we have 10,236 subgraphs corresponding to the total number of image patches. Categorical variables (network type and surface) were encoded using one-hot encoding, and the continuous variable (maximum speed) was normalized using min–max normalization before aggregation into patch-specific graphs. The min–max normalization is among the greatest normalization techniques that have been found to enhance model performance by applying linear transformation of input data to generate a balance of value comparisons between data before and after the process [73,74]. Each patch-specific graph was represented as a sub-graph G = (V, E), where V represents street segments as nodes and E encodes topological and semantic relationships among segments (e.g., connectivity, intersection). Each node V i V was associated with a feature vector x i ∈ Rd capturing encoded attributes such as type and surface type, linked to patch-level target vectors containing socio-economic indicators and public health determinants.

4.4. Extraction of Embeddings

The extraction of embeddings followed a developed deep learning pipeline. To extract embeddings from satellite imagery, each image patch was resized to 224 × 224 pixels ( X i ∈ R224×224) and served as an input to a CNN, which was trained to predict a vector of socio-economic indicators and public health determinants. We used a pretrained ResNet50 model that was trained on over 1.3 million ImageNet images [75] as a CNN feature extractor. We used global average pooling followed by a fully connected layer of 256 units with a rectified linear unit (ReLU) activation and a dropout rate of 0.3 to extracted 256-unit dimensions. This set-up enabled the model to distinguish high-dimensional visual information into a lower-dimensional embedding space that retains relevant spatial patterns that are important for downstream applications. This task was accomplished as a multi-output regression problem, enabling the model to jointly predict multiple dimensions of urban socio-economic indicators and public health determinants simultaneously. Given a training set of N-labeled image patches with corresponding decile targets y i ∈ [1, 10]T, training was performed using the Adam optimizer with a batch size of 32, and we optimized the mean squared error, due to its robustness to outliers [76], across all outputs using a loss function defined in Equation (1), as in Brooks [77]:
L θ = 1 N i = 1 N | | y i     f θ ( x i ) | | 2 2
where f θ denotes the CNN parameterized by weights θ mapping input x i   to the final predicted outputs y i ; x i   is the input, y i   are decile targets in T dimensions for sample i, and the norm sums square differences over all T output dimensions. We extracted intermediate semantic embeddings from the trained CNN to support multimodal learning. Specifically, the output from the final dense layer prior to regression, z i     R 256 ,   was used as the embedding of the 256 dimension for each image patch, as captured in Equation (2):
z i =   g θ ( X i )
where g θ denotes the CNN up to the last dense layer before the regression output.
We also extracted embeddings from the street network. We used two Graph Convolutional Network (GCN) layers, followed by a global mean pooling operator and a fully connected output layer. Each GCN layer used 32 hidden channels with ReLU activation. The applied GCN is an extended version of ordinal CNN for graph processing [69], where the feature propagation at each layer follows the rule, as depicted in Equation (3):
H ( l + 1 ) =   δ ( D 1 2 A D 1 / 2 H ( l ) W ( l ) )
where A′ = A + I is the adjacency matrix with self-loops, D′ is the corresponding degree matrix of A′, W(l) is a learnable weight matrix at layer l, H(l) is the input node feature matrix to layer l, and δ (⋅) denotes a ReLU activation. At each layer, node features are updated by aggregating information from neighboring nodes, applying a linear transformation, and passing the result through the non-linear activation, yielding embeddings that capture both the local topological structure and node attributes.
The model was trained using the Adam optimizer, with a learning rate of 0.01 and mean squared error (MSE) loss, following Equation (1). After model training, we extracted 32-dimensional graph-level embeddings z r R k   by modifying the forward pass to return pooled node features, rather than decile prediction outputs. This was obtained by taking the feature matrix at the final layer of GCN, H(l) = [ h 1 ,   h 1 ,   ,   h N ] T, and applying a global mean pooling operation to form a single vector representing the whole graph, z r . Therefore, from Equation (3), the final overall embeddings, z r , are given by Equation (4):
z r =   1 | V |   v i V h i
where V is the number of nodes and z r is used as the embedding for downstream tasks.

4.5. Fusion of Embeddings

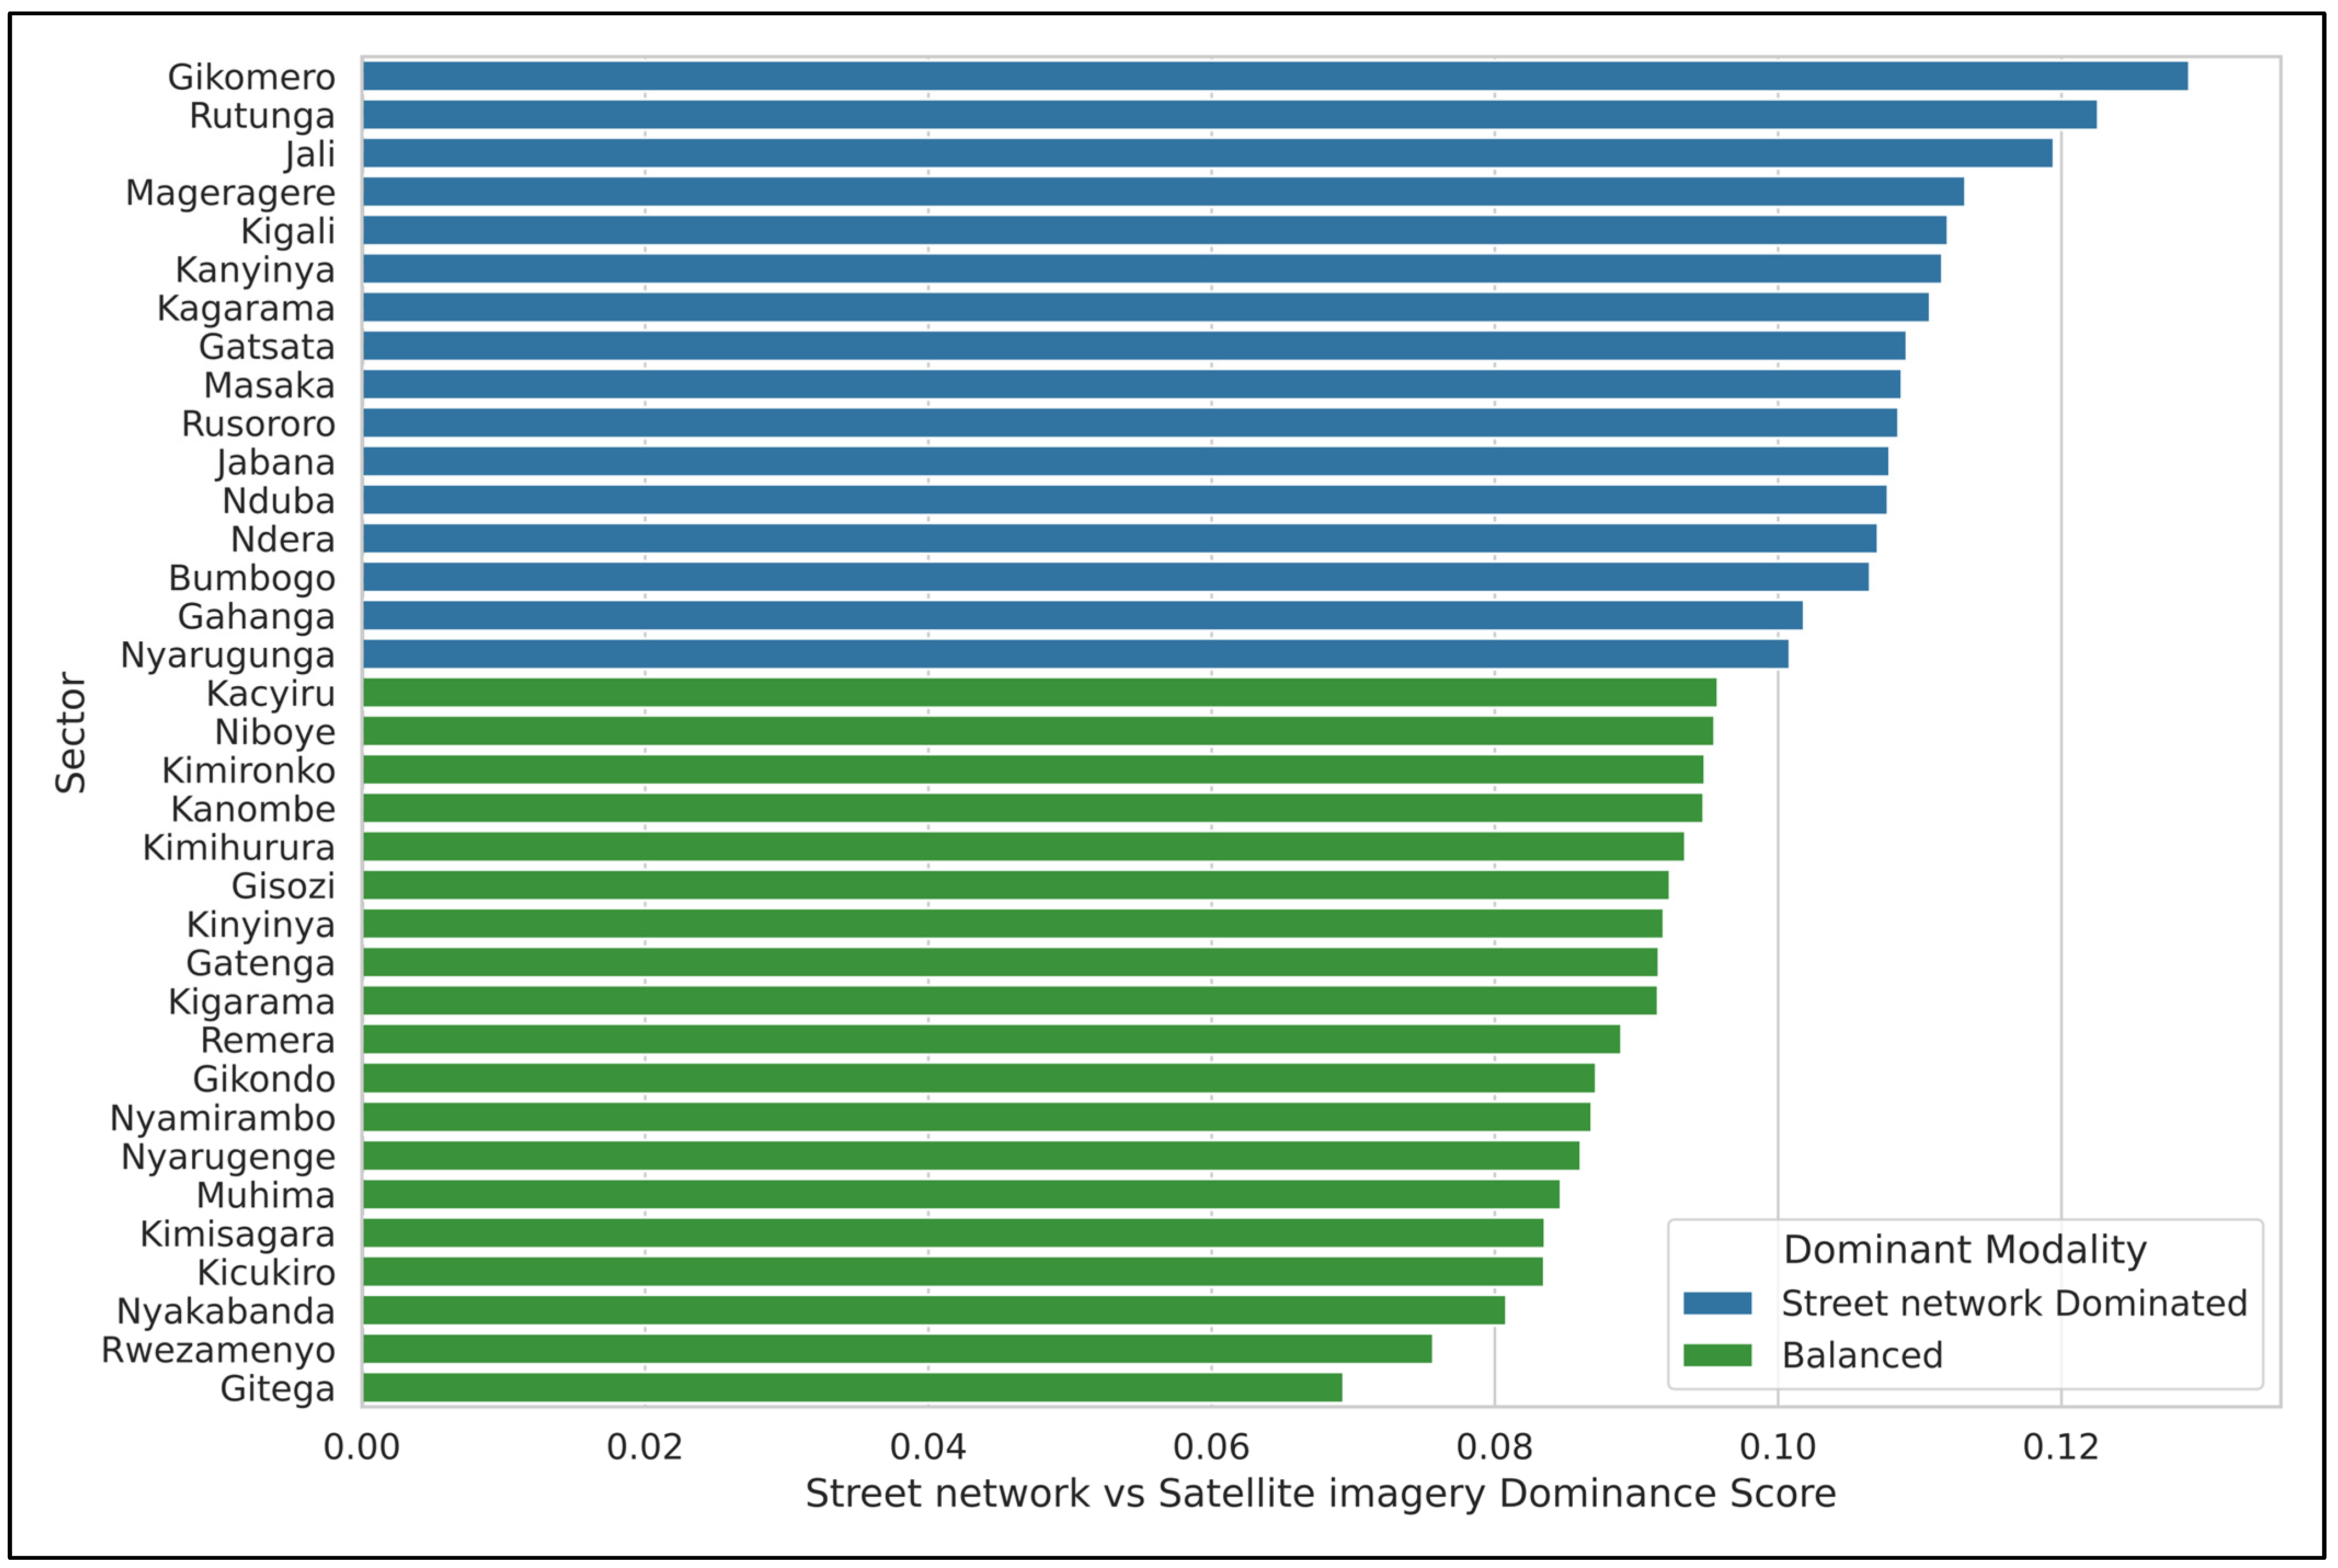
Next, we merged embeddings extracted from satellite imagery and street network data to construct a fused embedding dataset for predicting socio-economic indicators and public health determinants. Inspired by Xi et al. [25], we used a modality-aware attentional fusion technique that learns to adaptively weight and combine embeddings from each modality [72]. While other fusion methods such as simple concatenation or weighted average can sometimes achieve good predictive performance, the attention-based fusion provides per-sample interpretability by quantifying the relative contribution of each modality [25], which is an advantage for urban analytics (see Appendix E). We denoted z i and z r for image and street network-based embeddings, respectively. We then have projected 32-dimensional graph-level embeddings to 256-dimentional embeddings to allow fusion. Finally, we applied a non-linear transformation to project both embeddings into a shared latent space, as denoted in Equation (5):
  h i = tan W z i   +   b ,   h r = tan W z r   +   b
where W     R d × d and b     R d are shared learnable parameters. An attention context vector c     R d is then used to compute relevance scores for each modality α i   =   c T h i , α r   =   c T h r , which were normalized through a softmax function to obtain attention weights, as shown in Equation (6):
β i   =   e α i e α i + e α r ,   β r   =   e α r e α i + e α r
The final fused embeddings z f are computed as a convex combination, as illustrated in Equation (7), based on Equations (2), (4) and (6):
z f   =   β i · z i   +   β G   ·   z G

4.6. Downstream Tasks

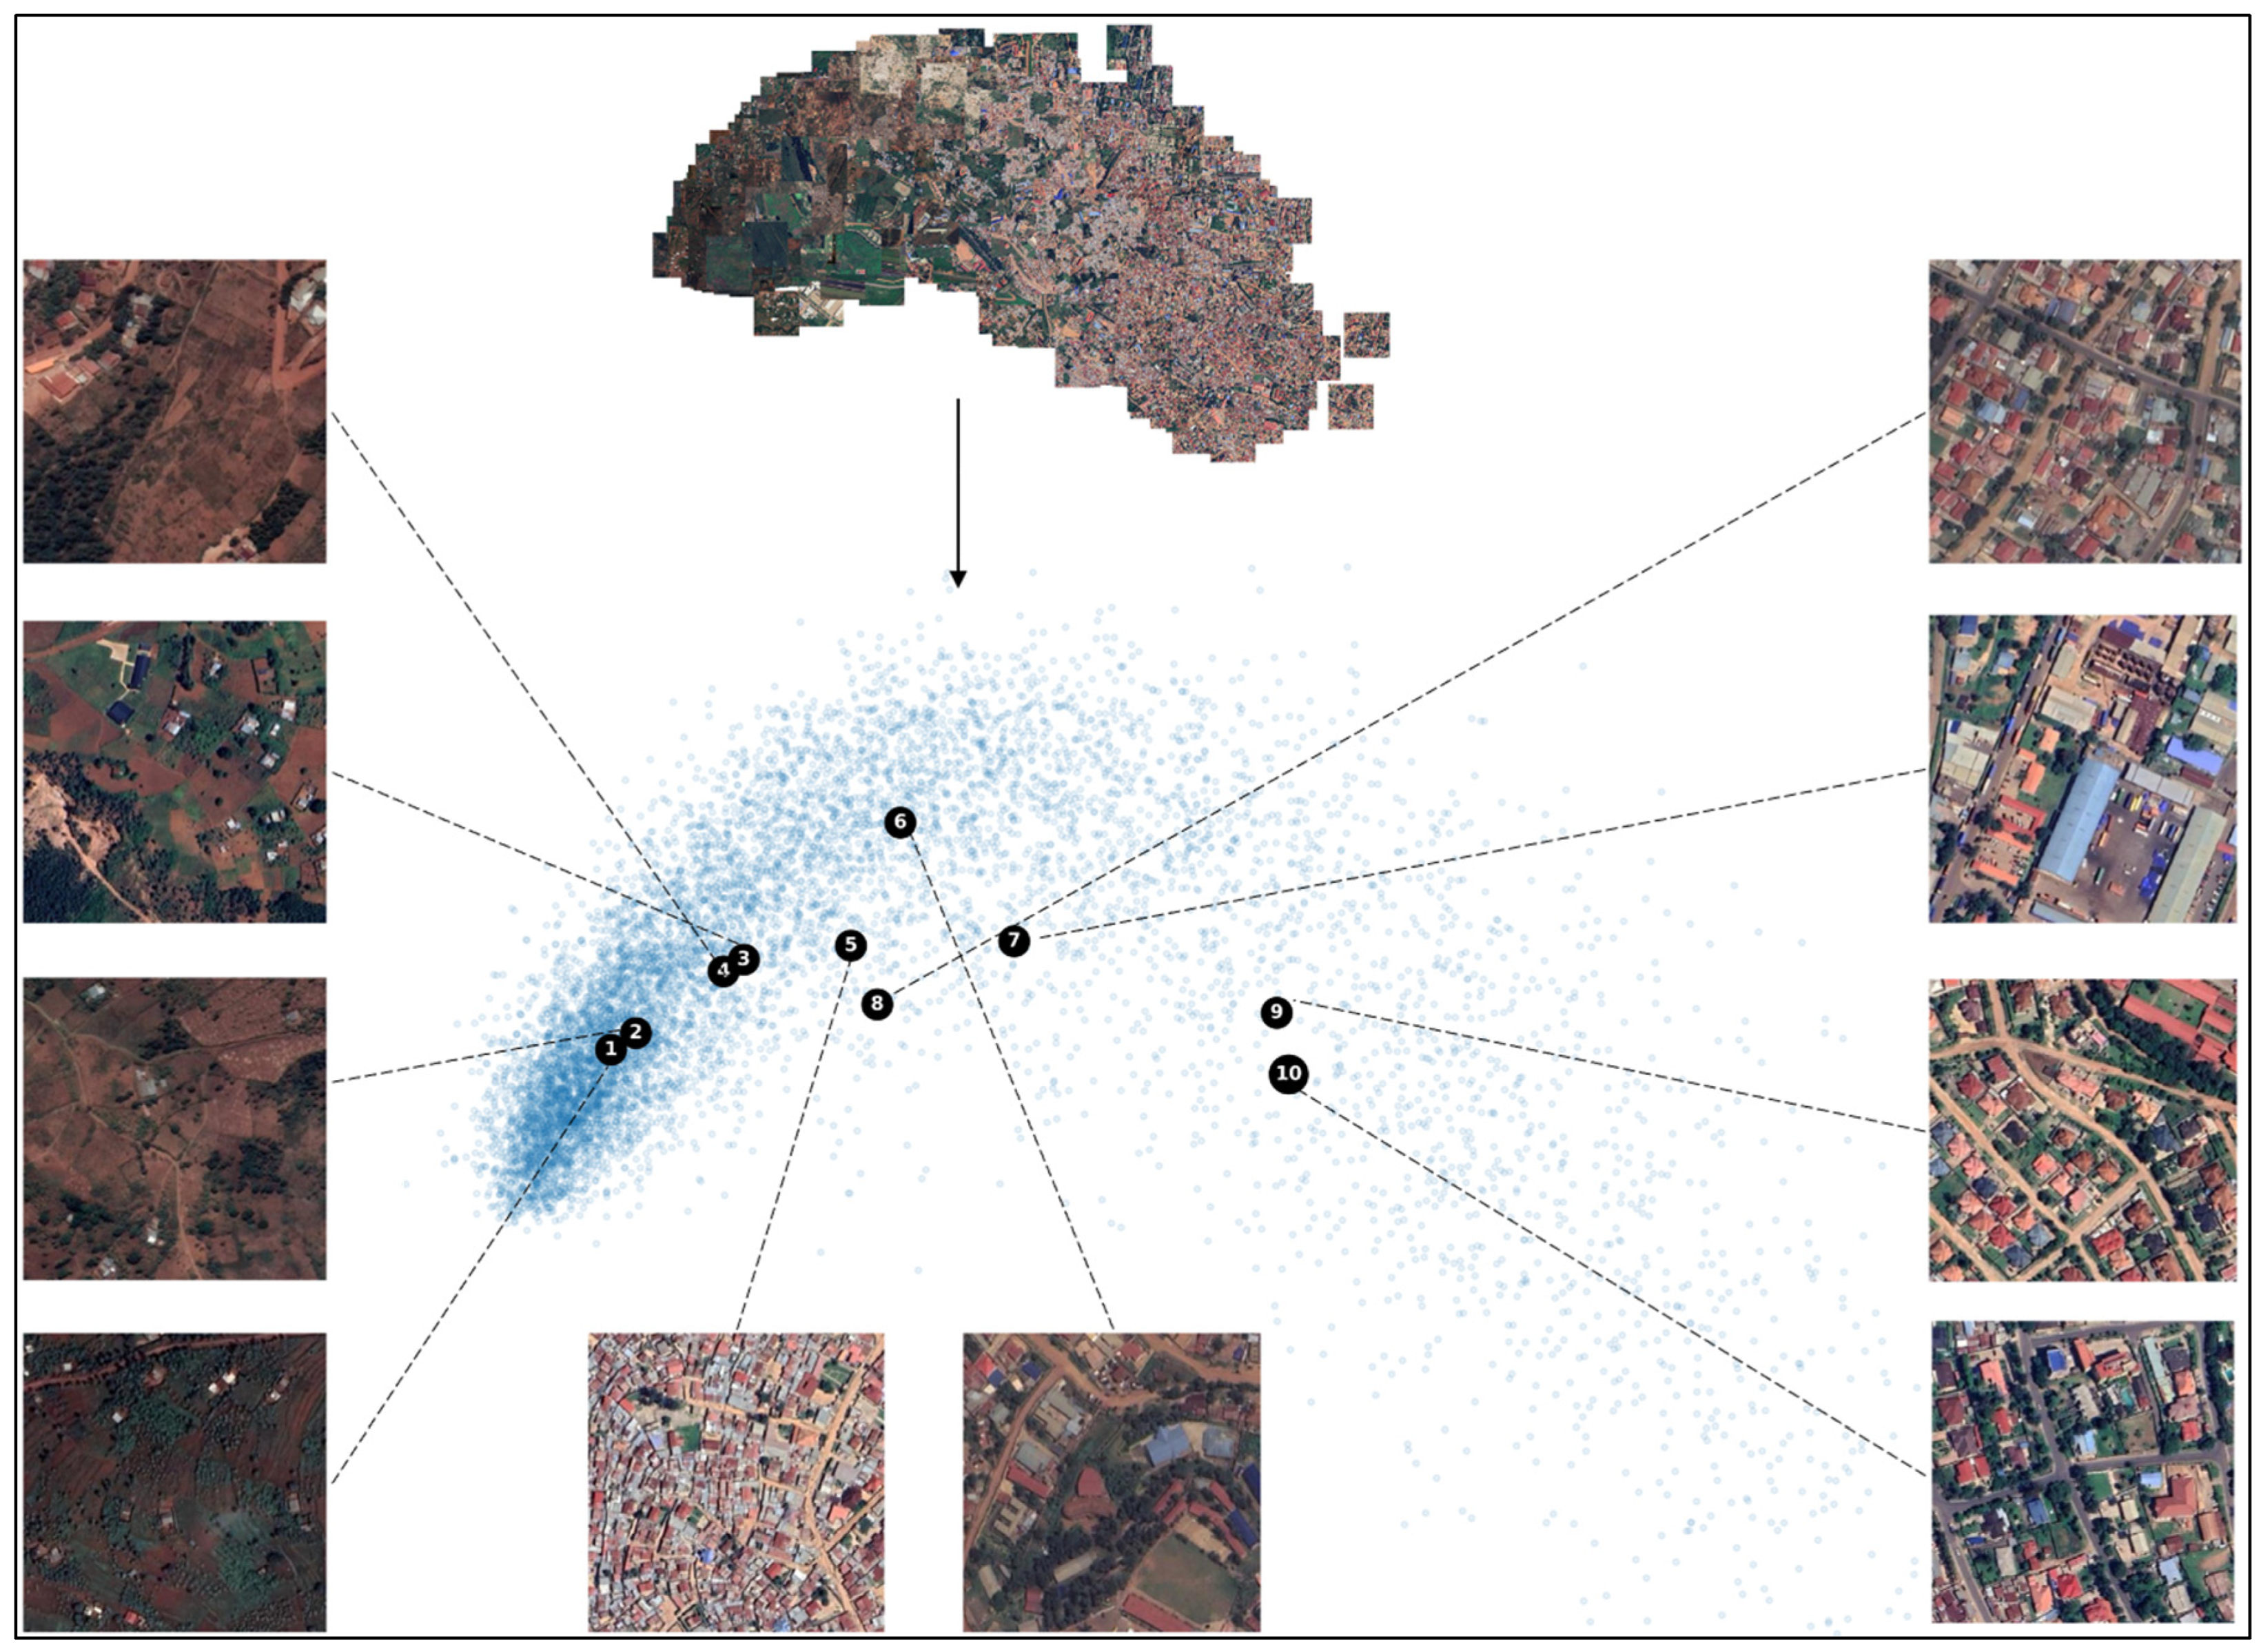
The fused embeddings z f were used as an input to a multilayer perceptron (MLP) [78] for the regression of multiple decile-based socio-economic indicators and public health determinants. The MLP architecture comprised two hidden layers with ReLU activation and dropout regularization, trained with mean squared error loss. We investigated the interpretability of the learned embedding space by applying Principal Component Analysis (PCA), a multivariate analysis that maintains data covariance while simplifying the data [79], to reduce the high-dimensional embeddings (256 dimensions) into two dimensions. To qualitatively assess this alignment, we selected ten anchor points corresponding to different decile levels of a representative socio-economic outcome. For each anchor point, we displayed the associated satellite image and decile label, illustrating how distinct urban textures, such as dense informal settlements, intermediate peri-urban zones, and formal neighborhoods, are embedded within the learned space.
Next, we assessed the association between public health determinants and socio-economic indicators, using statistical analysis through Spearman correlation coefficient and Ordinary Least Squares (OLS) regression, due to its computational tractability and its natural extension to multi-output regression [80]. This choice was also influenced by the socio-economic and public health data that were available only at the sector level, which produce unstable estimates in spatially localized models such as Geographically Weighted Regression (GWR). Furthermore, we used PCA on public health determinants to create a composite health index, using the first principal component. Then, we applied OLS regression to assess the influence of socio-economic indicators on the obtained health index.

4.7. Measurement of Prediction Performance

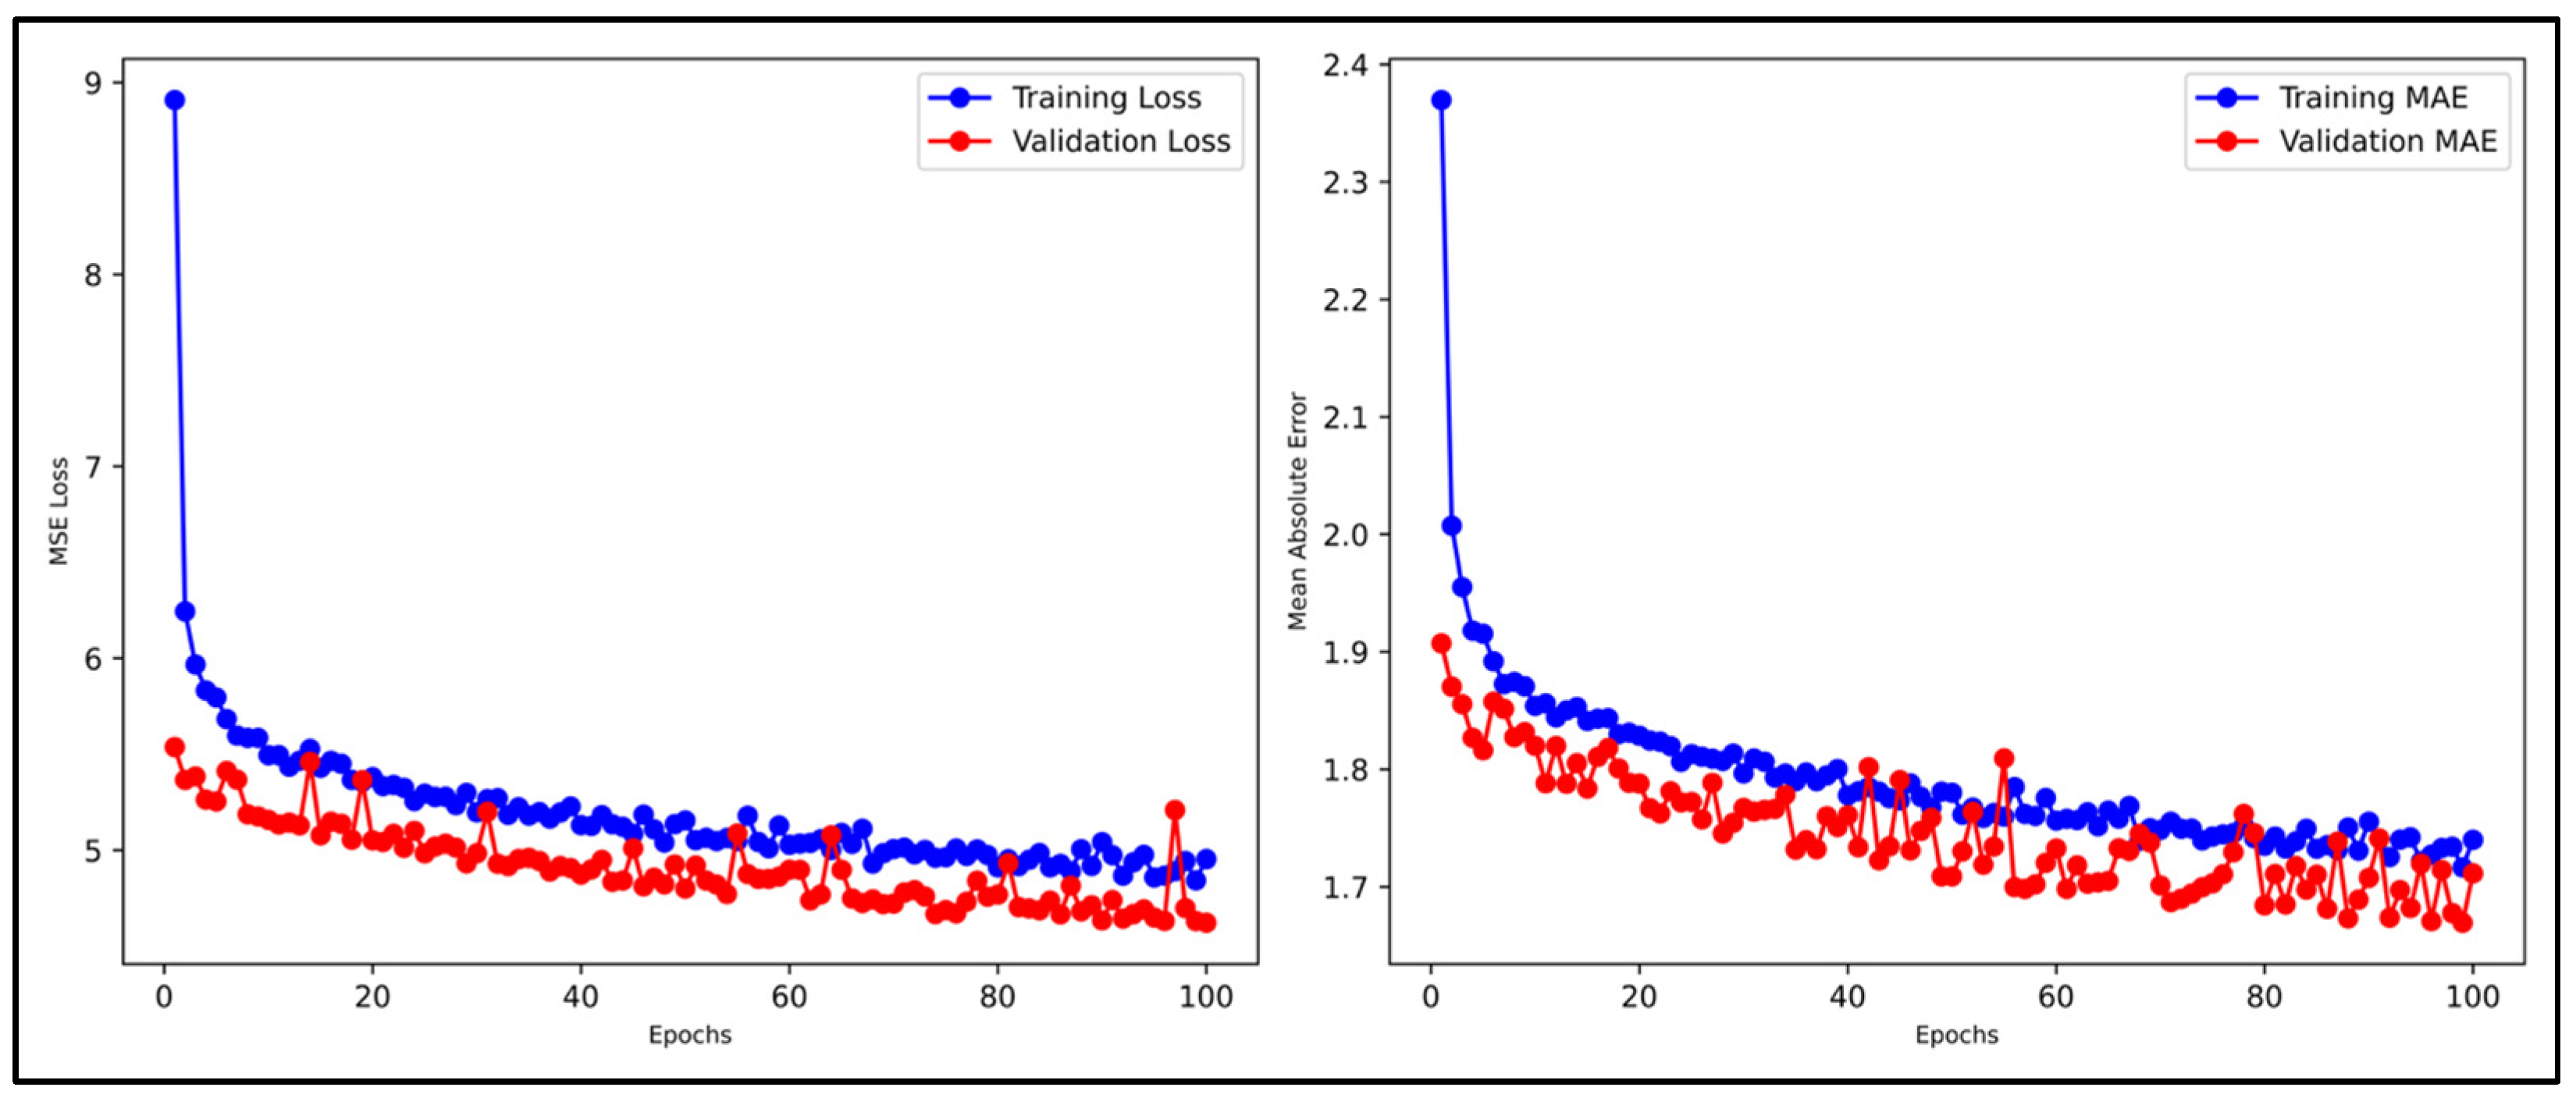
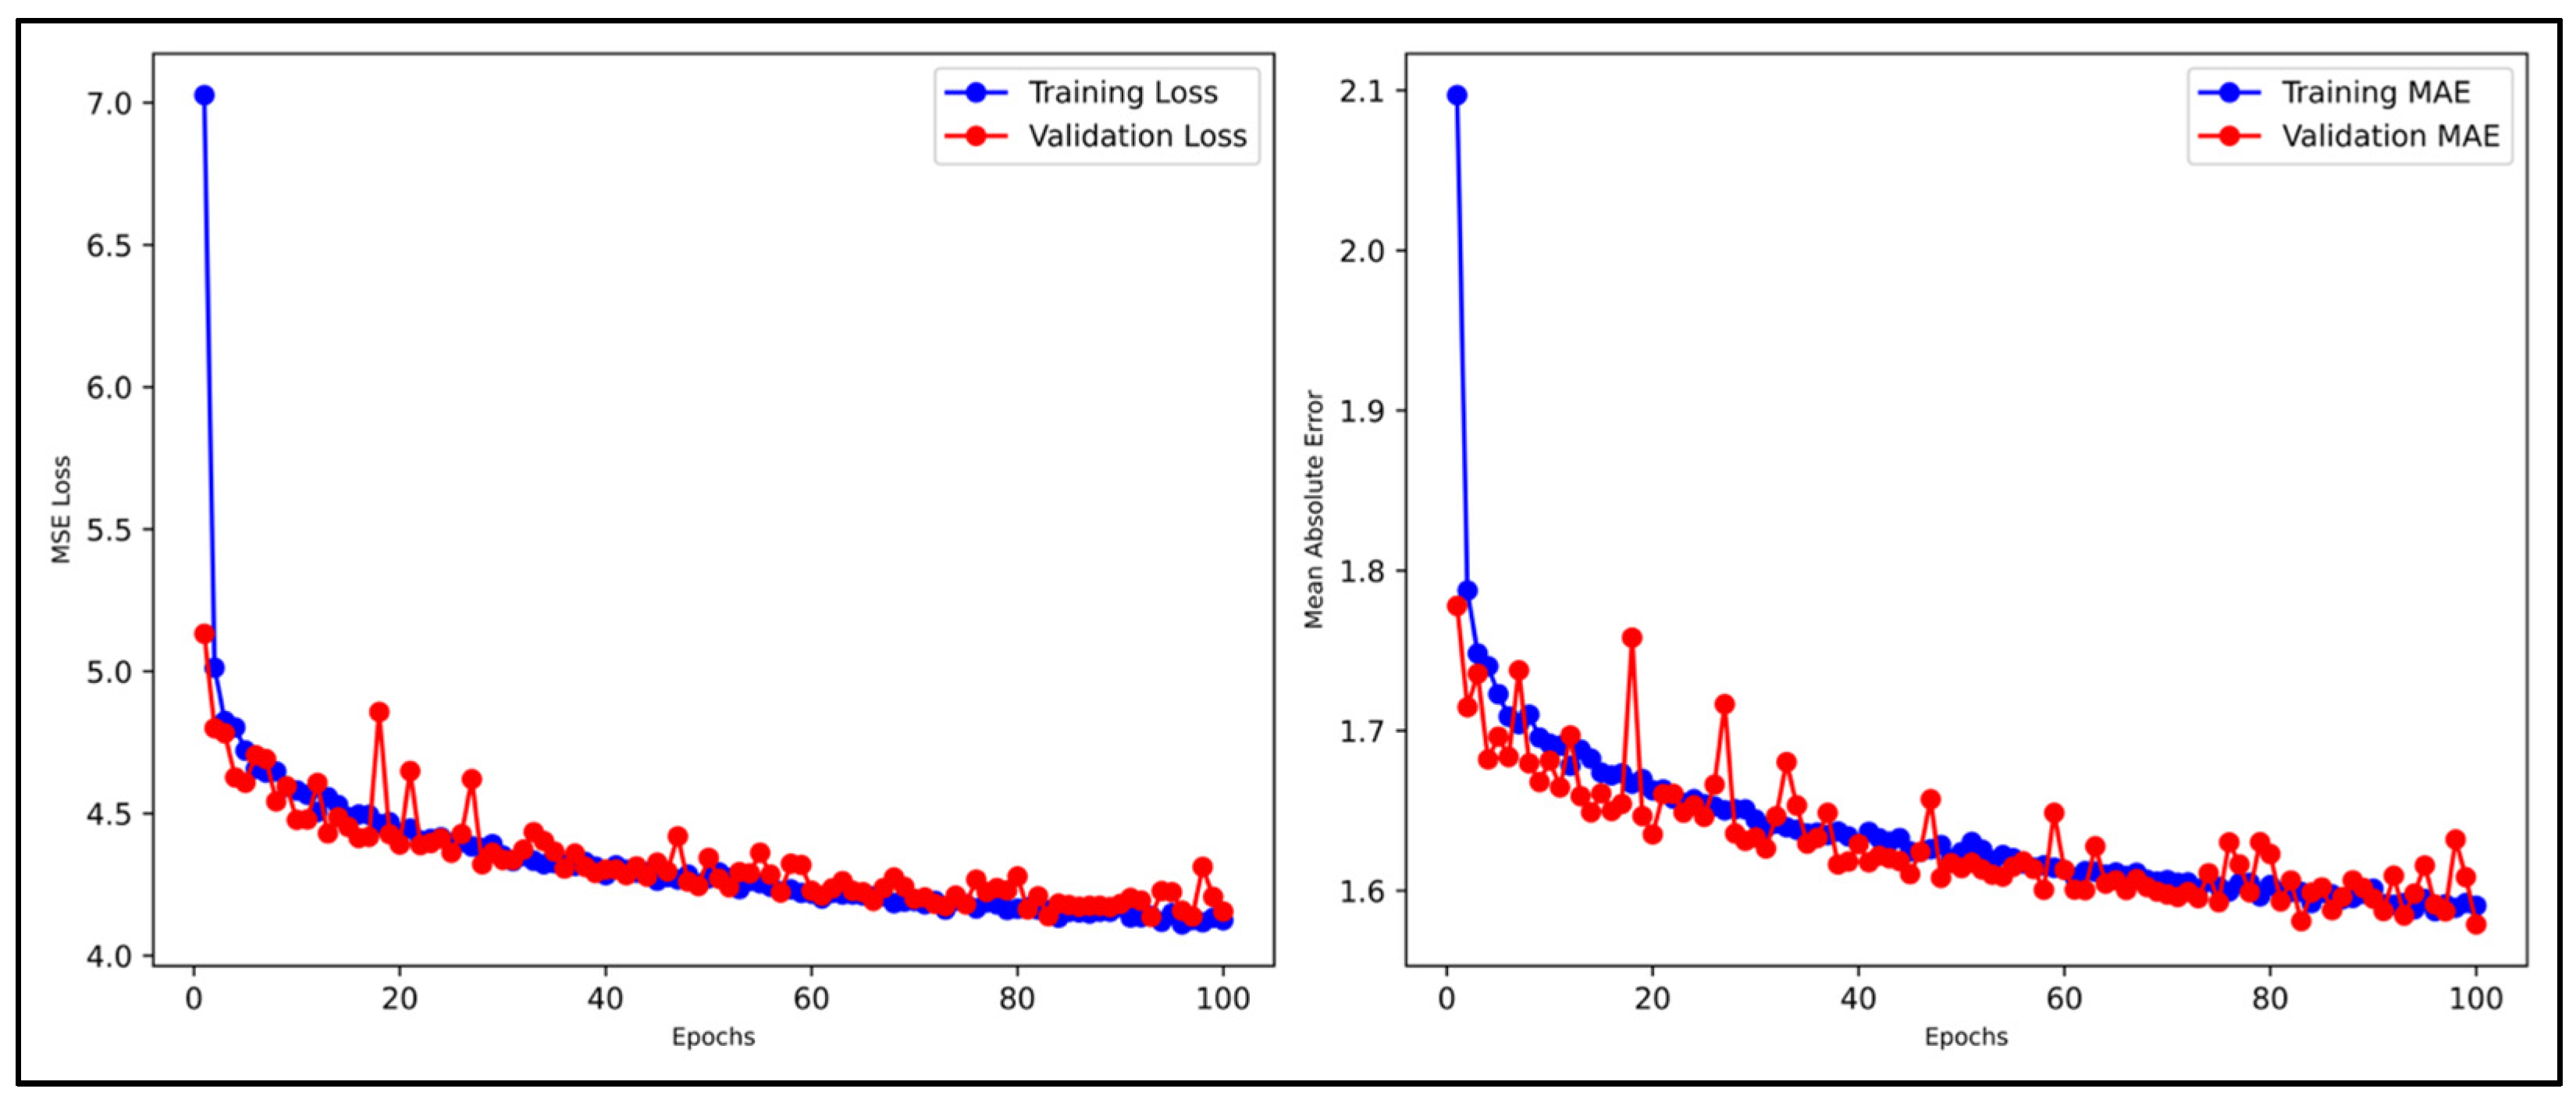
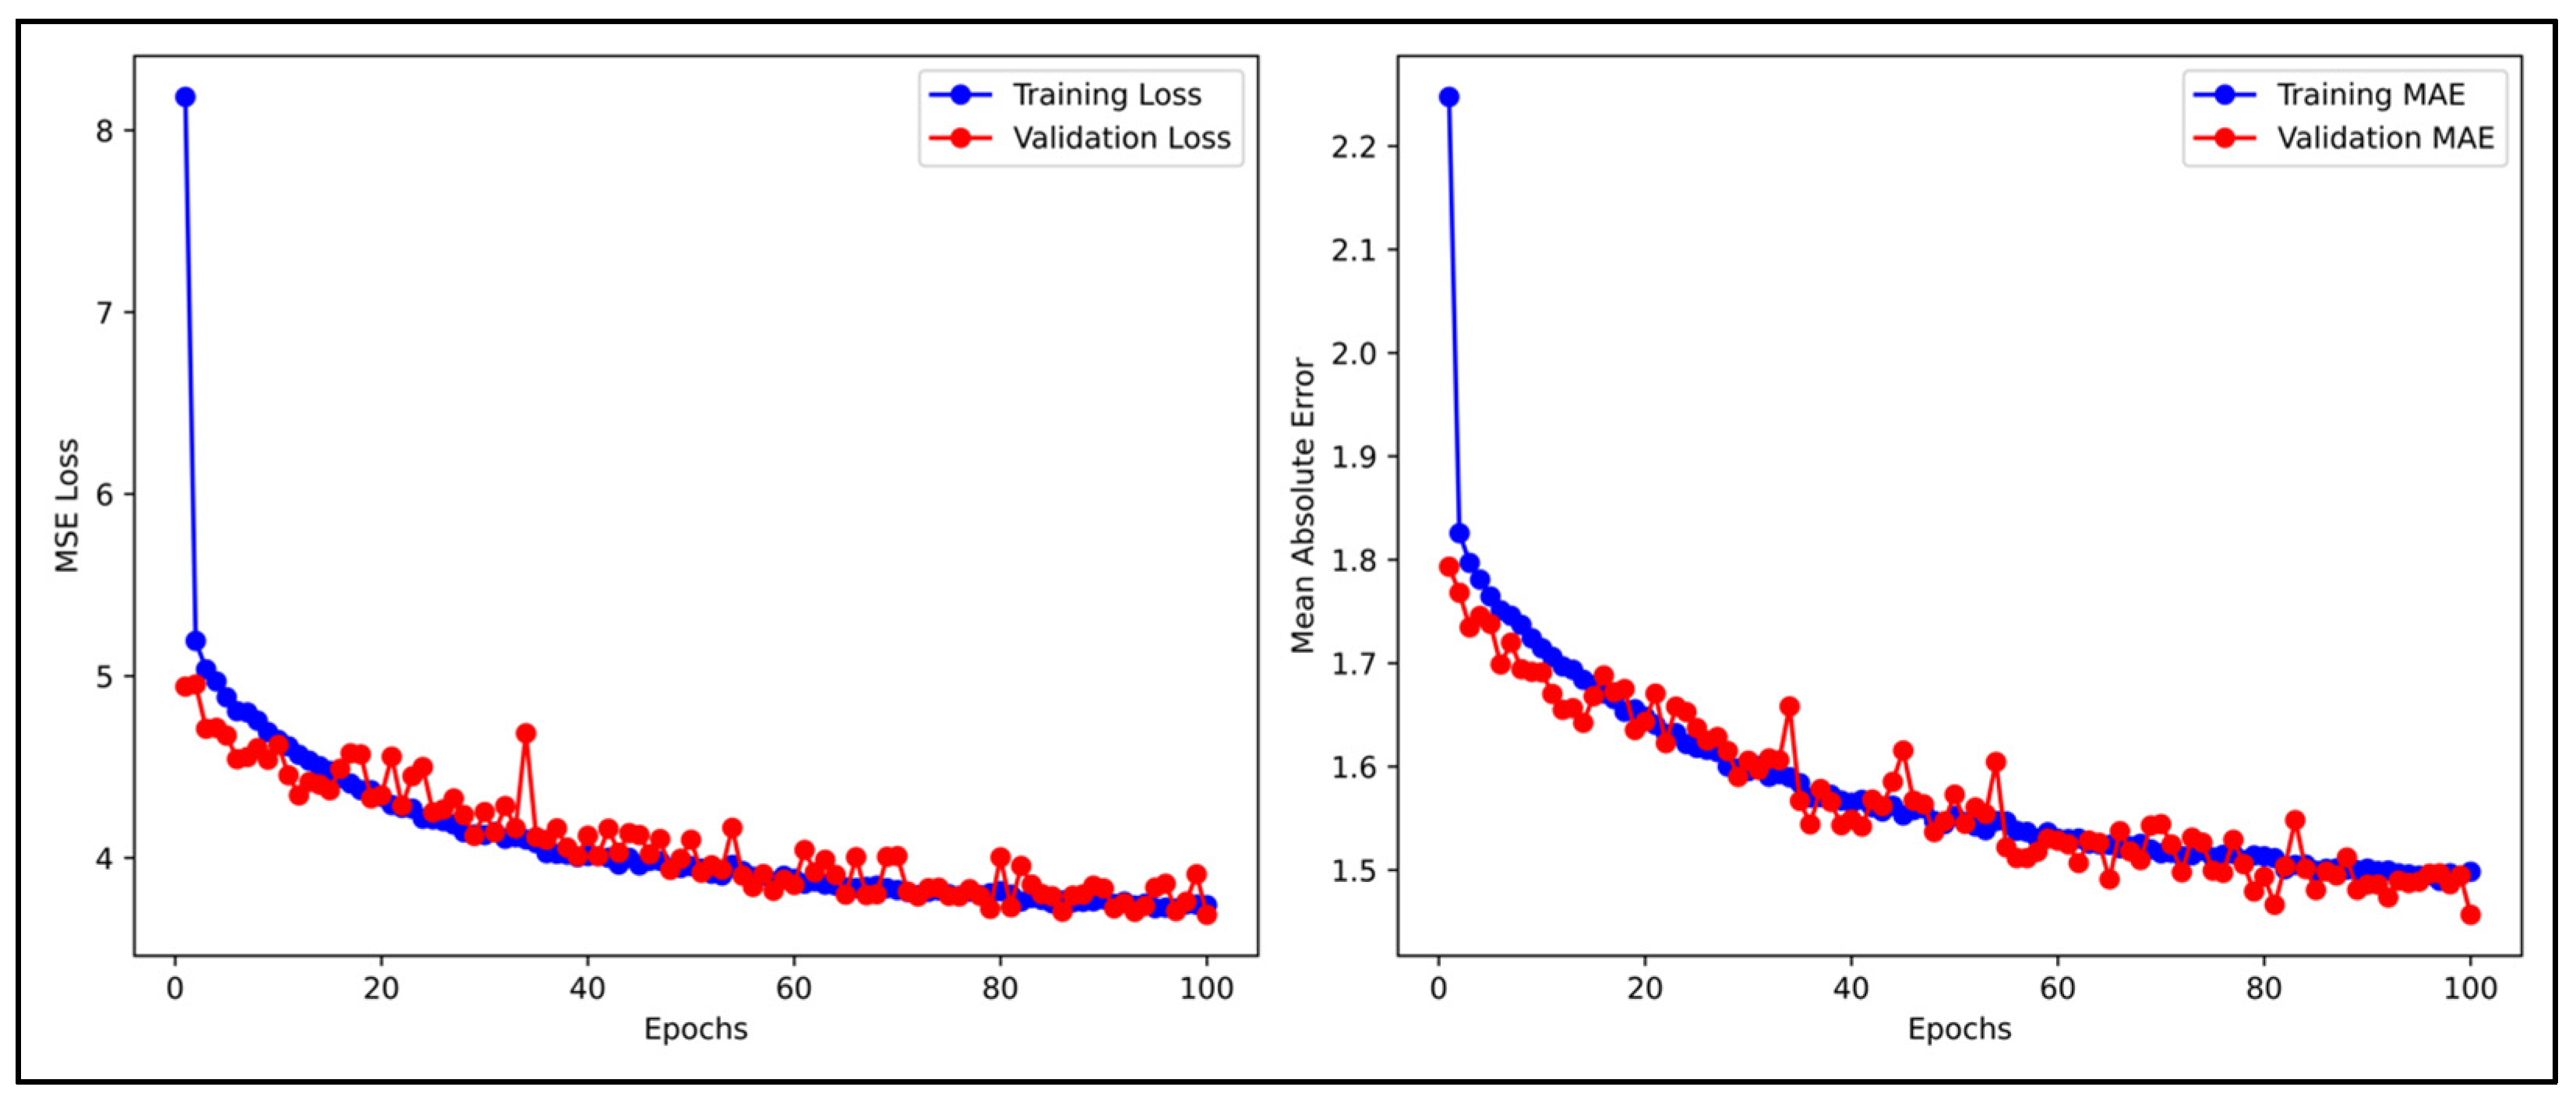
For all the models (CNN, GCN and downstream MLP), we have used 80% of the data from all 35 sectors of City of Kigali for training and 20% for evaluation, ensuring that no patches from the same sector appeared in both sets, which reflected a common practice in machine learning training [81]. We trained models for 100 iterations, balancing performance and computational resources to allow for the research settings and application in computational resource-constrained areas. The Appendix B contains graphs showing mean loss and mean absolute error for both the training and validation sets over training epochs (see Figure A1, Figure A2 and Figure A3).
We then evaluated the performance of the models by using five-fold cross validation with shuffled splits and a fixed random seed (42), which is commonly used in machine learning to test model robustness and generalizability [49]. In each fold, 80% of the data were used for training and 20% were held out for testing. We trained each fold for 30 epochs to balance the limited computational resources available for the study (Appendix C represents the hyperparameters used). The performance was reported using the MAE and Spearman correlation coefficient (r) aggregated as mean ± standard deviation across folds, due to their robustness on ranked data [82]. The results are presented in Table A4 in Appendix D.

5. Results

5.1. Predictions of Socio-Economic Indicators and Public Health Determinants

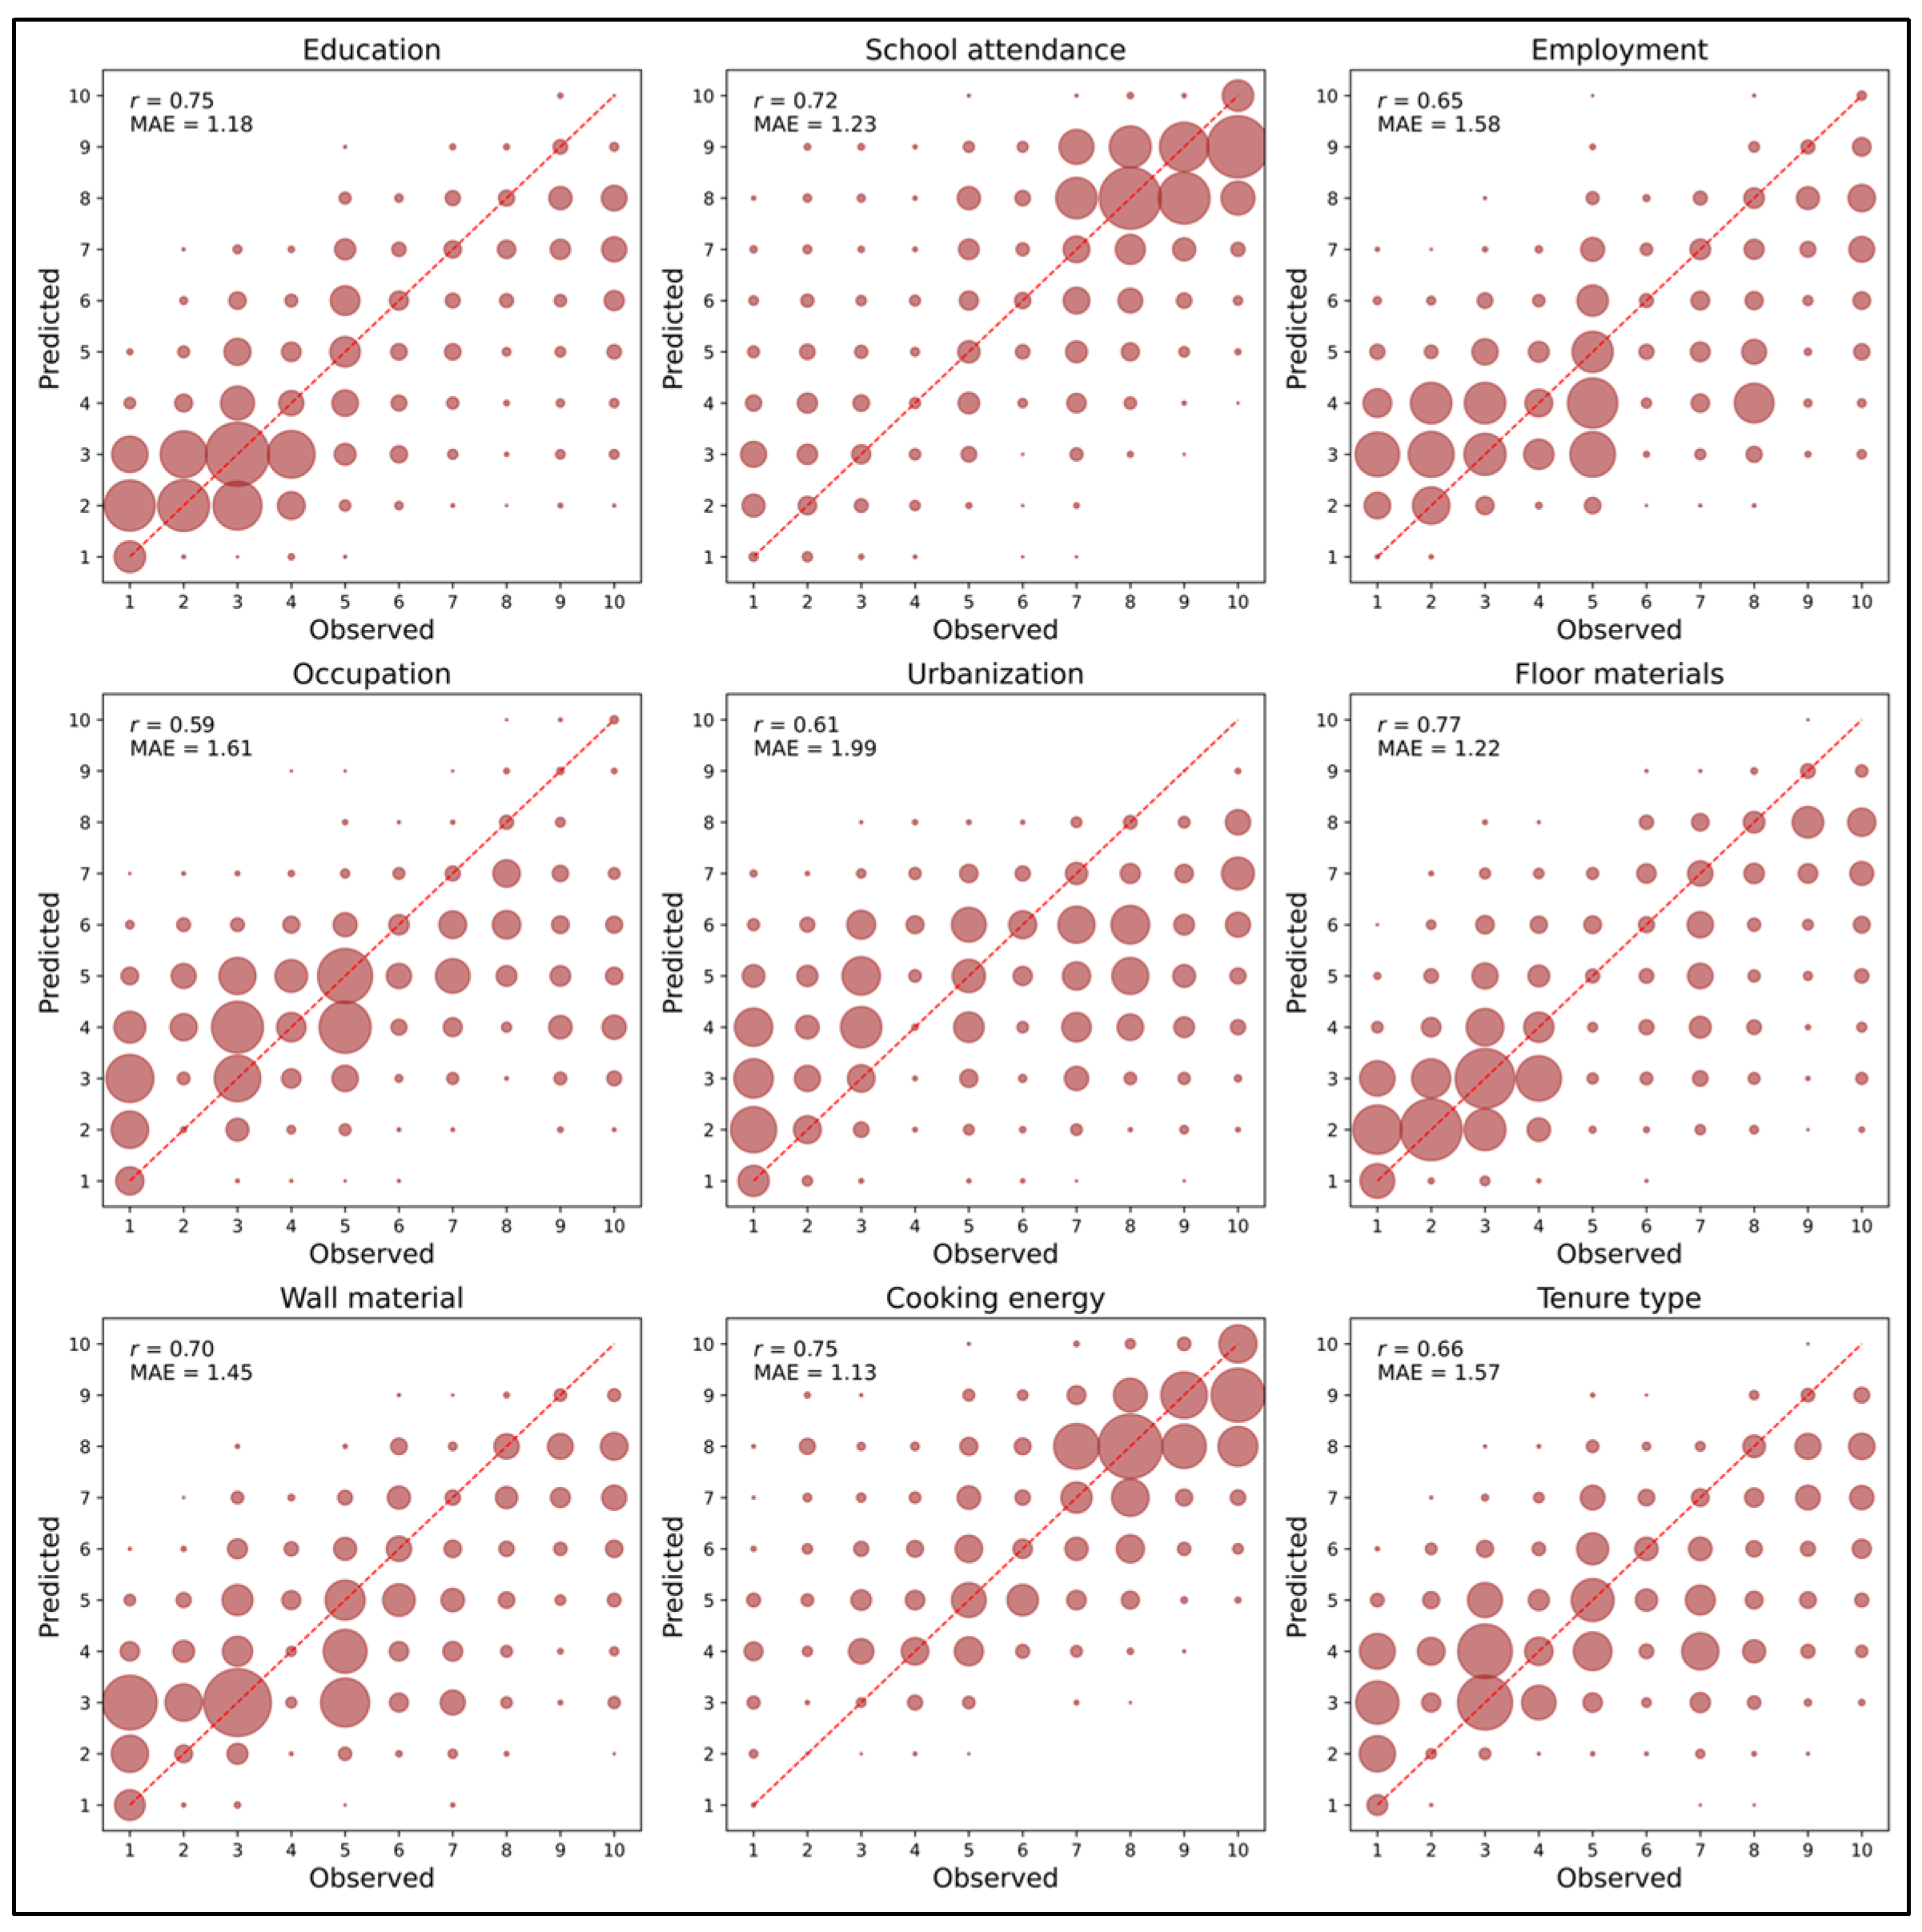
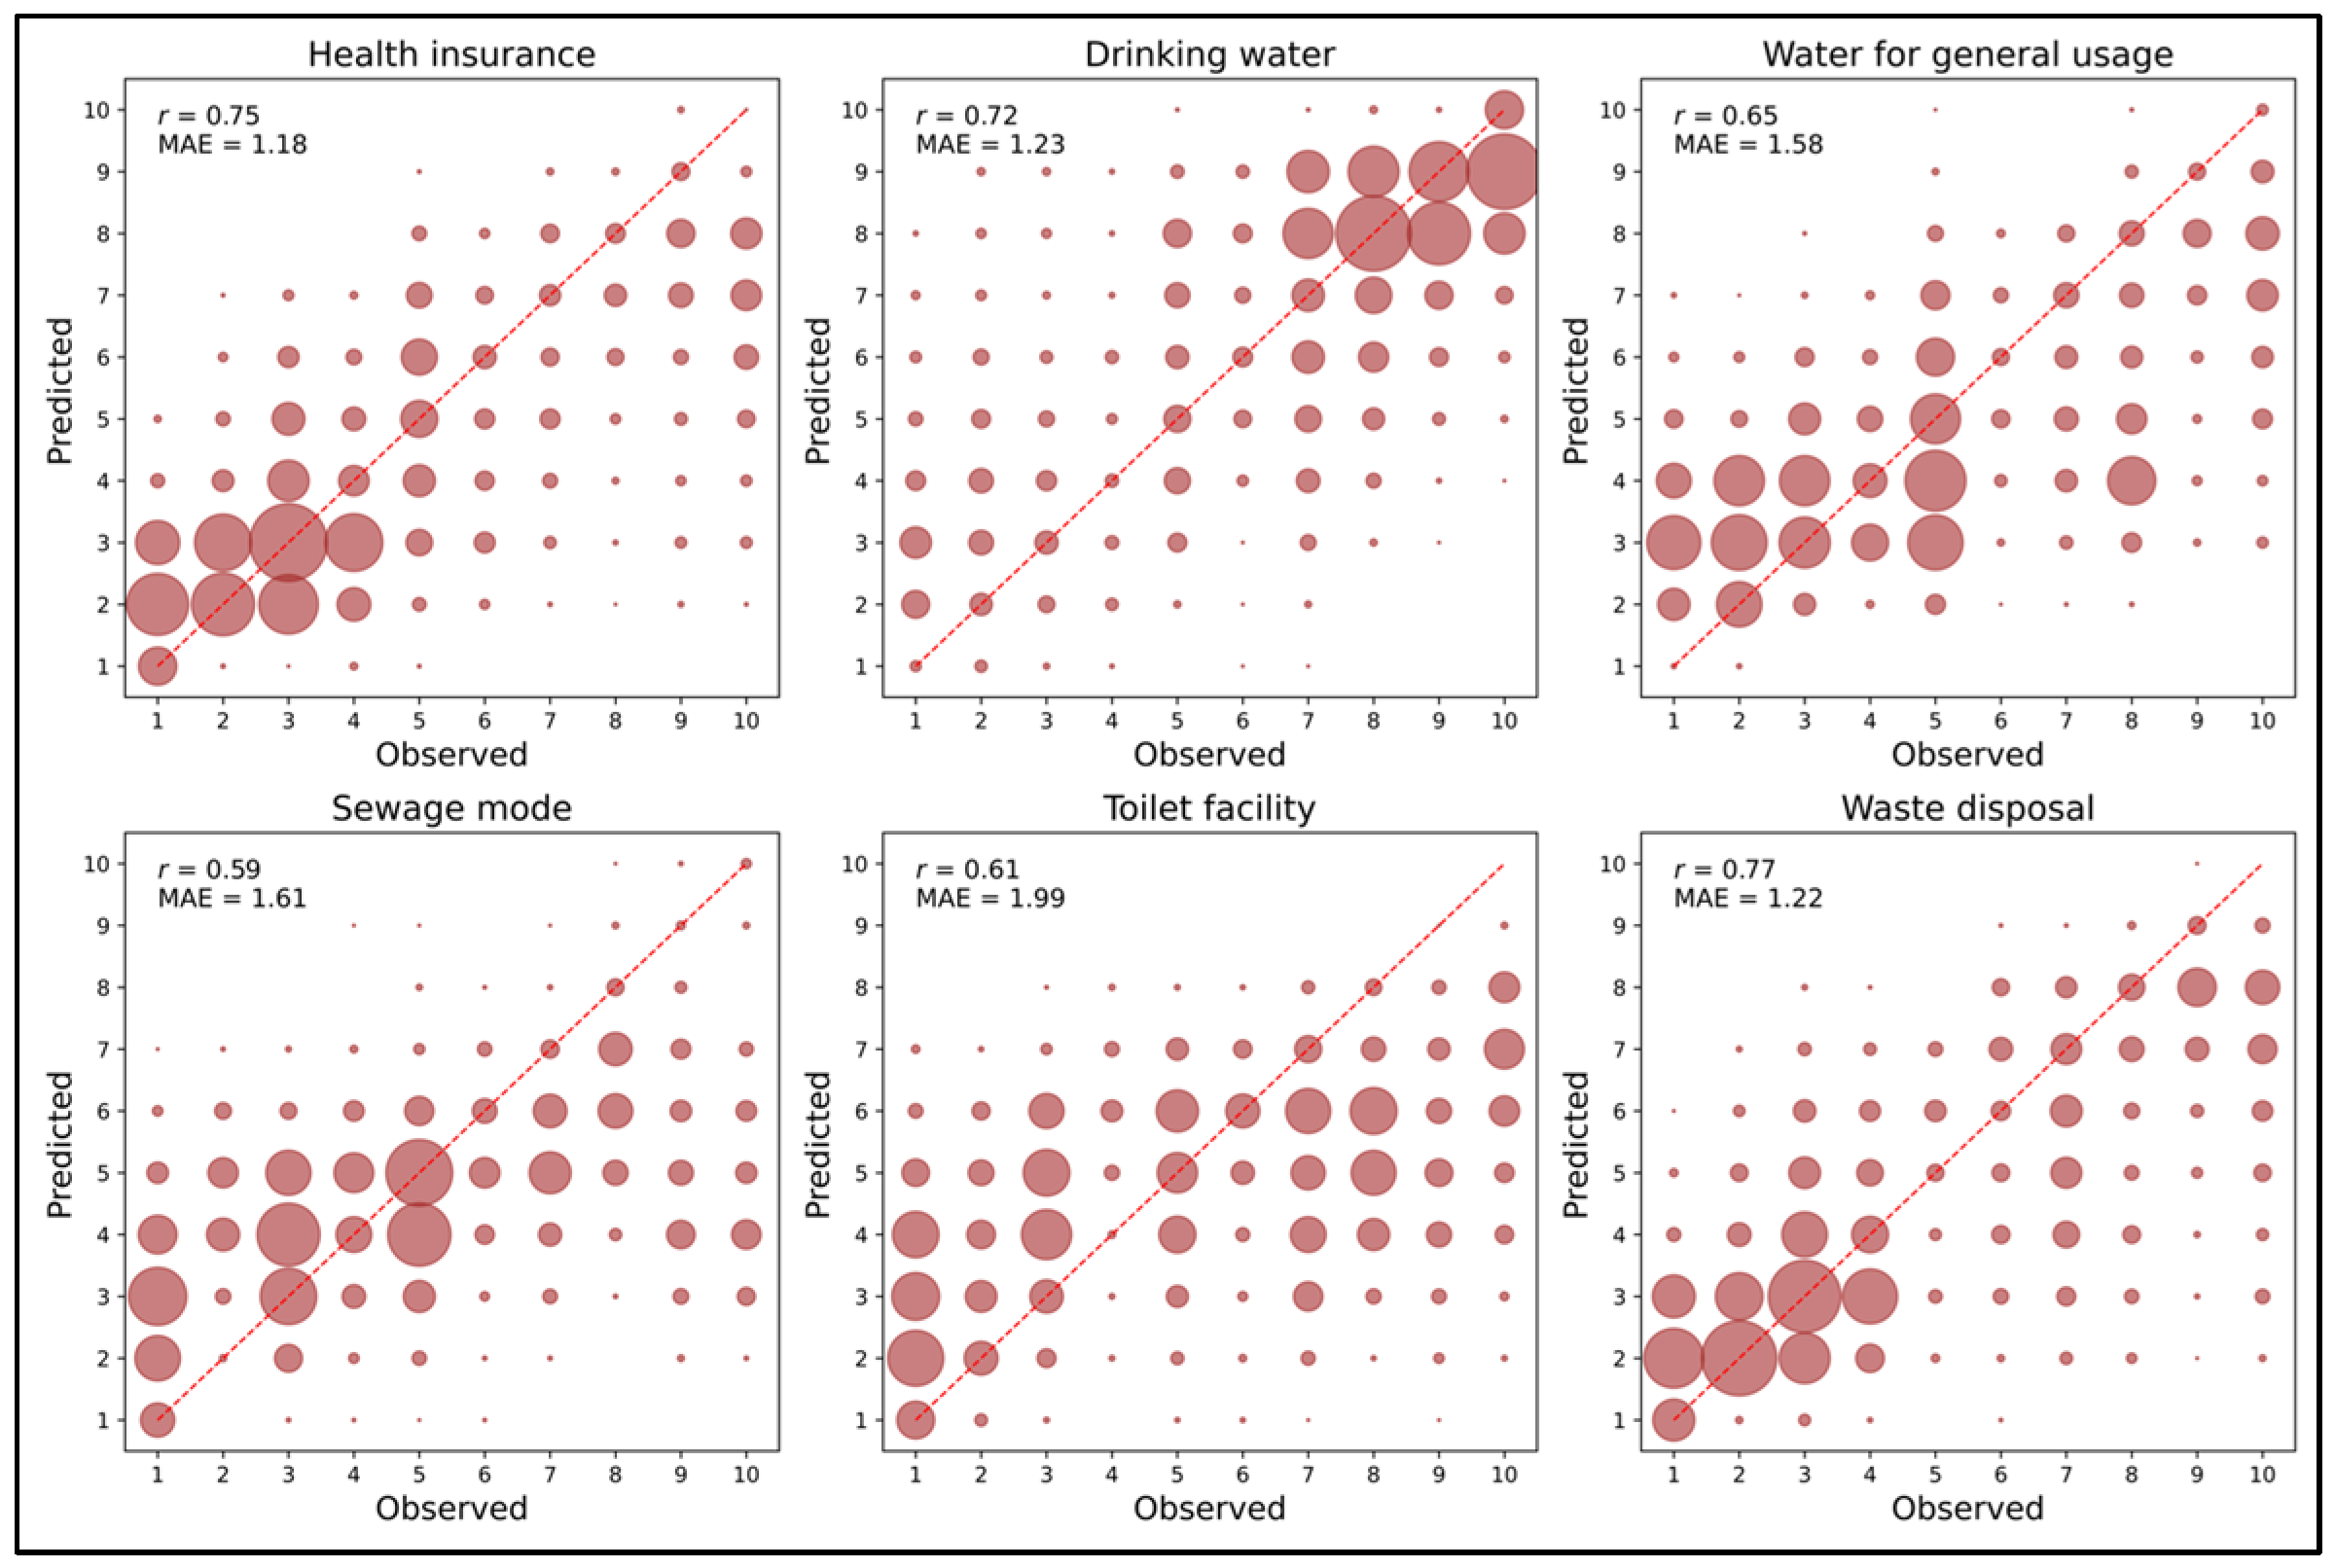
We present the performance evaluation metrics of unimodal and multimodal models across socio-economic indicators and public health determinants through the MAE and Spearman correlation coefficient (r) in Table 1. The best performance metrics are represented in bold. Overall, the multimodal fusion model achieves the best average performance across socio-economic indicators and public health determinants, demonstrating the benefit of integrating visual and topological information. For socio-economic determinants, there was an average correlation of 0.68 and an MAE of 1.26 between the actual and predicted deciles. The average correlation and MAE for public health determinants were 0.68 and 1.46, respectively. The model shows strong predictive performance for education, cooking energy, and health insurance (r = 0.75, MAE = 1.18, 1.13, and 1.18). The weakest performances were occupation (r = 0.59, MAE = 1.61) and sewage mode (r = 0.59, MAE = 1.61). However, performance gains are not uniform across all targets (socio-economic indicators and public health determinants). For tenure type, water for general usage, and toilet facility, the street-network-only model attains a marginally lower MAE. This suggests that these outcomes are more strongly influenced by infrastructural topology and connectivity patterns than by visual urban morphology alone.
The scatter plots (Figure 5) indicate that the occupation and urbanization predictions are more dispersed and tend to underestimate higher observed values, which is reflected in the weaker correlations. By contrast, in education, cooking energy, and floor materials, larger bubbles cluster tightly along the diagonal, indicating consistent agreement across categories.
A similar pattern is evident for public health determinants (Figure 6). While health insurance and waste disposal show tight clustering along the diagonal line and relatively low error, sewage mode and toilet facility display greater dispersion, with a clear tendency to underestimate higher observed values.

5.2. Spatial Patterns of Urban Socio-Economic Indicators and Public Health Determinants

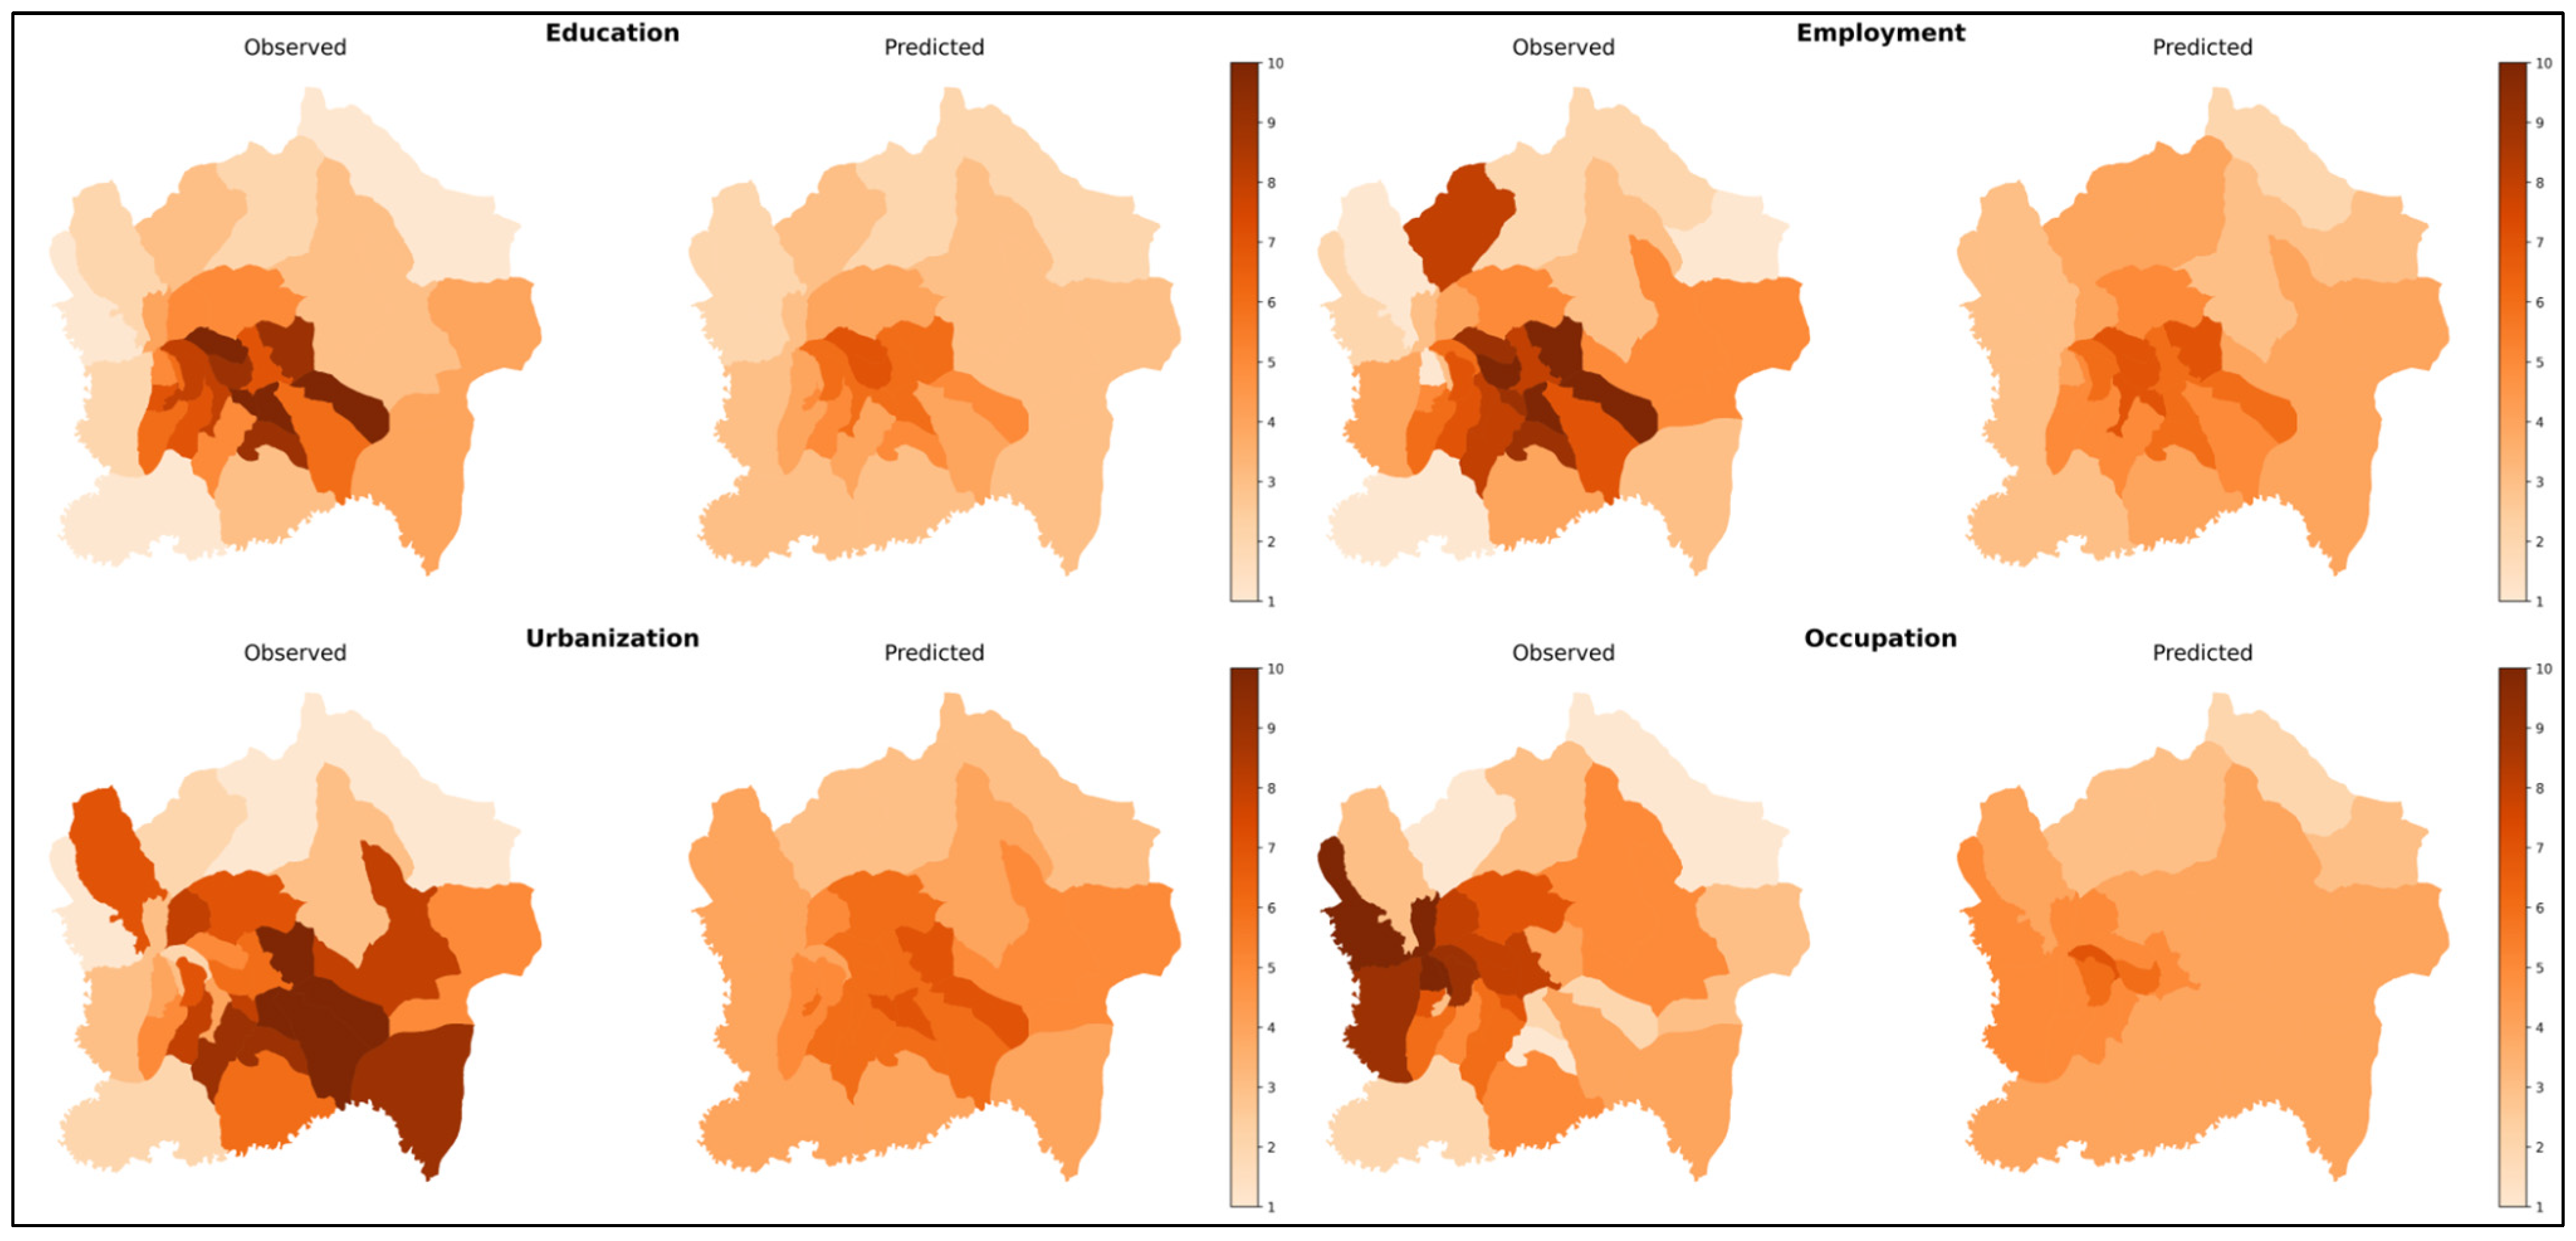
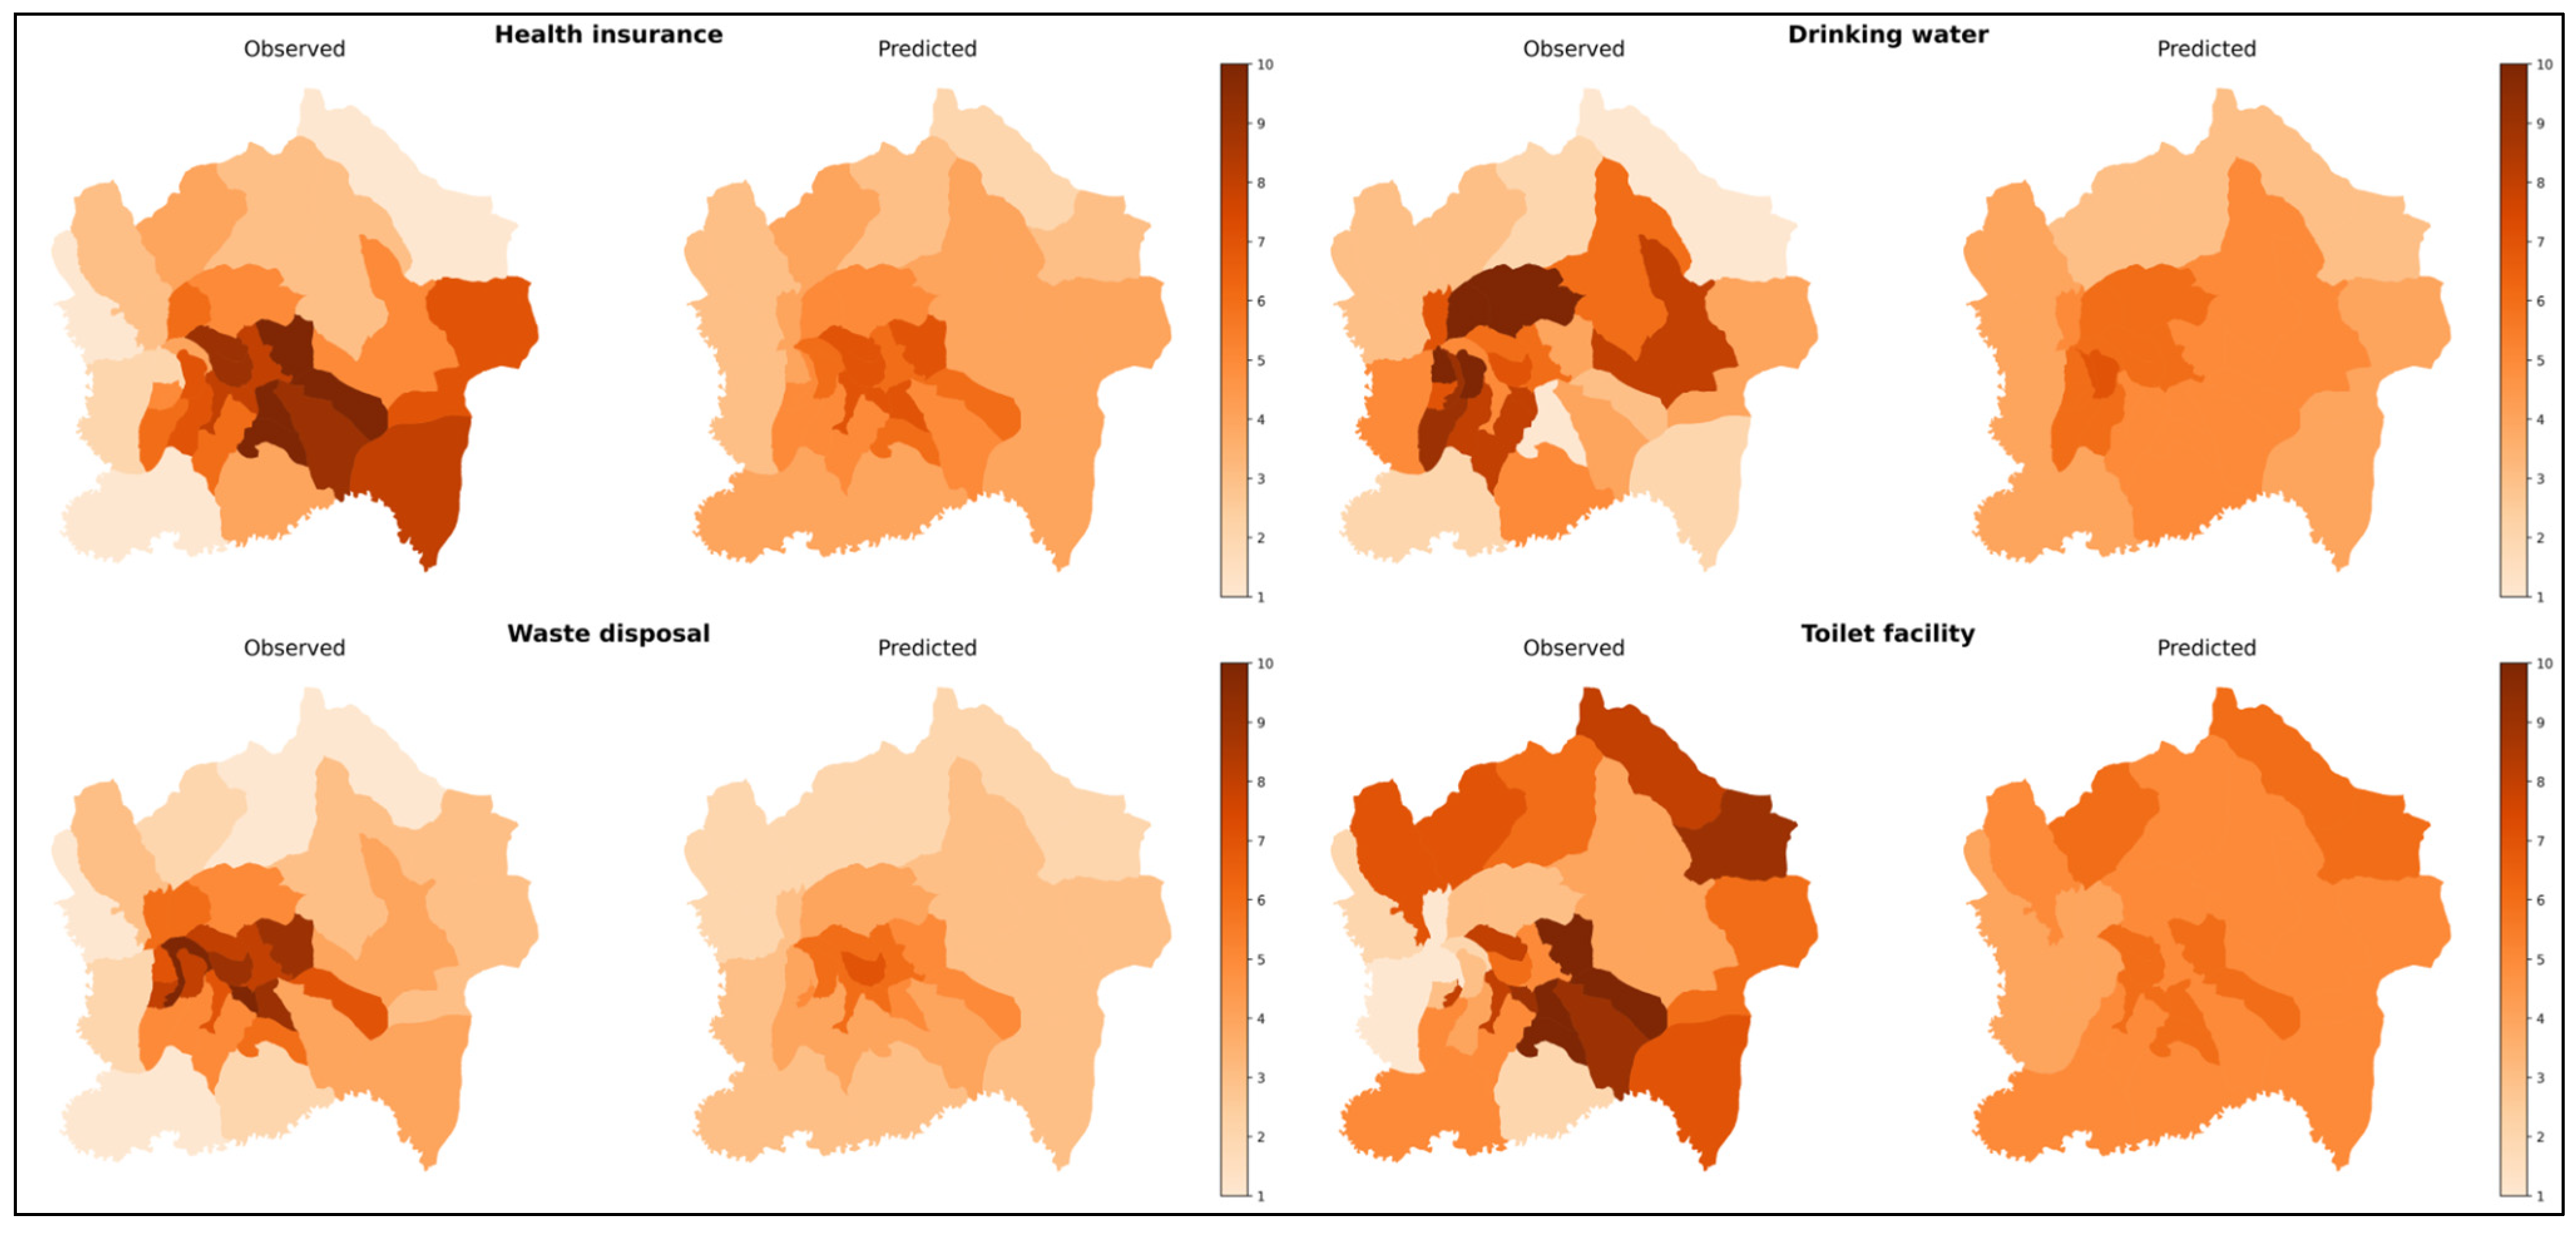
The observed data from national statistics reveal that the city center of the City of Kigali has the best socio-economic indicators and public health determinants, generally. The outskirts are primarily home to the impoverished, while the city’s east side is gentrifying and has pockets of modern neighborhoods. However, this observation was different for tenure type (housing) and school attendance, which are dominant in the outskirts and rural settings of the city. Importantly, the fused embeddings from both the satellite image and road network were able to capture these variations. Figure 7 and Figure 8 visualize spatial patterns for the observed and predicted socio-economic indicators and public health determinants across the city of Kigali, respectively.

5.3. Interpretation of Fused Embeddings

The fused embeddings are shown in two dimensions, and reveal the location of the satellite images of several public health determinants and socio-economic variables in the embedding space (Figure 9). Points in the scatter plot (center) correspond to the distribution of fused embeddings. Based on the observed employment data, black-labeled markers denote the centroids of employment deciles, ranging from 1 (lowest employment; worst off) to 10 (highest employment; better off). Example patches from each decile are shown around the embedding space, illustrating a visual progression from sparsely built, rural environments (deciles 1–4) to densely developed urban and peri-urban areas (deciles 7–10). The embedding reveals a continuous feature space aligned with the employment conditions, suggesting that spatial and structural characteristics in satellite imagery capture salient patterns associated with local socio-economic status.

5.4. Influences of Socio-Economic Conditions on Public Health Determinants

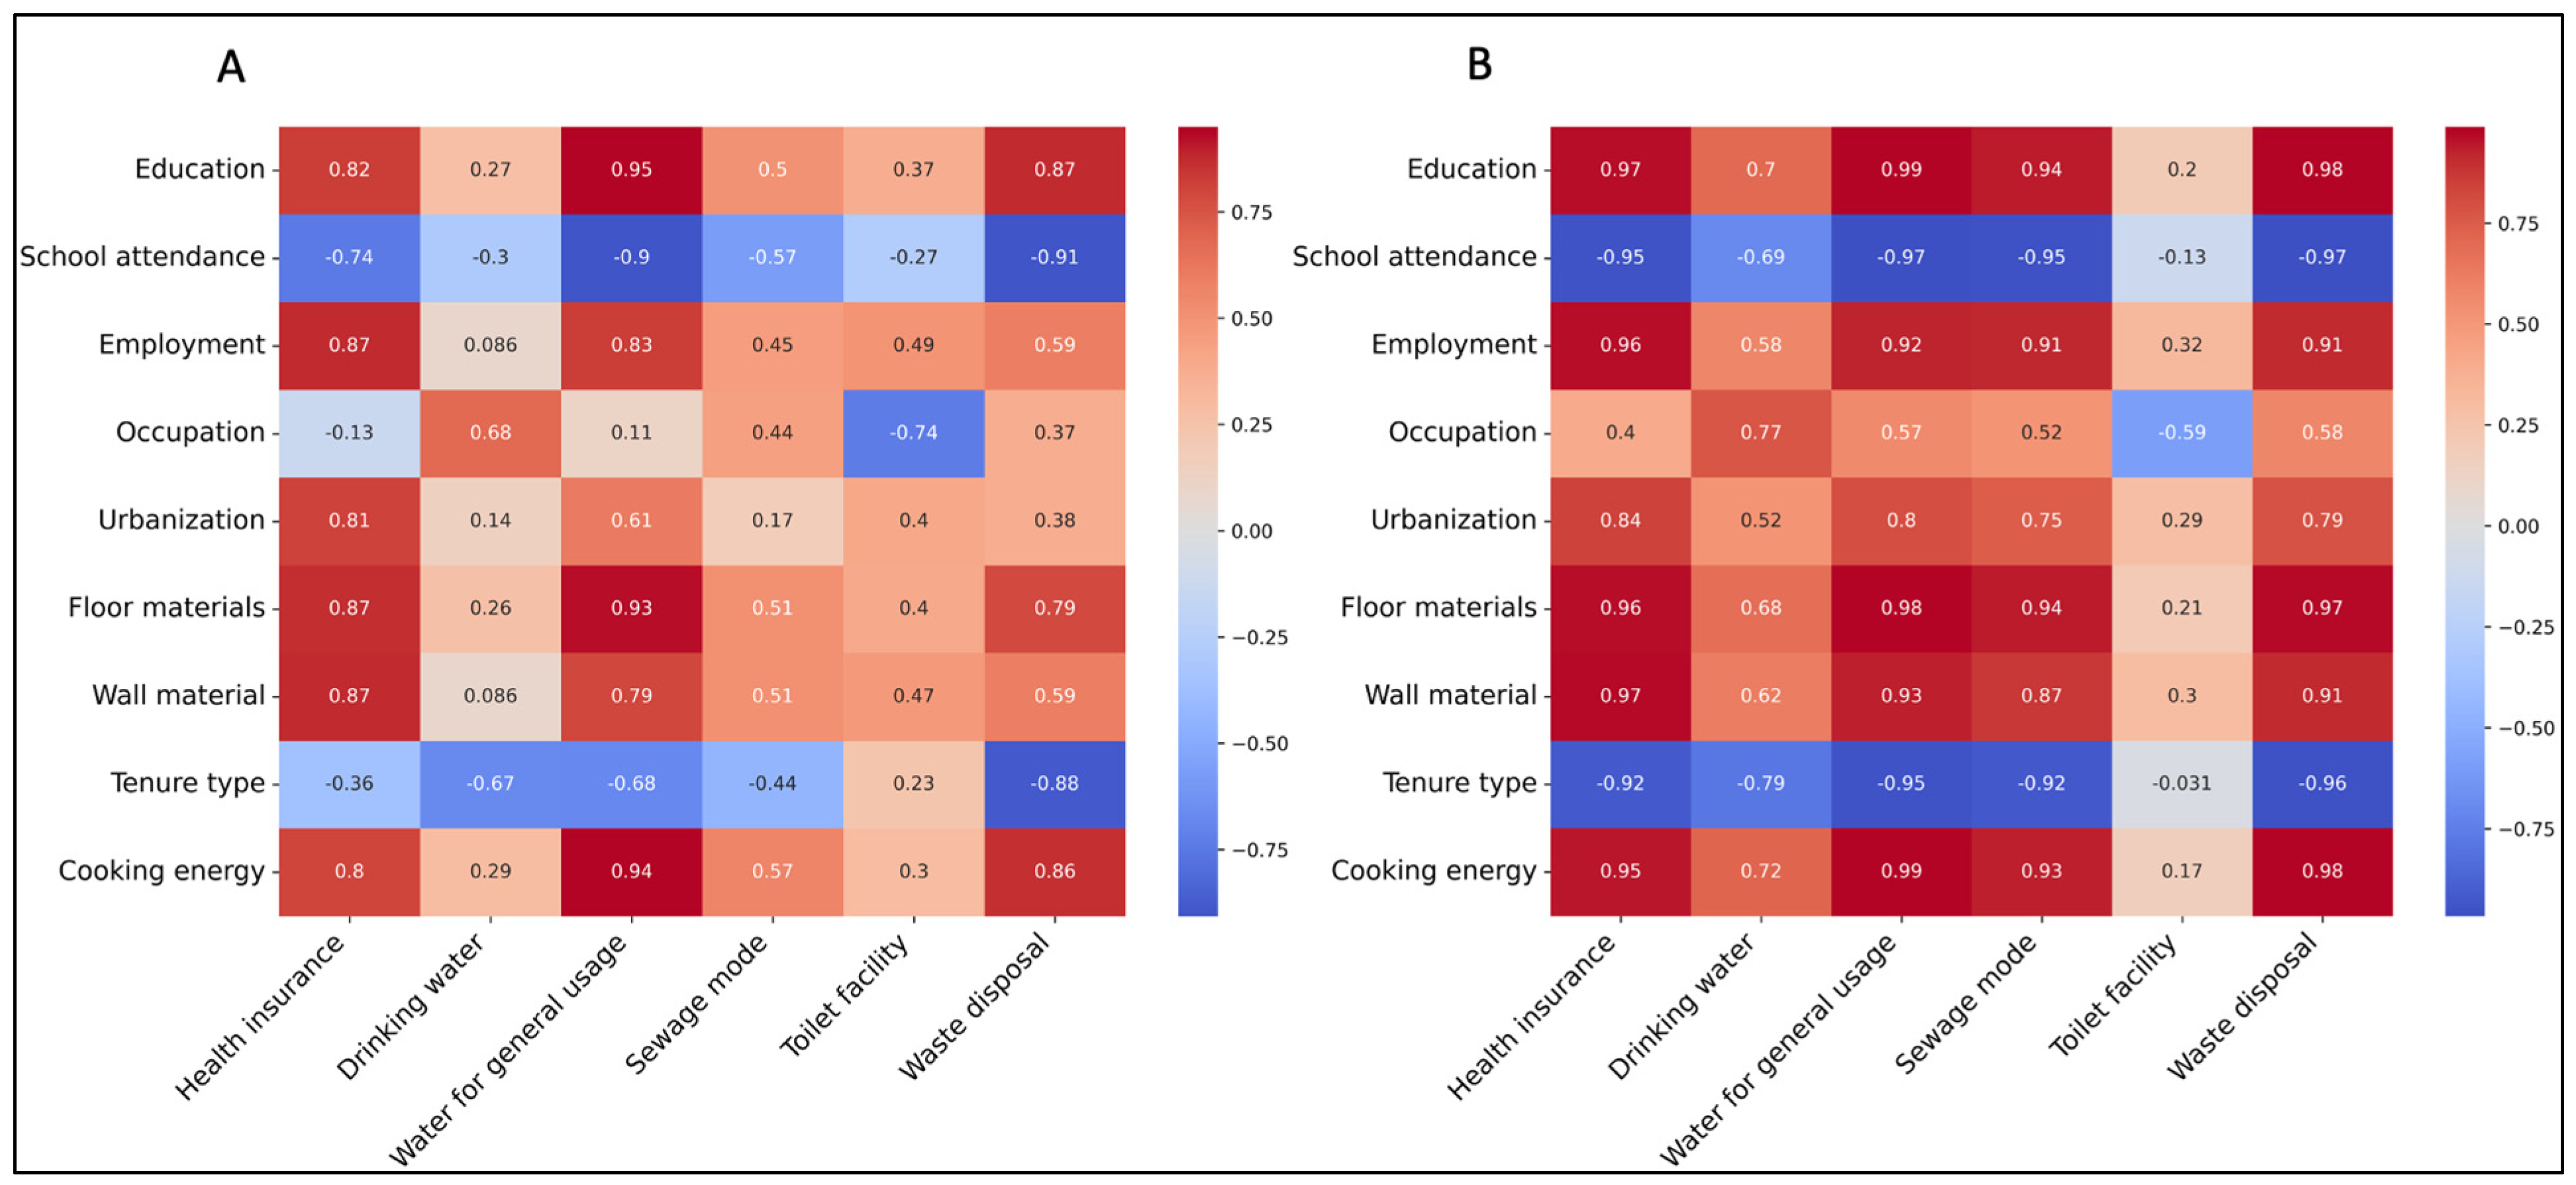
The findings illustrating the influence of socio-economic indicators and public health are captured in Figure 10A,B. The predicted indicators consistently exhibit stronger and more homogeneous monotonic correlations with determinants of public health than the observed indicators. This pattern suggests that the model predictions smooth the local noise and inconsistencies that are present in the observed data, yielding clearer sector-level relationships. While the observed indicators reflect real-world variability, they are also affected by reporting errors, aggregation effects, and missingness, which may weaken apparent associations with health outcomes. Some negative or weak correlations indicate localized or domain-specific mismatches that are not fully captured by socio-economic decile scores. The predicted matrix (left) reveals even stronger and more uniformly positive correlations than the observed matrix. For instance, predicted education shows a near-perfect correlation with several health-related indicators (r > 0.9), while observed education correlations are slightly lower (e.g., r = 0.82 with health insurance). This suggests that the model captures and may amplify monotonic relationships between these domains.
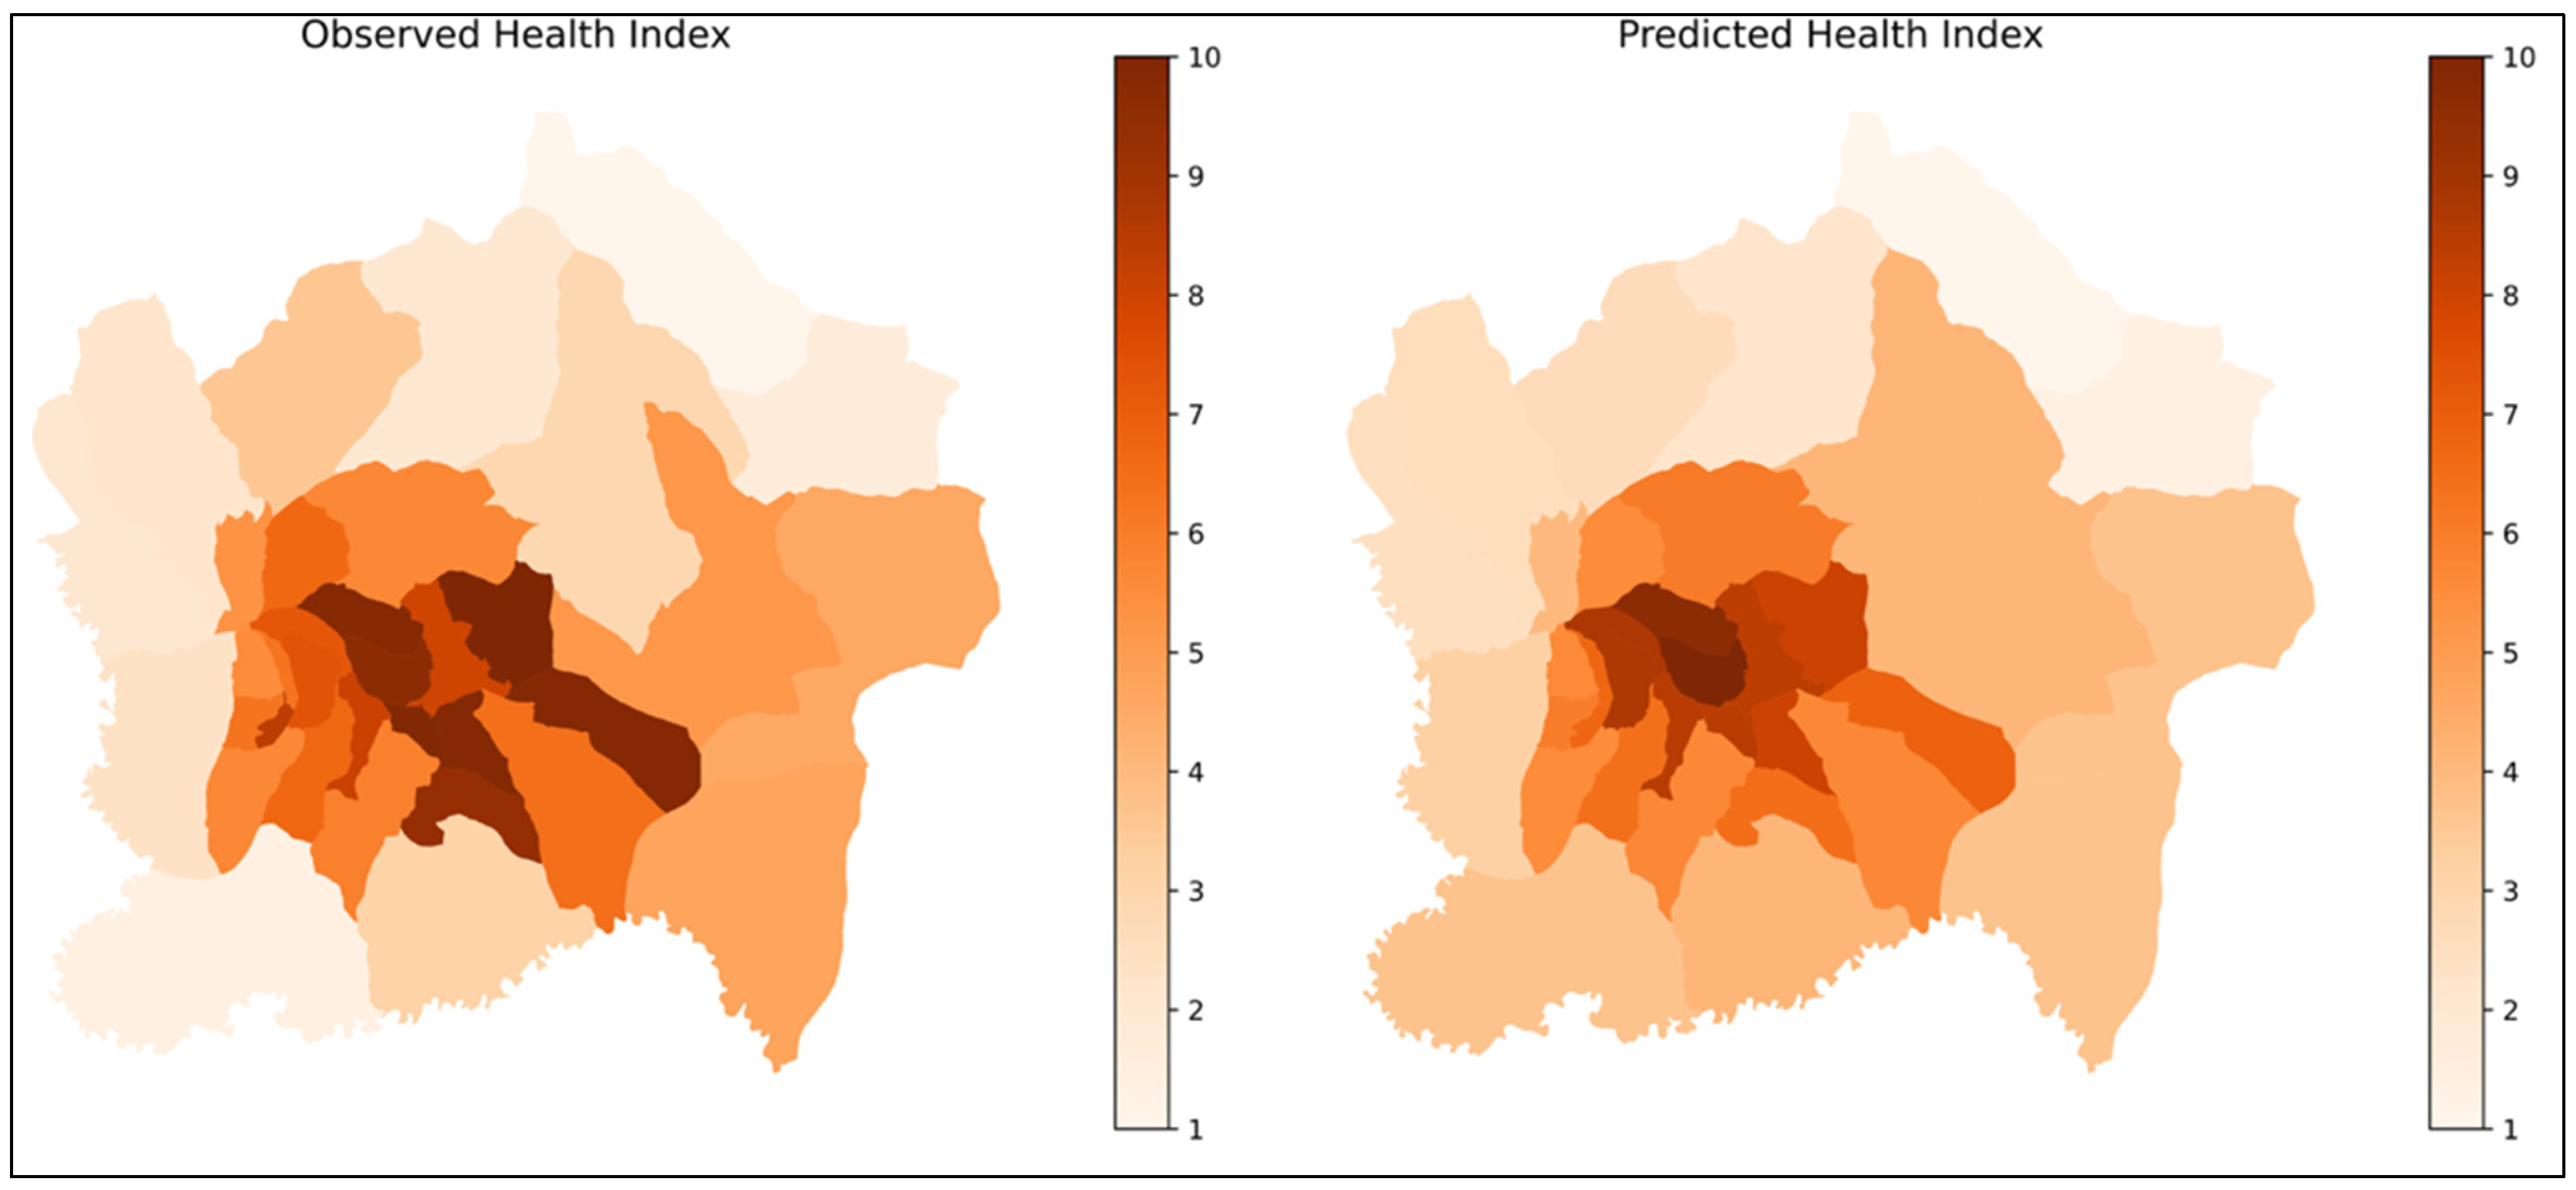
We also evaluate the extent to which socio-economic indicators generally influence public health, using its corresponding index obtained by us. The observed and predicted indices showed a strong association (r = 0.91) and low prediction error (MAE = 0.92; RMSE = 1.19). The OLS regression indicated that socio-economic indicators are significant predictors of the health index (adjusted R2 = 0.97). The data analysis results illustrated in Figure 11 reveal a close alignment between observed and predicted indices from sparsely built rural environments to dense urban cores, aligning with the observed employment and infrastructure conditions.
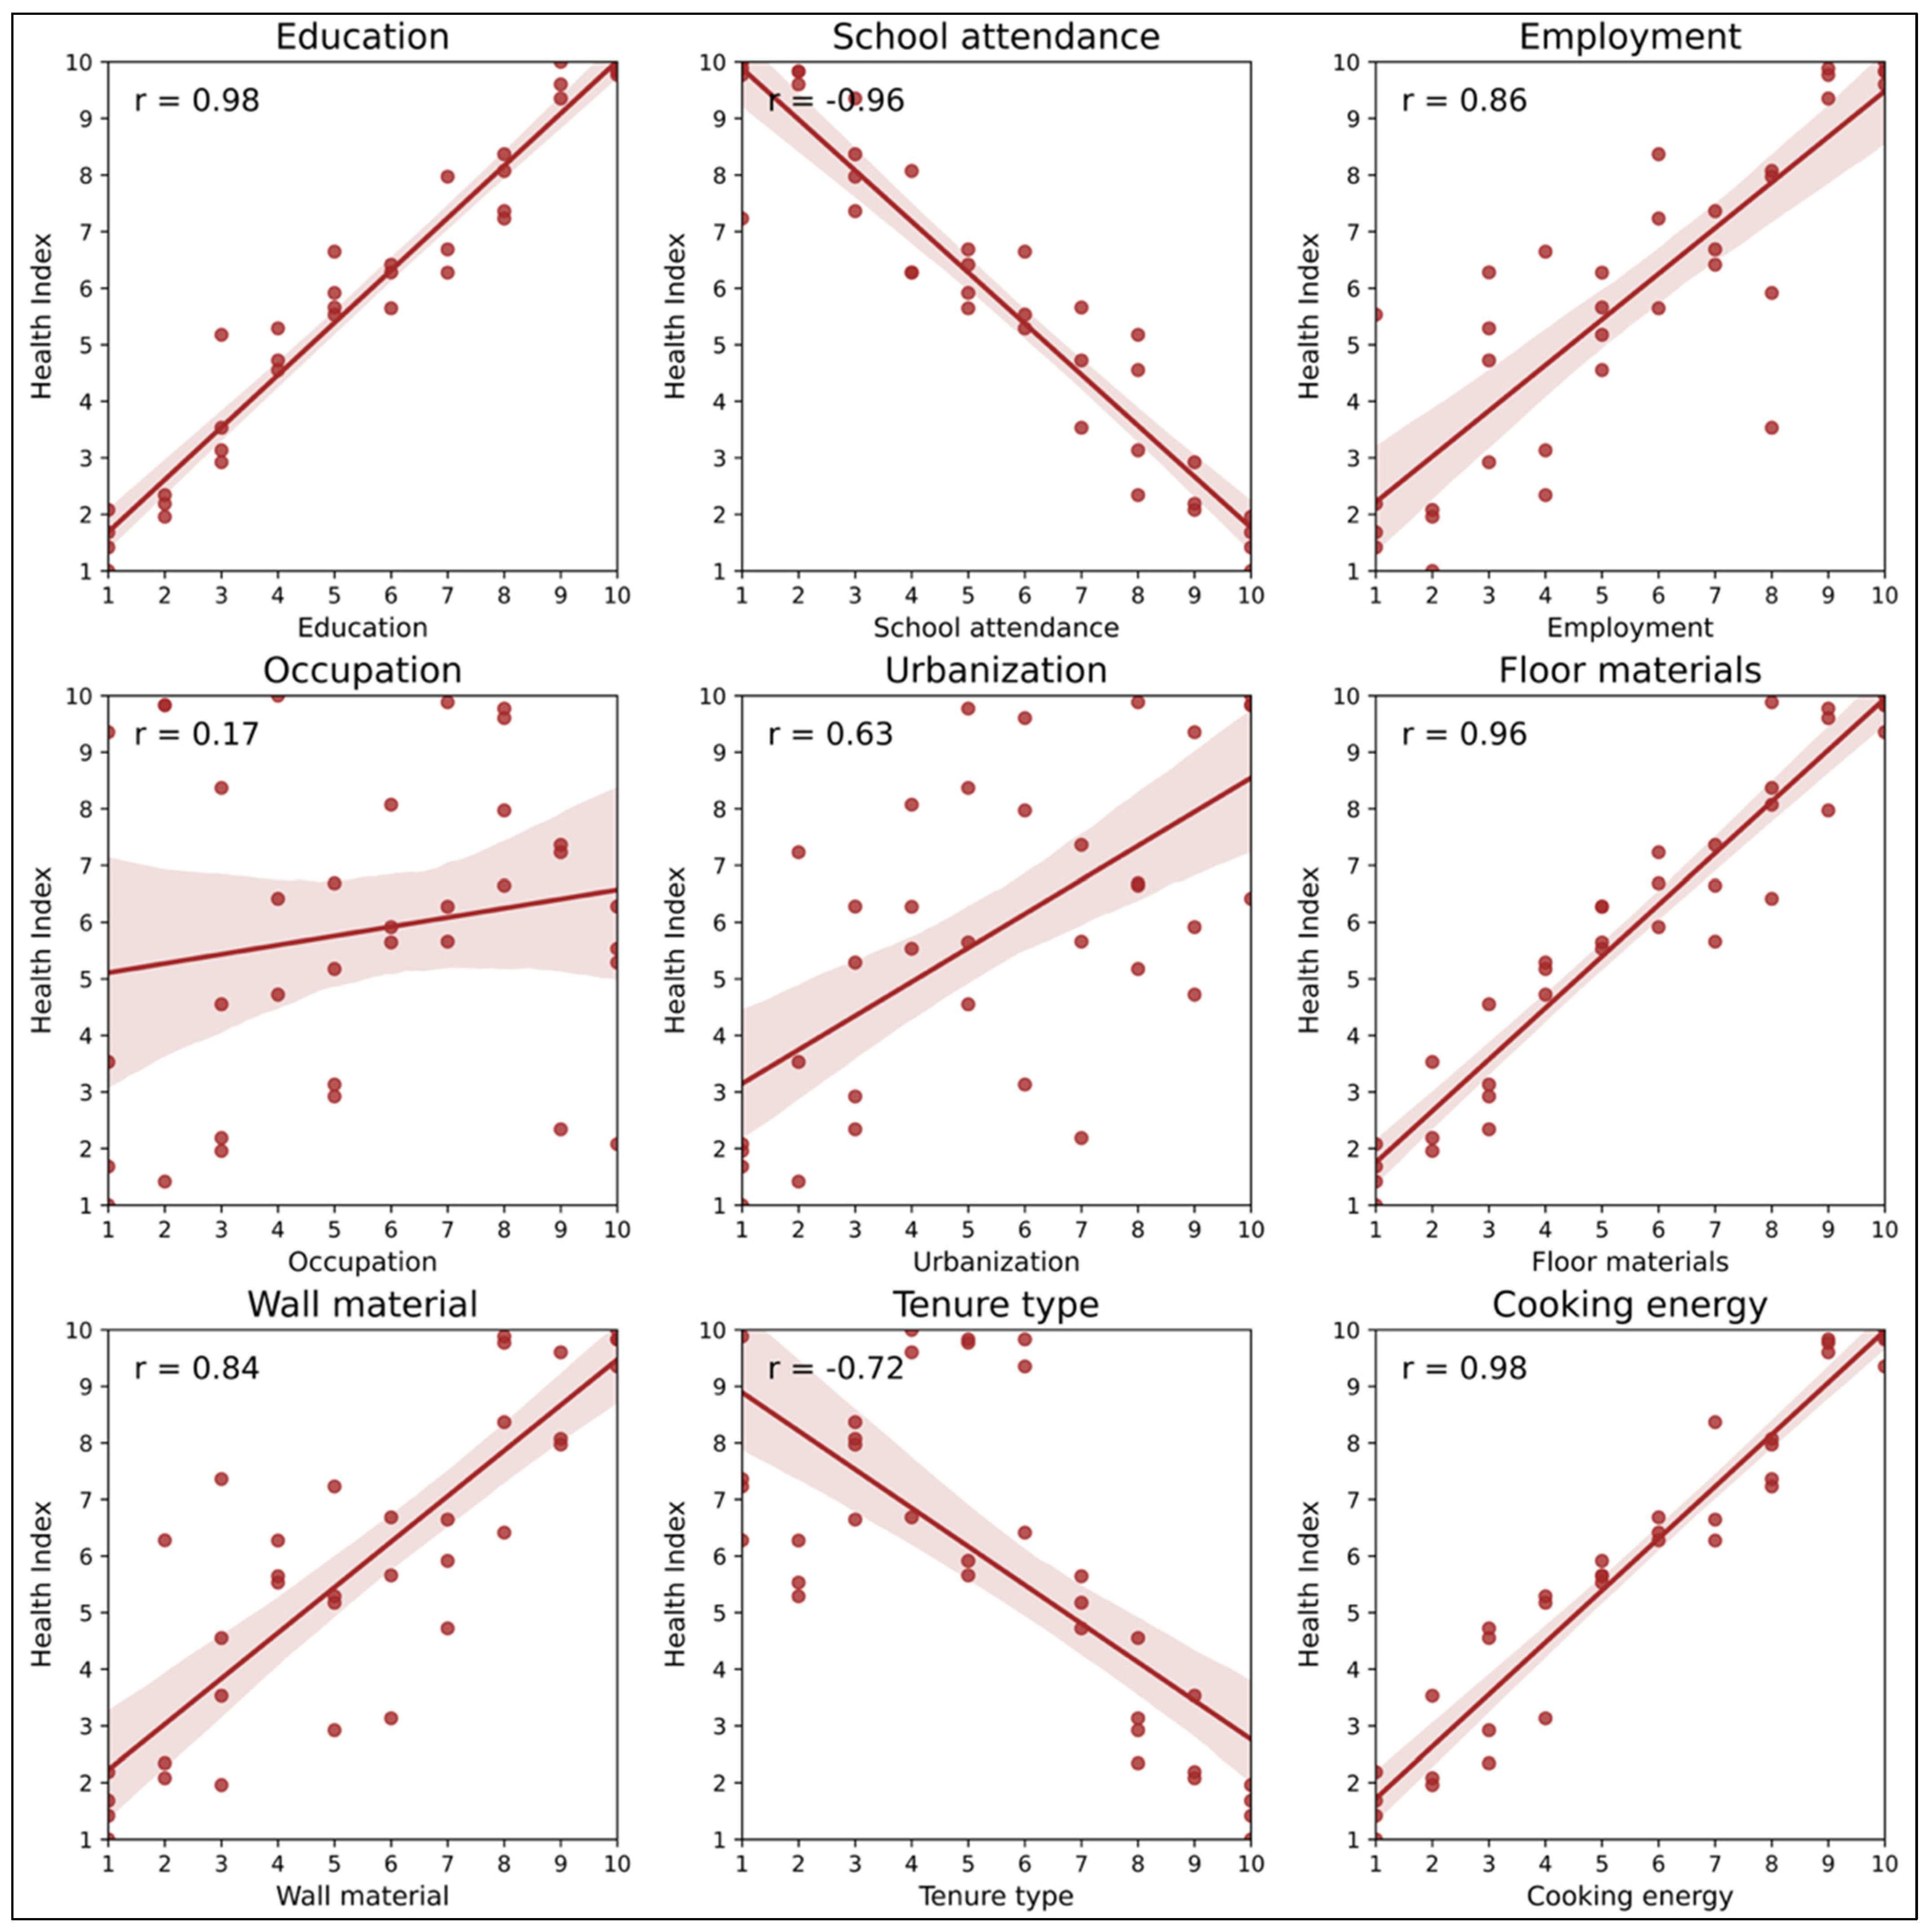
Scatter plots (Figure 12) reveal that education (r = 0.98), cooking energy (r = 0.98), floor materials (r = 0.96), wall materials (r = 0.84), and employment (r = 0.86) were the strongest predictors of the health index, reflecting the combined influence of infrastructure quality, energy access, and labor participation (occupation) on population health. Urbanization showed a moderate association (r = 0.63), while school attendance (r = −0.96) and tenure type (r = −0.72) exhibited strong negative correlations, suggesting complex socio-demographic effects that run counter to the expected trends.

6. Discussion

This study introduces a multimodal deep learning framework that integrates satellite imagery and street network data to model urban socio-economic indicators and public health determinants in a data-scarce urban environment. The findings (see Table 1 and Figure 5 and Figure 6) highlight that multimodal and fusion approaches improve the predictive performance and interpretability for modeling complex urban conditions. This aligns with prior studies that demonstrated the benefit of multimodal fusion in urban analytics [24,25]. For instance, prior studies used CNN and satellite imagery to predict poverty, living conditions, and well-being [22,31], while street networks were used to predict economic status and deprivation [21]. Our findings align with the above studies, but extend them by showing that fusing these data modalities through an attention mechanism allows us to derive additional information and interpretation that would not be captured using a single data modality. This enabled more accurate prediction for most of the socio-economic indicators and public health determinants, compared to single-modality models. This is particularly significant in contexts where traditional data such as surveys and censuses are unavailable or outdated. This use of an attentional mechanism approach is also supported by recent multimodal machine learning studies [25,68].
The findings (Figure 9) also revealed that fused embeddings highlight the structural, morphological, and topological attributes captured in high-resolution satellite imagery and street networks, which retain urban spatial visual and topological proxies that are crucial for predictive analysis [17,25]. The patterns of fused embedding highlight that beyond their predictive performance, they also provide a lens into the spatial logic of urban inequalities by capturing transitions between dense urban cores, peri-urban zones, and sparsely developed areas. This reflects how the settlement morphology and infrastructure networks shape the living conditions. Such representations can support planners and public health practitioners by identifying emerging zones of deprivation, infrastructure gaps, and spatial discontinuities in service provision. In rapidly urbanizing cities where formal data collection falls behind physical expansion, these embeddings provide a mechanism for timely situational awareness. They translate raw geospatial signals into interpretable patterns that can inform infrastructure prioritization, targeted interventions, and equity-oriented planning.
Findings illustrated by Figure 10A,B reveal a strong relationship between socio-economic indicators and public health determinants. Observed sector-level associations highlight how urban morphology, infrastructure, and service access collectively shape public health. The stronger correlations observed between predicted socio-economic indicators and public health determinants reveal that model predictions act as spatial proxies that capture latent urban structural patterns, rather than direct socio-economic measurements. Therefore, the results reflect noise reduction, spatial smoothing, or representation of underlying environmental gradients. This supports previous claims that deep learning methods can uncover latent spatial processes linking built environment features to social outcomes, particularly in urban contexts where formal data collections do not evolve with rapid urban changes, which would allow for urban monitoring [23,31]. In addition, findings on the influence of socio-economic indicators on public health (Figure 11) demonstrate that urban form and infrastructural characteristics encode strong socio-economic indicators that influence public health, and can be extracted through multimodal approaches. The high predictive power of education, energy access, and housing materials reveal the interconnectedness of living conditions and health, supporting long-standing urban planning theory while quantifying these effects at an unprecedented spatial resolution [4,32,50]. Some counterintuitive patterns in school attendance and tenure type arise from the specific spatial organization of City of Kigali, where peri-urban areas exhibit higher school attendance and home ownership, but still lack an adequate health-supporting infrastructure. These relationships should be understood as aggregate, place-based dynamics, rather than individual-level causal mechanisms. Urban sectors function as socio-spatial units shaped by historical development, infrastructure investment, and demographic processes. As a result, correlations at this level may reflect environmental gradients, service clustering, and settlement patterns, rather than direct behavioral or household-level effects.
In the proposed framework depicted in Figure 2, we hypothesize that satellite imagery encodes the visual and morphological cues of urban areas, while street networks encode the latent accessibility and connectivity patterns, and that their integration should yield an interpretable representation of socio-economic indicators and public health determinants. The observed performance of the multimodal model and the spatial coherence of predicted socio-economic indicators and public health determinants are broadly consistent with this hypothesis. In particular, the complementary strengths of CNN-derived morphological embeddings and GNN-derived topological embeddings suggest that inequality and health vulnerability are structurally embedded in both the physical form and network organization of the city. Partial divergences between predicted and census-based indicators do not contradict the framework; rather, they indicate that administrative statistics and learned spatial representations capture different observational layers of the same urban system. While the census data used summarize the discrete sector-level categories, the multimodal embeddings approximate the continuous spatial gradients of the infrastructure and environmental conditions. This convergence between modalities supports the conceptual premise that urban socio-economic indicators and public health determinants are multi-dimensional and cannot be fully explained by a single data source.
Some methodological considerations should be noted. First, using sector-level labels introduces aggregation effects that may obscure intra-sector heterogeneity and exposes the analysis to the Modifiable Areal Unit Problem (MAUP). As a result, statistical relationships can vary, depending on the spatial zoning system. While this approach is necessary in data-constrained contexts and enables multimodal learning, it smooths fine-scale variability in socio-economic and environmental conditions. Consequently, correlations observed at the sector level may differ under alternative aggregation schemes. Moreover, these correlations represent aggregated spatial associations and should not be interpreted as individual-level relationships. The study also assumes temporal stationarity, representing socio-economic and health conditions at a single point in time. Urban systems are dynamic, so future work should incorporate time-resolved data, such as satellite imagery, mobility traces, or longitudinal administrative records. Additionally, multi-scale or hierarchical modeling could capture both fine-grained spatial variation and temporal dynamics. Expanding the framework to include other urban datasets, such as points of interest or mobile phone metadata, could further improve the predictive accuracy and interpretability.

7. Conclusions

This study proposed a multimodal deep learning framework, integrating high-resolution satellite imagery with street network datasets alongside deep learning models, to predict the spatial patterns of socio-economic indicators and public health determinants and their inter-relationships in urban environments. The findings highlight that the framework achieved strong predictive performance, which confirmed that fused embeddings portray visual and topological proxies that are essential to approximate urban living conditions. These embeddings encode signals portraying socio-economic indicators and public health determinants and its dimensional space illustrate a continuous gradient from sparsely built rural areas to densely developed urban core. This reveals how the built urban environment reflects the underlying disparities. The findings indicate that multimodal deep learning approaches can generate disaggregated and policy-relevant information that is essential for urban planning and the decision-making process, which is highly relevant in data scarce settings where conventional socio-economic and health surveys are costly, outdated or unavailable. Thus, operationalizing the proposed framework at scale can support evidence-based planning and targeted interventions to address disparities, ultimately enabling more equitable and health-conscious urban development for the achievement of the Sustainable Development Goals, mainly target 3 of goal 11.

Author Contributions

Conceptualization, E.D., J.P.B. and E.U.; methodology, E.D., J.P.B., E.U. and P.G.; software, E.D.; validation, E.D., J.P.B., E.U., P.G. and E.M.; formal analysis, E.D.; investigation, J.P.B., E.U., P.G. and E.M.; resources, E.D.; data curation, E.D.; writing—original draft preparation, E.D.; writing—review and editing, E.D., J.P.B., E.U., P.G. and E.M.; visualization, E.D.; supervision, J.P.B., E.U., P.G. and E.M. All authors have read and agreed to the published version of the manuscript.

Funding

This research was funded by the National Institutes of Health (NIH), grant numbers U2RTW012122 and UE5 HL172181, provided through Research Training in Data Science for Health in Rwanda, collaborative projects between the Regional Centre of Excellence in Biomedical Engineering and E-Health (CEBE), at the University of Rwanda, African Institute for Mathematical Sciences (AIMS) and Washington University in Saint Louis. The APC was funded by the NIH.

Institutional Review Board Statement

Not applicable.

Informed Consent Statement

Not applicable.

Data Availability Statement

Satellite imagery is available upon request from the National Land Authority of Rwanda (NLA). The statistical census dataset is accessible upon request, through the National Institute of Statistics of Rwanda (NISR) at https://microdata.statistics.gov.rw/ (accessed on 2 December 2024). The street network dataset is publicly available from OpenStreetMap (OSM) at https://www.openstreetmap.org/ (accessed on 22 June 2024). Code replicating the study will be available upon publication at https://github.com/Jesse-DE/profiling-urban-se-and-ph.

Conflicts of Interest

The authors declare no conflicts of interest.

Appendix A

Appendix A.1. Detailed Information for Used Socio-Economic Indicators

  • Education: Education is a primary driver of socio-economic status, influencing employment opportunities, health literacy, and long-term household income. Higher levels of educational attainment, such as tertiary education, indicate access to specialized skills, formal employment, and upward mobility, and thus were assigned the highest score (4). Upper and lower secondary levels (scores of 3 and 2, respectively) reflect moderate education attainment, offering greater opportunities than basic schooling. Primary education (score 1), while enabling literacy, indicates more limited social and economic prospects. The education variable thus stratifies the population by human capital, a core determinant of household well-being.
  • School attendance: Although limited in description, the school attended variable (coded as 1, 2, 3) was interpreted as levels of school participation. Higher values were scored more favorably (3 for 3), assuming progression through the education system. This aligns with developmental trajectories and reflects long-term access to educational services, a crucial foundation for human capital formation.
  • Employment: The nature of employment reveals household income stability and integration into the formal economy. Employers with regular employees (score 5) represent business ownership and economic independence. Employees (score 4) indicate salaried and formal sector work. Paid apprentices (score 3) are still in transitional roles but are typically on a pathway to skilled employment. Own-account workers without employees (score 2) reflect informal or subsistence work. Contributing family workers (score 1) and those under Other (score 0) are often economically dependent or marginally engaged in the labor markets. This stratification captures the occupational vulnerability and economic productivity.
  • Occupation: The type of occupation provides deeper insight into the skill levels and income categories of employed individuals. Scientific activities (score 5) are highly specialized and associated with higher education and income. Administrative, hospitality, and transport services (scores 4–3) represent mid-level white- and blue-collar jobs. Retail, construction, and manufacturing (scores 3–2) are typically labor-intensive, with varying formality. Agriculture, mining, and household care (score 1) suggest low-income and subsistence-level livelihoods. Not stated and others were scored 0, due to their ambiguity. These distinctions capture the distribution of labor and social class.
  • Wall material: Wall materials indicate the physical integrity and safety of dwellings. Burnt bricks with cement and cement blocks (scores 5 and 4) indicate durable and formally constructed homes. Sun-dried bricks, whether with cement or not (scores 3–2), are common in transitional or informal housing. Wood and mud constructions (score 1) are vulnerable to the weather, pests, and structural failure. Not stated walls (score 0) likely reflect highly informal housing. The hierarchy captures the material’s resilience and construction quality.
  • Floor material: Flooring is a clear marker of household investment in sanitation and comfort. Tile floors (score 3) are durable and hygienic, and are typical in well-built homes. Cement floors (score 2) are utilitarian and moderately comfortable. Earth floors (score 1) are porous, dusty, and unsanitary, reflecting deprivation. The floor quality is directly linked to cleanliness and respiratory health.
  • Urbanization: The type of residential area reflects broader urban or rural development planning. Modern planned urban areas (score 4) benefit from road networks, water, and sanitation infrastructure. Planned rural settlements (score 3) offer some structure but fewer services. Spontaneous urban settlements (score 2) and unplanned rural housing (score 1) are often informal, with limited services. These distinctions align with spatial inequality and urban–rural divides.
  • Cooking energy: Cooking energy is a direct proxy for indoor air quality and economic status. Gas (score 3) is clean, efficient, and costly. Charcoal (score 2) is more affordable but produces smoke and indoor pollutants. Firewood (score 1), though common, is labor-intensive and harmful to respiratory health. The scoring reflects both environmental impact and household welfare.
  • Tenure type: Housing tenure affects economic stability. Owners (score 2) are more secure and likely to invest in property improvements, reflecting asset accumulation. Tenants (score 1) have less control over their living conditions and are more vulnerable to displacement and rent shocks. Ownership is thus favored as a marker of economic stability and autonomy. However, the tenure type seems predominant in rural settings due to high urban migration, with more immigrants lacking land and property ownership.

Appendix A.2. Detailed Information for Used Public Health Determinants

  • Health insurance: Health insurance type reflects access to medical services and the financial means to afford them. Private insurance (score 4) denotes high-income status and broad coverage. MMI and RSSB (scores 3 and 2, respectively) cover civil servants and formal workers. Community-based health insurance (score 1) serves low-income populations with limited benefit packages. The scores align with healthcare accessibility, financial protection, and the structural capacity of the health system to serve different income groups.
  • Toilet facility: Sanitation is essential for public health and human dignity. Flush toilets for single households (score 3) represent the highest sanitation standard. Pit latrines with slabs (scores 2 and 1) vary based on usage (individual vs shared), with shared facilities posing greater hygiene risks. These scores reflect increasing exposure to infectious diseases and decreasing sanitation quality.
  • Sewage mode: Sewage disposal reflects infrastructure adequacy. The main sewer systems (score 5) represent modern, safe waste management. Sumps, courtyard systems, and cesspools (scores 4–2) offer decreasing hygiene and safety. Open disposal in channels, bushes, or rivulets (score 1–0) is unsanitary and environmentally harmful. These categories stratify the environmental health risk and infrastructure coverage.
  • Drinking water: Access to drinking water reflects both the service provision and health risk. Internal piped water (score 5) is safest and most convenient. Compound taps (score 4) and neighbor pipes or protected wells (score 3) suggest shared or semi-secure access. Public taps (score 2) require queuing and water transport. Unprotected springs and Other (scores 1–0) reflect unsafe and unreliable sources, increasing waterborne disease risk.
  • Water for general usage: Broader water access includes water for cleaning and hygiene. The scoring parallels of drinking water from internal pipes (score 5) are optimal, followed by compound or neighbor sources and protected springs (scores 4–3). Public taps and unprotected sources (scores 2–1) represent growing levels of insecurity. Surface water like rivers or lakes (score 0) pose high disease risks. These variables capture household vulnerability to water insecurity.
  • Waste disposal: Solid waste disposal reveals environmental management and municipal service access. Formal collection services (score 3) indicate robust infrastructure. Composting (score 2) is eco-friendly but often informal. Dumping in fields or bushes (score 1) poses environmental and health hazards. This variable aligns with environmental cleanliness and vector-borne disease exposure.

Appendix B

Figure A1. Loss function and MAE by iteration for training and validation datasets on CNN model, using satellite imagery.
Urbansci 10 00177 g0a1
Figure A2. Loss function and MAE by iteration for training and validation datasets for GCN model, using street network.
Urbansci 10 00177 g0a2
Figure A3. Loss function and MAE by iteration for training and validation datasets for MLP model, using fused embeddings.
Urbansci 10 00177 g0a3

Appendix C

Table A1. Model architecture.
ModelLayersHidden UnitsEmbedding DimOutput
CNNResNet50 + Dense256256Multi-output regression
GCN2 GCN layers3232 projected to 256Multi-output regression
FusionAttention projection256256Fused embedding
MLP2 hidden layers256Final prediction
Table A2. Training protocol.
SettingValue
OptimizerAdam
Learning rate (GCN)0.01
Batch size32
Epochs100 (30 per CV fold)
Loss functionMean Squared Error
Validation5-fold cross-validation (seed = 42)
Train/test split80%/20% (sector-separated)
Table A3. Graph construction.
Graph PropertyConfiguration
NodesRoad segments
Node featuresOne-hot surface + highway + normalized length/max speed
Edge constructionk-NN (k = 3) via KDTree
Edge directionBidirectional
PoolingGlobal mean pooling

Appendix D

Table A4. Cross-validation performance, using fused embeddings across socio-economic indicators and public health determinants.
MAE_meanMAE_stdr_meanr_std
Socio-economic indicatorsEducation1.200.030.780.01
School attendance1.260.040.770.01
Employment1.600.040.670.01
Occupation1.630.030.570.02
Urbanization1.990.050.610.02
Floor materials1.250.020.780.01
Wall material1.500.030.710.01
Tenure type1.160.030.730.01
Public health determinantsHealth insurance1.610.030.670.00
Drinking water1.840.030.580.02
Water for general usage1.290.030.760.01
Cooking energy1.180.040.790.01
Sewage mode1.750.030.590.02
Toilet facility1.680.030.500.01
Waste disposal1.110.040.770.01
The results captured in Table A4 show that cooking energy, floor materials, education, waste disposal, school attendance, and general water usage were predicted most accurately, with correlation coefficients ranging from 0.76 to 0.79 and low MAEs of around 1.1–1.3, suggesting that the model captures spatially encoded patterns effectively. Variables that are highly heterogeneous, or less directly observable from spatial data, such as occupation, drinking water, sewage mode, and toilet facility, showed a moderate predictive accuracy (r ≈ 0.50–0.61, MAE ≈ 1.63–1.99), highlighting the limits of inference from spatial embeddings. Across all targets, the small standard deviations for both MAE and r indicate that performance was consistent across folds, demonstrating the stability and reproducibility of the results and giving confidence that the model generalizes well across the dataset.

Appendix E

Figure A4. Sector-wise modality dominance in attention-based fusion.
Urbansci 10 00177 g0a4
The horizontal bars represent sectors, with bar length corresponding to the dominance score. Blue bars indicate sectors where the road network contributes more to predictions, while green bars indicate sectors with balanced contributions between modalities. This visualization highlights which modality drives predictions in each sector, providing interpretable, actionable insights for urban planning and socio-economic analysis.

References

  1. Balland, P.A.; Jara-Figueroa, C.; Petralia, S.G.; Steijn, M.P.A.; Rigby, D.L.; Hidalgo, C.A. Complex economic activities concentrate in large cities. Nat. Hum. Behav. 2020, 4, 248–254. [Google Scholar] [CrossRef] [Scilit]
  2. Ezzati, M.; Webster, C.J.; Doyle, Y.G.; Rashid, S.; Owusu, G.; Leung, G.M. Cities for global health. BMJ 2018, 363, k3794. [Google Scholar] [CrossRef] [Scilit]
  3. Friesen, J.; Friesen, V.; Dietrich, I.; Pelz, P.F. Slums, Space, and State of Health—A Link between Settlement Morphology and Health Data. Int. J. Environ. Res. Public Health 2020, 17, 2022. [Google Scholar] [CrossRef] [Scilit]
  4. Luca, M.; Campedelli, G.M.; Centellegher, S.; Tizzoni, M.; Lepri, B. Crime, inequality and public health: A survey of emerging trends in urban data science. Front. Big Data 2023, 6, 1124526. [Google Scholar] [CrossRef] [Scilit]
  5. United Nations. 2018 Revision of World Urbanization Prospects|Multimedia Library—United Nations Department of Economic and Social Affairs. Available online: https://population.un.org/wup/assets/Publications/WUP2018-Report.pdf (accessed on 19 May 2020).
  6. Loughran, K.; Elliott, J.R. Unequal Retreats: How Racial Segregation Shapes Climate Adaptation. Hous. Policy Debate 2022, 32, 171–189. [Google Scholar] [CrossRef] [Scilit]
  7. Nagendra, H.; Bai, X.; Brondizio, E.S.; Lwasa, S. The urban south and the predicament of global sustainability. Nat. Sustain. 2018, 1, 341–349. [Google Scholar] [CrossRef] [Scilit]
  8. United Nations. Transforming Our World: The 2030 Agenda for Sustainable Development. A/RES/70/1. 2015. Available online: https://www.un.org/en/development/desa/population/migration/generalassembly/docs/globalcompact/A_RES_70_1_E.pdf (accessed on 20 May 2020).
  9. Gavens, L.; Holmes, J.; Bühringer, G.; McLeod, J.; Neumann, M.; Lingford-Hughes, A.; Hock, E.S.; Meier, P.S. Interdisciplinary working in public health research: A proposed good practice checklist. J. Public Health 2018, 40, 175–182. [Google Scholar] [CrossRef] [Scilit]
  10. Hamblion, E.; Saad, N.J.; Greene-Cramer, B.; Awofisayo-Okuyelu, A.; Minet, D.S.; Smirnova, A.; Tahelew, E.E.; Kaasik-Aaslav, K.; Ezerska, L.A.; Lata, H.; et al. Global public health intelligence: World Health Organization operational practices. PLoS Glob. Public Health 2023, 3, e0002359. [Google Scholar] [CrossRef] [Scilit] [PubMed]
  11. UN-Habitat. Urbanization and Development: Emerging Futures; UN-Habitat: Nairobi, Kendya, 2016; Available online: https://unhabitat.org/sites/default/files/download-manager-files/WCR-2016-WEB.pdf (accessed on 22 May 2020).
  12. Rusli, N.; Ling, G.H.T.; Hussain, M.H.M.; Salib, N.S.M.; Bakar, S.Z.A.; Othman, M.H. A review on worldwide urban observatory systems’ data analytics themes: Lessons learned for Malaysia Urban Observatory (MUO). J. Urban Manag. 2023, 12, 231–254. [Google Scholar] [CrossRef] [Scilit]
  13. Skinner, C. Issues and Challenges in Census Taking. Annu. Rev. Stat. Appl. 2018, 5, 49–63. [Google Scholar] [CrossRef] [Scilit]
  14. Kuffer, M.; Wang, J.; Nagenborg, M.; Pfeffer, K.; Kohli, D.; Sliuzas, R.; Persello, C. The scope of earth-observation to improve the consistency of the SDG slum indicator. ISPRS Int. J. Geo-Inf. 2018, 7, 428. [Google Scholar] [CrossRef] [Scilit]
  15. Esch, T.; Heldens, W.; Hirner, A.; Keil, M.; Marconcini, M.; Roth, A.; Zeidler, J.; Dech, S.; Strano, E. Breaking new ground in mapping human settlements from space—The Global Urban Footprint. ISPRS J. Photogramm. Remote Sens. 2017, 134, 30–42. [Google Scholar] [CrossRef] [Scilit]
  16. Burke, M.; Driscoll, A.; Lobell, D.B.; Ermon, S. Using satellite imagery to understand and promote sustainable development. Science 2021, 371, 1219. [Google Scholar] [CrossRef] [Scilit]
  17. Ahn, D.; Yang, J.; Cha, M.; Yang, H.; Kim, J.; Park, S.; Han, S.; Lee, E.; Lee, S.; Park, S. A human-machine collaborative approach measures economic development using satellite imagery. Nat. Commun. 2023, 14, 6811. [Google Scholar] [CrossRef] [Scilit]
  18. Mboga, N.; Georganos, S.; Grippa, T.; Lennert, M.; Vanhuysse, S.; Wolff, E. Fully convolutional networks and geographic object-based image analysis for the classification of VHR imagery. Remote Sens. 2019, 11, 597. [Google Scholar] [CrossRef] [Scilit]
  19. Juhász, S.; Pintér, G.; Kovács, Á.J.; Borza, E.; Mónus, G.; Lőrincz, L.; Lengyel, B. Amenity complexity and urban locations of socio-economic mixing. EPJ Data Sci. 2023, 12, 34. [Google Scholar] [CrossRef] [Scilit]
  20. Yeh, C.; Perez, A.; Driscoll, A.; Azzari, G.; Tang, Z.; Lobell, D.; Ermon, S.; Burke, M. Using publicly available satellite imagery and deep learning to understand economic well-being in Africa. Nat. Commun. 2020, 11, 2583. [Google Scholar] [CrossRef] [Scilit]
  21. Li, T.; Xin, S.; Xi, Y.; Tarkoma, S.; Hui, P.; Li, Y. Predicting Multi-level Socioeconomic Indicators from Structural Urban Imagery. In Proceedings of the 31st ACM International Conference on Information & Knowledge Management, Atlanta, GA, USA, 17–21 October 2022; ACM: New York, NY, USA, 2022; pp. 3282–3291. [Google Scholar] [CrossRef] [Scilit]
  22. Castro, D.A.; Álvarez, M.A. Predicting socioeconomic indicators using transfer learning on imagery data: An application in Brazil. GeoJournal 2023, 88, 1081–1102. [Google Scholar] [CrossRef] [Scilit]
  23. Jean, N.; Burke, M.; Xie, M.; Davis, W.M.; Lobell, D.B.; Ermon, S. Combining satellite imagery and machine learning to predict poverty. Science 2016, 353, 790–794. [Google Scholar] [CrossRef] [Scilit] [PubMed]
  24. Liu, Y.; Zhang, X.; Ding, J.; Xi, Y.; Li, Y. Knowledge-infused Contrastive Learning for Urban Imagery-based Socioeconomic Prediction. In Proceedings of the ACM Web Conference, Austin, TX, USA, 30 April–4 May 2023; ACM: New York, NY, USA, 2023; pp. 4150–4160. [Google Scholar] [CrossRef] [Scilit]
  25. Xi, Y.; Li, T.; Wang, H.; Li, Y.; Tarkoma, S.; Hui, P. Beyond the First Law of Geography: Learning Representations of Satellite Imagery by Leveraging Point-of Interests. In Proceedings of the ACMWeb Conference 2022 (WWW’22), Lyon, France, 25–29 April 2022; ACM: New York, NY, USA, 2022; pp. 3308–3316. [Google Scholar] [CrossRef] [Scilit]
  26. Fan, Z.; Zhang, F.; Loo, B.P.Y.; Ratti, C. Urban visual intelligence: Uncovering hidden city profiles with street view images. Proc. Natl. Acad. Sci. USA 2023, 120, e2220417120. [Google Scholar] [CrossRef] [Scilit]
  27. Chong, S.K.; Bahrami, M.; Chen, H.; Balcisoy, S.; Bozkaya, B.; Pentland, S. Economic outcomes predicted by diversity in cities. EPJ Data Sci. 2020, 9, 17. [Google Scholar] [CrossRef] [Scilit]
  28. Georganos, S.; Grippa, T.; Gadiaga, A.N.; Linard, C.; Lennert, M.; VanHuysse, S.; Mboga, N.; Wolff, E.; Kalogirou, S. Geographical random forests: A spatial extension of the random forest algorithm to address spatial heterogeneity in remote sensing and population modelling. Geocarto Int. 2021, 36, 121–136. [Google Scholar] [CrossRef] [Scilit]
  29. Hafner, S.; Georganos, S.; Mugiraneza, T.; Ban, Y. Mapping Urban Population Growth from Sentinel-2 MSI and Census Data Using Deep Learning: A Case Study in Kigali, Rwanda. 2023. Available online: http://arxiv.org/abs/2303.08511 (accessed on 2 August 2023).
  30. Abascal, A.; Rothwell, N.; Shonowo, A.; Thomson, D.R.; Elias, P.; Elsey, H.; Yeboah, G.; Kuffer, M. “Domains of deprivation framework” for mapping slums, informal settlements, and other deprived areas in LMICs to improve urban planning and policy: A scoping review. Comput. Environ. Urban Syst. 2022, 93, 101770. [Google Scholar] [CrossRef] [Scilit]
  31. Dufitimana, E.; Gahungu, P.; Uwayezu, E.; Mugisha, E.; Poorthuis, A.; Bizimana, J.P. Measuring urban socio-economic disparities in the global south from space using convolutional neural network: The case of the City of Kigali, Rwanda. GeoJournal 2024, 89, 107. [Google Scholar] [CrossRef] [Scilit]
  32. Thomson, D.R.; Linard, C.; Vanhuysse, S.; Steele, J.E.; Shimoni, M.; Siri, J.; Caiaffa, W.T.; Rosenberg, M.; Wolff, E.; Grippa, T.; et al. Extending Data for Urban Health Decision-Making: A Menu of New and Potential Neighborhood-Level Health Determinants Datasets in LMICs. J. Urban Health 2019, 96, 514–536. [Google Scholar] [CrossRef] [Scilit]
  33. Salgado, M.; Madureira, J.; Mendes, A.S.; Torres, A.; Teixeira, J.P.; Oliveira, M.D. Environmental determinants of population health in urban settings. A systematic review. BMC Public Health 2020, 20, 853. [Google Scholar] [CrossRef] [Scilit] [PubMed]
  34. Darin-Mattsson, A.; Fors, S.; Kåreholt, I. Different indicators of socioeconomic status and their relative importance as determinants of health in old age. Int. J. Equity Health 2017, 16, 173. [Google Scholar] [CrossRef] [Scilit] [PubMed]
  35. Kabudula, C.W.; Houle, B.; Collinson, M.A.; Kahn, K.; Tollman, S.; Clark, S. Assessing Changes in Household Socioeconomic Status in Rural South Africa, 2001–2013: A Distributional Analysis Using Household Asset Indicators. Soc. Indic. Res. 2017, 133, 1047–1073. [Google Scholar] [CrossRef] [Scilit]
  36. Fatehkia, M.; Tingzon, I.; Orden, A.; Sy, S.; Sekara, V.; Garcia-Herranz, M.; Weber, I. Mapping socioeconomic indicators using social media advertising data. EPJ Data Sci. 2020, 9, 22. [Google Scholar] [CrossRef] [Scilit]
  37. Revazov, V.S.; Piliyeva, D.E.; Kasayeva, L.V.; Gasparyan, A.A. Employment as a Factor of Stable Social and Economic Development of a Region. In Proceedings of the International Session on Factors of Regional Extensive Development (FRED 2019), Irkutsk, Russia, 27 May–1 June 2019; Atlantis Press: Paris, France, 2020. [Google Scholar] [CrossRef] [Scilit]
  38. Vasileva, I.; Morozova, N.; Bondarenko, N. Education as a driver of economic growth of territories in the conditions of digital transformation. SHS Web Conf. 2021, 97, 01001. [Google Scholar] [CrossRef] [Scilit]
  39. Tusting, L.S.; Bisanzio, D.; Alabaster, G.; Cameron, E.; Cibulskis, R.; Davies, M.; Flaxman, S.; Gibson, H.S.; Knudsen, J.; Mbogo, C.; et al. Mapping changes in housing in sub-Saharan Africa from 2000 to 2015. Nature 2019, 568, 391–394. [Google Scholar] [CrossRef] [Scilit]
  40. Hummel, D. The effects of population and housing density in urban areas on income in the United States. Local Econ. 2020, 35, 27–47. [Google Scholar] [CrossRef] [Scilit]
  41. Casati, P.; Moner-Girona, M.; Khaleel, S.I.; Szabo, S.; Nhamo, G. Clean energy access as an enabler for social development: A multidimensional analysis for Sub-Saharan Africa. Energy Sustain. Dev. 2023, 72, 114–126. [Google Scholar] [CrossRef] [Scilit]
  42. Hurst, A.I.; Shaw, N.I.; Carrieri, D.I.; Stein, K.I.; Wyatt, K.I. Exploring the rise and diversity of health and societal issues that use a public health approach: A scoping review and narrative synthesis. PLoS Glob. Public Health 2024, 4, e0002790. [Google Scholar] [CrossRef] [Scilit]
  43. Gebremichael, S.G.; Yismaw, E.; Tsegaw, B.D.; Shibeshi, A.D. Determinants of water source use, quality of water, sanitation and hygiene perceptions among urban households in North-West Ethiopia: A cross-sectional study. PLoS ONE 2021, 16, e0239502. [Google Scholar] [CrossRef] [Scilit]
  44. Id, G.M.R.; John, M.B.; Ngalesoni, F.N.; Msasi, D.; Kapologwe, N.; Kengia, J.T.; Bukundi, E.; Ndakidemi, R.; Tukai, M.A. Understanding the implication of direct health facility financing on health commodities availability in Tanzania. PLoS Glob. Public Health 2023, 3, e0001867. [Google Scholar] [CrossRef] [Scilit]
  45. Lindblom, H.; Lowén, M.; Faresjö, T.; Hedman, K.; Sandström, P. Disease prevalence and number of health care visits among members of a nationwide sports organization compared to matched controls. BMC Public Health 2021, 21, 455. [Google Scholar] [CrossRef] [Scilit] [PubMed]
  46. Dufera, M.; Dabsu, R.; Tiruneh, G. Assessment of malaria as a public health problem in and around Arjo Didhessa sugar cane plantation area, Western Ethiopia. BMC Public Health 2020, 20, 655. [Google Scholar] [CrossRef] [Scilit]
  47. Cabrera-Barona, P.; Wei, C.; Hagenlocher, M. Multiscale evaluation of an urban deprivation index: Implications for quality of life and healthcare accessibility planning. Appl. Geogr. 2016, 70, 1–10. [Google Scholar] [CrossRef] [Scilit]
  48. Bai, X.; Nath, I.; Capon, A.; Hasan, N.; Jaron, D. Health and wellbeing in the changing urban environment: Complex challenges, scientific responses, and the way forward. Curr. Opin. Environ. Sustain. 2012, 4, 465–472. [Google Scholar] [CrossRef] [Scilit]
  49. Feng, C.; Jiao, J. Predicting and mapping neighborhood-scale health outcomes: A machine learning approach. Comput. Environ. Urban Syst. 2021, 85, 101562. [Google Scholar] [CrossRef] [Scilit]
  50. Suel, E.; Polak, J.W.; Bennett, J.E.; Ezzati, M. Measuring social, environmental and health inequalities using deep learning and street imagery. Sci. Rep. 2019, 9, 6229. [Google Scholar] [CrossRef] [Scilit]
  51. NISR. Fifth Rwanda Population and Housing Census, 2022. National Institute of Statistics of Rwanda, Ministry of Finance and Economic Planning: Ministry of Health; The DHS Program, ICF International, Kigali. 2022. Available online: http://www.statistics.gov.rw/data-sources/censuses/Population-and-Housing-Census/fifth-population-and-housing-census-2022/main-indicators-5th-rwanda-population-and-housing-census-phc (accessed on 2 December 2024).
  52. Manirakiza, V.; Mugabe, L.; Nsabimana, A.; Nzayirambaho, M. City Profile: Kigali, Rwanda. Environ. Urban. ASIA 2019, 10, 290–307. [Google Scholar] [CrossRef] [Scilit]
  53. Carter, B. Linkages Between Poverty, Inequality and Exclusion in Rwanda. 2018. Available online: https://opendocs.ids.ac.uk/opendocs/handle/20.500.12413/14189 (accessed on 24 August 2021).
  54. Manirakiza, V.; Njunwa, J.K.; Mugabe, L.; Rutayisire, P.C.; Nzayirambaho, M.; Nduwayezu, G.; Malonza, J.; Nsabimana, A. Neighbourhood Characteristics and Inequality in the City of Kigali-Rwanda. Kigali. 2023. Available online: https://www.centreforsustainablecities.ac.uk/wp-content/uploads/2023/07/Kigali-City-Report-FINAL-1.pdf (accessed on 15 September 2023).
  55. City of Kigali. Zoning Regulations: Kigali Master Plan of 2050. 2019. Available online: https://masterplan.kigalicity.gov.rw/portal/apps/webappviewer/index.html?id=fdd2e30cbc15401d9daee5f68982d755 (accessed on 21 March 2021).
  56. Uwizeye, D.; Irambeshya, A.; Wiehler, S.; Niragire, F. Poverty profile and efforts to access basic household needs in an emerging city: A mixed-method study in Kigali’s informal urban settlements, Rwanda. Cities Health 2022, 6, 98–112. [Google Scholar] [CrossRef] [Scilit]
  57. Baffoe, G.; Malonza, J.; Manirakiza, V.; Mugabe, L. Understanding the concept of neighbourhood in Kigali City, Rwanda. Sustainability 2020, 12, 1555. [Google Scholar] [CrossRef] [Scilit]
  58. Xie, M.; Jean, N.; Burke, M.; Lobell, D.; Ermon, S. Transfer Learning from Deep Features for Remote Sensing and Poverty Mapping. In Thirtieth AAAI Conference on Artificial Intelligence (AAAI-16), Phoenix, AZ, USA, 12–17 February 2016; AAAI Press: Washington, DC, USA, 2016; Available online: www.aaai.org (accessed on 15 September 2023).
  59. Pokhriyal, N.; Jacques, D.C. Combining disparate data sources for improved poverty prediction and mapping. Proc. Natl. Acad. Sci. USA 2017, 114, E9783–E9792. [Google Scholar] [CrossRef] [Scilit]
  60. McCallum, I.; Kyba, C.C.M.; Bayas, J.C.L.; Moltchanova, E.; Cooper, M.; Cuaresma, J.C.; Pachauri, S.; See, L.; Danylo, O.; Moorthy, I.; et al. Estimating global economic well-being with unlit settlements. Nat. Commun. 2022, 13, 2459. [Google Scholar] [CrossRef] [Scilit] [PubMed]
  61. Chen, C.; He, X.; Liu, Z.; Sun, W.; Dong, H.; Chu, Y. Analysis of regional economic development based on land use and land cover change information derived from Landsat imagery. Sci. Rep. 2020, 10, 12721. [Google Scholar] [CrossRef] [Scilit] [PubMed]
  62. Yap, W.; Biljecki, F. A Global Feature-Rich Network Dataset of Cities and Dashboard for Comprehensive Urban Analyses. Sci. Data 2023, 10, 667. [Google Scholar] [CrossRef] [Scilit] [PubMed]
  63. Yap, W.; Stouffs, R.; Biljecki, F. Urbanity: Automated modelling and analysis of multidimensional networks in cities. Npj Urban Sustain. 2023, 3, 45. [Google Scholar] [CrossRef] [Scilit]
  64. LeCun, Y.; Bengio, Y.; Hinton, G. Deep learning. Nature 2015, 521, 436–444. [Google Scholar] [CrossRef] [Scilit] [PubMed]
  65. Wang, J.; Huang, W.; Biljecki, F. Learning visual features from figure-ground maps for urban morphology discovery. Comput. Environ. Urban Syst. 2024, 109, 102076. [Google Scholar] [CrossRef] [Scilit]
  66. Corso, G.; Stark, H.; Jegelka, S.; Jaakkola, T.; Barzilay, R. Graph neural networks. Nat. Rev. Methods Primers 2024, 4, 17. [Google Scholar] [CrossRef] [Scilit]
  67. Liu, Y.; Ding, J.; Li, Y. Knowledge-driven Site Selection via Urban Knowledge Graph. arXiv 2021, arXiv:2111.00787. [Google Scholar] [CrossRef] [Scilit]
  68. Wu, S.; Yan, X.; Fan, X.; Pan, S.; Zhu, S.; Zheng, C.; Cheng, M.; Wang, C. Multi-Graph Fusion Networks for Urban Region Embedding. In Proceedings of the IJCAI International Joint Conference on Artificial Intelligence, Vienna, Austria, 23–29 July 2022; pp. 2312–2318. [Google Scholar] [CrossRef] [Scilit]
  69. Zhang, H.; Lu, G.; Zhan, M.; Zhang, B. Semi-Supervised Classification of Graph Convolutional Networks with Laplacian Rank Constraints. Neural Process. Lett. 2022, 54, 2645–2656. [Google Scholar] [CrossRef] [Scilit]
  70. Khemani, B.; Patil, S.; Kotecha, K.; Tanwar, S. A review of graph neural networks: Concepts, architectures, techniques, challenges, datasets, applications, and future directions. J. Big Data 2024, 11, 18. [Google Scholar] [CrossRef] [Scilit]
  71. Delgado-Enales, I.; Del Ser, J.; Molina-Costa, P. A framework to improve urban accessibility and environmental conditions in age-friendly cities using graph modeling and multi-objective optimization. Comput. Environ. Urban Syst. 2023, 102, 101966. [Google Scholar] [CrossRef] [Scilit]
  72. Dai, Y.; Gieseke, F.; Oehmcke, S.; Wu, Y.; Barnard, K. Attentional Feature Fusion. In Proceedings of the 2021 IEEE Winter Conference on Applications of Computer Vision (WACV), Virtual, 3–8 January 2021; IEEE: New York, NY, USA, 2021; pp. 3559–3568. [Google Scholar] [CrossRef] [Scilit]
  73. Izonin, I.; Tkachenko, R.; Shakhovska, N.; Ilchyshyn, B.; Singh, K.K. A Two-Step Data Normalization Approach for Improving Classification Accuracy in the Medical Diagnosis Domain. Mathematics 2022, 10, 1942. [Google Scholar] [CrossRef] [Scilit]
  74. Ifada, N.; Sophan, M.K.; Putri, N.F.D. A MinMax Item-based Method for Multi-Criteria Recommendation Systems. Procedia Comput. Sci. 2023, 227, 1020–1029. [Google Scholar] [CrossRef] [Scilit]
  75. Russakovsky, O.; Deng, J.; Su, H.; Krause, J.; Satheesh, S.; Ma, S.; Huang, Z.; Karpathy, A.; Khosla, A.; Bernstein, M.; et al. ImageNet Large Scale Visual Recognition Challenge. Int. J. Comput. Vis. 2015, 115, 211–252. [Google Scholar] [CrossRef] [Scilit]
  76. Gong, Z.; Wang, C.; Liu, B.; Li, B.; Tu, W.; Chen, Y.; Deng, Z.; Zhao, P. Multi-spatial urban function modeling: A multi-modal deep network approach for transfer and multi-task learning. Int. J. Appl. Earth Obs. Geoinf. 2025, 136, 104397. [Google Scholar] [CrossRef] [Scilit]
  77. Brooks, M. Inside the maths that drives AI. Nature 2024, 631, 244–246. [Google Scholar] [CrossRef] [Scilit]
  78. Murtagh, F. Multilayer perceptrons for classification and regression. Neurocomputing 1991, 2, 183–197. [Google Scholar] [CrossRef] [Scilit]
  79. Greenacre, M.; Groenen, P.J.F.; Hastie, T.; D’Enza, A.I.; Markos, A.; Tuzhilina, E. Principal component analysis. Nat. Rev. Methods Primers 2022, 2, 100. [Google Scholar] [CrossRef] [Scilit]
  80. Wooditch, A.; Johnson, N.J.; Solymosi, R.; Ariza, J.M.; Langton, S. Ordinary Least Squares Regression. In A Beginner’s Guide to Statistics for Criminology and Criminal Justice Using R; Springer International Publishing: Cham, Switzerland, 2021; pp. 245–268. [Google Scholar] [CrossRef] [Scilit]
  81. Roshan, J.V. Optimal ratio for data splitting. Stat. Anal. Data Min. ASA Data Sci. J. 2022, 15, 531–538. [Google Scholar] [CrossRef] [Scilit]
  82. de Winter, J.C.F.; Gosling, S.D.; Potter, J. Comparing the Pearson and Spearman correlation coefficients across distributions and sample sizes: A tutorial using simulations and empirical data. Psychol. Methods 2016, 21, 273–290. [Google Scholar] [CrossRef] [Scilit] [PubMed]
Figure 1. The study area location: The City of Kigali, Rwanda’s capital, situated in the geographic center of the country.
Urbansci 10 00177 g001
Figure 2. Overview of the proposed multimodal deep learning framework.
Urbansci 10 00177 g002
Figure 3. An overview of label data and satellite image patches used in the analysis. The lowest decile (red) is the worst off, and the highest decile (blue) denotes the best off for each socio-economic indicator and public health determinant.
Urbansci 10 00177 g003
Figure 4. Street network dataset attributes (data source: OpenStreetMap).
Urbansci 10 00177 g004
Figure 5. Scatter plots indicating the performance of trained networks in predicting socio-economic indicators. Bubble size indicates the frequency of predictions corresponding to each observed–predicted decile pair, with larger circles representing higher concentration.
Urbansci 10 00177 g005
Figure 6. Scatter plots indicating the performance of trained networks in predicting public health determinants. Bubble size indicates the frequency of predictions corresponding to each observed–predicted decile pair, with larger circles representing higher concentration.
Urbansci 10 00177 g006
Figure 7. Spatial distribution maps comparing observed and predicted deciles for selected socio-economic indicators.
Urbansci 10 00177 g007
Figure 8. Spatial distribution maps comparing observed and predicted deciles of selected health-related determinants.
Urbansci 10 00177 g008
Figure 9. Visualization of the embedding space. A two-dimensional projection of the fused embeddings of satellite image patches (illustrated here for employment) highlights the structure of the low-dimensional embedding space.
Urbansci 10 00177 g009
Figure 10. Correlation between socio-economic indicators and public health determinants. (A) Based on observed data. (B) After applying multimodal feature fusion. Darker red shades represent stronger positive correlations, while blue indicates negative correlations.
Urbansci 10 00177 g010
Figure 11. Comparison maps between observed and predicted health indices across sectors.
Urbansci 10 00177 g011
Figure 12. Scatter plots with regression lines for each socio-economic indicator against the actual health index. It calculates and displays Spearman correlation coefficients on each plot.
Urbansci 10 00177 g012
Table 1. Predictions metrics for socio-economic indicators and public health determinants.
Satellite ImageryStreet NetworkFused
MAErMAE
Socio-economic indicatorsEducation1.810.651.390.711.180.75
School attendance2.090.561.450.721.230.72
Employment1.760.651.660.641.580.65
Occupation2.060.261.650.581.610.59
Urbanization2.100.492.060.571.990.61
Floor materials1.780.681.510.701.220.77
Wall material1.650.701.700.631.450.70
Cooking energy1.790.651.380.721.130.75
Tenure type1.850.471.320.701.570.66
Public health determinantsHealth insurance1.680.681.700.621.180.75
Drinking water2.050.391.870.551.230.72
Water for general usage1.740.651.440.701.580.65
Sewage mode2.150.321.750.591.610.59
Toilet facility2.040.491.760.451.990.61
Waste disposal1.810.591.240.721.220.77
Disclaimer/Publisher’s Note: The statements, opinions and data contained in all publications are solely those of the individual author(s) and contributor(s) and not of MDPI and/or the editor(s). MDPI and/or the editor(s) disclaim responsibility for any injury to people or property resulting from any ideas, methods, instructions or products referred to in the content.