Article

A Validated, Population-Scale Dataset of 2.7 Million IRONMAN® Triathlon Records with Separated Transition Times (2002–2026)

1
Nova O2 Sports Science, São Paulo 12246-020, Brazil
2
School of Health and Caring Sciences, University of West Attica, 12243 Athens, Greece
3
Department of Physiology, Federal University of São Paulo (UNIFESP), São Paulo 04023-062, Brazil
4
Institute of Primary Care, University of Zurich, 8091 Zurich, Switzerland
5
Medbase St. Gallen Am Vadianplatz, Vadianstrasse 26, 9001 St. Gallen, Switzerland
*
Author to whom correspondence should be addressed.
Sci 2026, 8(9), 265; https://doi.org/10.3390/sci8090265
Submission received: 25 July 2026 / Revised: 10 September 2026 / Accepted: 15 September 2026 / Published: 19 September 2026
(This article belongs to the Section Sports Science and Medicine)

Abstract

Long-distance triathlon has become a major model for studying endurance performance. Research has nonetheless been constrained by distance-specific datasets that separate full-distance from half-distance events and largely omit transition times. Our aim was to assemble, validate, and describe an openly available dataset that removes both constraints. We compiled 2,706,922 athlete-race records from more than 1500 IRONMAN® and IRONMAN® 70.3 events held between 2002 and 2026, the final season partial, drawn from the official IRONMAN® results platform (75.4%) and a third-party aggregator covering event series absent from it (24.6%). Each record contains swimming, first transition (T1), cycling, second transition (T2), running, and overall times in seconds, with finish status, age group, gender, country, and qualification points. The dataset showed close correspondence between sources and high internal consistency. Split times were identical to the second for 98.8% of 4,732,776 athlete–discipline pairs across all 559 race-years present in both sources, summed splits matched reported overall times within one second for 98.3% of records, and separated T1 and T2 times were available for 84.2% and 84.1% of records—to our knowledge, the first population-level provision of this information. Openly deposited with reproducible collection scripts, the dataset supports research on pacing, transition efficiency, sex differences, non-completion, and qualification equity.

1. Introduction

The IRONMAN® triathlon—comprising a 3.86 km swim, 180.25 km cycle, and 42.20 km run for the full distance, or approximately half those distances for the 70.3 format—has grown from 15 starters at its inaugural 1978 event in Waikiki, Hawaii, to more than 250,000 annual registrations across more than 50 countries [1]. The sport’s global expansion, combined with its extreme physiological demands, has made it a valuable model for studying endurance performance, pacing strategies, sex differences, and the epidemiology of race non-completion. Those demands are of a kind that the usual determinants of endurance performance do not fully capture: beyond roughly four hours of competition, maximal oxygen uptake and the anaerobic threshold cease to predict performance well, and fuel and fluid provision, substrate availability, and electrolyte balance become limiting in their own right [2,3]. Competition over eight to seventeen hours also imposes a sustained thermoregulatory load [4] and a progressive loss of neuromuscular function across the three disciplines [5], so that the athlete who begins the run is not physiologically the athlete who began the swim.
Large-scale analyses of IRONMAN® performance have been published in recent years, the largest of which examined 823,459 half-distance records to assess the predictive value of individual disciplines on overall performance [6]. One earlier analysis of pacing in 343,345 full-distance athletes found that the fastest finishers spent proportionally less time in transitions than the rest (0.9% vs. 2.2% of total race time) [7].
Despite this progress, existing datasets present important limitations. Published analyses have relied on distance-specific datasets that separate full-distance from half-distance events, precluding direct cross-distance comparisons. Transition times have been largely overlooked at population scale, and the two transitions are not interchangeable. T1 follows the swim and precedes the cycle, so it is dominated by the change in equipment and by the shift from horizontal to upright posture. T2 follows several hours of cycling and precedes the run, placing it at the point where the run-off-bike penalty originates; it therefore reflects accumulated fatigue as much as logistical efficiency [8]. Treating them as a single combined interval discards that distinction. The one dedicated analysis of transition times at IRONMAN® distance that we are aware of examined the annual top 10 finishers at the World Championship and was unable to separate T1 from T2 [9]. At Olympic distance, Cejuela et al. found that T2 correlated more strongly with final placement than T1, which is the asymmetry a combined interval would hide; no equivalent analysis exists for long-distance triathlon [10]. A technical report describing a collection of IRONMAN® race results was published on Academic Torrents [11], but it was not peer-reviewed and lacks detailed documentation of fields, validation procedures, and collection methodology. We are not aware of a peer-reviewed, openly available, and formally validated dataset for IRONMAN® triathlon—in contrast to other endurance sports where large-scale datasets have been formally described [12]—which limits reproducibility and obliges the research community to re-collect data from primary sources.
The aim of this work is to assemble, validate, and describe an openly available, population-scale dataset of IRONMAN® and IRONMAN® 70.3 race records, unifying full-distance and half-distance events in a single schema with separated transition times, and to characterize its composition, coverage, and data quality so that it can serve as a reusable resource for the sport science community.

2. Materials and Methods

2.1. Data Sources

Race results were obtained from two sources. The primary source was the official IRONMAN® results platform, hosted on Competitor Group’s event management system. This platform is reached exclusively through a public REST application programming interface (API) at the base domain labs-v2.competitor.com; the base domain does not serve a browsable web interface, and the service is accessed programmatically using the endpoint pattern detailed in the Data collection subsection below. The same race results are also publicly browsable on the IRONMAN website at https://www.ironman.com/races (for example, https://www.ironman.com/races/im-brazil/results; both accessed on 28 March 2026), which is the human-facing presentation of the data served programmatically by this API. The API returns detailed race results in JSON format, including split times for each discipline, transition times, finish status, rankings, All World Athlete (AWA) qualification points, and distance completed per segment. A secondary source, CoachCox (coachcox.co.uk), was used to supplement the primary dataset for event series not available on the official platform. CoachCox is a third-party statistics aggregator that compiles IRONMAN® race results via a public REST API. Its independence from the official platform is editorial rather than metrological: it collects and republishes results produced by the same timing operation. Agreement between the two sources therefore establishes faithful transcription through two separate collection pipelines, and not independent measurement of the underlying times. Both sources provide individual athlete-level results with swim, first transition (T1), cycling, second transition (T2), running, and overall finish times in seconds.

2.2. Event Discovery

Events on the official platform are identified by universally unique identifiers (UUIDs) embedded in the results pages of ironman.com. We developed an automated discovery procedure that extracts these UUIDs from the HTML source of race result pages at https://www.ironman.com/{race-slug}-results (accessed on 28 March 2026). Race slugs were derived from the CoachCox race metadata by converting event names to URL-compatible format (e.g., “IRONMAN® Florida”→“im-florida”). A total of 210 candidate slugs were tested, yielding 128 valid event UUIDs across both full-distance and half-distance IRONMAN® events. The remaining slugs either corresponded to discontinued events with no result page or were blocked by the website’s content delivery network.
Each event UUID provides access to an event page containing a list of subevents—individual race editions organized by year. For example, the IRONMAN® Florida event page lists 24 subevents from 2002 to 2025, each with its own subevent UUID. The resulting index of race editions across the 128 series is provided in the repository.

2.3. Data Collection—Official Platform

Results for each subevent were retrieved via the official API endpoint at https://labs-v2.competitor.com/api/results?wtc_eventid={subevent-uuid} (accessed on 28 March 2026). The API returns a JSON response containing an array of athlete result objects with over 30 fields per record. Requests were made using Python (v3.12) with the requests library (v2.33.0), with a self-imposed delay of 2.0 s between consecutive API calls. A progress-tracking mechanism was implemented to enable resumption of interrupted collection sessions. Data collection was performed on 28 March 2026. Of the 1235 race editions listed in the subevent index, results were retrieved for 1172, yielding 2,041,743 athlete-race records. The remaining 63 editions returned no results; 28 of these belong to the 2021 season, consistent with the cancelations of that year, and the rest are scattered editions that were canceled or whose results were never published. Among the 1172 successfully retrieved, five (four pre-2007 New Zealand races and one 2023 French race) initially returned server errors and were obtained on a second attempt. Because collection took place in March 2026, the 2026 season is represented only by races held before that date and is partial wherever it appears in this article.
For each athlete record, the following fields were extracted and mapped to standardized column names: athlete name, bib number, country, ISO 3166-1 alpha-2 country code [13], age group, event name, event identifier, split times (swim, T1, bike, T2, run, overall) in seconds, finish status (finisher, did not finish, did not start, disqualified), rankings (overall, gender, age group) for finish and individual disciplines, AWA points, and distance completed per segment in kilometers.

2.4. Data Collection—Supplementary Source

For event series not available on the official platform, results were obtained from the CoachCox public API at https://www.coachcox.co.uk/wp-json/imstats/v1.90/race/results/{race-id} (accessed on 27 March 2026). Race identifiers were obtained from a reference dataset of 587 known race IDs, supplemented by an automated scan of 500 consecutive IDs beyond the known maximum. A total of 947 races were identified, of which 382 race-years were not represented in the official dataset. These 382 supplementary race-years contributed 665,179 additional athlete-race records. Data collection from the supplementary source was performed on 27 March 2026, with a self-imposed delay of 1.5 s between requests.

2.5. Definition of the Transition Times

Both platforms report T1 and T2 as intervals between timing mats: T1 between the swim exit and the start of the bike course, and T2 between the end of the bike course and the start of the run. We neither defined these intervals nor positioned the mats; the fields are transcribed as published. Their content therefore depends on decisions taken by each event organizer—the size and layout of the transition area, where the mats sit relative to the bike racking, and how congested that area is when a given athlete passes through it. None of these are recorded in the results, and none are guaranteed to be constant across events or across years within the same event. A transition time in this dataset is consequently the time an athlete took to traverse one particular transition area at one particular event, rather than a standardized measure of transition efficiency, and comparisons across events should be read with that in mind.

2.6. Data Quality Assessment

Data quality was assessed along four dimensions: agreement between the two sources, field completeness, internal consistency of the split times, and physiological plausibility. Completeness, internal consistency and plausibility were computed over the entire dataset; cross-source agreement is necessarily restricted to the race-years both sources hold, and the procedure for it is described next. Quantitative results for all four are reported in the Technical Validation subsection of the Results.

Cross-Source Validation Procedure

To assess agreement between the two data sources, we compared every race-year present in both, rather than a sample. For each race-year, we compared the total number of records, the distribution of finish statuses, and individual athlete split times across all six disciplines (swim, T1, bike, T2, run, overall).
Athletes were matched between sources by name within each race-year. Three matching rules were applied in sequence so that the contribution of each could be measured: case-insensitive exact matching, as used previously; the same after Unicode NFKD normalization, which folds diacritics and punctuation; and an order-invariant form that additionally sorts the name tokens. The third rule was necessary because the supplementary source records names as “Lastname, Firstname” for part of the covered period while the official platform records them as “Firstname Lastname”, a reordering that diacritic folding cannot repair. Names that appear more than once within a race-year cannot be matched one-to-one and were excluded from both sides before joining. The agreement statistic reported in the Results is computed on the order-invariant match, which is a broader and more permissive set than the exact match used in the previous version of this dataset description; the two figures are therefore not directly comparable, and the difference between the three rules is reported so that the effect of the choice is visible. The quantitative results of this comparison are reported in the Technical Validation subsection of the Results.

2.7. Data Merging

The two sources were merged into a unified dataset using a deterministic procedure. The official source was designated as primary; supplementary records were included only for race-years not represented in the official dataset. Overlap detection was performed by normalizing event names (removing year, brand prefixes, and championship designations) and matching on the combination of normalized name, year, and race type (full-distance or half-distance). When the same race-year was present in both sources, the official record was retained and the supplementary record discarded; ambiguous cases, such as events whose names differed between sources only by a sponsor prefix or a “European/Asian Championship” designation, were resolved by manual inspection of the normalized-name mapping before the merge was finalized. Applied across the two sources, this rule found 559 race-years present in both, resolved in favor of the official record in every case, against 613 present only in the official source and 382 present only in the supplementary source—1554 distinct race-years in the merged dataset. Normalization is what makes a collision detectable at all: matching the raw event names identifies none of the 559, the generic rules identify 537, and the championship-prefix rules account for the remaining 22. The manual inspection of the normalized-name mapping was carried out by one author and was not independently verified by a second. A source column was added to every record, taking the value “official” or “coachcox”, enabling downstream analyses to filter by data provenance. Fields available only in the official source (AWA points, distance completed per segment, ISO country code) were left empty for supplementary records.

2.8. Data Consolidation

Individual race JSON files were consolidated into a single comma-separated values (CSV) file using a streaming approach to minimize memory requirements. Finish status was harmonized across sources: the official platform provides boolean fields (finisher, DNF, DNS, DQ) which were mapped to a single categorical variable; the supplementary source provides a categorical field directly. Race type (full-distance or half-distance) was inferred from the event name: events containing “70.3” were classified as half-distance and all others as full-distance. Gender was derived from the age group field: categories prefixed with “F” or labeled “FPRO” were classified as female, and “M” or “MPRO” as male.
Full-distance and half-distance events were consolidated into one schema rather than kept apart because a shared schema is what makes direct comparison across the two distances possible, which distance-specific datasets preclude by construction. The race_type field preserves the distinction within the file, so pooling across distances remains a decision taken by the analyst rather than one imposed by the data.
Age-group definitions were checked for stability across the covered period, since boundaries that moved would compromise longitudinal reuse. The five-year bands from 18–24 to 75–79 are present in every year from 2002 to 2026, and no boundary changes at any point. What varies is only which of the oldest bands is populated: 80–84 is absent from 2006 to 2008, and 85–89 appears from 2015 to 2018 and again from 2022 onward. This reflects whether any athlete in those bands finished a given season rather than a change in the classification itself.

2.9. Ethical Considerations

The dataset analyzed in this study is publicly available. Both data sources provide unrestricted public access to their APIs without authentication, and the underlying race results are also publicly browsable on the IRONMAN website (https://www.ironman.com/races, accessed on 28 March 2026) and on CoachCox (https://www.coachcox.co.uk/imstats/, accessed on 27 March 2026). Self-imposed rate limiting (1.5–2.0 s between requests) was applied throughout data collection. Athlete names were retrieved from both sources because exact name matching was the only means of linking records across them for the cross-source validation reported in the Results. Names were used exclusively for that purpose. They were never published, transferred to third parties, or used to contact athletes, and they are retained on a single research workstation under the control of the first author, separate from any shared or deposited file. The name field is removed before deposit and is therefore absent from the released dataset.
The released dataset is de-identified rather than anonymous. Direct identifiers are removed, but the combination of event, age group, bib number, and exact split times could in principle be matched against the publicly accessible source results, which display athlete names. This residual risk is inherent to the source: race results are published by the organizers as a public record of competition, and the deposited file does not render any athlete more identifiable than the source already does.
A further 55 records were withdrawn from the deposited file because the supplementary source had applied its own redaction to those athletes, replacing both name and country with a redaction marker. That suppression is propagated here rather than reversed. The deposited file therefore contains 2,706,867 records, while the dataset described in this article comprises 2,706,922; Table 1 marks which fields reach the deposit.

3. Results

3.1. Dataset Composition

The dataset is provided as a single CSV file (ironman_merged.csv, 516 MB) containing 2,706,922 athlete-race records with 28 columns. Each row represents one athlete’s participation in one race event. The complete schema is described in Table 1.
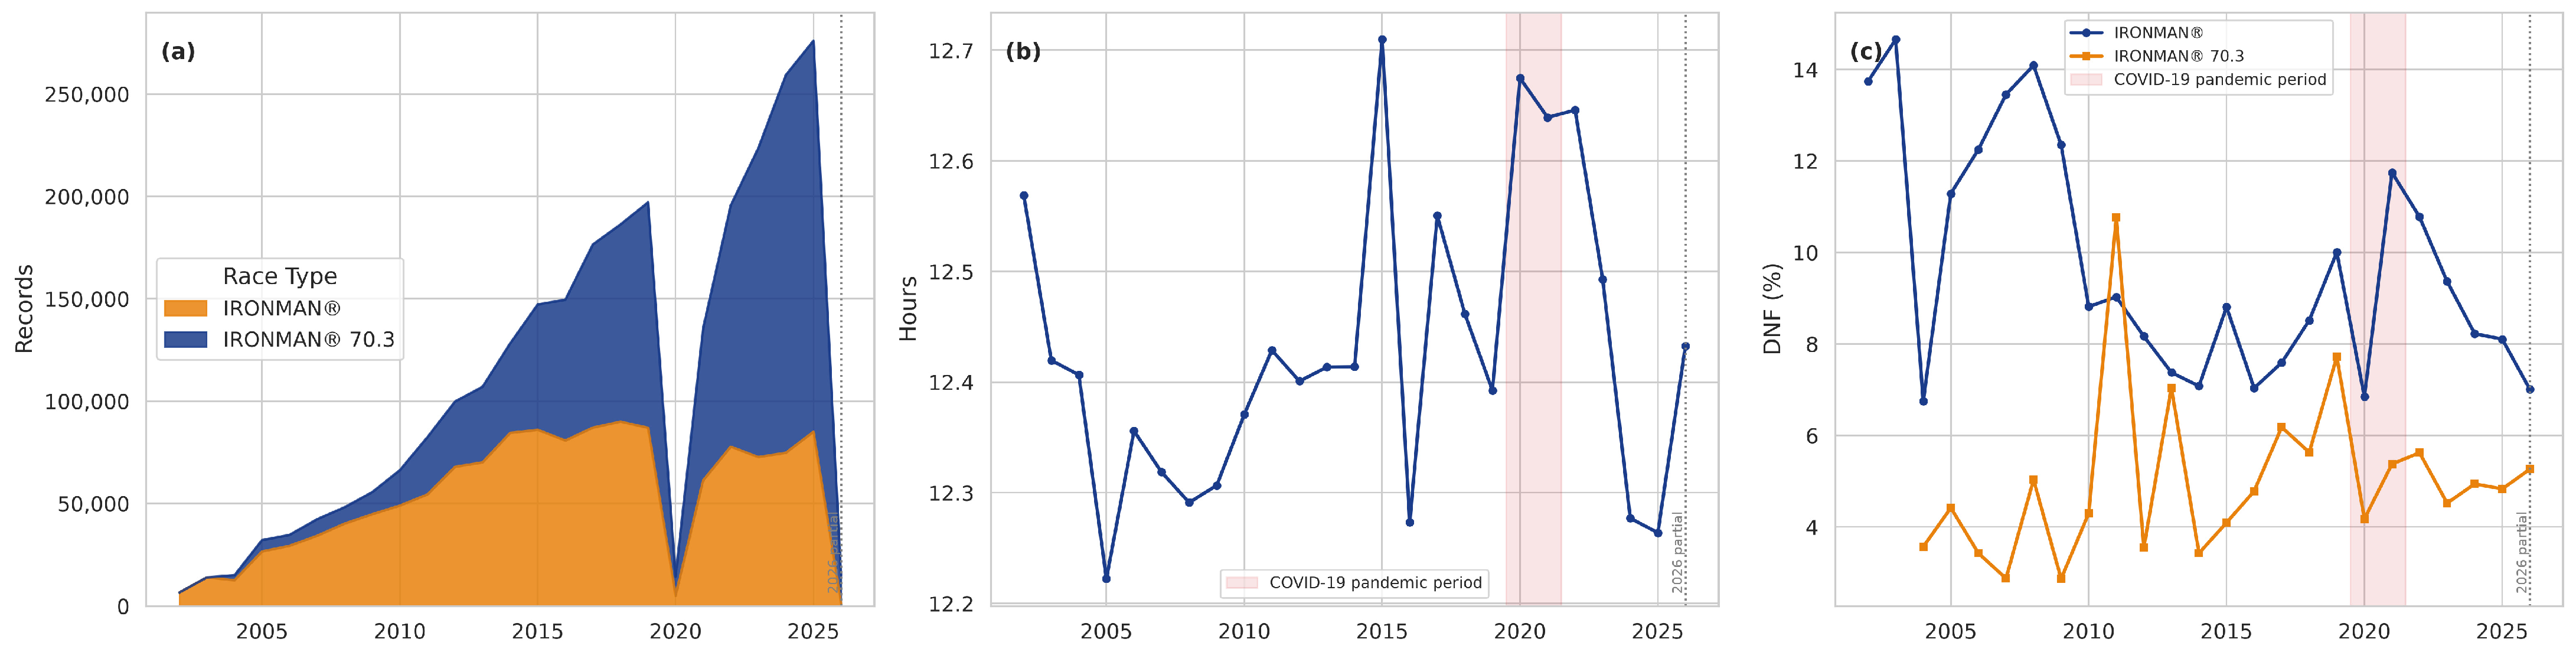
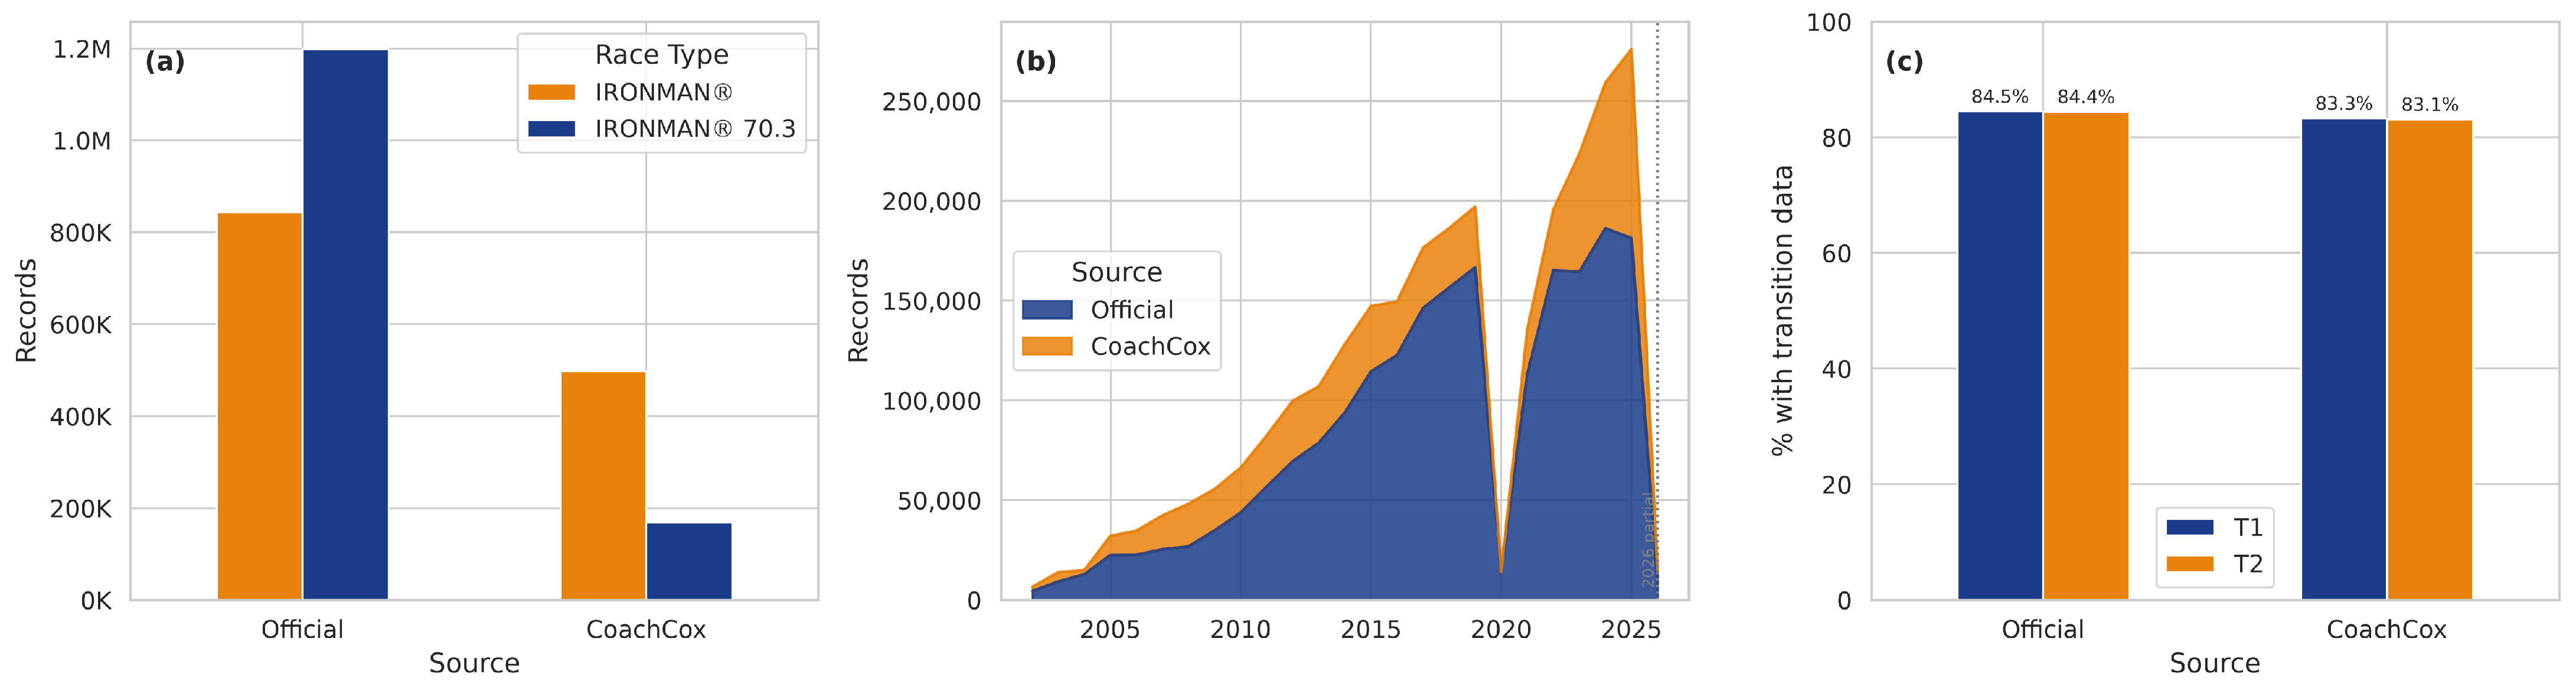
The dataset comprises 1,340,799 full-distance IRONMAN® records (49.5%) and 1,366,123 half-distance IRONMAN® 70.3 records (50.5%). Of these, 2,041,743 records (75.4%) originate from the official IRONMAN® platform and 665,179 records (24.6%) from the supplementary source (Figure 1). Records span 24 years from 2002 to 2026 across more than 1500 individual race events (Figure 2a). Data were collected on 27–28 March 2026, so the final season is incomplete: the 2026 records cover only races held before that date and are not comparable in volume with a full season. Figures with a year axis mark 2026 accordingly.

3.1.1. Finish Status

A total of 2,239,335 records (82.7%) correspond to finishers, 176,416 (6.5%) to athletes who did not finish (DNF), 271,615 (10.0%) to athletes who did not start (DNS), and 9,214 (0.3%) to disqualified athletes. The remaining 10,342 records (0.4%) have no finish status assigned.

3.1.2. Split Times

Split times are recorded in seconds for six segments: swim, first transition (T1), cycling, second transition (T2), running, and overall. Coverage varies by field: swim times are available for 85.9% of records, cycling for 85.9%, running for 82.9%, and overall finish time for 83.0%. Transition times (T1 and T2) are available for 84.2% and 84.1% of records, respectively. Records without split times correspond primarily to DNS athletes, early race withdrawals, and a subset of older races (pre-2007) where transition times were not separately recorded.
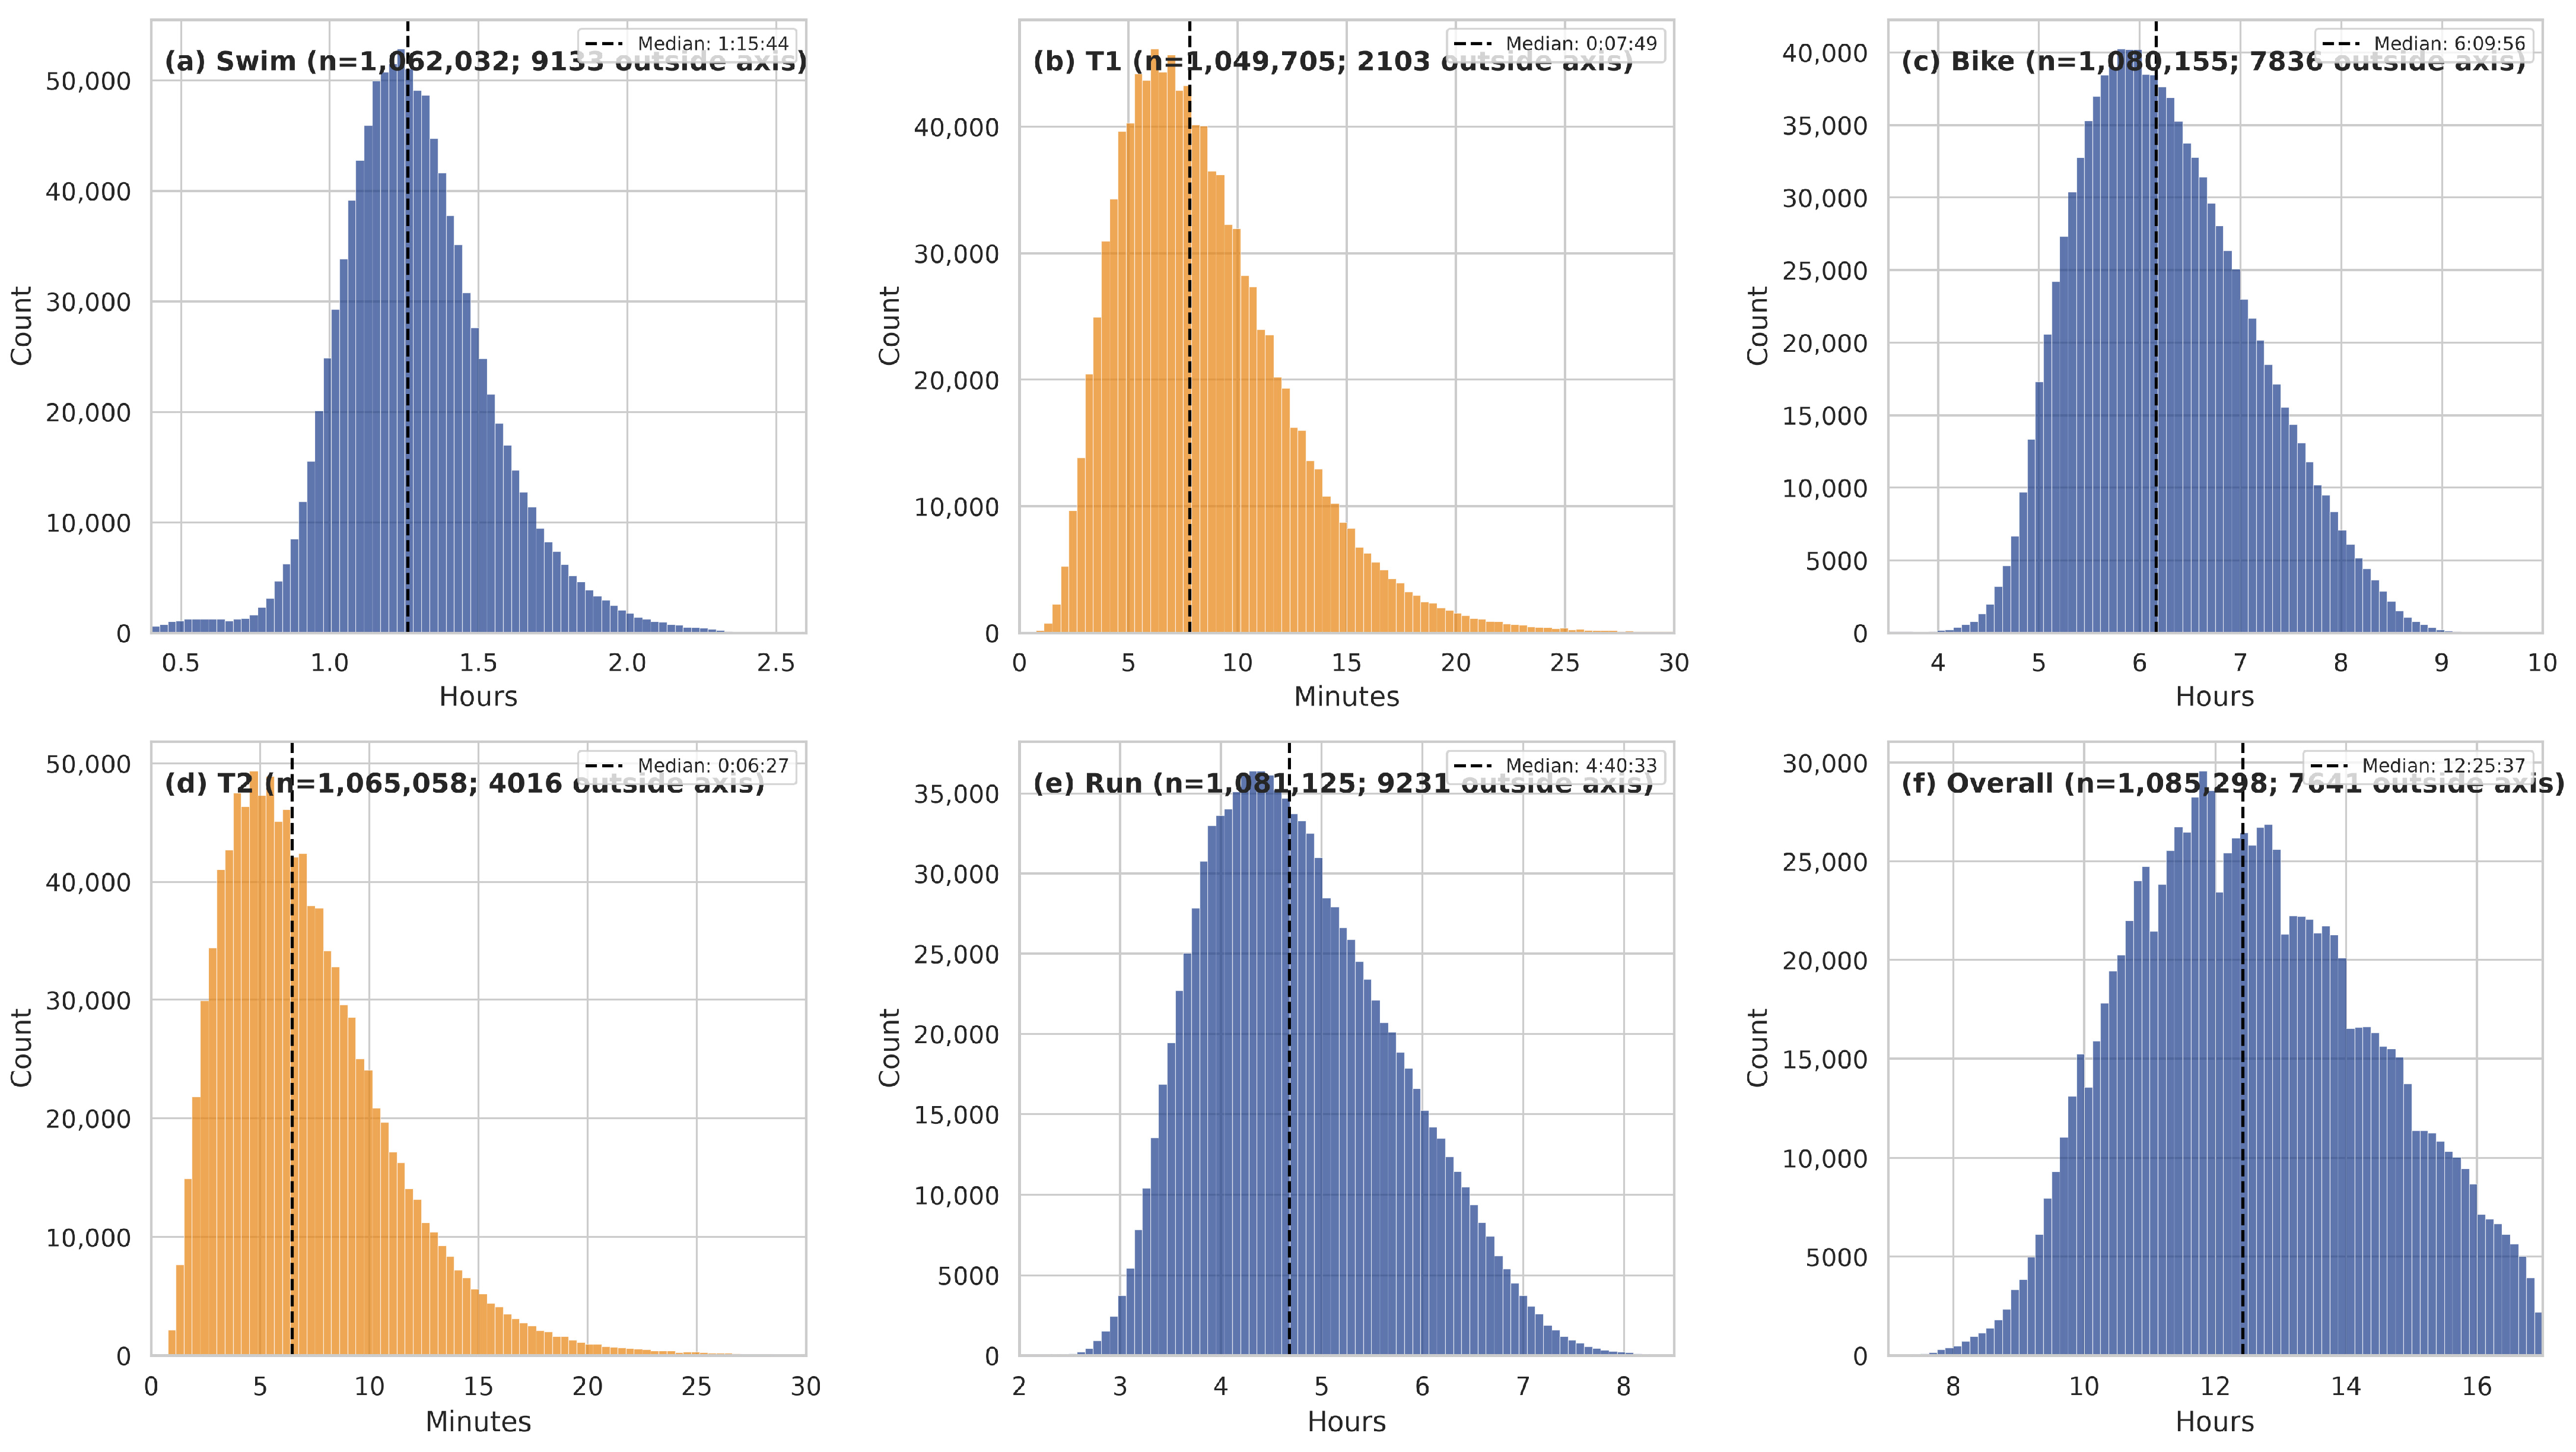
For full-distance IRONMAN® finishers (n = 1,094,780), median split times are: swim 1:15:44, T1 0:07:49, bike 6:09:56, T2 0:06:27, run 4:40:33, and overall 12:25:37 (Figure 3). For half-distance IRONMAN® 70.3 finishers (n = 1,144,555), median split times are: swim 0:38:35, T1 0:05:46, bike 2:57:24, T2 0:04:14, run 2:05:25, and overall 5:53:16.

3.1.3. Demographics

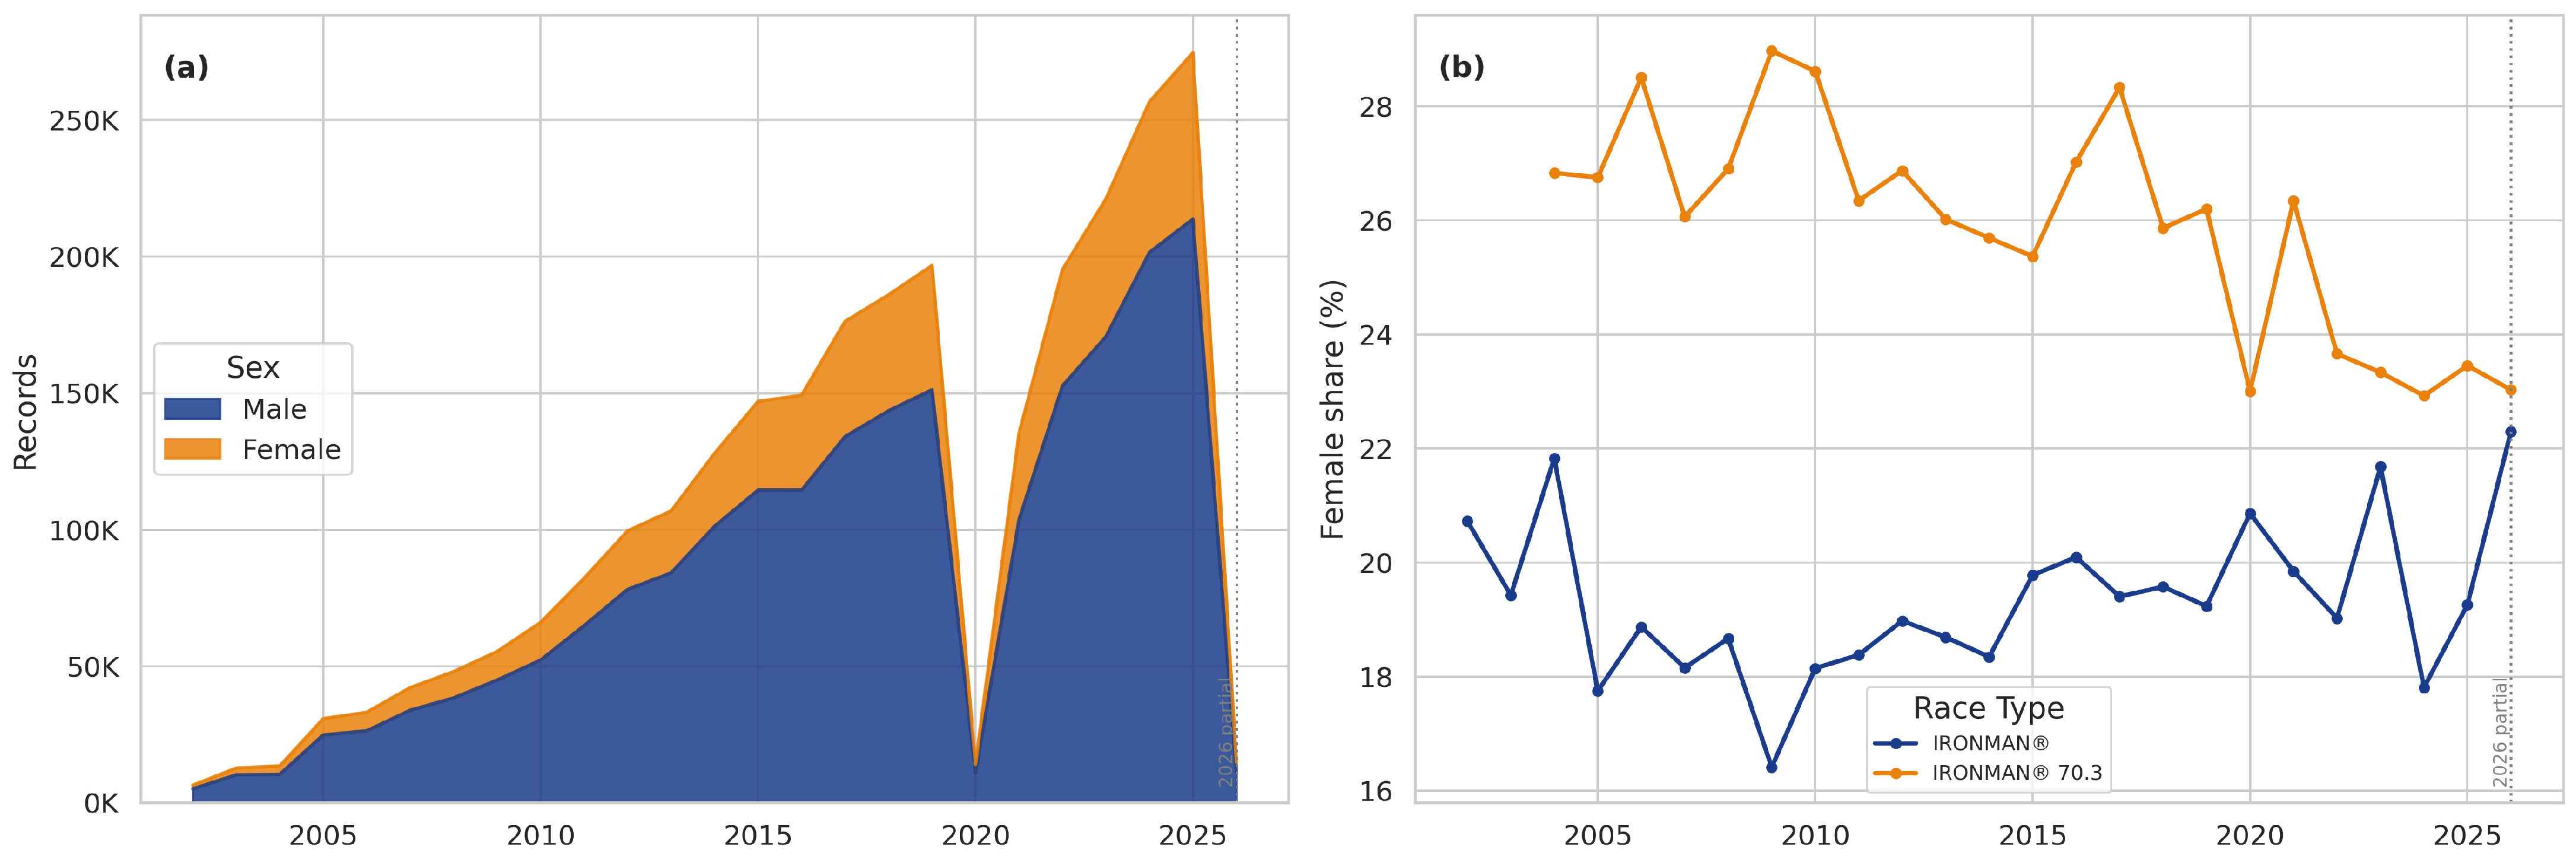
Male athletes account for 2,098,548 records (77.5%) and female athletes for 594,978 records (22.0%). Gender was inferred from the age group field; 13,396 records (0.5%) with unrecognized age group codes were classified as unknown. The composition of participation by sex across the covered period is shown in Figure 4, by record count and as the female share within each race distance.

3.1.4. Additional Fields

AWA (All World Athlete) qualification points are available for 1,478,052 records (54.6%), exclusively from the official source. AWA points range from 18 to 6000 (median: 2218) and reflect the athlete’s performance relative to age group and gender benchmarks. Distance completed per segment (swim, bike, run, and total, in kilometers) is available for 1,537,761 records (56.8%), also exclusively from the official source. These distance fields are particularly informative for DNF analysis, as they indicate the exact point of race withdrawal.

3.2. Technical Validation

3.2.1. Cross-Source Agreement

The primary validation approach was cross-referencing results between the two data sources. The comparison covers every race-year present in both sources—559 race-years spanning 2003 to 2026, of which 340 are full-distance and 219 half-distance—rather than a selected subset (Table 2).
Record counts from the two sources differed by two or fewer athletes for 484 of the 559 race-years (86.6%). Athlete name matching yielded a median rate of 95.3% per race-year under case-insensitive exact matching and 96.4% under the order-invariant rule.
The difference between those two rules is informative and revises an explanation given previously. Sixty-three race-years, all between 2017 and 2019 and all full-distance, matched at essentially zero under exact matching despite record counts agreeing to within a few athletes; the supplementary source records names as “Lastname, Firstname” in those seasons while the official platform records “Firstname Lastname”. Unicode normalization, which folds diacritics, raises the median match rate by only 0.5 percentage points and cannot repair a reordering; sorting the name tokens raises those three seasons from near zero to 93.1%, 93.3% and 93.5%. Character encoding does contribute where non-English names are frequent—IRONMAN® Brazil 2024 rises from 85.9% to 87.8% under normalization alone—but it accounts for a small part of the gap rather than the whole of it.
Among matched athletes, split times were compared across all six disciplines, yielding 4,732,776 athlete–discipline pairs. Exact agreement (zero-second difference) was observed for 98.76% of these pairs, ranging from 98.50% for the run split to 99.10% for the swim. Agreement is not uniform over time: the median race-year agrees exactly for 100% of pairs and the fifth percentile for 99.21%, but the earlier seasons are weaker, with 2017 at 86.3% and 2014 at 95.1% against 99.9% or above from 2020 onward. The discrepancies are concentrated in records carrying post-race time corrections applied to one source but not the other. These results indicate close correspondence between the two sources across the full period, with the caveat that the correspondence is weaker in the earliest seasons.

3.2.2. Completeness

Field coverage was assessed across all 2,706,922 records (Table 1). Core identifying fields (finish status, age group, race type, race year) have near-complete coverage (≥99.6%). Split time fields range from 82.9% (run) to 85.9% (swim) coverage. Transition times (T1, T2) are available for 84.2% and 84.1% of records, respectively—a unique feature of this dataset, as no previously published large-scale IRONMAN® dataset has reported separated transition times at population level [9,10].
Fields exclusive to the official source (AWA points, distance completed) have coverage proportional to the official source’s share of the dataset (54.6% and 56.8%, respectively). These fields are absent from supplementary records by design and are clearly identifiable via the source column.

3.2.3. Transition Time Coverage

To assess whether records lacking transition data introduce systematic bias, we compared the performance of athletes with and without each transition among full-distance finishers. Athletes without T1 data (n = 42,972) had a median overall finish time of 11:46:20, compared with 12:27:08 for athletes with T1 data (n = 1,051,808), a difference of 41 min. The equivalent comparison for T2 gives a much smaller difference: athletes without T2 data (n = 25,706) had a median of 12:09:40 against 12:25:59 for those with it (n = 1,069,074), a difference of 16 min. In both cases the records lacking the transition are concentrated in older races with faster, more competitive fields rather than representing a bias toward slower or less complete records, and the effect is weaker for T2.
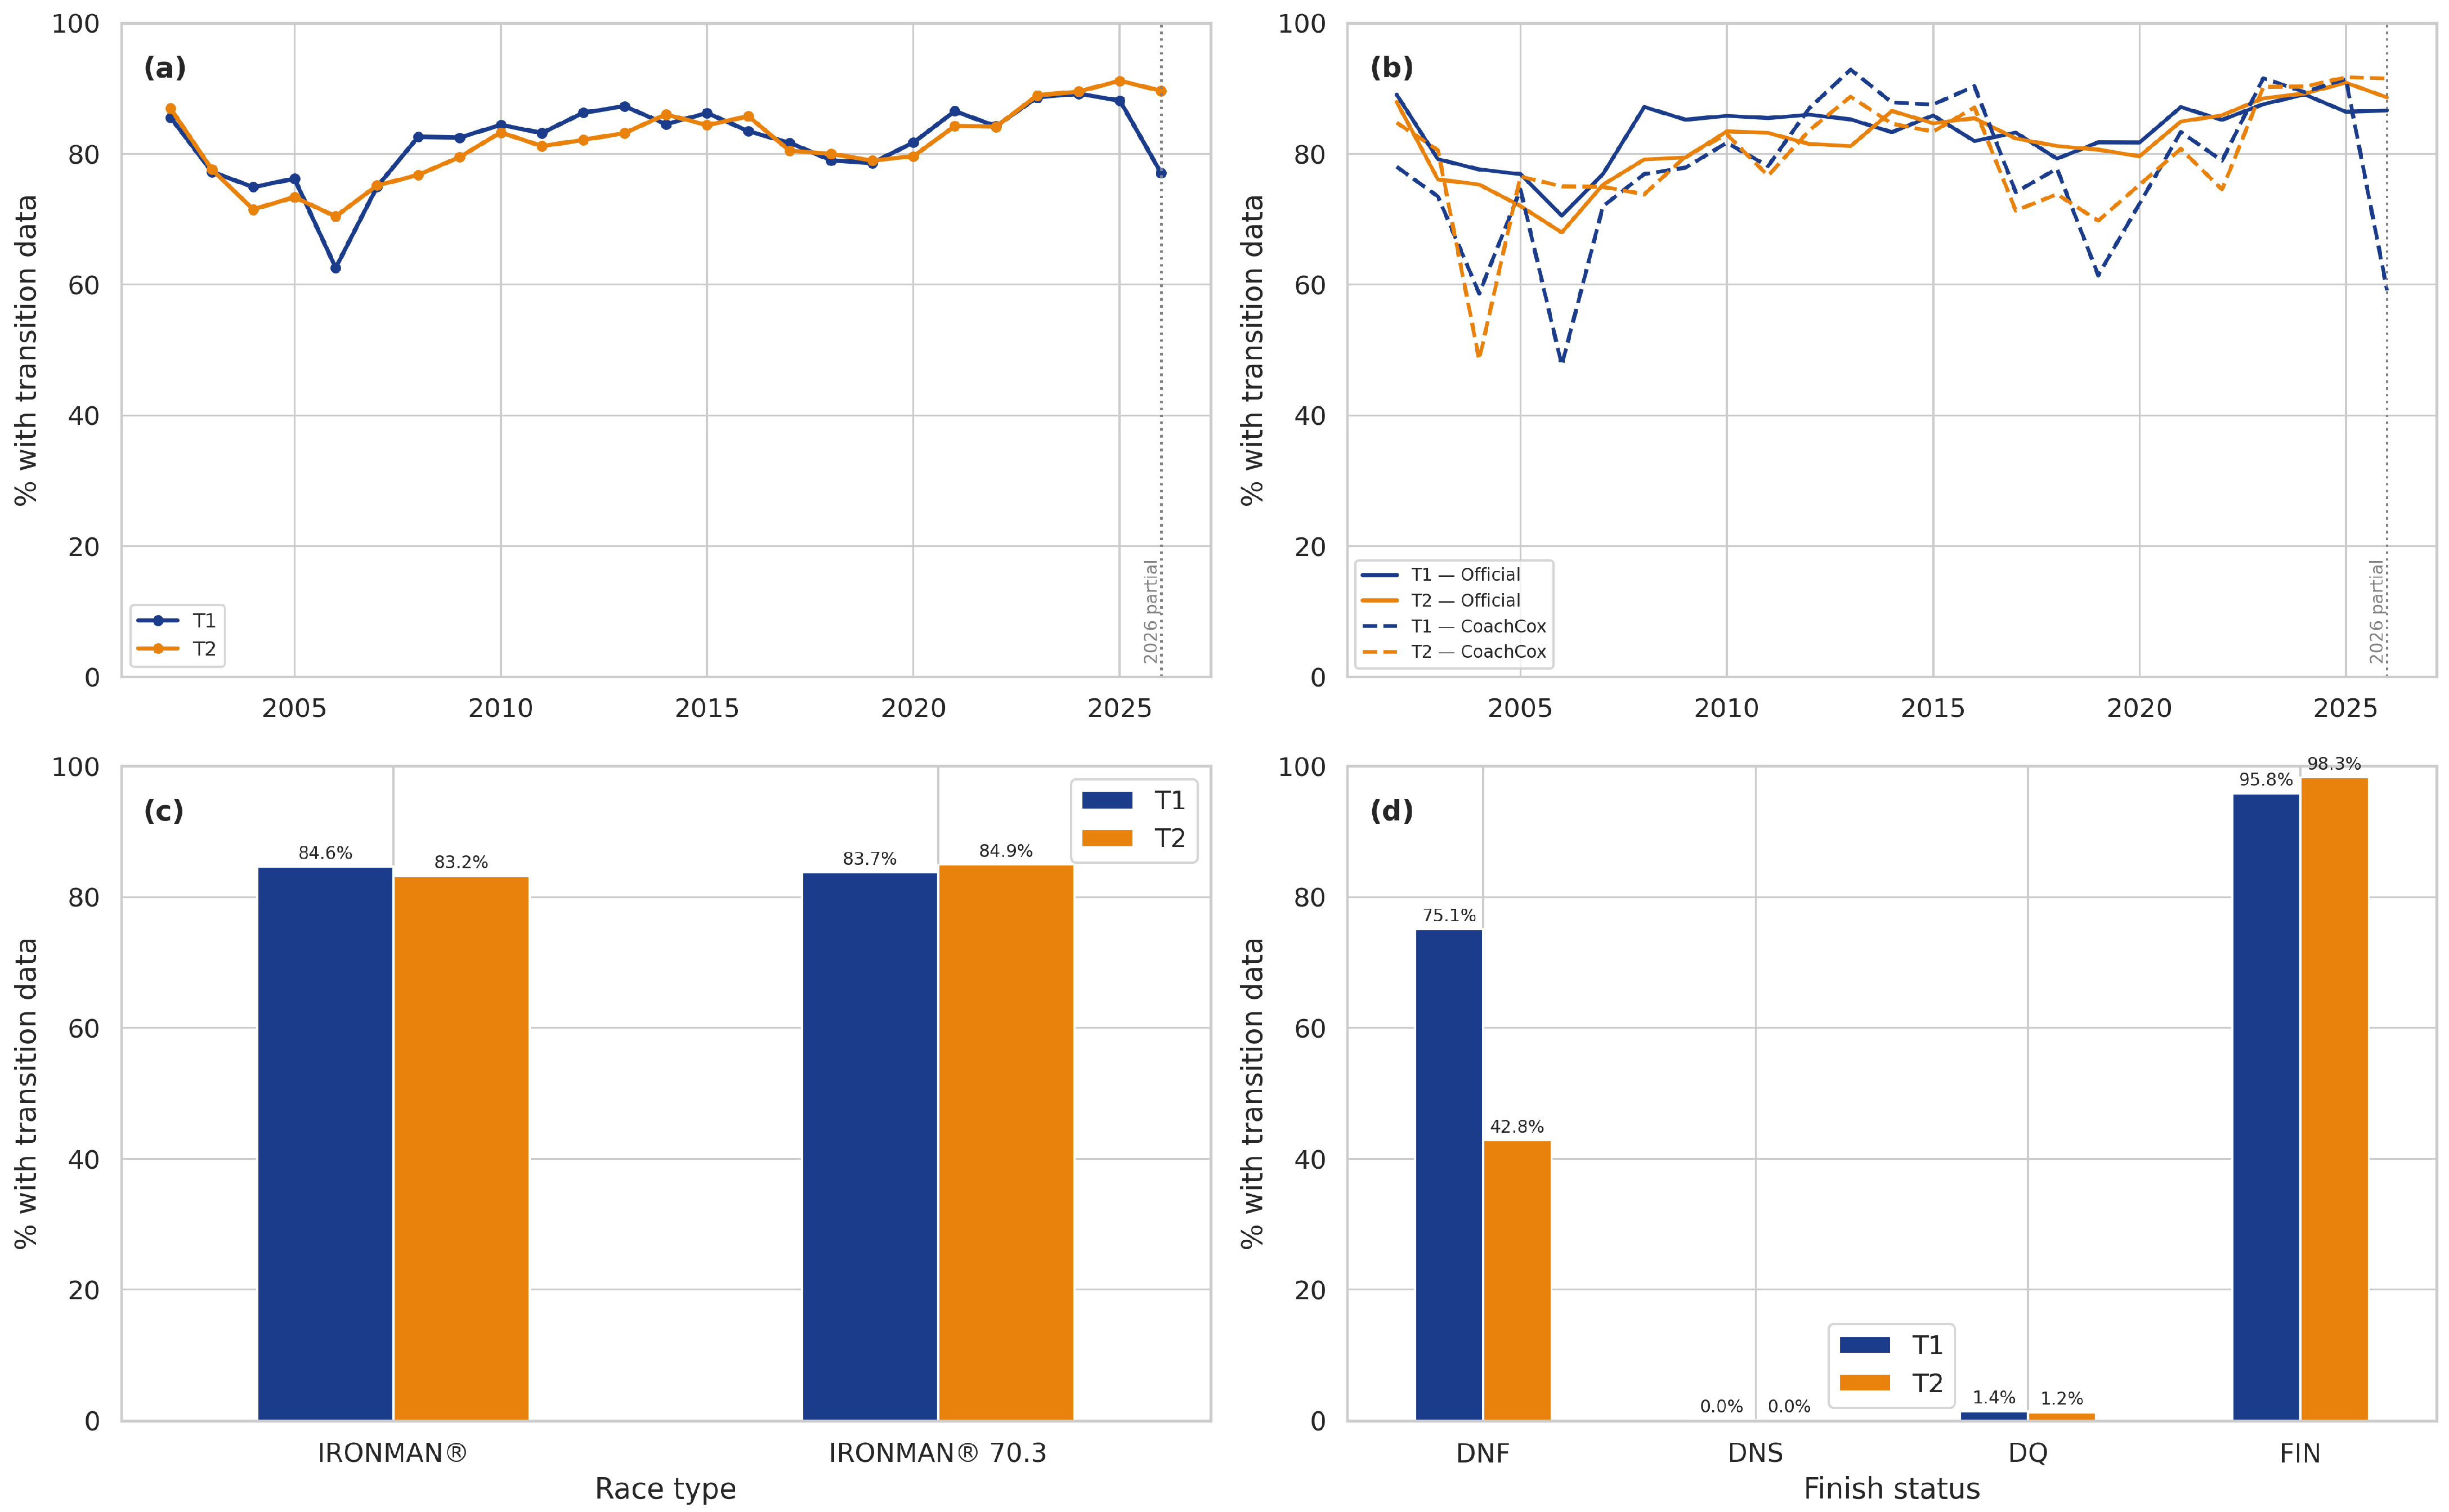
Transition coverage varies by year, from 62.6% (2006) to 89.2% (2024) for T1 and from 70.4% (2006) to 91.2% (2025) for T2, remaining above 80% from 2008 onward for both (Figure 5).
Missingness is not symmetric between the two transitions, and the asymmetry is informative rather than an artefact. Among finishers, T2 is better covered than T1 (98.3% against 95.8%), whereas among athletes who did not finish, the relation reverses sharply: T1 is present for 75.1% of DNF records but T2 for only 42.8%. This is what the race itself implies—an athlete who abandons the bike leg has passed through T1 and never reaches T2—and it means that a missing T2 in a DNF record localizes the withdrawal rather than merely recording an absence.

3.2.4. Internal Consistency

For records where all five split times and overall time were available and greater than zero (n = 2,139,756), we computed the absolute difference between the sum of individual splits (swim + T1 + bike + T2 + run) and the reported overall time. Of these records, 76.94% showed exact agreement (zero-second difference), 98.30% were within one second, and 99.9973% were within five seconds. The remaining 57 records (0.0027%) all differ by more than 60 s, and are likely attributable to post-race time adjustments not consistently propagated across fields. These results demonstrate high internal consistency of the split time data.

3.2.5. Physiological Plausibility

Split times were assessed against plausible ranges for each discipline. The bounds were set by the authors from the observed distributions and from the physiological limits of the events, rather than adopted from a published source. For full-distance IRONMAN® finishers they are: swim 30–150 min, T1 0.5–30 min, bike 3–10 h, T2 0.5–30 min, run 2–8 h, and overall 7–17 h. Under these bounds the proportion of out-of-range values among full-distance finishers is below 1.2% for every field, consistent with data-entry errors or extraordinary race conditions rather than systematic quality problems.
The bounds above are specific to the full distance and were not applicable to half-distance records, which are 50.5% of the dataset; applied there they would flag 85.1% of finishers on overall time, since the median IRONMAN® 70.3 finish is 5:53:16 against a lower bound of seven hours. Distance-specific bounds for the half distance are: swim 15–75 min, bike 1.5–5 h, run 1–4 h, and overall 3.5–9 h, with the same 0.5–30 min range applying to both transitions at either distance. Under these, out-of-range values among half-distance finishers fall below 0.7% for every field. Records falling outside the bounds for their distance are flagged but not removed, preserving the raw data for users to apply their own inclusion criteria.

4. Discussion

We assembled and validated the largest openly available dataset of IRONMAN® triathlon race records to date, comprising 2,706,922 athlete-race records across more than 1500 events and 24 years. Three features distinguish this resource from previously published triathlon datasets: it unifies full-distance and half-distance events in a single schema, it is drawn from two separate data sources with documented cross-validation, and it provides separated first (T1) and second (T2) transition times at the population scale. The four-dimensional quality assessment—cross-source agreement, completeness, internal consistency, and physiological plausibility—supports the use of the dataset as a reliable basis for secondary analysis.

4.1. Comparison with Existing Datasets

At 2.7 million records, the dataset is more than 3.3 times larger than the largest previously published IRONMAN® analysis, which examined 823,459 half-distance records [6], and it spans both race distances rather than one. Earlier large-scale studies have been limited to single distances and, in the case of transition analysis, to small elite subsamples: the only dedicated IRONMAN®-distance transition study was restricted to the annual top 10 World Championship finishers and could not separate T1 from T2 [9], while the Olympic-distance evidence that T2 relates more strongly to placement than T1 has had no long-distance counterpart [10]. An earlier community collection of IRONMAN® results was released on Academic Torrents but was not peer-reviewed and lacked documentation of fields, collection methodology, and validation [11]. The present resource follows the model of formally described, openly deposited datasets that have advanced reproducibility in other endurance sports [12], and extends it to long-distance triathlon.

4.2. Practical Guidance for Reuse

Several properties of the dataset are relevant to its analytical reuse. Full-distance and half-distance events differ substantially in split-time distributions and in physiological demands: the median finish among finishers in this dataset is 5:53:16 at the half distance against 12:25:37 at the full distance, and the determinants of performance are not the same across a range that wide [2]. Analyses should therefore stratify by the race_type field or explicitly justify pooling across distances. The source column allows users to restrict analyses to officially sourced records when fields unique to that source (AWA points, distance completed per segment) are required, or to use the full merged dataset when they are not, given the demonstrated equivalence between sources. The distance-completed fields localize the point of withdrawal along the race course with greater precision than inference from available splits, making them particularly informative for non-completion analyses. Because the deposited dataset excludes athlete names, longitudinal tracking of repeat participants is not directly supported in the public version; researchers requiring this capability can reproduce the full dataset from the provided scripts and match on name, accounting for spelling and name-change variations. Transition-time analyses should report the proportion of records with available data and consider restricting temporal analyses to post-2008 records, where coverage exceeds 80%.

4.3. Limitations

Three limitations concern how the dataset was assembled. First, event-level completeness cannot be quantified. No authoritative public register of every IRONMAN® and IRONMAN® 70.3 race-year held since 2002 exists against which to compute coverage, and automated discovery on the official platform was partly blocked by its content delivery network, so the series list is itself of unverified completeness. “Population-scale” in this article therefore refers to the scale of athlete-race records assembled and not to a claim of event-level completeness. Second, the two sources are not independent measurements. The supplementary source aggregates results published by the same timing operation that supplies the official platform, so their agreement demonstrates faithful transcription through two separate collection pipelines rather than external validation of the underlying times. Third, the 2026 season is partial: collection took place in March 2026, so that season holds only races run before that date and must not be read as a complete year.
Further limitations concern what the recorded values mean. Transition times are mat-to-mat intervals defined by each event’s timing provider rather than by us, and the size and layout of the transition area, the placement of the mats, and the congestion an athlete meets there are neither recorded nor guaranteed constant across events or across years; a comparison of transition times between events therefore carries an unmeasured component of course design. The dataset holds no course profile, elevation, air or water temperature, wind, or drafting regulation, so analyses of performance across events cannot control for the conditions under which those performances were produced. Courses, qualification rules and participant populations also changed over the 24 years covered, which makes any longitudinal comparison a comparison between eras as much as between athletes. Gender was inferred from age-group codes rather than self-reported, and a small fraction of records (0.5%) carried codes that could not be classified.
The remaining limitations concern the released file. Transition times are missing for 15.8% of records, and that missingness is not random but concentrated in older races with faster, more competitive fields; analyses spanning the earliest years should model this pattern rather than assume data are missing completely at random. Fields exclusive to the official source (AWA points, distance completed, ISO country code) are unavailable for the 24.6% of records drawn from the supplementary source, which effectively restricts analyses depending on them to the official subset. The public dataset contains no persistent athlete identifier, so longitudinal analyses rely on name matching in the reproducible full dataset, which is sensitive to spelling variation, transliteration of non-English names, and married-name changes; a pseudonymized identifier, derived deterministically from normalized athlete attributes, is a planned enhancement that would support longitudinal tracking without exposing names. The released dataset is de-identified rather than anonymous: direct identifiers are removed, but the combination of event, age group, bib number, and exact split times could in principle be matched against the publicly accessible source results, which display athlete names. Finally, both sources are public race-result services accessed through their own APIs; the dataset describes and validates these publicly available results rather than redistributing proprietary material, and reuse remains subject to the terms of use of the underlying platforms.

4.4. Research Directions

By unifying distances, sources, and transition-level detail at the population scale, the dataset enables lines of research that were previously constrained by data availability. Some are supported directly by fields the dataset contains: transition efficiency as a predictor of overall performance [8,14], epidemiology of race non-completion with dropout localized by the distance-completed fields, longitudinal trajectories of the sex difference in endurance performance [15], data-driven classification of pacing phenotypes [16], and the equity of the Kona qualification system through the AWA points field. Others would require linkage to information the dataset does not hold: return-to-competition patterns after the COVID-19 disruption can be described in aggregate but not attributed, since no field records why an athlete was absent, and any study of advanced footwear technology would need external data on what athletes wore, which no results platform publishes. We list the second group to mark the boundary rather than to claim it.

5. Conclusions

We present an openly available dataset of 2.7 million IRONMAN® and IRONMAN® 70.3 race records spanning 2002 to 2026. To our knowledge it is the largest openly available resource of its kind—more than three times the size of the largest previously published IRONMAN® analysis, which examined 823,459 records [6]—and the first to provide separated transition times at the population scale. Data quality was assessed along four dimensions: cross-source agreement, completeness, internal consistency, and physiological plausibility. Agreement between the two sources is close across all 559 race-years both of them hold, and internal consistency is high. The same assessment also marks where the resource is weaker: agreement is lower in the earliest seasons, transition times are absent for roughly one record in six, and the fields carried only by the official platform are unavailable for a quarter of the dataset. We report those limits alongside the strengths so that reuse can be judged against them. Together with the reproducible collection and merge scripts, the dataset provides a durable foundation for reproducible research on endurance performance, pacing, transitions, sex differences, non-completion, and qualification equity in long-distance triathlon.


Author Contributions

Conceptualization, A.S. and B.K.; methodology, A.S.; software, A.S. and D.F.; validation, A.S., D.F. and E.V.; formal analysis, A.S.; investigation, A.S.; data curation, A.S., E.V. and D.F.; writing—original draft preparation, A.S.; writing—review and editing, P.T.N., M.S.A., E.V., T.R., K.W., D.F. and B.K.; visualization, A.S.; supervision, B.K. All authors have read and agreed to the published version of the manuscript.

Funding

This research received no external funding.

Institutional Review Board Statement

The Ethics Commission of the Canton of St. Gallen, Switzerland, determined that the analysis of publicly accessible endurance-sport competition results is ethically unobjectionable and that a formal vote of the Commission is therefore not necessary (EKSG, 1 June 2010). The present study analyzes publicly accessible competition results, involves no intervention and no contact with participants, and uses no health-related personal data. It was conducted in accordance with the ethical standards of the Declaration of Helsinki, adopted in 1964 and last revised in 2013.

Informed Consent Statement

Not applicable.

Data Availability Statement

The de-identified dataset presented in this study is openly available in Zenodo at https://doi.org/10.5281/zenodo.19284673 (accessed on 14 September 2026) under a Creative Commons Attribution 4.0 International (CC BY 4.0) license, which applies to our compilation and its documentation. That identifier resolves to the current version, which is version 3.0.0 (https://doi.org/10.5281/zenodo.22097794, accessed on 14 September 2026). The deposited file carries 27 of the 28 columns described here and 2,706,867 of the 2,706,922 records, and is 475 MB. These data were derived from resources that are publicly accessible without authentication: the official IRONMAN® results platform (accessed via its public REST API; the same results are browsable at https://www.ironman.com/races, accessed on 28 March 2026) and the CoachCox statistics aggregator (https://www.coachcox.co.uk/imstats/, accessed on 27 March 2026). Public accessibility does not in itself extinguish privacy obligations, database rights, or the terms of use of the source platforms. Collection was rate-limited and non-disruptive, and the deposited file contains factual competition results with direct identifiers removed. All data-collection scripts, event identifiers, and the deterministic merge procedure are openly available at https://github.com/Nova-O2/ironman-data (accessed on 14 September 2026).

Acknowledgments

The authors thank Russell Cox for maintaining the CoachCox platform (coachcox.co.uk), which served as the supplementary data source for this study. Artificial intelligence tools (Claude, Anthropic) were used during manuscript preparation for language editing, grammar review, and verification of internal numerical consistency. The authors reviewed all AI-assisted output and take full responsibility for the content.

Conflicts of Interest

The authors declare no conflicts of interest.

References

  1. Lepers, R. Analysis of Hawaii Ironman Performances in Elite Triathletes from 1981 to 2007. Med. Sci. Sports Exerc. 2008, 40, 1828–1834. [Google Scholar] [CrossRef] [Scilit] [PubMed]
  2. Laursen, P.B.; Rhodes, E.C. Factors Affecting Performance in an Ultraendurance Triathlon. Sports Med. 2001, 31, 195–209. [Google Scholar] [CrossRef] [Scilit] [PubMed]
  3. Jeukendrup, A.E. Nutrition for Endurance Sports: Marathon, Triathlon, and Road Cycling. J. Sports Sci. 2011, 29, S91–S99. [Google Scholar] [CrossRef] [Scilit] [PubMed]
  4. Laursen, P.B.; Suriano, R.; Quod, M.J.; Lee, H.; Abbiss, C.R.; Nosaka, K.; Martin, D.T.; Bishop, D. Core Temperature and Hydration Status During an Ironman Triathlon. Br. J. Sports Med. 2006, 40, 320–325. [Google Scholar] [CrossRef] [Scilit] [PubMed]
  5. Millet, G.Y.; Lepers, R. Alterations of Neuromuscular Function After Prolonged Running, Cycling and Skiing Exercises. Sports Med. 2004, 34, 105–116. [Google Scholar] [CrossRef] [Scilit] [PubMed]
  6. Nikolaidis, P.T.; Valero, D.; Weiss, K.; Villiger, E.; Thuany, M.; Sousa, C.V.; Andrade, M.; Knechtle, B. Predicting Overall Performance in Ironman 70.3 Age Group Triathletes Through Split Disciplines. Sci. Rep. 2023, 13, 11614. [Google Scholar] [CrossRef] [Scilit] [PubMed]
  7. Knechtle, B.; Kach, I.; Rosemann, T.; Nikolaidis, P.T. The Effect of Sex, Age and Performance Level on Pacing of Ironman Triathletes. Res. Sports Med. 2019, 27, 370–387. [Google Scholar] [CrossRef] [Scilit] [PubMed]
  8. Millet, G.P.; Vleck, V.E. Physiological and Biomechanical Adaptations to the Cycle to Run Transition in Olympic Triathlon: Review and Practical Recommendations for Training. Br. J. Sports Med. 2000, 34, 384–390. [Google Scholar] [CrossRef] [Scilit] [PubMed]
  9. Rust, C.A.; Rosemann, T.; Lepers, R.; Knechtle, B. Changes in Transition Times in ’Ironman Hawaii’ Between 1998 and 2013. BMC Sports Sci. Med. Rehabil. 2014, 6, 37. [Google Scholar] [CrossRef] [Scilit] [PubMed]
  10. Cejuela, R.; Cala, A.; Pérez-Turpin, J.A.; Smith, D.J.; Chinchilla-Mira, J.J.; Cortell-Tormo, J.M. Temporal Activity in Particular Segments and Transitions in the Olympic Triathlon. J. Hum. Kinet. 2013, 36, 87–95. [Google Scholar] [CrossRef] [Scilit] [PubMed]
  11. Fister, I.J.; Fister, D. A Collection of IRONMAN, IRONMAN 70.3 and Ultra-Triathlon Race Results; Technical Report 0110; Academic Torrents: Cambridge, MA, USA, 2016; Available online: https://academictorrents.com/details/2269d7d1c77375aea732eea0905e370d4741575f (accessed on 14 September 2026).
  12. Emig, T.; Peltonen, J. Human Running Performance from Real-World Big Data. Nat. Commun. 2020, 11, 4936. [Google Scholar] [CrossRef] [Scilit] [PubMed]
  13. ISO 3166-1:2020; Codes for the Representation of Names of Countries and Their Subdivisions—Part 1: Country Code. International Organization for Standardization: Geneva, Switzerland, 2020.
  14. Vleck, V.E.; Bürgi, A.; Bentley, D.J. The Consequences of Swim, Cycle, and Run Performance on Overall Result in Elite Olympic Distance Triathlon. Int. J. Sports Med. 2008, 27, 43–48. [Google Scholar] [CrossRef] [Scilit] [PubMed]
  15. Lepers, R. Sex Differences in Triathlon Performance. Curr. Sports Med. Rep. 2019, 18, 227–228. [Google Scholar] [CrossRef] [Scilit] [PubMed]
  16. Abbiss, C.R.; Laursen, P.B. Describing and Understanding Pacing Strategies During Athletic Competition. Sports Med. 2008, 38, 239–252. [Google Scholar] [CrossRef] [Scilit] [PubMed]
Figure 1. Dataset composition by data source and race type. (a) Record counts by source (official IRONMAN® platform vs. CoachCox supplement) and race type (full-distance IRONMAN® vs. half-distance IRONMAN® 70.3). (b) Temporal distribution of records by source across 2002–2026; 2026 is a partial season. (c) Transition time coverage by data source, for T1 and T2.
Sci 08 00265 g001
Figure 2. Temporal trends in IRONMAN® participation and performance (2002–2026); 2026 is a partial season and is marked as such. (a) Annual participation by race type. (b) Median overall finish time for full-distance finishers (shading: COVID-19 pandemic period). (c) DNF rate by race type, with the same shading.
Sci 08 00265 g002
Figure 3. Split time distributions for full-distance IRONMAN® finishers. Panels: (a) swim, (b) T1, (c) bike, (d) T2, (e) run, (f) overall. The two transition panels are in minutes and the remaining four in hours, with axis ranges set per discipline. Each panel label gives the number of records drawn and, where the axis range clips the tail, how many records fall outside it; dashed vertical lines mark the median, computed over the full distribution rather than the drawn range.
Sci 08 00265 g003
Figure 4. Participation by sex across the covered period; 2026 is a partial season. (a) Annual record counts for male and female athletes. (b) Female share of records within each race distance. Athletes representing 251 distinct ISO 3166-1 country codes are present (country_iso2, available for 74.2% of records). By self-reported country of representation, the largest shares are the United States (937,613; 34.6%), the United Kingdom (183,093; 6.8%), and Australia (152,980; 5.7%).
Sci 08 00265 g004
Figure 5. Transition time coverage, T1 and T2 in every panel. (a) Coverage by year across the full dataset. (b) Coverage by year stratified by data source. (c) Coverage by race type. (d) Coverage by finish status, where the reversal between finishers and non-finishers is visible.
Sci 08 00265 g005
Table 1. Dataset schema. Each row describes one column in the merged CSV file (N = 2,706,922 records). The “Deposited” column indicates whether the field is present in the de-identified file released on Zenodo (N = 2,706,867).
ColumnTypeDescriptionExampleCoverage (%)Deposited
namestringAthlete full name“[athlete name]”100.0No
bibintegerBib number31100.0Yes
countrystringCountry of representation (free text; see Usage notes)“United States”99.6Yes
country_iso2stringISO 3166-1 alpha-2 country code“US”74.2 *Yes
age_groupstringAge group division or professional category“M35-39”, “FPRO”99.6Yes
event_namestringFull event name including year“2024 IRONMAN Florida”99.6Yes
event_idstringUnique event identifier (UUID)“af3f560c-…”99.6Yes
swim_secintegerSwim split time in seconds331885.9Yes
t1_secintegerTransition 1 time in seconds (swim → bike)29184.2Yes
bike_secintegerCycling split time in seconds16,86385.9Yes
t2_secintegerTransition 2 time in seconds (bike → run)14684.1Yes
run_secintegerRunning split time in seconds10,72282.9Yes
overall_secintegerOverall finish time in seconds31,34183.0Yes
finish_statusstringRace completion status“FIN”, “DNF”, “DNS”, “DQ”99.6Yes
rank_overallintegerOverall finish rank195.6Yes
rank_genderintegerFinish rank within gender195.4Yes
rank_groupintegerFinish rank within age group195.6Yes
swim_rankintegerOverall swim split rank996.6Yes
bike_rankintegerOverall cycling split rank496.3Yes
run_rankintegerOverall running split rank195.4Yes
awa_pointsintegerAll World Athlete qualification points500054.6 *Yes
swim_distance_kmfloatSwim distance completed in kilometers3.862463.2 *Yes
bike_distance_kmfloatCycling distance completed in kilometers180.27964.2 *Yes
run_distance_kmfloatRunning distance completed in kilometers42.03663.2 *Yes
total_distance_kmfloatTotal distance completed in kilometers226.17856.8 *Yes
race_typestringRace distance category“im” (full), “him” (half)100.0Yes
race_yearintegerYear of the race2024100.0Yes
sourcestringData provenance“official”, “coachcox”100.0Yes
Fields marked with * are available only for records from the official source (75.4% of the dataset). Coverage percentages are computed over the full merged dataset, counting a field as present when it holds a non-empty value; the split-time fields store zero as well as missing values, and both are treated as absent. The example value in the name row is a placeholder; athlete names are not reproduced here and are absent from the deposited file, from which a further 55 records were withdrawn because the supplementary source had redacted them.
Table 2. Cross-source agreement by season, over all 559 race-years present in both sources (2003–2026; 340 full-distance, 219 half-distance). Agreement is the proportion of matched athlete–discipline pairs whose split times are identical to the second.
SeasonRace-YearsMatched PairsMatch Rate, Exact (%)Match Rate, Order-Invariant (%)Exact Time Agreement (%)
2003328,49294.895.1100.00
2004334,11395.996.0100.00
2005544,03198.698.799.42
2006763,00495.495.599.98
2007870,86194.294.9100.00
2008880,24691.293.299.91
2009986,26089.090.199.97
2010982,98988.190.197.50
201111108,21487.689.999.95
201214127,79088.589.999.91
201316150,29987.689.797.71
201419181,74988.990.095.13
201522203,93389.391.099.75
201622212,46190.192.297.91
201723220,1700.093.186.32
201825223,8970.093.396.75
201924223,9410.093.599.76
2020522,36793.794.6100.00
202119120,32395.396.4100.00
202224201,51795.596.0100.00
202378614,13297.798.0100.00
2024102821,92597.597.999.99
202596772,19199.299.499.89
2026737,87199.899.8100.00
All5594,732,77695.396.498.76
Match rates in the “All” row are medians across race-years; the other columns are totals. The gap between the exact and order-invariant rules is concentrated in 2017–2019, where the supplementary source records names as “Lastname, Firstname” and exact matching therefore fails almost entirely.
Disclaimer/Publisher’s Note: The statements, opinions and data contained in all publications are solely those of the individual author(s) and contributor(s) and not of MDPI and/or the editor(s). MDPI and/or the editor(s) disclaim responsibility for any injury to people or property resulting from any ideas, methods, instructions or products referred to in the content.