Article

Signatures of Positive Selection and Climate Associations in Human OXPHOS Genes

1
Laboratory of Functional Physiology and Valorization of Bioresources, Higher Institute of Biotechnology of Béja, University of Jendouba, Béja 9000, Tunisia
2
Research Institute of Wildlife Ecology, University of Veterinary Medicine Vienna, 1160 Vienna, Austria
3
Wildlife Research—Vienna & Bredasdorp, Bredasdorp 7280, South Africa
4
Department of Evolutionary Anthropology, Faculty of Life Sciences, University of Vienna, Djerassiplatz 1, 1030 Vienna, Austria
*
Author to whom correspondence should be addressed.
Sci 2026, 8(9), 252; https://doi.org/10.3390/sci8090252
Submission received: 12 August 2026 / Revised: 7 September 2026 / Accepted: 8 September 2026 / Published: 10 September 2026
(This article belongs to the Section Biology Research and Life Sciences)

Abstract

Human adaptation to diverse climates has played a major role in shaping human evolution. Mitochondrial oxidative phosphorylation (OXPHOS) is central to energy production and thermogenesis; however, the respective contributions of the mitochondrial and nuclear genomes to climate adaptation remain poorly understood. Here, we analyzed 1901 genomes from 19 global populations to investigate positive selection across 13 mitochondrial and 78 nuclear OXPHOS genes. We identified 19 candidate amino acid positions under positive selection in seven mitochondrial genes and 103 candidate SNPs under positive selection in 20 nuclear genes. Climate association analyses revealed significant associations between climatic variables and candidate mitochondrial and nuclear variants. Notably, candidate nuclear SNPs occurred almost exclusively in non-coding regions, and 96 of the 103 variants have been previously reported as cis-eQTLs, suggesting that recent adaptive variation may have involved changes in gene regulation in addition to protein sequence variation. We also tested for statistical associations between mitochondrial amino acid variants and candidate nuclear SNPs; although 78 nominal associations were observed, none remained significant after correction for multiple testing. Several mitochondrial and nuclear variants have been previously reported in association with metabolic, neurological, and cardiovascular phenotypes. Overall, our findings highlight associations between climatic variation and mitochondrial and nuclear OXPHOS variation, as well as possible genetic interactions between mitochondrial and nuclear variants, providing new insights into the evolution of the OXPHOS system during recent human evolution.

1. Introduction

Mitochondria are essential organelles responsible for cellular energy production through oxidative phosphorylation (OXPHOS), which generates adenosine triphosphate (ATP) and heat for cellular functions and thermoregulation [1,2]. Beyond energy production, mitochondria regulate redox status, generate reactive oxygen species (ROS), calcium homeostasis, and apoptosis [1]. They are unique among animal cell organelles in possessing their own genome [3,4], though in higher eukaryotes this genome encodes only a limited set of genes, with the majority of mitochondrial proteins encoded by nuclear DNA [5]. These nuclear-encoded proteins are synthesized in the cytoplasm and subsequently imported into mitochondria through specialized protein import machineries. This dual-genome architecture necessitates precise coordination for optimal function [6]. The OXPHOS system comprises five multi-subunit complexes (I–V) embedded in the inner mitochondrial membrane, which collectively drive electron transfer and ATP synthesis. Electron transport generates a proton gradient across the inner mitochondrial membrane that drives ATP synthesis, while partial respiratory uncoupling can dissipate this gradient as heat [2,6]. Thus, mitochondrial variation may influence heat production not only by altering coupling efficiency at ATP synthase, but also by modulating electron transport rates and proton leak.
Human populations have adapted to an extraordinary range of environmental conditions following their expansion out of Africa approximately 50,000–100,000 years ago, colonizing habitats from cold boreal regions to tropical forests [7,8,9]. This global dispersal imposed diverse energetic and physiological demands, requiring metabolic flexibility to sustain thermogenesis, heat dissipation, and efficient energy production under contrasting climatic conditions [7]. Given its central role in thermogenesis and metabolic regulation, mitochondrial function, particularly OXPHOS efficiency, likely represents a key adaptation to environmental variation. Indeed, Ruiz–Pesini et al. [10] suggested that specific mtDNA replacement mutations enabled adaptation to colder northern climates, with these same variants influencing human health today. Similarly, Balloux et al. [11] and Mishmar et al. [12] proposed that environmental variation promoted selection of different mtDNA mutations across geographic regions. Such climate adaptation extends beyond humans to other species [13,14]. However, geographic or climatic associations with mtDNA variation do not, by themselves, establish that natural selection caused the observed patterns. Such patterns can also arise through demographic processes, including serial founder effects, migration, population structure, and genetic drift [15,16]. Therefore, distinguishing climate-associated genetic patterns from those generated by demographic history is essential when interpreting the evolutionary significance of mitochondrial variation.
Only a few studies have explored adaptation in nuclear genes involved in oxidative phosphorylation (OXPHOS), likely because the mitochondrial genome encodes the core catalytic and proton-pumping subunits of the respiratory chain, while most nuclear-encoded protein function as accessory, structural or regulatory components [2,17]. Indeed, Mishmar et al. [17] showed that three nuclear complex I genes (NDUFC2, NDUFA1, and NDUFA4) exhibited elevated amino acid substitution rates during primate evolution, suggesting adaptive selection. Because these genes encode membrane-domain subunits that interact closely with mitochondrial-encoded subunits, the authors compared amino acid changes across species and identified a correlation between substitutions in NDUFC2 and MT-ND5, which they interpreted as suggesting possible mitonuclear coevolution [17]. More broadly, empirical studies across diverse eukaryotes support the hypothesis of mitonuclear compensatory evolution, although its prevalence and evolutionary significance remain debated [18]. Approximately 150 nuclear genes encode mitochondrial proteins that interact directly with mtDNA-encoded products, particularly within the electron transport system, where precise assembly of nuclear- and mitochondrial-encoded subunits is essential for efficient oxidative phosphorylation. Consequently, mutations in mtDNA may be associated with compensatory changes in nuclear genes or regulatory pathways that help maintain mitochondrial function. However, such genetic associations should be distinguished from mitonuclear co-adaptation or coevolution, which require evidence of coordinated evolutionary change beyond statistical association alone.
Here, we analyzed 1901 whole-genome sequences from 19 human populations representing four major ancestries to investigate evolutionary patterns in mitochondrial- and nuclear-encoded OXPHOS genes. Unlike previous studies, which have focused on a limited number of OXPHOS genes or specific complexes, our analysis encompasses all five OXPHOS complexes and both mitochondrial and nuclear genomes. Specifically, we tested three hypotheses. First, we hypothesized that both mitochondrial and nuclear OXPHOS genes harbor signatures of positive selection, reflecting the central role of oxidative phosphorylation in human adaptation to diverse environments. Second, we hypothesized that the frequencies of candidate adaptive mitochondrial and nuclear variants are associated with climatic gradients, consistent with a role for environmental selection in shaping OXPHOS diversity. Third, we hypothesized that positively selected mitochondrial amino acid variants would show non-random associations with positively selected nuclear OXPHOS variants, consistent with mitonuclear co-evolution.

2. Material and Methods

2.1. Study Populations

We used high-coverage whole-genome sequence variant calls from the expanded 1000 Genomes Project cohort [19]. We selected 1901 individuals belonging to 19 populations originally represented in the 1000 Genomes Project Phase 3 panel [20]. High-coverage phased VCF files (GRCh38) were downloaded from the 1000 Genomes FTP site (https://ftp.1000genomes.ebi.ac.uk/vol1/ftp/data_collections/1000G_2504_high_coverage/working/20220422_3202_phased_SNV_INDEL_SV/, accessed on 15 October 2025). Variants were annotated with rsIDs using dbSNP build 151 for GRCh38 (https://ftp.ncbi.nlm.nih.gov/snp/organisms/human_9606_b151_GRCh38p7/VCF/, accessed on 15 October 2025). Complete mitochondrial genome sequences were additionally obtained from the 1000 Genomes FTP repository (https://ftp.1000genomes.ebi.ac.uk/vol1/ftp/release/20130502/supporting/MT/, accessed on 16 October 2025). We selected 1901 individuals from 19 populations (Table 1) representing four ancestry groups. African ancestry populations included ESN (Esan in Nigeria), GWD (Gambian (Mandinka in Western Divisions in Gambia), YRI (Yoruba in Ibadan, Nigeria), LWK (Luhya in Webuye, Kenya), and MSL (Mende in Sierra Leone). European ancestry populations included GBR (British from England and Scotland), FIN (Finnish from Finland), TSI (Toscani in Italia), and IBS (Iberian Populations in Spain). East Asian populations included CHS (Southern Han Chinese), CHB (Han Chinese in Beijing, China), JPT (Japanese in Tokyo, Japan), CDX (Chinese Dai in Xishuangbanna, China), and KHV (Kinh in Ho Chi Minh City, Vietnam). South Asian ancestry included BEB (Bengali in Bangladesh), GIH (Gujarati Indians in Houston, USA), ITU (Indian Telugu in the UK), PJL (Punjabi in Lahore, Pakistan), and STU (Sri Lankan Tamil in the UK). Admixed populations (ASW, ACB, MXL, PEL, CLM, and PUR) were excluded because recent inter-continental admixture generates extended, admixture-induced linkage disequilibrium that can produce spurious selection signals in haplotype-based scans (iHS, xp-EHH). CEU was not included because GBR was selected to represent the British/Northwestern European component of the European panel, and CEU was considered to provide limited additional population differentiation relative to GBR.
We used bcftools version 1.13 (https://github.com/samtools/bcftools/ (accessed on 17 October 2025)) and PLINK v2.00a3 (https://www.cog-genomics.org/plink/ (accessed on 17 October 2025)) to process the variant call format (VCF) files. The following filtering criteria were applied in bcftools: -m2 -M2 -v snps (retaining only biallelic SNPs), -i ‘F_MISSING < 0.10’ (excluding sites with >10% missing data), and -i ‘ID!=“.”’ (excluding variants without rsIDs). Using bcftools v. 1.13, we also removed variants with duplicate genomic positions or duplicate rsIDs. Hardy–Weinberg Equilibrium (HWE) was assessed separately for each of the 19 populations using the --hwe midp option in PLINK v2.00a3, and variants with p < 1 × 10⁻⁶ were excluded. The number of variants removed at each filtering step, together with the final number of variants retained for each chromosome and used consistently across all 19 populations, is reported in Supplementary Table S1. SNP positions correspond to the GRCh38/hg38 human genome assembly (https://genome.ucsc.edu/, accessed between 20 October and 11 December 2025).
Mitochondrial coding sequences of the 1901 selected individuals were aligned using ClustalW as implemented in BioEdit v.7.2.5 [21] under default parameters. For each individual, the start and end coordinates of each mitochondrial coding gene (from the initiation to the termination codon) were manually identified based on reference annotations. Individual protein-coding genes were then extracted separately, ensuring intact open reading frames and codon alignment across all sequences. Gene identity and sequence completeness were further confirmed via BLAST searches against the NCBI database (https://blast.ncbi.nlm.nih.gov/Blast.cgi, accessed on 12 November 2025).
The overall analytical pipeline, including data retrieval, quality control, selection scans, functional annotation, climate association, and mitonuclear association analyses, is summarized in Figure 1.

2.2. Investigated OXPHOS Genes

We analyzed 13 mitochondrial DNA-encoded OXPHOS genes: MT-ND1, MT-ND2, MT-ND3, MT-ND4, MT-ND4L, MT-ND5, MT-ND6 (Complex I); MT-CYB (Complex III); MT-CO1, MT-CO2, MT-CO3 (Complex IV); MT-ATP6, MT-ATP8 (Complex V). In addition, we analyzed 78 nuclear-encoded oxidative phosphorylation (OXPHOS) genes (Supplementary Table S2), representing the complete set of nuclear genes encoding subunits of the five OXPHOS enzyme complexes. These nuclear subunits include 37 genes of Complex I (NADH dehydrogenase), four genes of Complex II (succinate dehydrogenase), nine genes of Complex III (cytochrome bc1complex), 11 genes of Complex IV (cytochrome c oxidase), and 17 genes of Complex V (ATP synthase).

2.3. Identifying Positive Selection in Mitochondrial OXPHOS Genes:

To assess whether mitochondrial OXPHOS genes show evidence of positive selection at the amino acid level, we first applied a codon-based maximum-likelihood approach implemented in the PAML v. 4.9j package [22]. For each mitochondrial gene, the best-fitting nucleotide substitution model was determined using MEGA v. 11.0.11 [23], and a gene-specific maximum-likelihood phylogenetic tree was constructed under the selected model. These trees were then used as phylogenetic inputs for CODEML to test for positive selection at individual amino acid sites. The analysis estimates the ratio of nonsynonymous to synonymous substitution rates (dN/dS), where values below 1 indicate purifying selection, a value of 1 indicates neutral evolution, and values above 1 indicate positive selection. We compared the nearly neutral model M1a, which allows sites to evolve under neutral or purifying selection, with the positive-selection model M2a, which includes an additional class of sites with dN/dS > 1 [24]. The two models were compared using a likelihood-ratio test (LRT), calculated as twice the difference in log-likelihoods between the models and evaluated against a chi-square distribution with 2 degrees of freedom, corresponding to the two additional parameters in M2a. When the LRT supported the M2a model, the Bayes Empirical Bayes (BEB) approach was used to identify individual codons with a high posterior probability of belonging to the positively selected class. Codons with a BEB posterior probability >0.95 were considered candidate sites showing evidence consistent with positive selection. Each mitochondrial gene was analyzed independently using CODEML, and no multiple-testing correction was applied across genes.
We further used four additional codon models implemented on the DATAMONKEY web server (http://www.datamonkey.org/; accessed between 4 November and 26 December 2025) [25] to assess codons under positive or purifying selection: Single Likelihood Ancestral Counting (SLAC), Fixed Effects Likelihood (FEL), Fast Unconstrained Bayesian AppRoximation (FUBAR) and Mixed Effects Model of Evolution (MEME) [26,27]. For each gene, the corresponding coding-sequence alignment was uploaded to Datamonkey, which inferred the phylogenetic tree used for the subsequent codon-based analyses. Evidence of positive selection was assessed using p < 0.05 for SLAC, FEL, and MEME, and a posterior probability of ≥95% for FUBAR. All tests were performed independently for each mitochondrial gene, and no additional multiple-testing correction was applied across genes.
Identification of positively selected sites relied on the two complementary approaches: PAML/CODEML (codon-based) and the Datamonkey web server (site-based). Candidate status within PAML required support under model M2a using Bayes empirical Bayes (BEB) analysis. For Datamonkey, a multi-method consensus framework [25] was used to mitigate false positives, designating sites as candidates only if supported by at least two of four implemented methods (SLAC, FEL, FUBAR, and MEME). To maintain statistical independence across frameworks, criteria were evaluated separately within each pipeline rather than pooled. The resulting set encompasses all candidate sites supported by either analytical approach.

2.4. Identifying Positive Selection in Nuclear OXPHOS Genes

To detect positive selection (selective sweeps) in the phased autosomal chromosomes, we employed the integrated haplotype score (iHS) approach [28], the cross-population extended haplotype homozygosity (xp-EHH) [29] approach, and the Population Branch Excess (PBE) statistics [30] and combined all three methods by calculating a Fisher score (see, for example, [31]).
The iHS method captures the ratio of extended haplotype homozygosity (EHH) for the haplotypes carrying the derived iHHD and ancestral allele iHHA at candidate SNP sites [28]. We used selscan version 2.0.3 [32] to calculate iHS at individual SNPs across the genome excluding sites with minor allele frequency below 0.05. The required genetic maps for GRCh38 were obtained from the Broad Institute Eagle tables (https://alkesgroup.broadinstitute.org/Eagle/downloads/tables/, accessed on 22 October 2025). For visualization and regional assessment, normalized SNP-level statistics were additionally summarized in non-overlapping 100 kb windows. Raw iHS scores were normalized using the norm script provided with selscan.
We further employed the cross-population extended haplotype homozygosity (xp-EHH) statistic, which compares haplotype homozygosity decay between two populations [29]. Positive xp-EHH values indicate extended haplotype homozygosity in the focal population relative to the reference, consistent with a stronger selective sweep in the focal population; negative values indicate the converse. We computed xp-EHH scores pairwise between all populations using the software selscan version 2.0.3, with normalization performed as for iHS. For the 19 populations included in the analysis, both directions of each population pair were evaluated, resulting in 342 directional comparisons, with each population alternatively designated as the focal and reference population. For each SNP, only positive xp-EHH values—reflecting extended haplotype homozygosity on the focal population background—were retained, and the mean positive xp-EHH score across these comparisons was calculated to derive a single population-specific selection metric.
Pairwise FST were calculated using Weir and Cockerham approach as implemented in VCFtools [33,34]. FST was estimated at individual SNPs for all population pairs and negative FST estimates were set to zero. The resulting FST values were then converted to branch lengths using T = l n ( 1 F S T ) . The PBE method [30], is a modified approach of the original Population Branch Statistics (PBS) [35]. For each focal population (A) and two predefined reference populations (B and C), SNP-specific PBS values were calculated as P B S A = ( T A B + T A C T B C ) / 2 . SNP-level PBS and T values were combined across chromosomes 1–22 to obtain genome-wide median values, which were used to calculate the expected PBS and subsequently PBE following Yassin et al. [30] (see also [31]). We implemented the PBE calculation using custom scripts in R version 4.1.0 [36]. In the PBE analyses, for each focal population within the four major ancestry groups (EUR, EAS, SAS, and AFR), two genetically divergent non-focal populations were selected as reference populations to represent genetically divergent backgrounds relative to each focal superpopulation: CHB and YRI for EUR, GBR and YRI for EAS and SAS, and GBR and CHB for AFR. These choices were supported by population structure analyses reported by Awadi et al. [37], whose PCA of populations representing the four major ancestry groups showed clear differentiation among these populations. Using two genetically distinct reference populations for each focal population allowed population-specific excess differentiation to be evaluated relative to broader patterns of genomic differentiation. The same reference populations were used consistently for all focal populations within each ancestry group.
Because three nuclear oxidative phosphorylation (OXPHOS) genes, NDUFA1, NDUFB11, and COX7B, are located on the X chromosome, selection analyses were also performed on X-chromosomal variants encompassing these genes. The pseudoautosomal regions (PARs) were excluded because of their distinct inheritance pattern, and only biallelic variants located within the non-pseudoautosomal region (nPAR) were retained. X-chromosome iHS and XP-EHH statistics were normalized separately from autosomal statistics.
To integrate evidence from iHS, xp-EHH, and PBE, we calculated a genome-wide Fisher score for each SNP following Herzog et al. [31]. For each statistic, we computed genome-wide ranks and transformed them to −log10 (rank of the statistic/number of SNPs). The Fisher score for each SNP was then computed as the sum of these transformed values across the three statistics. Thus, higher scores indicate stronger combined evidence of selection across the three statistics. As is common for genome-wide selection scans, extreme selection signals are typically identified using empirical or tail-based thresholds rather than a universal statistical cut-off. Depending on the method, studies have used predefined statistic thresholds [38], empirical significance based on genome-wide rankings [39], or extreme tails of the score distribution [28]. Accordingly, we used the upper 1% of the integrated score distribution as an empirical criterion for identifying candidate selection outliers, following the approach of Herzog et al. [31].

2.5. Functional Significance of Positively Selected Variants

To assess the potential functional significance of variants under positive selection, we queried previously reported cis-expression quantitative trait loci (eQTLs) from the GTEx Portal (https://www.gtexportal.org/home/ [40]; dbGaP Accession phs000424.v10.p2, accessed between 15 June and 10 July 2026) using each positively selected SNP identified in this study. For every queried variant, we recorded significant cis-eQTL associations reported by GTEx, including the associated eGene(s) and tissue(s) in which the association was detected. Additionally, we queried the NHGRI-EBI GWAS Catalog (https://www.ebi.ac.uk/gwas/ [41]; accessed between 15 June and 10 July 2026) using the positively selected nuclear SNPs identified in this study (e.g., rsIDs). For each queried variant, we recorded previously reported trait and disease associations available in the database. Finally, to identify mitochondrial variants under positive selection with known disease associations, we queried the MITOMAP database (http://www.mitomap.org (accessed on 20 July 2026) [42]).
To assess whether multiple candidate SNPs within the same gene might represent independent functional signals or merely tag a shared haplotype, we performed pairwise linkage disequilibrium (LD) analyses. For each gene containing two or more positively selected SNPs, we retrieved LD estimates (r2) using the LDmatrix tool from the LDlink web interface (https://ldlink.nih.gov/; accessed on 25 August 2026 [43]), which queries the 1000 Genomes Project high-coverage GRCh38 reference panel. We analyzed candidates using the population-specific panel corresponding to the population in which the signatures were detected. Pairwise SNP combination with r2 > 0.8 were considered to be in strong LD [44], suggesting they likely tag the same locus or haplotype rather than acting as independent functional variants.

2.6. Associations Between Climatic Variation and Positively Selected Variants

Because GIH (Gujarati Indians in Houston, USA), ITU (Indian Telugu in the UK), and STU (Sri Lankan Tamil in the UK) were sampled outside the geographic regions represented by their corresponding ancestral populations, these three populations were excluded from the climate association analyses. This exclusion was implemented because climatic variables assigned according to the sampling location would not accurately represent the environmental conditions associated with the geographic origins of these populations. Climatic principal component analyses and subsequent genotype–climate association tests were therefore performed using the remaining 16 populations. For each population, a single set of coordinates (latitude and longitude) was obtained from the kgp R package v 1.1.1 [45]. These population-level coordinates were used to extract bioclimatic data from the WORLDCLIM data set for 2.5 min intervals (Version 2.1, http://www.worldclim.org/bioclim.htm (accessed on 12 December 2025)). Nineteen bioclimatic variables were automatically extracted using DIVA-GIS ver. 7.5. To reduce multicollinearity and summarize environmental variation, we performed Principal Component Analysis (PCA) on standardized climate variables using the ade4 package in R 4.1.0 [36]. The first four principal components (PC1–PC4), explaining 91.54% of the total climatic variance, were retained as predictors representing major climatic gradients.
Genotypic and amino-acid (AA) data were formatted for binomial generalized linear mixed models (GLMMs). Diploid SNPs were modeled as binomial proportions using a two-column response matrix of alternative and reference allele counts cbind (alternative, reference) derived from individual genotypes. Haploid AA positions were treated as binary responses (0 = reference, 1 = alternative), with the most frequent allele designated as the reference. The first four climatic principal components (PC1–PC4) were included as fixed effects. To account for population structure, two specifications were fitted: non-nested models with population included as a random intercept (SNP ~ PC1 + PC2 + PC3 + PC4 + (1|population) and AA ~ PC1 + PC2 + PC3 + PC4 + (1|population)), and nested models where population was nested within superpopulation (SNP ~ PC1 + PC2 + PC3 + PC4 + (1|superpopulation/population) and AA ~ PC1 + PC2 + PC3 + PC4 + (1|superpopulation/population)). Superpopulations were defined according to the 1000 Genomes population classification. The estimated effects of the climatic principal components were then examined to assess associations between climatic PCs and candidate positively selected SNPs and amino-acid positions. p-values were adjusted using the Benjamini–Hochberg false discovery rate (FDR) procedure across all four climatic PCs, separately for mitochondrial amino-acid variants and nuclear SNPs.

2.7. Association Analyses of Mitochondrial and Nuclear Variants

Associations between positively selected mitochondrial amino acid (AA) variants and nuclear SNP variants were assessed using generalized linear models implemented in the glmmTMB package v. 1.1.14 in R 4.1.0. For each AA–SNP pair, mitochondrial AA state was modeled as the response variable, with nuclear SNP state and population included as predictors (AA ~ SNP + population). Population was included as a fixed effect to account for differences in allele frequencies and population structure.
For each model, the significance of the AA–SNP association was evaluated using a likelihood-ratio test (LRT), comparing the full model containing the predictor of interest with a reduced model including population only (AA~population). Likelihood-ratio statistics (χ2), corresponding p-values, and degrees of freedom were extracted for each AA–SNP pair. To account for multiple testing, p-values were adjusted using the Benjamini–Hochberg false discovery rate (FDR) procedure, and associations with FDR-adjusted p-values < 0.05 were considered statistically significant.

3. Results

3.1. Positive Selection in Mitochondrial OXPHOS Genes

Overall, 19 unique amino acid positions across seven mitochondrial OXPHOS genes showed evidence of positive selection according to our predefined criteria: MT-ND1, MT-ND2, MT-ND3, MT-ND4, and MT-ND5 of Complex I, MT-CYB of Complex III, and MT-ATP6 of Complex V. Site-specific analyses implemented in Datamonkey identified 12 codons supported by at least two of the four methods applied (FEL, SLAC, FUBAR, and MEME) (Table 2). The M2a site model implemented in CODEML identified 13 candidate codons across the same seven genes (Table 2, Supplementary Table S3). Six positions—MT-ND2_331, MT-ND5_13, MT-ND5_257, MT-ND5_555, MT-ATP6_176, and MT-CYB_7—were independently identified by both the CODEML and Datamonkey analyses. Combining both approaches according to our predefined criteria resulted in 19 unique candidate positions. The six sites supported by both frameworks represent the strongest candidates, as they were independently recovered by methods differing in their underlying statistical assumptions; the remaining 13 sites, supported by only one framework, are considered lower-confidence sites.

3.2. Positive Selection in Nuclear OXPHOS Genes

We identified signatures of positive selection in 103 SNPs across 20 nuclear genes (Table 3, Supplementary Table S4). The number of SNPs under positive selection per gene ranged from one to 25, with the highest numbers observed in NDUFS6 (25 SNPs), COX5A (18 SNPs), NDUFA8 (10 SNPs), and NDUFS4 (9 SNPs). Eight genes were represented by a single SNP: ATP5MC2, ATP5MK, COX6B1, NDUFA6, NDUFB1, NDUFS5, NDUFV1, and SDHD. Signatures of positive selection were detected across three of the four ancestry groups, with no signatures identified in the East Asian (EAS) populations. The largest number of positively selected SNPs was observed in European populations (GBR, FIN, and TSI), followed by African populations (LWK, ESN, YRI, GWD, and MSL), whereas only two SNPs were identified across the two South Asian (SAS) populations (BEB and ITU). Among the populations analyzed, only GBR exhibited SNPs under positive selection in genes belonging to all five OXPHOS complexes.
To evaluate whether candidate selection signals were non-randomly distributed across populations, we tested the observed SNP counts across all 19 populations against two null models. The observed distribution deviated significantly from both an equal-distribution model (χ2 = 327.32, df = 18, p < 2.2 × 10⁻¹⁶) and a sample-size-weighted model (χ2 = 322.95, df = 18, p < 2.2 × 10⁻¹⁶). This deviation was driven primarily by European (EUR) populations—GBR (n = 49), FIN (n = 25), and TSI (n = 24)—which together accounted for 71.8% of all detected candidates. Notably, the SNP counts for individual populations are not mutually exclusive, as many candidate SNPs were shared between two or three populations (Supplementary Table S4).

3.3. Functional Significance of Positively Selected Variants

Functional annotation using the GTEx database revealed that 96 (out of 103) positively selected nuclear SNPs function as cis-eQTLs (Supplementary Table S5). Of the 20 investigated OXPHOS genes, variants in 19 were associated with the expression of their corresponding genes, whereas no corresponding expression association was observed for SDHD. Several SNPs were also associated with the expression of additional nearby genes, including nuclear-encoded mitochondrial genes involved in mitochondrial RNA regulation and ribosomal function (PTCD1 and MRPL58), transcriptional regulators (ZBTB32, ETV2, SP1, KMT2B, TCF20, and L3MBTL2), and genes involved in RNA processing or cellular regulation (CPSF4, CPSF2, U2AF1L4, TARBP2, EDC3, SNUPN, LIN37, KMT2B, and HID1). These findings suggest that candidate SNP variants under positive selection may influence the expression of individual OXPHOS genes, raising the possibility of broader effects on cellular pathways that need further investigation.
Pairwise LD analysis revealed distinct haplotypic structures across multi-SNP loci. All candidate variants in COX4I1 (FIN), NDUFA10 (ESN), UQCRC2 (GBR), and NDUFV2 (LWK) were in strong LD (r2 > 0.8), indicating selection on single shared haplotypes. Conversely, high LD encompassed 12 out of 18 variants in COX5A (GBR) and 15 out of 20 in NDUFS6 (FIN), with the unlinked variants suggesting secondary or distinct sub-haplotype structures (Supplementary Table S6).
On the other hand, GWAS annotation further showed that several positively selected SNPs have previously been associated with complex human traits, including blood pressure, body mass index, hematological traits, Alzheimer’s disease risk, circulating IGF-1 levels, frailty, metabolic traits, educational attainment, and susceptibility to leprosy (Table 4), providing additional context regarding the potential functional relevance of these variants.
Finally, MITOMAP annotation showed that several positively selected mitochondrial amino acid variants in MT-ND1, MT-ND2, MT-ND3, and MT-ND5 have previously been reported in association with human diseases (Table 5), providing functional and clinical context for these variants.

3.4. Mitonuclear and Climate Associations

To investigate potential mitonuclear associations among candidate sites under positive selection, we examined the relationships between the 19 mitochondrial amino acid positions and the 103 positively selected nuclear SNPs identified in our analyses. Although several associations showed nominal evidence of association (p < 0.05), none remained significant after controlling for the false discovery rate (FDR < 5%). The strongest nominal associations were observed for MT-CytB_7 with rs1980307 ATP5MF and rs35704781 NDUFA8 (p = 0.00154 for both; FDR = 0.679), and for MT-ND5_13 with rs77208309 ATP5MF (p = 0.00159; FDR = 0.679). Additional nominal associations involved MT-ND5_555, MT-ND5_544, MT-ND1_304, and other mitochondrial amino acid positions (Supplementary Table S7).
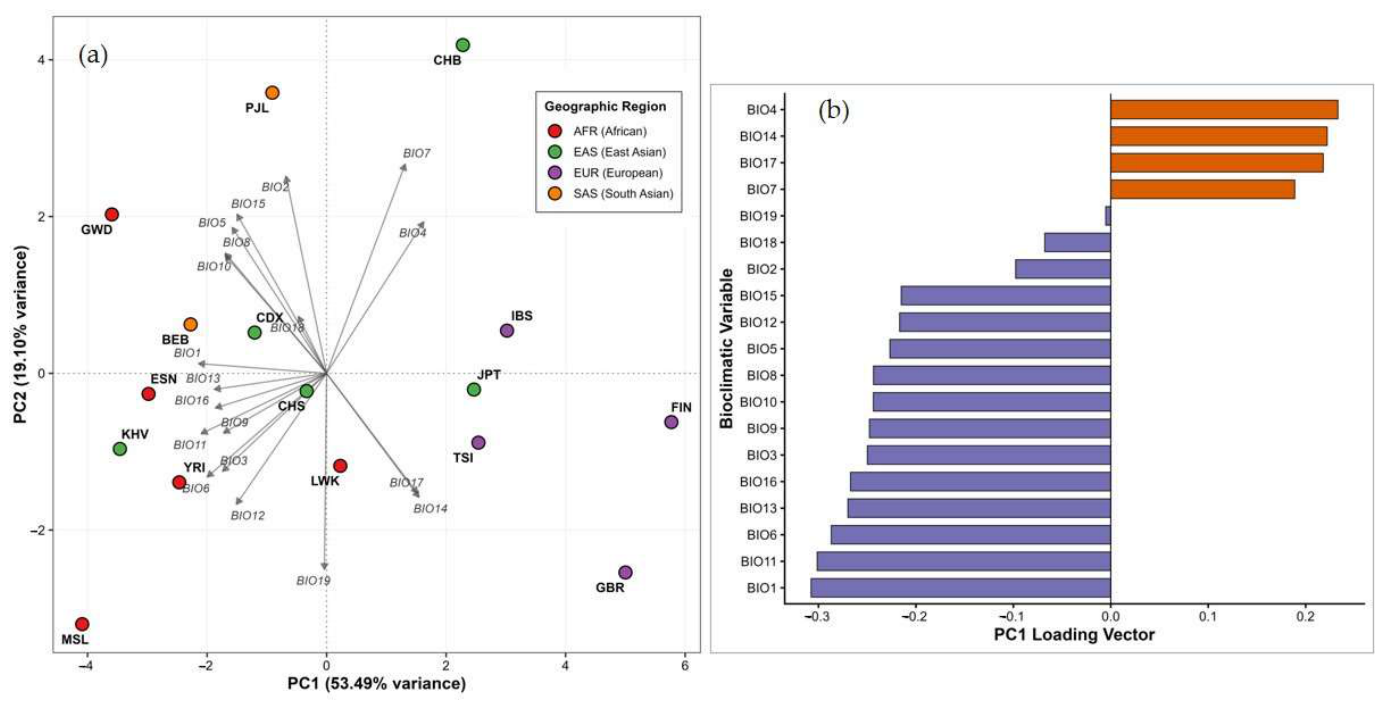
The PCA of the 19 WorldClim bioclimatic variables showed that the first four components explained 91.54% of the total climatic variation. PC1 explained 53.49% of the variance and mainly represented a broad composite climatic gradient involving temperature conditions and seasonal precipitation (Figure 2, Supplementary Table S8). PC2 accounted for 19.10% and was primarily associated with temperature variability and seasonality, with an additional contribution from cold-season precipitation. PC3 explained 11.92% and mainly reflected precipitation availability, particularly during the warmest and driest periods. PC4 accounted for 7.02% and represented a weaker gradient involving temperature extremes and seasonal precipitation patterns. The loadings of all bioclimatic variables on the four PCs are provided in Supplementary Table S8.
Association analyses between amino acid variants and climatic principal components identified four significant positions after FDR correction for the non-nested model. All four associations involved PC1, which represented a broad climatic gradient involving temperature conditions and seasonal precipitation. The significant associations were restricted to mitochondrial Complex I genes (MT-ND1, MT-ND3, and MT-ND5). No significant associations were detected for PC2–PC4. The strongest signal is observed for MT-ND1_304 (β = 0.316, SE = 0.061, FDR = 1.436 × 10⁻⁶), followed by MT-ND3_114 (β = 0.49, SE = 0.115, FDR = 5.128 × 10⁻⁵), MT-ND5_257 (β = −0.39, SE = 0.147, FDR = 0.009) and MT-ND5_458 (β = 0.15, SE = 0.042, FDR = 5.963 × 10⁻⁴). However, the nested model identified only two positions (MT-ND3_114: β = 0.211, SE = 0.082, FDR = 0.017; MT-ND1_304: β = 0.134, SE = 0.061, FDR = 0.045) significantly associated with PC1.
Similarly, association analyses revealed significant association between nuclear SNPs and climate principal components. For the non-nested model, 83 SNPs were significantly associated with PC1, whereas 19 SNPs were associated with PC2 27 with PC3 and six with PC4 (Supplementary Table S9). Under the nested model, 21 were significantly associated with PC1, five with PC2 and four with PC3. The associated SNPs identified under the nested model were located in seven genes involved in mitochondrial function: ATP5MF, COX5A, NDUFS4, NDUFS6, SDHA, SDHD, and UQCRC2 (Supplementary Table S10).

4. Discussion

To our knowledge, this is the first study to comprehensively investigate signatures of natural selection across the complete set of mitochondrial- and nuclear-encoded oxidative phosphorylation (OXPHOS) genes in globally distributed human populations while integrating climate association and mito-nuclear interaction analyses. We identified candidate variants showing signatures of positive selection in both genomes and detected significant associations between several of these variants and climatic variables. Together, these findings suggest that environmental pressures, particularly temperature and precipitation, have contributed to shaping variation in OXPHOS genes.

4.1. Positive Selection and Climate Adaptation in mtDNA

Our codon-based analyses identified 19 amino acid positions across seven mtDNA genes (MT-ND1MT-ND5, MT-ATP6, and MT-CYB) showing signatures of positive selection, with most sites located in Complex I and MT-ATP6. Four positively selected amino acid positions, MT-ND3_114, MT-ND1_304, MT-ND5_458, and MT-ND5_257, were also significantly associated with climatic PC1. Because PC1 captured a broad climatic gradient with contributions from both temperature- and precipitation-related variables, these associations are consistent with mitochondrial variation tracking a composite climatic environment rather than temperature alone. This finding accords with previous evidence that climatic variation has contributed to the geographic distribution and evolution of human mitochondrial diversity [7,10,12,15]. The contribution of precipitation to PC1 is also relevant in the context of human population history, as temperature- and precipitation-related variables have been associated with ancient human migration routes and used as proxies for freshwater availability and diet [7,9].
The concentration of climate-associated variants in MT-ND1, MT-ND3 and MT-ND5 is consistent with a potential role of climatic variation in shaping mitochondrial respiratory function. The mitochondrially encoded ND proteins form core components of the membrane arm of respiratory Complex I, which couples electron transfer to proton translocation across the inner mitochondrial membrane. Variation affecting these proteins could therefore potentially influence mitochondrial bioenergetic properties, although the functional consequences of the variants identified here remain to be established. Previous studies have proposed that variation in mitochondrial OXPHOS genes may contribute to environmental adaptation through effects on bioenergetic efficiency and thermogenesis [10,12,14]. Notably, MT-ND3_114 corresponded to the 10398G/A polymorphism previously associated with minimum temperature [15] and was among the strongest climate-associated variants. This variant has also been linked to mitochondrial physiological traits, including mitochondrial matrix pH and calcium homeostasis [46]. Although these associations do not establish a direct causal effect of climate on these variants, their recurrence in studies of climatic variation supports their potential relevance to environmental adaptation in humans.
Climate association analyses showed a strong dependence on how population structure was modeled. In the non-nested models, 83 of 103 positively selected nuclear SNPs and 4 amino-acid positions were significantly associated with PC1, whereas only 21 SNPs and 2 amino-acid positions remained significant when population was modeled as nested within superpopulations. The concentration of associations on PC1 may partly reflect its high explanatory power (53.49% of climatic variance) but also suggests that its temperature and seasonal precipitation gradients are particularly relevant to OXPHOS variation. However, PC1 also strongly differentiated populations by latitude and ancestry (Figure 2), indicating that climatic and demographic gradients are closely coupled. This marked reduction indicates that many of the associations detected without hierarchical population structure may reflect population differentiation and shared demographic history, which can covary with geographically structured climatic gradients. The remaining associations are therefore more conservative candidates for climate-related variation, although they should still be interpreted as statistical associations rather than direct evidence of climate-driven selection. Overall, the strong sensitivity of the results to population-structure specification highlights the importance of accounting for demographic and geographic history when assessing climate–genetic associations.

4.2. Positive Selection in Nuclear OXPHOS Genes

The nuclear genome-wide selection scans (iHS, XP-EHH, and PBE) identified 103 candidate SNPs across 20 OXPHOS genes and 10 populations, with most candidate SNPs detected in GBR population (49 of 103). Although some signals were shared among populations, the limited overlap between populations of different ancestries, with only four SNPs shared between European and African populations, suggests a strong population-specific component to the nuclear OXPHOS selection signals. Our pairwise linkage disequilibrium (LD) analyses provide crucial context for these findings. We showed that candidate variants often form tightly linked clusters (r2 > 0.8), composed of 3 to 5 SNPs, as seen across COX4I1 (FIN), NDUFA10 (ESN), UQCRC2 (GBR), and NDUFV2 (LWK), as well as major sub-clusters in COX5A (GBR; 12/18) and NDUFS6 (FIN; 15/20). This indicates that the elevated total SNP count is partially inflated by localized LD-tagging of single beneficial haplotypes rather than several independent functional mutations. Furthermore, these findings align with the known sensitivity of haplotype-based statistics (iHS and xp-EHH) and differentiation metrics (PBE) to population-specific haplotype structures and demographic histories [28,29,30]. For example, the large number of GBR-specific candidates appears to reflect both extensive regional LD tagging and this population’s specific demographic history, complicating the distinction between true selection and neutral demographic processes. Nonetheless, given the role of mitochondrial oxidative phosphorylation in bioenergetics and thermogenesis, such population-specific selection may be compatible with adaptation to geographically varying energetic and environmental demands. Notably, while Mishmar et al. [17] identified NDUFA4 as a target of positive selection, we detected selection across multiple complex I subunits, suggesting that different Complex I components have been favored over distinct evolutionary timescales.
Among the selected genes, COX4I1 showed three candidate SNPs under positive selection detected in both African (LWK, MSL) and European (FIN, GBR) populations, indicating that selection on this gene is not restricted to a single climatic context. COX4I1 encodes a regulatory subunit of cytochrome c oxidase that modulates oxygen utilization, ATP-dependent regulation of Complex IV activity, and the hypoxia response via an isoform switch with COX4I2 [47,48,49]. The occurrence of selection signals across geographically and climatically diverse populations may reflect the importance of Complex IV function under different metabolic or environmental conditions, although the specific selective pressures cannot be determined from these data alone. Alternatively, the shared signals may reflect recurrent selection on similar functional variation or the retention of ancestral standing variation that has been favored under different local conditions. The enrichment of selection signals in Complex IV is also consistent with the comparative analysis of Weaver et al. [50], who found strong evolutionary rate correlations between mitochondrial- and nuclear-encoded Complex IV genes across mammals.

4.3. Mitonuclear Co-Evolution

Our analyses did not identify significant mitonuclear associations after controlling for the false discovery rate. The lack of FDR-significant associations despite strong nominal signals may partly reflect linkage disequilibrium among candidate SNPs, which reduces the independence of tests and increases the multiple-testing burden. Indeed, Nuclear genes enriched for candidate SNPs, such as COX5A, NDUFS6, and NDUFA8, showed strong pairwise LD among candidate SNPs (Supplementary Table S6). Notably, almost all candidate positively selected SNPs are located in non-coding regions rather than protein-coding exons. Functional annotation using GTEx revealed that 96 of these 103 SNPs function as cis-eQTLs. Although these results provide limited statistical evidence for mitonuclear associations, the enrichment of regulatory variants among the nuclear candidates may be relevant to the broader hypothesis of mitonuclear coevolution [18,51]. The predominance of regulatory variants among the nuclear candidates raises the possibility that regulatory changes may contribute to maintaining mitonuclear compatibility in the presence of mitochondrial protein-coding variation. This could complement the compensatory coevolution hypothesis, which emphasizes coordinated amino acid substitutions between interacting mitochondrial- and nuclear-encoded OXPHOS subunits (e.g., [17]). Such regulatory mechanisms could provide a flexible means of modulating OXPHOS function without requiring compensatory changes in protein sequence.

4.4. Functional Implications of Identified Variants

Although several mitochondrial and nuclear variants identified as candidates for positive selection have previously been associated with metabolic, neurological, and cardiovascular disorders, these associations may provide insight into the potential contemporary consequences of variants shaped by past selection. Variants favored under historical selective pressures, such as those imposed by colder climates or changing energetic demands during human dispersal, may have different phenotypic consequences in contemporary populations living in climate-controlled environments with abundant food availability and reduced energetic demands. In such situation, alleles that were once advantageous may contribute to present-day disease susceptibility [2,7,10]. While this hypothesis is plausible based on our findings, functional studies will be required to establish the physiological effects of the candidate variants identified in our positive-selection analyses.
As with any population-genetic study, these findings should be interpreted in light of several considerations. The climatic variables used in this study represent present-day environmental conditions and therefore provide proxies for the selective environments experienced during recent human evolution. In addition, demographic history and population structure may contribute to geographic patterns in both signatures of positive selection and genotype–environment associations. Although we accounted for population structure in our statistical analyses, these factors cannot be fully disentangled from local adaptation, and further analyses explicitly incorporating demographic history will help clarify their relative contributions. Finally, our analyses focused on common genetic variants and relied on statistical inference rather than experimental validation. Functional studies will therefore be important to determine the biological significance of these candidate adaptive variants and to further evaluate their contribution to human physiological diversity and adaptation.

5. Conclusions

Our findings identify candidate signals of positive selection and climate-associated variation in OXPHOS genes across the mitochondrial and nuclear genomes. Selection signals were detected across multiple OXPHOS complexes, and several candidate variants showed associations with climatic variables, suggesting that environmental differences may have contributed to the observed patterns of genetic differentiation. The observed patterns may reflect both environmental and population–history effects, highlighting the importance of considering demographic history and population structure in their interpretation. We also identified limited evidence of mitonuclear associations, involving nuclear variants with cis-eQTL effects, providing functional context for a possible role of regulatory variation in mitonuclear coadaptation. These findings provide a basis for further investigation of the genetic and regulatory mechanisms underlying OXPHOS variation, while additional demographic, population-genetic, and functional studies will be needed to clarify the evolutionary and physiological significance of the candidate signals identified in the current study.

Supplementary Materials

The following supporting information can be downloaded at: https://www.mdpi.com/article/10.3390/sci8090252/s1, Table S1: Summary of variant filtering and sequencing data quality control across chromosomes. Table S2: Nuclear-encoded genes investigated in this study, grouped by mitochondrial respiratory complex. Table S3: Results of PAML analysis. Table S4: Positively selected SNPs in nuclear-encoded OXPHOS genes, with genomic annotation, population distribution, and selection scores. Table S5: Identified eGene for each SNPs, p-values and tissues where these eGenes are expressed. Table S6: Pairwise linkage disequilibrium (r2) among candidate SNPs within nuclear genes enriched for positively selected variants. Table S7: Associations between mitochondrial amino-acid positions and nuclear SNPs. Table S8: Principal Component Loadings of Bioclimatic Variables. Table S9: Associations between nuclear SNPs and climate principal components under the non-nested model. Table S10: Associations between nuclear SNPs and climate principal components under the nested model.

Author Contributions

A.A., H.S. and H.B.S. conceived the experiments; A.A., F.S. and H.B.S. analyzed the data; H.B.S. and A.A. wrote the paper; H.S. and F.S. revised the final version. All authors have read and agreed to the published version of the manuscript.

Funding

No funding was received for this study.

Institutional Review Board Statement

Not applicable.

Informed Consent Statement

Not applicable.

Data Availability Statement

The data that supports the findings of this study are available in the Supplementary Materials of this article. All custom scripts used for PBE, the integrated selection score, climate association models, and mitonuclear association analyses are available from the corresponding author.

Conflicts of Interest

The authors declare no conflicts of interest.

References

  1. Wallace, D.C.; Lott, M.T.; Procaccio, V. Mitochondrial Genes in Degenerative Diseases, Cancer and Aging. In Emery and Rimoin's Principles and Practice of Medical Genetics; Rimoin, D.L., Connor, J.M., Pyeritz, R.E., Korf, B.R., Eds.; Churchill Livingstone: London, UK, 2006. [Google Scholar]
  2. Wallace, D.C. Why do we still have a maternally inherited mitochondrial DNA? Insights from evolutionary medicine. Annu. Rev. Biochem. 2007, 76, 781–821. [Google Scholar] [CrossRef] [Scilit]
  3. Lane, N.; Martin, W. The energetics of genome complexity. Nature 2010, 467, 929–934. [Google Scholar] [CrossRef] [Scilit]
  4. Gray, M.W. Mitochondrial evolution. Cold Spring Harb. Perspect. Biol. 2012, 4, a011403. [Google Scholar] [CrossRef] [Scilit]
  5. Calvo, S.E.; Mootha, V.K. The mitochondrial proteome and human disease. Annu. Rev. Genom. Hum. Genet. 2010, 11, 25–44. [Google Scholar] [CrossRef] [Scilit]
  6. Liu, Y.J.; Sulc, J.; Auwerx, J. Mitochondrial genetics, signalling and stress responses. Nat. Cell Biol. 2025, 27, 393–407. [Google Scholar] [CrossRef] [Scilit]
  7. Grover-Thomas, F.; van Dorp, L.; Balloux, F.; Andrés, A.M.; Camus, M.F. Climate-associated natural selection in the human mitochondrial genome. Mol. Biol. Evol. 2026, 43, msag044. [Google Scholar] [CrossRef] [Scilit]
  8. Prugnolle, F.; Manica, A.; Balloux, F. Geography predicts neutral genetic diversity of human populations. Curr. Biol. 2005, 15, R159–R160. [Google Scholar] [CrossRef] [Scilit]
  9. Beyer, R.M.; Krapp, M.; Eriksson, A.; Manica, A. Climatic windows for human migration out of Africa in the past 300,000 years. Nat. Commun. 2021, 12, 4889. [Google Scholar] [CrossRef] [Scilit]
  10. Ruiz-Pesini, E.; Mishmar, D.; Brandon, M.; Procaccio, V.; Wallace, D.C. Effects of purifying and adaptive selection on regional variation in human mtDNA. Science 2004, 303, 223–226. [Google Scholar] [CrossRef] [Scilit]
  11. Balloux, F. The worm in the fruit of the mitochondrial DNA tree. Heredity 2010, 104, 419–420. [Google Scholar] [CrossRef] [Scilit]
  12. Mishmar, D.; Ruiz-Pesini, E.; Golik, P.; Macaulay, V.; Clark, A.G.; Hosseini, S.; Brandon, M.; Easley, K.; Chen, E.; Brown, M.D.; et al. Natural selection shaped regional mtDNA variation in humans. Proc. Natl. Acad. Sci. USA 2003, 100, 171–176. [Google Scholar] [CrossRef] [Scilit]
  13. Garvin, M.R.; Bielawski, J.P.; Sazanov, L.A.; Gharrett, A.J. Review and meta-analysis of natural selection in mitochondrial complex I in metazoans. J. Zool. Syst. Evol. Res. 2015, 53, 1–17. [Google Scholar] [CrossRef] [Scilit]
  14. Awadi, A.; Ben Slimen, H.; Schaschl, H.; Knauer, F.; Suchentrunk, F. Positive selection on two mitochondrial coding genes and adaptation signals in hares (genus Lepus) from China. BMC Ecol. Evol. 2021, 21, 100. [Google Scholar] [CrossRef] [Scilit]
  15. Balloux, F.; Handley, L.J.L.; Jombart, T.; Liu, H.; Manica, A. Climate shaped the worldwide distribution of human mitochondrial DNA sequence variation. Proc. R. Soc. B 2009, 276, 3447–3455. [Google Scholar] [CrossRef] [Scilit]
  16. DeGiorgio, M.; Jakobsson, M.; Rosenberg, N.A. Explaining Worldwide Patterns of Human Genetic Variation Using a Coalescent-Based Serial Founder Model of Migration Outward from Africa. Proc. Natl. Acad. Sci. USA 2009, 106, 16057–16062. [Google Scholar] [CrossRef] [Scilit]
  17. Mishmar, D.; Ruiz-Pesini, E.; Mondragon-Palomino, M.; Procaccio, V.; Gaut, B.; Wallace, D.C. Adaptive selection of mitochondrial complex I subunits during primate evolution. Gene 2006, 378, 11–18. [Google Scholar] [CrossRef] [Scilit]
  18. Hill, G.E. Mitonuclear compensatory coevolution. Trends Genet. 2020, 36, 414–424. [Google Scholar] [CrossRef] [Scilit]
  19. Byrska-Bishop, M.; Evani, U.S.; Zhao, X.; Basile, A.O.; Abel, H.J.; Regier, A.A.; Corvelo, A.; Clarke, W.E.; Musunuri, R.; Nagulapalli, K.; et al. High-coverage whole-genome sequencing of the expanded 1000 Genomes Project cohort including 602 trios. Cell 2022, 185, 3426–3440. [Google Scholar] [CrossRef] [Scilit]
  20. The 1000 Genomes Project Consortium. A global reference for human genetic variation. Nature 2015, 526, 68–74. [Google Scholar] [CrossRef] [Scilit]
  21. Hall, T.A. BioEdit: A User-Friendly Biological Sequence Alignment Editor and Analysis Program for Windows 95/98/NT. Nucleic Acids Symp. Ser. 1999, 41, 95–98. [Google Scholar]
  22. Yang, Z. PAML 4: Phylogenetic analysis by maximum likelihood. Mol. Biol. Evol. 2007, 24, 1586–1591. [Google Scholar] [CrossRef] [Scilit]
  23. Tamura, K.; Stecher, G.; Kumar, S. MEGA11: Molecular Evolutionary Genetics Analysis Version 11. Mol. Biol. Evol. 2021, 38, 3022–3027. [Google Scholar] [CrossRef] [Scilit]
  24. Yang, Z.; Nielsen, R.; Goldman, N.; Pedersen, A.M.K. Codon-substitution models for heterogeneous selection pressure at amino acid sites. Genetics 2000, 155, 431–449. [Google Scholar] [CrossRef] [Scilit]
  25. Pond, S.L.K.; Frost, S.D.W. Datamonkey: Rapid detection of selective pressure on individual sites of codon alignments. Bioinformatics 2005, 21, 2531–2533. [Google Scholar] [CrossRef] [Scilit]
  26. Murrell, B.; Moola, S.; Mabona, A.; Weighill, T.; Sheward, D.; Kosakovsky Pond, S.L.; Scheffler, K. FUBAR: A fast, unconstrained Bayesian approximation for inferring selection. Mol. Biol. Evol. 2013, 30, 1196–1205. [Google Scholar] [CrossRef] [Scilit]
  27. Murrell, B.; Wertheim, J.O.; Moola, S.; Weighill, T.; Scheffler, K.; Kosakovsky Pond, S.L. Detecting individual sites subject to episodic diversifying selection. PLoS Genet. 2012, 8, e1002764. [Google Scholar] [CrossRef] [Scilit]
  28. Voight, B.F.; Kudaravalli, S.; Wen, X.; Pritchard, J.K. A map of recent positive selection in the human genome. PLoS Biol. 2006, 4, e72. [Google Scholar] [CrossRef] [Scilit]
  29. Sabeti, P.C.; Varilly, P.; Fry, B.; Lohmueller, J.; Hostetter, E.; Cotsapas, C.; Xie, X.; Byrne, E.H.; McCarroll, S.A.; Gaudet, R.; et al. Genome-wide detection and characterization of positive selection in human populations. Nature 2007, 449, 913–918. [Google Scholar] [CrossRef] [Scilit]
  30. Yassin, A.; Debat, V.; Bastide, H.; Gidaszewski, N.; David, J.R.; Pool, J.E. Recurrent specialization on a toxic fruit in an island Drosophila population. Proc. Natl. Acad. Sci. USA 2016, 113, 4771–4776. [Google Scholar] [CrossRef] [Scilit]
  31. Herzog, T.; Larena, M.; Kutanan, W.; Lukas, H.; Fieder, M.; Schaschl, H. Natural selection and adaptive traits in the Maniq, a nomadic hunter-gatherer society from Mainland Southeast Asia. Sci. Rep. 2025, 15, 4809. [Google Scholar] [CrossRef] [Scilit]
  32. Szpiech, Z.A.; Hernandez, R.D. Selscan: An efficient multithreaded program to perform EHH-based scans for positive selection. Mol. Biol. Evol. 2014, 31, 2824–2827. [Google Scholar] [CrossRef] [Scilit]
  33. Weir, B.S.; Cockerham, C.C. Estimating F-statistics for the analysis of population structure. Evolution 1984, 38, 1358–1370. [Google Scholar] [CrossRef] [Scilit]
  34. Danecek, P.; Auton, A.; Abecasis, G.; Albers, C.A.; Banks, E.; DePristo, M.A.; Handsaker, R.E.; Lunter, G.; Marth, G.T.; Sherry, S.T.; et al. The variant call format and VCFtools. Bioinformatics 2011, 27, 2156–2158. [Google Scholar] [CrossRef] [Scilit]
  35. Yi, X.; Liang, Y.; Huerta-Sanchez, E.; Jin, X.; Cuo, Z.X.; Pool, J.E.; Xu, X.; Jiang, H.; Vinckenbosch, N.; Korneliussen, T.S.; et al. Sequencing of 50 human exomes reveals adaptation to high altitude. Science 2010, 329, 75–78. [Google Scholar] [CrossRef] [Scilit]
  36. R Core Team. R: A Language and Environment for Statistical Computing; R Foundation for Statistical Computing: Vienna, Austria, 2024; version 4.1.0; Available online: https://www.R-project.org/ (accessed on 10 October 2025).
  37. Awadi, A.; Tolesa, Z.G.; Ben Slimen, H. Positive Selection in Aggression-Linked Genes and Their Protein Interaction Networks. Life 2026, 16, 15. [Google Scholar] [CrossRef] [Scilit]
  38. Ma, X.; Xu, S. Archaic Introgression Contributed to the Pre-Agriculture Adaptation of Vitamin B1 Metabolism in East Asia. iScience 2022, 25, 105614. [Google Scholar] [CrossRef] [Scilit]
  39. Schaschl, H.; Göllner, T.; Morris, D.L. Positive Selection Acts on Regulatory Genetic Variants in Populations of European Ancestry That Affect ALDH2 Gene Expression. Sci. Rep. 2022, 12, 4563. [Google Scholar] [CrossRef] [Scilit]
  40. GTEx Consortium. Human genomics. The Genotype-Tissue Expression (GTEx) pilot analysis: Multitissue gene regulation in humans. Science 2015, 348, 648–660. [Google Scholar] [CrossRef] [Scilit]
  41. Buniello, A.; MacArthur, J.A.L.; Cerezo, M.; Harris, L.W.; Hayhurst, J.; Malangone, C.; McMahon, A.; Morales, J.; Mountjoy, E.; Sollis, E.; et al. The NHGRI-EBI GWAS Catalog of published genome-wide association studies, targeted arrays and summary statistics 2019. Nucleic Acids Res. 2019, 47, D1005–D1012. [Google Scholar] [CrossRef] [Scilit]
  42. Lott, M.T.; Leipzig, J.N.; Derbeneva, O.; Xie, H.M.; Chalkia, D.; Sarmady, M.; Procaccio, V.; Wallace, D.C. mtDNA variation and analysis using Mitomap and Mitomaster. Curr. Protoc. Bioinform. 2013, 44, 1.23.1–1.23.26. [Google Scholar] [CrossRef] [Scilit]
  43. Machiela, M.J.; Chanock, S.J. LDlink: A Web-Based Application for Exploring Population-Specific Haplotype Structure and Linking Correlated Alleles of Possible Functional Variants. Bioinformatics 2015, 31, 3555–3557. [Google Scholar] [CrossRef] [Scilit]
  44. Carlson, C.S.; Eberle, M.A.; Rieder, M.J.; Yi, Q.; Kruglyak, L.; Nickerson, D.A. Selecting a Maximally Informative Set of Single-Nucleotide Polymorphisms for Association Analyses Using Linkage Disequilibrium. Am. J. Hum. Genet. 2004, 74, 106–120. [Google Scholar] [CrossRef] [Scilit]
  45. Turner, S.D. kgp: An R Package with Metadata from the 1000 Genomes Project. arXiv 2022, arXiv:2210.00539. [Google Scholar]
  46. Kazuno, A.A.; Munakata, K.; Nagai, T.; Shimozono, S.; Tanaka, M.; Yoneda, M.; Kato, N.; Miyawaki, A.; Kato, T. Identification of mitochondrial DNA polymorphisms that alter mitochondrial matrix pH and intracellular calcium dynamics. PLoS Genet. 2006, 2, e128. [Google Scholar] [CrossRef] [Scilit]
  47. Arnold, S. The power of life—Cytochrome c oxidase takes center stage in metabolic control, cell signalling and survival. Mitochondrion 2012, 12, 46–56. [Google Scholar] [CrossRef] [Scilit]
  48. Čunátová, K.; Reguera, D.P.; Houštěk, J.; Mráček, T.; Pecina, P. Role of Cytochrome c Oxidase Nuclear-Encoded Subunits in Health and Disease. Physiol. Res. 2020, 69, 947–965. [Google Scholar] [CrossRef] [Scilit]
  49. Fukuda, R.; Zhang, H.; Kim, J.W.; Shimoda, L.; Dang, C.V.; Semenza, G.L. HIF-1 Regulates Cytochrome Oxidase Subunits to Optimize Efficiency of Respiration in Hypoxic Cells. Cell 2007, 129, 111–122. [Google Scholar] [CrossRef] [Scilit]
  50. Weaver, R.J.; Rabinowitz, S.; Thueson, K.; Havird, J.C. Genomic signatures of mitonuclear coevolution in mammals. Mol. Biol. Evol. 2022, 39, msac233. [Google Scholar] [CrossRef] [Scilit]
  51. Bar-Yaacov, D.; Blumberg, A.; Mishmar, D. Mitochondrial-nuclear co-evolution and its effects on OXPHOS activity and regulation. Biochim. Biophys. Acta 2012, 1819, 1107–1111. [Google Scholar] [CrossRef] [Scilit]
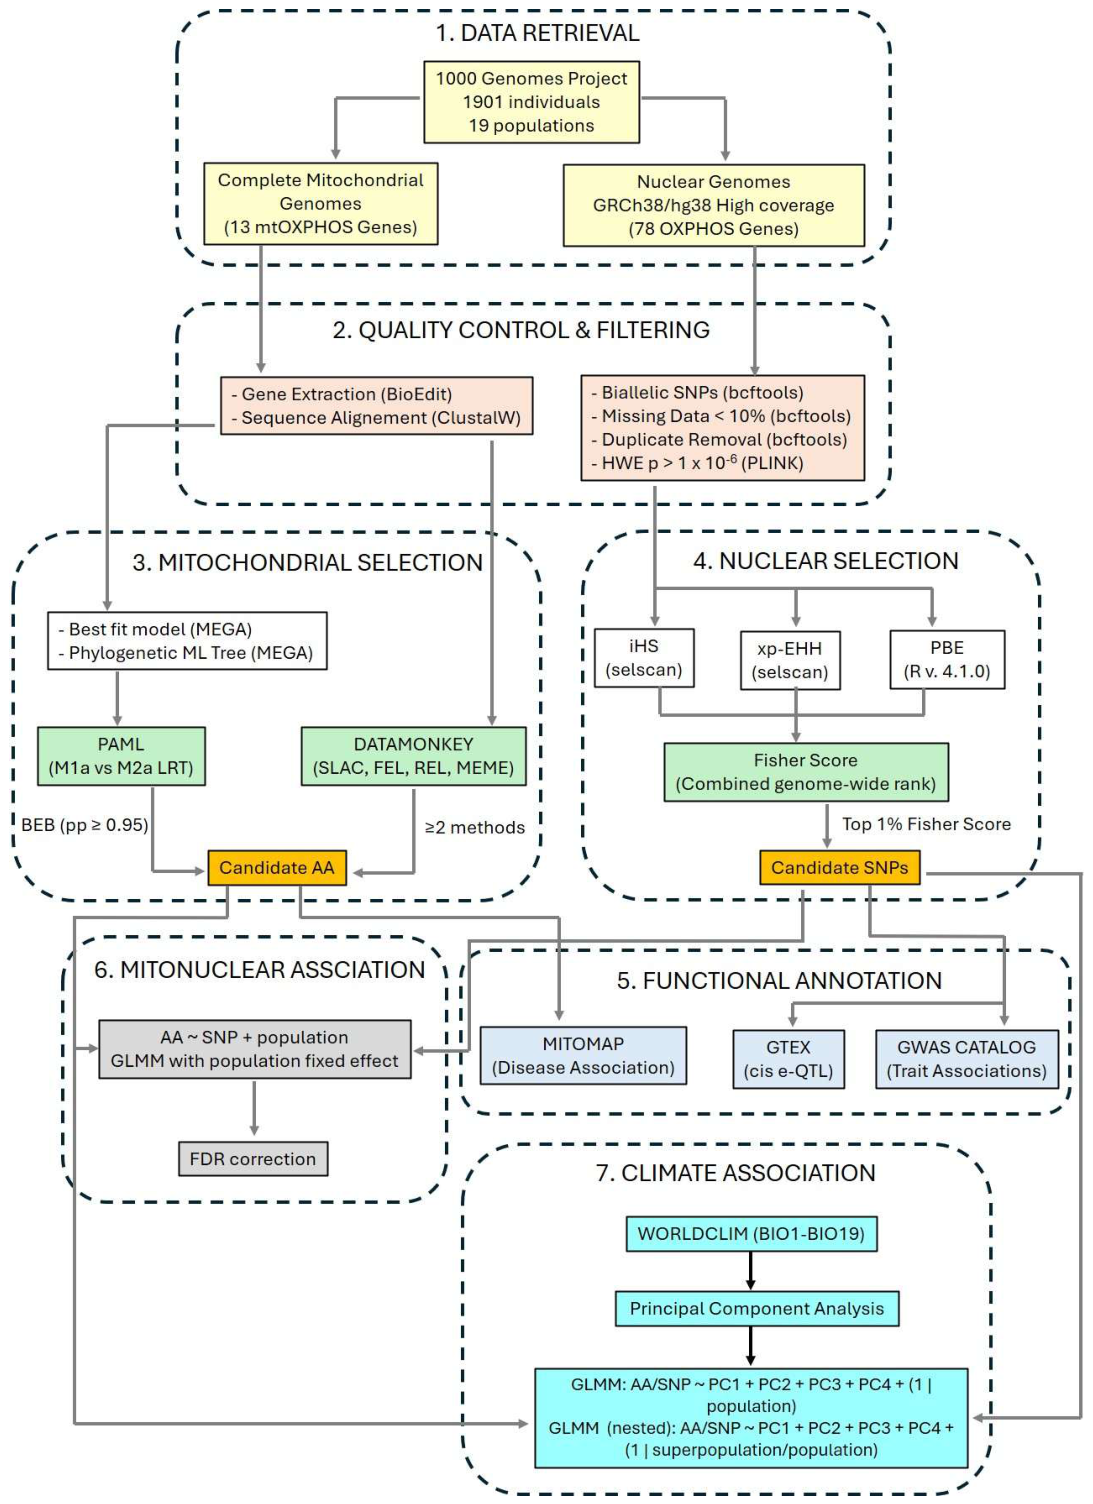
Figure 1. Overview of the analytical pipeline for detecting positive selection, climate associations, and mitonuclear associations in human OXPHOS genes.
Sci 08 00252 g001
Figure 2. Major axes of bioclimatic variation across global human populations. (a) PCA biplot based on BIO1–BIO19, with PC1 and PC2 explaining 53.49% and 19.10% of the total variance, respectively. (b) Loadings of the 19 bioclimatic variables on PC1.
Sci 08 00252 g002
Table 1. 1000 Genomes populations included in this study and their genetic ancestries.
Population (Code)Regional Population Description (Code)LatitudeLongitudeNumber of Individuals
Africa (AFR)Esan in Nigeria (ESN)9.066667.48333399
Gambians from The Gambia (GWD)13.45488−16.579032113
Mende Sierra Leone (MSL)8.48−13.2385
Yoruba in Ibadan, Nigeria (YRI)7.43.92108
Luhya in Webuye, Kenya (LWK)−1.2736.6199
Europe (EUR)British in England and Scotland (GBR)52.48624−1.89040191
Finnish in Finland (FIN)60.1724.9399
Iberian Populations in Spain (IBS)40.38−3.72107
Toscani in Italia (TSI)42.112107
South Asian (SAS)Bengali from Bangladesh (BEB)23.790.3586
Indian Telugu from the UK (ITU)52.48624−1.890401102
Gujarati Indians in Houston, USA (GIH)29.7589−95.3677103
Sri Lankan Tamil in the UK (STU)52.48624−1.890401102
Punjabi from Lahore, Pakistan (PJL)31.5546174.35715896
East Asian (EAS)Han Chinese in Beijing, China (CHB)39.91667116.383333103
Japanese in Tokyo, Japan (JPT)35.68139.68104
Kinh in Ho Chi Minh City, Vietnam (KHV)10.78106.6899
Southern Han Chinese (CHS)23.13333113.266667105
Chinese Dai in Xishuangbanna, China (CDX)22100.7893
Table 2. Positively selected amino acid sites in mitochondrial OXPHOS genes.
FELSLACFUBARMEMECodeml (M2a)
MT-ND1309 *4 *309 †, 4 †-30 †, 304 ††
MT-ND2-331 **331 †, 325 †-331 ††
MT-ND3--9 †-29 †, 114 ††
MT-ND450*-50 †-86 ††, 131 ††
MT-ND513 **, 517 *, 544 *, 555 *257 *, 458 **, 531 **, 555 *13 †, 21 †, 257 †, 267 †, 515 †, 531 †, 544 †, 555 †, 592 †13 *, 544 **, 555 **13 ††, 257 ††, 555 ††
MT-ATP6-59 ***, 176 *176 †-59 ††, 176 ††
MT-CYB-7 **, 338 *, 380 *7 ††, 338 †7 **, 82 *7 ††
Significance: * p < 0.05; ** p < 0.01; *** p < 0.001; † pp ≥ 0.95; †† pp ≥ 0.99.
Table 3. Population-specific candidate genes under positive selection across OXPHOS complexes I–V. Numbers in parentheses indicate the number of SNPs detected in each gene.
AncestryPopulationCICIICIIICIVCV
AFRESNNDUFA10 (3)SDHA (1)--ATP5MF (1)
GWDNDUFA6 (1)SDHD (1)---
LWKNDUFS5 (1), NDUFB1 (1), NDUFV2 (5), NDUFS4 (9)--COX4I1 (3)ATP5F1A (2)
MSL---COX4I1 (1)-
YRINDUFA10 (1), NDUFA6 (1),SDHA (1)--ATP5MF (1)
EURFINNDUFS6 (20)-UQCRC2 (1),COX4I1 (4)-
GBRNDUFA8 (10)SDHA (6)UQCRC2 (5)COX5A (18), COX4I1 (4), COX6B1 (1)ATP5MC2 (1), ATP5PD (2), ATP5MF (2),
TSINDUFS6 (12), NDUFA8 (1)SDHA (5)UQCRC2 (1)-ATP5PD (3), ATP5MF (2),
SASBEBNDUFV1 (1)----
ITU----ATP5MK (1)
Table 4. Positively selected nuclear OXPHOS SNPs associated with GWAS traits.
GeneChr:PositionSNPGWAS Reported Traits
COX5Achr15:74920016rs1133322Systolic blood pressure × alcohol consumption
chr15:74928627rs11072513Alzheimer’s disease polygenic risk score
chr15:74929884rs121485137-methylxanthine levels, Calcium levels, Body mass index
chr15:74932469rs11072516Neutrophil percentage of white cells, Neutrophil count, Neutrophil-to-lymphocyte ratio
chr15:74933467rs2044157Hematological traits
chr15:74935628rs4886640Systolic blood pressure × alcohol consumption interaction
chr15:74936759rs12899430Systolic blood pressure × alcohol consumption
COX6B1chr19:35653090rs6510503IGF 1 measurement, frailty measurement
Table 5. MITOMAP disease associations for positively selected mitochondrial variants.
GenePositionAA ChangeReported Disease
MT-ND14A4TDiabetes/LHON/PEO/vascular dementia
30Y30HLHON/Diabetes/CPTdeficiency/high altitude adaptation
Y30CLHON/HCM with hearing loss
Y30YNSHL/MIDD
304Y304HLHON/Insulin Resistance /possible adaptive high altitude variant/miscarriage
MT-ND2331A331SAD
A331TAD/PD/LHON/PCOS patients
MT-ND3114T114APD protective factor/longevity/altered cell pH/metabolic syndrome/breast cancer risk/Leigh Syndrome risk/ADHD/cognitive decline/SCA2 age of onset/Fuchs endothelial corneal dystrophy
T114TInvasive Breast Cancer risk factor AD PD BD lithium response Type 2 DM
MT-ND5544T544AGreater risk with hg X of end-stage kidney disease
T544MPossible LHON factor
Disclaimer/Publisher’s Note: The statements, opinions and data contained in all publications are solely those of the individual author(s) and contributor(s) and not of MDPI and/or the editor(s). MDPI and/or the editor(s) disclaim responsibility for any injury to people or property resulting from any ideas, methods, instructions or products referred to in the content.