Article

Analysis of Marginal Expansion in Existing Pressurised Water Installations: Analytical Formulation and Practical Application

by
Alfonso Arrieta-Pastrana
1,*,
Oscar E. Coronado-Hernández
1 and
Manuel Saba
2
1
Instituto de Hidráulica y Saneamiento Ambiental, Universidad de Cartagena, Cartagena 130001, Colombia
2
Civil Engineering Program, Universidad de Cartagena, Cartagena 130001, Colombia
*
Author to whom correspondence should be addressed.
Sci 2025, 7(4), 140; https://doi.org/10.3390/sci7040140
Submission received: 4 September 2025 / Revised: 27 September 2025 / Accepted: 30 September 2025 / Published: 2 October 2025

Abstract

Water supply networks in both developed and developing major cities worldwide were constructed many years ago. Currently, these systems face numerous challenges, including population growth, climate change, emerging technologies, and the policies implemented by local governments. Such factors can impact the design life of water infrastructure, leading to service pressure deficiencies. Consequently, water infrastructure must be reinforced to ensure an adequate and reliable service. This research presents the development of an analytical formulation for hydraulic installations with a pumping station, enabling the calculation of requirements for a new parallel pipeline within an existing water system without altering the current pipe resistance class. To implement the proposed solution, it is essential to maintain the initial pump head by adjusting the impeller size. A construction cost assessment is also undertaken to identify the most cost-effective reinforcement strategy, acknowledging that pipe costs vary significantly with diameter and material, and are proportional to the square of the diameter. The proposed methodology is applied to a 30 km pipeline with a 10% increase in demand, showing that a new parallel pipe of the same diameter as the existing hydraulic installation must be installed to minimise construction costs. A multi-parametric analysis was conducted employing machine learning presets with 309 dataset points.

1. Introduction

Water demand forecasting is of vital importance for the water sector, as an adequate level of service in terms of pressure is required to ensure the proper functioning of hydraulic installations [1,2].
Water infrastructure must be developed in accordance with specific criteria, depending on whether the project concerns urban water supply or irrigation. The design life of such projects varies according to national regulations. For example, in Colombia, urban water infrastructure is typically designed for a service life of 25 years [3].
Traditionally, water demand has been estimated primarily based on population growth for urban water infrastructure. However, recent studies highlight the need to account for more complex interactions, including not only demographic trends but also the impacts of climate change, emerging technologies, and different policy frameworks in urban environments [4].
Various calibration protocols for projecting water demand have been proposed by several authors and applied in different municipalities, with particular attention to climate-related effects for urban water systems [5,6]. Some of this research has employed global climate models to project water demand [7].
Irrigation demand may vary according to rainfall events, temperature, and crop evapotranspiration [8]. In this sector, various strategies have been proposed to address the impacts of climate change [9], while other studies have analysed water security in light of future trends [10].
Recently, studies on water demand have increasingly focused on the application of artificial intelligence for forecasting purposes. In this context, Gagliardi et al. (2017) [11] employed the Patt model and an Artificial Neural Network to forecast hourly water demand in the city of Ferrara and in two municipalities within the Province of Modena (Italy). In the irrigation sector, González Perea et al. (2019) [12] applied Artificial Neural Network architectures, the Bayesian framework, and Genetic Algorithms for forecasting analysis in the Bembézar MD Irrigation District (Spain).
When a new water infrastructure project is undertaken, both economic and technical criteria must be considered for design purposes. In this sense, many authors have developed some methodologies to reduce construction costs. For instance, Wu (1975) [13] demonstrated that for minimising construction costs, a quadratic curve for the hydraulic grade line can be considered for a pipeline series. Alperovits and Shamir (1977) [14] used the linear programming gradient to find the optimal design of water distribution supply networks. Choi et al. (2019) [15] proposed a methodology of practical design based on a multi-objective optimisation framework. Ramani et al. (2023) [16] developed a methodology for optimal design in developing countries for intermittent water distribution. Parvaze et al. (2023) [17] presented the optimisation problem of water distribution networks using genetic algorithms.
One of the primary challenges facing water distribution systems is the need to strengthen infrastructure in response to growing demand for water distribution or irrigation systems. In this regard, hydraulic installations must adapt to accommodate new requirements once a project has surpassed its design life. A key difficulty lies in the fact that existing infrastructure is limited to supporting only a specific pipe resistance class. Recent research has focused on the assessment of scenarios considering future water demand using traditional software (e.g., EPANET 2.2 or WaterGEMS V8i) [18], while other studies recommend the use of artificial intelligence techniques, combined with the advancements of the Internet of Things, for water demand forecasting [19].
This study develops an analytical formulation for hydraulic installations incorporating a pumping station, where water demand has increased due to factors such as population growth or irrigation requirements. The proposed formulation allows for the determination of the need for a new parallel pipeline within an existing water system, while preserving the pipe resistance of the current installation. A construction cost assessment is conducted to determine the most cost-effective reinforcement strategy from a benefit–cost perspective. Such analysis provides practical insights for identifying technically feasible and economically viable solutions suitable for implementation [20,21,22].
The proposed solution is first applied to a single installation as a preliminary step towards more complex networks. The reference case involves a 30 km network with an initial demand of 1.158 m3/s and a projected increase of 10%. The results indicate that projecting a new parallel pipe with the same internal diameter provided the minimum installation cost. This research is structured as follows: (i) Section 2 outlines the proposed methodology, in which an analytical formula is derived to compute the characteristics of a new parallel pipe, together with an assessment of the associated construction costs; (ii) Section 3 demonstrates the application of the methodology to a case study, complemented by a sensitivity analysis and a discussion of the implications arising from the assumptions adopted in this research; and (iii) Section 4 presents the main conclusions and highlights the practical significance of the findings.

2. Proposed Methodology

It is common to have pipeline systems that pump water from the supply source to an elevated storage reservoir. Such reservoirs are typically designed for a capacity Q0, corresponding to the demand of a specific population for a specified time. Over time, however, changes in water consumption patterns may lead to increased demand for water supply or irrigation systems, which often exceed the original design capacity. This section presents the methodology employed in this study (see Figure 1), which was used to calculate the requirements of a water installation under a scenario of increased water demand.
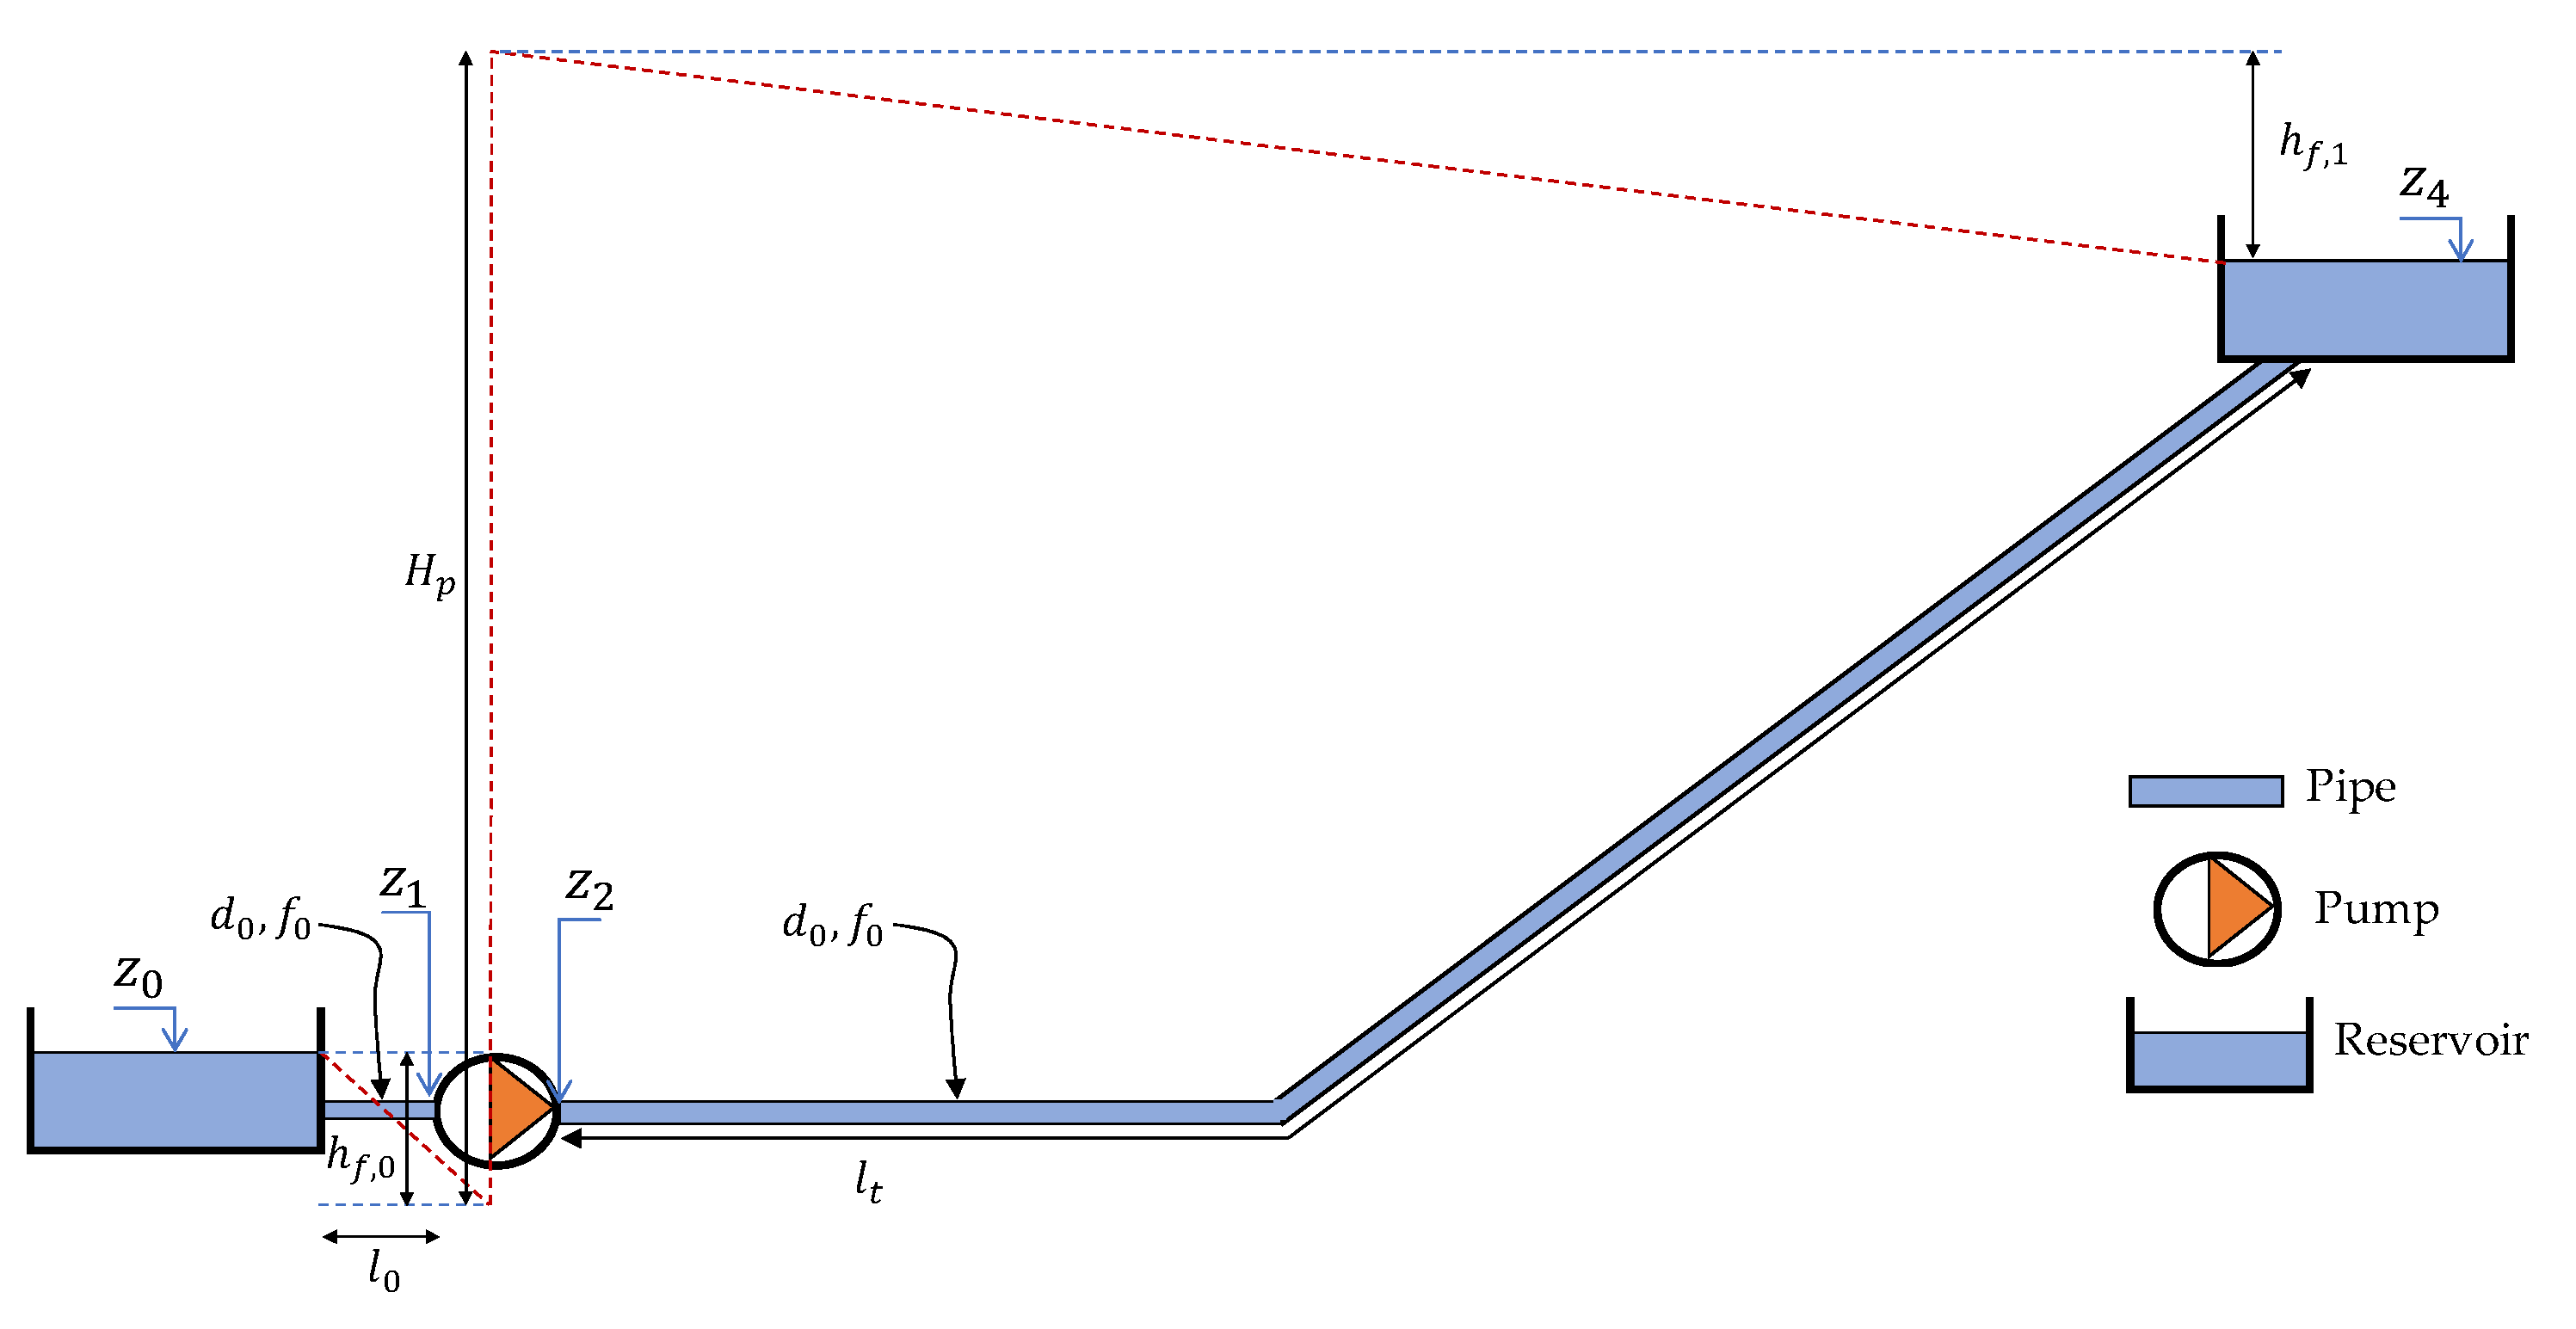
In these cases, it becomes necessary to reassess the hydraulic performance of the system and evaluate possible alternatives for upgrading its operation, as illustrated in Figure 2. Water is pumped from elevation z0 to z4. The pump is positioned between elevations z2 and z3 with a pump head Hp. The suction and discharge branches of the pipeline have lengths l0 and lt, respectively. The entire pipeline has an internal diameter d0 and is characterised by a friction factor f0.
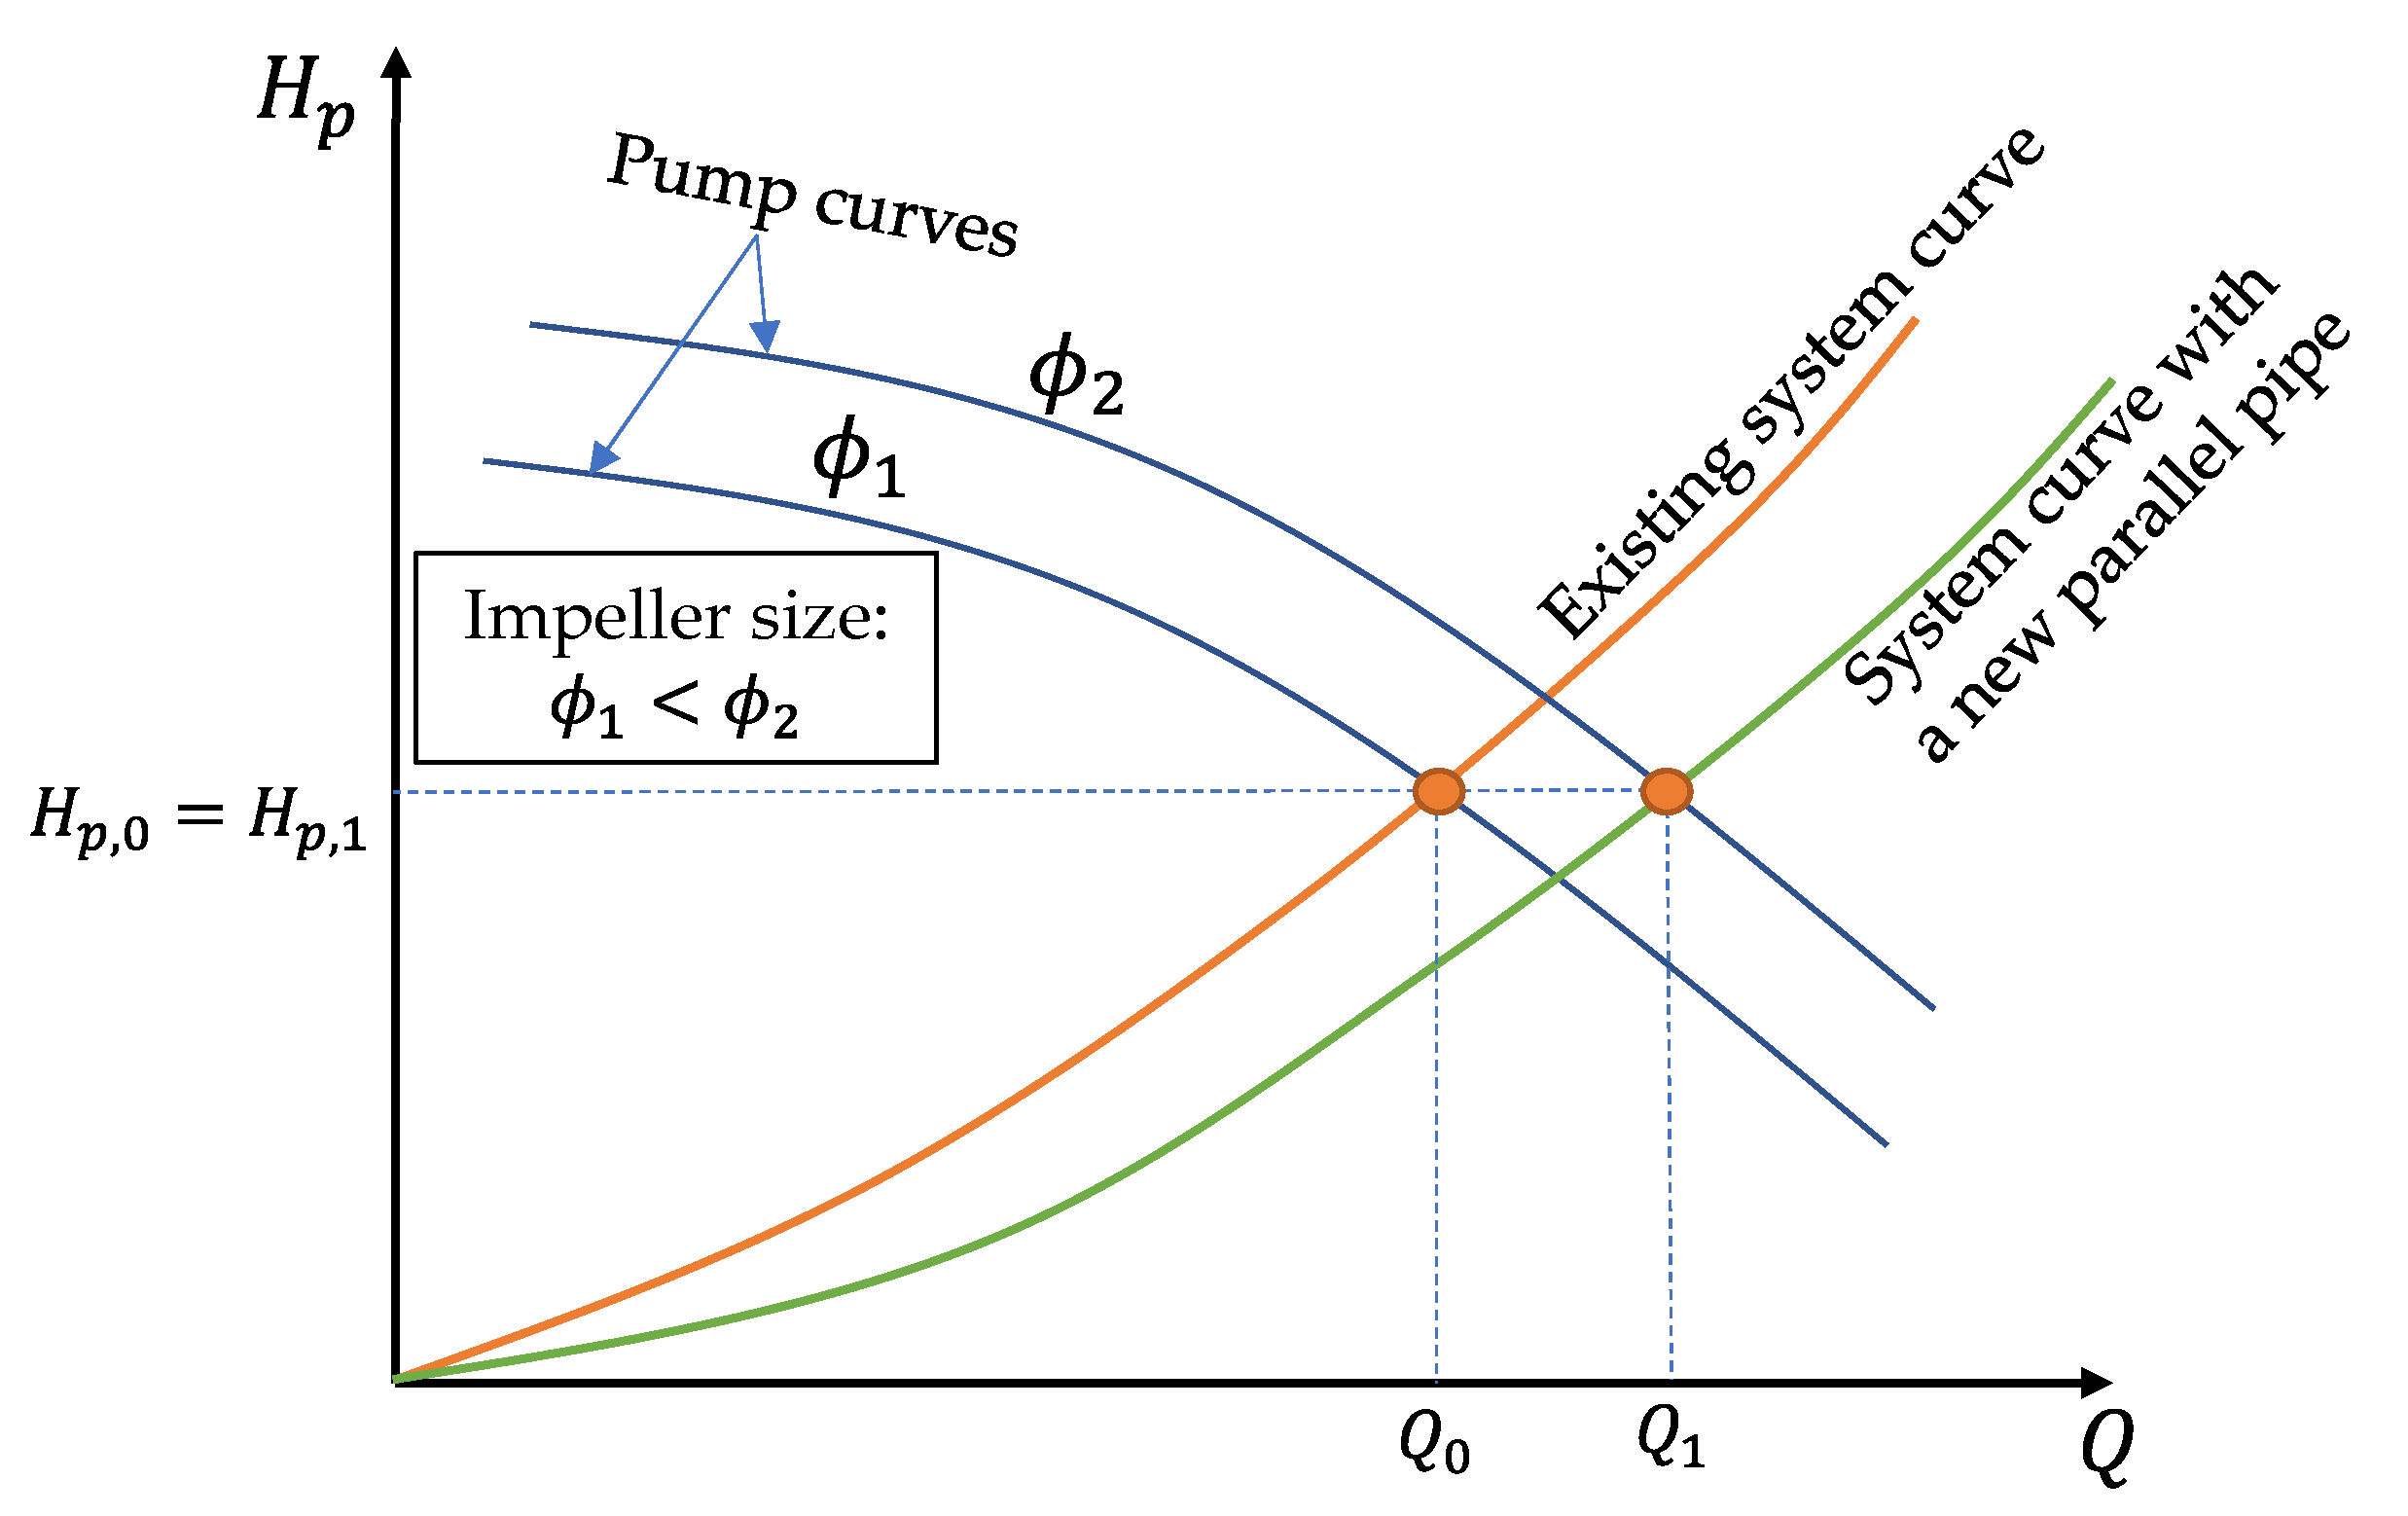
Over time, population growth in water supply networks or irrigation needs leads to an increase in water demand, rendering the originally designed flow rate Q0 insufficient. Consequently, it becomes necessary to increase the system capacity to a new flow rate value (Q1). However, it is not advisable to exceed the maximum pressure that the existing pipelines can withstand. One possible approach is to increase the dynamic head of the pumping system; however, this would expose the pipelines to higher pressures, which the existing infrastructure is unlikely to withstand. A more feasible solution is to install a parallel pipeline to increase the pumped flow, ensuring that the impeller size is adjusted accordingly, to maintain the initial pump head (Hp,0 = Hp,1). Figure 3 presents the behaviour of the existing system, which is working considering a pump curve with an impeller size ϕ1. As the water demand increases, the system curve with the parallel pipe requires that the impeller has a higher diameter (ϕ2).
The new parallel pipe has a length le and an internal pipe diameter d1, with a friction factor f1, as shown in Figure 4. The increased flow (Q1) corresponds to the sum of Q2 and Q3. To meet the additional water demand, a parallel pipe must be constructed, and the impeller size must be increased to maintain the initial pump head.

2.1. Hydraulic Modelling

2.1.1. Assumptions

For the hydraulic analysis, the following considerations are made:
  • The pump head of the pumping system is preserved considering a higher impeller size (ϕ2) [23].
  • The installed parallel pipe will have resistance characteristics similar to the existing one.
  • Friction losses in each pipeline section will be estimated using the Darcy–Weisbach equation [24].
  • Water demand has increased.

2.1.2. Governing Equations

The friction losses ( h f , i ) can be computed as:
h f , i = 8 f i l i π 2 g d i 5 Q i 2 = R i Q i 2
where the subscript i represents the characteristics of a pipe and R is the pipe resistance.
Applying the Bernoulli equation between z 0 and z 4 , then:
z 0 h f , 0 + H p h f , 1 h f , 2 = z 4
By replacing and substituting terms:
8 f 0 l e π 2 g d 0 5 ( Q 1 2 Q 2 2 ) = z 4 z 0   + R 0 Q 1 2 H p + R t Q 1 2
where R 0 = 8 f 0 l 0 π 2 g d 0 5 and R t = 8 f 0 l t π 2 g d 0 5 .
In the hydraulic system, the continuity equation is expressed as follows:
Q 1 = Q 2 + Q 3
Considering the parallel pipe located between z 3 and z 4 :
8 f 0 l e π 2 g d 0 5 Q 2 2 = 8 f 1 l e π 2 g d 1 5 Q 3 2
Equation (5) can be expressed as:
Q 3 = d 1 d 0 5 / 2 f 0 f 1 1 / 2 Q 2
Considering the water balance, thus:
Q 1 = Q 2 + d 1 d 0 5 / 2 f 0 f 1 1 / 2 Q 2
Upon simplification, it can be shown that:
Q 1 = Q 2 j
where j = 1 + d 1 d 0 5 2 f 0 f 1 1 2 .
By substituting Equation (8) into Equation (2):
8 f 0 l e π 2 g d 0 5 Q 1 2 Q 1 j 2 = z 4 z 0   + R 0 Q 1 2 H b + R t Q 1 2
Replacing the definition of j in Equation (9):
l e 8 f 0 π 2 g d 0 5 1 1 1 + d 1 d 0 5 2 f 0 f 1 1 2 2 Q 1 2 = z 4 z 0   + ( R 0 + R t ) Q 1 2 H b
Rearranging the terms, thus:
l e = π 2 g d 0 5 8 f 0 z 4 z 0   + ( R 0 + R t ) Q 1 2 H p Q 1 2 1 1 1 + d 1 d 0 5 2 f 0 f 1 1 2 2

2.2. Computation of Construction Costs

The construction costs of water supply systems can be broken down into several components, including the cost of pipes, installation expenses (such as excavation, handling, transport, and backfilling), and the cost of pumping stations.
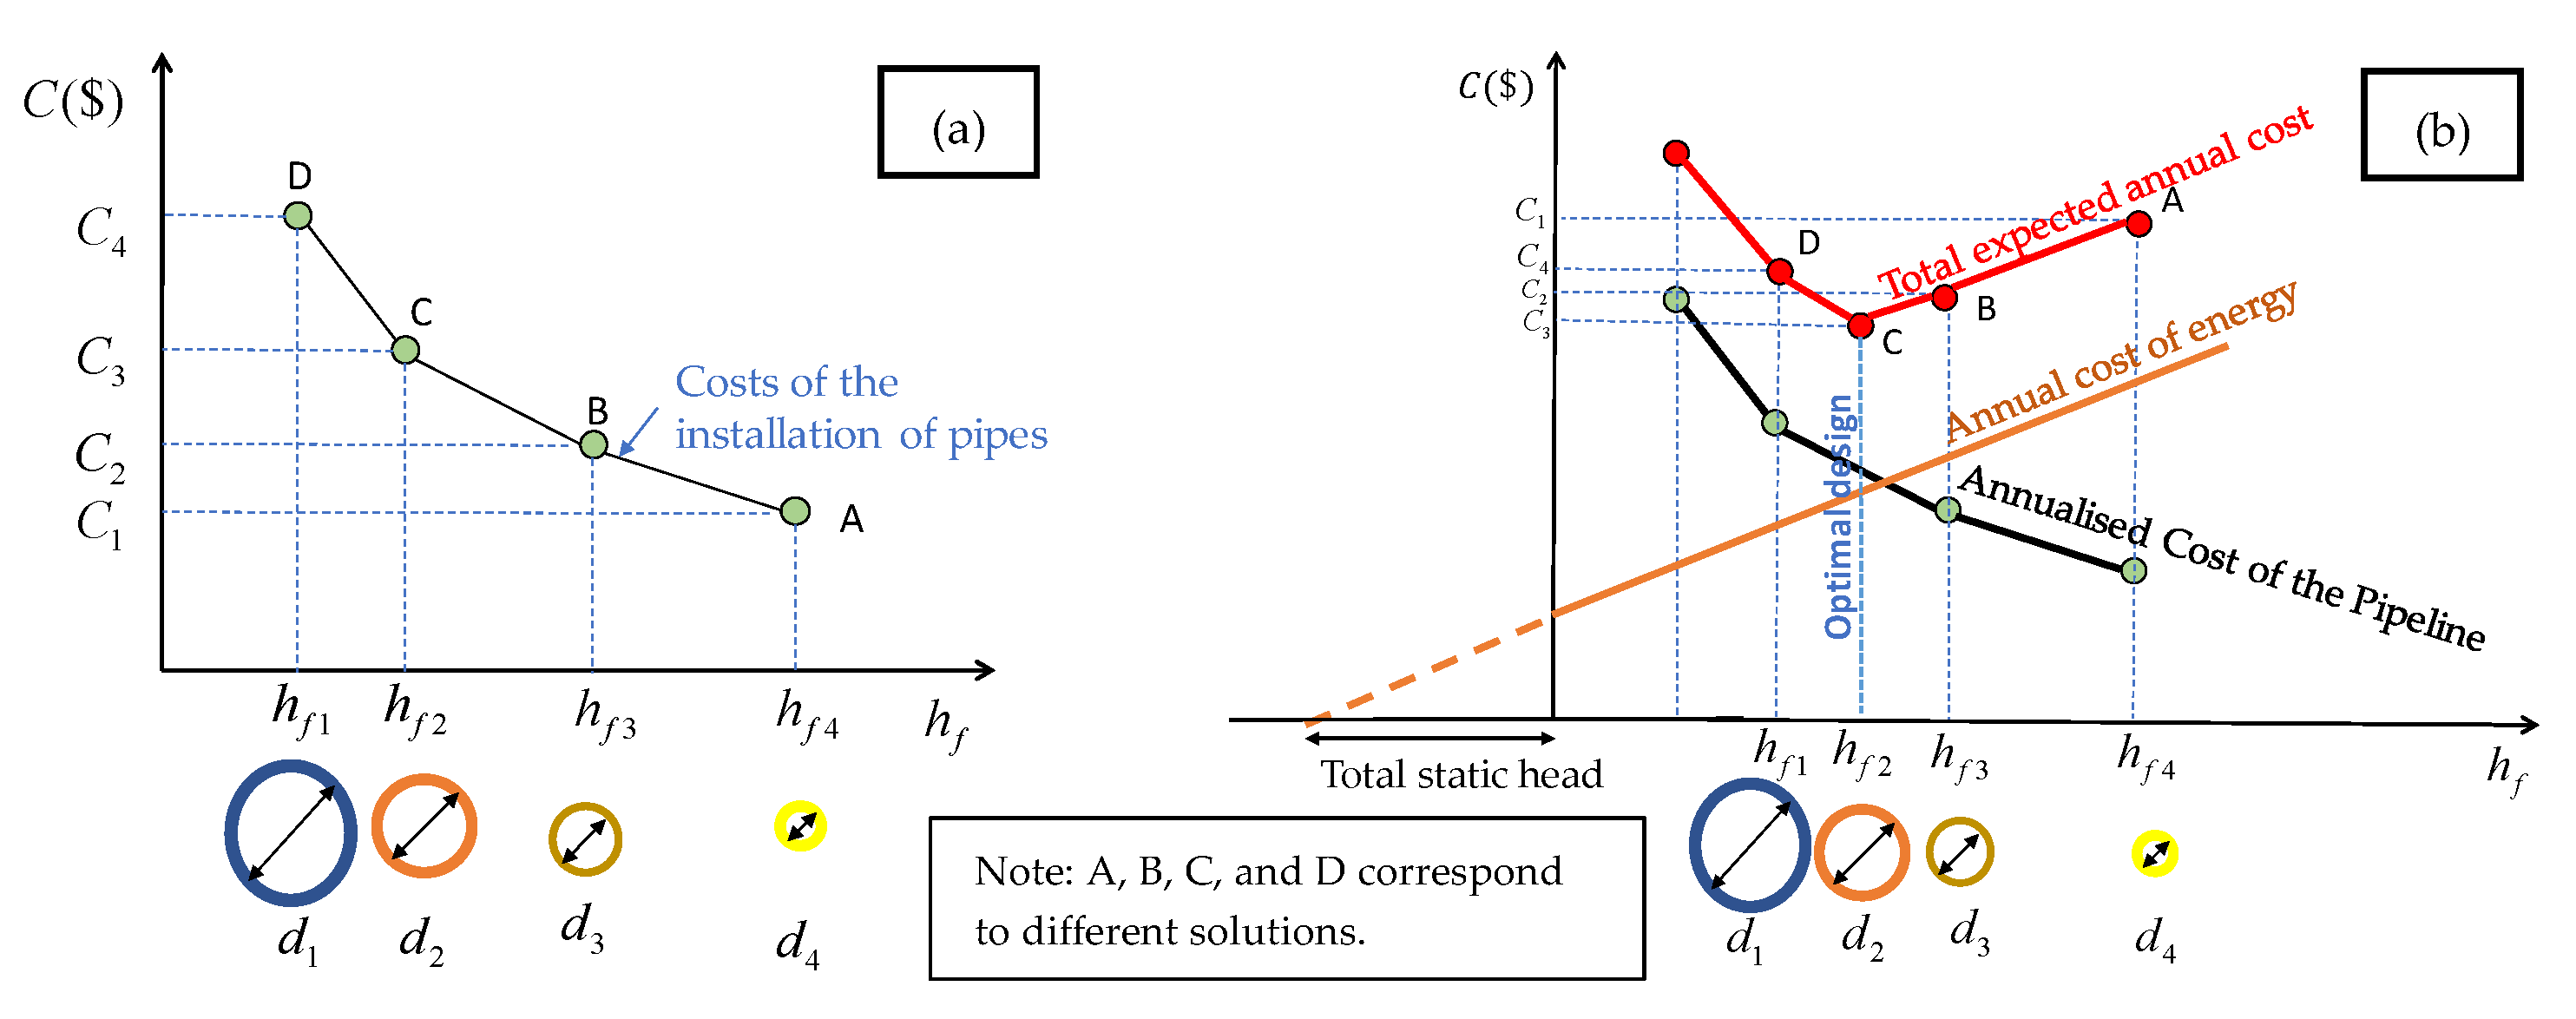
The benefit–cost analysis of water distribution systems can be performed as illustrated in Figure 5. To evaluate the expenses associated with pipe installation, it is necessary to consider both the market price of commercial pipes and the corresponding installation costs. As shown in Figure 5a, larger internal pipe diameters reduce friction losses but simultaneously increase construction costs, and vice versa. In this context, the designer must determine an appropriate pipe diameter that satisfies the required pressure conditions established by local regulations.
When energy costs are considered, the assessment follows the scheme in Figure 5b, where the pipe diameter has a direct influence on the annual operating cost. Smaller pipe diameters result in higher energy consumption and, consequently, greater yearly energy costs. The total expected annual cost is therefore obtained as the sum of the yearly energy cost and the annualised cost of the pipeline. This combined analysis highlights the importance of identifying the optimal design point (Point C in Figure 5), where the trade-off between energy expenditure and construction cost is balanced, ultimately ensuring both technical compliance and economic efficiency in system design.
The proposed methodology assumes a constant annual energy cost, as the pump power remains unchanged once the impeller size has been adjusted to meet this condition. Accordingly, the annual energy cost remains the same whether the additional water demand is considered or not. In this scenario, the only cost incurred is associated with the impeller modification, which is negligible compared to the other costs involved.
In general, when pipes of similar diameters are installed, the required installation depth and excavation width are also comparable.
During a pipe installation procedure, the trench must be constructed in accordance with the characteristics of the native soil and local regulations. In Colombia, for example, Resolution No. 0799/2021 stipulates a minimum cover of 1.0 m above the pipe crown level [3]. Furthermore, the trench width is standardised for a range of pipe diameters, ensuring sufficient space for proper placement and compaction of the backfill, particularly in the haunch zone. On this basis, excavation costs tend to remain similar for pipes of comparable diameters. By contrast, variations in pipe cost are significant, depending on both the diameter and the material used.
Since the operating pressure is assumed to be the same for all proposed capacity expansion alternatives, every installed pipe must withstand this pressure. The mechanical resistance of pipes is defined by the ratio of diameter to wall thickness, commonly referred to as the Standard Dimension Ratio (SDR).
As a consequence, the volume of material required ( V ), in m3 per linear metre of pipe, to manufacture a pipe section can be expressed as:
V = π d s
where d = pipe diameter, and s = pipe wall thickness.
Because all pipes must satisfy a constant standard dimension ratio (SDR), it follows that:
S D R = d s
and
V = π d 2 S D R
Thus, the unit cost ( P ) of a pipe can be represented as:
P = K d 2
where K is a proportionality constant.
Therefore, the unit price of a pipe is proportional to the square of its diameter, with K = 1 considered for the present analysis.

3. Results and Discussion

3.1. Practical Application

The results are applied to a practical application aimed at meeting the increasing water demand of a growing population, in which parallel pipeline sections have been installed to enhance supply capacity (see Figure 4). In this problem, a 30 km long pipe (lt) is considered, with an initial water demand of 1.158 m3/s (Q0) and an internal diameter (d0) of 1 m. The remaining data are as follows: z0 = 0 m, z1 = z2 = 4 m, z4 = 50 m, Hp = 100 m, and f0 = 0.015. Given that the water demand has increased by 10% (Q1 = 1.274 m3/s), an additional pipe of length le and internal diameter d1 must be installed, to gradually increase the system’s capacity without imposing higher pressurisation on the system. The optimisation problem consists of determining the characteristics of the parallel pipe while minimising installation costs.
Table 1 summarises the outcomes of the practical application, in which different internal diameters of the proposed parallel pipe are assessed under a constant friction factor (f1) of 0.015. Calculations are performed using Equation (11). The results highlight the inverse relationship between pipe diameter and required length: as the internal diameter increases, the corresponding length of the parallel section decreases. For example, when adopting a diameter of 2.0 m, the required pipe length is reduced to 5332 m, whereas a smaller diameter of 0.2 m necessitates a considerably longer section of 29,724 m.
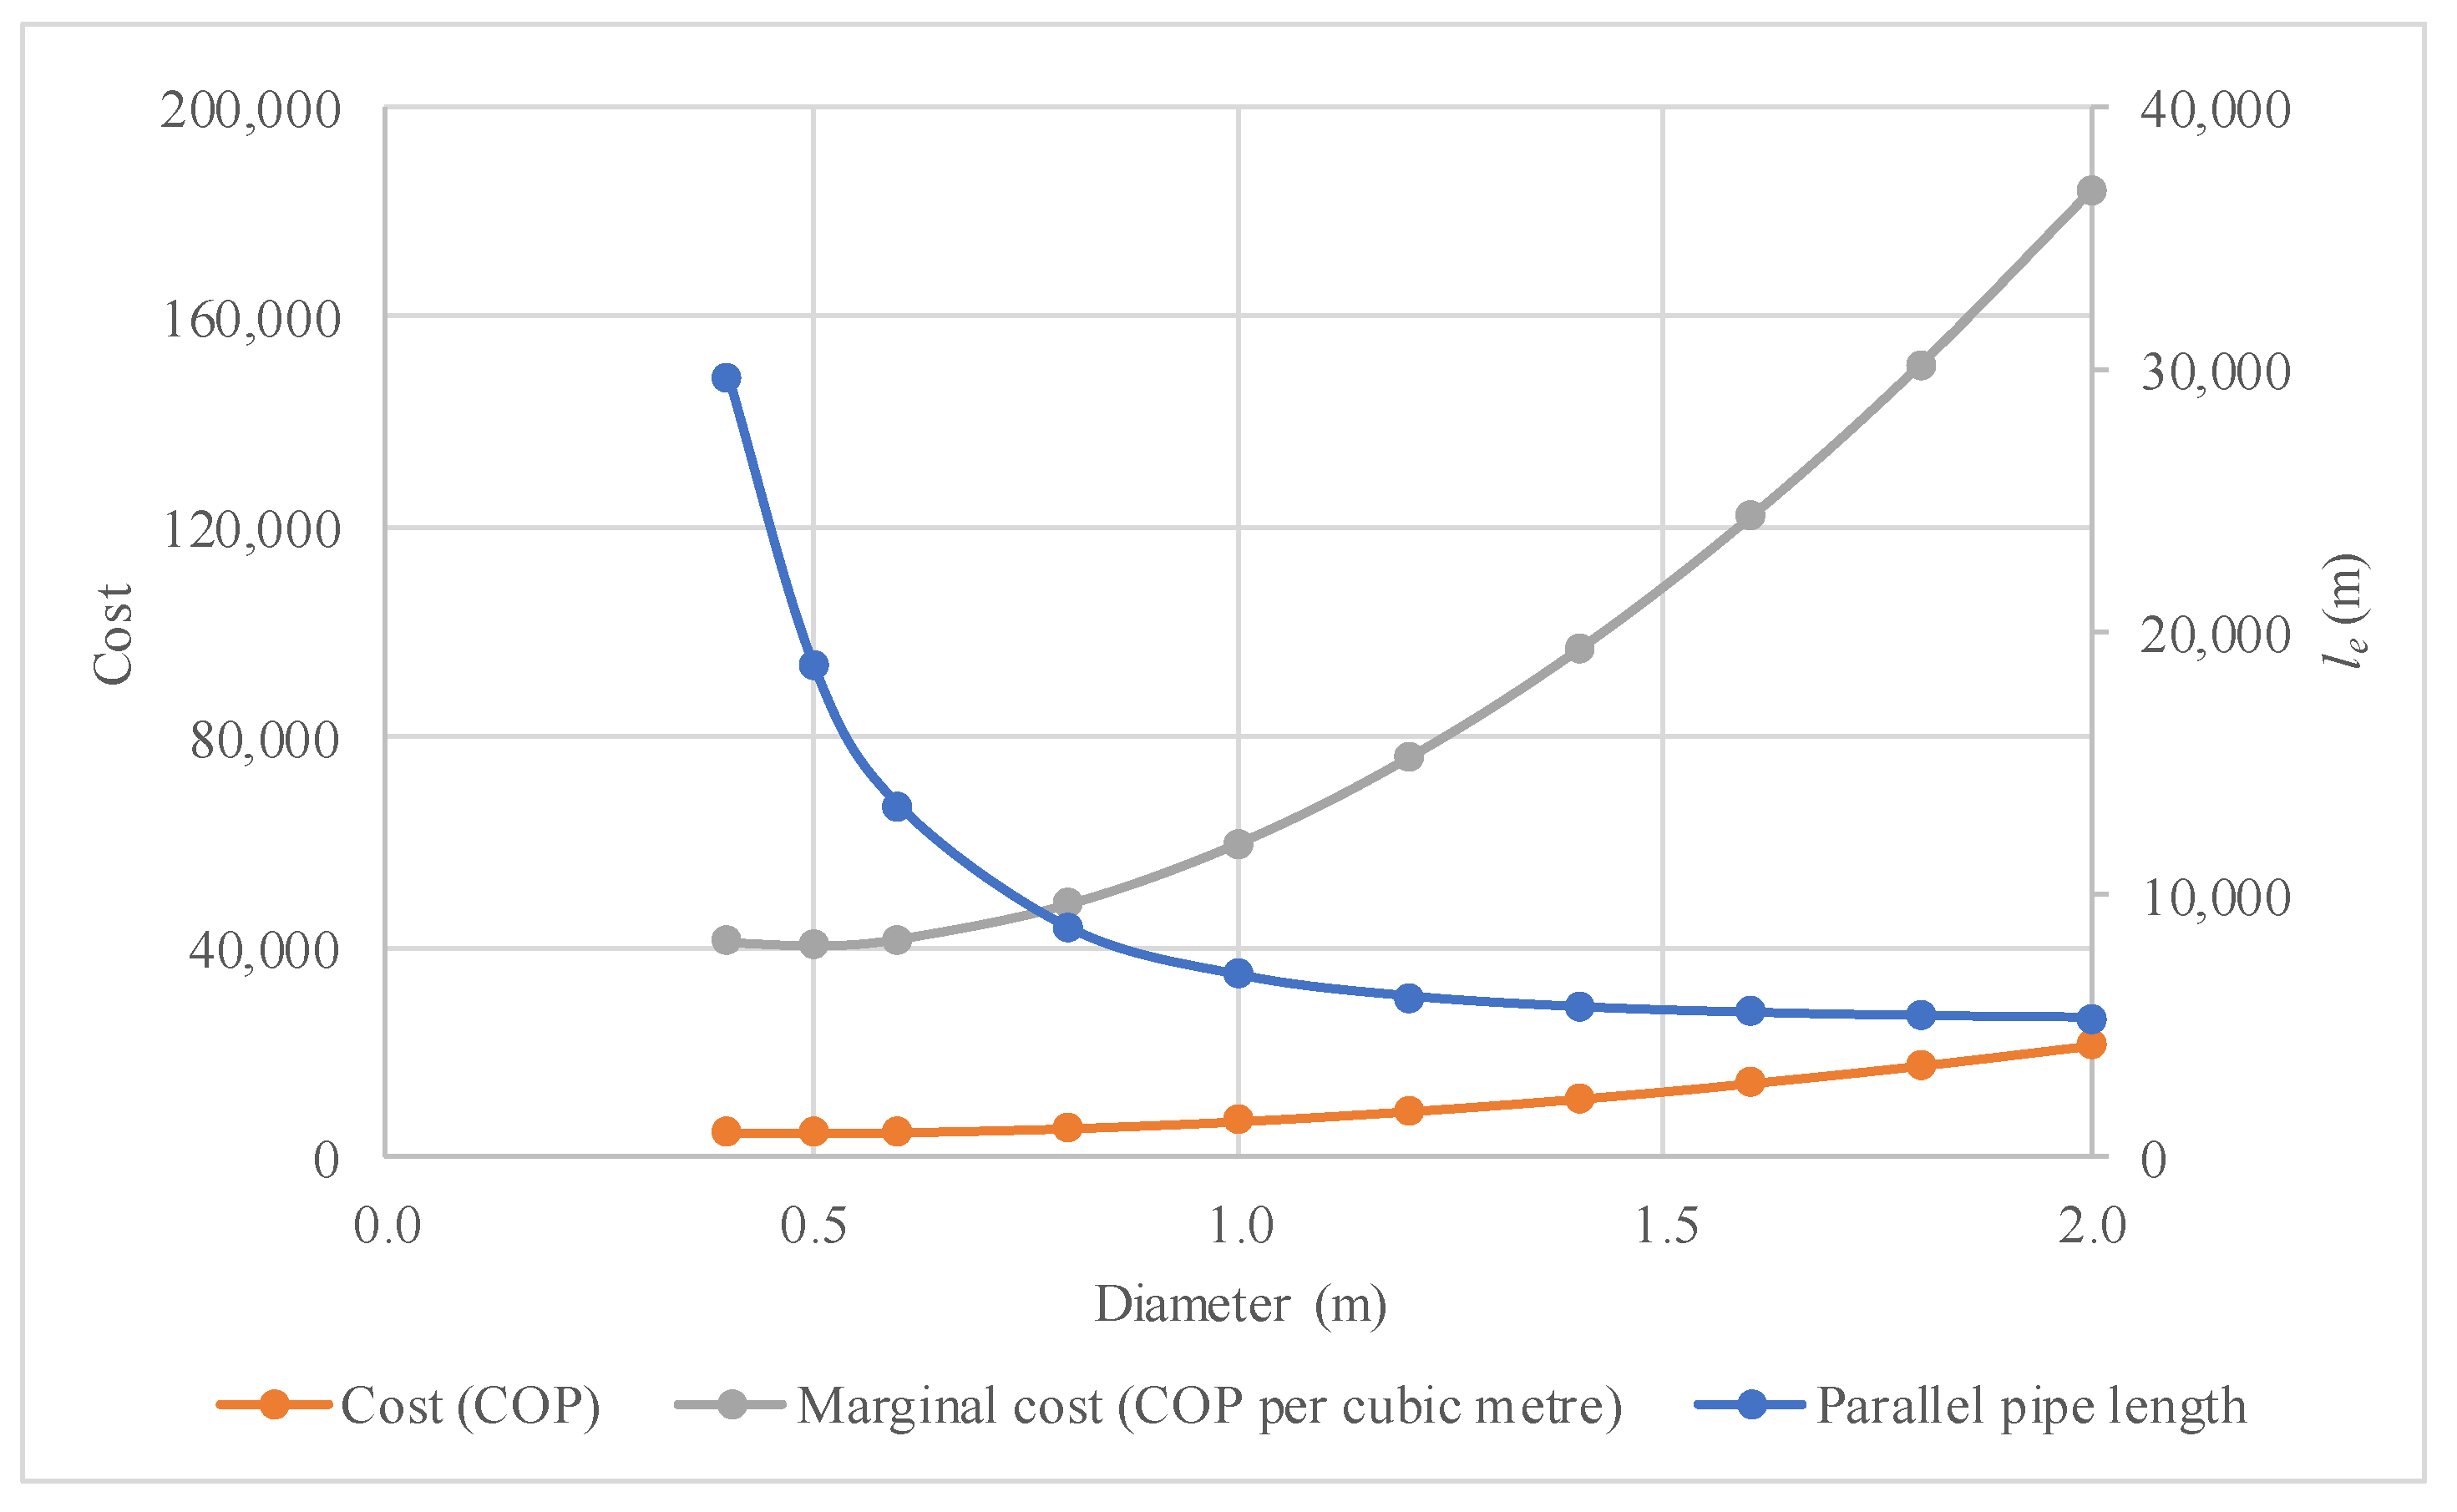
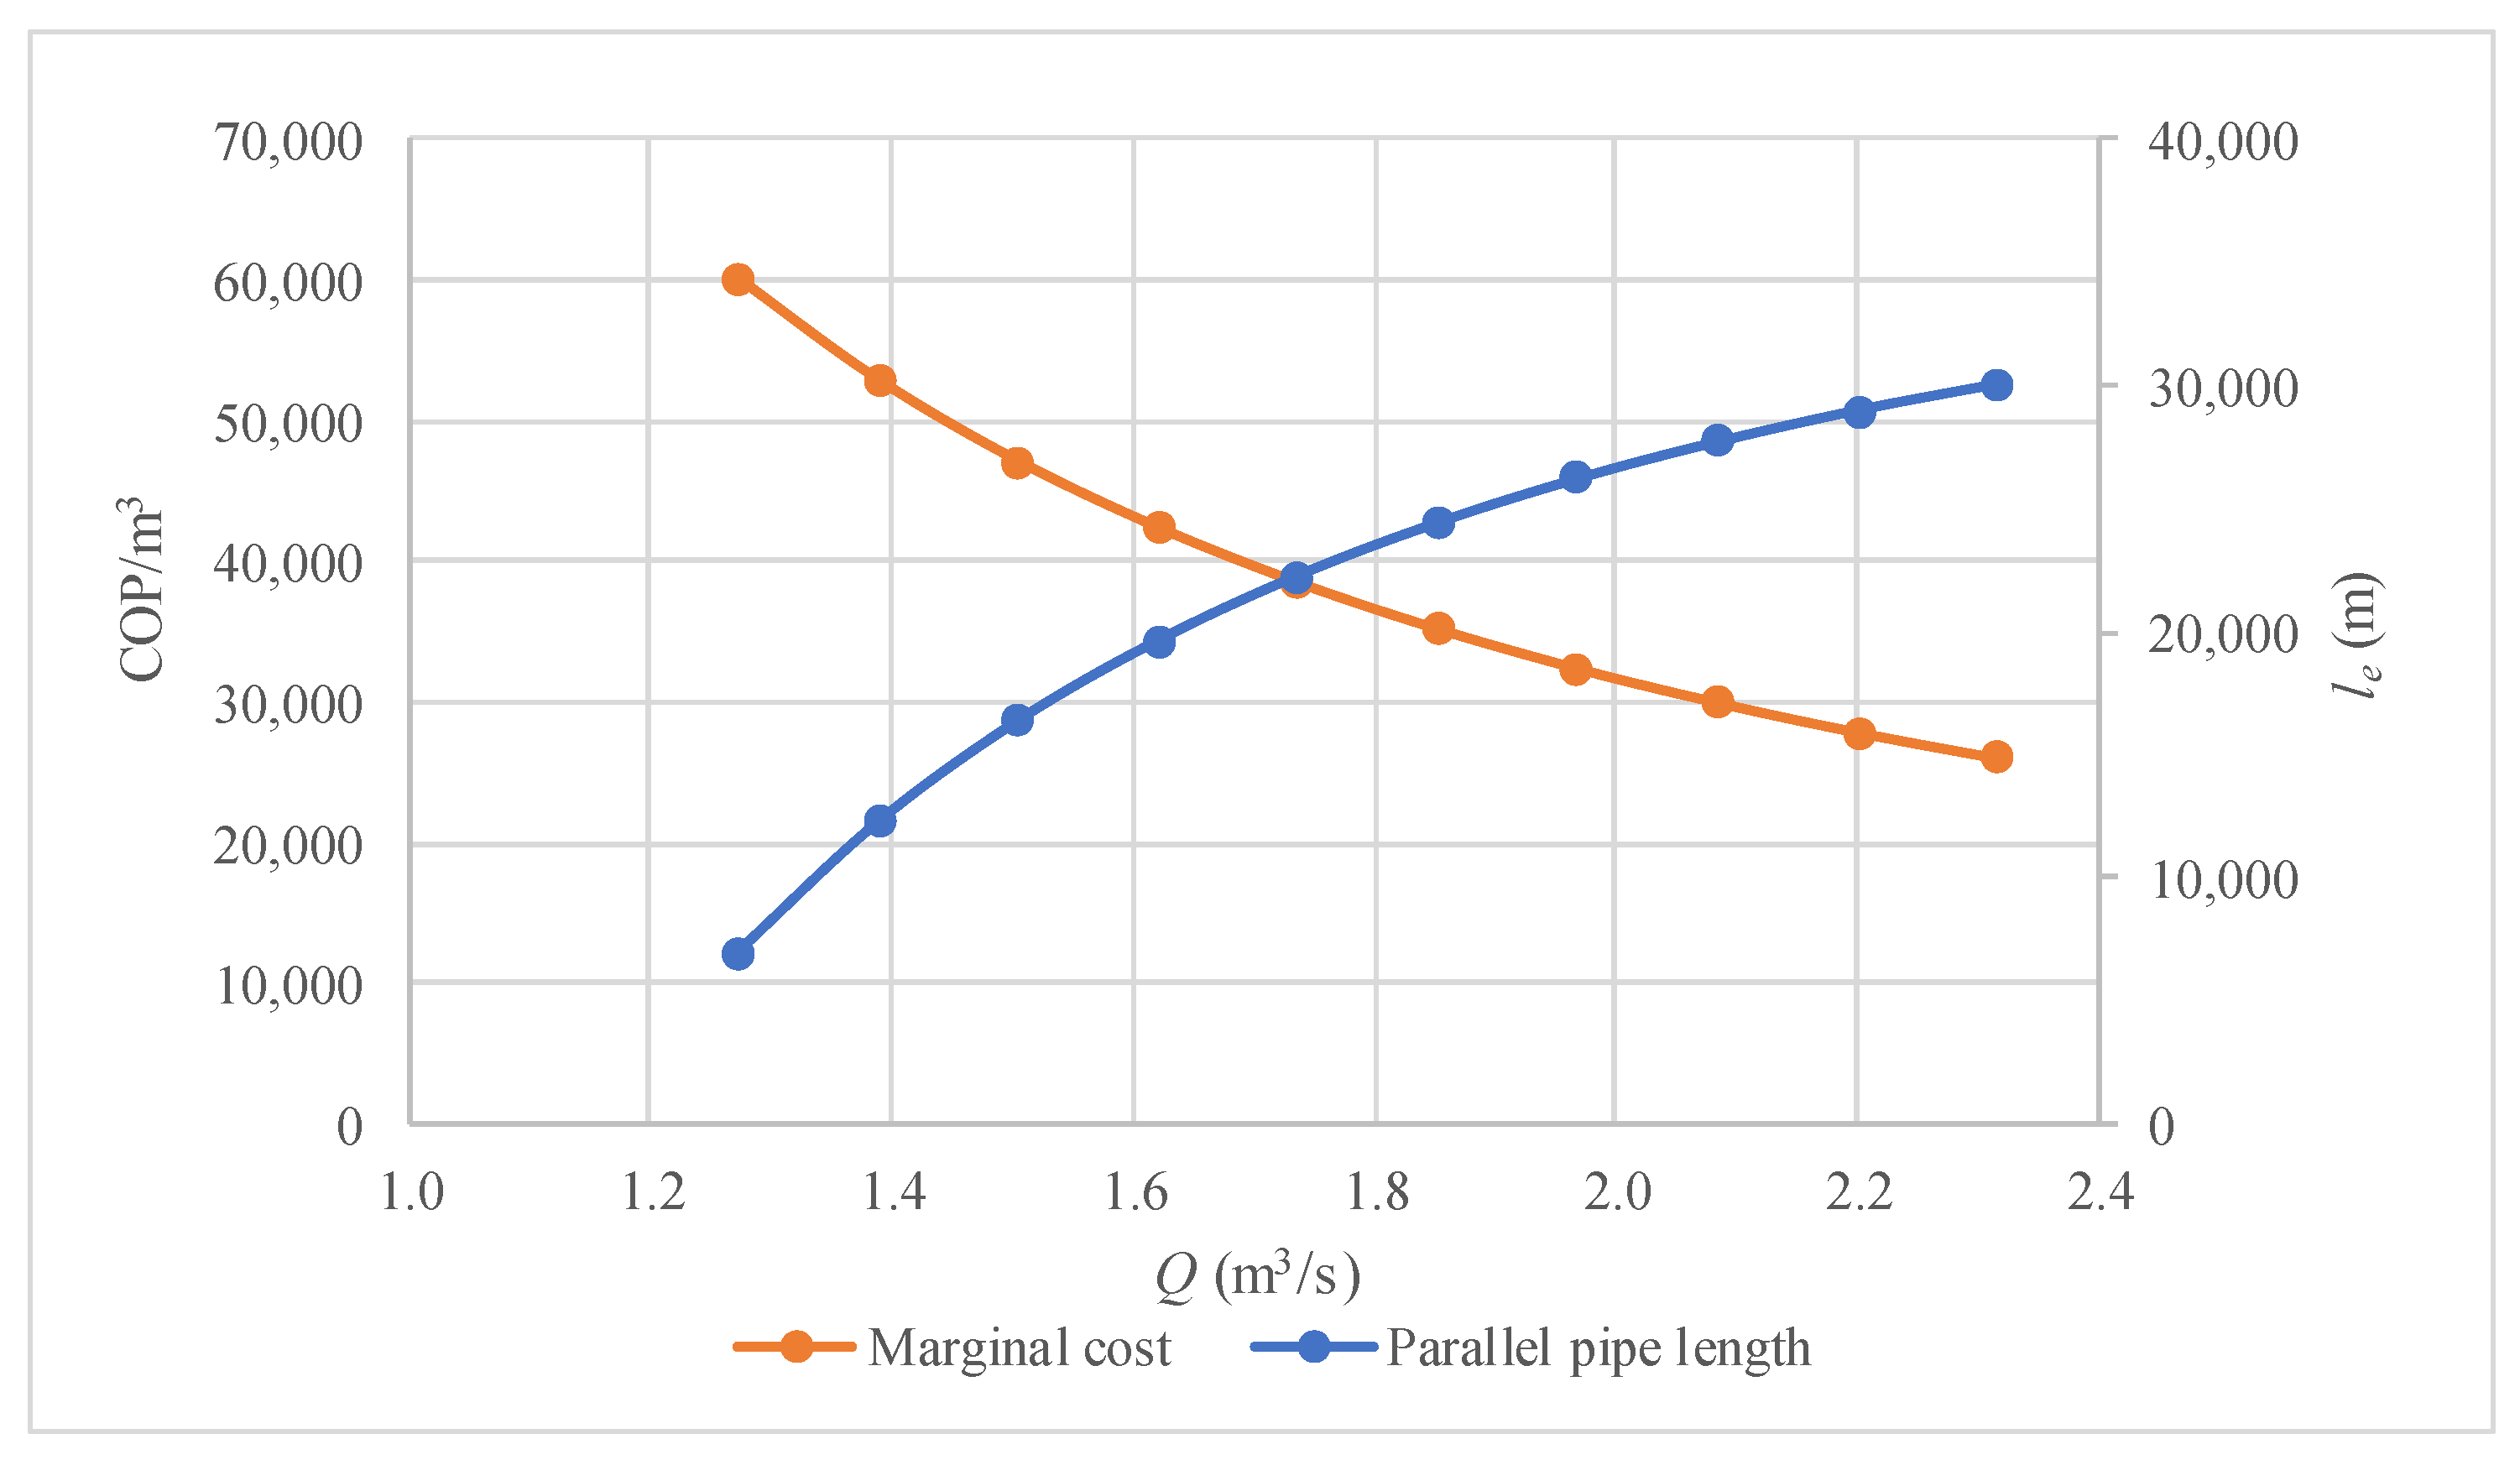
A comparison between the length of the parallel pipe and the construction costs is analysed as shown in Figure 6. It can be observed that the length becomes asymptotic for pipe diameters greater than 1.2 m. Conversely, the pipe cost increases sharply for diameters above 0.8 m, with the marginal cost rising even more steeply for larger diameters. The results presented in Figure 6 indicate that increasing the pipe diameter is the most expensive alternative for capacity expansion. Although larger diameters require shorter total pipe lengths, the cost grows proportionally to the square of the diameter, leading to higher overall investment and, consequently, a higher marginal cost per cubic metre of water conveyed. For instance, increasing the pipe diameter to 2 m results in an additional cubic meter cost that is 7.1 times greater than the initial unit cost. Similarly, for a diameter of 0.5 m, the marginal cost is 1.6 times higher than the cost of the initial cubic meter.
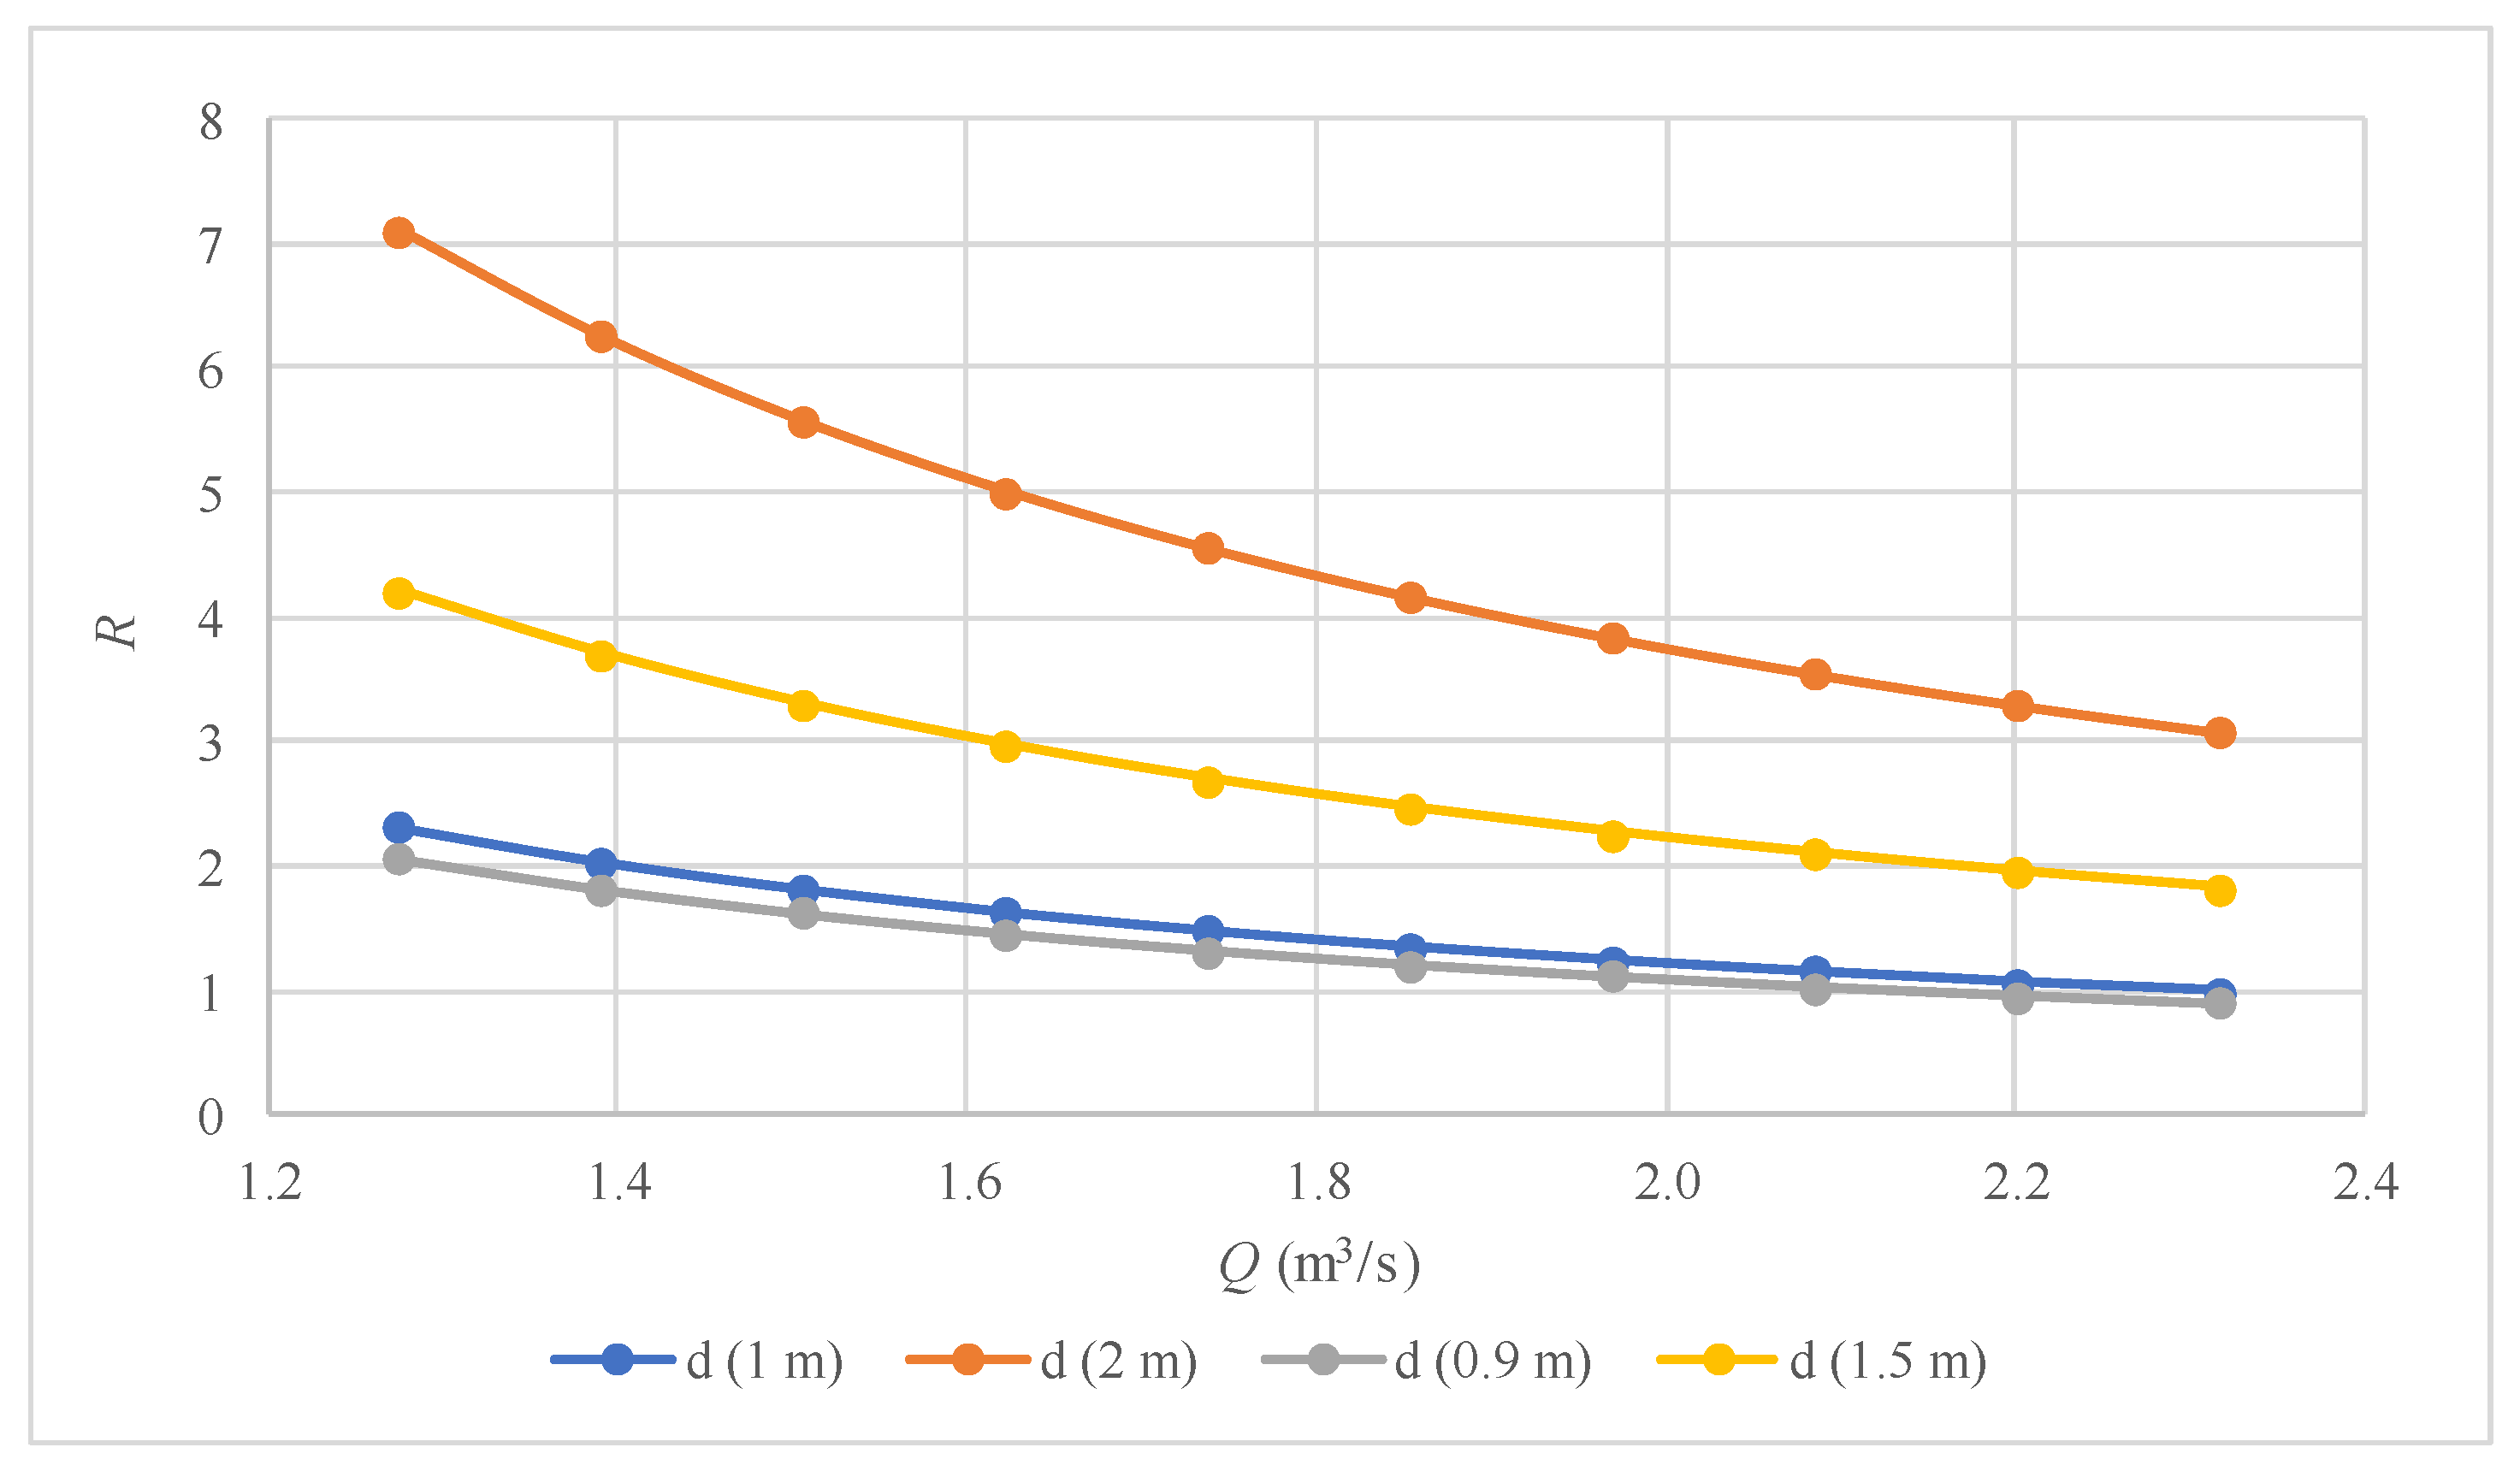
When a parallel pipeline of the same diameter as the existing pipe is installed, the marginal cost per cubic metre is approximately 2.3 times the initial unit cost. This marginal cost decreases as additional pipeline sections are incorporated, eventually converging to the initial unit cost per cubic meter, as shown in Figure 7.
Figure 8 presents the results for the marginal cost of producing an additional cubic meter relative to the initial unit cost, expressed as a function of pipe diameter. The analysis was conducted using a pipe diameter varying from 0.9 to 2.0 m. The results indicate that, for diameters larger than the installed pipe, the marginal cost of producing one cubic meter is higher. In contrast, for diameters smaller than the installed pipe, the marginal cost tends to be noticeably lower.
To analyse the sensitivity of the required length of the new pipeline, the variation in the friction factor was simulated, ranging from 0.008 for smooth pipes to 0.018 for rough pipes, while considering a 10% increase in flow rate. The results (see Table 2) show that increasing the friction coefficient by more than 125% resulted in a 13% increase in the required pipe length. This suggests that the friction coefficient of the new pipe has a minor impact on the length of pipe needed.
Table 3 presents the analysis of the variation in the pump’s dynamic head and its initial flow rate, along with a 10% increase in flow rate, for each of the pumping head alternatives considered. The results indicate that the required length is independent of the pump head, as the new parallel pipe has a length of 6949 m for all scenarios, with an internal diameter of 1.0 m.

3.2. Discussion

The impact of considering a narrow range of internal pipe diameters was assessed to examine the behaviour of the new parallel pipe values and the corresponding marginal cost. The results are consistent with the theoretical trends shown in Figure 5a, where higher costs are associated with smaller internal pipe diameters. Table 4 presents the outcomes for this lower range of diameters, confirming that the analytical equations are in reasonable agreement with the hypothesis proposed in this study.
A multiparametric analysis was performed using a dataset comprising 309 points, derived from thirteen input variables ( Q 1 , z 1 , z 2 , z 3 , z 4 , H p , l 0 , d 0 , l t , f 0 , f 1 , d 1 , and Q 0 ) and a single response variable ( l e ). The dataset was randomly generated to reflect the real characteristics of the system under study, in accordance with the equations presented in Section 3.1. Table 5 summarises the ranges of the variables.
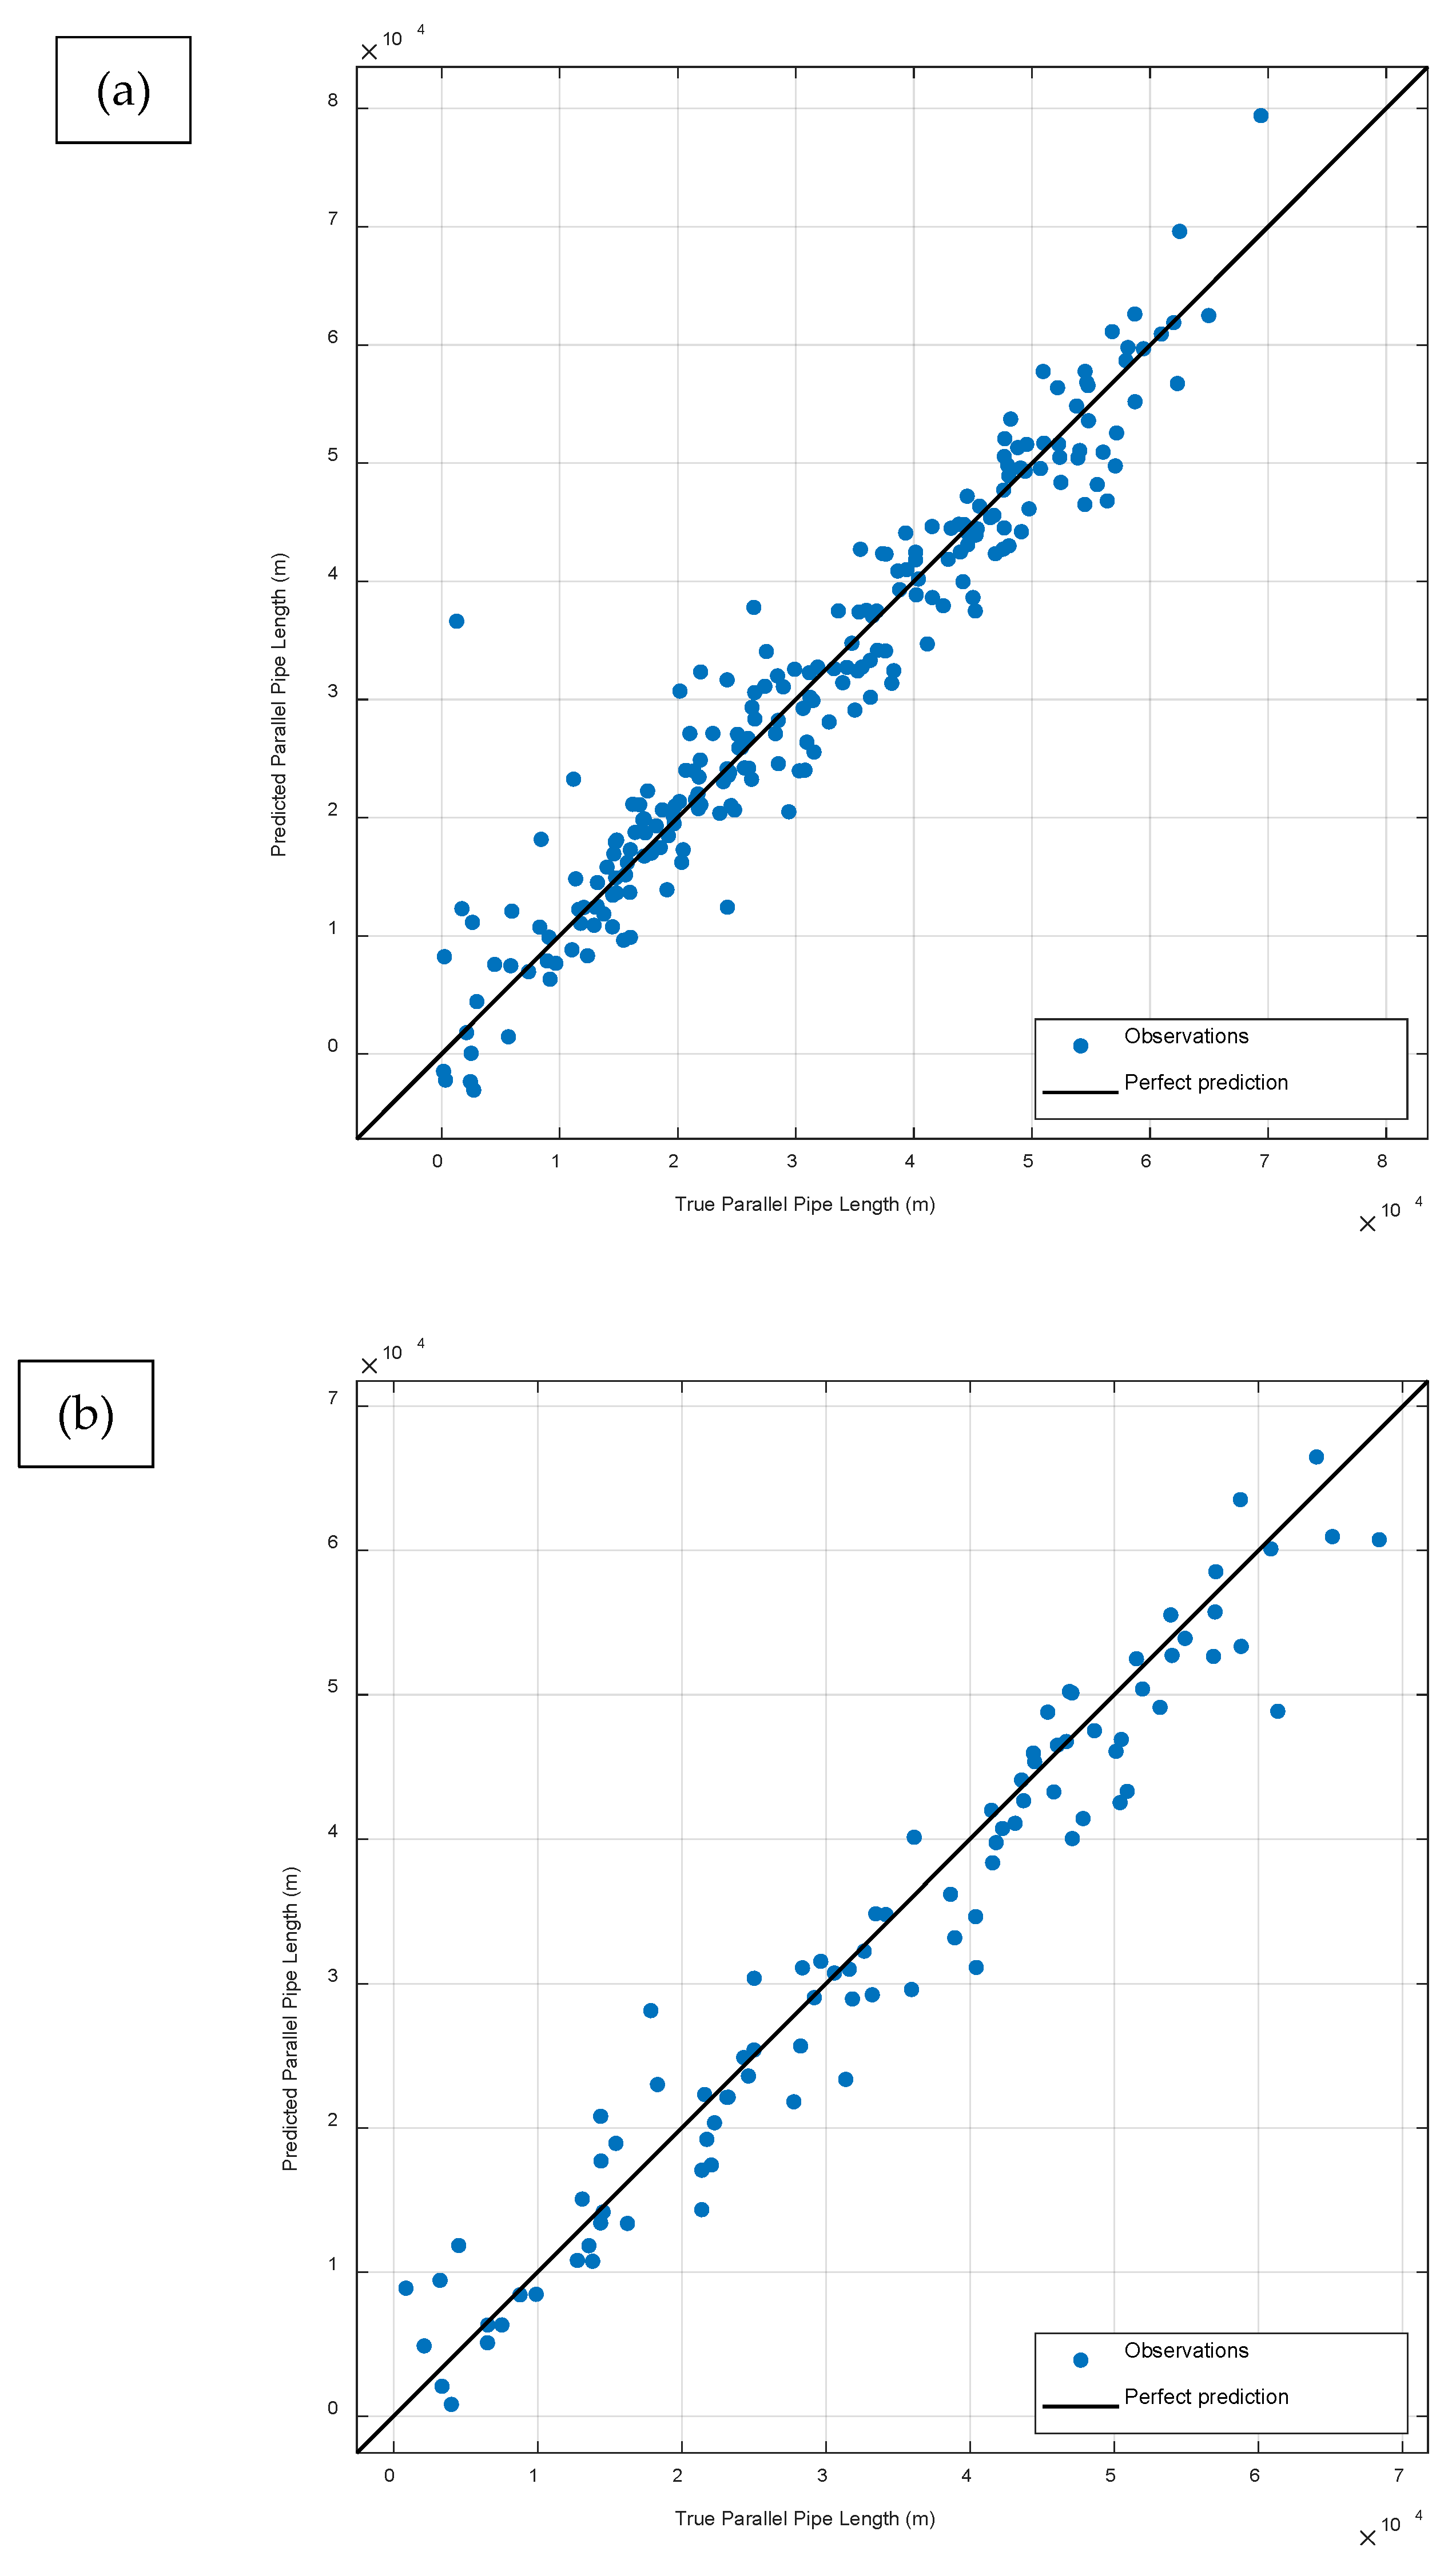
To assess the most suitable method, machine learning presets were performed as detailed in Table 6. The coefficient of determination (R2) was computed for each preset. The stepwise linear method demonstrated the best fit, with validation and test values of 0.92 and 0.95. Additionally, Figure 9 presents a comparison between the actual and predicted values of the parallel pipe length for both the validation and testing stages. The prediction of the selected model is adequate since the dataset tends to be close to the perfect prediction line (black).
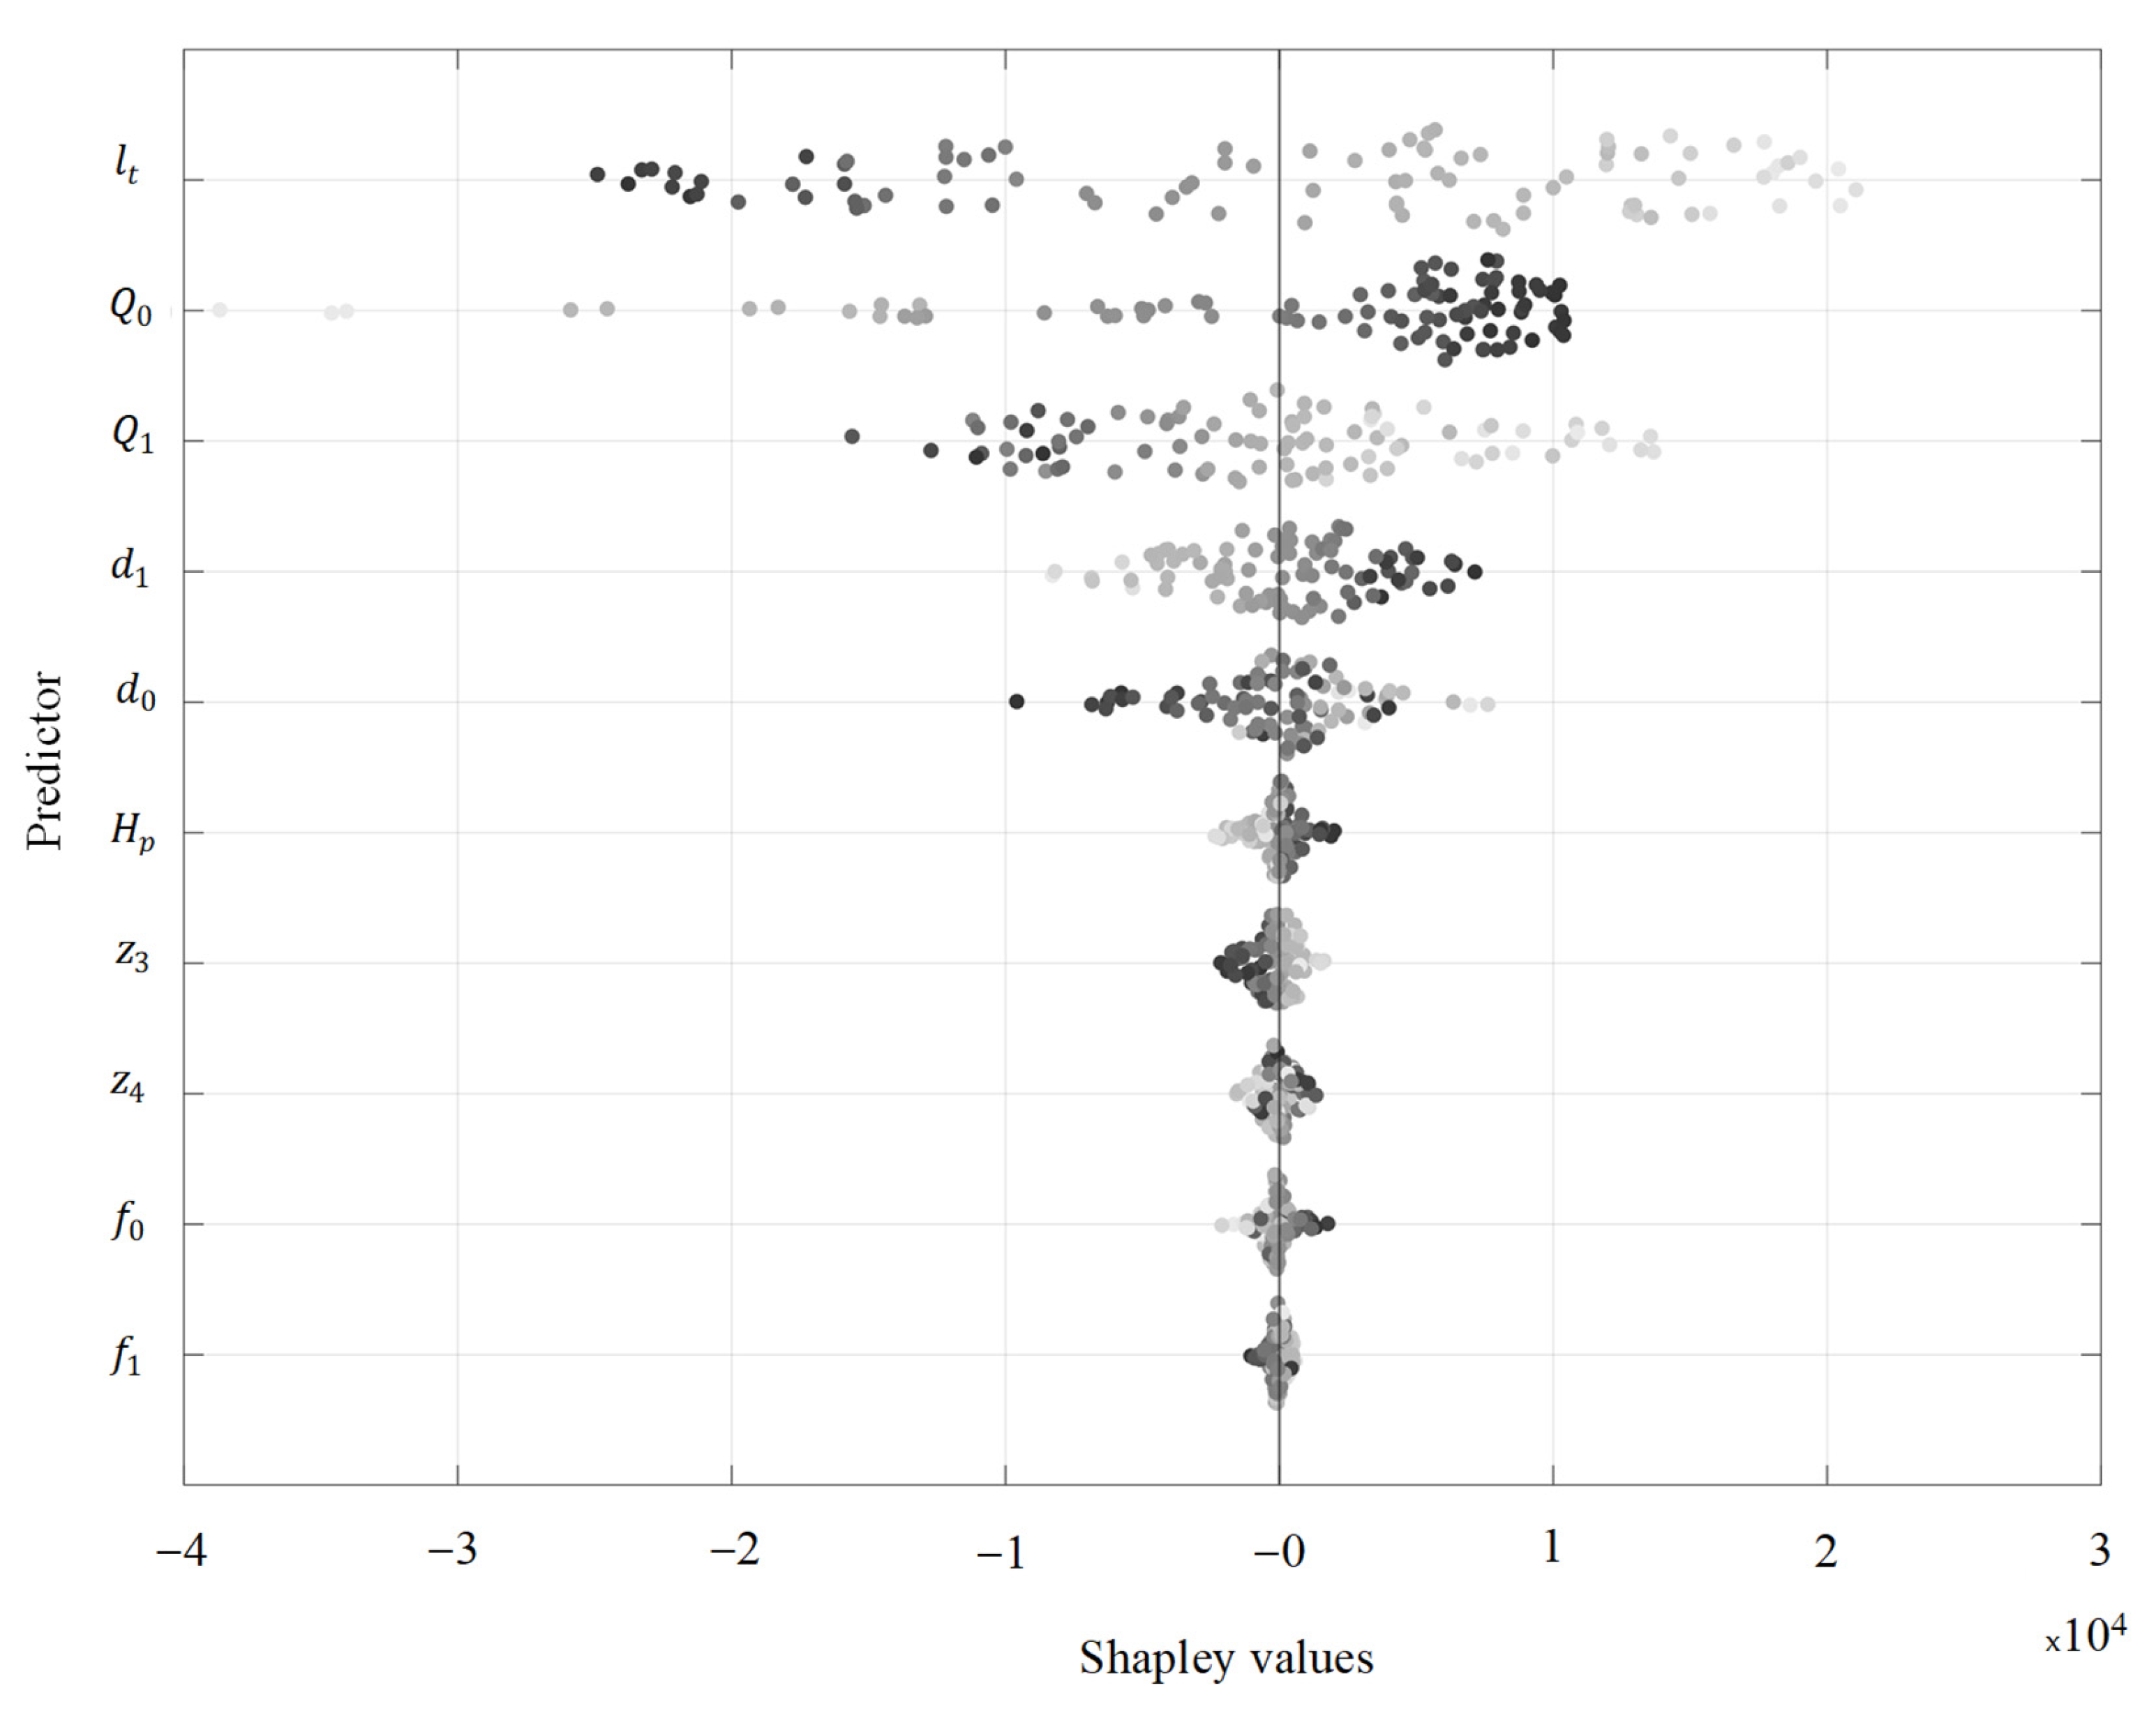
To assess the contribution of each predictor to the model’s output, the Shapley curve was generated, as shown in Figure 10. Larger absolute values indicate a more substantial influence of the corresponding predictor, while smaller values reflect weaker effects. In this regard, the predictors l t , Q 0 , Q 1 , d 1 , d 0 , and H p are the most relevant for the prediction.
In addition, this subsection discusses the implications of the assumptions considered:
  • Addition of a new parallel pipe: To accommodate additional water demand, any new pipe must have resistance characteristics comparable to those of the existing pipeline (e.g., PN 6, PN 10, PN 16, PN 20, PN 25, PN 32 or other). This ensures adequate protection against water hammer effects. Good practice guidelines generally recommend increasing the design pressure of pipes by 10% for systems operating under gravity flow and by 30% for pumping systems, to account for maximum surge pressures. Such considerations are commonly applied in practical engineering design.
  • Pipe roughness: The absolute roughness of existing pipes is assumed to remain constant over time. This implies that the hydraulic design must ensure flow velocities high enough to prevent biofilm development within the pipeline. The proposed methodology can be used to evaluate both the existing and the new friction losses.
  • Pump performance curves: The pump curves for the two impeller sizes (see Figure 3) assume the same power input, meaning that both configurations operate close to their best efficiency point with similar efficiencies.

4. Conclusions

This research presents the development of an analytical formulation to directly compute the required parallel pipeline for an existing water installation, where demand has increased due to population growth, climate change, or other factors affecting water distribution or irrigation networks. The proposed methodology preserves the resistance class of the pipe to prevent failures arising from overpressure. An optimisation framework is established to identify the most cost-effective reinforcement strategy, ensuring applicability in practical contexts.
Ideally, water supply systems should be reinforced by installing additional pipelines that match the diameter of the existing infrastructure. A sensitivity analysis was conducted to evaluate marginal costs under varying internal pipe diameters, friction factors, and pump heads. Shapley values further revealed that total pipe length, initial water demand, additional demand, internal pipe diameters, and pump head were the most influential predictors (input values) during the simulations.

Author Contributions

Conceptualization, A.A.-P.; methodology, A.A.-P., and O.E.C.-H.; formal analysis, A.A.-P., and O.E.C.-H.; validation, A.A.-P., writing—original draft preparation, O.E.C.-H., and A.A.-P.; writing—review and editing, M.S.; supervision, A.A.-P., and M.S. All authors have read and agreed to the published version of the manuscript.

Funding

This research received no external funding.

Data Availability Statement

The original contributions presented in this study are included in the article. Further inquiries can be directed to the corresponding author.

Conflicts of Interest

The authors declare no conflicts of interest.

Abbreviations

The following abbreviations are used in this manuscript:
d 0 Internal pipe diameter for the existing installation (m);
d 1 Internal pipe diameter for the projected parallel pipe (m);
f 0 Friction factor for the existing installation (-);
f 1 Friction factor for the projected parallel pipe (-);
h f Friction losses (m);
H p Pump head (m);
j Coefficient that depends on pipe diameter and friction factor (-);
K Proportionality constant (-);
l e Projected parallel pipe length (m);
l 0 Upstream pipe length (m);
l t Downstream pipe length (m);
N Total numbers of observations (-);
P Unit cost (COP);
R Pipe resistance (s2/m5);
R 2 Coefficient of determination (-);
S D R Constant standard dimension ratio (-);
Q 1 Existing water demand (m3/s);
Q 0 New water demand (m3/s);
S Pipe wall thickness (m);
z Invert elevation (m a.s.l.);
ϕ Impeller size (m)
V Volume of material required (m3 per linear meter of pipe);
Subscripts
i Pipe;
P Predicted value;
T True value
Superscripts
̄Average value

References

  1. Ghannam, S.; Hussain, F. Short-Term Water Demand Forecasting: A Review. Aust. J. Water Resour. 2024, 1–19. [Google Scholar] [CrossRef]
  2. Donkor, E.A.; Mazzuchi, T.A.; Soyer, R.; Alan Roberson, J. Urban Water Demand Forecasting: Review of Methods and Models. J. Water Resour. Plan. Manag. 2014, 140, 146–159. [Google Scholar] [CrossRef]
  3. Ministry of Housing, City, and Development (MinVivienda); Republic of Colombia. Resolution 0977 of 9 December 2021, Technical Guidelines for the Sector of Potable Water and Basic Sanitation (RAS). 2021. Available online: https://www.minvivienda.gov.co/normativa/resolucion-0799-2021 (accessed on 15 August 2025).
  4. Liu, H.; Xing, R.; Davies, E.G.R. Forecasting Municipal Water Demands: Evaluating the Impacts of Population Growth, Climate Change, and Conservation Policies on Water End-Use. Sustain. Cities Soc. 2025, 130, 106581. [Google Scholar] [CrossRef]
  5. Akuoko-Asibey, A.; Nkemdirim, L.C.; Draper, D.L. The Impacts of Climatic Variables on Seasonal Water Consumption in Calgary, Alberta. Can. Water Resour. J. 1993, 18, 107–116. [Google Scholar] [CrossRef]
  6. Amisigo, B.A.; McCluskey, A.; Swanson, R. Modeling Impact of Climate Change on Water Resources and Agriculture Demand in the Volta Basin and Other Basin Systems in Ghana. Sustainability 2015, 7, 6957–6975. [Google Scholar] [CrossRef]
  7. Dawadi, S.; Ahmad, S. Evaluating the Impact of Demand-Side Management on Water Resources under Changing Climatic Conditions and Increasing Population. J. Environ. Manag. 2013, 114, 261–275. [Google Scholar] [CrossRef] [PubMed]
  8. Dang, C.; Zhang, H.; Yao, C.; Mu, D.; Lyu, F.; Zhang, Y.; Zhang, S. IWRAM: A Hybrid Model for Irrigation Water Demand Forecasting to Quantify the Impacts of Climate Change. Agric. Water Manag. 2024, 291, 108643. [Google Scholar] [CrossRef]
  9. Ashofteh, P.-S.; Bozorg-Haddad, O.; Loáiciga, H.A. Development of Adaptive Strategies for Irrigation Water Demand Management under Climate Change. J. Irrig. Drain. Eng. 2017, 2, 143. [Google Scholar] [CrossRef]
  10. Eekhout, J.P.C.; Delsman, I.; Baartman, J.E.M.; van Eupen, M.; van Haren, C.; Contreras, S.; Martínez-López, J.; de Vente, J. How Future Changes in Irrigation Water Supply and Demand Affect Water Security in a Mediterranean Catchment. Agric. Water Manag. 2024, 297, 108818. [Google Scholar] [CrossRef]
  11. Gagliardi, F.; Alvisi, S.; Franchini, M.; Guidorzi, M. A Comparison between Pattern-Based and Neural Network Short-Term Water Demand Forecasting Models. Water Supply 2017, 17, 1426–1435. [Google Scholar] [CrossRef]
  12. González Perea, R.; Camacho Poyato, E.; Montesinos, P.; Rodríguez Díaz, J.A. Optimisation of Water Demand Forecasting by Artificial Intelligence with Short Data Sets. Biosyst. Eng. 2019, 177, 59–66. [Google Scholar] [CrossRef]
  13. Wu, I. pai Design of Drip Irrigation Main Lines. J. Irrig. Drain. Div. 1975, 101, 265–278. [Google Scholar] [CrossRef]
  14. Alperovits, E.; Shamir, U. Design of Optimal Water Distribution Systems. Water Resour. Res. 1977, 13, 885–900. [Google Scholar] [CrossRef]
  15. Choi, Y.H.; Lee, H.M.; Choi, J.; Yoo, D.G.; Kim, J.H. Development of Practical Design Approaches for Water Distribution Systems. Appl. Sci. 2019, 9, 5117. [Google Scholar] [CrossRef]
  16. Ramani, K.; Rudraswamy, G.K.; Umamahesh, N.V. Optimal Design of Intermittent Water Distribution Network Considering Network Resilience and Equity in Water Supply. Water 2023, 15, 3265. [Google Scholar] [CrossRef]
  17. Parvaze, S.; Kumar, R.; Khan, J.N.; Al-Ansari, N.; Parvaze, S.; Vishwakarma, D.K.; Elbeltagi, A.; Kuriqi, A. Optimization of Water Distribution Systems Using Genetic Algorithms: A Review. Arch. Comput. Methods Eng. 2023, 30, 4209–4244. [Google Scholar] [CrossRef]
  18. Mekonnen, Y.A. Evaluation of Current and Future Water Demand Scenario and Hydraulic Performance of Water Distribution Systems, a Case Study for Addis Kidam Town, Ethiopia. Appl. Water Sci. 2023, 13, 40. [Google Scholar] [CrossRef]
  19. Wang, K.; Meng, J.; Wang, Z.; Zhao, K.; Liu, B. Robust Adaptive Optimization for Sustainable Water Demand Prediction in Water Distribution Systems. Sci. Rep. 2025, 15, 4039. [Google Scholar] [CrossRef] [PubMed]
  20. Robak, A.; Bush, S.; Bjornlund, H. Advancing the Impact Identification Step of Benefit-Cost Analysis of Potable Water Infrastructure Investments: A Systems Method for Identifying Important Impacts Pre-Monetisation. Water Res. 2023, 239, 120058. [Google Scholar] [CrossRef]
  21. Napolitano, J.; Di Francesco, M.; Sechi, G.M. Decision Trees in Cost–Benefit Analysis for Flood Risk Management Plans. J. Hydroinform. 2024, 26, 762–778. [Google Scholar] [CrossRef]
  22. Varouchakis, E.A.; Palogos, I.; Karatzas, G.P. Application of Bayesian and Cost Benefit Risk Analysis in Water Resources Management. J. Hydrol. 2016, 534, 390–396. [Google Scholar] [CrossRef]
  23. Mays, L. Hydraulic Design Handbook, 1st ed.; McGraw-Hill: New York, NY, USA, 1999. [Google Scholar]
  24. Chaudhry, M.H. Applied Hydraulic Transients; Van Nostrand Reinhold Company: New York, NY, USA, 1987. [Google Scholar]
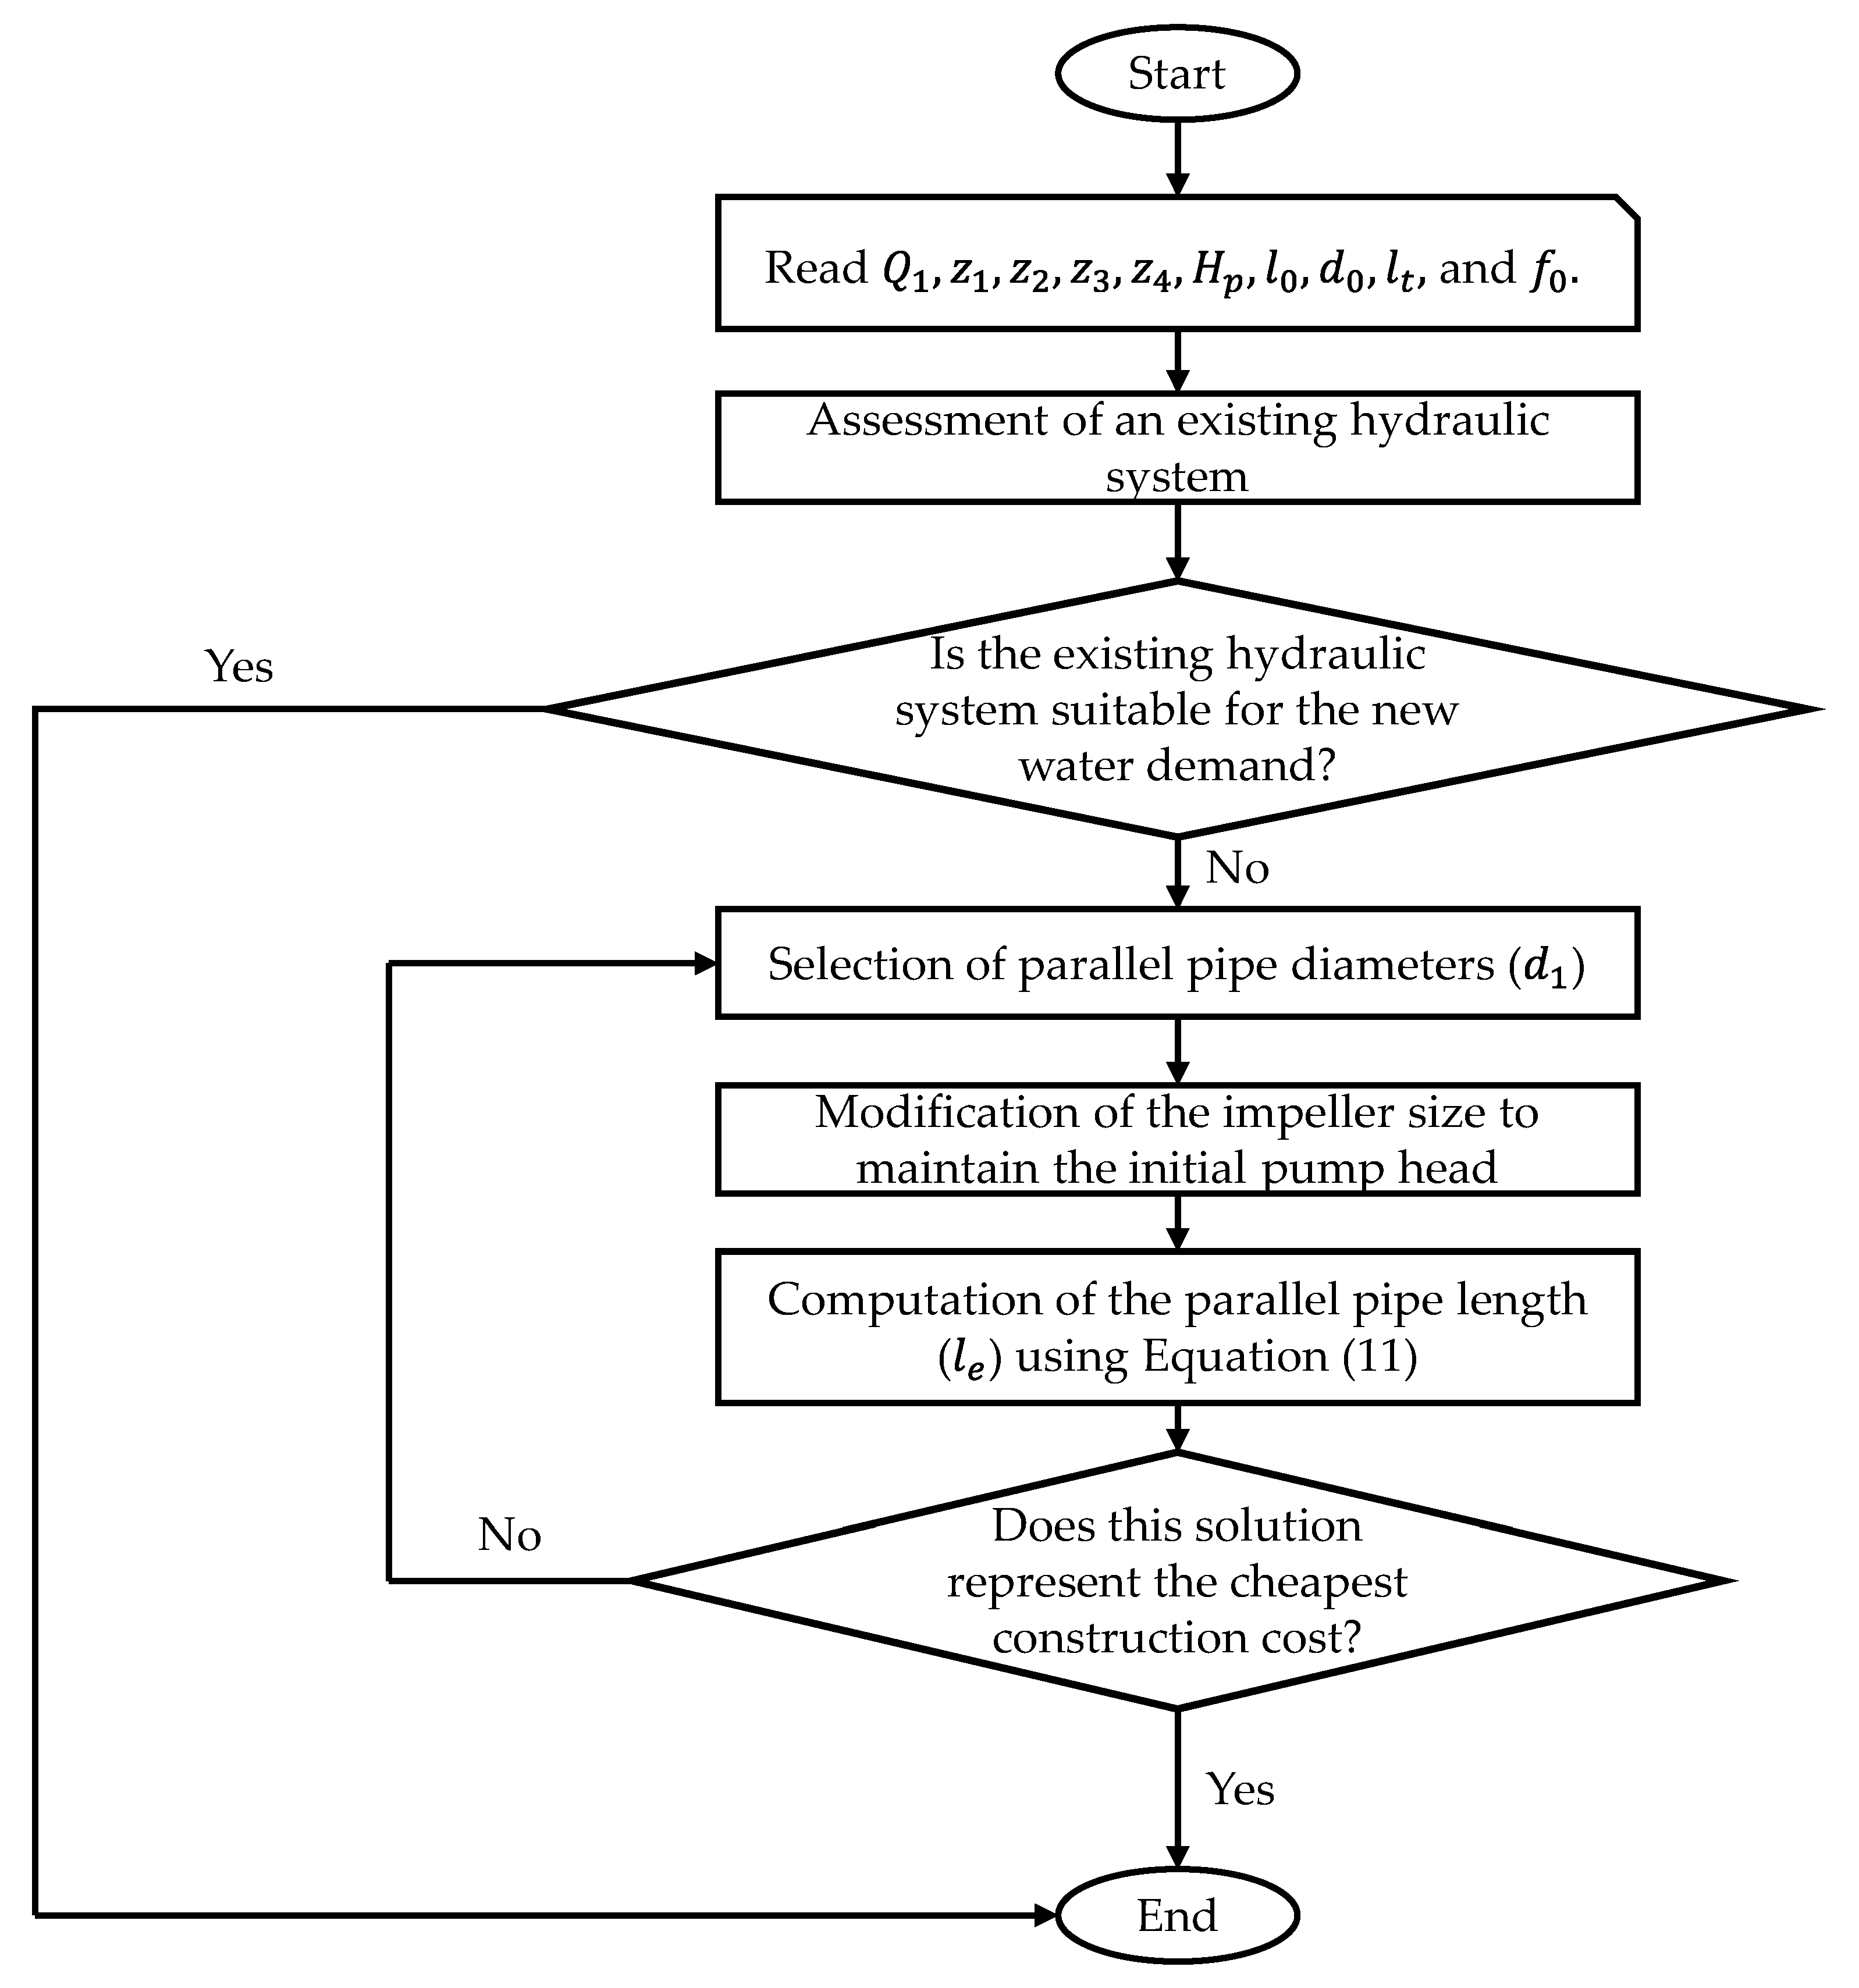
Figure 1. Methodology used in this study.
Sci 07 00140 g001
Figure 2. Schematic representation considering an initial water demand.
Sci 07 00140 g002
Figure 3. Analysis of pump and system curves under existing and projected scenarios.
Sci 07 00140 g003
Figure 4. Recommended infrastructure to supply the additional water demand.
Sci 07 00140 g004
Figure 5. Assessment of construction costs: (a) excluding energy costs; and (b) including energy costs.
Sci 07 00140 g005
Figure 6. Effect of Pipe Diameter Modification on System Capacity Expansion.
Sci 07 00140 g006
Figure 7. Effect of gradual flow rate increase by installing a parallel pipeline of equal diameter to the existing one.
Sci 07 00140 g007
Figure 8. Relationship between marginal cost per cubic meter and the initial unit cost.
Sci 07 00140 g008
Figure 9. Comparison of the actual and predicted parallel pipe lengths: (a) in the validation stage; and (b) in the testing stage.
Sci 07 00140 g009
Figure 10. Shapley values for the stepwise linear method.
Sci 07 00140 g010
Table 1. Characteristics of the pumping system considering different alternatives.
d 1 (m) l e (m)
2.05332
1.85401
1.65519
1.45732
1.26135
1.06949
0.88751
0.613,413
0.518,756
0.429,724
Table 2. Effect of the Friction Coefficient on the Installed Pipeline.
f 1 (-) l e (m)
0.0086341
0.0096439
0.0106531
0.0116621
0.0126707
0.0136790
0.0146871
0.0156949
0.0167025
0.0177099
0.0187172
Table 3. Effect of pump head on the required pipeline length.
H p (m) Q 1 (m3/s) l e (m)
1001.274
951.209
901.140
851.066
800.9806949
750.901
700.806
650.698
600.570
550.403
Table 4. Impact of marginal cost and parallel pipe length for a narrow range of internal pipe diameters.
d 1
(m)
l e
(m)
Marginal Cost (COP/m3)
0.1018,75666,009
0.15951375,334
0.20694997,826
0.256008132,154
0.305610177,678
0.355424233,859
0.405332300,254
0.455283376,532
0.505256462,465
0.555240557,900
0.605231662,734
Table 5. Range of predictors used to generate the dataset.
VariableUnitRange
FromTo
Q 1 m3/s0.296.00
z 1 m a.s.l.1.04.0
z 2 m a.s.l.1.04.0
z 3 m a.s.l.5.010.0
z 4 m a.s.l.10.050.0
H p m50.0220.0
l 0 m20.050.2
d 0 m0.261.96
l t m10,22059,968
f 0 -0.0100.024
f 1 -0.0100.024
d 1 m0.322.88
Q 0 m3/s0.025.71
Table 6. Coefficients of determination for machine learning presets.
PresetR2 (Validation)R2 (Test)PresetR2 (Validation)R2 (Test)
Linear0.850.87Efficient Linear SVM0.000.18
Interactions Linear0.890.91Boosted Trees0.840.89
Robust Linear0.830.87Bagged Trees0.810.86
Stepwise Linear0.920.95Squared Exponential GPR0.920.92
Fine Tree0.720.86Matern 5/2 GPR0.920.92
Medium Tree0.740.79Exponential GPR0.890.88
Coarse Tree0.620.61Rational Quadratic GPR0.920.92
Linear SVM0.840.87Narrow Neural Network0.770.85
Quadratic SVM0.920.92Medium Neural Network0.450.67
Cubic SVM0.920.92Wide Neural Network0.400.78
Fine Gaussian SVM0.00−0.02Bilayered Neural Network0.790.84
Medium Gaussian SVM0.850.85Trilayered Neural Network0.660.85
Coarse Gaussian SVM0.830.85SVM Kernel−0.01−0.06
Efficient Linear Least Squares0.060.16Least Squares Regression Kernel0.810.81
Note: the cell highlighted in grey represents the selected preset.
Disclaimer/Publisher’s Note: The statements, opinions and data contained in all publications are solely those of the individual author(s) and contributor(s) and not of MDPI and/or the editor(s). MDPI and/or the editor(s) disclaim responsibility for any injury to people or property resulting from any ideas, methods, instructions or products referred to in the content.