Article

Cost Reduction in Power Systems via Transmission Line Switching Using Heuristic Search

by
Juan Camilo Vera-Zambrano
1,
Mario Andres Álvarez-Arévalo
1,
Oscar Danilo Montoya
1,*,
Juan Manuel Sánchez-Céspedes
2 and
Diego Armando Giral-Ramírez
3
1
Grupo de Compatibilidad e Interferencia Electromagnética (GCEM), Facultad de Ingeniería, Universidad Distrital Francisco José de Caldas, Bogotá 110231, Colombia
2
Gestión e Investigación en Informática, Redes y Afines (GIIRA), Facultad de Ingeniería, Universidad Distrital Francisco José de Caldas, Bogotá 110231, Colombia
3
Facultad Tecnológica, Universidad Distrital Francisco José de Caldas, Bogotá 110231, Colombia
*
Author to whom correspondence should be addressed.
Sci 2025, 7(4), 141; https://doi.org/10.3390/sci7040141
Submission received: 16 August 2025 / Revised: 19 September 2025 / Accepted: 29 September 2025 / Published: 3 October 2025
(This article belongs to the Section Computer Sciences, Mathematics and AI)

Abstract

Electrical grids are currently facing new demands due to increased power consumption, growing interconnections, and limitations regarding transmission capacity. These factors introduce considerable challenges for the dispatch and operation of large-scale power systems, often resulting in congestion, energy losses, and high operating costs. To address these issues, this study presents a transmission line switching strategy, which is formulated as an optimal power flow problem with binary variables and solved via mixed-integer nonlinear programming. The proposed methodology was tested using MATLAB’s MATPOWER toolbox version 8.1, focusing on power systems with five and 3374 nodes. The results demonstrate that operating costs can be reduced by redistributing power generation while observing the system’s reliability constraints. In particular, disconnecting line 6 in the 5-bus system yielded a 13.61% cost reduction, and removing line 1116 in the 3374-bus system yielded cost savings of 0.0729%. These findings underscore the potential of transmission line switching in enhancing the operational efficiency and sustainability of large-scale power systems.

1. Introduction

1.1. General Context

Electric power systems are a fundamental piece of infrastructure that sustains the development and functioning of modern society, providing continuous and reliable energy, which is essential for industry, commerce, and households [1,2]. These systems are characterized by their complexity, as they involve multiple interconnected stages—generation, transmission, and distribution—that must operate cohesively to ensure system stability and power quality. Their diverse components, operational constraints, and physical phenomena (e.g.,transient dynamics and load fluctuations) further contribute to this complexity [3].
The increasing global demand for electricity, driven by population growth, urbanization, and technological advancement, intensifies the pressure on existing power grids [4]. Concurrently, the accelerated integration of renewable energy sources introduces new instability factors, such as variability and intermittency, which challenge traditional grid management practices [5]. This highlights the need for developing advanced operational strategies and innovative planning methodologies aimed at maintaining system reliability, preventing outages, and optimizing infrastructure utilization amid evolving technical and market conditions [6].
Furthermore, these challenges have spurred the exploration of novel solutions focused on flexibility, efficiency, and sustainability. Techniques such as grid reconfiguration, demand response, energy storage, and distributed generation (DG) are being increasingly adopted in order to adapt dynamically to fluctuating demands and generation patterns [1]. The ongoing technological evolution underscores the importance of integrating these tools into operational practices, thereby fostering resilient, cost-effective, and environmentally sustainable power systems that are capable of supporting the future’s complex energy landscape.

1.2. Motivation

A fundamental challenge faced by modern power systems is managing congestion on transmission lines, which can lead to overloads, increased power losses, and voltage stability issues. Overloaded lines exceeding their thermal or operating limits threaten grid reliability and can cause cascading failures if not properly managed [7]. Traditional approaches to mitigating these issues involve deploying flexible AC transmission systems (FACTS), upgrading the infrastructure with high-efficiency transformers, or expanding transmission capacity, all of which require substantial financial investments and long planning horizons [8]. However, these solutions often lack the necessary flexibility for a rapid response to unpredictable load or renewable generation fluctuations, which limits their effectiveness in dynamic environments.
Given these limitations, there is a critical need to develop reconfigurable, cost-effective control strategies capable of adapting in real time to changing operating conditions [9]. Techniques such as network reconfiguration, flexible switching, and real-time demand response can optimize the power flow and alleviate congestion without extensive infrastructure expansion. Such strategies not only enhance system reliability and operational efficiency; they also contribute to reducing the overall costs and carbon emissions [10]. Thus, innovative and agile control methodologies are essential for transitioning towards smarter, more resilient, and environmentally sustainable power grids that can accommodate increasing energy demands and integrate renewable energy sources [11,12].

1.3. Literature Review

Within the realm of power systems operation, optimal transmission switching (OTS) has garnered significant attention as an effective technique to alleviate congestion, reduce power losses, and improve the overall network efficiency [13,14]. OTS involves the strategic opening and closing of transmission lines, enabling a dynamic reconfiguration of the grid’s topology to optimize its power flow distribution [15]. This method takes advantage of the inherent flexibility of the existing infrastructure, allowing operators to adapt to changing system conditions without additional physical investments. The concept originated in the 1980s and was initially aimed at preventing voltage collapse and enhancing load management. It has since matured into a vital tool for both short-term reliability and long-term operational planning [16].
Over recent decades, the evolution of power systems—marked by increased renewable energy integration, decentralization, and the development of smart grids—has further heightened the importance of OTS. This approach supports the integration of variable renewable sources, addresses voltage stability issues, and mitigates the overloads caused by unpredictable fluctuations in generation and demand [17]. Nonetheless, the mathematical complexity of the underlying optimization problem remains a substantial obstacle. AC optimal power flow (OPF) formulations with line switching are inherently non-convex and are generally expressed as mixed-integer nonlinear programming (MINLP) problems, which are computationally demanding and challenging to solve at scale [18,19].
To overcome these computational challenges, numerous solution strategies have been proposed. These range from sophisticated mathematical optimization algorithms—such as convex relaxations, decomposition methods, and cutting-plane techniques—to heuristic and metaheuristic approaches, including genetic algorithms, tabu search, and swarm intelligence. These methods aim to find feasible, near-optimal, and computationally tractable solutions within acceptable time frames, allowing operators to implement network reconfiguration in real-world, large-scale power systems. Nevertheless, balancing solution quality with computational efficiency remains a critical concern, motivating ongoing research in this area [13].
To provide a comprehensive and up-to-date overview of the research on OTS, Table 1 summarizes the key contributions in the literature. This comparative analysis highlights the diversity of OTS solution approaches, modeling frameworks, and computational strategies, as well as the range of benchmark and real-world test systems explored. The table also specifies the main optimization objectives considered—such as cost reduction, reliability enhancement, contingency management, voltage stability, and grid resilience to intentional attacks—offering a clear context for this work within the broader landscape of power system reconfiguration research.

1.4. Contribution, Scope and Limitations

This research introduces a heuristic methodology aimed at optimizing the transmission line configuration of large-scale power systems in order to minimize operating costs. This approach leverages a detailed AC power flow analysis within the MATLAB environment, utilizing the MATPOWER toolbox to efficiently evaluate numerous line-disconnection scenarios. By systematically assessing the impact of switching actions on system economics and reliability, this methodology identifies network configurations that balance operational efficiency with adherence to technical constraints regarding voltage limits, thermal capacities, and system stability. Its applicability spans a range of system sizes, from small distribution networks to large, complex transmission grids, supporting both operational and planning decision-making processes.
A notable strength of the proposed approach is its ability to navigate the combinatorial complexity inherent in large-scale systems. Its step-by-step evaluation, combined with the accuracy of AC power flow solutions, allows exploring multiple contingency scenarios within feasible computational times. Validations conducted on two benchmark systems—a simplified 5-bus network for initial testing and scalability assessment and a comprehensive 3374-bus system—demonstrates its robustness, computational efficiency, and potential for real-time application, e.g., grid reconfiguration, contingency analysis, and operational decision support.
However, despite these advantages, our methodology has certain limitations. As a heuristic approach, it does not guarantee global optimality, particularly in very large or highly interconnected systems, where there may be multiple local optima. In addition, iterative AC power flow calculations, while more accurate than simplified models, can still be computationally demanding, limiting real-time applicability in extremely large networks or scenarios requiring rapid response. Furthermore, the current framework does not explicitly consider the impact of switching costs, equipment wear, or constraints on switching frequency, which are critical factors for practical implementation. Future research should focus on incorporating these operational constraints, improving scalability through hybrid optimization strategies and accounting for uncertainties associated with demand, generation, and contingency scenarios for improved robustness.

1.5. Paper Structure

The remaining sections of this paper are organized as follows. Section 2 presents the OTS problem formulation and describes the proposed heuristic approach. Section 3 details our proposal’s implementation and validation, and it presents an analysis of the results obtained. Finally, Section 4 summarizes the key findings, discusses their practical implications, and outlines future research directions.

2. Methodology

The OTS problem aims to minimize the operating costs of an electrical system through strategic network reconfiguration [23]. Its mathematical formulation is an MINLP problem, as it combines binary variables x i j , which represent the status of the lines, with continuous variables describing the system’s operation (voltages, power flows). The objective function aims to minimize the generation cost C i ( P gen i ) [24] and is subject to nonlinear constraints that ensure a safe operation, such as the power balance and the grid’s operating limits [25]. The complexity of this problem lies in its combinatorial nature, which makes an exhaustive search for solutions computationally intractable in realistically sized systems, posing a significant challenge for direct solution.
To overcome these computational barriers, this research proposes a heuristic methodology that decomposes the problem into more manageable subproblems. Instead of tackling the full MINLP, the strategy systematically evaluates the impact of disconnecting a single transmission line at a time. For each scenario, an AC-OPF is solved, which enables the quantification of the new operating cost while rigorously verifying compliance with all technical constraints. This iterative process was implemented in the MATLAB environment, using the MATPOWER toolbox to efficiently analyze candidate topologies.

2.1. Heuristic Solution Algorithm

The core of this methodology is a heuristic algorithm designed to efficiently navigate the complex solution space of the OTS problem. The procedure systematically evaluates the impact of individually disconnecting each transmission line, following a logical sequence of steps to ensure the technical and economic viability of each action.

2.1.1. Initialization and Base Case

The algorithm begins by loading the studied power system from MATPOWER [26]. It then solves an AC-OPF for the initial configuration (with all lines in service) to establish a benchmark operating cost. This value is crucial since it serves as the basis for all subsequent economic comparisons.

2.1.2. Iterative Simulation and Feasibility Criterion

The main loop iterates through each line in the system. For each line, a topological connectivity check is performed to ensure that its disconnection does not isolate any nodes. If connectivity is maintained, the line’s disconnection is simulated (by setting its status x i j ), and a new AC-OPF is solved using the MIPS solver [27]. An acceptance criterion is then applied: the scenario is considered successful only if the AC-OPF converges to a valid solution and the resulting operating cost is lower than the benchmark. If these conditions are not met, the configuration is discarded.

2.1.3. Consolidation and Optimal Configuration Selection

Once the loop has evaluated all system lines, the algorithm concludes by collecting all successful scenarios. These results are organized in a list in descending order, prioritizing the candidates that offer the greatest operating costs reductions. This final step clearly identifies the optimal network configuration (or a set of the best configurations) found by the heuristic approach.

2.1.4. Objective Function

The primary goal of the OTS problem is to minimize the overall power generation costs across all connected and dispatched thermal units. These costs are directly linked to the energy production expenses associated with each individual generation unit. The formulation of the objective function, along with its detailed components, is presented in Equations (1) and (2).
m i n C T = i = 1 N gen C i ( P gen i )
with
C i ( P gen i ) = a i P gen i 2 + b i P gen i + c i
In these expressions, CT represents the total operating cost of the system. Additionally, Equation (2) details the cost function for each generator, which is a quadratic function of the active power generated ( P g i ). The parameters a i , b i , and c i are the quadratic, linear, and constant cost coefficients for each generator within the set of all generation units ( N gen ).

2.1.5. Problem Constraints

The set of constraints ensures that the system’s operation remains within technical and security limits. Equations (3) and (4) guarantee the active and reactive power balance at each bus i in the set of buses N bus . They state that the net injected power generation P g i , Q g i minus the demand P d i , Q d i must equal the sum of the power flows leaving the bus. These active and reactive power flows ( P i j and Q i j ) for each line in the set N lines are calculated by means of Equations (5) and (6). These nonlinear expressions depend on the voltage magnitudes and angles V i and θ i , the physical properties of the line ( G i j and B i j ), and the binary decision variable x i j , which determines whether a line is in service. Additionally, the model incorporates crucial operating limits: Inequalities (7) and (8) impose the operating ranges for the active and reactive power of each generator in the set N gen ; Equations (10) and (11) detail the active and reactive power transfer limits for a transmission line; Constraint (9) keeps the voltage magnitudes at all buses within a safe operating profile; and Equation (12) defines the binary nature of the decision variable x i j , which takes a value of 1 if the line is connected and 0 if it is not.
P gen i P dem i = j = 1 N bus P i j ( x ) i N bus
Q gen i Q dem i = j = 1 N bus Q i j ( x ) i N bus
P i j ( x ) = V i V j G i j ( x ) cos ( θ i θ j ) + B i j ( x ) sin ( θ i θ j ) ( i , j ) N bus ; i j
Q i j ( x ) = V i V j G i j ( x ) sin ( θ i θ j ) B i j ( x ) cos ( θ i θ j ) ( i , j ) N bus ; i j
P gen i m i n P gen i P gen i m a x i N gen
Q gen i m i n Q gen i Q gen i m a x i N gen
V i min V i V i m a x i N bus
P i j min P i j P i j m a x ( i , j ) N lines ; i j
Q i j min Q i j Q i j m a x ( i , j ) N lines ; i j
x ( i , j ) ( 0 , 1 ) ( i , j ) N lines
Table 2 summarizes all the variables, parameters, and symbols used throughout the mathematical formulation of the optimal transmission switching (OTS) problem. This table provides clear definitions for each element.

2.1.6. Model Characterization

The OTS problem is formulated as a MINLP, wherein the binary variables represent the connection (1) or disconnection (0) of a transmission line and the continuous variables describe the power system’s operation (flows, voltages, and angles). The objective function focuses on minimizing the total generation cost, typically modeled as a sum of quadratic functions for each generator [24]. In addition, power balance constraints, operating limits for the lines and generators, and allowable voltage ranges are enforced to ensure physical feasibility [25].
This approach entails significant combinatorial complexity: as the number of lines and buses grows, the solution space expands exponentially, making an exhaustive search for the optimal solution computationally prohibitive [28]. Furthermore, the equations describing the power flows are nonlinear—they depend on parameters such as conductance and susceptance, as well as on the trigonometric relationships between the nodal voltages and phase angles—, adding yet another layer of difficulty.
To overcome these challenges, this study adopted a heuristic decomposition strategy that iteratively evaluates the economic and technical impact of individually disconnecting each line. For each candidate topology, an AC-OPF is solved, comparing the resulting generation costs and verifying compliance with all operational constraints. This heuristic approach, typically implemented in MATLAB while leveraging specialized libraries like MATPOWER [26,29], makes it possible to identify topological configurations that reduce operating costs while preserving system reliability.

2.2. Solution Strategy

The proposed procedure is implemented in the MATPOWER environment [29], where the power system data (including buses, lines, and generators) are modeled, an AC-OPF is evaluated to verify compliance with technical constraints such as generation limits and voltage ranges. The heuristic strategy begins with all lines in service and establishes a reference cost. Next, it sequentially disconnects each line, and the AC-OPF is used to check for topological feasibility (i.e., ensuring that no generators are left isolated and that the power flow still converges) in order to assess the economic and operational performance of the grid. Only the disconnections that reduce overall costs while preserving a valid system configuration are recorded.
Figure 1 provides a sequential overview of the process, from the loading of the initial data to the identification of the most economically advantageous line configurations:
The workflow proceeds as follows. First, the necessary electrical parameters (impedances, power limits, and generator cost curves) are loaded using MATPOWER’s loadcase function, after which an initial AC-OPF determines the base system cost. Subsequently, each line in the system is examined to ensure that disconnecting it does not create electrical islands or isolate critical nodes. If the system remains connected, x = 0 is assigned to the line k, and a new AC-OPF is run using the MIPS solver [27]. If the solution converges and the operating cost falls below the base below, the configuration is marked as feasible; otherwise, it is disregarded.
Once all lines have been evaluated, the scenarios exhibiting cost reductions are ranked in descending order of savings. This final list highlights which line disconnections offer the greatest economic benefits. Additionally, further technical filtering and post-processing may confirm that no overloads, improper voltage profiles, or other operational issues arise [24,30].
Although this method does not ensure global optimality, in practice, it delivers feasible configurations with notable economic savings and reduced computational overhead when compared to outright solving a large-scale MINLP problem [25]. Thus, it effectively contributes to power system planning and operation by offering a balance between solution quality and computational simplicity.

3. Results and Discussion

The proposed heuristic approach for the OTS problem was validated on two test feeders composed of five and 3374 buses, respectively. The main characteristics of these test feeders, along with the relevant numerical analyses and discussions, are presented in this section.

3.1. Test Feeder Characterization

The proposed methodology was validated using two test systems with differing complexity. The first, a 5-bus system, is suitable for rapid preliminary verifications, whereas the second, with 3374 buses, represents the actual operating conditions of large-scale networks and constitutes a demanding scenario for assessing the robustness and scalability of our approach.
The key characteristics of these feeders are presented below. First, the 5-bus system is analyzed.
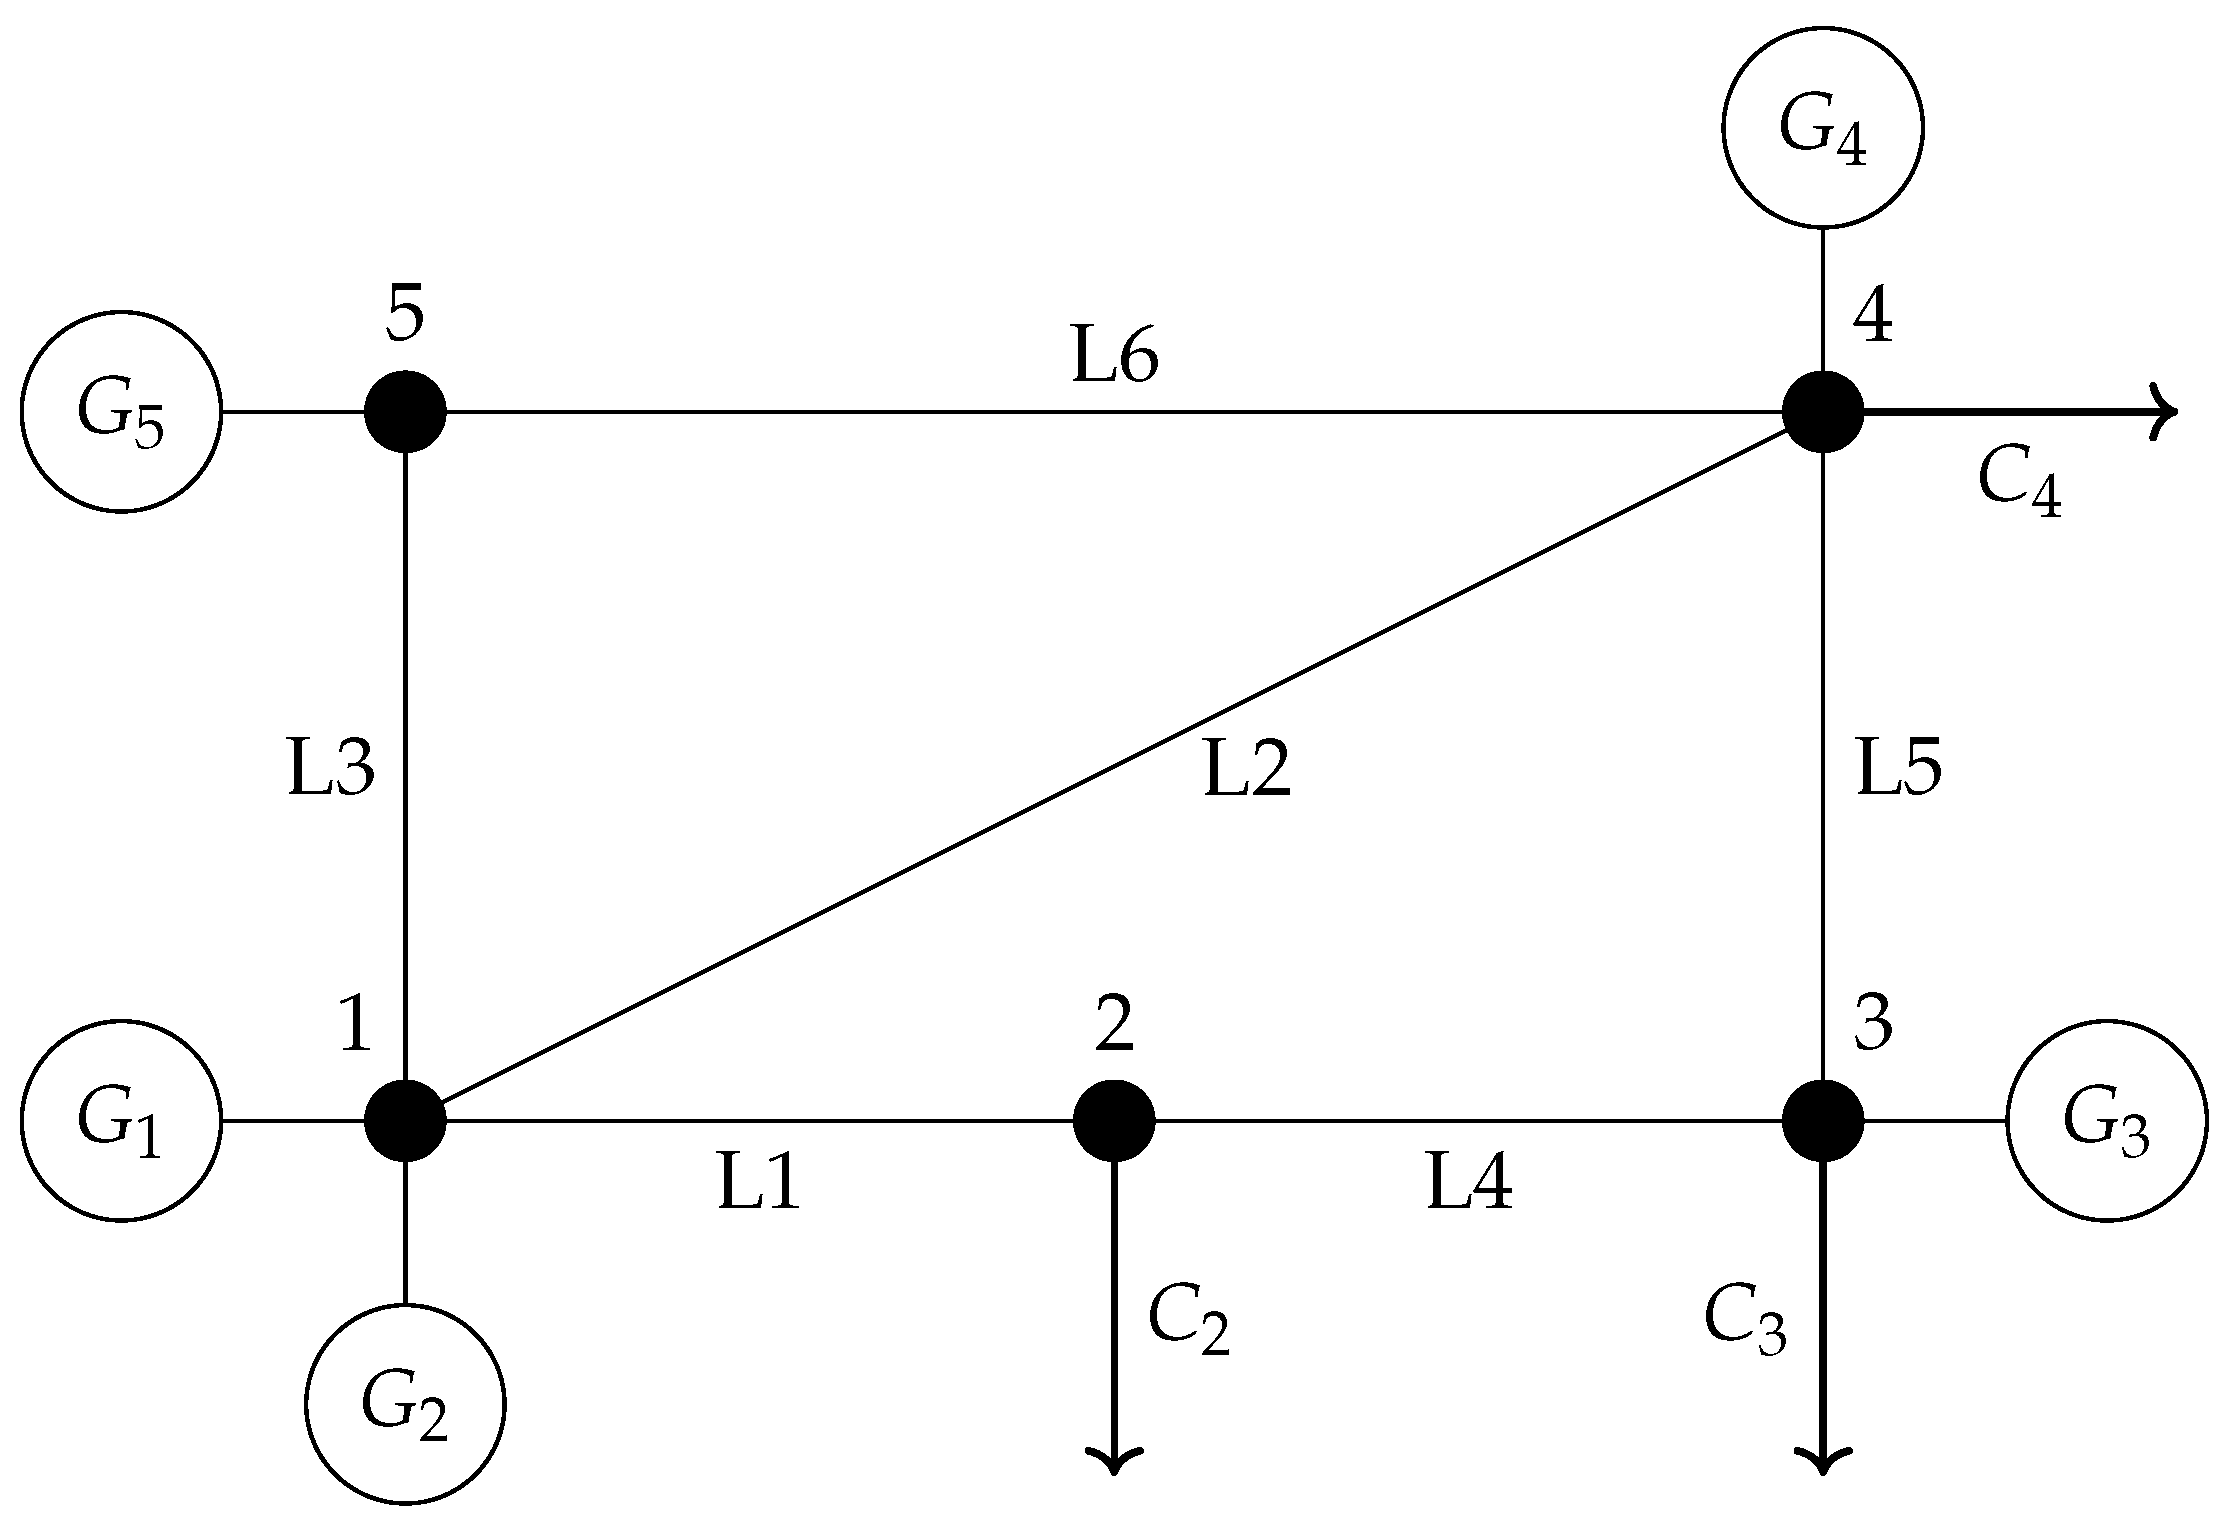
  • This system, depicted in Figure 2, has five nodes arranged in a meshed topology, five DGs, loads at selected nodes, and six transmission lines, enabling the analysis of line switching and optimal power dispatch with reduced computational complexity [31,32].
  • The generation cost scheme is linear, with active and reactive power limits for each unit. Detailed parameters regarding buses, lines, and generators are presented in Table 3, Table 4, and Table 5, respectively.
Below is a brief characterization of the 3374-bus system.
  • With 3374 buses modeled in MATPOWER, this meshed and realistic electrical system integrates 596 generators, 4161 transmission lines, and 2434 loads, ensuring high redundancy and DG availability [33].
  • It features two operating areas that facilitate the analysis of interzonal power flows, constituting a large-scale environment for assessing the methodology’s robustness and scalability. The fundamental parameters are summarized in Table 6.
Further technical details regarding generator cost functions and other related variables for the standardized test cases considered for both feeders in this work can be found in the MATPOWER documentation and related references [34,35]. These resources provide full specifications—including generator types, cost parameters ( a i , b i , c i ), limits, and other relevant variables—since these test systems are widely used for benchmarking and are publicly available for reproduction.
Remark 1.
The evaluated line disconnection scenarios were obtained based on predefined topological and operational screening criteria. These criteria aimed to ensure system feasibility by maintaining network connectivity and avoiding islanded conditions. By limiting the search to these feasible configurations, the methodology effectively reduced computational complexity while exploring the most promising candidate scenarios for cost reduction. Although not all possible line disconnections were examined, this screening approach ensured that the solutions were practical and implementable in real-world systems, focusing on the configurations most likely to yield economic and operational benefits.

3.2. Numerical Validation, Analysis and Discussion Regarding the PJM 5-Bus Test System

In order to assess the influence of line disconnections on both economic and operational performance, a comprehensive analysis was performed on the 5-bus system under four scenarios: reference (no disconnection), disconnection of line 6, disconnection of line 5, and disconnection of line 4. This study evaluated the trade-offs between cost reduction, voltage profile stability, and shifts in power losses, thereby providing a holistic perspective regarding the effects of each contingency.
The operating cost analysis (see Table 7) indicated that disconnecting line 6 yields the most significant reduction (13.61%). This action substantially redistributes generation, bringing about a positive impact on the overall profitability despite an increase in power losses. In contrast, disconnecting lines 5 and 4 entails a smaller cost reduction (13.55% and 5.49%, respectively), which implies a more modest influence on the economic balance.
Regarding the marginal energy prices (see Table 8), disconnecting line 6 raises the minimum price from 10.00 $/MWh to 14.90 $/MWh, and it lowers the maximum price from 39.71 $/MWh to 32.55 $/MWh, indicating a more uniform distribution of generation costs. On the other hand, disconnecting line 5 keeps the minimum price at 10.00 $/MWh but raises the maximum to 40.00 $/MWh, suggesting that cost concentration could become more pronounced in specific nodes.
From an operational standpoint, the voltage profiles (see Table 9) show that disconnecting line 6 promotes system stability by increasing the minimum voltage to 1.088 p.u. and keeping the maximum at 1.100 p.u. While disconnecting line 5 also enhances the minimum voltage (1.082 p.u.), its impact is comparatively smaller. In the case of line 4, the minimum voltage drops to 1.063 p.u., potentially heightening instability risks under more constrained transmission conditions.
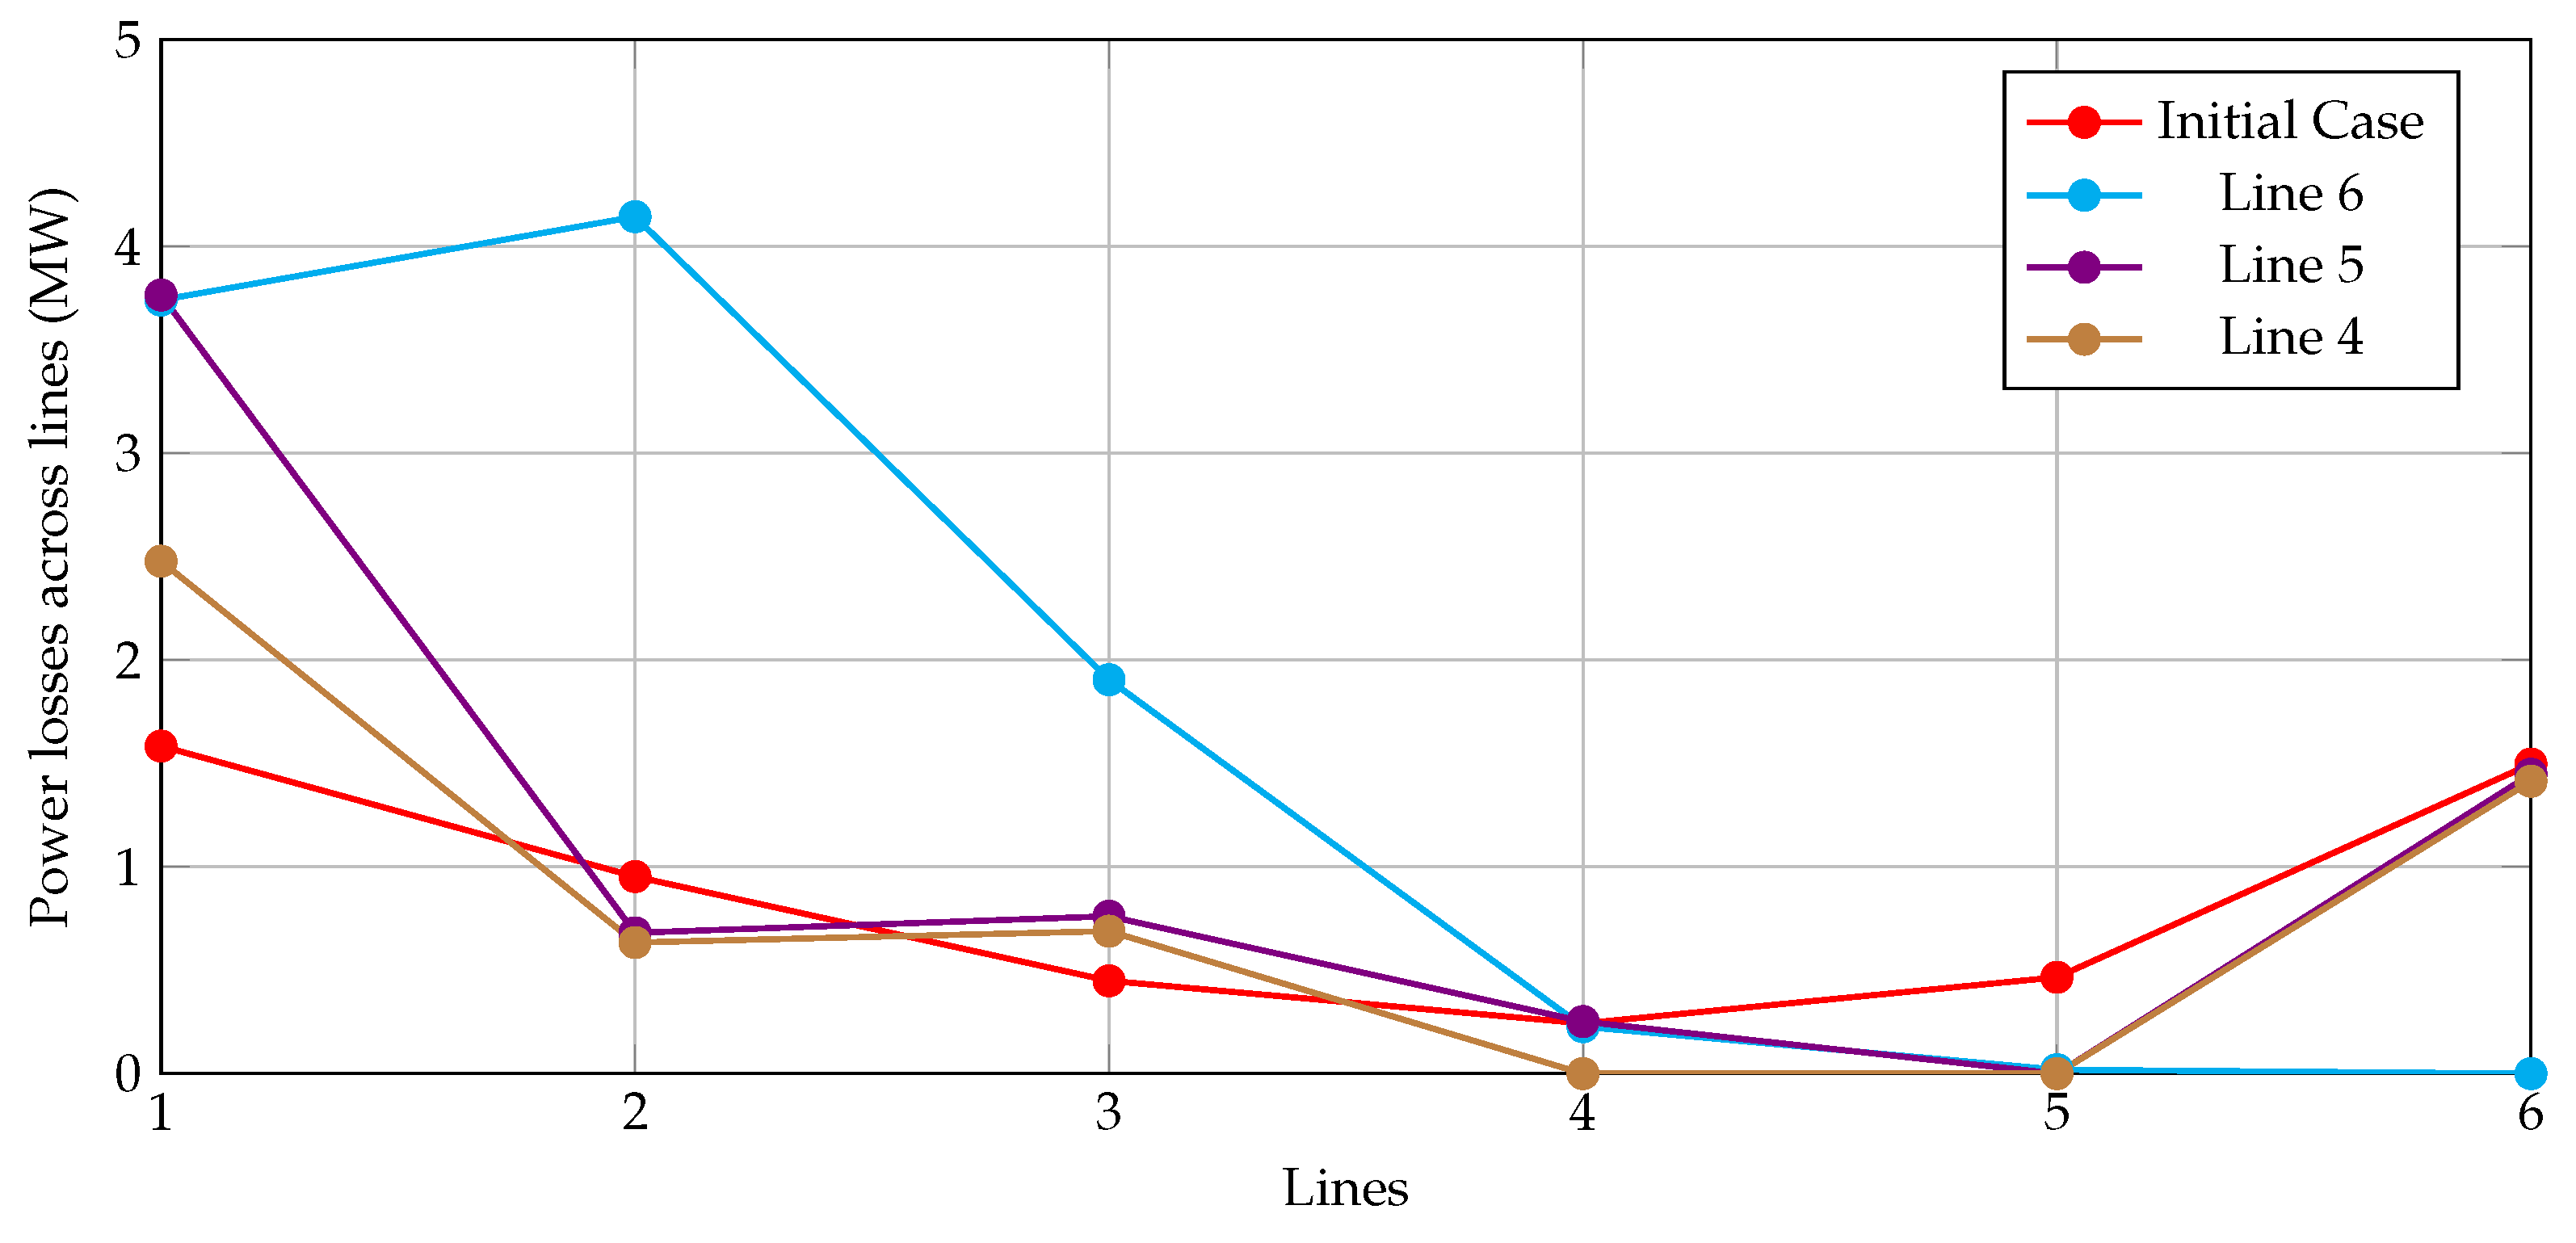
The redistribution of generation and power losses illustrates the effects of these disconnections on the overall system efficiency. According to Table 10, disconnecting line 6 significantly increases the total losses (from 5.19 MW to 10.04 MW), reflecting the higher flows rerouted across the network. Although the losses of other branches also increase (Figure 3), the net benefit in terms of operating costs reduction and voltage profiles offsets these additional losses. On the other hand, the disconnection of lines 5 and 4 leads to more moderate increases in losses (6.91 MW and 5.21 MW, respectively), reiterating the trade-off between cost reduction and system reliability. Overall, these results underscore the need to jointly consider economic, voltage, and transmission constraints when assessing line disconnection scenarios.
The analysis of the 5-bus system revealed that line disconnections significantly affect both the system’s operating costs and key parameters such as the generated power, voltage profiles, and power losses. In particular, disconnecting line 6 stands out as the most efficient option, delivering a notable reduction in operating costs and a more efficient power redistribution despite the increase in losses. Improved voltages and system stability further support the operational benefits of this disconnection. However, it is important to consider practical constraints such as those related to line transmission capacity and voltage, which may affect the feasibility of specific disconnections under more constrained scenarios. Although disconnecting line 6 yields the highest gains, power flow restrictions and the system’s operating conditions must be carefully reviewed in order to avoid potential stability issues and ensure an optimal performance.

3.3. Numerical Validation, Analysis and Discussion Regarding the 3374-Bus Feeder

To assess the influence of line disconnections on both economic and operational performance within a large-scale environment, a comprehensive analysis was performed on the 3374-bus system under eight scenarios: reference (no disconnection) and the disconnection of lines 1116, 1083, 834, 813, 812, 3520, and 1075. This study evaluated the trade-offs between cost reduction, voltage profile stability, marginal price variations, and shifts in power losses, providing a holistic perspective of the effects of each contingency on an extensive power grid.
From an economic standpoint, the results regarding cost reductions (see Table 11) highlight the disconnection of line 1116 as the most effective measure, yielding a 0.0729% decrease. Although such a percentage appears minor, it represents savings on the order of thousands of dollars per hour, which becomes significant over extended periods. Lines 1083, 834, and 813 also offer reductions in the same order of magnitude, highlighting that small-scale improvements in a large network can have substantial financial benefits.
The marginal price analysis (see Table 12) revealed notable shifts in the network’s pricing structure following certain line disconnections. Some of these reduced the maximum price from 466.57 $/MWh to values near 340 $/MWh, while others drove it up to 811.60 $/MWh, illustrating the potential concentration of costs in specific areas of the grid. In addition, the minimal price can shift from negative or near-zero values to 0.00 $/MWh, indicating enhanced uniformity in cost allocation for particular disconnection scenarios.
Voltage profiles and phase angles (see Table 13) experience only minor variations when individual lines are disconnected, demonstrating the robustness of the 3374-bus system. Although there are small deviations in the minimum and maximum angles appear (e.g., from −37.07° to approximately −35.6°), these shifts do not compromise voltage support or the overall angular stability, suggesting that most of the system retains a sufficient reactive power and line capacity to handle these contingencies.
The total active power generation, demand, and associated losses (see Table 14) show that the line disconnections produce modest changes, generally reducing generation and losses by a few MW. For instance, disconnecting line 1116 causes the losses to drop from 830.26 MW to 815.08 MW. This improvement, although proportionally small, suggests an enhanced dispatch configuration that capitalizes on the downstream load distribution and the rebalancing of flows. Consequently, the overall network maintains resilience and can achieve marginal yet valuable efficiency gains by selectively disconnecting lines with minimal adverse effects on stability.
This detailed analysis of the 5- and 3374-bus systems provided a comprehensive understanding of how line disconnections affect both the operational and economic performance of electrical networks at differing scales and levels of complexity. Each test system offered valuable insights into the way in which disconnections influence operating costs, marginal prices, voltage profiles, phase angles, generation distribution, and active power losses. These evaluations further highlight how efficient optimization and redistribution strategies can enhance the stability and operating efficiency of power systems regardless of their size. In the 5-bus system, cost reductions stem largely from redistributing power generation, as the line losses did not decrease. Meanwhile, in the 3374-bus system, both losses and costs underwent reductions through redistribution and optimization.
When comparing these cases, although the fractional decreases in costs and losses may seem small in large-scale networks like the 3374-bus system, the absolute savings become considerable due to the scale of the operation. The marginal price variations also suggest that smaller systems tend to exhibit more controlled changes, whereas larger grids may experience a greater price dispersion due to increased network complexity. Overall, these analyses underscore the importance of identifying critical lines and applying suitable optimization strategies to enhance system efficiency and stability, thereby facilitating an improved planning and operation of modern electrical networks. This approach not only enables significant operating cost savings; it also facilitates better resource management and higher reliability in power system operation.

4. Conclusions

This research developed and validated a methodology for optimal transmission switching in power systems, which was aimed at reducing operating costs through a heuristic strategy and advanced simulation tools such as MATPOWER and the MIPS solver. The results obtained for the 5- and 3374-bus test systems confirm the effectiveness of our proposal, demonstrating significant reductions in operating costs and improvements in the system’s key parameters. This methodology made it possible to identify network configurations that optimize generation dispatch and enhance operational efficiency.
This study demonstrated that the OTS methodology is effective for cutting operating costs in power systems of different scales. In the 5-bus system, disconnecting line 6 led to a substantial 13.61% cost reduction, underscoring the method’s ability to pinpoint lines whose disconnection optimizes expenses. In the 3374-bus system, disconnecting line 1116 delivered the largest cost reduction (0.0729%), which constitutes considerable absolute savings due to the system’s size. These results validate the effectiveness of the proposed methodology and its applicability in electrical networks of diverse complexity and scale.
Disconnecting specific lines affects the voltage profiles and phase angles of various nodes in the system, which exhibit variations related to the network’s size. In the 5-bus system, disconnecting line 6 improved the voltage profile across all nodes, particularly at critical ones such as node 4. In the 3374-bus system, the analyzed cases indicated minimal impacts on operating parameters, indicating the grid’s high stability and robustness in the face of line disconnections. These findings further validate the method’s ability to preserve operational stability and enhance system efficiency.
Our proposal allowed for a more efficient power redistribution in the test systems, thereby improving resource utilization. In the 5-bus system, disconnecting line 6 led to a significant increase in generation at node 5. In the 3374-bus system, disconnecting specific lines gave way to a redistribution that bolstered the system’s operating efficiency, reflecting the network’s capacity to maintain a balanced load allocation and minimize active power losses. These outcomes highlight the effectiveness of the proposed approach in optimizing power generation and distribution for a broad range of networks.
Although disconnecting certain lines elevated power losses in other parts of the network, the operational benefits and cost reductions outweighed these losses. In the 5-bus system, disconnecting line 6 increased power losses, but the redistribution of generation improved the overall system efficiency. In the 3374-bus feeder, disconnecting particular lines introduced slight decreases in the total generated power, as well as in total active power losses, implying enhanced efficiency. These results show that, even when losses increase, the proposed methodology can successfully optimize the system’s efficiency and reduce costs in electrical networks of different scales and complexity.
Future work could explore the application of this methodology to larger and more complex power grids under diverse operating scenarios, including the integration of renewable energy sources in order to analyze their impact on system stability and voltage regulation. Additionally, incorporating stability constraints related to voltage profiles and frequency response into the optimization process would provide a more comprehensive assessment of the system’s operational security. Employing predictive demand curves and dynamic system modeling could also enable periodic OTS adjustments in response to demand fluctuations and contingencies. Further research could develop more advanced and efficient algorithms, potentially leveraging machine learning and predictive analytics for handling large-scale systems, improving the identification of economically optimal configurations, and proactively forecasting potential stability issues. Lastly, comprehensive economic analyses should be conducted to evaluate the long-term operating and maintenance costs associated with line switching, ensuring the practical and sustainable implementation of this methodology in real-world transmission networks.

Author Contributions

Conceptualization, methodology, software, and writing (review and editing): J.C.V.-Z., M.A.Á.-A., O.D.M., J.M.S.-C. and D.A.G.-R. All authors have read and agreed to the published version of the manuscript.

Funding

The authors acknowledge the support provided by Thematic Network 723RT0150, i.e., Red para la integración a gran escala de energías renovables en sistemas eléctricos (RIBIERSE-CYTED), funded through the 2022 call for thematic networks of the CYTED (Ibero-American Program of Science and Technology for Development).

Data Availability Statement

The original contributions presented in this study are included in the article. Further inquiries may be directed to the corresponding author.

Acknowledgments

The authors acknowledge the use of AI-based tools, including ChatGPT developed by OpenAI, which supported the refinement of the manuscript’s structure, language, and clarity. These tools were employed solely to enhance the presentation of the authors’ original ideas, formulations, and numerical simulations, without altering the scientific content or integrity of the work.

Conflicts of Interest

The authors declare no conflicts of interest.

References

  1. Rashid, M.H.; Abed, N.Y.; Hussien, Z.F.; Rahim, A.A.; Abdullah, N. Electric Power System. In Power Electronics Handbook, 5th ed.; Butterworth-Heinemann: Oxford, UK, 2024; pp. 845–863. [Google Scholar] [CrossRef]
  2. Zhang, N.; Yan, J.; Hu, C.; Sun, Q.; Yang, L.; Gao, D.W.; Guerrero, J.M.; Li, Y. Price-Matching-Based Regional Energy Market With Hierarchical Reinforcement Learning Algorithm. IEEE Trans. Ind. Inform. 2024, 20, 11103–11114. [Google Scholar] [CrossRef]
  3. Patrick, D.R.; Fardo, S.W.; Fardo, B.W. Electrical Power Systems Technology; River Publishers: New York, NY, USA, 2022. [Google Scholar] [CrossRef]
  4. Vo, D.H.; Vo, A.T.; Ho, C.M. Urbanization and renewable energy consumption in the emerging ASEAN markets: A comparison between short and long-run effects. Heliyon 2024, 10, e30243. [Google Scholar] [CrossRef] [PubMed]
  5. El-Sayed, E.I.; Al-Gazzar, M.M.; Seif, M.S.; Soliman, A.M.A. Energy management of renewable energy sources incorporating with energy storage device. Int. J. Power Electron. Drive Syst. 2022, 13, 883–899. [Google Scholar] [CrossRef]
  6. Paul, B.; Sarker, A.; Abhi, S.H.; Das, S.K.; Ali, M.F.; Islam, M.M.; Islam, M.R.; Moyeen, S.I.; Rahman Badal, M.F.; Ahamed, M.H.; et al. Potential smart grid vulnerabilities to cyber attacks: Current threats and existing mitigation strategies. Heliyon 2024, 10, e37980. [Google Scholar] [CrossRef]
  7. Moran, L.; Espinoza, J.; Burgos, R. Voltage regulation in mine power distribution systems: Problems and solutions. In Proceedings of the 2014 IEEE Industry Application Society Annual Meeting, IAS 2014, Vancouver, BC, Canada, 5–9 October 2014. [Google Scholar] [CrossRef]
  8. Atul, D.; Singh, M. A Brief Review For Power Quality Problems Evaluation, Reliability, Concerns And Various Mitigation. Int. Sci. J. Eng. Manag. 2024, 3, 1–7. [Google Scholar] [CrossRef]
  9. Bosupally, D.; Muniyamuthu, V.; Muktevi, C. Congestion Management of Power Systems by Optimal Allocation of FACTS devices using Hybrid Techniques. Int. J. Electr. Electron. Res. 2023, 11, 299–307. [Google Scholar] [CrossRef]
  10. Hasan, M.M.; Chen, X.C. Business strategies and carbon emissions. Energy Econ. 2025, 141, 108092. [Google Scholar] [CrossRef]
  11. Mousavi, R.; Mousavi, A.; Mousavi, Y.; Tavasoli, M.; Arab, A.; Kucukdemiral, I.B.; Alfi, A.; Fekih, A. Revolutionizing solar energy resources: The central role of generative AI in elevating system sustainability and efficiency. Appl. Energy 2025, 382, 125296. [Google Scholar] [CrossRef]
  12. Lu, W.M.; Le, T.T. From Technology to Strategy: The Evolving Role of Smart Grids and Microgrids in Sustainable Energy Management. Energies 2025, 18, 4609. [Google Scholar] [CrossRef]
  13. Yadav, A.K.; Mahajan, V. Transmission line switching for loss reduction and reliability improvement. In Proceedings of the 2019 International Conference on Information and Communications Technology, ICOIACT 2019, Yogyakarta, Indonesia, 24–25 July 2019; pp. 794–799. [Google Scholar] [CrossRef]
  14. Andrés, P.; Almeida, M.; Francisco, D.; Galarza, C. Estado del Arte de conmutación de líneas de transmisión con análisis de contingencias. Rev. I+D Tecnol. 2019, 15, 98–106. (In Spanish) [Google Scholar] [CrossRef]
  15. Agarwal, A.; Pandey, A.; Pileggi, L. Continuous Switch Model and Heuristics for Mixed-Integer Nonlinear Problems in Power Systems. IEEE Trans. Power Syst. 2024, 39, 5780–5791. [Google Scholar] [CrossRef]
  16. Khanabadi, M.; Ghasemi, H. Transmission congestion management through optimal transmission switching. In Proceedings of the 2011 IEEE Power and Energy Society General Meeting, Detroit, MI, USA, 24–28 July 2011. [Google Scholar] [CrossRef]
  17. Numan, M.; Abbas, M.F.; Yousif, M.; Ghoneim, S.S.; Mohammad, A.; Noorwali, A. The Role of Optimal Transmission Switching in Enhancing Grid Flexibility: A Review. IEEE Access 2023, 11, 32437–32463. [Google Scholar] [CrossRef]
  18. Fisher, E.B.; O’Neill, R.P.; Ferris, M.C. Optimal transmission switching. IEEE Trans. Power Syst. 2008, 23, 1346–1355. [Google Scholar] [CrossRef]
  19. Tabatabaei Khorram, S.A.; Fotuhi-Firuzabad, M.; Safdarian, A. Optimal transmission switching as a remedial action to enhance power system reliability. In Proceedings of the 2016 Smart Grids Conference, SGC 2016, Kerman, Iran, 20–21 December 2016; pp. 7–12. [Google Scholar] [CrossRef]
  20. Jagadeesan Nair, V. Optimal Transmission Switching and Grid Reconfiguration for Transmission Systems via Convex Relaxations. Electricity 2025, 6, 37. [Google Scholar] [CrossRef]
  21. Zhang, M.; Wang, L.; Liu, J.; Deng, X.; Wu, K. Multi-Period Optimal Transmission Switching with Voltage Stability and Security Constraints by the Minimum Number of Actions. Sustainability 2024, 16, 8272. [Google Scholar] [CrossRef]
  22. Masache, P.; Carrión, D.; Cárdenas, J. Optimal Transmission Line Switching to Improve the Reliability of the Power System Considering AC Power Flows. Energies 2021, 14, 3281. [Google Scholar] [CrossRef]
  23. Toctaquiza, J.; Carrión, D.; Jaramillo, M. An Electrical Power System Reconfiguration Model Based on Optimal Transmission Switching under Scenarios of Intentional Attacks. Energies 2023, 16, 2879. [Google Scholar] [CrossRef]
  24. Díaz González, C. Economic Load Dispatch in an Electric Power System: Modeling, Simulation, and Analysis. Master’s Thesis, University of Oviedo, Oviedo, Spain, June 2017. (In Spanish). [Google Scholar]
  25. Capitanescu, F.; Wehenkel, L. An AC OPF-based heuristic algorithm for optimal transmission switching. In Proceedings of the 2014 Power Systems Computation Conference, Wroclaw, Poland, 18–22 August 2014. [Google Scholar] [CrossRef]
  26. Zimmerman, R.D.; Murillo-Sánchez, C.E.; Thomas, R.J. MATPOWER’s extensible optimal power flow architecture. In Proceedings of the 2009 IEEE Power and Energy Society General Meeting, Calgary, AB, Canada, 26–30 July 2009. [Google Scholar] [CrossRef]
  27. Wang, H.; Murillo-Sánchez, C.E.; Zimmerman, R.D.; Thomas, R.J. On computational issues of market-based optimal power flow. IEEE Trans. Power Syst. 2007, 22, 1185–1193. [Google Scholar] [CrossRef]
  28. Agarwal, A.; Pandey, A.; Pillegi, L. Continuous Switch Model and Heuristics for Mixed-Integer Problems in Power Systems. arXiv 2022, arXiv:2206.14510. [Google Scholar] [CrossRef]
  29. Zimmerman, R.D.; Murillo-Sánchez, C.E.; Thomas, R.J. MATPOWER: Steady-state operations, planning, and analysis tools for power systems research and education. IEEE Trans. Power Syst. 2011, 26, 12–19. [Google Scholar] [CrossRef]
  30. Oviedo, M.; Rios, D.; Baum, G.; Blanco, G. Optimal Transmission Switching for cost reduction in the Interconnected System of Paraguay. In Proceedings of the 2020 IEEE Congreso Bienal de Argentina, Resistencia, Argentina, 1–4 December 2020. [Google Scholar] [CrossRef]
  31. Fang, X.; Li, F.; Wei, Y.; Cui, H. Strategic scheduling of energy storage for load serving entities in locational marginal pricing market. IET Gener. Transm. Distrib. 2016, 10, 1258–1267. [Google Scholar] [CrossRef]
  32. Li, F.; Bo, R. Small test systems for power system economic studies. In Proceedings of the IEEE PES General Meeting, Minneapolis, MN, USA, 25–29 July 2010. [Google Scholar] [CrossRef]
  33. Fattahi, S.; Lavaei, J.; Atamturk, A. A bound strengthening method for optimal transmission switching in power systems. IEEE Trans. Power Syst. 2019, 34, 280–291. [Google Scholar] [CrossRef]
  34. Matpower. Description of case3375wp. 2025. Available online: https://matpower.org/docs/ref/matpower5.0/case3375wp.html (accessed on 3 July 2024).
  35. Matpower. Description of case5. 2025. Available online: https://matpower.org/docs/ref/matpower5.0/case5.html (accessed on 9 November 2024).
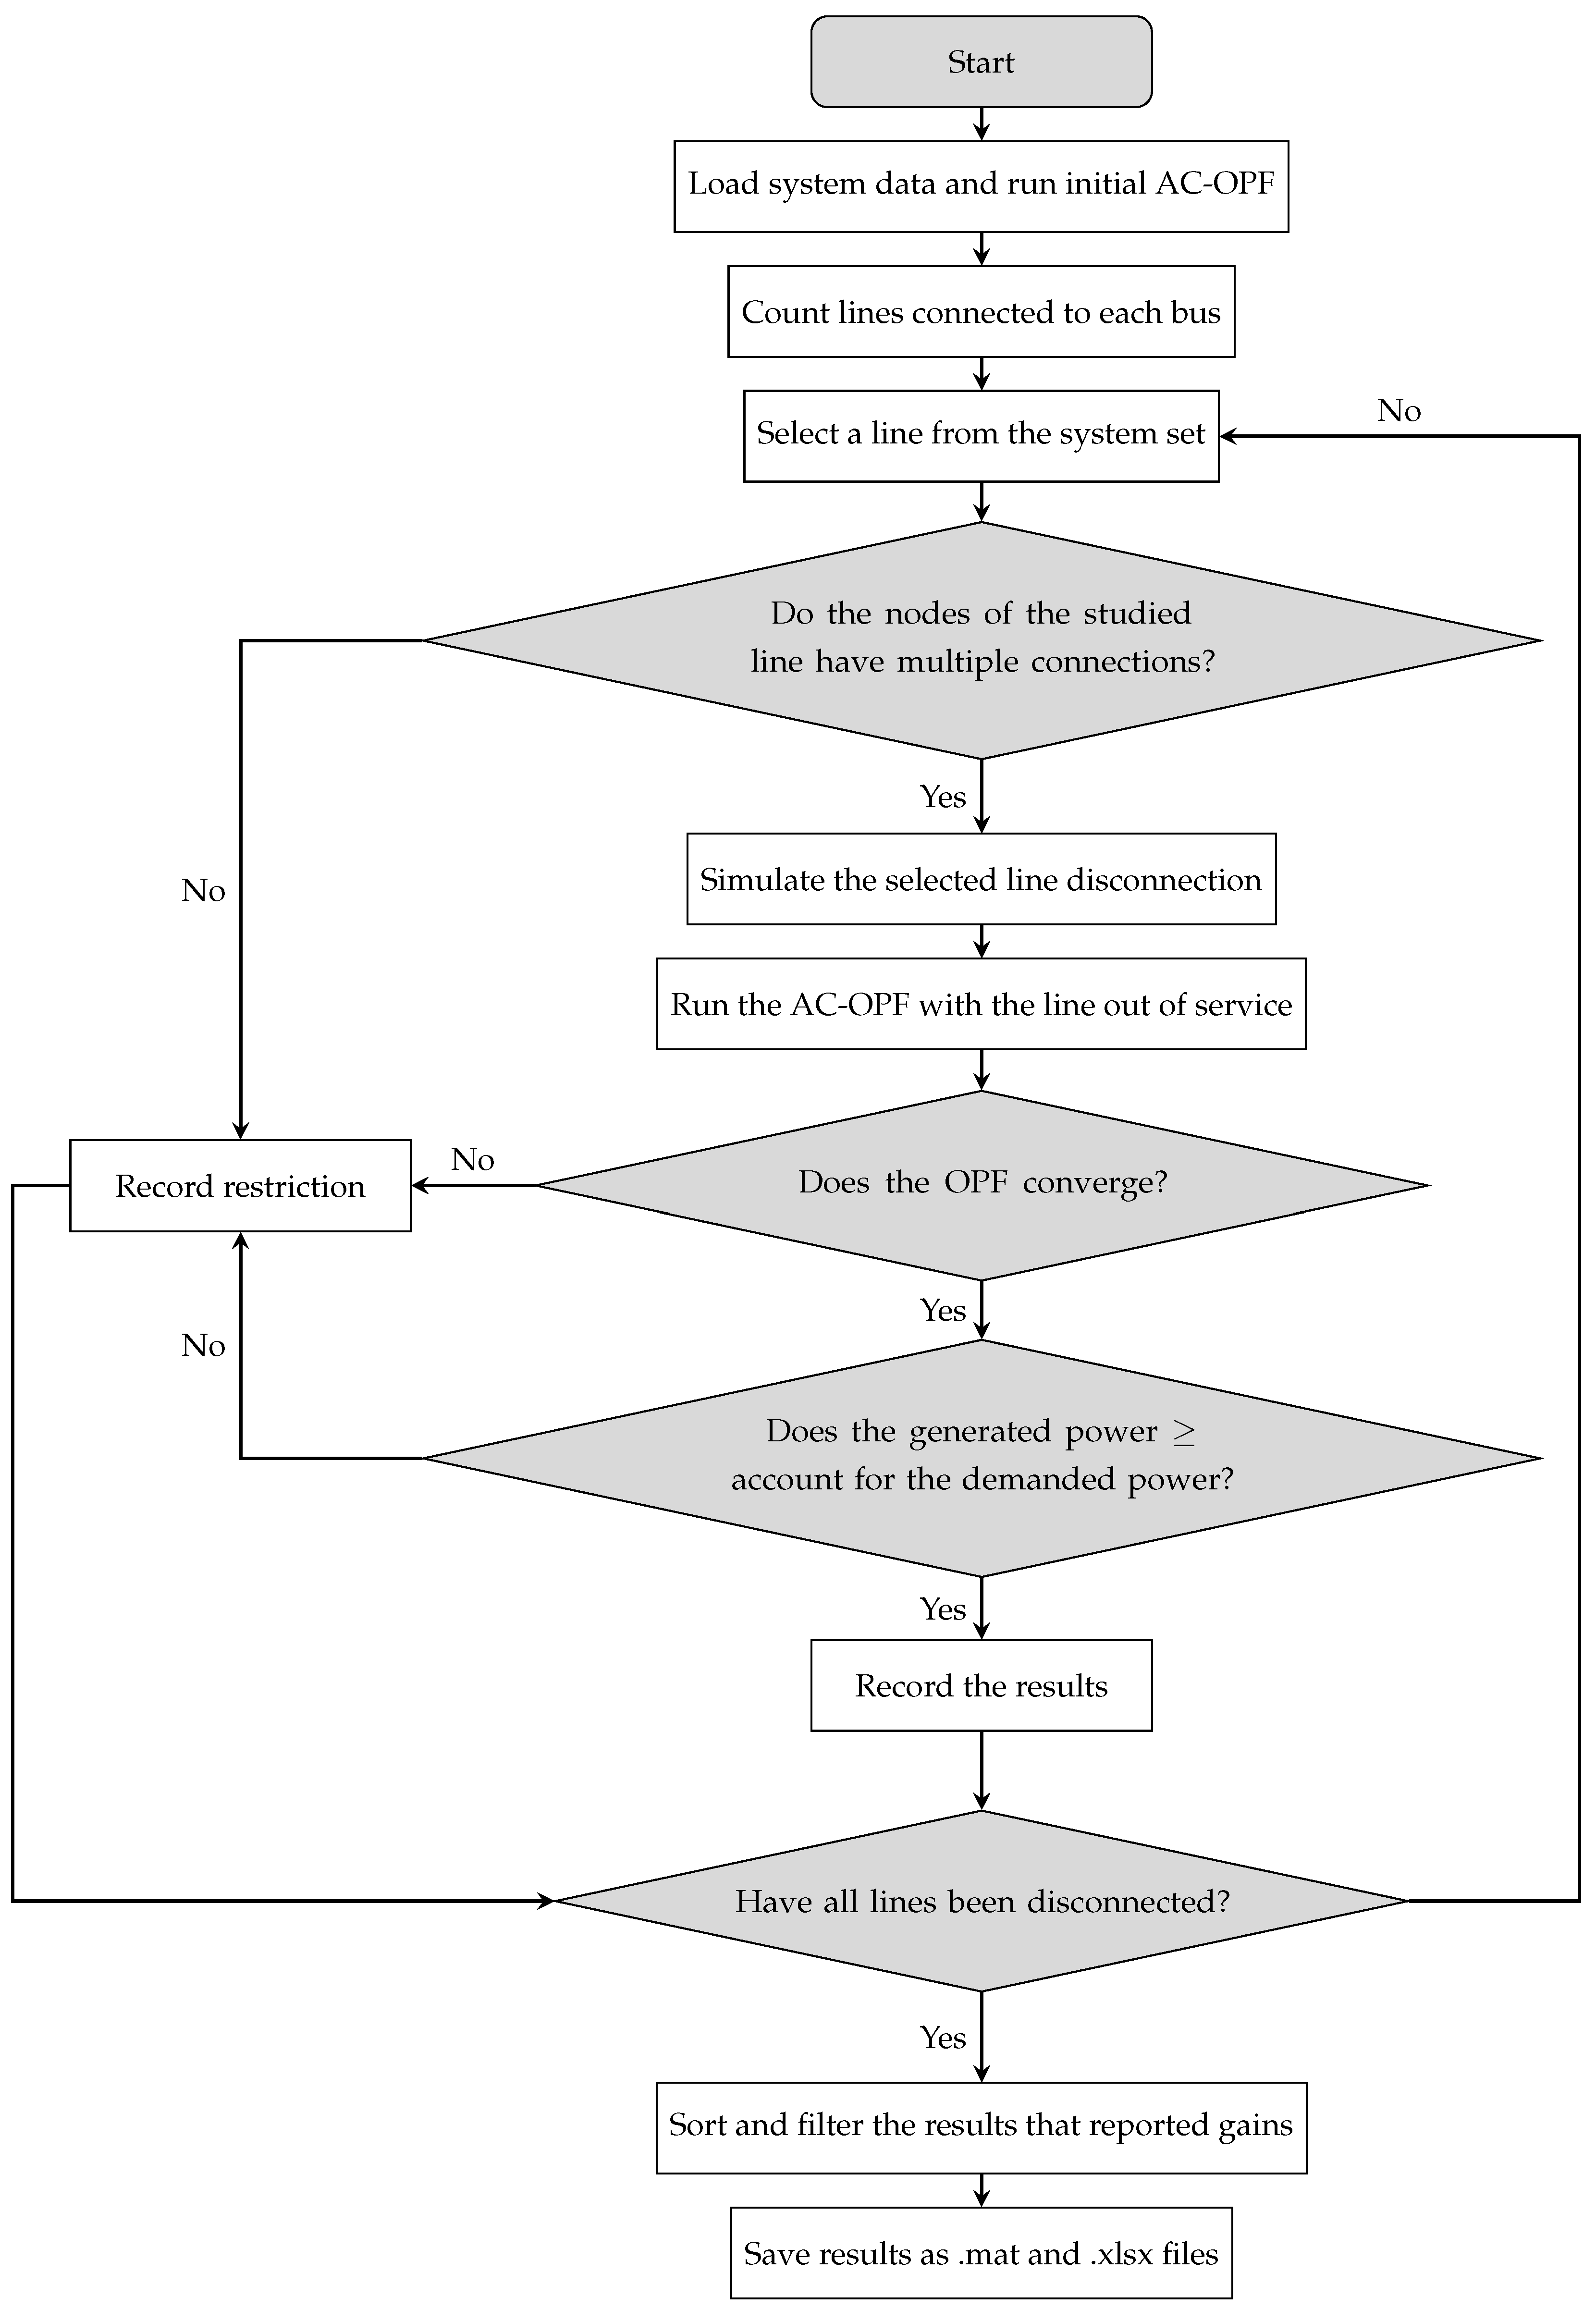
Figure 1. Proposed solution methodology for the OTS problem.
Sci 07 00141 g001
Figure 2. PJM 5-bus test system diagram. Line numbers are indicated as L:1–L:6.
Sci 07 00141 g002
Figure 3. Power losses analysis in the lines of the 5-bus system.
Sci 07 00141 g003
Table 1. Summary of selected OTS approaches and their application in the literature.
Ref.Proposed MethodologyTest SystemObjective Function
[13]Transmission line switching for losses reduction and reliability improvementIEEE 24-busMinimizing active power losses and improving reliability
[14]OTS as DC-OPF with binary variables, MILPIEEE 5-bus, 14-busMinimizing total generation costs
[13]OTS for enhancing transmission system reliabilityIEEE 24-busMinimizing unserved demand and loss of load probability
[18]MILP model based on DC-OPF for topology and dispatch optimizationIEEE 118-busMinimizing generation dispatch cost
[20]OTS and grid reconfiguration via convex relaxations (SOCP, MISOCP), comparing DC, AC, and convexified OPF against novel relaxations for realistic grid physicsIEEE 9-bus, 39-bus, 118-busMinimizing generation costs, losses, and system congestion (locational marginal prices) with improved feasibility and computational efficiency
[21]Multi-period OTS with voltage stability and security constraints; two-stage solution (prescreening + MILP/NLP rolling horizon)IEEE 118-bus, 662-busMinimizing the number of switching actions while ensuring voltage stability and security margins over multiple periods
[22]OTS considering AC power flows, reliability and contingency analysis (N-1, N-2, N-3), loadability and ranking; formulated as a MINLP with an AC-OPFEcuador, 230 kV systemMinimizing total generation cost and ensuring reliability/security under multiple contingencies and operating limits
[23]OTS-based reconfiguration in the face of intentional attacks using a DC-OPF; contingency ranking and index analysis for vulnerability and mitigation; topology reconfiguration to optimize securityIEEE 30-busMinimizing generation cost and maintaining reliability/security when facing intentional attacks (N-1), reducing line overload and angle deviation after contingencies
Table 2. Variables and parameters.
SymbolDefinitionSymbolDefinition
C T Total operating cost ($/h) C i Generator i cost ($/MWh)
a i Quadratic cost coeff. ($/MWh2) b i Linear cost coeff. ($/MWh)
c i Constant cost coeff. ($/h) P g e n i Active power by gen i (MW)
P gen i max Max. active power gen i (MW) P gen i min Min. active power gen i (MW)
Q g e n i Reactive power gen i (Mvar) Q gen i max Max. reactive power gen i (Mvar)
Q gen i min Min. reactive power gen i (Mvar) P d e m i Demand at node i (MW)
Q d e m i Reactive demand at node i (Mvar) P i j Active power i-j (MW)
Q i j Reactive power i-j (Mvar) P i j max Max. active power i-j (MW)
P i j min Min. active power i-j (MW) Q i j max Max. reactive power i-j (Mvar)
Q i j min Min. reactive power i-j (Mvar) N g e n Number of generators
N b u s Number of buses N l i n e s Number of transmission lines
xBinary matrix for line status G i j Line conductance ( Ω )
B i j Line susceptance ( Ω 1 ) θ i Voltage angle node i (°)
θ j Voltage angle node j (°) θ m i n Min. system voltage angle (°)
θ m a x Max. system voltage angle (°) V i Voltage at node i (V)
V j Voltage at node j (V) V i max Max. voltage at node i (V)
V i min Min. voltage at node i (V) V m a x Max. system voltage (V)
V m i n Min. system voltage (V)
Table 3. Nodal parameters for the 5-bus test system.
Node P gen (MW) Q gen (Mvar) P dem (MW) Q dem (Mvar) V max (p.u) V min (p.u)
12100001.10.9
20030098.611.10.9
3323.49030098.611.10.9
400400131.471.10.9
5466.51000.006741.10.9
Table 4. Line parameters of the 5-node test system.
LineNode iNode j R ij   ( Ω ) X ij   ( Ω ) B ij  ( Ω 1 )
L1120.002810.02810.00712
L2140.003040.03040.00658
L3150.000640.00640.03126
L4230.001080.01080.01852
L5340.002970.02970.00674
L6450.002970.02970.00674
Table 5. Generation parameters of the 5-bus test system.
Generator iCost ($/MWh)P Limit (MW)Q Limit (Mvar)
11440±30
215170±127.5
330520±390
440200±150
510600±450
Table 6. Parameters of the 3374-bus test system.
ComponentDescription
Number of buses3374
Number of generators596
Number of lines4161
Number of transformers383
Number of loads2434
Number of areas2
Total generation capacity71,095.0 MW
Actual generated active power in the reference case49,193.3 MW
Actual generated reactive power in the reference case10,800.7 Mvar
Total active power demand48,363.0 MW
Total reactive power demand19,527.4 Mvar
Table 7. Impact of line disconnections on the costs of the 5-bus system.
LineNode iNode jFinal Cost
($/h)
Cost Reduction ($/h)Cost Reduction
(%)
Reference case--17,551.89--
Line 64515,163.032388.8613.61
Line 53415,174.032377.8613.55
Line 42316,587.95963.945.49
Table 8. Impact of line disconnections on the marginal prices of the 5-bus system.
Line λ P min ($/MWh) λ P max ($/MWh)
Reference case10.0039.71
Line 614.9032.55
Line 510.0040.00
Line 411.8230.00
Table 9. Impact of line disconnection on the operating parameters of the 5-bus system.
Line V min (p.u.) V max (p.u.) θ min (°) θ max (°)
Reference case1.0641.100−0.733.59
Line 61.0881.100−0.057.73
Line 51.0821.100−3.653.47
Line 41.0631.100−1.713.39
Table 10. Impact of line disconnections on power in the 5-bus system.
LineGenerated Power (MW)Demanded Power (MW)Final Power Losses (MW)
Reference case1005.191000.005.19
Line 61010.041000.0010.04
Line 51006.911000.006.91
Line 41005.211000.005.21
Table 11. Impact of line disconnections on the costs of the 3374-bus system.
LineNode iNode jFinal Cost
($/h)
Cost
Reduction
($/h)
Cost
Reduction (%)
Reference case--7,412,072.20--
Line 11166656577,406,667.605404.600.0729
Line 10836786657,407,373.664698.540.0634
Line 834498307,407,522.444549.760.0614
Line 813425107,407,935.384136.820.0558
Line 8121087,408,422.473649.730.0492
Line 3520987,408,473.043599.160.0485
Line 10756914397,408,658.213413.990.0461
Table 12. Impact of line disconnections on the marginal prices of the 3374-bus system.
Line λ P min ($/MWh) λ P max ($/MWh)
Reference case−0.02466.57
Line 11160.00338.97
Line 1083−0.02417.03
Line 8340.00340.89
Line 8130.00359.59
Line 8120.00811.60
Line 35200.00473.84
Line 1075−0.02485.39
Table 13. Impact of line disconnections on the operating parameters of the 3374-bus system.
Line V min (p.u.) V max (p.u.) θ min (°) θ max (°)
Reference case0.9421.120−37.073.17
Line 11160.9421.120−35.683.16
Line 10830.9421.120−37.023.17
Line 8340.9421.120−35.723.16
Line 8130.9421.120−35.703.18
Line 8120.9421.120−35.623.17
Line 35200.9421.120−35.673.19
Line 10750.9421.120−36.983.16
Table 14. Impact of line disconnections on power in the 3374-bus system.
LineTotal Generated Power
(MW)
Total Demanded Power
(MW)
Total Active Power Losses
(MW)
Reference case49,193.348,363830.26
Line 111649,178.148,363815.08
Line 108349,192.648,363829.62
Line 83449,179.448,363816.37
Line 81349,183.948,363820.92
Line 81249,179.948,363816.86
Line 352049,190.148,363827.13
Line 107549,192.748,363829.69
Disclaimer/Publisher’s Note: The statements, opinions and data contained in all publications are solely those of the individual author(s) and contributor(s) and not of MDPI and/or the editor(s). MDPI and/or the editor(s) disclaim responsibility for any injury to people or property resulting from any ideas, methods, instructions or products referred to in the content.