Abstract
The proliferation of social network data has unlocked unprecedented opportunities for extensive, data-driven exploration of human behavior. The structural intricacies of social networks offer insights into various computational social science issues, particularly concerning social influence and information diffusion. However, modeling large-scale social network data comes with computational challenges. Though large language models make it easier than ever to model textual content, any advanced network representation method struggles with scalability and efficient deployment to out-of-sample users. In response, we introduce a novel approach tailored for modeling social network data in user-detection tasks. This innovative method integrates localized social network interactions with the capabilities of large language models. Operating under the premise of social network homophily, which posits that socially connected users share similarities, our approach is designed with scalability and inductive capabilities in mind, avoiding the need for full-graph training. We conduct a thorough evaluation of our method across seven real-world social network datasets, spanning a diverse range of topics and detection tasks, showcasing its applicability to advance research in computational social science.
1. Introduction
The surge in popularity of social media over recent decades has provided computational social scientists with an exciting avenue for empirical data-driven mining of human behavior [1,2]. Leveraging social network data has enabled the tracking of mass sentiment, health trends, political polarization, the spread of mis/disinformation, social influence, behavior contagion, and information diffusion, all at an unprecedented scale. Social network data comprises two crucial elements: content—what people share—and network—who, when, and how frequently users interact with each other. The text-based content aspect of social network data has become more manageable due to recent advancements in large language models (LLMs). However, effectively handling the network element requires methods such as graph representation learning, which often struggle to scale up to large social network data [3,4]. While powerful graph embedding methods can capture global network structures and higher-order proximities, they often require substantial computational resources, extensive training time, and elevated hardware requirements that may not justify marginal performance gains on large but sparse real-world social network datasets.
This paper introduces a pragmatic approach for modeling large-scale social network data by leveraging localized social network interactions, building upon the assumption of social network homophily. The social network homophily theory suggests that socially connected users are more likely to be similar [5]. Specifically, we harness the power of LLMs by drawing inspiration from the theory of linguistic homophily in social networks, which posits that users with similar language styles are more likely to be friends [6]. Our proposed model, named Social-LLM, is influenced by Retweet-BERT [7], initially designed for political leaning detection using retweet interactions and user profile descriptions. We extend Retweet-BERT by generalizing to all social network interactions, incorporating additional types of content, and applying the model to a diverse range of computational social science applications, including political polarization, online hate speech, account suspension, and morality. Our approach emphasizes scalability and inductive capabilities by avoiding full-graph training and focusing on first-order proximity. While this design does not eliminate the computational demands of large language models, it provides a practical alternative to GNN-based methods that struggle with scalability on large, sparse networks.
Our summary of contributions is as follows:
- We propose Social-LLM, a social network representation model designed to be scalable that combines user content cues with social network cues for inductive user detection tasks.
- We conduct a thorough evaluation of Social-LLMs on 7 real-world, large-scale social media datasets of various topics and detection tasks.
- We showcase the utility of using Social-LLM embeddings for visualization.
2. Related Work
Detecting users is a crucial element in computational social science research, encompassing a spectrum of areas like identifying ideologies [8,9], spotting inauthentic accounts [10,11], flagging hateful or toxic behavior [12,13], recognizing influential figures [14], assessing vulnerability to misinformation [15,16], and beyond. Most user detection methods that utilize social network features only consider them to the extent of network statistics (e.g., node centrality measures) and not the complex relationships among individuals [10,11]. Recent approaches have explored various network-aware strategies, including density-aware walks for coordinated inauthentic campaign detection [17], dynamic GNNs for evolving user behavior modeling [18], and neural architecture search for optimal relational GNNs in bot detection [19].
In many cases, the lack of social network data is due to practical limitations: it is challenging to obtain the network data, and it is also challenging to effectively model them. While the challenge of obtaining network data lies beyond our control, we can address the second limitation with graph representation learning [20,21]. These methods effectively capture crucial higher-order proximity information within social networks yet often demand substantial computational resources during training or have elevated hardware requirements. The scale of large social network data can surpass device capacities that cannot be solved by distributed training, parallelism, or batching due to the inherent inability to partition the graph [22]. Other methods use sampling approaches to reduce training complexity [3]. However, there remains an inherent scalability trade-off when attempting to model very large graphs [4]. Additionally, most existing graph-based approaches lack inductive capabilities, requiring complete model retraining when encountering new users, and cannot efficiently leverage the representational power of large language models for capturing linguistic homophily in social networks. In this work, we preserve social network data but utilize them in the simplest manner by considering only the first-order proximity (i.e., the edges themselves). We show that such graph approximation is often sufficient for user detection on social media datasets.
Our method, Social-LLM, utilizes multi-relational data among users coupled with user features. Perhaps the most similar method to ours is TIMME, a scalable end-to-end graph neural network (GNN) user classification method that utilizes multi-relational social network data [23], or GEM, another heterogeneous GNN designed for malicious account detection [21]. Both methods can also take user content features as node feature input. Recent work has increasingly integrated large language models with social network analysis, including approaches for influencer marketing analysis [24], real-time community detection and anomaly detection [25], incremental social event detection [26], and rumor detection with graph attention networks [27]. These developments highlight the broader applicability of LLMs to computational social science tasks [28]. However, because these methods inherently rely on social network relations, it is not possible to deploy them inductively on out-of-sample users. This limitation makes them impractical for large-scale applications where new users frequently appear. Furthermore, these approaches do not fully exploit the recent advances in large language models for understanding linguistic patterns that correlate with social connections. Social-LLM, on the other hand, can be applied to any unseen users as long as we have the same user content features without retraining.
The key advantages of our Social-LLM approach over existing methods include: (1) a design that avoids full-graph training by using edge-based sampling, which can be more tractable for large, sparse datasets, (2) inductive learning capabilities that allow application to unseen users without retraining, and (3) reusability of learned embeddings across different downstream tasks. While this approach sacrifices some precision by focusing only on first-order proximity rather than global network structures, we demonstrate that this localized modeling is sufficient for achieving substantial performance improvements in user detection tasks while maintaining practical scalability.
3. Social-LLM Framework
We propose Social-LLM, a model that leverages network homophily and user features to learn user representations scalably. This representation model can then be applied inductively for a range of downstream user detection tasks. Social-LLM draws from two types of social network features: content cues from each user and network cues from social interactions.
We train Social-LLM in an unsupervised manner to learn user representations in a d−dimensional embedding space (Figure 1, step 1). Once we train the user representation module, we can apply the user representation module to any user content input to obtain the user embeddings. Additional layers can be trained on top of any downstream user detection task (Figure 1, step 2).
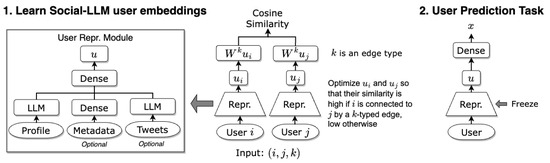
Figure 1.
Overview of the proposed Social-LLM framework.
3.1. Content Cues
The content cues are derived mainly from the textual content on their social media but can also be from other contextual metadata. We primarily utilize users’ profile descriptions, which are self-provided mini-biographies. For most user detection task purposes, users’ biography encodes a substantial amount of personal information with personal descriptors (e.g., “Mother”, “Senator”, “Research Scientist”) and, in some cases, self-identities and beliefs (e.g., “Democratic”, “#BLM”, “LGBTQ”). Capped at a limit of 160 characters, these descriptions have to be short, incentivizing users to convey essential information they wish to share about themselves succinctly and attractively. The use of Twitter profile descriptions, not the tweet texts, has proved useful in a large number of computational social science research [7,29,30,31,32]. From a practical standpoint, using user profiles instead of all of the tweets by a user also vastly reduces the complexity of the computation problem as well as alleviates data collection challenges. In addition to profile descriptions, we also leverage, when applicable, user metadata features (e.g., follower counts, account creation date, etc.) and user tweets.
3.2. Network Cues
Online social media platforms offer a variety of ways to engage with one another, such as by following, liking, or re-sharing. These acts of social interaction can be gathered to form social networks. The Twitter API enables us to obtain three types of social interactions: retweeting, mentioning, and following. Though the following network is perhaps the most useful indication of user interaction, it is rarely in empirical research used due to the API rate limits set by Twitter [33]. As such, following the vast majority of computational social science research on Twitter (e.g., [34,35]), we use the retweet and mention networks in this research. Retweet refers to the act of re-sharing another user’s tweet directly, without any additional comments. Mention includes all other acts of mentioning (using ’@’) another user, including retweeting with comments (i.e., quoting), replying, or otherwise referencing another user in a tweet. We draw a distinction between retweets and mentions because they may represent two distinct motivations of social interaction: retweeting is usually understood as an endorsement [36,37] while mentioning could be used to criticize publicly [38].
3.3. User Representation Module
The user representation module mainly takes place in the pre-trained LLM model to be applied to the user’s profile description. This LLM model is trainable in order to allow for fine-tuning in our training process. If user metadata features and/or the averaged LLM embeddings of the user tweets are provided, they will be directed through a series of dense layers. We concatenate these outputs into one single embedding and apply another dense layer to produce a single d-dimensional embedding for user i.
3.4. Unsupervised Training via Siamese Architecture
The user representation module is wrapped in a Siamese model architecture in a manner similar to Sentence-BERT [39]. Specifically, we apply an identical representation module on the user content cue and optimize the resulting embeddings based on the network cues. A training instance of Social-LLM is a tuple where i and j are two users who are connected by a social network interaction (i.e., an edge) of type k. We want to train the user embeddings and so that they are as similar as possible. Sentence-BERT [39] and Retweet-BERT [7] achieve this by optimizing the cosine similarity of embeddings. However, we also want to consider (1) multiple edge types—modeling retweets distinct from mentions—and (2) directionality—user A retweeting from user B is not the same as user B retweeting from user A. To account for multiple edge types, we initialize a learnable weight matrix for every edge type k. To account for directionality, we can use separate weight matrices and for the in- and out-edges. We then calculate the cosine similarity scores between and , or and in the directional case, as the final output. We can also account for edge weights by weighting each training instance proportionally to their weight.
3.5. Multiple Negatives Ranking Loss
We train the model with a ranking loss function, pitching positive examples against negative examples. All edges in the graph serve as positive examples, and all other pairs of users, i.e., user i and user j who are not connected by an edge, can serve as negative examples. To speed up the training procedure, we use the multiple negatives loss function [40], which has shown to work well in Jiang, Ren, and Ferrara [7]. Essentially, all other pairs of users in the same batch serve as negative examples. For instance, if the input batch contains positive examples , then for all are negative examples. This will encourage users who are truly connected in the graph to have more similar representations than users who do not. To minimize training complexity, we alternate the training of different types of edges in a round-robin fashion. For example, if we want to accommodate for both and edges, we will train one batch of k retweet edges, followed by one batch of k mention edges. When one type of edge is fully consumed, we will end this epoch. Edges are reshuffled at the beginning of each epoch. We show the pseudocode in Algorithm 1.
| Algorithm 1 Alternating Training Loss for Retweet and Mention Edges |
|
3.6. Downstream Task Application
The Social-LLM model produces a reusable user representation that can be used on any downstream user prediction task (Figure 1, step 2). We can fine-tune the representation module further or freeze the layers and add task-specific fine-tuning layers on top. We can also append any user-specific features (profile LLM embeddings, user metadata features, etc.) that we used during the Social-LLM training process to the learned Social-LLM user embeddings at this step.
3.7. Trade-Offs of Social-LLM
Social-LLM builds on traditional user detection methods by adding social network components. The main advantages of Social-LLM over similar GNN approaches include ease of training, inductive capabilities, and reusability. However, these advantages come with trade-offs. Notably, we sacrifice precision and thoroughness for speed and efficiency. Our model focuses only on first-order proximity, or users who are connected immediately by an edge. This undoubtedly loses valuable information from the global network structures or higher-order proximities. However, as we will demonstrate in this paper, in the cases of many user detection problems on social networks, it is sufficient to model the localized connections of a lightweight model’s performance compared to models that ignore the social network entirely, without incurring the full training complexity of GNNs. For these large but sparse real-world social network datasets, the more powerful graph embedding methods may require a lot more training time, memory footprint, or hardware resources for a marginal gain in performance. We note that while LLM inference and fine-tuning can themselves be computationally demanding, our method shifts the scalability bottleneck away from graph size, enabling inductive application to unseen users.
4. Experiments
In this section, we introduce the datasets underlying our analysis, explain the evaluation strategy and baselines that ground our comparisons, and present the results that demonstrate the effectiveness of our approach.
4.1. Data
We use seven different real-world datasets to extensively validate our approach. The first two datasets, Covid-Political and Election2020, were used in Retweet-BERT [7], focusing only on using user profile descriptions and retweet interactions to predict political partisanship. To demonstrate the additional capabilities of Social-LLM, we introduce several other datasets that encompass more heterogeneous user metadata and network features. In addition, our new datasets add diversity to the types of labels (partisanship, morality, account suspension, toxicity), prediction methods (classification and regression; single output and multi-output), time spans, and data sizes to demonstrate the robustness of our approach. The summary statistics of all of our datasets are displayed in Table 1.

Table 1.
Summary statistics of our Twitter datasets, including the number of retweet (RT) and mention (MN) edges, what kind of additional features they have, how the labels were determined, and the prediction task. Datasets 1–2 label users by political partisanship heuristically using characteristics of their user content. Dataset 3 is labeled using a moral foundation classifier based on their tweet texts. Dataset 4 is labeled by checking whether a user was later suspended by Twitter. Datasets 5–7 are labeled by applying the Perspective API on user tweets.
4.1.1. COVID Politics
Research Question. The COVID-19 pandemic left an unprecedented impact on everyone worldwide. Research has shown that COVID-19 was politicized, with partisanship steering online discourse about the pandemic [9,41].
Dataset. Our dataset, Covid-Politics, is based on a real-time collection of tweets related to the COVID-19 pandemic [42] between 21 January and 31 July 2020, which was further preprocessed by Jiang, Ren, and Ferrara [7] to remove bots [10,43]. It also consists of the following user metadata features: initial follower count, final follower count, number of tweets, number of original tweets, number of days active (post at least once), and whether the user is verified. The ground truth partisanship labels from Jiang, Ren, and Ferrara [7] are derived from a blend of two heuristics-labeling methods. The first uses annotated political hashtags used in user profile descriptions, and the second uses the partisanship leaning of new media URLs mentioned in users’ tweets. This dataset contains 78,672 labeled users with 180,928 retweet interactions. The distribution of users is unbalanced, with approximately 75% of them labeled as left-leaning.
Purpose. This dataset validates Social-LLM’s ability to predict user political partisanship during the COVID-19 pandemic with an imbalanced label distribution.
4.1.2. Election 2020
Research Question. The 2020 US presidential election took place amidst the backdrop of the COVID-19 pandemic. Former Vice President Joe Biden, the Democratic nominee, defeated the incumbent Republican President Donald Trump.
Dataset. The Election-2020 dataset is based on a real-time collection of tweets regarding the 2020 US presidential election [44] from 1 March to 31 May 2020. This dataset was similarly preprocessed to remove bots and users with low degrees [7].
Purpose. Since this is specifically a dataset on US politics, the user label we are interested in predicting is partisanship. We use the same partisanship labels from Jiang, Ren, and Ferrara [7], which labeled 78,932 users as either left-leaning or right-leaning. The distribution split is even, with around 50% of the users labeled as left-leaning. These users encompass the Election2020 dataset with 2.8 million retweet interactions.
4.1.3. COVID Morality
Research Question. The Moral Foundation Theory (MFT) decomposes human moral reasoning into five foundations: care/harm, fairness/cheating, loyalty/betrayal, authority/subversion, and purity/degradation [45] (a sixth foundation, liberty/oppression [46], was later added; however, we only use the first five following Rao et al. [47]). Research on moral foundation and network homophily found that moral values of purity can predict social network distances between two users, suggesting that social networks exhibit purity homophily [48]. On the subject of COVID-19, numerous studies have established a link between moral values and decision-making regarding health-related behaviors during the pandemic, such as wearing masks or getting vaccinated [49,50,51]. It stands to reason that user morality may play a role in facilitating online communication patterns on COVID-19.
Dataset. The Covid-Morality dataset is also compiled from the previously mentioned real-time collection of COVID-19 data as Covid-Politics [42], but spans a longer time period and is focused on a different prediction task. This data spans from February 2020 to October 2021 for 21 full months. To detect moral values in the tweets, we use the morality detector [47] fine-tuned specifically for this dataset. It predicts the 10 moralities (each foundation contains two opposite labels for its virtue and vice) in a multilabel manner. We retain tweets that have at least one of the ten moralities present. Of the users who produced these tweets with moral values, we filtered for active users by retaining users who posted at least 10 tweets during any month. We then sampled 150,000 users from this set. With this set of users, we built a network of retweet and mention interactions. As with Jiang, Ren, and Ferrara [7], we only kept edges with weights ≥ 2, leaving us with 119,770 users sharing 609,845 retweet edges and 639,994 mention edges.
Due to the way the moral datasets are typically annotated, a tweet could be labeled as having any of the 10 moralities, even if we do not need to differentiate virtues and vices for the purposes of analyzing moral foundations [52]. For example, a tweet labeled as having care but no harm, harm or no care, or both care and harm all reflect a moral foundation in the care/harm dimension. Therefore, for each tweet, we aggregate the 10 labels into 5, assigning a value of 1 to the moral foundation if both polar opposites are present, 0.5 if either the virtue or vice is present, and 0 otherwise. We then calculate 5 moral scores for users by computing the average moral foundation score across all of their tweets. This dataset includes the following user metadata features: account age, number of followers count, number of people they are following, number of lists the user is a member of, the total number of tweets ever posted by this user, the number of posts favorited by the user, and whether they are verified. Additionally, we calculate the number of original tweets, retweets, quoted tweets, and replies by each user contained in our dataset.
Purpose. We apply Social LLM to a multi-output regression prediction task to determine the moral leanings of the users based on their social network data.
4.1.4. Ukraine–Russia Suspended Accounts
Research Question. When the Ukraine–Russian war erupted in early 2022, social media quickly became a platform to spread content about the conflict, not all of which was truthful. Early research suggests that Russian mis/disinformation campaigns, state-sponsored content, and otherwise suspicious activities were rampant on social media [53,54]. We used a real-time collection of tweets about the conflict [55] for a full month in March 2022. Many of these users who tweeted about the war were since suspended by Twitter, (see Twitter’s help page on account suspension: https://help.twitter.com/en/managing-your-account/suspended-x-accounts (accessed on 29 September 2025)) and they were often found to be newer, more active (spamming), and more toxic than users that were not suspended [56]. We theorize that suspended users and normal users reflect different communication characteristics due to different agendas, motivations, and needs from social media.
Dataset. Our raw dataset contains around 10 million non-suspended users and 1 million suspended users. We filter for users who posted a minimum of 10 tweets to remove inactive users and a maximum of 130 tweets to remove spamming bots. At this time of the research, we no longer had access to the Botometer [10] tool due to Twitter’s API cutoff (https://independenttechresearch.org/letter-twitters-new-api-plans-will-devastate-public-interest-research/ (accessed on 29 September 2025)). Therefore, we resorted to using the maximum tweet amount as a rough elimination criterion. A total of 130 is the 90% threshold of the number of tweets per user after removing users with less fewer 10 tweets. Having 130 tweets in one month represents 4.19 tweets per day, which we feel is a reasonable number of tweets an authentic account could post. After filtering, we have 1.4 million non-suspended and 73,000 suspended users. Since the dataset is heavily imbalanced, we sampled a roughly equal proportion of users who were not suspended. We then built the retweet and mention network using the edge weight ≥ 2 criteria and removed any users who were isolated in the network following [7]. Our final Ukr-Rus-Suspended dataset consists of 56,440 users, 135,053 retweet edges, and 255,476 mention edges. Around 58% of the users were suspended. We also retained the same user metadata features as we did in the Covid-Morality dataset (Section 4.1.3). Unlike other datasets, the ground-truth labels were not derived from the tweet texts themselves, so we additionally explore including the tweet texts as a content feature in our model.
Purpose. This dataset evaluates Social-LLM’s capability to identify suspicious or inauthentic accounts using additional features such as user tweet text.
4.1.5. Ukraine–Russia Hate
Research Question. Beyond misinformation and coordinated activity, the online discourse regarding the Ukraine–Russia war is also riddled with toxic language [57]. As a spin-off from the previous Ukr-Rus-Suspended dataset (Section 4.1.4), we experiment with whether we can detect users’ toxicity levels from their Twitter behavior and activity.
Dataset. Our preprocessing step diverges from the Ukr-Rus-Suspended dataset (Section 4.1.4) after filtering for users based on the min and max number of tweets. We employ the Perspective API (https://perspectiveapi.com/ (accessed on 29 September 2025)), a widely used toxicity detector used in similar studies [58,59]. The Perspective API returns a TOXICITY score for each text on a scale of 0 (not toxic) to 1 (very toxic). Besides the flagship TOXICITY score, the API also computes 5 other toxicity measures: IDENTITY_ATTACK, INSULT, PROFANITY, THREAT, and SEVERE_TOXICITY. We apply the Perspective API to users’ original tweets. Occasionally when the tweet is not written in an unsupported language or contains only URLs, the Perspective API will fail to produce toxicity scores. Therefore, we filter for users who have at least 10 original tweets rated by the Perspective API. There are 82,041 users in this Ukr-Rus-Hate dataset. We save all 166,741 retweet edges and 414,258 edges, neglecting to remove the edges with weights < 2 as we did previously since the density of the network is comparatively smaller. The user metadata features we retain are the same as we did in the Ukr-Rus-Suspended (Section 4.1.4) and Covid-Morality (Section 4.1.3) datasets.
Purpose. This dataset tests Social-LLM’s ability to predict user toxicity levels as a multi-output regression problem.
4.1.6. Immigration Hate
Research Question. To further test the capabilities of social-LLM, we compile another hate speech dataset, this time forgoing breadth for depth by collecting a relatively full set of historical tweets by a smaller set of users.
Dataset. This dataset is based on another dataset collected by Bianchi et al. [60], which consists of annotated tweets from 2020 to 2021 that reference immigration hate terms. We attempted to rehydrate the 18,803 tweets that were found to be uncivil, intolerant, or both. In total, 8790 (47% of the total) tweets by 7566 unique users were successfully retrieved; the rest of the tweets were no longer available. Since these users are known to have tweeted hateful immigration tweets at least at some point, we use them to snowball our Immigration-Hate dataset with the Twitter historical API, collecting the hateful users’ most recent tweets up to a maximum of 3200. This resulted in 21 million tweets, of which 2.9 million tweets were original. We focus only on original tweets in this work.
We applied the Perspective API on the tweets for five measures of toxicity: TOXICITY, IDENTITY_ATTACK, INSULT, PROFANITY, and THREAT, then we aggregated toxicity scores for users by computing the average toxicity score of their tweets. Using Botometer [10,43], we found that bots seem especially prevalent in the dataset. Therefore, to mitigate the influence of bots, we remove users according to two thresholds of bot score: 0.8, which is a conservative choice given the peak in the distribution of bot scores, and 0.5, which would leave us substantially fewer users but with a higher certainty that they are genuine. Since the number of users is already small, we retain all network edges. In the Immigration-Hate-08 dataset, 5759 users with bot scores less than or equal to 0.8 share 63,097 retweet and 83,870 mention edges. In the Immigration-Hate-05 dataset, 2188 users with bot scores less than or equal to 0.5 share 4827 retweet and 7993 mention edges. The user metadata features we use include account age, whether they are verified, number of followers, number of followings, number of total tweets posted, and the number of lists they are members of.
Purpose. This dataset validates Social-LLM’s performance on toxicity prediction in a focused domain-specific context.
4.2. Evaluation
We evaluated our method in step 2 of our overall workflow (Figure 1). We conducted an extensive comparison of Social-LLM with baseline methods, as well as several sensitivity and ablation studies.
Baseline Methods. For a thorough evaluation of our approach, we used a series of state-of-the-art baseline methods divided into three categories: content-based, network-based, and hybrid methods. The content-based and network-based models provide an alternative user embedding that we can utilize in the evaluation procedure (Figure 1 step 2). All input embeddings undergo similar training processes for target task prediction. For the hybrid method, we use TIMME, an end-to-end user detection method that also uses both user features and network features. We conduct a thorough hyperparameter tuning process for all of the baseline models.
4.2.1. Content-Based Methods
For Content-Based Methods, we primarily investigate using embeddings from pre-trained LLMs. Fine-tuning the LLMs for our specific purpose is also one option; however, doing so on the Covid-Politics and Election2020 dataset did not deliver a substantial enough improvement to justify the added training cost. In this work, we experiment with the following three LLMs applied to the profile descriptions: (1) RoBERTa [61] (roberta-base), (2) BERTweet [62] (vinai/bertweet-base), a RoBERTa fine-tuned on Twitter data, and (3) SBERT-MPNet (sentence-transformers/all-mpnet-base-v2), a Sentence-BERT [39] model based on MPNet [63] and is currently the best-performing Sentence-BERT model (https://www.sbert.net/docs/pretrained_models.html (accessed on 29 September 2025)).
For datasets with additional metadata features, we also experiment with using only the raw metadata features as the “user embeddings” as well as by concatenating the LLM embeddings with the raw metadata features. For Ukr-Rus-Suspended, we additionally experiment with applying the aforementioned three LLMs on users’ tweets, averaging one LLM embedding per user.
4.2.2. Network-Based Methods
We used two purely network-based methods as the network-based baseline: node2vec [64] and ProNE [65]. While GraphSAGE [66] is another suitable choice for inductive graph representation learning with node attributes, it is, in practice, to train on a large graph within reasonable time limits and can therefore underperform [7]. These network embedding methods do support weights and directions but heterogenous edge types. Therefore, we ran a separate network model on the (1) retweet edges only, (2) mention edges only, and (3) indiscriminately combined retweet and mention edges as one edge (with edge weights equal to the sum of the retweet edge and mention edge weights).
4.2.3. Hybrid Method
We used TIMME [23] as our hybrid method baseline, providing it with the same user content features and network features as our Social-LLM model. The original model was only designed for user classification tasks, but we modified the open-sourced code to enable regression. Since TIMME is designed to be a multi-relational model, we mainly apply it on both retweet and mention edges, but we also experiment with combining these edges indiscriminately.
4.2.4. Experimental Setup
For every dataset and its corresponding set of user embeddings, we conducted the same train–test procedure repeated 10 times, splitting the dataset randomly using 10 pre-selected random seeds. Unless otherwise indicated, we used a 60%–20%–20% train–val–test split. The validation sets are used for early stopping and for model selection. The model architecture and hyperparameters are fixed for all experiments: batch size = 32, learning rate = , number of epochs = 10, hidden dimension = 32, number of dense layer = 1. We also applied early stopping if the epoch’s loss stops improving. The classification tasks were evaluated using Macro-F1, and the regression tasks were evaluated using Pearson’s correlation. For regression tasks with multiple labels, we averaged the Pearson’s correlation across labels.
4.3. Results
Below, we discuss our experimental results and interpret our findings. For model selection within the same family of methods, we use the validation sets to select the final model. Most results are presented in Table 2, which shows the average result over 10 repeated random splits.
Table 2.
Experimental result scores of various models on the seven datasets. C indicates whether the model uses content cues as features, and N indicates whether the model uses network cues as features. The best model for each experiment is in bold, and the best baseline model is underlined.
4.3.1. Experiment 1: Choice of LLMs
We first experiment with the choice of LLMs by running our prediction tasks using only the profile LLM embeddings as features. This determines both the best baseline method for LLMs and which LLM we should use in our Social-LLM models. We selected the clear winner, SBERT-MPNet, which outperformed RoBERTa and BERTweet on all datasets. We note that, given rapid innovations in NLP and LLMs, SBERT-MPNet may not be the best model or could soon be replaced by a better successor. However, the contribution of Social-LLM is not tied to a single LLM but rather a model training paradigm that can be paired with any LLM. Our choices of LLMs are driven by ease of use, costs, and reproducibility [67].
4.3.2. Experiment 2: Main Experiments
In Table 2 Experiment 2, we underline the best baseline model and boldface the best model (either a baseline or the Social-LLM model) for each dataset. We also indicate the percentage gain or loss in performance using Social-LLM compared to the best-performing baseline. Regarding baseline methods, there is no clear winner among the content-based, network-based, or hybrid models. Network-based models face much higher variability in performance across datasets, pointing at issues when using solely network features. Notably, we observe that Social-LLM is superior in nearly all cases, with improvements ranging from a substantial 26% to a modest 1%. Using a one-sided t-test, we find that all improvements are statistically significant. The only dataset where Social-LLM performs comparatively worse than the baselines is Covid-Morality, where the network embedding models are slightly superior, but the Social-LLM model still demonstrates commendable performance. In summary, Social-LLM emerges as the most consistent model, exhibiting robustness across various tasks and data sizes.
4.3.3. Experiment 3: Edge Type Ablation
We performed an edge-type ablation experiment to evaluate the importance of each edge type on datasets containing both retweets and mention edges. When using only one type of edge, we find they perform comparably. The combination of retweets and mentions as two distinct edge types occasionally results in improved performance but can also lead to deteriorated outcomes. However, combining them indiscriminately as one edge type yields the best performance consistently. This suggests that both retweets and mentions carry important signals, yet the distinctions between the two actions might not be substantial enough to warrant differentiation for our objective tasks.
4.3.4. Experiment 4: Edge Weights and Directions
Using the best edge-type model (RT for Election2020 and Covid-Political, and RT + MN for all others), we then experimented with adding edge weights (+w) and edge directions (+d). The inclusion of directions always yields better performance, and occasionally, the performance is further enhanced if we stack on weights as well. The importance of directionality emphasizes the value of understanding the flow of information exchange on social networks.
4.3.5. Experiment 5: User Tweet Embeddings
Ukr-Rus-Suspended is the only dataset for which the ground truth labels were not derived directly from the tweet texts; therefore, we could additionally include user tweet embeddings as features. In Figure 2, we see that using user tweet embeddings leads to an average improvement of 4% Macro-F1 between otherwise identically configured models with vs. without user tweet embeddings. This experiment underscores the importance of including user tweets, when applicable and suitable, in user prediction tasks.
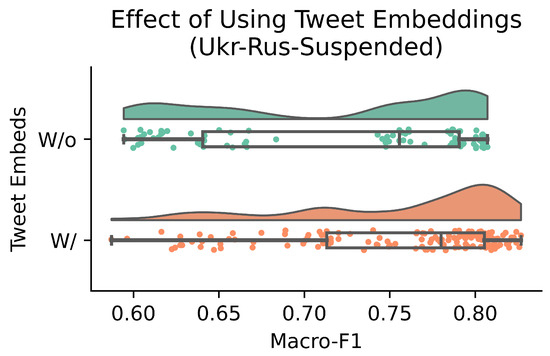
Figure 2.
Effect of adding user tweet embeddings on the Ukr-Rus-Suspended dataset (Experiment 5). The distributions of Macro-F1 scores across runs are shown for models trained without tweet embeddings (top, green) and with tweet embeddings (bottom, orange). Models with tweet embeddings achieve consistently higher Macro-F1, with an average improvement of 4%.
4.3.6. Experiment 6: Sensitivity to Dimension Size
For every dataset, we select the Social-LLM model with the best edge type, edge weight, and edge direction configuration to plot the sensitivity to embedding dimension d. The results are presented in Figure 3. Performance generally increases with rising dimensions, with being a popular choice; however, we note that Social-LLM usually performs quite well even with very low dimensions.
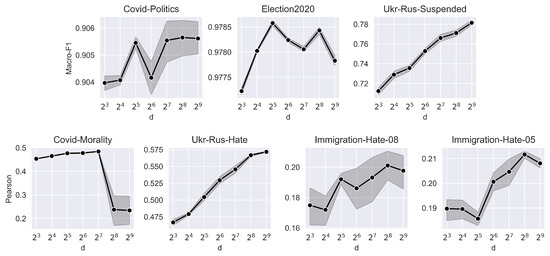
Figure 3.
Sensitivity to embedding dimension d (Experiment 6).
4.3.7. Visualization
Finally, we highlight the utility of using Social-LLM embeddings as visualization tools. In Figure 4, we use TSNE [68] to reduce the embedding dimension from selected datasets and visually represent them. We observe a distinct separation of liberals and conservatives in Covid-Politics, and this distinction is even pronounced in Election2020, emphasizing the political differences among users on a more politics-oriented topic. In the Ukr-Rus-Suspended dataset, the global separation between suspended and non-suspended accounts is less apparent, but localized clusters of suspended and non-suspended users emerge. In sum, Social-LLM embeddings offer valuable support in visualizing complex social networks.
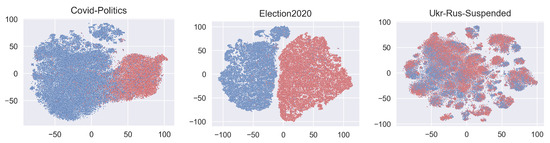
Figure 4.
Visualization of Social-LLM embeddings on select datasets.
5. Conclusions
This paper presents Social-LLM, a scalable social network embedding method that integrates user content information, primarily from user profile descriptions, with social interaction information (e.g., retweets and mentions) for user detection. By combining the state-of-the-art innovations in LLMs with straightforward modeling of first-order proximity—specifically, considering only the edges themselves—from the social network by exploiting characteristics of social network sparsity and homophily. Leveraging seven different large Twitter datasets drawn from the real world, with a diverse range of meaningful user detection tasks, we showcase the advantage and robustness of our method against state-of-the-art methods that rely solely on content or network features. Importantly, Social-LLM, once fitted to the social network, can be applied to numerous downstream user prediction tasks even in the absence of the original social network, underscoring its efficiency and generalizability to out-of-sample users. We show that Social-LLM works best when modeling both retweet and mention edges indiscriminately and when accounting for the directionality of social network interactions. Using additional tweet content embeddings also improves the performance. Further, Social-LLM embeddings prove useful when visualizing large-scale social networks.
5.1. Limitations
While Social-LLM demonstrates strong empirical performance and scalability across a diverse range of social media tasks, several limitations warrant discussion. First, the model’s reliance on first-order network proximity, while efficient, may under utilize higher-order structural information that could be informative for certain tasks. Future work could explore scalable approximations of second-order or community-level features without compromising computational tractability.
Second, our model leverages profile descriptions and metadata as primary content features. Although these have proven effective in past work, they may omit behavioral nuances captured in user timelines or long-term activity patterns. We partially mitigate this by incorporating tweet-level embeddings when available, but acknowledge that data sparsity or access limitations could impact generalizability across platforms or contexts.
Lastly, while our model performs well inductively, we did not explicitly evaluate long-term stability or temporal generalization—e.g., how embeddings drift as user behavior evolves. Extending Social-LLM with continual learning or temporal robustness mechanisms is an important direction for future work.
5.2. Ethical Considerations
This research uses publicly available Twitter data, consistent with prior work and Twitter’s developer terms of service. Nonetheless, the use of social media data for user modeling raises potential ethical concerns, particularly around user privacy, profiling, and unintended inferences. We mitigate these concerns by avoiding personally identifiable information and focusing on aggregate modeling over individual prediction.
We acknowledge that models for user detection, especially those involving morality, partisanship, or toxicity, could be misused if deployed without context or accountability. To reduce this risk, we intentionally design Social-LLM to be interpretable and modular, and we refrain from releasing trained models or embeddings for sensitive tasks. Future releases of data or code will include appropriate documentation, usage disclaimers, and FAIR-aligned practices to ensure transparency and reproducibility.
We encourage responsible use of Social-LLM for research, and caution against any application intended for surveillance, behavioral targeting, or discrimination. As part of ongoing work, we are exploring more robust safeguards, such as adversarial testing and interpretability probes, to further audit model fairness and reduce downstream harms [69].
Author Contributions
Conceptualization, methodology, validation, formal analysis, investigation, writing—original draft preparation, writing—review and editing, J.J. and E.F.; software, data curation, visualization, J.J.; supervision, project administration, resources, funding acquisition, E.F. All authors have read and agreed to the published version of the manuscript.
Funding
This project was in part supported by the NSF (Award Number 2331722).
Data Availability Statement
The original contributions presented in this study are included in the article. Further inquiries can be directed to the corresponding author.
Conflicts of Interest
The authors declare no conflicts of interest.
References
- Freeman, L.C. The Development of Social Network Analysis: A Study in the Sociology of Science; Empirical Press: Vancouver, BC, Canada, 2004. [Google Scholar]
- Lazer, D.; Pentland, A.; Adamic, L.; Aral, S.; Barabási, A.-L.; Brewer, D.; Christakis, N.; Contractor, N.; Fowler, J.; Gutmann, M.; et al. Computational Social Science. Science 2009, 323, 721–723. [Google Scholar] [CrossRef]
- Ma, H.; Rong, Y.; Huang, J. Graph Neural Networks: Scalability. In Graph Neural Networks: Foundations, Frontiers, and Applications; Springer Nature: New York, NY, USA, 2022; pp. 99–119. [Google Scholar]
- Wu, Z.; Pan, S.; Chen, F.; Long, G.; Zhang, C.; Yu, P.S. A Comprehensive Survey on Graph Neural Networks. IEEE Trans. Neural Netw. Learn. Syst. 2021, 32, 4–24. [Google Scholar] [CrossRef] [PubMed]
- McPherson, M.; Smith-Lovin, L.; Cook, J.M. Birds of a Feather: Homophily in Social Networks. Annu. Rev. Sociol. 2001, 27, 415–444. [Google Scholar] [CrossRef]
- Kovacs, B.; Kleinbaum, A.M. Language-Style Similarity and Social Networks. Psychol. Sci. 2020, 31, 202–213. [Google Scholar] [CrossRef] [PubMed]
- Jiang, J.; Ren, X.; Ferrara, E. Retweet-BERT: Political Leaning Detection Using Language Features and Information Diffusion on Social Networks. In Proceedings of the International AAAI Conference on Web and Social Media (ICWSM), Limassol, Cyprus, 5–8 June 2023; Volume 17, pp. 459–469. [Google Scholar]
- Barberá, P.; Jost, J.T.; Nagler, J.; Tucker, J.A.; Bonneau, R. Tweeting From Left to Right: Is Online Political Communication More Than an Echo Chamber? Psychol. Sci. 2015, 26, 1531–1542. [Google Scholar] [CrossRef]
- Jiang, J.; Chen, E.; Yan, S.; Lerman, K.; Ferrara, E. Political Polarization Drives Online Conversations About COVID-19 in the United States. Hum. Behav. Emerg. Technol. 2020, 2, 200–211. [Google Scholar] [CrossRef]
- Davis, C.A.; Varol, O.; Ferrara, E.; Flammini, A.; Menczer, F. Botornot: A System to Evaluate Social Bots. In Proceedings of the 25th International Conference Companion on World Wide Web (WWW Companion), Montreal, QC, Canada, 11–15 May 2016; pp. 273–274, ISBN 9781450341448. [Google Scholar]
- Masood, F.; Almogren, A.; Abbas, A.; Khattak, H.A.; Din, I.U.; Guizani, M.; Zuair, M. Spammer Detection and Fake User Identification on Social Networks. IEEE Access 2019, 7, 68140–68152. [Google Scholar] [CrossRef]
- Jiang, J.; Luceri, L.; Walther, J.B.; Ferrara, E. Social Approval and Network Homophily as Motivators of Online Toxicity. arXiv 2023, arXiv:2310.07779. [Google Scholar] [CrossRef]
- Ribeiro, M.; Calais, P.; Santos, Y.; Almeida, V.; Meira, W., Jr. Characterizing and Detecting Hateful Users on Twitter. In Proceedings of the International AAAI Conference on Web and Social Media (ICWSM), Palo Alto, CA, USA, 25–28 June 2018; Volume 12. [Google Scholar]
- Rios, S.A.; Aguilera, F.; Nuñez-Gonzalez, J.D.; Graña, M. Semantically Enhanced Network Analysis for Influencer Identification in Online Social Networks. Neurocomputing 2019, 326, 71–81. [Google Scholar] [CrossRef]
- Aral, S.; Walker, D. Identifying Influential and Susceptible Members of Social Networks. Science 2012, 337, 337–341. [Google Scholar] [CrossRef]
- Ye, J.; Luceri, L.; Jiang, J.; Ferrara, E. Susceptibility to Unreliable Information Sources: Swift Adoption with Minimal Exposure. In Proceedings of the ACM Web Conference 2024, Singapore, 13–17 May 2024; pp. 4674–4685. [Google Scholar]
- Gopalakrishnan, A.A.; Hossain, J.; Elmas, T.; Sarıyüce, A.E. Density-aware Walks for Coordinated Campaign Detection. arXiv 2025, arXiv:2506.13912. [Google Scholar] [CrossRef]
- Choi, J. User Authentication Using Graph Neural Networks for Adapting to Dynamic and Evolving User Patterns. Electronics 2025, 14, 3570. [Google Scholar] [CrossRef]
- Tzoumanekas, G.; Chatzianastasis, M.; Ilias, L.; Kiokes, G.; Psarras, J.; Askounis, D. A Graph Neural Architecture Search Approach for Identifying Bots in Social Media. Front. Artif. Intell. 2024, 7, 1509179. [Google Scholar] [CrossRef] [PubMed]
- Hamilton, W.L. Graph Representation Learning; Morgan & Claypool Publishers: San Rafael, CA, USA, 2020. [Google Scholar]
- Liu, Z.; Chen, C.; Yang, X.; Zhou, J.; Li, X.; Song, L. Heterogeneous Graph Neural Networks for Malicious Account Detection. In Proceedings of the 27th ACM International Conference on Information and Knowledge Management (CIKM ’18), Turin, Italy, 22–26 October 2018; pp. 2077–2085. [Google Scholar]
- Serafini, M.; Guan, H. Scalable Graph Neural Network Training: The Case for Sampling. ACM SIGOPS Oper. Syst. Rev. 2021, 55, 68–76. [Google Scholar] [CrossRef]
- Xiao, Z.; Song, W.; Xu, H.; Ren, Z.; Sun, Y. TIMME: Twitter Ideology-Detection via Multi-Task Multi-Relational Embedding. In Proceedings of the 26th ACM SIGKDD International Conference on Knowledge Discovery & Data Mining, Virtual, 6–10 July 2020; pp. 2258–2268. [Google Scholar]
- Zhang, X.; Liu, Y.; Wang, J.; Hu, Z.; Chen, X.; Yan, R. SAGraph: A Large-Scale Social Graph Dataset with Comprehensive Context for Influencer Selection in Marketing. In Proceedings of the 48th International ACM SIGIR Conference on Research and Development in Information Retrieval, Washington, DC, USA, 14–18 July 2024; pp. 3733–3742. [Google Scholar]
- Pasham, S.D. Scalable Graph-Based Algorithms for Real-Time Analysis of Big Data in Social Networks. Metascience 2024, 2, 92–129. [Google Scholar]
- Qiu, Z.; Ma, C.; Wu, J.; Yang, J. Text is All You Need: LLM-enhanced Incremental Social Event Detection. In Proceedings of the 63rd Annual Meeting of the Association for Computational Linguistics (ACL), Vienna, Austria, 27 July–1 August 2025; pp. 4666–4680. [Google Scholar]
- Li, L.; Liu, G.; Liu, Y.; Yu, Q.; Luo, C.; Li, N. A Novel Rumor Detection Method Focusing on Social Psychology with Graph Attention Network. Neurocomputing 2025, 626, 129609. [Google Scholar] [CrossRef]
- Thapa, S.; Shiwakoti, S.; Shah, S.B.; Adhikari, S.; Veeramani, H.; Nasim, M.; Naseem, U. Large Language Models (LLM) in Computational Social Science: Prospects, Current State, and Challenges. Soc. Netw. Anal. Min. 2025, 15, 1–30. [Google Scholar] [CrossRef]
- Jiang, J.; Chen, E.; Luceri, L.; Murić, G.; Pierri, F.; Chang, H.-C.H.; Ferrara, E. What are Your Pronouns? Examining Gender Pronoun Usage on Twitter. In Proceedings of the 17th International AAAI Conference on Web and Social Media, Limassol, Cyprus, 5–8 June 2023. [Google Scholar]
- Piao, G.; Breslin, J.G. Inferring User Interests for Passive Users on Twitter by Leveraging Followee Biographies. In Proceedings of the 39th European Conference on IR Research, ECIR 2017, Aberdeen, UK, 8–13 April 2017; pp. 122–133. [Google Scholar]
- Rogers, N.; Jones, J.J. Using Twitter Bios to Measure Changes in Self-Identity: Are Americans Defining Themselves More Politically Over Time? J. Soc. Comput. 2021, 2, 1–13. [Google Scholar] [CrossRef]
- Thelwall, M.; Thelwall, S.; Fairclough, R. Male, Female, and Nonbinary Differences in UK Twitter Self-Descriptions: A Fine-Grained Systematic Exploration. J. Data Inf. Sci. 2021, 6, 1–27. [Google Scholar] [CrossRef]
- Martha, V.; Zhao, W.; Xu, X. A Study on Twitter User-Follower Network: A Network Based Analysis. In Proceedings of the 2013 IEEE/ACM International Conference on Advances in Social Networks Analysis and Mining, Niagara Falls, ON, Canada, 25–28 August 2013; pp. 1405–1409. [Google Scholar]
- Conover, M.; Ratkiewicz, J.; Francisco, M.; Gonçalves, B.; Menczer, F.; Flammini, A. Political Polarization on Twitter. In Proceedings of the International AAAI Conference on Web and Social Media (ICWSM), Barcelona, Spain, 17–21 July 2011; Volume 5, pp. 89–96. [Google Scholar]
- Ferrara, E.; Varol, O.; Davis, C.; Menczer, F.; Flammini, A. The Rise of Social Bots. Commun. ACM 2016, 59, 96–104. [Google Scholar] [CrossRef]
- Boyd, D.; Golder, S.; Lotan, G. Tweet, Tweet, Retweet: Conversational Aspects of Retweeting on Twitter. In HICSS 2010; IEEE: Piscataway, NJ, USA, 2010; pp. 1–10. [Google Scholar]
- Metaxas, P.; Mustafaraj, E.; Wong, K.; Zeng, L.; O’Keefe, M.; Finn, S. What do Retweets Indicate? Results From User Survey and Meta-Review of Research. In Proceedings of the International AAAI Conference on Web and Social Media (ICWSM), Oxford, UK, 26–29 May 2015; Volume 9, pp. 658–661. [Google Scholar]
- Hemsley, J.; Stromer-Galley, J.; Semaan, B.; Tanupabrungsun, S. Tweeting to the Target: Candidates’ Use of Strategic Messages and @Mentions on Twitter. J. Inf. Technol. Politics 2018, 15, 3–18. [Google Scholar] [CrossRef]
- Reimers, N.; Gurevych, I. Sentence-BERT: Sentence Embeddings Using Siamese BERT-Networks. In Proceedings of the 2019 Conference on Empirical Methods in Natural Language Processing and the 9th International Joint Conference on Natural Language Processing (EMNLP-IJCNLP), Hong Kong, China, 3–7 November 2019. [Google Scholar]
- Henderson, M.; Al-Rfou, R.; Strope, B.; Sung, Y.-H.; Lukács, L.; Guo, R.; Kumar, S.; Miklos, B.; Kurzweil, R. Efficient Natural Language Response Suggestion for Smart Reply. arXiv 2017, arXiv:1705.00652. [Google Scholar] [CrossRef]
- Calvillo, D.P.; Ross, B.J.; Garcia, R.J.B.; Smelter, T.J.; Rutchick, A.M. Political Ideology Predicts Perceptions of the Threat of COVID-19 (and Susceptibility to Fake News About It). Soc. Psychol. Personal. Sci. 2020, 11, 1119–1128. [Google Scholar] [CrossRef]
- Chen, E.; Lerman, K.; Ferrara, E. Tracking Social Media Discourse About the COVID-19 Pandemic: Development of a Public Coronavirus Twitter Data Set. JMIR Public Health Surveill. 2020, 6, e19273. [Google Scholar] [CrossRef] [PubMed]
- Yang, K.-C.; Ferrara, E.; Menczer, F. Botometer 101: Social Bot Practicum for Computational Social Scientists. J. Comput. Soc. Sci. 2022, 5, 1511–1528. [Google Scholar] [CrossRef] [PubMed]
- Chen, E.; Deb, A.; Ferrara, E. #Election2020: The First Public Twitter Dataset on the 2020 US Presidential Election. J. Comput. Soc. Sci. 2022, 5, 1–18. [Google Scholar]
- Haidt, J.; Joseph, C. Intuitive Ethics: How Innately Prepared Intuitions Generate Culturally Variable Virtues. Daedalus 2004, 133, 55–66. [Google Scholar] [CrossRef]
- Haidt, J. The Righteous Mind: Why Good People Are Divided by Politics and Religion; Vintage: New York, NY, USA, 2012. [Google Scholar]
- Rao, A.; Guo, S.; Wang, S.-Y.N.; Morstatter, F.; Lerman, K. Pandemic Culture Wars: Partisan Asymmetries in the Moral Language of COVID-19 Discussions. In Proceedings of the 2023 IEEE International Conference on Big Data (BigData), Sorrento, Italy, 15–18 December 2023; pp. 413–422. [Google Scholar]
- Dehghani, M.; Johnson, K.; Hoover, J.; Sagi, E.; Garten, J.; Parmar, N.J.; Vaisey, S.; Iliev, R.; Graham, J. Purity Homophily in Social Networks. J. Exp. Psychol. Gen. 2016, 145, 366. [Google Scholar] [CrossRef]
- Chan, E.Y. Moral Foundations Underlying Behavioral Compliance During the COVID-19 Pandemic. Personal. Individ. Differ. 2021, 171, 110463. [Google Scholar] [CrossRef]
- Díaz, R.; Cova, F. Reactance, Morality, and Disgust: The Relationship Between Affective Dispositions and Compliance With Official Health Recommendations During the COVID-19 Pandemic. Cogn. Emot. 2022, 36, 120–136. [Google Scholar] [CrossRef]
- Francis, K.B.; McNabb, C.B. Moral Decision-Making During COVID-19: Moral Judgements, Moralisation, and Everyday Behaviour. Front. Psychol. 2022, 12, 6484. [Google Scholar] [CrossRef]
- Hoover, J.; Portillo-Wightman, G.; Yeh, L.; Havaldar, S.; Davani, A.M.; Lin, Y.; Kennedy, B.; Atari, M.; Kamel, Z.; Mendlen, M.; et al. Moral Foundations Twitter Corpus: A Collection of 35k Tweets Annotated for Moral Sentiment. Soc. Psychol. Personal. Sci. 2020, 11, 1057–1071. [Google Scholar] [CrossRef]
- Indiana University’s Observatory on Social Media. Suspicious Twitter Activity around the Russian Invasion of Ukraine. 2022. Available online: https://osome.iu.edu/research/white-papers/Ukraine_OSoMe_White_Paper_March_2022.pdf (accessed on 29 September 2025).
- Pierri, F.; Luceri, L.; Jindal, N.; Ferrara, E. Propaganda and Misinformation on Facebook and Twitter during the Russian Invasion of Ukraine. In Proceedings of the 15th ACM Web Science Conference 2023 (WebSci), Austin, TX, USA, 30 April–1 May 2023; pp. 65–74, ISBN 9798400700897. [Google Scholar]
- Chen, E.; Ferrara, E. Tweets in Time of Conflict: A Public Dataset Tracking the Twitter Discourse on the War Between Ukraine and Russia. In Proceedings of the International AAAI Conference on Web and Social Media (ICWSM), Limassol, Cyprus, 5–8 June 2023; Volume 17, pp. 1006–1013. [Google Scholar]
- Pierri, F.; Luceri, L.; Chen, E.; Ferrara, E. How Does Twitter Account Moderation Work? Dynamics of Account Creation and Suspension on Twitter During Major Geopolitical Events. EPJ Data Sci. 2023, 12, 43. [Google Scholar] [CrossRef] [PubMed]
- Thapa, S.; Shah, A.; Jafri, F.A.; Naseem, U.; Razzak, I. A Multi-Modal Dataset for Hate Speech Detection on Social Media: Case-Study of Russia-Ukraine Conflict. In Proceedings of the 5th Workshop on Challenges and Applications of Automated Extraction of Socio-political Events from Text (CASE), Abu Dhabi, United Arab Emirates, 7–8 December 2022. [Google Scholar]
- Frimer, J.A.; Aujla, H.; Feinberg, M.; Skitka, L.J.; Aquino, K.; Eichstaedt, J.C.; Willer, R. Incivility is Rising Among American Politicians on Twitter. Soc. Psychol. Personal. Sci. 2023, 14, 259–269. [Google Scholar] [CrossRef]
- Kim, J.W.; Guess, A.; Nyhan, B.; Reifler, J. The Distorting Prism of Social Media: How Self-Selection and Exposure to Incivility Fuel Online Comment Toxicity. J. Commun. 2021, 71, 922–946. [Google Scholar] [CrossRef]
- Bianchi, F.; HIlls, S.; Rossini, P.; Hovy, D.; Tromble, R.; Tintarev, N. “It’s Not Just Hate”: A Multi-Dimensional Perspective on Detecting Harmful Speech Online. In Proceedings of the 2022 Conference on Empirical Methods in Natural Language Processing (EMNLP), Abu Dhabi, United Arab Emirates, 7–11 December 2022; pp. 8093–8099. [Google Scholar]
- Liu, Y.; Ott, M.; Goyal, N.; Du, J.; Joshi, M.; Chen, D.; Levy, O.; Lewis, M.; Zettlemoyer, L.; Stoyanov, V. RoBERTa: A Robustly Optimized BERT pretraining approach. arXiv 2019, arXiv:1907.11692. [Google Scholar]
- Nguyen, D.Q.; Vu, T.; Nguyen, A.T. BERTweet: A Pre-Trained Language Model for English Tweets. In Proceedings of the 2020 Conference on Empirical Methods in Natural Language Processing (EMNLP): System Demonstrations, Online, 16–20 November 2020; pp. 9–14. [Google Scholar]
- Song, K.; Tan, X.; Qin, T.; Lu, J.; Liu, T.-Y. MPNet: Masked and Permuted Pre-Training for Language Understanding. Adv. Neural Inf. Process. Syst. 2020, 33, 16857–16867. [Google Scholar]
- Grover, A.; Leskovec, J. Node2vec: Scalable Feature Learning for Networks. In Proceedings of the 22nd ACM SIGKDD International Conference on Knowledge Discovery and Data Mining (KDD), San Francisco, CA, USA, 13—17 August 2016; pp. 855–864. [Google Scholar]
- Zhang, J.; Dong, Y.; Wang, Y.; Tang, J.; Ding, M. Prone: Fast and Scalable Network Representation Learning. In Proceedings of the Twenty-Eighth International Joint Conference on Artificial Intelligence (IJCAI-19), Macao, China, 10–16 August 2019; Volume 19, pp. 4278–4284. [Google Scholar]
- Hamilton, W.; Ying, Z.; Leskovec, J. Inductive Representation Learning on Large Graphs. Adv. Neural Inf. Process. Syst. 2017, 1025–1035. [Google Scholar]
- Bosley, M.; Jacobs-Harukawa, M.; Licht, H.; Hoyle, A. Do We Still Need BERT in the Age of GPT? Comparing the Benefits of Domain-Adaptation and In-Context-Learning Approaches to Using LLMs for Political Science Research. In Proceedings of the 2023 Annual Meeting of the Midwest Political Science Association (MPSA), Chicago, IL, USA, 13–16 April 2023. [Google Scholar]
- Van der Maaten, L.; Hinton, G. Visualizing Data Using t-SNE. J. Mach. Learn. Res. 2008, 9, 2579–2605. [Google Scholar]
- Ferrara, E. Fairness and bias in artificial intelligence: A brief survey of sources, impacts, and mitigation strategies. Sci 2024, 6, 3. [Google Scholar] [CrossRef]


Disclaimer/Publisher’s Note: The statements, opinions and data contained in all publications are solely those of the individual author(s) and contributor(s) and not of MDPI and/or the editor(s). MDPI and/or the editor(s) disclaim responsibility for any injury to people or property resulting from any ideas, methods, instructions or products referred to in the content. |
© 2025 by the authors. Licensee MDPI, Basel, Switzerland. This article is an open access article distributed under the terms and conditions of the Creative Commons Attribution (CC BY) license (https://creativecommons.org/licenses/by/4.0/).