Article

Design of Experiments Applied to the Analysis of an H-Darrieus Hydrokinetic Turbine with Augmentation Channels

by
Angie J. Guevara Muñoz
1,*,
Miguel. A. Rodriguez-Cabal
2,
Edwin Chica
2,
Daniel Sanin Villa
3 and
Diego Hincapié Zuluaga
1
1
Department of Mechatronics and Electromechanics, Faculty of Engineering, Instituto Tecnólogico Metropolitano, Medellín 050013, Colombia
2
Department of Mechanical Engineering, Faculty of Engineering, University of Antioquia, Medellín 05001, Colombia
3
Área de Industria, Materiales y Energía, Universidad EAFIT, Medellín 050022, Colombia
*
Author to whom correspondence should be addressed.
Sci 2025, 7(3), 121; https://doi.org/10.3390/sci7030121
Submission received: 14 July 2025 / Revised: 12 August 2025 / Accepted: 25 August 2025 / Published: 2 September 2025
(This article belongs to the Section Computer Sciences, Mathematics and AI)

Abstract

This study presents a general 3 × 5 × 5 factorial experimental design to maximize the Power Coefficient (Cp) of an H-Darrieus hydrokinetic turbine equipped with external accessories. Five accessory configurations (standard, cycloidal, flat plate, curve, and blocking plate), three solidity levels, and five Tip-Speed Ratio (TSR) levels were evaluated as main factors under the hypothesis that these factors significantly influence Cp. The data analyzed were obtained from numerical simulations, and their processing was conducted using Analysis of Variance (ANOVA), linear regression models, and response surfaces in the software programs Minitab 21 and RStudio V4.4.2. ANOVA makes it possible to determine the statistical significance of the effect of each factor and their interactions on the obtained Cp, identifying the accessories, TSR, and solidity that have the greatest impact on turbine performance. The results indicate that the optimal configuration to maximize Cp includes the flat-plate accessory, a solidity of 1.0, and a TSR of 3.2. From the linear regression models, mathematical relationships describing the system’s behavior were established, while the response surface analysis identified optimal operating conditions. These findings provide an effective tool for optimizing H-Darrieus turbine designs, highlighting the positive impact of accessories on performance improvement.

1. Introduction

Hydrokinetic turbines are a developing technology for renewable electricity generation, harnessing water currents in rivers, artificial channels, and oceans without requiring dam infrastructure. Their primary advantage lies in their ability to convert the kinetic energy of water flow into mechanical energy and subsequently into electrical energy with a lower environmental footprint compared to conventional hydroelectric generation systems. However, the development and optimization of these turbines remain a technical challenge, requiring the use of analytical and computational tools to improve their efficiency and hydrodynamic performance.
Hydrokinetic turbines are generally classified into two main types: Horizontal Axis Water Turbines (HAWT) and Vertical Axis Water Turbines (VAWT) [1]. Among hydrokinetic turbines, the H-Darrieus turbine, a type of VAWT, offers significant advantages in terms of design and manufacturing due to its compact structure, absence of flow-orientation mechanisms, and simplicity of construction [2]. The design of H-Darrieus turbines is determined by the water-flow characteristics at the installation site, with key factors being current velocity, channel depth, and flow direction. These elements define the available kinetic energy and, consequently, the optimal turbine geometry to maximize performance [3]. The blades, typically configured in two or three units, must feature a hydrodynamic profile optimized for operation in water, such as NACA profiles [4], with curvatures designed to improve the Cp. Turbine efficiency is directly influenced by the Tip-Speed Ratio (TSR), which is typically optimized to ensure a balance between torque generation and drag minimization. Furthermore, the rotor solidity, defined as the ratio of blade area to swept area, plays a fundamental role in turbine performance, particularly in low-velocity flows where higher solidity can improve energy capture [5].
In this regard, the Design of Experiments (DoE) applied to Computational Fluid Dynamics (CFD) has become a key tool for optimizing the design of hydrokinetic turbines, particularly H-Darrieus turbines [6]. This approach enables efficient exploration of the design space, identifying key parameters such as solidity, TSR, and the incorporation of passive accessories that influence turbine performance. Moreover, the use of DoE significantly reduces the number of simulations required to achieve optimal configurations, which in turn minimizes computational costs without compromising result accuracy [7]. The combination of DoE with CFD not only facilitates the identification of complex interactions between design factors but also enables the construction of predictive models based on statistical regression and response surface analysis, enhancing the designers’ ability to extrapolate and generalize results to different operating conditions [8]. This systematic approach contributes to the continuous optimization of hydrokinetic turbines, enabling the implementation of innovations that improve their efficiency and viability in renewable energy applications and thereby accelerating their development and commercialization [9].
In general terms, the hydrodynamic efficiency of an H-Darrieus turbine is highly dependent on geometric and operational parameters. Furthermore, its performance can be improved through the incorporation of external accessories, which can modify the incident-flow profile and reduce hydrodynamic losses [10]. Given the potential of these turbines to contribute to the diversification of the renewable energy matrix, the development of experimental and numerical methodologies to evaluate and optimize their behavior is relevant in the field. In this context, techniques such as DoE, Analysis of Variance (ANOVA), and response surface modeling, combined with advanced numerical simulations, represent key strategies to improve the efficiency and viability of H-Darrieus hydrokinetic turbines in real-world applications.
The specialized literature includes several studies focused on maximizing the power coefficient of H-Darrieus turbines. In a 2023 paper, Enderaaj et al. [11] assess the variability of this coefficient in four turbines situated at the cooling tower’s outlet. The turbines had diameters matching 100, 80, 65, and 50% of the tower’s outlet diameter, and all had the same solidity. These were evaluated at different TSRs (1.5–3.5), and it was found that the best power coefficient (0.294) was achieved with the turbine with a diameter equal to 80% of the diameter of the tower outlet and a TSR of 2.5. The type, thickness, and length of the chord of the profile used for turbine construction affect this coefficient. NACA profiles were used by Ghiasi et al. [12], including two symmetrical profiles (0018 and 0022) and asymmetrical profiles (4418) with two distinct chord lengths (0.1 and 0.2 m). The power coefficient of the asymmetric profiles is higher for TSRs over 2.25, while the power coefficient of the NACA 0018 is lower for TSRs below 2. Modifications to the profile surfaces can also increase the power coefficient. According to Korukçu [13], the power coefficient of H-Darrieus turbine profiles can be increased by 5.18% compared to standard blades by placing a circular dimple on them. In studies conducted in the field of external accessories, several authors have reported that the power coefficient can be improved by incorporating devices that affect the fluid behavior. For example, Patel et al. [14] investigated performance improvement using flat and concave blocking plates in open channels. They introduced the width ratio (WR) and distance ratio (DR) to characterize plate dimensions and positioning, finding that a concave plate with 101 mm width (WR = 0.36) and 80 mm distance (DR = 0.286) yielded the highest Cp (0.245) at TSR = 0.999, representing an 18.45% improvement. For flat plates, the best performance (Cp = 0.229) was achieved with the same width but at 40 mm distance (DR = 0.143), with an improvement of 10.92%. Plates exceeding WR = 0.453 showed reduced performance due to excessive flow blockage. Guevara et al. [15] analyzed two H-Darrieus turbine configurations using CFD and DoE-ANOVA, concluding that solidity and plate position significantly affect performance, with solidity being the more influential factor. The optimal setup was solidity 1.35 with the plate at 0.665 m; this configuration increased the maximum moment coefficient by 10.6% and the minimum by 20%. Tunio et al. [16] found that using ducts boosts energy production by 112% but also doubles hydraulic loads and stresses (up to 178.5 MPa), especially in the shaft–arm junction, requiring structurally optimized designs. Aditionally, Chen et al. [17] utilized a configuration of double deflectors and achieved increases in the power coefficient of 70.27% and 117.14% for TSRs of 1.25 and 2.25, respectively, in comparison to the bare turbine. Similarly, Guevara et al. [18] conducted 2D transient simulations in ANSYS Fluent and found that increasing rotor solidity improves peak power output but narrows the optimal TSR range.
As evidenced in the review of the specialized literature, the inclusion of external accessories in the design of hydrokinetic turbines can enhance their hydrodynamic performance, thereby increasing efficiency by improving the power coefficient (Cp). However, achieving an appropriate design typically requires conducting extensive simulations to evaluate possible configurations and determine the optimal solution for specific operating conditions. In this context, the present study performs a statistical analysis based on a general full factorial design and linear regression models. The experimental data analyzed are taken from a previous study entitled “2D Numerical Analysis of an H-Darrieus Hydrokinetic Turbine with Passive Improvement Mechanisms” [18], in which a 3 × 5 × 5 factorial design was conducted to assess the influence of three main variables (Tip-Speed ratio (TSR), solidity, and type of external accessory) on the resulting power coefficient. The effect of each variable is quantified through ANOVA, linear regression, and response surface analysis using statistical tools such as Minitab 21 and RStudio V4.4.2. The results will identify the optimal combination of factors needed to maximize Cp, along with a set of equations that model the phenomenon. These equations are intended to serve as a design guideline for improving H-Darrieus turbines to reduce the number of simulations required for the proper design of hydrokinetic turbines under low-flow conditions and thereby promote their use in renewable-energy applications.

2. Materials and Methods

Optimizing Cp in hydrokinetic turbines requires analytical methodologies that can efficiently evaluate multiple factors. DoE is a statistical tool that facilitates experiment planning and execution by reducing the number of tests necessary while maximizing the amount of information obtained with regard to the influence of factors on the response variable. Various DoE strategies exist, and each has advantages and limitations. The most basic method is One Variable at a Time (OVAT) analysis, in which only one parameter is varied while the others remain constant. Although it is intuitive and easy to implement, it has severe limitations: it cannot detect factor interactions, and it requires extensive testing to thoroughly explore the design space, making it inefficient and prone to biased interpretations. In contrast, full-factorial designs analyze all possible factor-level combinations, enabling evaluation of both main effects and their interactions. However, their primary disadvantage is that the number of experiments grows exponentially with factors and levels, potentially making them unfeasible for studies with multiple variables. To address this issue, fractional factorial designs are employed; these designs reduce the number of required tests by selecting a representative subset of combinations, sacrificing some resolution in detecting higher-order interactions. Another alternative involves using DoE with Response Surface Methodology (RSM), which focuses on modeling the factor–response relationship through mathematical functions fitted to experimental data. This approach proves particularly useful when the objective is to find optimal conditions within continuous value ranges rather than to evaluate fixed configuration sets.
This study has implemented a general 3 × 5 × 5 factorial design; this design enables simultaneous analysis of three key factors (solidity, accessory configuration, and TSR) based on the previous CFD study [18]. These factors were selected due to their direct influence on the hydrodynamic performance and energy-conversion efficiency of H-Darrieus turbines. Solidity determines the blade loading and wake behavior; accessory configuration alters the inlet flow conditions; and TSR governs the rotor’s dynamic interaction with the flow. These characteristics were systematically varied in the CFD simulations. Furthermore, this approach allows for the identification of both individual effects and factor interactions, providing key information to optimize the performance of the H-Darrieus turbine. A total of 75 experimental configurations were selected for statistical evaluation. These configurations were originally generated and simulated using ANSYS Fluent. Table 1 presents the considered factors and their corresponding levels, with the TSR examined in the range from 1.5 to 3.5 by adjusting the angular velocity of the turbine. The Cp is defined as the response variable that enables quantification of the hydrodynamic performance of the turbine under different operating conditions.
Figure 1 shows the NACA 0018 profile scaled to three chord lengths: 160 mm, 203 mm, and 268 mm, corresponding to solidities of 1.0, 1.35, and 1.79, respectively. It can be seen that although the shape remains the same, the dimensions of the profile change proportionally.
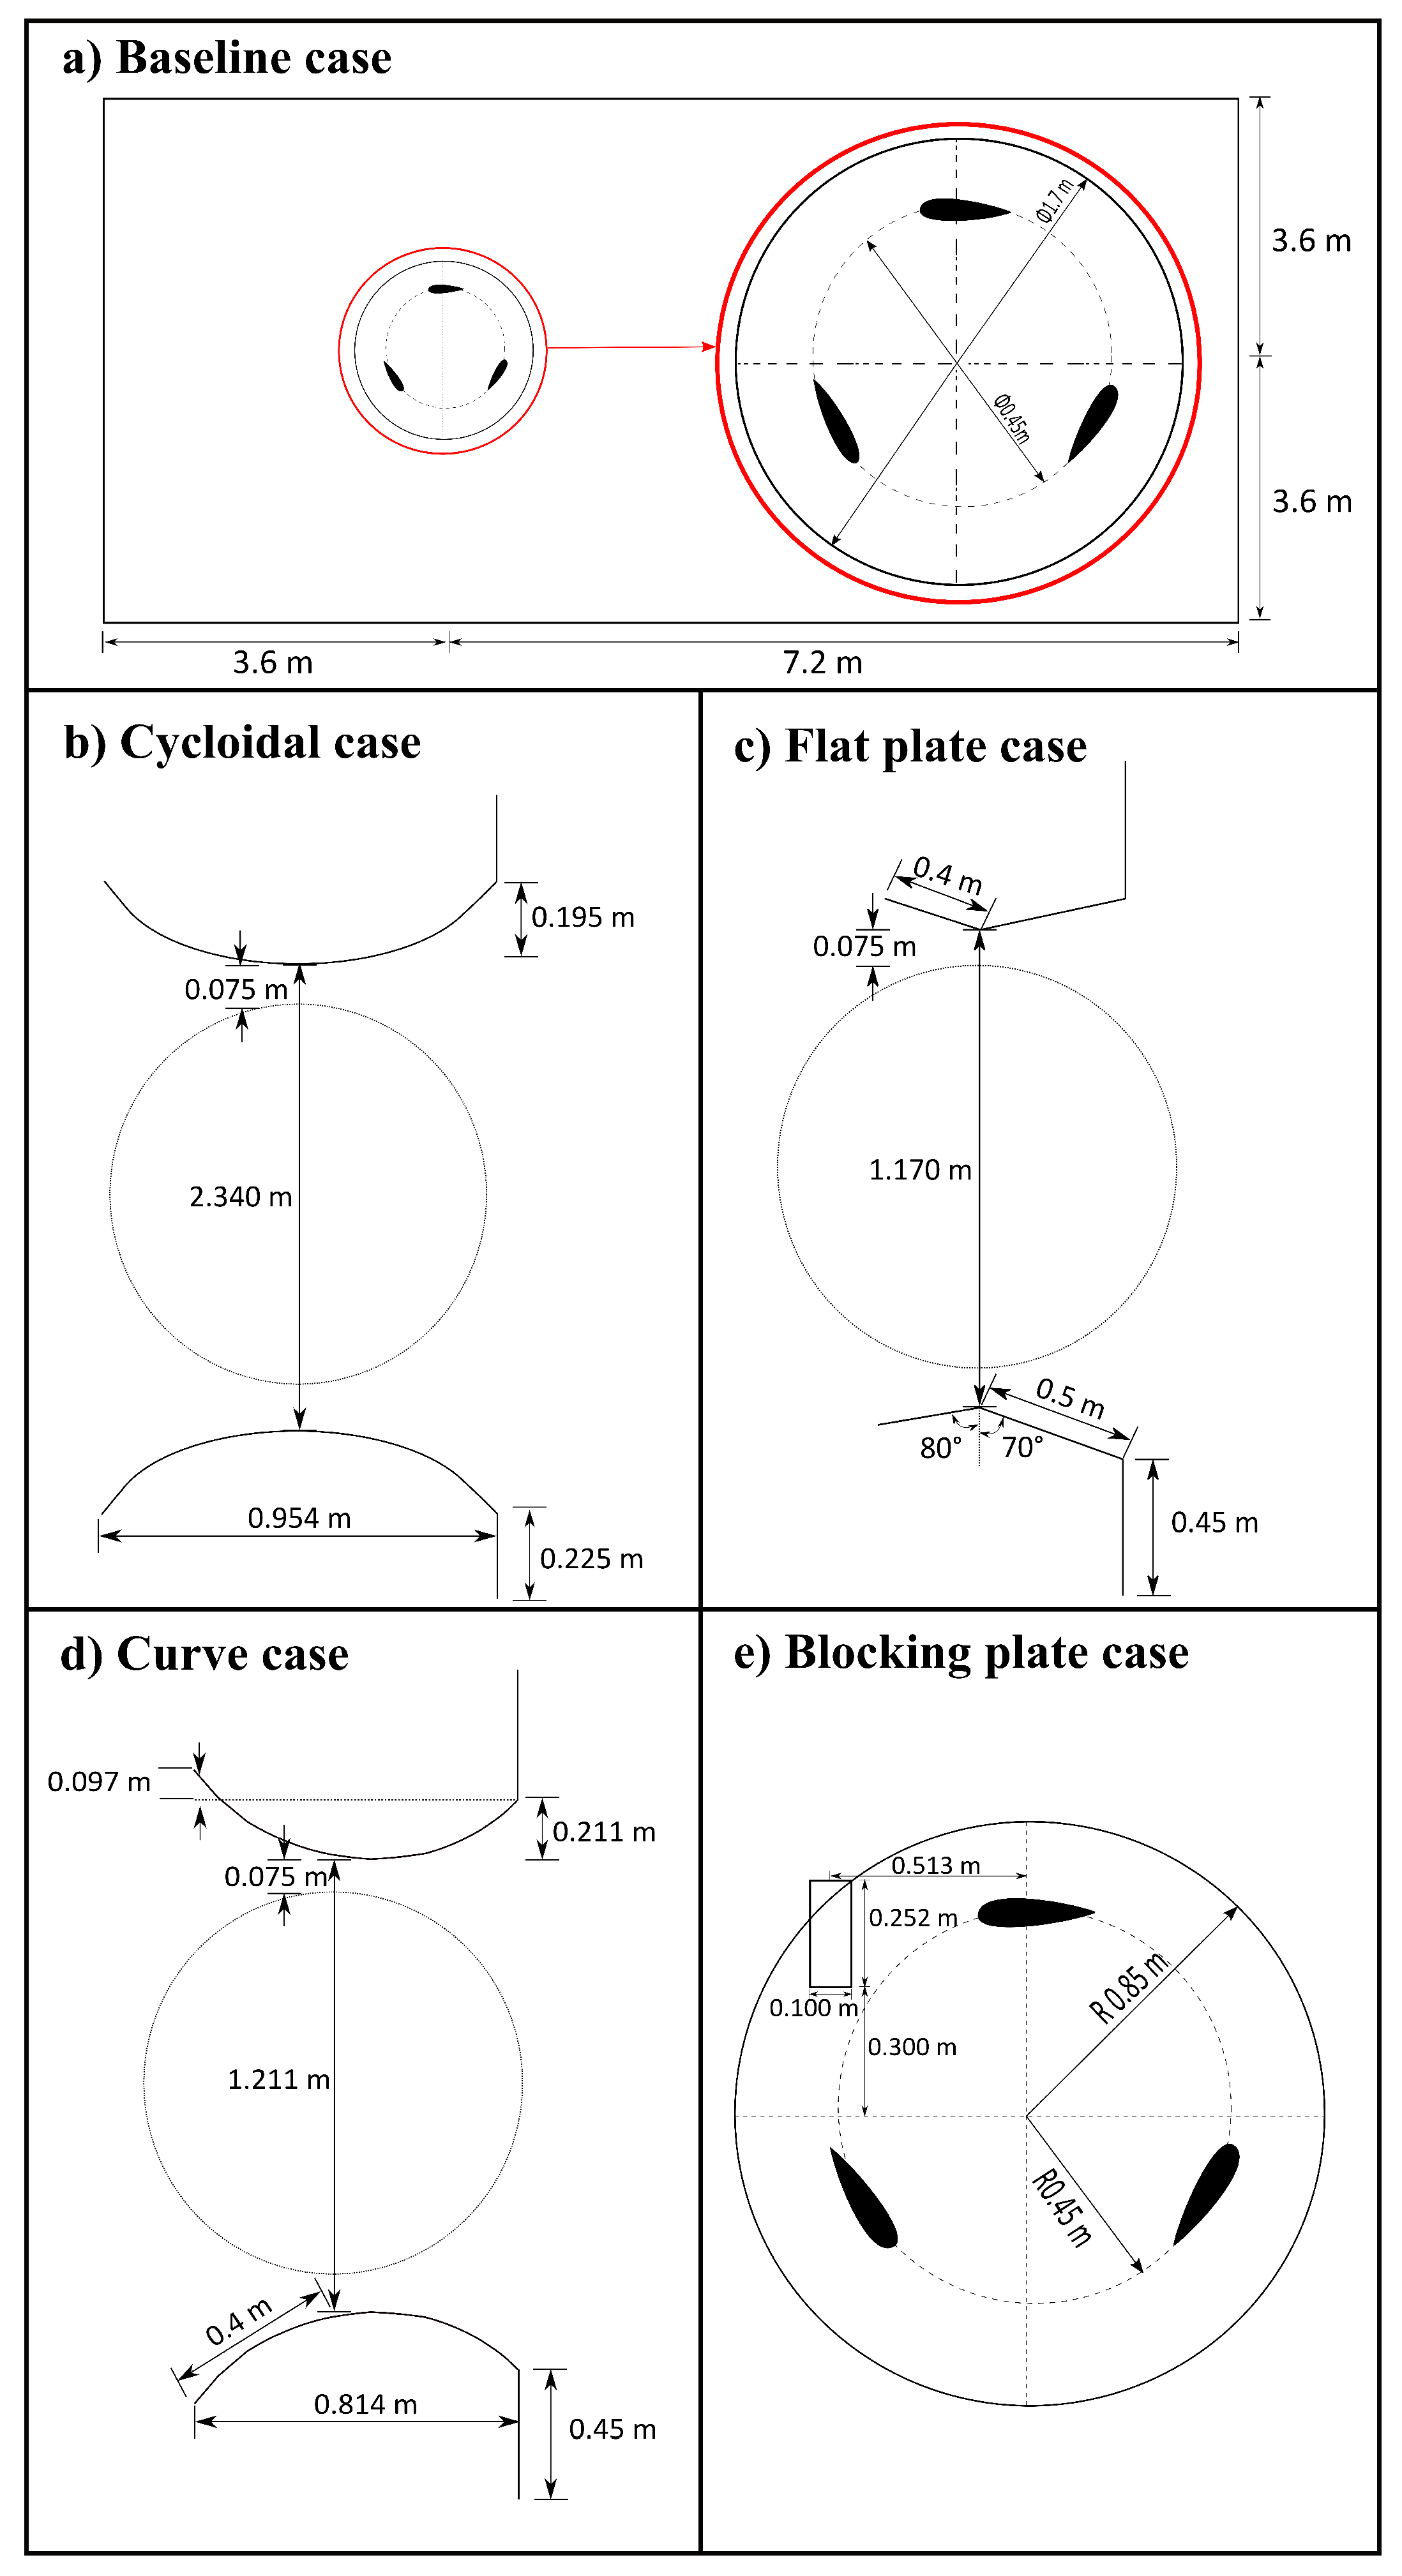
This study evaluated five configurations of external accessories designed to modify the interaction of flow with the H-Darrieus turbine and optimize its hydrodynamic performance. The standard configuration corresponds to the turbine without additional accessories and serves as a reference for analyzing the impact of other devices on the Cp. The cycloidal accessory features a geometry inspired by cycloidal profiles and was designed to improve flow acceleration around the blades and reduce boundary-layer separation losses. On the other hand, the flat plate consists of a strategically positioned planar surface that modifies the flow-circulation pattern, promoting flow redirection and enhancing energy transfer to the turbine. The curved configuration incorporates a curved profile that redirects flow toward the blades, optimizing lift generation while minimizing energy losses associated with fluid dispersion. Finally, the blocking plate acts as a partial flow barrier in specific turbine regions, increasing differential pressure and improving blade thrust. These geometric configurations are presented in Figure 2, which illustrates their dimensions and positions relative to the turbine.
The numerical simulations corresponding to the 75 treatments in this study were conducted by some of the authors of this work, and their methodological details, validation, and results can be found in the previously published literature [18]. This study focuses on the application of DoE techniques and ANOVA analysis to data previously obtained through simulations, aiming to optimize the performance of the H-Darrieus turbine using the RSM. A full factorial design was used, given that simulations corresponding to all parameter combinations were already available. Employing a fractional design or another partial exploration strategy would mean omitting valuable information that has already been generated. Furthermore, this design allows for accurate identification of the main effects and interactions between key factors such as TSR and solidity. For modeling, RSM was selected due to its ability to fit interpretable polynomial models, which capture nonlinear relationships and facilitate optimization. Although more complex methods such as artificial neural networks or kriging are available, RSM represents a suitable option due to its balance of accuracy, computational efficiency, and interpretability, considering the volume and nature of the available data.
The simulations used a realizable k ε turbulence model (URANS) with a constant inlet velocity of 1 m/s, atmospheric pressure at the outlet, and no-slip wall conditions. The computational domain was divided into stationary and rotating zones, which were coupled through the overset method to handle rotational motion. Three solidity levels ( σ = 1.0 , 1.35, and 1.79) and four passive mechanisms (cycloidal, flat plate, curve, and blocking plate) were analyzed, with mesh independence validated using 133,000 elements. Similarly, in a previous study, a mesh-independence analysis found differences of less than 2% compared with the finest mesh; these results validate the representativeness of those findings. The data obtained from these simulations served as the basis for the experimental design and the subsequent statistical analysis presented in the results section. The analysis aimed to identify optimal configurations through predictive response surface models. Table 2 shows the Cp values determined for the 75 treatments evaluated in this study.
When designing a DoE, it is essential to establish two statistical hypotheses. The null hypothesis ( H 0 ) posits that there is no significant effect of the studied factors on the response variable, meaning that any observed variation is solely due to system randomness. In contrast, the alternative hypothesis ( H 1 ) maintains that at least one factor or interaction has a significant impact on the variable of interest. To evaluate these hypotheses, a significance level ( α ) is defined; this value establishes the probabilistic threshold beyond which H 0 is rejected in favor of H 1 , such that one can conclude that the factor in question influences the system response [19]. In the context of this study, the null hypothesis is formulated as follows: “Variations in solidity and the implementation of external accessories in H-Darrieus hydrokinetic turbines operating at different TSR values have no significant effect on their Cp.” Conversely, the alternative hypothesis states that “At least one of these factors significantly affects the turbine’s power coefficient: solidity, external accessories, or TSR.” To analyze these effects, a general factorial statistical model is employed, as expressed in Equation (1) [20]. The use of a general factorial model in this analysis is justified by the need to simultaneously evaluate the effect of both categorical and continuous variables on the turbine’s power coefficient. Specifically, “Accessories” is a categorical factor representing distinct configurations (e.g., presence or absence of additional components). In contrast, “Solidity” and “TSR” are continuous variables that are experimentally varied within defined ranges. Although factorial models are commonly associated with categorical factors, they are fully compatible with mixed-variable designs, enabling the modeling of both main effects and potential interactions. This approach is essential for understanding how the presence of accessories influences turbine performance under the different hydrodynamic conditions represented by Solidity and TSR. Furthermore, the model provides a robust statistical framework for evaluating the significance of individual and combined effects, offering a comprehensive understanding of the system’s behavior across operational scenarios.
Y i j k l = μ + α i + β j + γ k + ( α β ) i j + ( α γ ) i k + ( β γ ) j k + ( α β γ ) i j k + ε i j k l ; i = 1 , 2 , , a ; j = 1 , 2 , , b ; k = 1 , 2 , , c ; l = 1 , 2 , , n
where Y i j k l is the observed response (power coefficient, Cp); μ represents the overall mean of the experiment; and α i , β j , and γ k are the main effects of factors A, B, and C, respectively. ( α β ) i j , ( α γ ) i k , ( β γ ) j k represent the second-order interactions between factors and ( α β γ ) i j k denotes the third-order interaction among all three factors simultaneously. ε i j k l corresponds to the random error associated with each experimental treatment. The indices vary according to the number of levels and experimental replicates. i = 1 , 2 , , a (levels of factor A: solidity), j = 1 , 2 , , b (levels of factor b: accessories), k = 1 , 2 , , c (levels of factor C: TSR), l = 1 , 2 , , n (experimental replicates). This model enables decomposition of the system’s variability into main effects and interactions, providing a detailed analysis of each factor’s impact on turbine performance. Through ANOVA, the statistical significance of these effects is evaluated, facilitating identification of optimal design combinations and contributing to improving the efficiency of H-Darrieus hydrokinetic turbines. The statistical analysis of Table 2 data was performed using Minitab 21 with the aim of identifying the optimal configuration that maximizes the performance of H-Darrieus hydrokinetic turbines. Some Cp values exceeding unity were observed, and this result was attributed to the effect of external accessories on the turbine because these accessories increase the incident mass flow through the rotor. This phenomenon enables the system to surpass the Betz limit, as reported in previous studies [21,22,23]. To analyze system behavior across a broader range of operating conditions, linear regression models were established to predict relationships between the study’s dependent and independent variables. In this case, a non-hierarchical structure was adopted, providing greater analytical flexibility by treating observations as independent and thereby facilitating pattern detection without imposing prior structural constraints [24]. The selection of the most suitable regression model was conducted through rigorous statistical criteria. The significance of coefficients was evaluated indirectly using metrics such as the coefficient of determination ( R 2 ) and adjusted R 2 , which quantify the model’s predictive capacity while adjusting this measure according to the number of predictors. Additionally, the Bayesian Information Criterion (BIC) and Akaike Information Criterion (AIC) were implemented; both are widely used in model selection due to their ability to penalize model complexity and prevent overfitting [25]. Model processing and fitting were performed using RStudio V4.4.2 software to ensure precise and reliable statistical analysis. These tools enabled optimized data interpretation and guaranteed the solidity of the obtained conclusions.

3. Results and Discussion

3.1. ANOVA

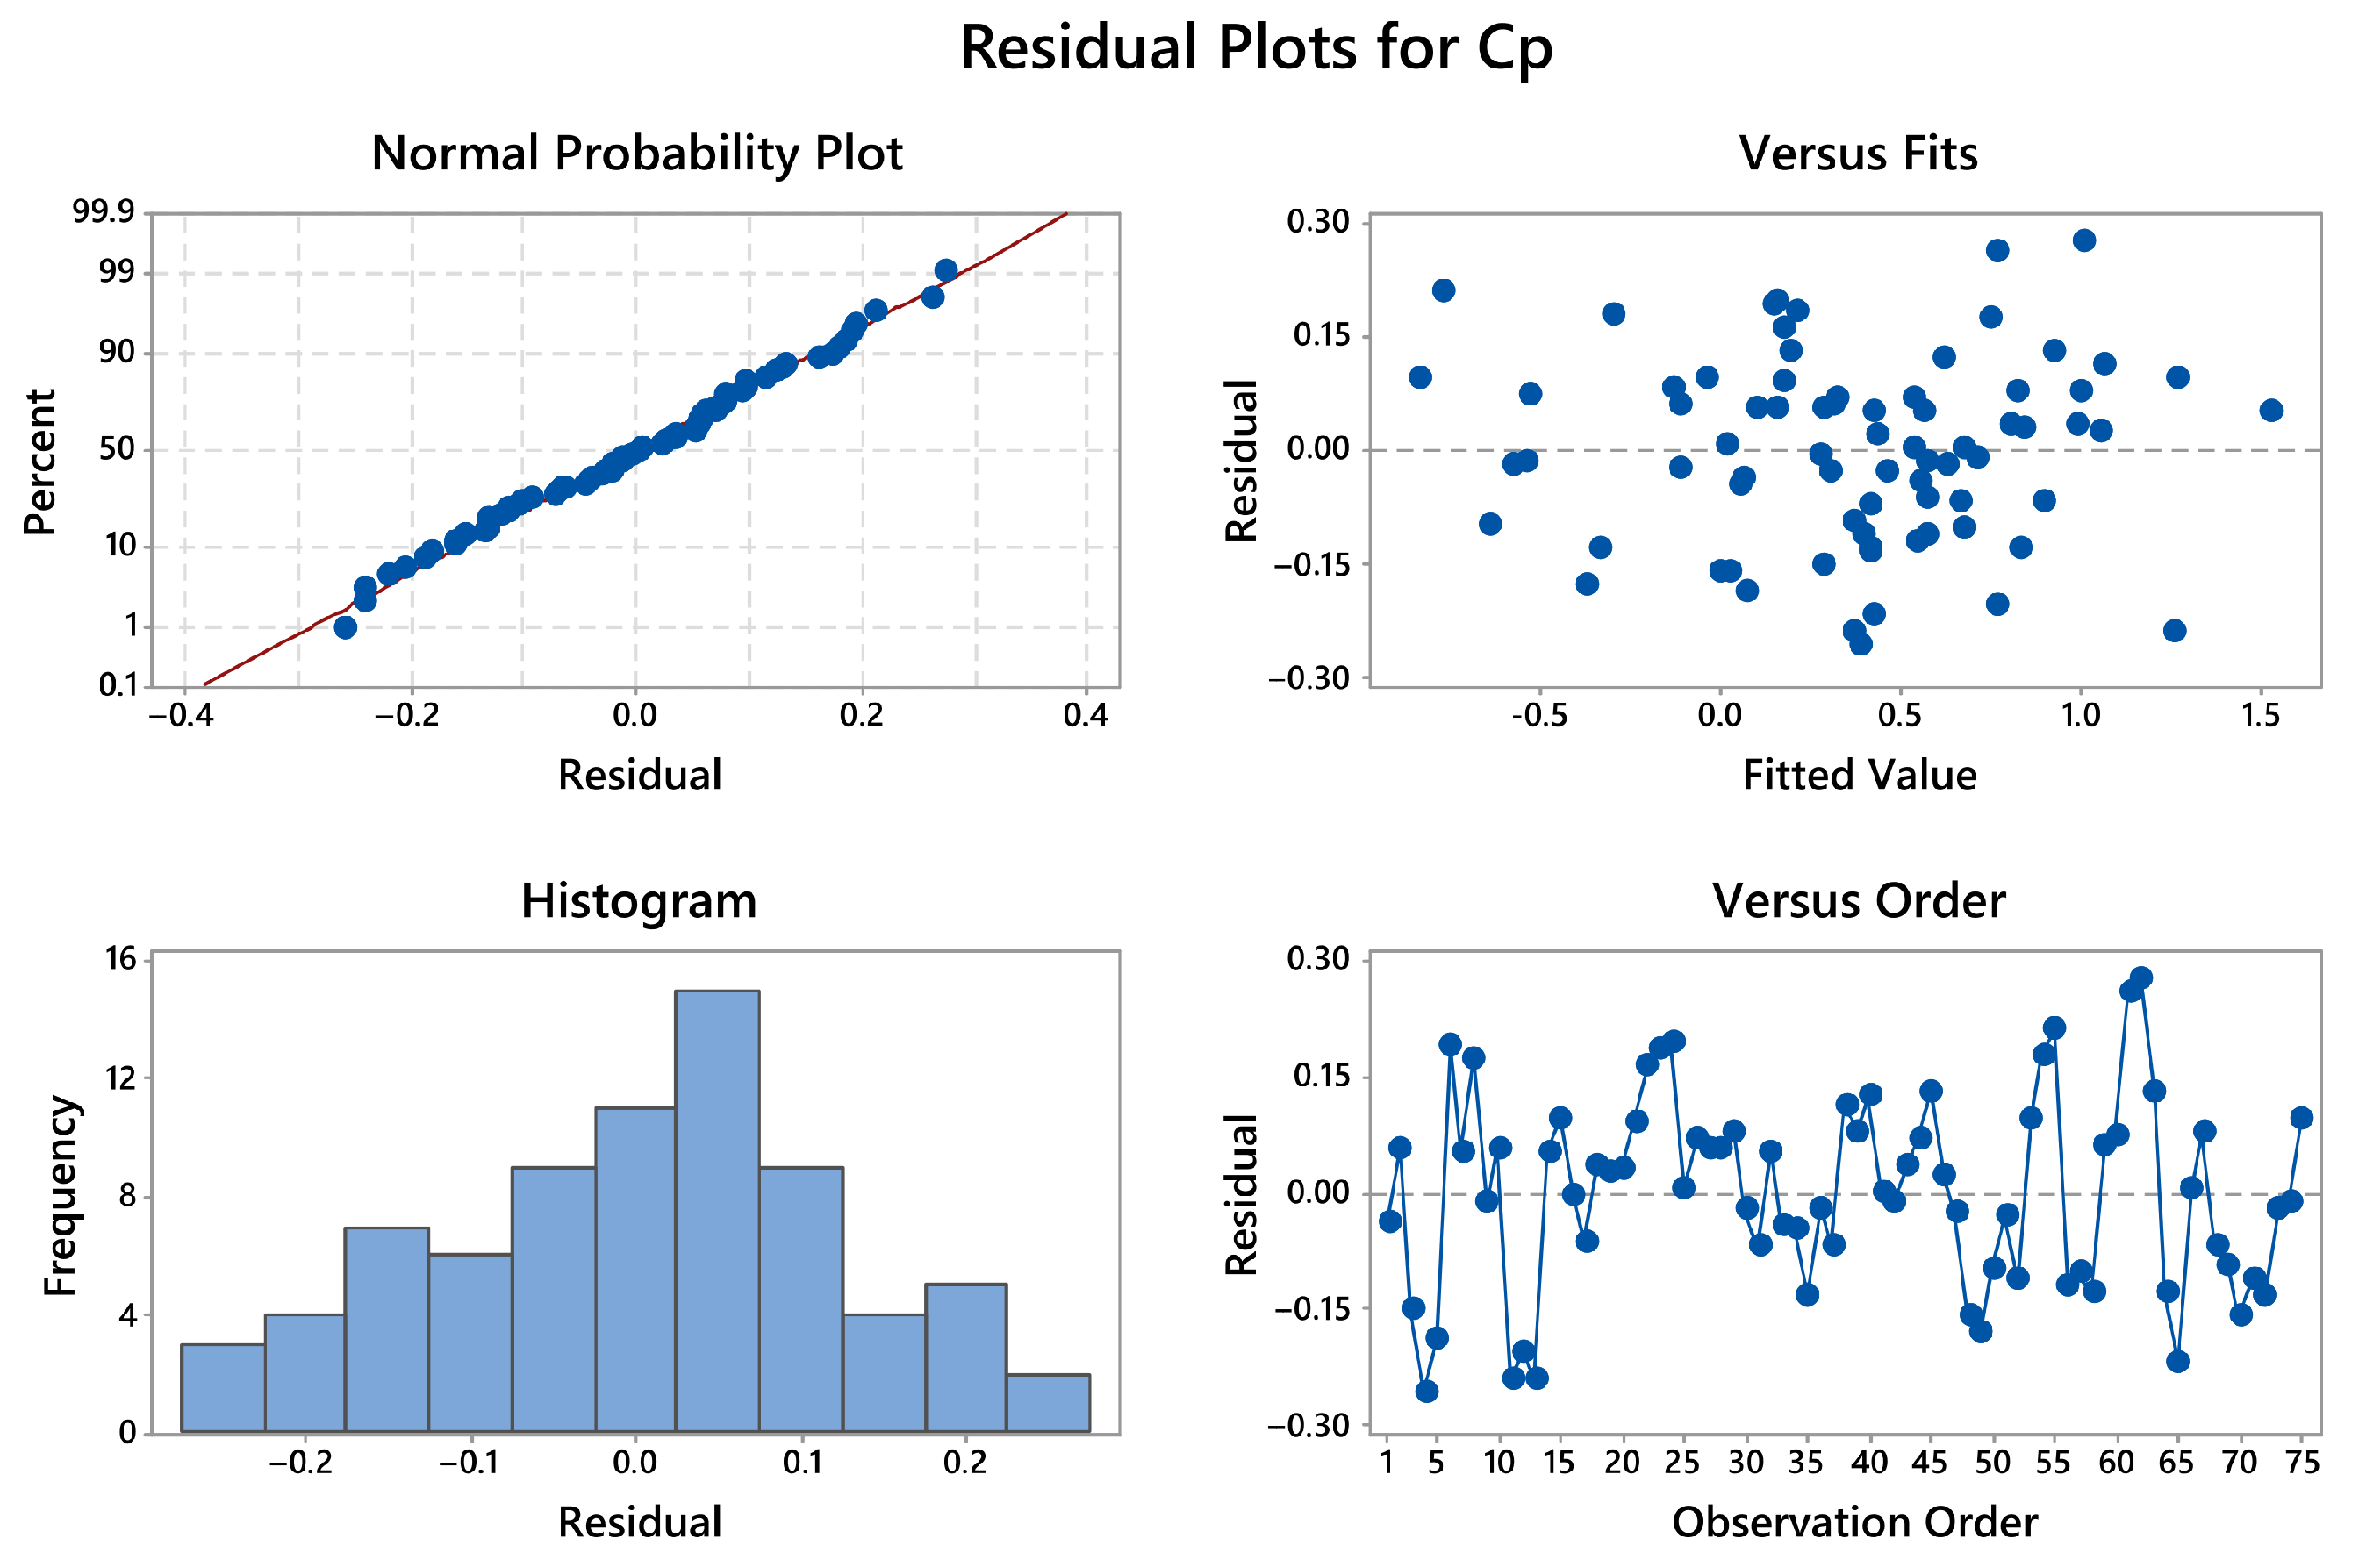
To determine which factors most significantly influence Cp, an ANOVA was performed by calculating the sum of squares, estimated effect, least squares mean, and F-values and p-values for the three evaluated factors and their two-way interactions. Table 3 presents the initial ANOVA results; there, the triple interaction was integrated into the residual error term because its inclusion in designs with limited replications and fractional factorials can compromise the reliability of the estimates due to the restriction of degrees of freedom, making statistical interpretation difficult [26]. This study employed a significance level of α = 0.05 , as recommended by [27]. The assumptions of normality, constant variance, and residual independence were verified through graphical methods, as shown in Figure 3, [28]. The normal probability plot shows a distribution approximating normality (with points closely following the reference line). Similarly, the residuals-versus-fitted-values plot indicates that the residuals are randomly distributed, confirming constant variance. The residual histogram reveals normally distributed data without skewness. Finally, the residual-versus-observation-order plot demonstrates residual independence, as no discernible trends or patterns are evident.
Any effect with a p-value smaller than the established alpha level (0.05) is considered statistically significant, meaning the null hypothesis is rejected and we conclude that the corresponding effect influences the efficiency of H-Darrieus hydrokinetic turbines. The exploratory evaluation revealed that the p-value of the Solidity × Accessories two-way interaction was slightly above 0.05; therefore, this interaction was removed from the ANOVA. Table 3 shows that all remaining p-values are statistically significant, confirming the alternative hypothesis and leading us to reject the null hypothesis. This demonstrates that changes in solidity or the implementation of external accessories in H-Darrieus turbines configured with different TSRs affect their power coefficients. Furthermore, the F-value indicates whether the terms included in the model are related to the response variable. The high F-values for Accessories and TSR suggest these terms have a significant influence on Cp, while Solidity’s influence is comparatively minor. In the context of an H-Darrieus hydrokinetic turbine equipped with external accessories, the factors Solidity, Tip-Speed Ratio (TSR), and Accessories, along with their two-term interactions (Solidity × TSR, Accessories × TSR, and Solidity × Accessories), are significant because they collectively influence the turbine’s Cp, a key indicator of energy-conversion efficiency. Solidity governs the proportion of the rotor’s swept area occupied by blades, affecting the balance between torque and rotational speed; higher solidity generally enhances torque but may reduce efficiency at high TSR values. TSR, the ratio of blade-tip speed to water velocity, determines how effectively kinetic energy from the flow is transferred to the rotor, with an optimal range specific to each turbine configuration. The factor Accessories, evaluated in five configurations (standard, cycloidal, flat plate, curve, and blocking plate), alters the flow field around the rotor, redirecting or accelerating the incoming stream to increase the pressure differential across the blades. The Solidity × TSR interaction is important because the hydrodynamic behavior of the blades changes with different solidity values under varying rotational speeds. The Accessories × TSR interaction reflects how the effectiveness of external flow modifiers depends on the rotor’s speed relative to the flow. Finally, the Solidity × Accessories interaction is also significant, as the influence of the accessories may vary depending on the blade density; for instance, flow-control devices might be more effective or detrimental depending on how much blockage the blades themselves already introduce. Together, these factors and their interactions highlight the complex and interdependent nature of hydrokinetic turbine performance, justifying a factorial modeling approach to fully capture their influence on Cp.
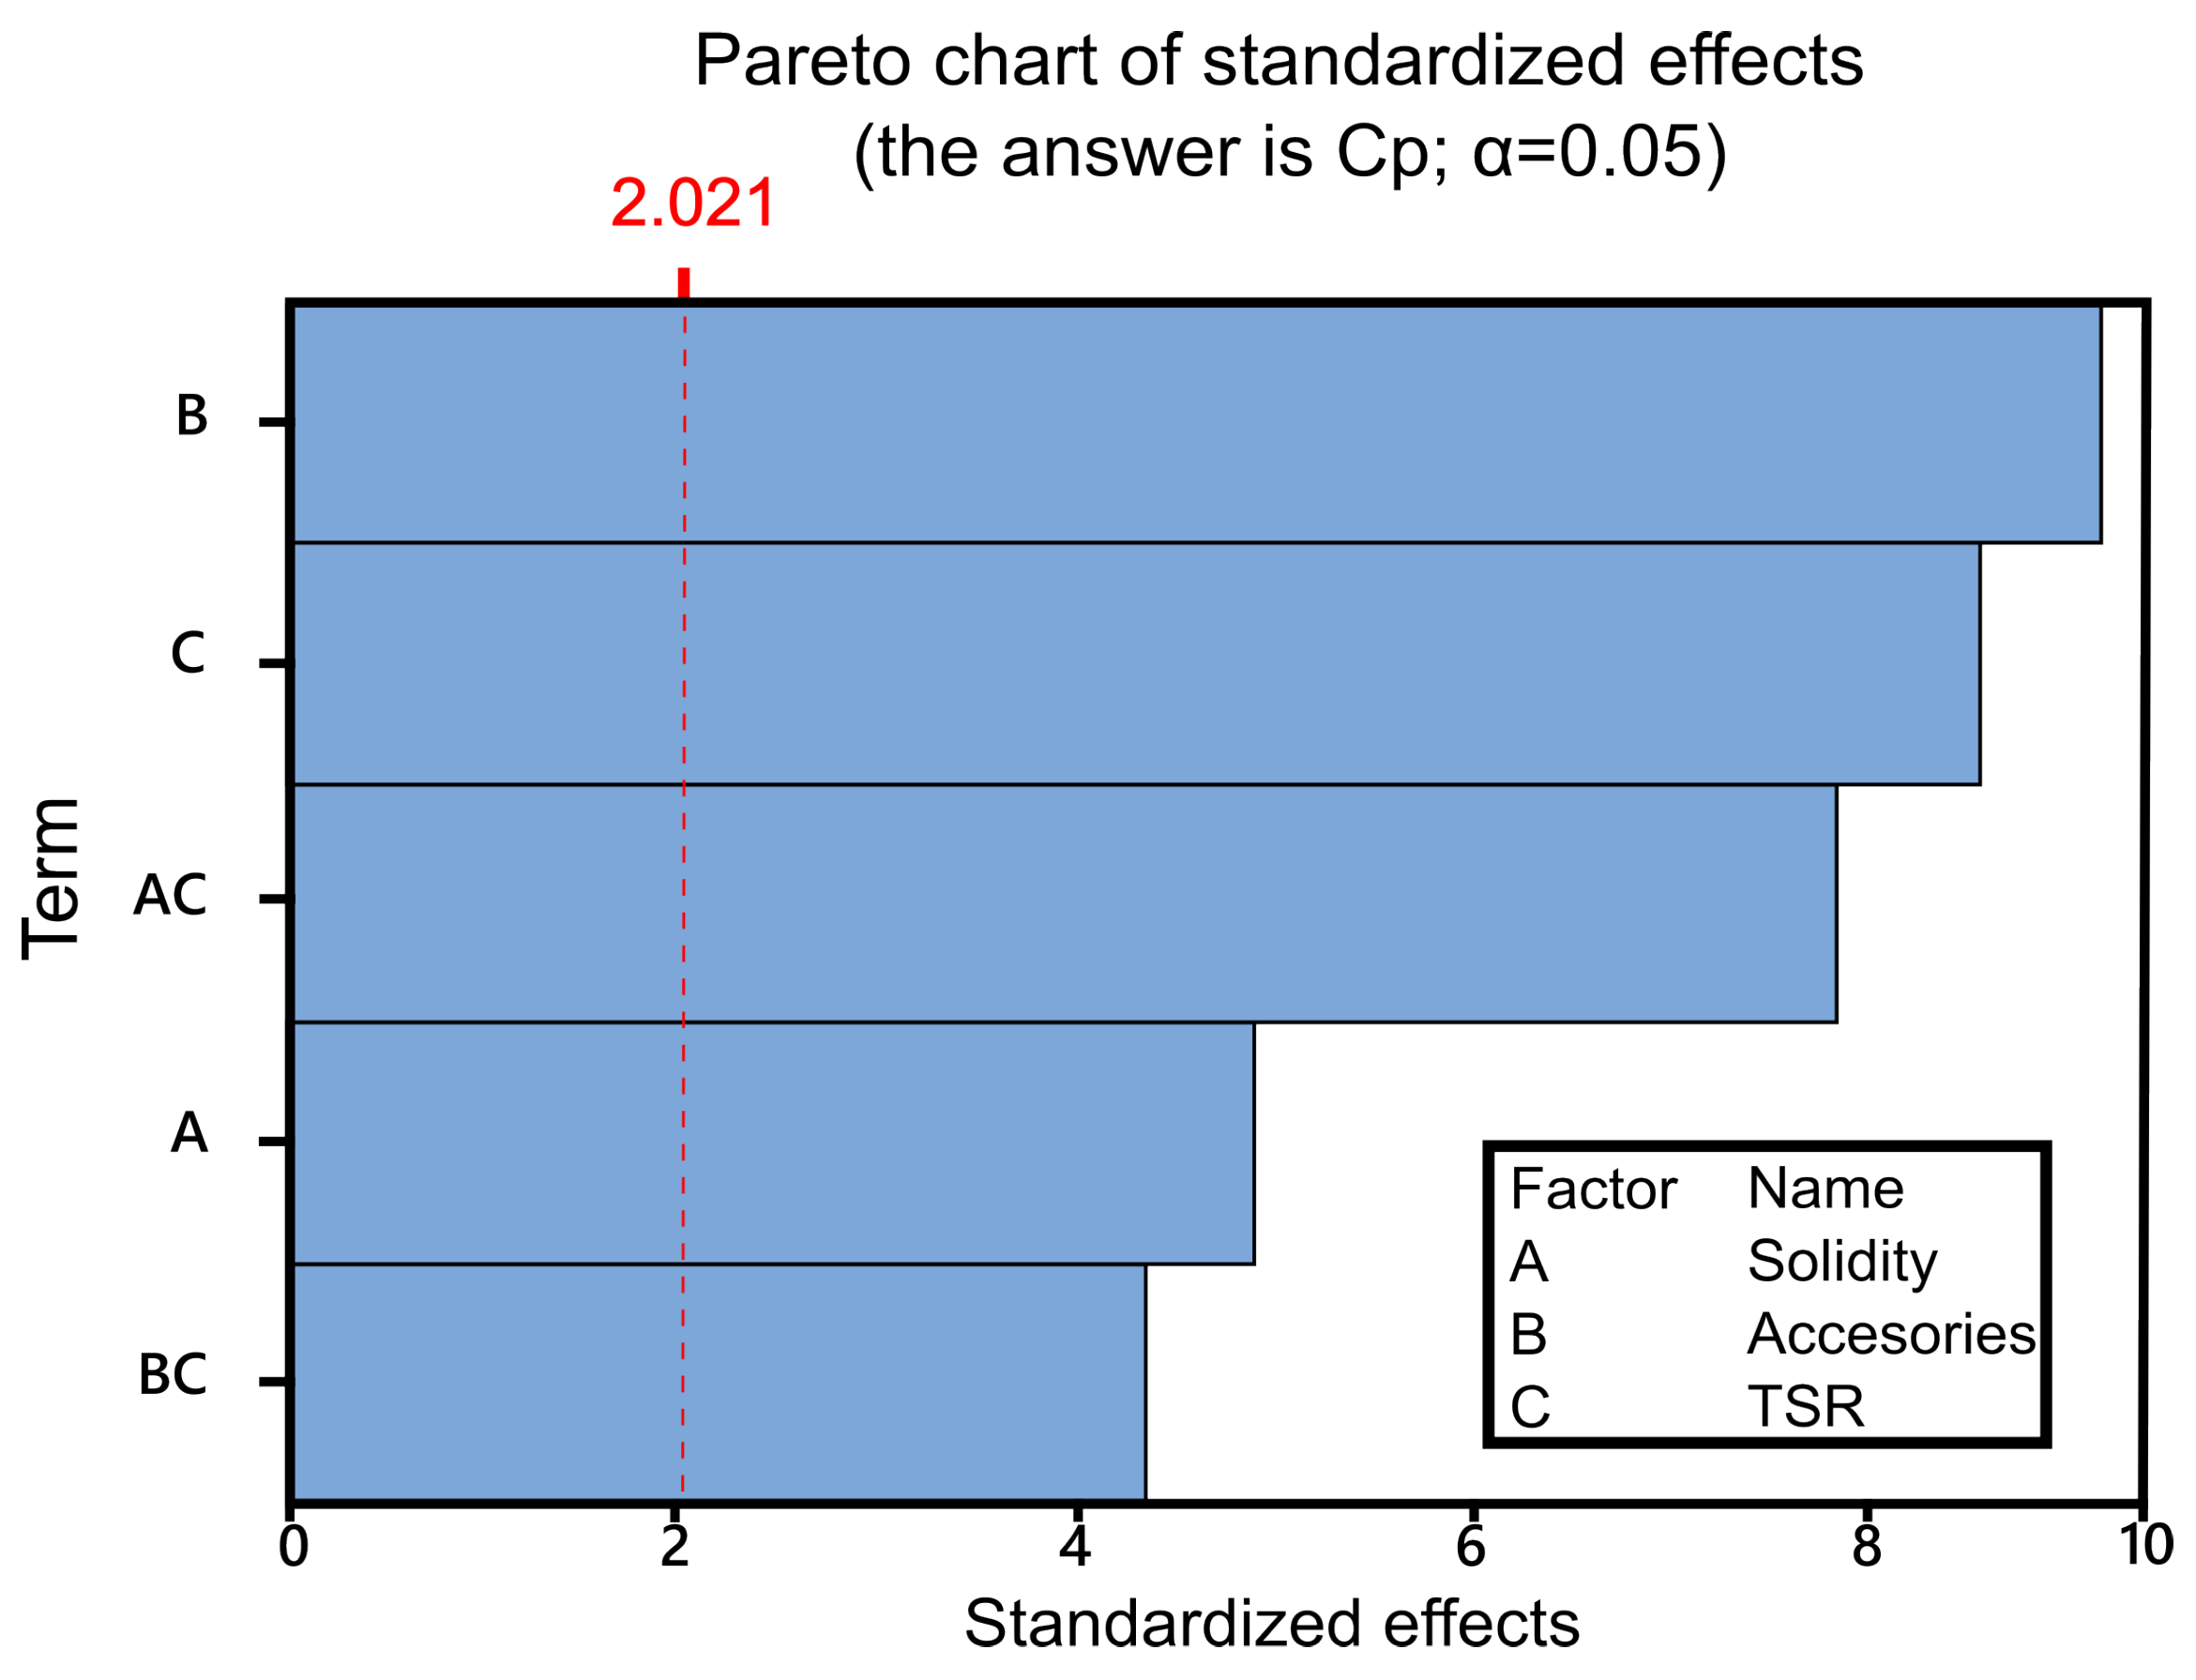
The Pareto chart displays the magnitude and importance of individual effects and their respective combinations, with the reference line (red line) indicating which effects are statistically significant [29]. In a preliminary exploratory analysis, all possible interactions were evaluated and the interaction between factors A and B (AB) was found to be non-significant, which is why it was integrated into the residual error term. As can be seen in Figure 4, all main effects and the remaining interactions exceed the threshold for statistical significance. Among them, the factors corresponding to accessories and the TSR have the most pronounced effects, indicating their dominant influence on the behavior of the Cp.
Table 4 presents the refined ANOVA model summary after case filtering. Sd represents the standard deviation of the distance between the data values and the fitted value, while R-squared represents the correlation coefficient, showing the model’s predictive capability as a percentage. The reported values exceed 70%, indicating an acceptable correlation level [20].
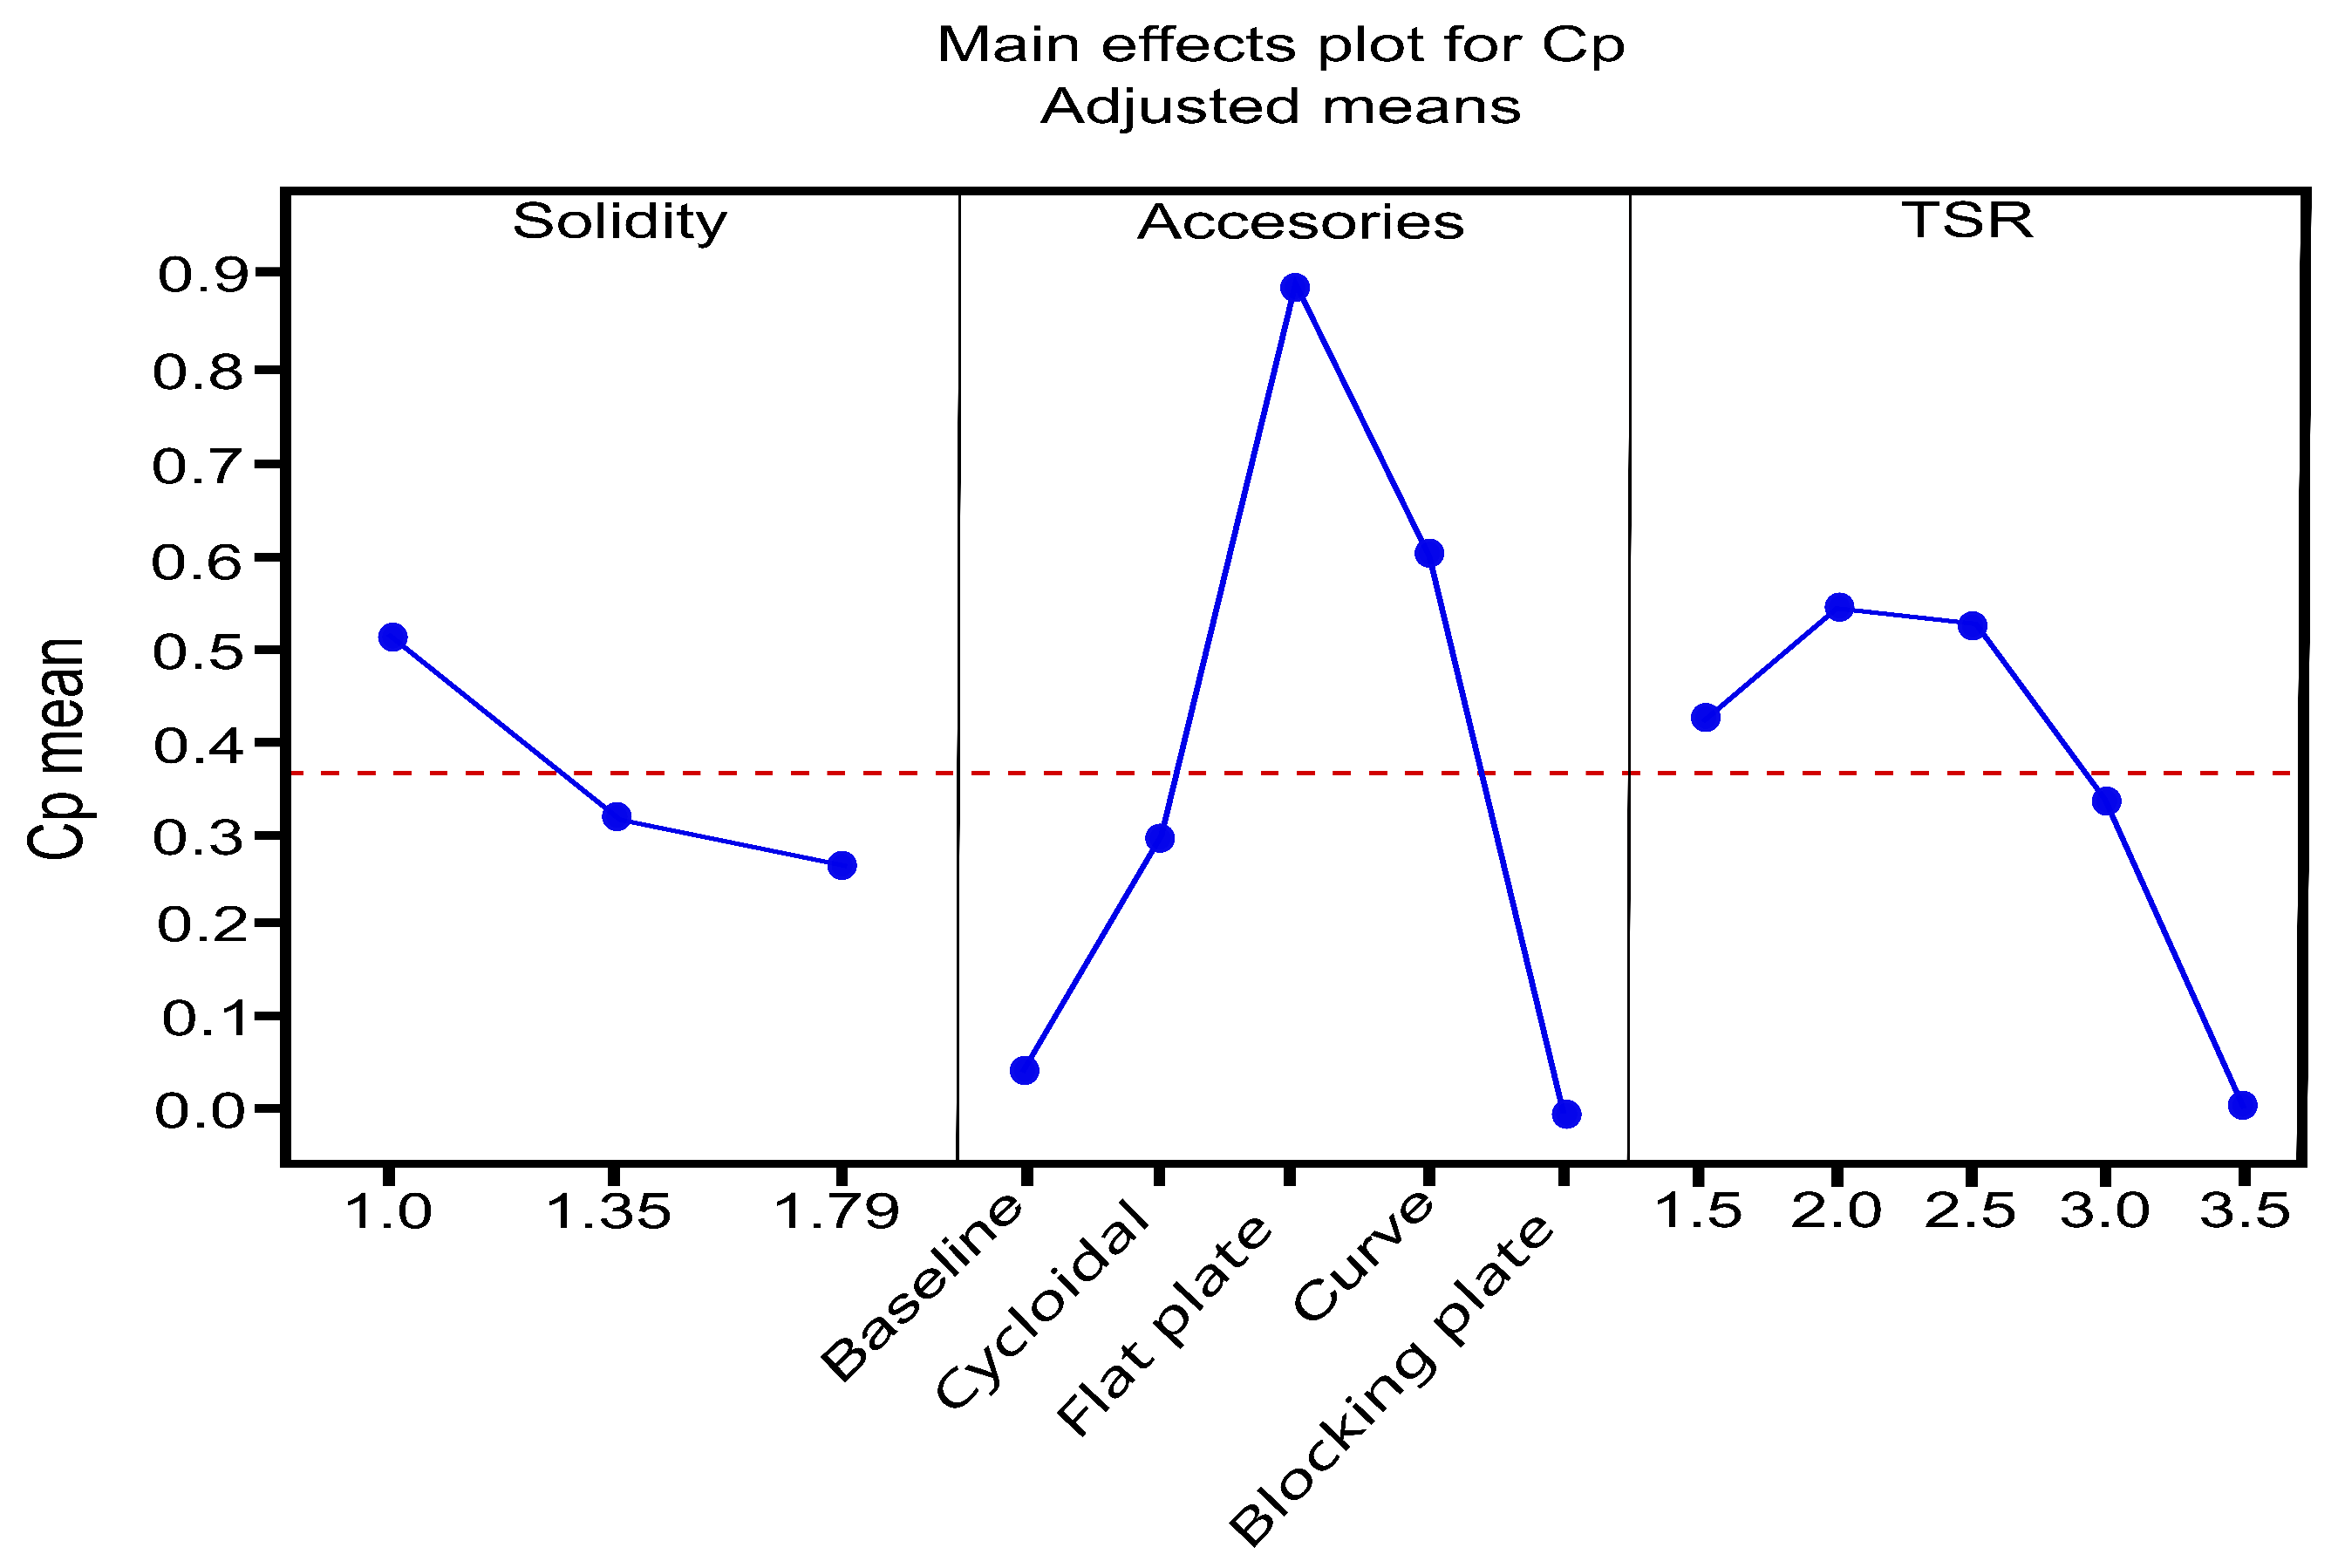
To determine which was the best configuration (highest Cp), a means analysis was performed. Figure 5 shows the adjusted meaning of Cp for each factor level, with the red line indicating the overall mean. Globally, it is observed that the best effect is obtained with the flat-plate level of the accessories factor; additionally, the best solidity is 1.0, and the best TSR is 2.5.
Figure 6 shows the interaction plot for the factors and their different levels. In the Solidity × TSR interaction, it is observed that when TSR is 1.5 and 2.0, the slope is positive as solidity increases, and efficiency increases. Additionally, when solidity is 1.0 and TSR is 2.5–3.0, the Solidity × TSR interaction yields the best performance. On the other hand, for the Accessory × TSR interaction, there is a pattern: in all cases, the best performance is obtained with the flat-plate accessory and the overall best performance occurs at TSR 3.0. The optimal configuration of the study is an H-Darrieus hydrokinetic turbine with a solidity of 1.0, a flat-plate accessory, and a TSR of 3.0.
Analysis of variance confirmed the statistical significance of the model, as well as that of several individual terms and their interactions. In particular, the accessory type and its interaction with solidity were identified as highly significant factors, suggesting that the improvement in turbine performance depends not only on the accessory’s use, but also on its optimal configuration with respect to solidity.

3.2. Linear Regression Model

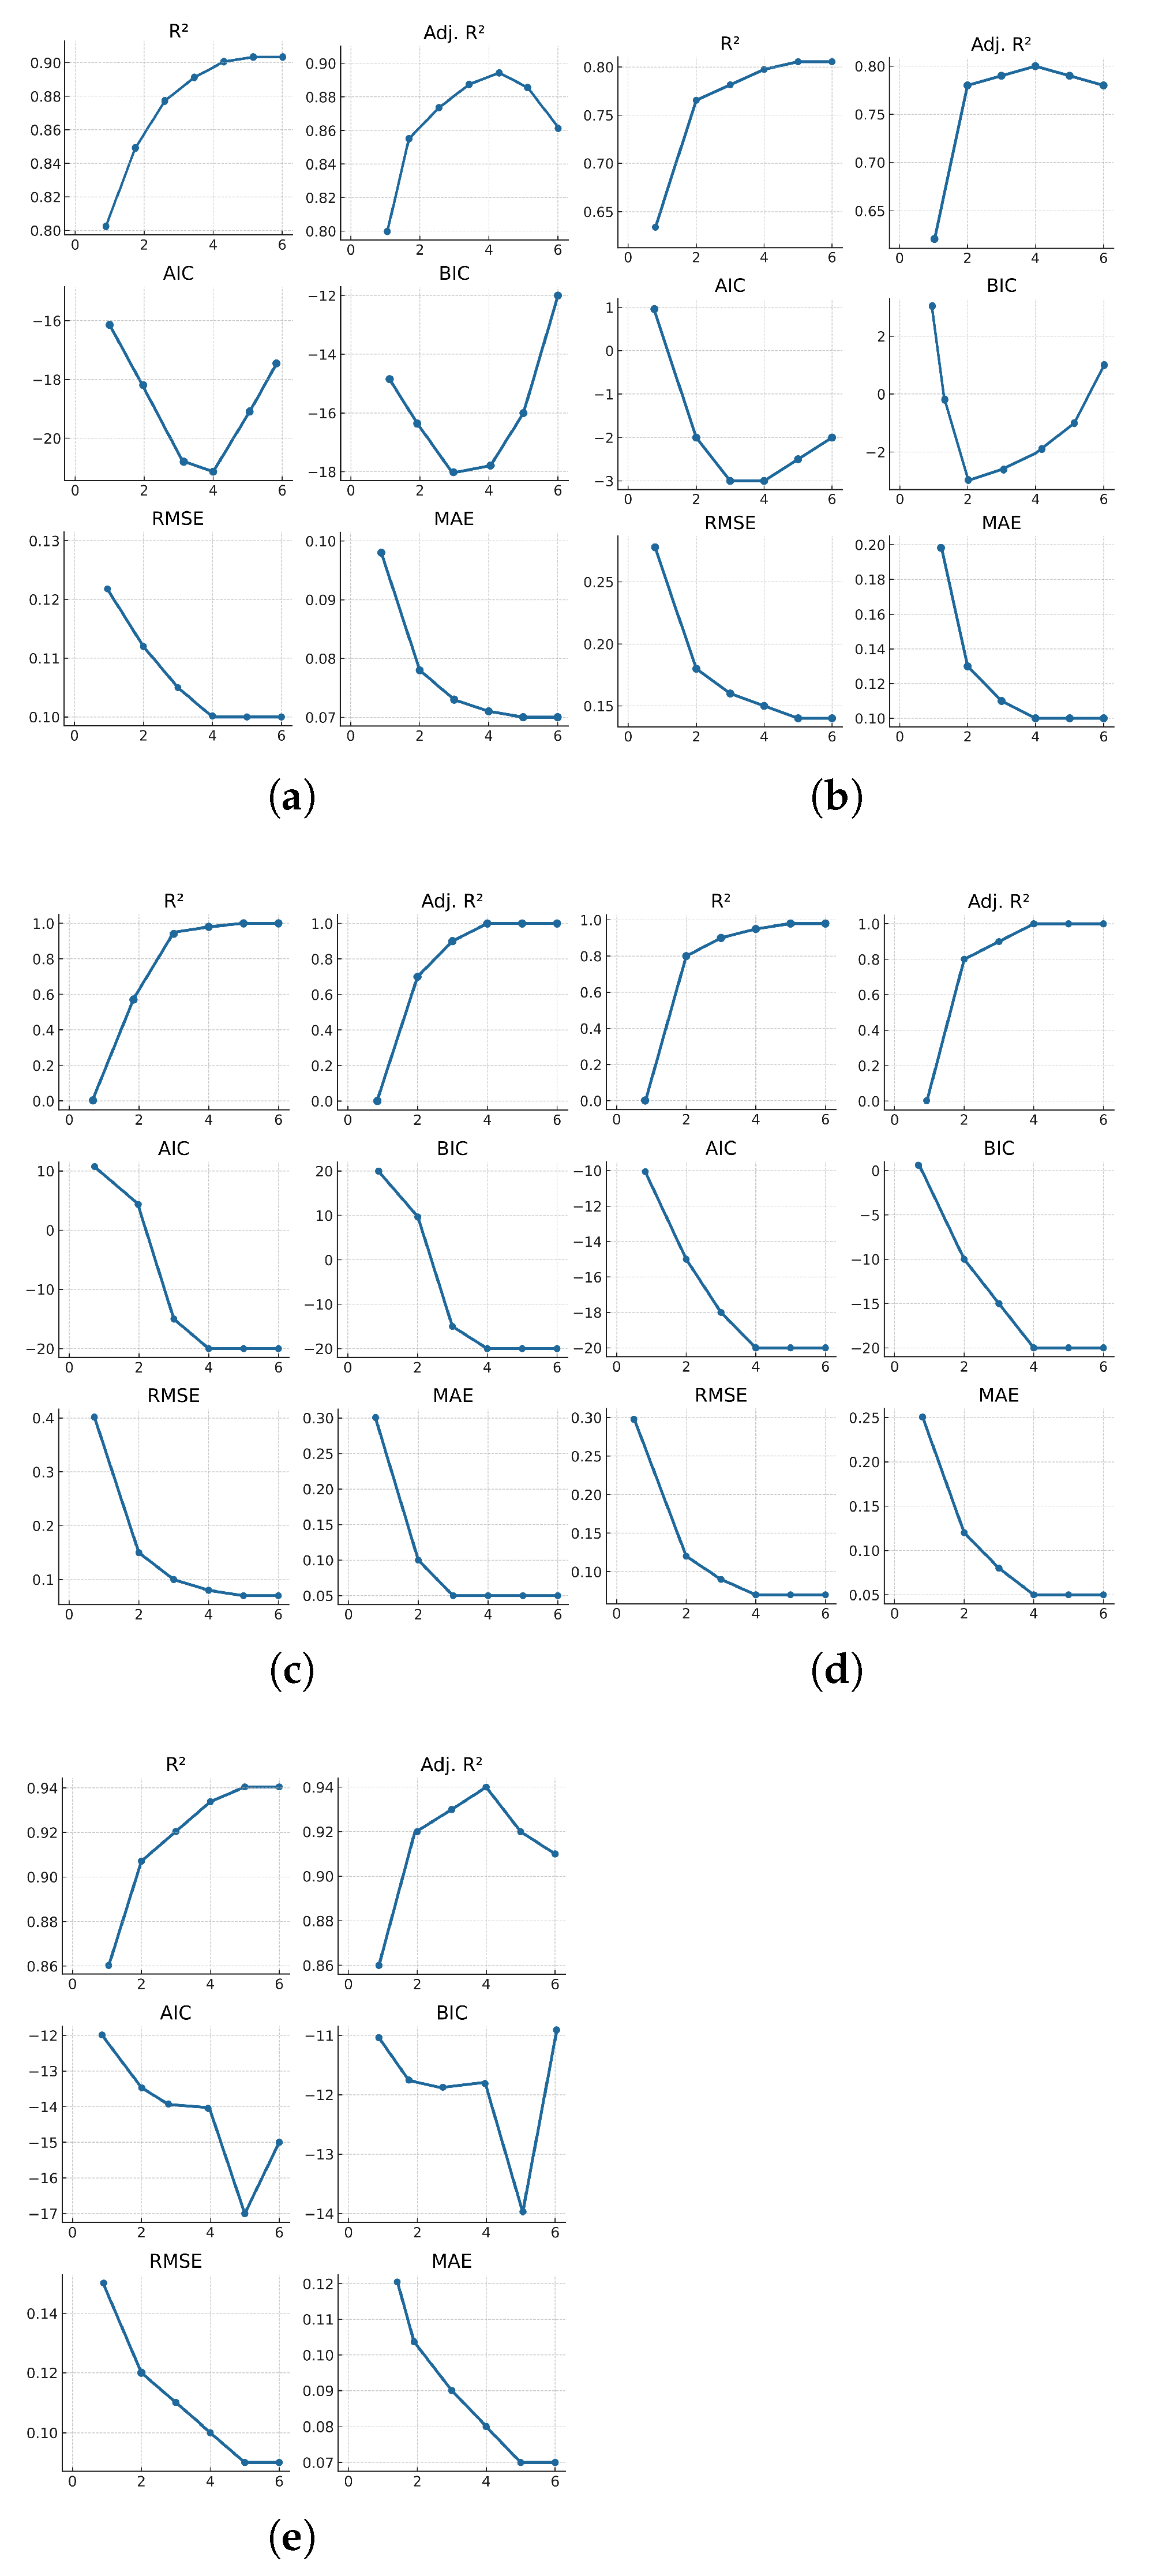
To expand our understanding of the interaction between TSR, solidity, and different accessories, higher-order analysis is required. Solidity has one degree of freedom as a geometric parameter. In contrast, TSR has three degrees of freedom as a kinetic parameter, resulting in seven terms: S o l i d i t y , T S R , S o l i d i t y   ×   T S R , T S R 2 , S o l i d i t y   ×   T S R 2 , T S R 3 , and S o l i d i t y   ×   T S R 3 . These terms are combined to produce 127 term sets. Linear regression was performed via the least squares method for each term set, and this process was repeated for each accessory, for a total of 635 linear regressions. To display the results of the generated models, they were grouped by the number of included terms, creating seven groups per accessory. The last group for each accessory (containing all seven terms) was discarded to reduce overfitting. From each group, the best linear regression model was selected based on the AIC criterion and adjusted R 2 . The following plots show the behavior of these models for each accessory according to their respective group classification. For the baseline, cycloidal, and blocking-plate configurations, the regression metrics plot shows maximum values for adjusted R 2 and minimum values for AIC in the groups containing four, three, and five terms, respectively. For the flat-plate and curve cases, the best-performing group is group six. Figure 7 displays all precision metrics calculated for each case, while the best models identified for each configuration are reported in Table 5.
Equations (2)–(6) present the results obtained from the linear regression analysis carried out for the cases studied. These equations represent the mathematical relationship between the variables considered and make it possible to model the behavior of the studied system [30]. Here, S corresponds to the Solidity term, T represents the TSR with each of its degrees, and ε represents the error associated with each proposed model.
Standard C p = 1.154 S 0.492 S T + 0.391 T 2 0.083 T 3 0.888 + ε
Cycloidal C p = 1.076 S + 2.708 T 0.617 S T 0.431 T 2 2.922 + ε
Flat plate C p = 5.316 T + 3.025 S T + 3.450 T 2 1.787 S T 2 0.501 T 3 + 0.227 S T 3 + 0.718 + ε
Curve C p = 2.247 T + 2.095 S T + 2.047 T 2 1.394 S T 2 + 0.196 S T 3 0.527 + ε
Blocking plate C p = 1.829 S T + 0.933 T 2 1.442 S T 2 0.212 T 3 + 0.240 S T 3 1.445 + ε
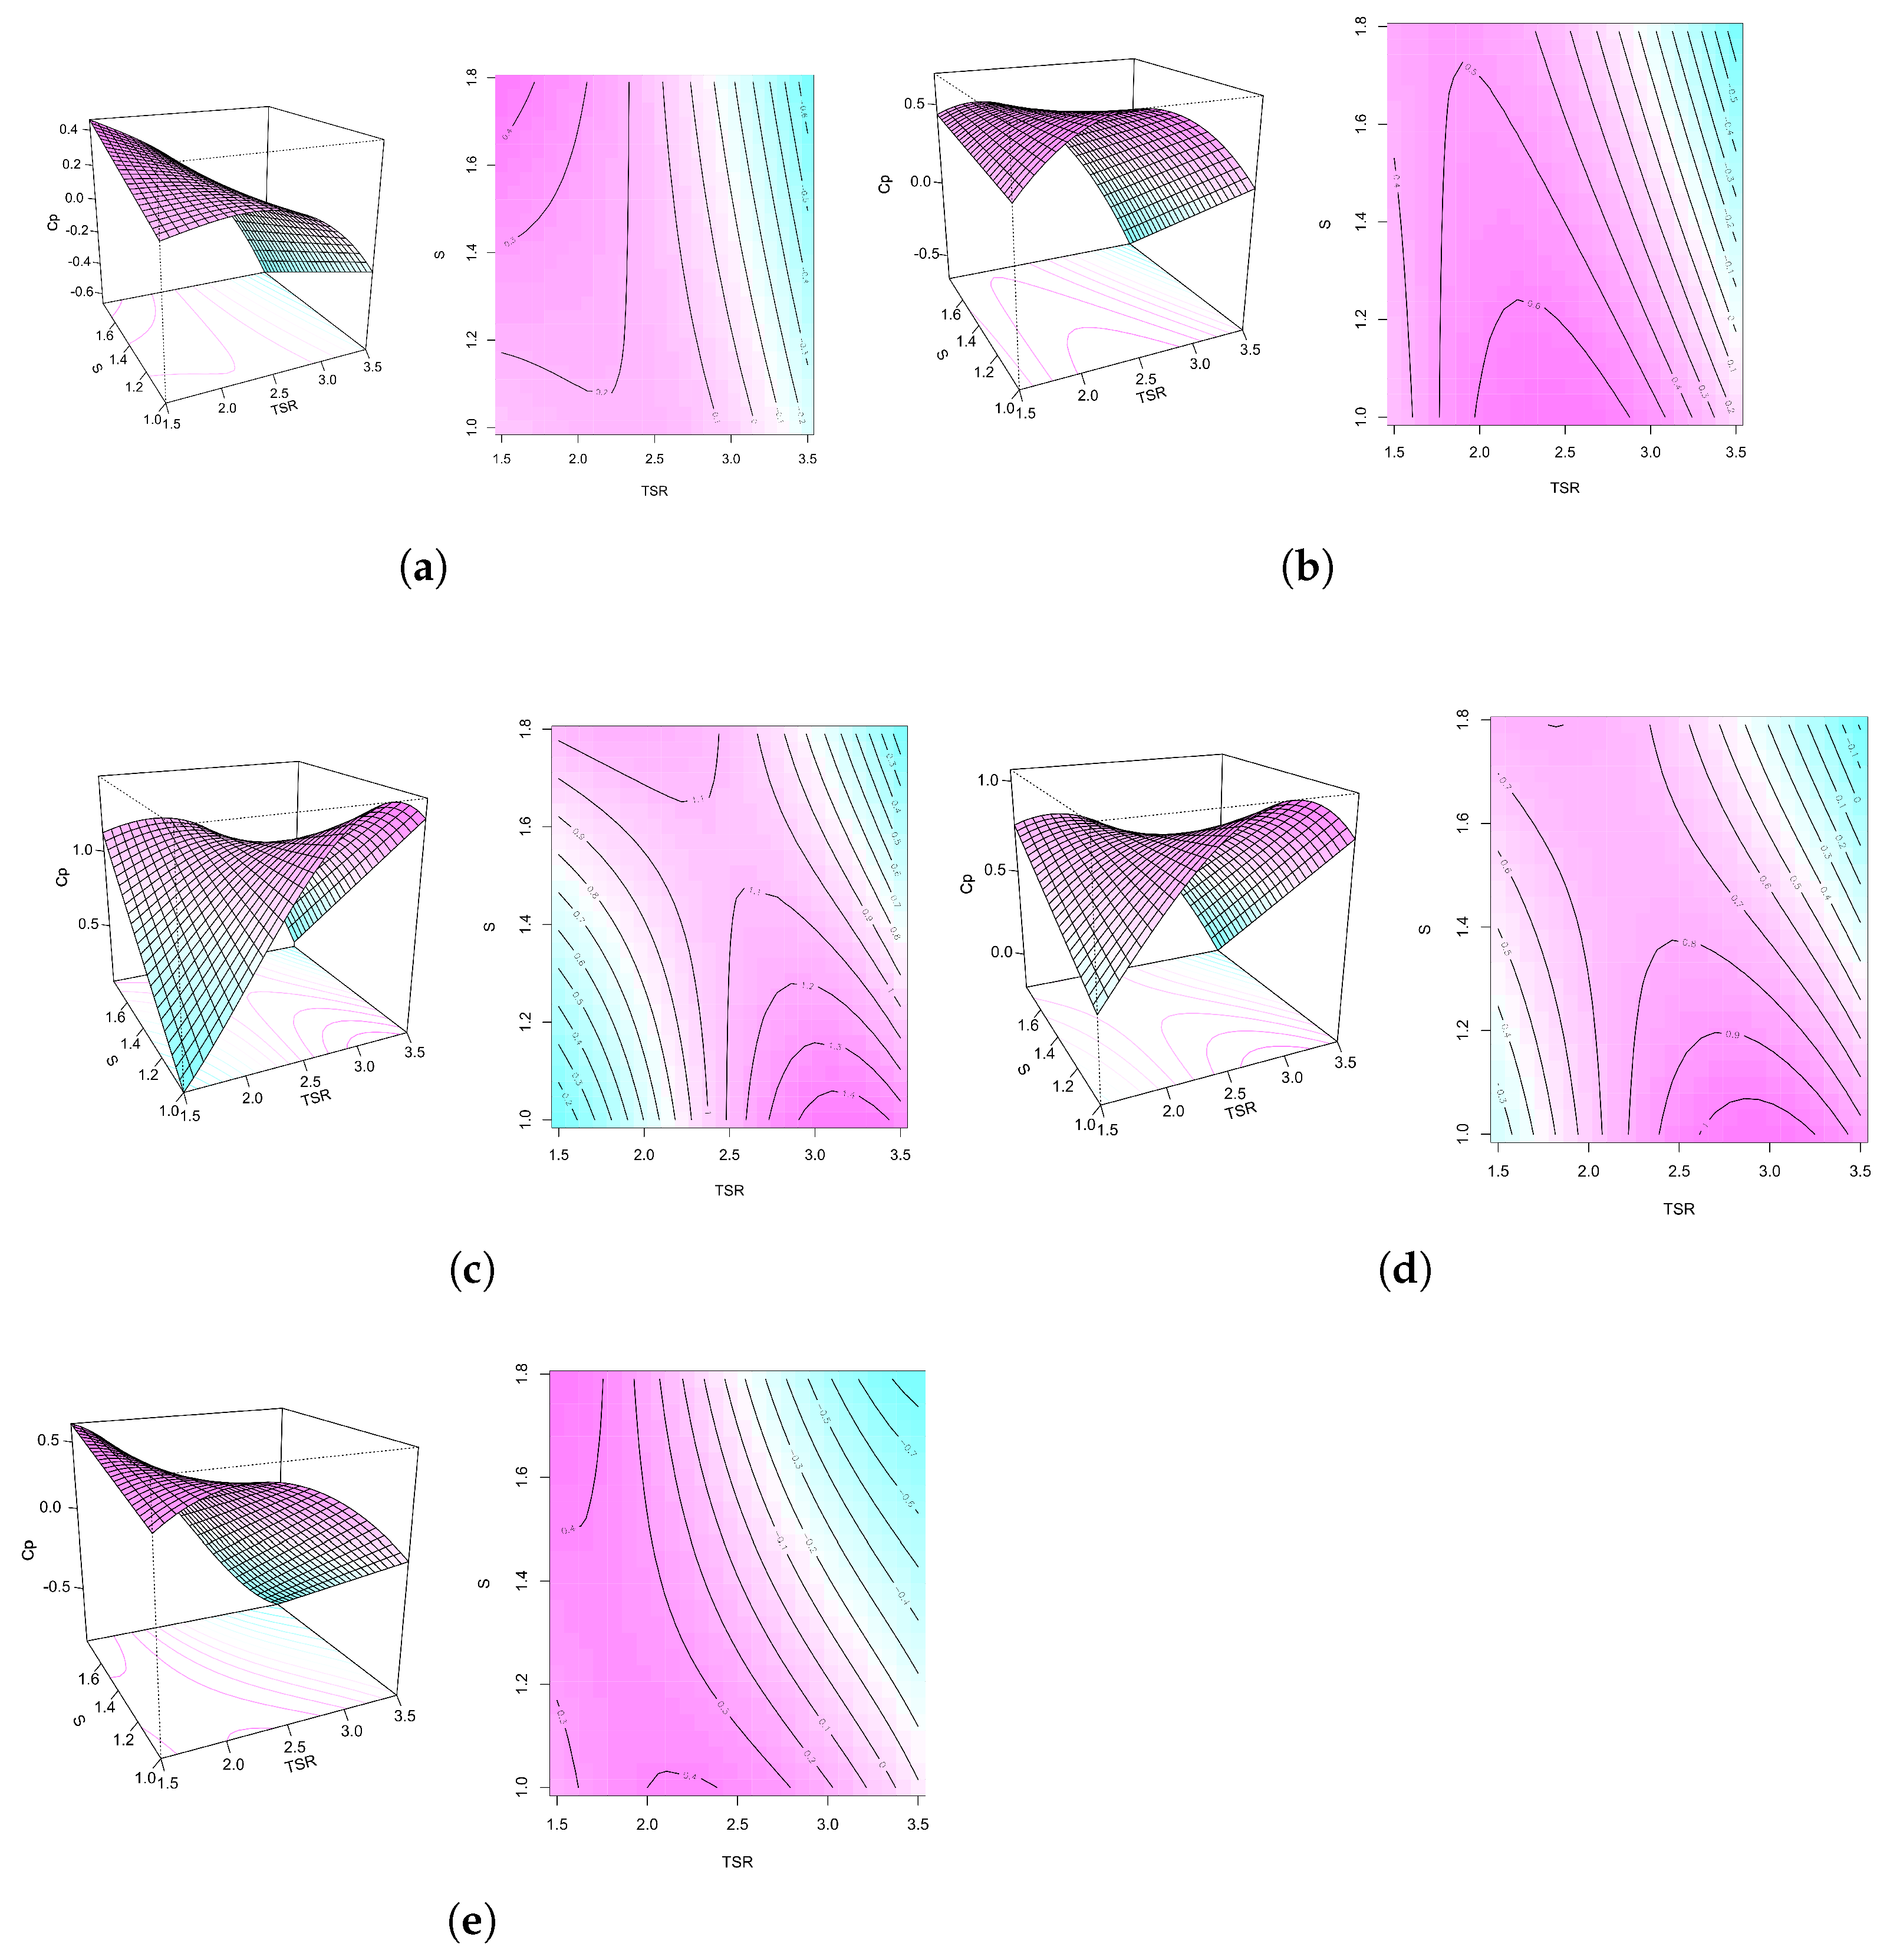
The data obtained from the linear regression analysis were used to establish a response surface analysis and thus estimate the range of best performance for each evaluated accessory. This approach facilitates the identification of the most suitable and least favorable configurations according to the input factors. Figure 8 presents the response surfaces between Solidity (S) and TSR (T), along with contour plots, showing the impact of their interaction on the power coefficient for each configured accessory. It is observed that the power coefficient has a nonlinear dependence on Solidity (S) and TSR (T). Additionally, regions with high Cp values (areas with more intense fuchsia tones) in the contour plots vary according to the configured accessory type, suggesting that certain combinations of Accessories, Solidity, and TSR maximize Cp. Similarly, when the color remains constant in these zones, it indicates that Cp remains stable, as can be observed more clearly in the response surface plots. Figure 8a,b,e show that at higher TSR values, the Cp is lower. However, Figure 8c and Figure 8d, corresponding to the flat-plate and curve cases, respectively, have power coefficients that are higher, reaching maximum values of 1.4 and 1.0. Both maximum values are located at the lower extremes of the contour plots.
The trends observed in this study align with behaviors that were previously reported in the literature. In a result similar to the findings of Patel et al. [31], the influence of external attachments on turbine performance was found to be nonlinear, with performance peaks occurring at specific combinations of solidity and attachment type. This pattern is characteristic of multifactor interactions in RSM-based analyses and confirms that accessory configuration can substantially modify the hydrodynamic response. Furthermore, the substantial performance gains obtained with flat and curved plates are in agreement with prior research demonstrating that flow manipulation through external elements can enhance Cp by redirecting and concentrating the incoming stream. Overall, the results reinforce the understanding that accessory design, when analyzed in conjunction with solidity and TSR, plays a decisive role in optimizing H-Darrieus turbine efficiency. By matching the observed performance patterns with those reported in earlier studies, the present work strengthens the evidence base supporting the integration of statistical modeling and design of experiments in hydrokinetic turbine optimization.

4. Conclusions

This study presents a comprehensive statistical and mathematical analysis conducted using Minitab 21 and RStudio V4.4.2 to evaluate the influence of three key factors: solidity, Tip-Speed ratio (TSR), and accessory type, on the performance of H-Darrieus hydrokinetic turbines. Through an ANOVA framework, significant main effects and interactions were identified, particularly highlighting the combined influence of solidity and TSR on the Cp. Among the tested configurations, the optimal performance was obtained with a solidity of 1.0, a TSR of 3.2, and the flat-plate accessory, this last being the accessory that maximized turbine performance. These results validate the effectiveness of the proposed methodology for establishing the optimal operating point of an H-Darrieus hydrokinetic turbine. Additionally, these results demonstrate that these accessories significantly affect Cp; specifically, the flat- and curved-plate configurations increased Cp by up to 660% and 420%, respectively, compared to the base configuration. To complement these experimental findings, analytical mathematical models were developed using DoE, linear regression, and response surface analysis. These models accurately described the turbine behavior, achieving a coefficient of determination ( R 2 ) of 85%. This approach not only confirms the validity of the experimental trends but also provides a practical tool for estimating performance across a range of operating conditions, reducing the need for computationally intensive simulations. Overall, the results demonstrate that we have developed a reliable and efficient methodology for optimizing the design and operation of H-Darrieus turbines in real-world applications.

Author Contributions

The authors’ contributions to the research are as follows: Conceptualization, A.J.G.M., D.S.V. and M.A.R.-C.; methodology, A.J.G.M., D.H.Z. and E.C.; software, M.A.R.-C., D.H.Z. and A.J.G.M.; validation, A.J.G.M., D.H.Z. and E.C.; formal analysis, A.J.G.M. and M.A.R.-C.; investigation, M.A.R.-C., D.H.Z. and A.J.G.M.; resources, A.J.G.M.; data curation, D.H.Z.; writing—original draft preparation, M.A.R.-C., D.H.Z. and A.J.G.M.; writing—review and editing, D.S.V. and E.C.; visualization, M.A.R.-C.; supervision, E.C.; project administration, A.J.G.M.; funding acquisition, M.A.R.-C., D.H.Z., A.J.G.M., D.S.V. and E.C. All authors have read and agreed to the published version of the manuscript.

Funding

This research received no external funding.

Data Availability Statement

The original contributions presented in this study are included in the article. Further inquiries can be directed to the corresponding authors.

Acknowledgments

This work was supported by the Instituto Tecnológico Metropolitano de Medellín (Colombia), under the research groups of Advanced Computing and Digital Design (SeCADD) and mathematical modeling, which belongs to the research group of Advanced Materials and Energy (MATyER), and contributes to the development of the project entitled “Desarrollo de un sistema de picogeneración eléctrica mediante una turbina hidrocinética híbrida H-Darrieus/Savonious para una ZOMAC en el Oriente Antioqueño”. It was also supported by Universidad de Antioquía under the research group GEA, and Universidad EAFIT.

Conflicts of Interest

The authors declare no conflicts of interest.

Abbreviations

The following abbreviations are used in this manuscript:
CFDComputational fluid dynamics
VAWTVertical Axis Water Turbines
HAWTHorizontal Axis Water Turbines
TSRTip-Speed Ratio
CpPower Coefficient
DoEDesign of Experiments
OVATOne Variable at a Time
RSMResponse Surface Methodology
ANOVAAnalysis of Variance
BICBayesian Information Criterion
AICAkaike Information Criterion
MAEMean Absolute Error
RMSERoot Mean Square Error

References

  1. Vermaak, H.J.; Kusakana, K.; Koko, S.P. Status of micro-hydrokinetic river technology in rural applications: A review of literature. Renew. Sustain. Energy Rev. 2014, 29, 625–633. [Google Scholar] [CrossRef]
  2. Furukawa, A.; Watanabe, S.; Matsushita, D.; Okuma, K. Development of ducted Darrieus turbine for low head hydropower utilization. Curr. Appl. Phys. 2010, 10, S128–S132. [Google Scholar] [CrossRef]
  3. Gosselin, R.; Dumas, G.; Boudreau, M. Parametric study of H-Darrieus vertical-axis turbines using CFD simulations. J. Renew. Sustain. Energy 2016, 8, 053301. [Google Scholar] [CrossRef]
  4. Del Rio, J.A.S.; Sánchez, A.R.; Villa, D.S.; Quintana, E.C. Numerical Study of H-Darrieus Turbine as a Rotor for Gravitational Vortex Turbine. CFD Lett. 2022, 14, 1–11. [Google Scholar] [CrossRef]
  5. Du, L.; Ingram, G.; Dominy, R.G. Experimental study of the effects of turbine solidity, blade profile, pitch angle, surface roughness, and aspect ratio on the H-Darrieus wind turbine self-starting and overall performance. Energy Sci. Eng. 2019, 7, 2421–2436. [Google Scholar] [CrossRef]
  6. Arrieta-Gomez, M.; Vélez-García, S.; Zuluaga, D.H.; Tejada, J.C.; Sanin-Villa, D. Efficiency optimization of a hybrid Savonius-Darrieus hydrokinetic turbine via regression modeling and CFD-based design of experiments. Results Eng. 2025, 27, 105751. [Google Scholar] [CrossRef]
  7. chol Nam, M.; Dechun, B.; Xiangji, Y.; Mingri, J. Design optimization of hydraulic turbine draft tube based on CFD and DOE method. IOP Conf. Ser. Earth Environ. Sci. 2018, 136, 012019. [Google Scholar] [CrossRef]
  8. Moraes, R.C.; Dias, M.A.; Neto, L.J.M. Gas turbine combustor CFD study and single-objective DoE optimization. Numer. Heat Transf. Part A Appl. 2022, 82, 700–715. [Google Scholar] [CrossRef]
  9. Park, J.; Knight, B.G.; Liao, Y.; Mangano, M.; Pacini, B.; Maki, K.J.; Martins, J.R.R.A.; Sun, J.; Pan, Y. CFD-based design optimization of ducted hydrokinetic turbines. Sci. Rep. 2023, 13, 17968. [Google Scholar] [CrossRef]
  10. Khan, R.; Kumar, A. Performance enhancement of hydrokinetic turbine using augmentation techniques: A review. Int. J. Green Energy 2024, 21, 1667–1694. [Google Scholar] [CrossRef]
  11. Singh, E.; Roy, S.; Yam, K.S.; Law, M.C. Numerical analysis of H-Darrieus vertical axis wind turbines with varying aspect ratios for exhaust energy extractions. Energy 2023, 277, 127739. [Google Scholar] [CrossRef]
  12. Ghiasi, P.; Najafi, G.; Ghobadian, B.; Jafari, A.; Mamat, R.; Fairusham Ghazali, M. CFD-Study of the H-Rotor Darrius wind turbine performance in Drag-Lift and lift Regime: Impact of Type, thickness and chord length of blades. Alex. Eng. J. 2023, 67, 51–64. [Google Scholar] [CrossRef]
  13. Korukçu, M. Impact of Blade Modifications on the Performance of a Darrieus Wind Turbine. Processes 2024, 12, 732. [Google Scholar] [CrossRef]
  14. Patel, V.; Rathod, V.; Patel, C. Optimal utilization of hydrokinetic energy resources through performance improvement of the darrieus turbine using concave and flat blocking plates. Ocean Eng. 2023, 283, 115099. [Google Scholar] [CrossRef]
  15. Muñoz, A.G.; Rodriguez-Cabal, M.A.; Zuluaga, D.H. Assessment of H-Darrieus Hydrokinetic Turbines by Configuration with a Blocking Plate Using a Design of Experiment Approach. Math. Model. Eng. Probl. 2025, 12, 9–16. [Google Scholar] [CrossRef]
  16. Tunio, I.A.; Shah, M.A.; Hussain, T.; Harijan, K.; Mirjat, N.H.; Memon, A.H. Investigation of duct augmented system effect on the overall performance of straight blade Darrieus hydrokinetic turbine. Renew. Energy 2020, 153, 143–154. [Google Scholar] [CrossRef]
  17. Chen, W.H.; Lam, T.T.; Chang, M.H.; Jin, L.; Chueh, C.C.; Augusto, G.L. Optimizing H-Darrieus Wind Turbine Performance with Double-Deflector Design. Energies 2024, 17, 503. [Google Scholar] [CrossRef]
  18. Guevara-Muñoz, A.J.; Hincapie-Zuluaga, D.A.; Ángel Rodríguez-Cabal, M.; Sierra-Del-rio, J.A.; Colmenares-Quintero, R.F.; Torres-Lopez, E. 2D Numerical Analysis of an H-Darrieus Hydrokinetic Turbine with Passive Improvement Mechanisms. Eng. Trans. 2023, 71, 553–569. [Google Scholar] [CrossRef]
  19. Morrison, D.E.; Henkel, R.E. Significance Tests Reconsidered. In The Significance Test Controversy; Routledge: London, UK, 2017; pp. 182–198. [Google Scholar] [CrossRef]
  20. Gutierrez, H.; De la Vara, R. Análisis y Diseño de Experimentos, 3rd ed.; Editorial Mcgraw-hill: Mexico City, Mexico, 2008; pp. 1–489. [Google Scholar]
  21. Hansen, M.O.L.; Sørensen, N.N.; Flay, R.G.J. Effect of Placing a Diffuser around a Wind Turbine. Wind Energy 2000, 3, 207–213. [Google Scholar] [CrossRef]
  22. Jamieson, P.M. Beating Betz: Energy Extraction Limits in a Constrained Flow Field. J. Sol. Energy Eng. 2009, 131, 031008. [Google Scholar] [CrossRef]
  23. Ohya, Y.; Karasudani, T.; Sakurai, A.; Inoue, M. Development of a High-Performance Wind Turbine Equipped with a Brimmed Diffuser Shroud. Trans. Jpn. Soc. Aeronaut. Space Sci. 2006, 49, 18–24. [Google Scholar] [CrossRef]
  24. Lam, R.; Allaire, D.L.; Willcox, K.E. Multifidelity Optimization using Statistical Surrogate Modeling for Non-Hierarchical Information Sources. In Proceedings of the 56th AIAA/ASCE/AHS/ASC Structures, Structural Dynamics, and Materials Conference, Kissimmee, FL, USA, 5–9 January 2015; American Institute of Aeronautics and Astronautics: Reston, VA, USA, 2015. [Google Scholar] [CrossRef]
  25. Dziak, J.J.; Coffman, D.L.; Lanza, S.T.; Li, R.; Jermiin, L.S. Sensitivity and specificity of information criteria. Brief. Bioinform. 2020, 21, 553–565. [Google Scholar] [CrossRef] [PubMed]
  26. Ibrahim, M.M.A.; Nordgren, R.; Kjellsson, M.C.; Karlsson, M.O. Model-Based Residual Post-Processing for Residual Model Identification. AAPS J. 2018, 20, 81. [Google Scholar] [CrossRef]
  27. Lucas, J.M. Response Surface Methodology: Process and Product Optimization Using Designed Experiments, 3rd edition. J. Qual. Technol. 2010, 42, 228–230. [Google Scholar] [CrossRef]
  28. Montgomery, D.C. Design and Analysis of Experiments, 10th ed.; Wiley: Hoboken, NJ, USA, 2019; pp. 1–688. [Google Scholar]
  29. Minitab. Soporte Técnico de Minitab-Minitab. 2025. Available online: https://www.minitab.com/es-mx/support/ (accessed on 15 February 2025).
  30. Myers, R.H.; Montgomery, D.C.; Anderson-Cook, C.M. Response Surface Methodology: Process and Product Optimization Using Designed Experiments, 4th ed.; Wiley: Hoboken, NJ, USA, 2016; pp. 1–856. [Google Scholar]
  31. Patel, V.; Eldho, T.; Prabhu, S. Performance enhancement of a Darrieus hydrokinetic turbine with the blocking of a specific flow region for optimum use of hydropower. Renew. Energy 2019, 135, 1144–1156. [Google Scholar] [CrossRef]
Figure 1. Used profiles with different chord lengths (different solidities). Prepared by the authors.
Sci 07 00121 g001
Figure 2. General dimensions of the configured models. Adapted from [18].
Sci 07 00121 g002
Figure 3. Residual analysis graphs for Cp.
Sci 07 00121 g003
Figure 4. Standardized effects Pareto chart.
Sci 07 00121 g004
Figure 5. Main effects graph for Cp.
Sci 07 00121 g005
Figure 6. Interaction graph for Cp.
Sci 07 00121 g006
Figure 7. Regression model accuracy metrics: R-squared, AIC, BIC, adjusted R 2 , Mean Absolute Error (MAE), Root Mean Square Error (RMSE). (a) Standard case. (b) Cycloidal case. (c) Flat plate case. (d) Curve case. (e) Blocking plate case.
Sci 07 00121 g007
Figure 8. Estimated response surface and contour plots for the effects of interactions between solidity and TSR on the power coefficient. (a) Standard case. (b) Cycloidal case. (c) Flat plate case. (d) Curve case. (e) Blocking plate case.
Sci 07 00121 g008
Table 1. Proposed factorial design. Prepared by the authors.
FactorsLevel 1Level 2Level 3Level 4Level 5
Solidity1.01.351.79
AccessoriesStandardCycloidalFlat plateCurveBlocking plate
TSR1.52.02.53.03.5
Table 2. Cp of each combination of factors. Adapted from [18].
SolidityAccessories1.52.02.53.03.5
1.0Standard0.0210.2070.1360.126−0.117
Cycloidal0.3380.4770.9200.5550.367
Flat plate0.1280.5551.0141.5761.364
Curve0.2680.5101.0261.0790.871
Blocking plate0.2640.3300.3970.3450.014
1.35Standard0.3920.3420.153−0.060−0.643
Cycloidal0.3380.6140.5130.001−0.472
Flat plate0.6100.8311.1801.0790.741
Curve0.5360.6990.8350.6830.322
Blocking plate0.3870.3750.063−0.253−0.651
1.79Standard0.4270.2810.054−0.127−0.564
Cycloidal0.4230.5650.285−0.060−0.463
Flat plate1.0261.2801.0550.7030.202
Curve0.6720.8950.5920.270−0.166
Blocking plate0.4560.276−0.140−0.553−0.741
Table 3. ANOVA results.
SourceDegrees 
of Freedom
Sum of 
Squares
Mean SquareF-Valuep-Value
Model3417.5570.51618.278 1.2 × 10 15
Lineal1012.3561.23643.7360
Solidity20.8320.41614.733 1.605 × 10 5
Accessories48.6122.15376.2050
TSR42.9120.72825.768 1.312 × 10 10
2-term interactions245.2010.2177.670 1.183 × 10 8
Solidity × TSR83.2540.40714.397 1.277 × 10 9
Accessories × TSR161.9470.1224.307 8.833 × 10 5
Error321.1300.028
Total7418.687
Table 4. Model summary.
SdR-Squared [%]R-Squared (Adjusted) [%]R-Squared (Predicted) [%]
0.16893.9588.8178.74
Table 5. Summary of best models based on AIC and adjusted R 2 .
CaseFeatures R 2 RMSEMAEAICBICAdj.  
R 2
Standard[’S’, ’S T’, ’T⌃2’, ’T⌃3’]0.9100.0910.073−19.381−15.8410.874
Cycloidal[’S’, ’T’, ’S T’, ’T⌃2’]0.8520.1440.105−5.492−1.9520.793
Flat
plate
[’T’, ’S T’, ’T⌃2’,  
’S T⌃2’, ’T⌃3’, ’S T⌃3’]
0.9660.0730.064−22.070−17.1140.941
Curve[’T’, ’S T’, ’T⌃2’, 
’S T⌃2’, ’T⌃3’, ’S T⌃3’]
0.9620.0620.052−26.651−21.6940.934
Blocking 
plate
[’S T’, ’T⌃2’, 
’S T⌃2’, ’T⌃3’, ’S T⌃3’]
0.9490.0900.070−17.739−13.4910.921
Disclaimer/Publisher’s Note: The statements, opinions and data contained in all publications are solely those of the individual author(s) and contributor(s) and not of MDPI and/or the editor(s). MDPI and/or the editor(s) disclaim responsibility for any injury to people or property resulting from any ideas, methods, instructions or products referred to in the content.