Article

The Detection of Different Cancer Types Using an Optimized MoS2-Based Surface Plasmon Resonance Multilayer System

by
Talia Tene
1,*,
Diego Fabián Vique López
2,
Paulina Elizabeth Valverde Aguirre
3,
Adriana Monserrath Monge Moreno
3 and
Cristian Vacacela Gomez
4
1
Department of Chemistry, Universidad Técnica Particular de Loja, Loja 110160, Ecuador
2
Facultad de Salud Pública, Escuela Superior Politécnica de Chimborazo (ESPOCH), Riobamba 060155, Ecuador
3
Facultad de Ciencias, Escuela Superior Politécnica de Chimborazo (ESPOCH), Riobamba 060155, Ecuador
4
INFN-Laboratori Nazionali di Frascati, Via E. Fermi 54, I-00044 Frascati, Italy
*
Author to whom correspondence should be addressed.
Submission received: 9 April 2025 / Revised: 4 May 2025 / Accepted: 26 May 2025 / Published: 3 June 2025
(This article belongs to the Section Biology Research and Life Sciences)

Abstract

The early and accurate detection of cancer remains a critical challenge in biomedical diagnostics. In this work, we propose and investigate a novel surface plasmon resonance (SPR) biosensor platform based on a multilayer configuration incorporating copper (Cu), silicon nitride (Si3N4), and molybdenum disulfide (MoS2) for the optical detection of various cancer types. Four distinct sensor architectures (Sys1–Sys4) were optimized through the systematic tuning of Cu thickness, Si3N4 dielectric layer thickness, and the number of MoS2 monolayers to enhance sensitivity, angular shift, and spectral sharpness. The optimized systems were evaluated using refractive index data corresponding to six cancer types (skin, cervical, blood, adrenal, breast T1, and breast T2), with performance metrics including sensitivity, detection accuracy, quality factor, figure of merit, limit of detection, and comprehensive sensitivity factor. Among the configurations, Sys3 (BK7–Cu–Si3N4–MoS2) demonstrated the highest sensitivity, reaching 254.64 °/RIU for adrenal cancer, while maintaining a low detection limit and competitive figures of merit. Comparative analysis revealed that the MoS2-based designs, particularly Sys3, outperform conventional noble-metal architectures in terms of sensitivity while using earth-abundant, scalable materials. These results confirm the potential of Cu/Si3N4/MoS2-based SPR biosensors as practical and effective tools for label-free cancer diagnosis across multiple malignancy types.

1. Introduction

Cancer remains a major contributor to global morbidity and mortality, with increasing prevalence observed across diverse demographic and geographic groups [1,2,3]. Malignant transformation originates from genetic and epigenetic disturbances that disrupt essential regulatory pathways involved in cell division [4], programmed cell death [5], and genomic repair [6]. These disruptions promote uncontrolled proliferation and metastatic progression. Among the various cancer types, breast [7], cervical [8], skin [9], adrenal [10], gland [11], and hematologic [12] malignancies frequently exhibit a high clinical burden due to their diagnostic complexity and variable biological behavior.
While early detection is a critical determinant of clinical outcome, current diagnostic protocols rely heavily on imaging [13], histopathology [14], and molecular assays [15], which are often limited by high cost, procedural invasiveness, and dependence on advanced instrumentation. These constraints hinder widespread adoption in population-level screening programs, particularly in resource-constrained environments. This has motivated the exploration of alternative diagnostic modalities that offer simplicity, real-time feedback, and sensitivity to cellular or molecular changes [16].
Surface plasmon resonance (SPR) biosensing is one such technique that allows for label-free and real-time detection of refractive index variations at the interface between a metallic film and a dielectric environment [17,18]. In the context of cancer diagnostics, changes in the refractive index are often linked to alterations in cellular morphology and protein content [19], both of which differ between healthy and malignant cells. These features render SPR sensors suitable for the optical sensing of cancer-related transformations without the need for biochemical amplification or labeling [20].
Recent advances in material science have led to the integration of two-dimensional nanomaterials into SPR platforms [21]. These atomically thin systems exhibit strong light–matter interactions, large surface-to-volume ratios, and highly tunable optoelectronic behavior, making them particularly suitable for biosensing applications [22]. Among them, molybdenum disulfide (MoS2) has attracted attention for its semiconducting character, direct bandgap at the monolayer level, and capacity for exciton–plasmon coupling under optical excitation [23,24,25]. These properties can be exploited to enhance the local electromagnetic field and facilitate adsorption of biomolecular species, thereby improving sensor responsiveness.
Contrary to concerns that MoS2 lacks visibility in high-impact biosensing applications, several recent studies have established its relevance across different contexts. For instance, MoS2-based sensors have been reported for the detection of prostate-specific antigen through electrical measurements in oxide-free environments, yielding detection limits in the picogram per milliliter range [26]. Other configurations have demonstrated its application in food safety analysis, where MoS2-based composite sensors enable the identification of chemical contaminants and pathogens with high selectivity and optical sensitivity [27]. Additional examples include the enzymatic detection of glucose using MoS2/Ag nanocomposites [28] and the development of MoS2-integrated SPR sensors for viral detection, including SARS-CoV-2 [29], with angular sensitivities exceeding 370 degrees per refractive index unit (°/RIU). Furthermore, transmission-based MoS2-enhanced SPR fiber sensors operating in the terahertz regime have shown detection resolutions below 10−7 refractive index units [30].
The present study focuses on a theoretical design of an SPR sensor incorporating a Cu/Si3N4/MoS2 multilayer configuration, optimized for the detection of multiple cancer cell types. The investigation employs the transfer matrix method (TMM) to simulate angular reflectance spectra under conditions mimicking the optical signatures of cancerous cells. Emphasis is placed on identifying material parameters and layer configurations that maximize resonance angle shift per refractive index unit. The model accounts solely for physical refractive index variations and does not involve experimental validation, biological interaction specificity, or fabrication procedures. Instead, the objective is to establish a high-fidelity computational framework for evaluating sensor feasibility, guiding subsequent experimental development, and expanding the landscape of MoS2-based plasmonic biosensing.

2. Methodology

2.1. Numerical Framework

The numerical framework approach is given in Refs. [31,32]. To begin, the equation used to compute the total reflection of the N-layer model may be expressed as:
R = M 11 + M 12   q N q 1 M 21 + M 22   q N M 11 + M 12   q N q 1 + M 21 + M 22   q N 2
Then, the reflectance is noted as a function of the angle of incidence, the so-called SPR deep curve. Using (1), we can calculate the peak position, angle shift variation, full width at half maximum (FWHM), and attenuation percentage.
On the other hand, the performance metrics of the proposed SPR sensors are calculated as follows.
  • The sensitivity enhancement regarding the baseline sensors after/before analyte adsorption:
    S R I a f t e r = ( S R I a f t e r S R I b e f o r e ) S R I b e f o r e
  • The sensitivity to the refractive index after analyte adsorption:
    S R I = θ n
    where θ is the angle shift variation and n is the refractive index variation (dimensionless).
  • The detection accuracy (DA) is expressed in terms of θ and FWHM (in degrees) as:
    D A = θ F W H M
  • The quality factor (QF) is denoted in terms of S R I and FWHM:
    Q F = S R I F W H M
  • The figure of merit (FoM) is expressed as:
    F o M = S R I ( 1 R m i n ) F W H M
    where R m i n shows the lowest normalized reflection value from the SPR curve.
  • The limit of detection (LoD) is calculated as:
    L o D = n θ × 0.005 °
  • The comprehensive sensitivity factor (CSF) ratio is computed based on Ref. [33] (and reference inside):
    C S F = S R I × ( R m a x R m i n ) F W H M
    R m a x represents the maximum reflectance before deep resonance. The investigation is conducted with a data sampling of 5 × 10 4 points. Notably, all simulations assume TM-polarized light, as required for surface plasmon excitation at the metal–dielectric interface.
It is important to clarify that the current study is grounded in a theoretical framework that models cancer detection solely through physical variations in the refractive index (RI) at the metal–dielectric interface. This approach assumes that malignant transformations induce measurable RI shifts due to changes in cell morphology, density, and intracellular composition. However, the modeling approach does not incorporate biochemical specificity or molecular recognition mechanisms, such as antibody–antigen interactions, which would be required for the selective identification of specific cancer types or biomarkers in complex biological samples. Therefore, the proposed SPR sensor configurations should be interpreted as early-stage, label-free platforms designed to assess the feasibility and sensitivity of detecting bulk RI contrasts associated with malignant cell populations.

2.2. Systems and Initial Parameters

To assess the optical and sensing performance of the proposed biosensor, five distinct configurations were analyzed, as outlined in Table 1. The baseline system (Sys0, P/Cu/PBS) comprises a BK-7 glass prism and a copper thin film interfaced with phosphate-buffered saline (PBS), serving as a reference without any biological perturbation. In Sys1 (P/Cu/MCancer), a biological and generic cancer sample [34] replaces the PBS medium to model the initial interaction between copper and a representative cancerous analyte, enabling the characterization of surface plasmon resonance (SPR) shifts due to biological refractive index changes alone. Building upon this system, Sys2 (P/Cu/SN/MCancer) introduces a 5.00 nm thick silicon nitride (Si3N4) layer between the copper and the sensing medium. Si3N4 is a robust dielectric known for its high transparency, thermal stability, and low optical loss in the visible spectrum and has previously demonstrated significant field-confining capabilities in SPR structures [35]. This layer also provides protection against copper oxidation and supports stable field propagation.
In Sys3 (P/Cu/SN/MoS2/MCancer), a monolayer of molybdenum disulfide (MoS2) is added on top of the Si3N4 layer, followed by the cancer sample. MoS2, a two-dimensional transition metal dichalcogenide, has shown exceptional light–matter interaction characteristics and supports increased surface adsorption of biomolecules due to its large surface-to-volume ratio [36]. In Sys4 (P/Cu/MoS2/SN/MCancer), the positions of Si3N4 and MoS2 are reversed to evaluate the influence of layering sequence on plasmonic coupling and resonance efficiency. This comparative framework enables an in-depth exploration of how nanomaterial integration affects SPR sensitivity and specificity.
The corresponding material parameters for each layer are summarized in Table 2. The BK-7 prism (n = 1.5151), selected for its favorable dispersion characteristics and cost-effectiveness, serves as the input medium for the excitation of surface plasmons [37]. Copper is employed as the plasmonic metal due to its high electrical conductivity and strong plasmonic response. Although less chemically stable than gold or silver, the use of copper is justified by its cost efficiency and ability to support intense field confinement when properly encapsulated. Copper presents a complex refractive index n = 0.0369 + 4.5393i at the excitation wavelength of 633 nm and a thickness of 45 nm; these values were chosen based on previous reports [38].
Si3N4 is modeled with a real refractive index of 2.0394 and thickness of 5.00 nm, a configuration supported by prior biosensing literature [39]. The MoS2 layer is modeled with a refractive index of n = 5.0805 + 1.1723i and a monolayer thickness of 0.65 nm, in alignment with experimental data for optoelectronic applications [40]. For the biological layers, PBS is represented by a refractive index of 1.335 [41], and the cancer sample layer is modeled with an average refractive index of 1.349, which reflects the optical response of a malignant cell environment due to increased protein and nuclear content [34]. The combination of copper, Si3N4, and MoS2 in Sys4 is expected to yield a synergistic enhancement in field localization, analyte interaction, and sensing precision.

3. Results and Discussion

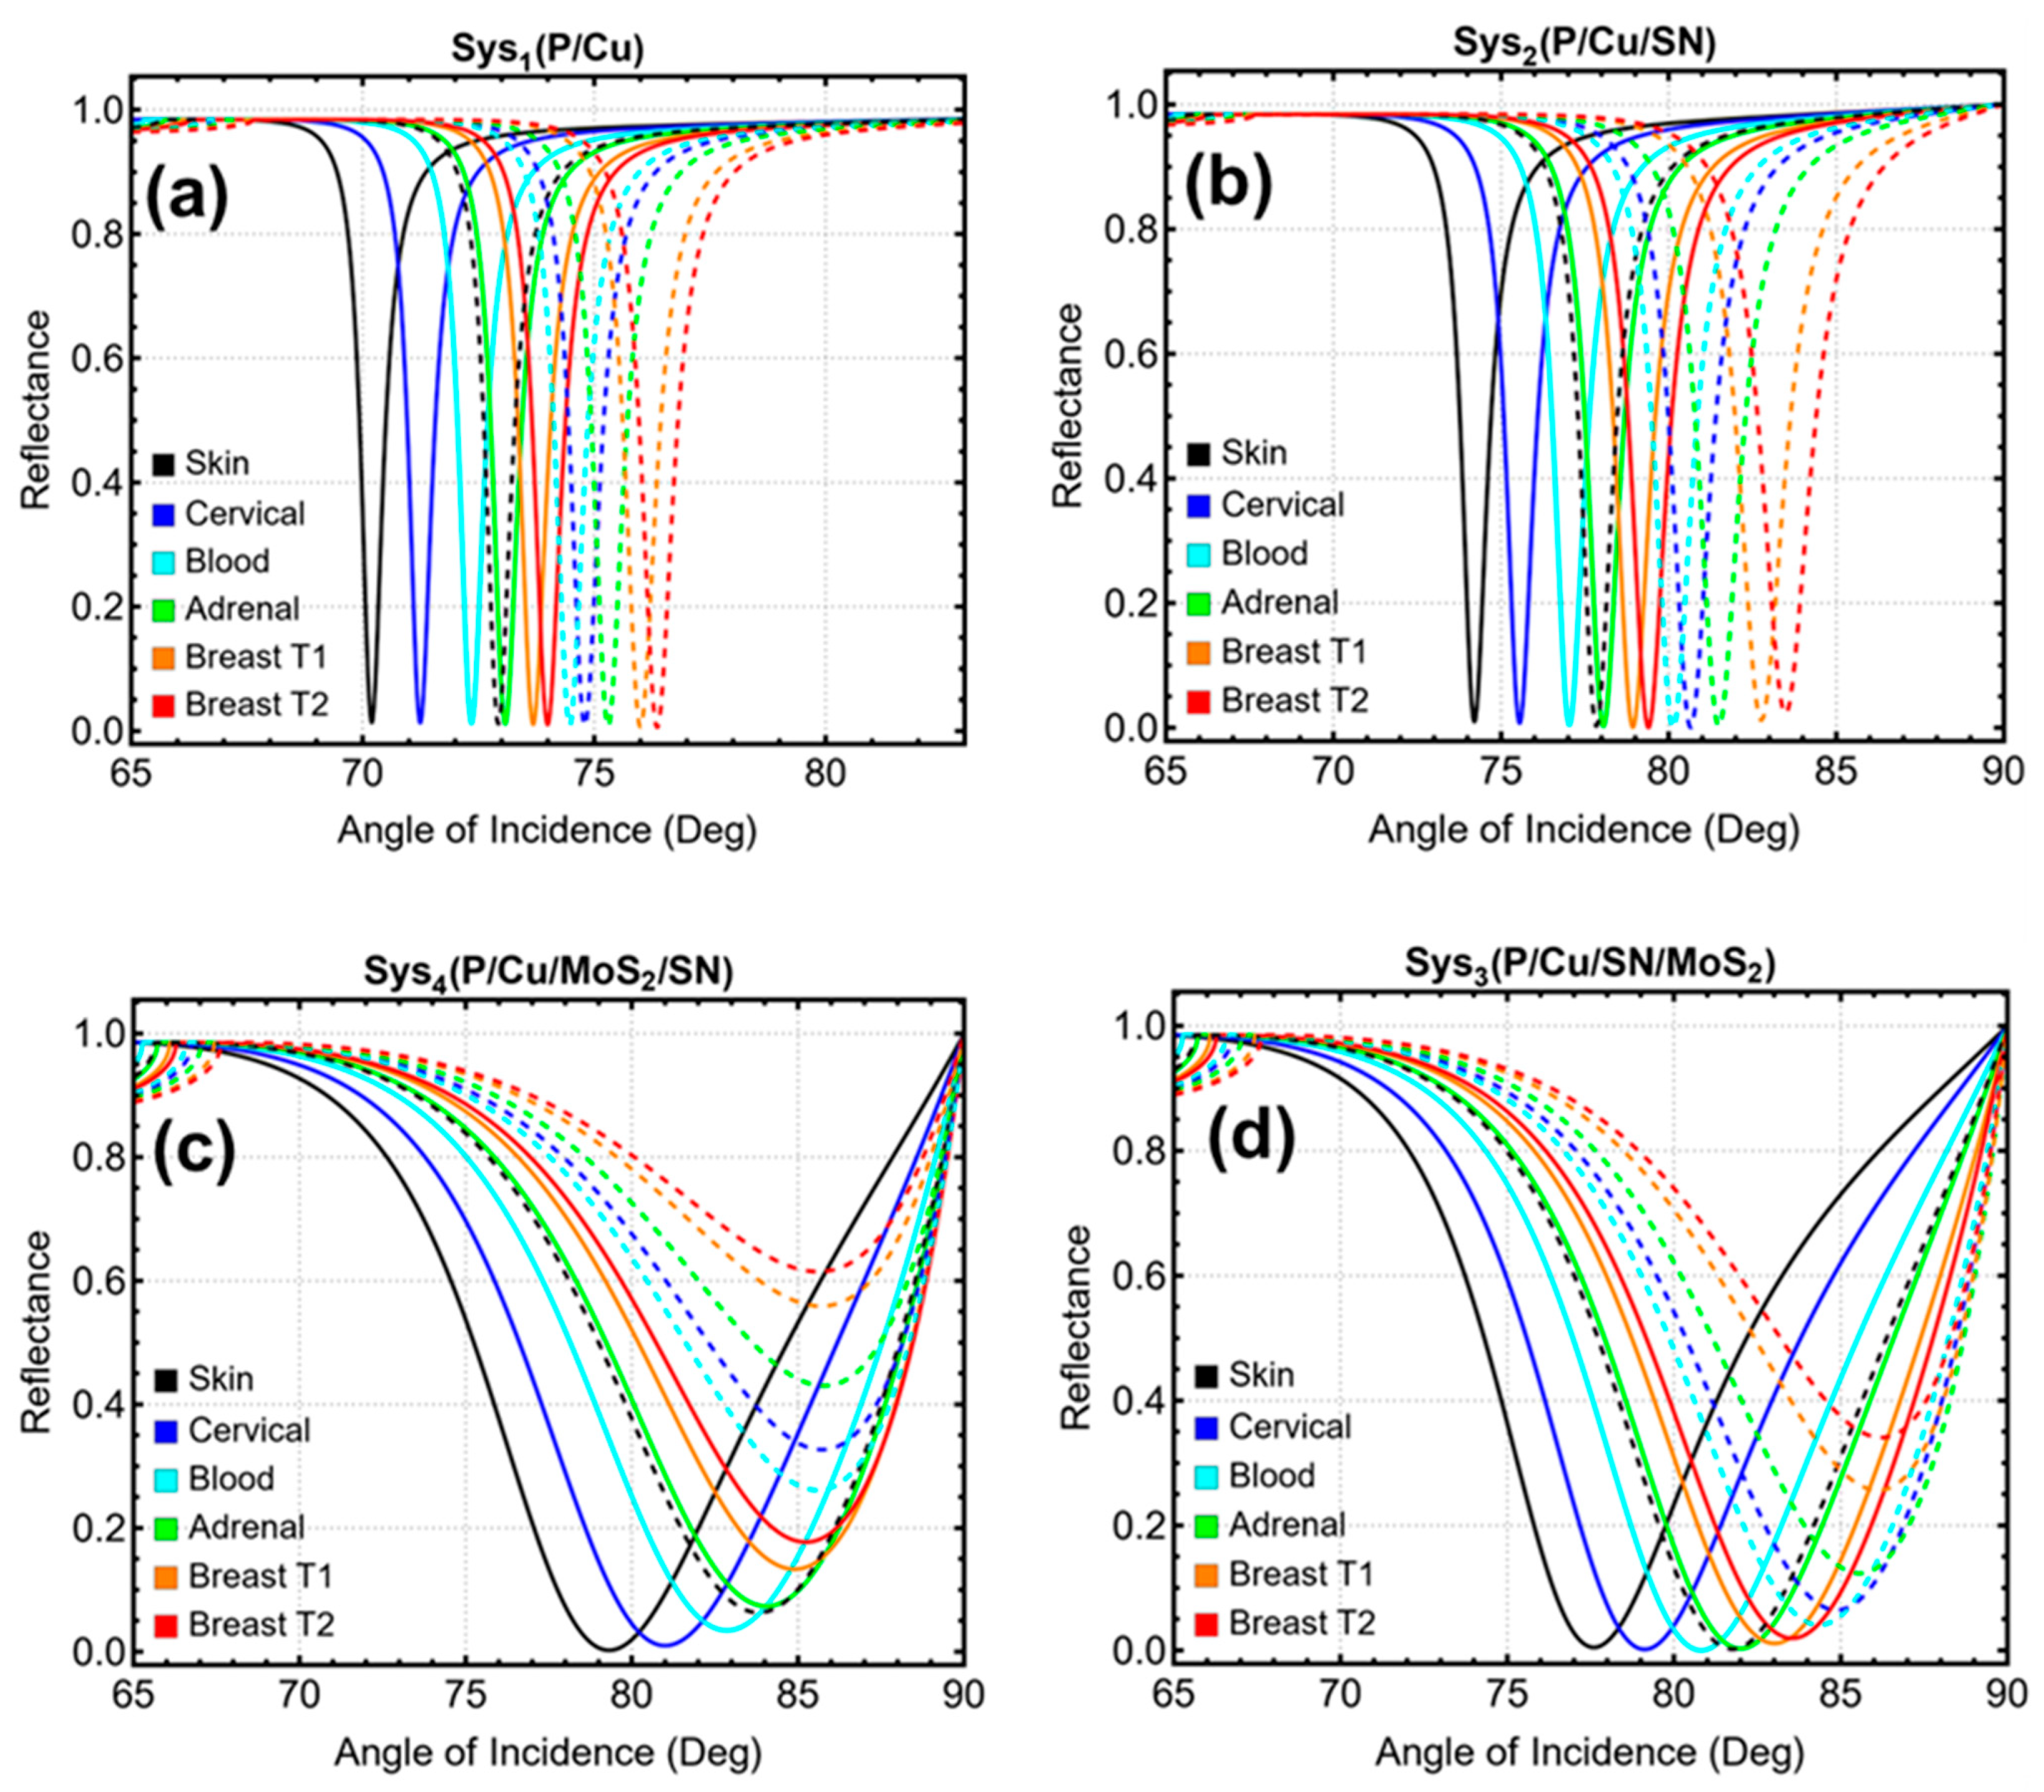
3.1. Systems Under Consideration

To evaluate the sensing performance of the proposed SPR biosensor architecture for detecting cancer, four multilayer systems (Sys1 to Sys4) were analyzed relative to the baseline configuration (Sys0). Each system includes a representative cancer sample to assess its ability to detect refractive index variations associated with malignant cells [34]. The comparative analysis was based on simulated reflectance behavior, with quantitative metrics shown in Figure 1 and summarized in Table S1.
As shown in Figure 1a, the baseline structure Sys0, consisting of Cu interfaced with PBS (black curve), produces an SPR dip at 66.90°, which serves as a reference. Replacing PBS with a cancer sample in Sys1 (violet curve) causes a resonance shift to 68.86°, indicating the sensor’s ability to detect changes in the surrounding refractive index. With the inclusion of a Si3N4 layer in Sys2 (cyan), the SPR dip further shifts to 71.28°, suggesting improved field confinement and light–matter interaction. The addition of a MoS2 monolayer in Sys3 (green) results in a peak at 72.62°, and rearranging the stack to form Sys4 (red) slightly moves the peak position to 72.50°.
Sensitivity enhancement relative to the reference system is shown in Figure 1b. Sys1 achieves a 2.38% increase, while Sys2 performs notably better with 5.97%. Sys3 and Sys4 offer the highest enhancements at 7.96% and 7.79%, respectively. These results indicate a stronger electromagnetic response when MoS2 is integrated, either directly at the sensing interface or sandwiched between the metal and dielectric layers.
The angular shift Δθ, shown in Figure 1c, follows a consistent trend. Sys1 exhibits a minor shift of 1.60°, while Sys2 responds with 4.02°. Both MoS2-based configurations record larger angular deviations: 5.36° for Sys3 and 5.24° for Sys4. This behavior is beneficial for distinguishing subtle changes in the refractive index, which is particularly important for early-stage cancer detection.
The attenuation percentage, as shown in Figure 1d, differs considerably between the systems. Sys1 and Sys2 show pronounced resonance dips (28.19% and 28.21%), while Sys3 and Sys4 maintain reflectance levels near baseline with minimal attenuation (0.32% and 0.01%, respectively). This characteristic may contribute to improved signal clarity in systems with lower attenuation.
The full width at half maximum (FWHM), plotted in Figure 1e, is a key factor in assessing spectral sharpness and resolution. Sys1 offers the narrowest dip at 1.09°, followed by Sys2 at 1.48°. While Sys3 exhibits a broader dip at 2.81°, it also achieves the highest angular shift. Sys4 presents a slightly narrower FWHM at 2.60°, suggesting a more compact resonance while retaining strong sensing performance. Rather than prioritizing a single design, this study considers all four configurations as viable candidates for refractive-index-based cancer detection. Their respective trade-offs in angular resolution, sensitivity, attenuation, and FWHM could guide subsequent application-specific evaluations.

3.2. Cooper Optimization

Copper thickness directly influences the strength and shape of plasmonic resonance in SPR biosensors. To identify the optimal conditions for each system (Sys1 through Sys4), simulations were carried out over a Cu thickness range from 30 nm to 55 nm. Results are presented in Figures S1 and S2 and Table S2, with key parameters including angular shift (Δθ) (Figure S2a), sensitivity enhancement (Figure S2b), attenuation (Figure S2c), and FWHM (Figure S2d).
The reflectance curves in Figure S1a–d reveal a common trend: thinner Cu layers (30–35 nm) lead to broader and weaker resonance dips across all systems, indicating inefficient field confinement. As the thickness increases to 45 nm, the dips become sharper and deeper, suggesting improved coupling and reduced loss. In some cases, thicker layers beyond 45 nm begin to degrade resonance sharpness slightly, indicating diminishing returns.
The angular shift behavior shown in Figure S2a reflects distinct patterns for each system. Sys1 and Sys2 show a mild decline in Δθ as thickness increases, with Sys1 dropping from 1.83° at 30 nm to 1.58° at 55 nm and Sys2 decreasing from 1.93° to 1.81°. Despite this reduction, the simultaneous improvements in attenuation and FWHM justify the choice of 55 nm for these two systems. As shown in Figure S2c, attenuation drops dramatically—from above 70% at 30 nm to just 1.38% and 1.38% for Sys1 and Sys2 at 55 nm. This improvement is critical for enhancing the signal-to-noise ratio. Additionally, Figure S2d shows that FWHM narrows significantly, reaching 0.56° for Sys1 and 1.04° for Sys2. These results support the use of 55 nm as the most balanced thickness for stable and precise resonance in these simpler Cu-based structures.
Sys3 and Sys4 follow a different trajectory. In both systems, Δθ increases steadily with thickness, reaching 1.99° and 1.98° at 55 nm. Sensitivity enhancement also improves with thickness, peaking at 2.82% for Sys3 and 2.81% for Sys4. However, attenuation and FWHM show an inflection point. As seen in Figure S2c, attenuation reaches its lowest values at 45 nm—0.32% for Sys3 and 0.006% for Sys4—but starts to rise again beyond this point. Similarly, Figure S2d indicates that FWHM is minimized at 45 nm. For example, FWHM in Sys4 decreases from 2.60° at 45 nm to 1.88° at 55 nm, reducing the spectral sharpness that is crucial for high-resolution detection.
Based on these combined observations, 55 nm is selected for Sys1 and Sys2, where the marginal loss in Δθ is compensated by significant gains in spectral clarity and signal stability. For Sys3 and Sys4, the 45 nm condition provides the best balance between sensitivity, angular shift, attenuation, and FWHM. These optimized thickness values—55 nm for Sys1 and Sys2 and 45 nm for Sys3 and Sys4—are used in all subsequent analyses.

3.3. Silicon Nitride Optimization

The integration of a dielectric spacer such as Si3N4 between the metal layer and sensing medium in SPR biosensors offers both chemical stability and enhanced field confinement. To determine the optimal thickness of the Si3N4 layer, the sensor response was investigated in Sys2, Sys3, and Sys4 across a range from 5 nm to 15 nm. The reflectance behavior and corresponding metrics are summarized in Figures S3 and S4 and Table S3.
As shown in the reflectance profiles (Figure S3a–c), increasing Si3N4 thickness consistently shifts the SPR dips toward higher incidence angles in all systems, indicating stronger light–matter interaction with the cancer sample. This trend is quantitatively confirmed in Figure S4a, where Δθ increases with Si3N4 thickness. For instance, in Sys2, Δθ rises from 1.8° at 5 nm to 14.5° at 13 nm before declining slightly to 9.5° at 15 nm. A similar but more linear behavior is observed in Sys3 and Sys4, where Δθ reaches 15.0° and 15.9° at 15 nm, respectively.
Sensitivity enhancement, as shown in Figure S4b, mirrors the angular shift trend. Sys2 displays a substantial increase from 2.6% at 5 nm to a peak of 20.9% at 13 nm, followed by a reduction to 13.6% at 15 nm. Sys3 and Sys4 maintain a consistent rise, peaking at 21.3% and 22.5%, respectively, at 15 nm. These results confirm the ability of a thicker dielectric layer to extend the evanescent field into the sensing region, thus increasing sensitivity to refractive index changes.
However, the improved sensitivity and angle response must be evaluated alongside attenuation and FWHM to ensure overall sensor effectiveness. Figure S4c reveals that Sys2 maintains very low attenuation from 5 nm to 11 nm (e.g., 1.1% at 7 nm) but exhibits a sharp increase to 97.1% at 15 nm, significantly compromising resonance quality. Sys3 and Sys4 show less extreme but still notable increases, with attenuation rising to 67.9% and 67.4%, respectively, at 15 nm. Such high values reflect strong reflectance suppression at resonance and can limit detection contrast.
The FWHM data in Figure S4d further clarify this trade-off. At 7 nm, Sys2 presents a narrow dip width of 0.96°, which broadens to 7.64° at 15 nm. Sys3 and Sys4 follow the same upward trajectory. For instance, FWHM in Sys4 increases from 5.06° at 7 nm to 8.44° at 15 nm. This broadening reduces angular resolution and could impair the distinction of closely spaced resonance features in practical applications.
Given these observations, 7 nm emerges as the most balanced Si3N4 thickness across all systems. At this thickness, the following occurs:
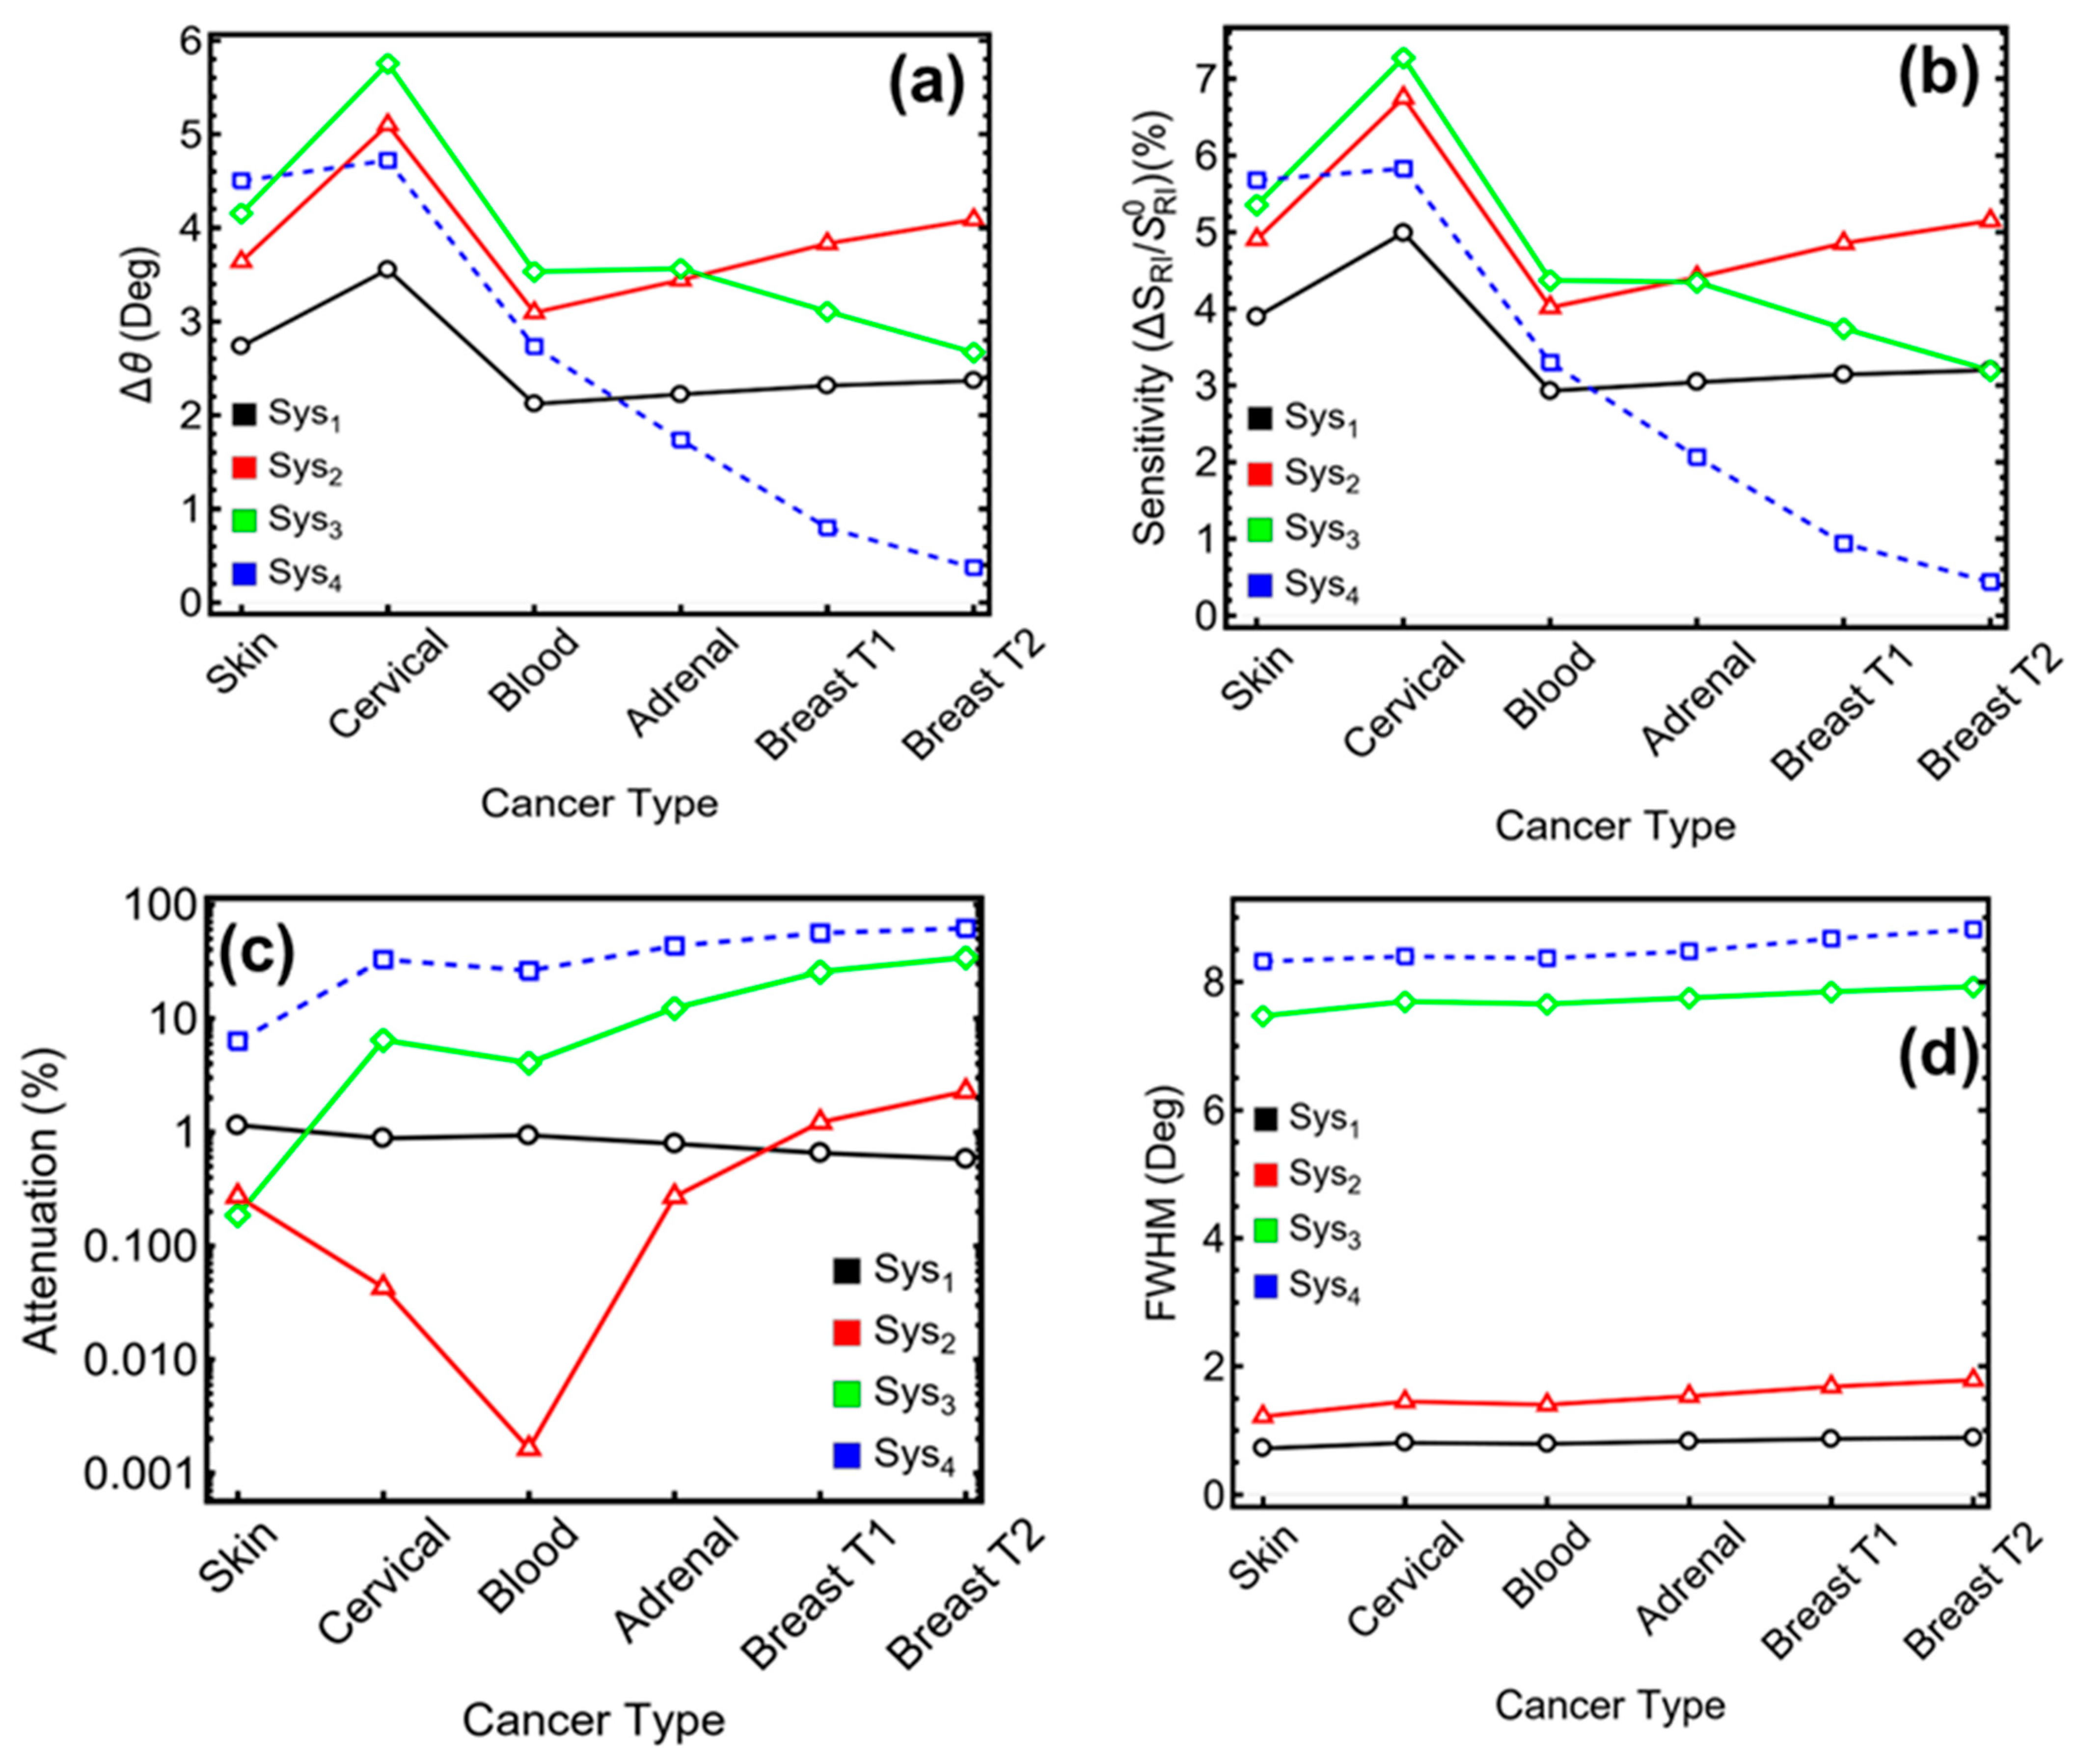
  • Sys2 achieves Δθ = 3.7°, sensitivity = 5.4%, attenuation = 1.1%, and FWHM = 0.96°.
  • Sys3 records Δθ = 4.0°, sensitivity = 5.6%, attenuation = 12.9%, and FWHM = 5.36°.
  • Sys4 offers Δθ = 3.9°, sensitivity = 5.5%, attenuation = 19.8%, and FWHM = 5.06°.
These values show meaningful improvements in sensing performance relative to the baseline while preserving dip sharpness and minimizing reflectance loss. Thus, 7 nm provides the most reliable configuration for maintaining a stable and detectable SPR signal in all three systems. This thickness is adopted in the remaining simulations for consistency and optimal performance.

3.4. Molybdenum Disulfide Optimization

To further emphasize, MoS2 has emerged as a promising 2D material in SPR biosensing due to its strong light–matter interaction, high surface adsorption capability, and refractive index sensitivity [42,43]. To determine the optimal number of MoS2 monolayers in the proposed sensor architectures, Sys3 and Sys4 were evaluated for layer counts ranging from 1 to 6 (denoted as L1–L6). The impact on reflectance behavior and performance metrics was assessed using the results in Figures S5 and S6 and Table S4.
As shown in the reflectance curves (Figure S5a,b), increasing the number of MoS2 layers leads to a systematic redshift of the SPR dip in both systems, accompanied by a broadening of the resonance curve. These shifts reflect deeper field penetration and increased interaction with the analyte, especially in multilayered MoS2 configurations [42].
Quantitative analysis in Figure S6a shows that Δθ increases steadily with the number of MoS2 layers. In Sys3, Δθ grows from 2.0° at L1 to 10.7° at L6. In Sys4, the same trend is observed, rising from 2.0° at L1 to 11.1° at L6. Similar behavior is reported for sensitivity enhancement in Figure S6b, where Sys3 reaches 14.9% at L6 and Sys4 peaks at 15.5%. These results indicate that additional MoS2 layers effectively enhance sensor response by amplifying the evanescent field’s interaction with the biological analyte [43].
However, improvements in Δθ and sensitivity must be weighed against attenuation and FWHM. As shown in Figure S6c, attenuation in Sys3 initially decreases to a minimum of 0.87% at L2 before rising again to 45.9% at L6. Similarly, in Sys4, attenuation drops to just 0.004% at L3 but increases beyond that, reaching 33.2% at L6. This rise in attenuation at higher layer counts suggests a growing energy loss at resonance, which can degrade detection contrast and the signal-to-noise ratio. Indeed, FWHM, as presented in Figure S6d, also shows a consistent increase with additional MoS2 layers. In Sys3, FWHM widens from 5.1° at L1 to 12.3° at L6, while Sys4 grows from 4.8° to 11.5° over the same range. Broader FWHM indicates reduced angular resolution, which can compromise the ability to differentiate subtle changes in analyte concentration.
Considering these trade-offs, two MoS2 layers (L2) are selected as the optimal condition for Sys3. At this point, Sys3 achieves a substantial angular shift (3.8°), sensitivity enhancement (5.3%), and a remarkably low attenuation of 0.87%, with FWHM maintained at 6.98°. For Sys4, three MoS2 layers (L3) provide the most balanced performance. At L3, the system records Δθ = 5.5°, sensitivity enhancement = 7.6%, and an exceptionally low attenuation of 0.004%, while keeping FWHM at 8.05°. Although higher layers improve Δθ further, they introduce more significant losses and reduce spectral definition, making L3 the most efficient and stable configuration. These configurations are adopted in all subsequent analyses.

3.5. Optimized Parameters and Cancer Samples Tested

Table 3 presents the optimized material configurations and corresponding structural parameters for the four multilayer systems evaluated in this study. These values result from sequential parametric optimization aimed at maximizing resonance angle sensitivity while minimizing reflectance broadening. In Sys1 and Sys2, the copper layer thickness was fixed at 55.0 nm, whereas in Sys3 and Sys4, a thinner copper layer of 45.0 nm was selected to enhance coupling efficiency in the presence of additional functional layers. The dielectric silicon nitride (Si3N4) layer, where included, was maintained at a uniform thickness of 7.0 nm, based on its role in improving field confinement and reducing damping losses. The molybdenum disulfide (MoS2) layer was introduced in Sys3 and Sys4, with a thickness corresponding to two monolayers (1.30 nm) and three monolayers (1.95 nm), respectively. These layer counts were chosen to balance the trade-off between increased light–matter interaction and signal attenuation, ensuring favorable spectral resolution across the operational range.
Regarding the origin and consistency of the refractive index values used in this theoretical investigation, Table 4 provides a comparative summary of the normal and cancerous refractive indices (RIs) for six representative cancer types, together with relevant experimental details reported in prior studies. These values were not derived from the direct experimentation in the present work but were selected from previously validated literature sources [44,45,46,47,48,49], where consistent cancer-induced RI shifts were quantified under controlled conditions. In each referenced case, simulations were based on a cancer cell concentration of approximately 80%, as adopted in Ref. [34], which represents a biologically plausible scenario for evaluating optical contrast between malignant and non-malignant cell populations. This concentration enables the modeling of maximum expected optical perturbation, thereby providing a rigorous framework for assessing the theoretical sensitivity limits of SPR-based detection systems.
Regarding specificity, the current sensor model does not incorporate chemical functionalization or molecular recognition layers. Instead, the detection relies on the intrinsic optical contrast introduced by physical changes in cancer cell morphology and density, which affect the local refractive index at the metal–dielectric interface. While this approach does not distinguish between cancer types through biochemical affinity, it enables label-free and rapid identification based on optically resolvable parameters. The SPR systems evaluated here use angular interrogation to capture small RI variations, which are amplified by the multilayer design, particularly in configurations integrating MoS2 and Si3N4 layers. As noted, these materials enhance local electromagnetic field confinement and resonance sharpness, improving the ability to resolve subtle RI differences associated with specific cell lines.
Each cancer type modeled corresponds to a well-characterized cell line with distinct biophysical properties. For instance, the MDA-MB-231 and MCF-7 breast cancer lines exhibit differing nuclear densities and membrane compositions, contributing to measurable RI disparities. Similarly, Jurkat (blood), HeLa (cervical), and PC-12 (adrenal) cells have been reported to induce RI changes in the range of 0.014 to 0.033 units compared to their normal analogues. These differences, while moderate, fall within the angular resolution capacity of SPR systems operating with optimized multilayer stacks.
We point out that no experimental determination of the linear detection range was performed in the present study. However, based on previous experimental works [46,49], effective SPR detection in similar contexts has been demonstrated at concentrations as low as 1:105 (e.g., MDA-231 in blood). This suggests that SPR sensors designed for physical refractive index interrogation, particularly those augmented with MoS2 for enhanced field localization, are theoretically capable of detecting cancer cells at low abundance, provided that there is sufficient optical separation from background components.

3.6. Cancer Detection

The practical relevance of the proposed biosensor systems is evaluated by analyzing their performance in detecting six different cancer types: skin, cervical, blood, adrenal, breast T1, and breast T2. The sensor response before and after cancer onset is shown through reflectance curves in Figure 2, while detailed performance metrics are plotted in Figure 3 and quantified in Table S5.
The SPR reflectance curves in Figure 2a–d demonstrate resonance angle shifts upon exposure to malignant samples across all systems. In Sys1 and Sys2, these shifts are evident but modest, with well-defined dips and relatively narrow resonance profiles. In Sys3 and Sys4, the resonance shifts are larger and consistently differentiated across all cancer types, reflecting stronger plasmon–analyte interaction due to the presence of MoS2 and optimized dielectric structuring. Quantitatively, Figure 3a shows that Δθ increases significantly in Sys3, ranging from 2.67° (breast T2) to 5.76° (cervical). Sys4 also performs well, but the shift reduces for high-RI samples such as breast T2 (0.37°) and breast T1 (0.79°), indicating decreasing sensitivity for later-stage malignancies. In contrast, Sys1 and Sys2 maintain moderate shifts, peaking at 3.56° and 5.10°, respectively, for cervical cancer.
The sensitivity enhancement trends in Figure 3b mirror those of Δθ. Sys3 achieves the highest enhancement overall, with values up to 7.27% (cervical) and consistently above 4.30% across all cancer types. Sys4 follows closely for skin and cervical cancers but drops significantly for breast and adrenal cancers, with a minimum of 0.43% (breast T2). Sys2 maintains sensitivity levels between 4.01% (blood) and 6.75% (cervical), outperforming Sys1, which remains mostly below 4.99% across all cases.
In terms of attenuation (Figure 3c), Sys1 and Sys2 demonstrate very low energy losses for all cancer types, ranging from 0.58% to 1.15% in Sys1 and even reaching 0.001% for blood cancer in Sys2. These low attenuation values produce sharp resonance dips, which are useful for accurate angle detection. However, Sys3 also maintains manageable attenuation, with values mostly under 13.93%, and a minimum of 0.18% for skin cancer. Sys4, by contrast, exhibits notably high attenuation in multiple cases, especially 61.46% (breast T2) and 55.89% (breast T1), which can obscure resonance detection.
The FWHM results in Figure 3d provide insight into the resolution quality of each system. Sys1 and Sys2 maintain narrow FWHM values under 1.79°, favoring high angular precision. However, these gains come at the expense of sensitivity. Sys3 exhibits broader FWHM values between 7.47° (skin) and 7.93° (breast T2), which are acceptable given the strong angular shifts and sensitivity enhancements. Sys4, although similar in architecture, displays slightly broader FWHM values up to 8.81°, combined with increased attenuation, which limits its practical advantage.
The comprehensive performance data in Table S5 highlight Sys3 as the most effective biosensor design for detecting all six cancer types. Sys3 delivers a high angular shift (e.g., 5.76° for cervical), strong sensitivity (e.g., 7.27%), and moderate attenuation (e.g., 0.87–12.33%) across the board. Its ability to maintain reliable detection across early- and mid-stage cancers, while balancing field confinement and signal clarity, supports its broader diagnostic applicability.

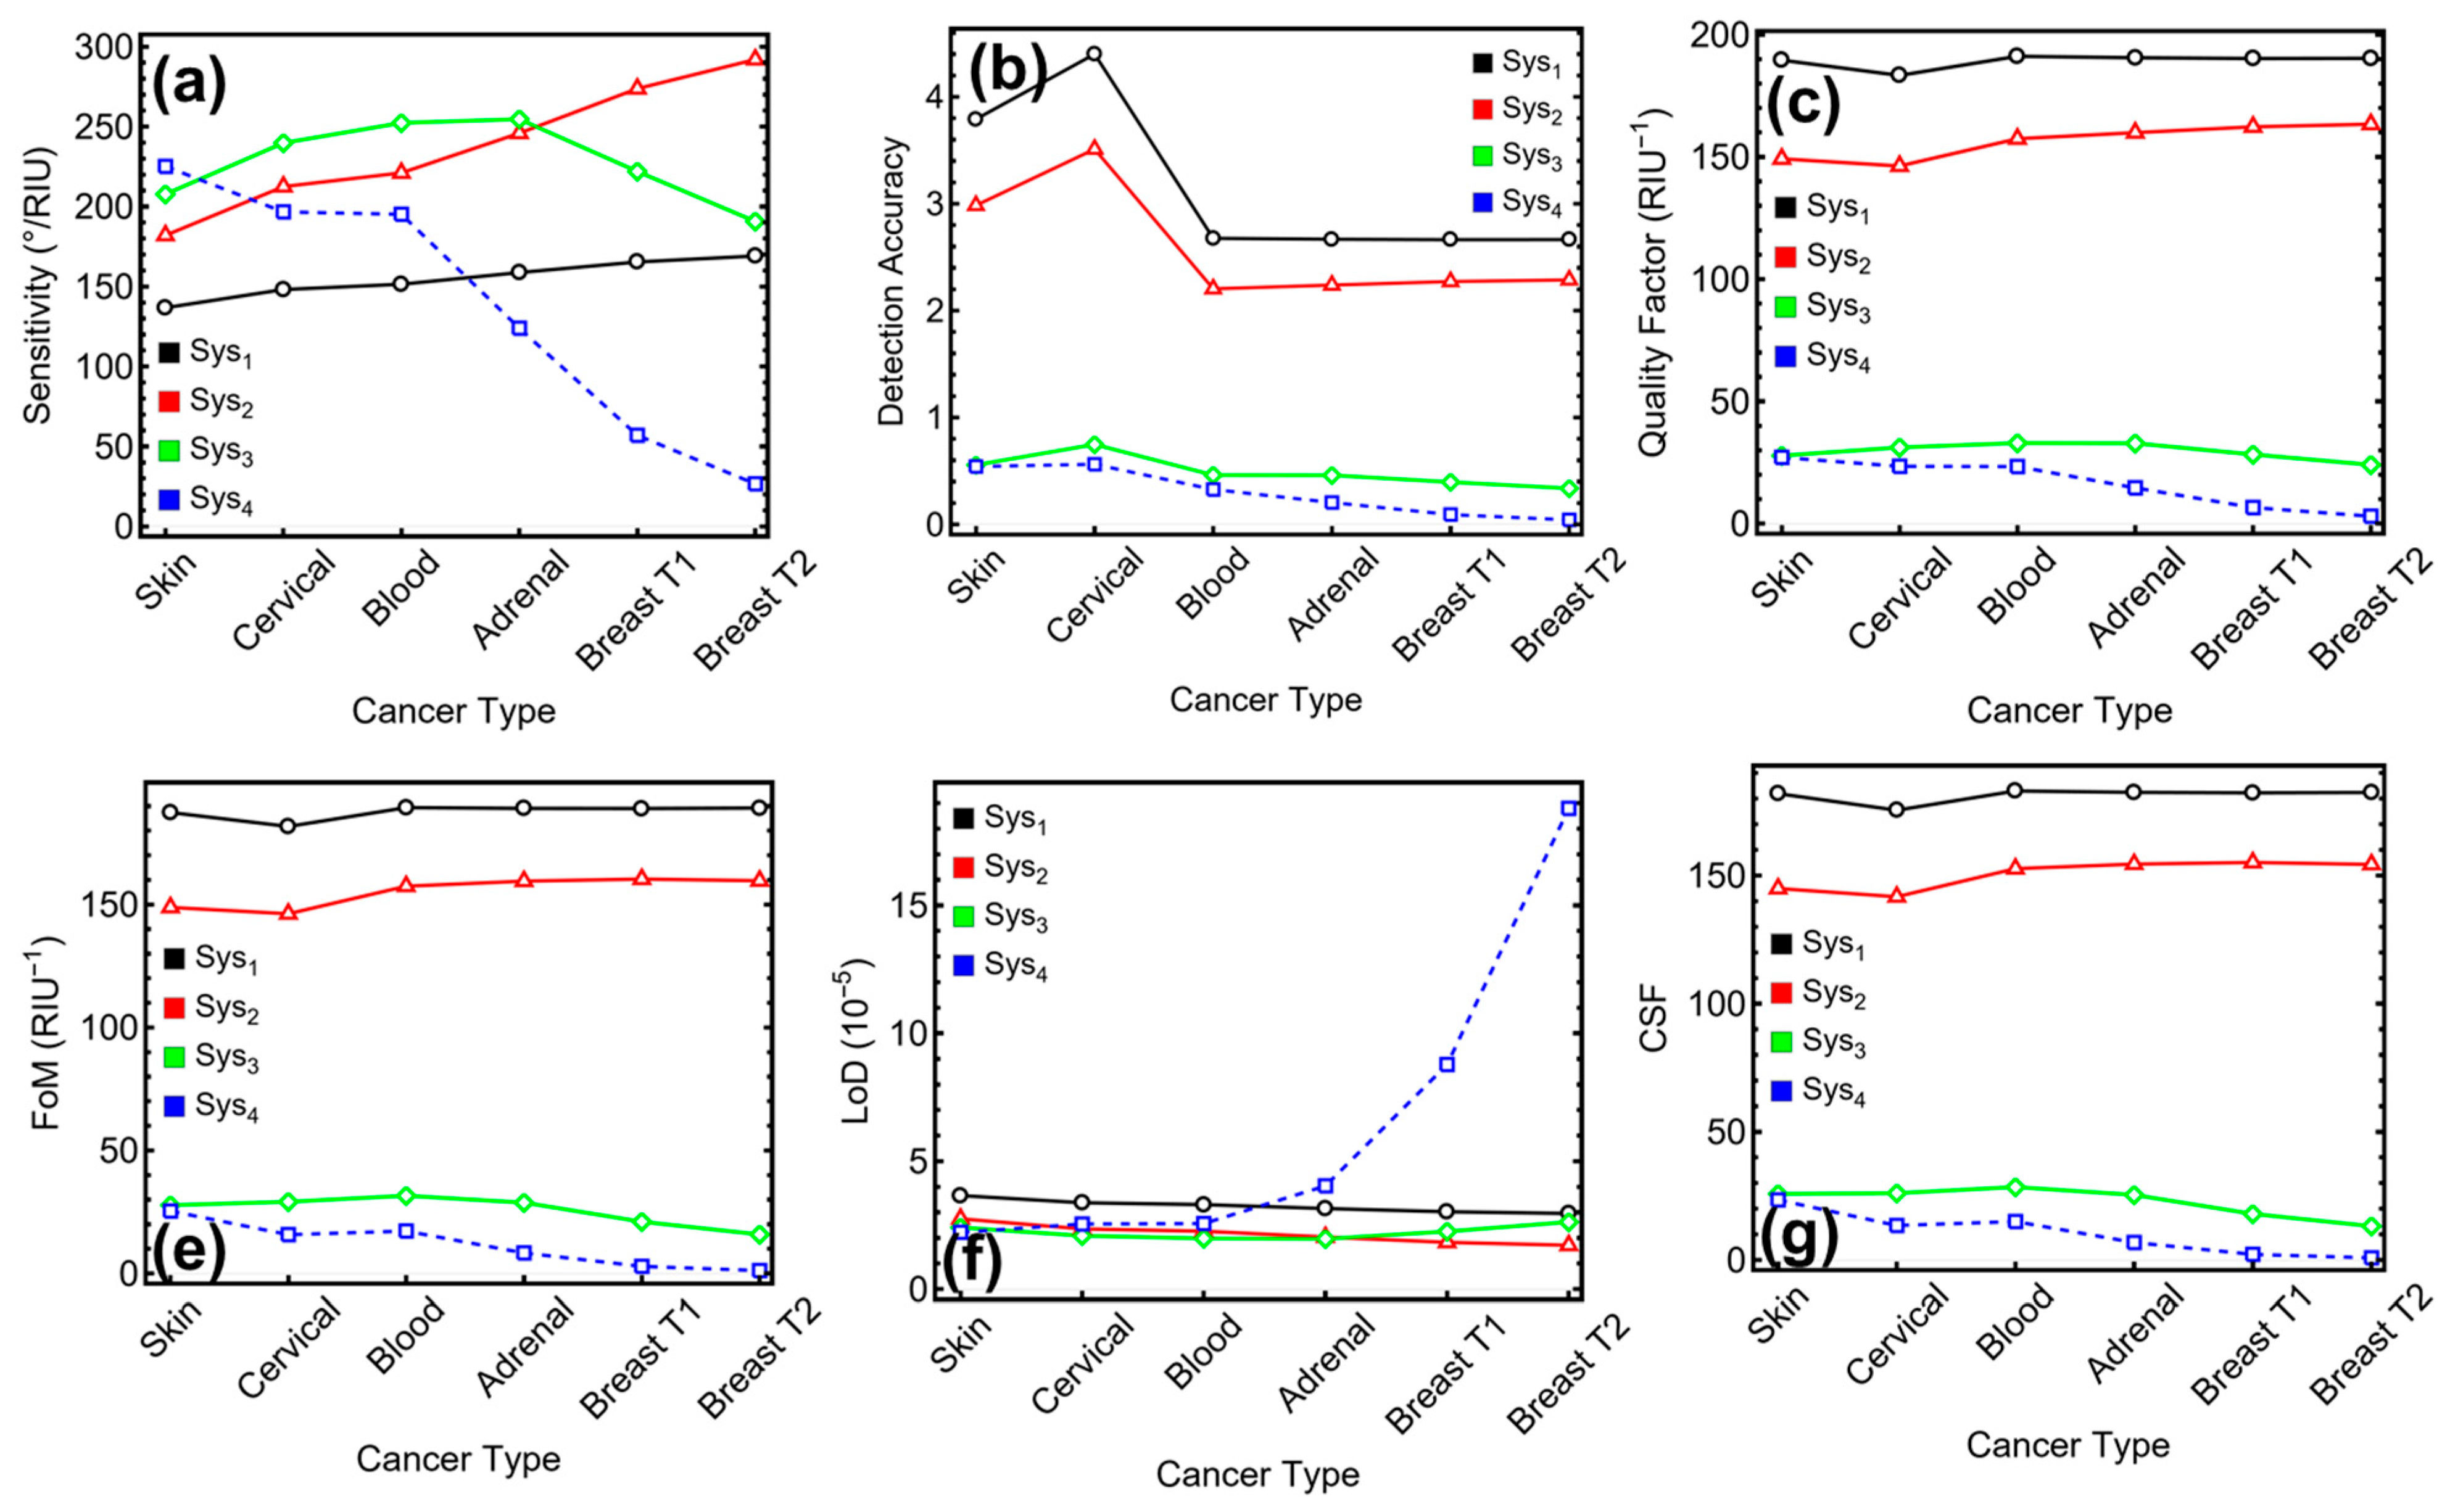
3.7. Performance Metrics of the Biosensor

To assess the diagnostic utility of the optimized SPR biosensors, an extended analysis was performed across six biologically relevant cancer types, using key performance indicators: sensitivity (S, Figure 4a), detection accuracy (DA, Figure 4b), quality factor (QF, Figure 4c), figure of merit (FoM, Figure 4e), limit of detection (LoD, Figure 4f), and comprehensive sensitivity factor (CSF, Figure 4g), with the results summarized in Figure 4 and Table 5.
Among all configurations, the MoS2-integrated systems, Sys3 and Sys4, demonstrated the highest sensitivity to refractive index variations (Figure 4a). In Sys3, S values ranged from 190.71 °/RIU (breast T2) to 254.64 °/RIU (adrenal), while Sys4 achieved sensitivity up to 225.13 °/RIU (skin). These values confirm the enhanced light–matter interaction enabled by the MoS2 layers. This behavior is especially advantageous for detecting early-stage cancers that manifest as subtle refractive index shifts, such as skin, cervical, or blood malignancies.
However, as expected from high-field enhancement systems, Sys3 and Sys4 exhibited trade-offs in terms of resonance sharpness. Detection accuracy values in Sys3 fell below 0.75 across all cancer types, while Sys4 registered even lower values, especially for blood and breast cancer, where DA dropped to 0.204 and 0.042, respectively (Figure 4b). These reduced values reflect the broader resonance profiles, which were previously linked to increased FWHM, and indicate a compromise in angular resolution. In cancers where precision localization of the resonance dip is essential, this trade-off becomes more critical.
Despite this, Sys3 maintains balanced performance in early-to-mid index cancers. It demonstrates LoD values ranging from 1.96 × 10⁻⁵ (adrenal) to 2.62 × 10⁻⁵ (breast T2), which are comparable to or better than those of Sys1, and still within the detection limits required for clinical applications (Figure 4f). Sys4, while still sensitive in low-index cases, suffers performance loss in high-index malignancies—its LoD rises sharply to 18.79 × 10⁻⁵ for breast T2, and its CSF falls to 0.82 (Figure 4f), indicating instability in complex detection scenarios.
Sys3 remains particularly strong for cancers with moderate refractive index change, such as cervical, skin, and blood cancers. For example, in cervical cancer, Sys3 provides 239.79 °/RIU sensitivity, an FoM of 29.15 RIU−1, and a reasonable LoD of 2.19 × 10⁻⁵, confirming its suitability in early detection with limited molecular mass (Figure 4e,f). For blood cancer, Sys3 maintains high sensitivity (252.32 °/RIU), with a balanced FoM (31.61 RIU−1) and competitive CSF (28.45). While its angular precision remains lower than that of Sys1, the overall field interaction strength and low detection threshold justify its use when sensitivity is the driving factor.
Sys4, while also MoS2-based, shows a steeper decline in performance for cancers with high refractive index shifts, such as breast T1 and T2. Its sensitivity to breast T2 drops to 26.61 °/RIU, and its FoM reaches only 1.16 RIU−1, with an extremely low DA and CSF. However, in low-RI cancers like skin and cervical cancer, Sys4 provides solid metrics, e.g., 196.67 °/RIU sensitivity and 15.78 RIU−1 FoM for cervical cancer—making it viable for detection in early-stage scenarios where the RI contrast is less dramatic.
By contrast, while Sys2 offers a strong balance of metrics across all cancers, including sharp dips and a low LoD, its structure lacks the advanced nanomaterial interaction capability provided by MoS2. Its performance remains robust but inherently limited in field enhancement compared to Sys3. The current study, therefore, does not aim to downplay Sys2 but rather positions it as a reference to highlight how MoS2-enhanced architectures—especially Sys3—can outperform conventional designs in high-sensitivity applications.

3.8. Literature Comparison

Table 6 presents a comparative summary of sensitivity values (S, in °/RIU) reported for surface plasmon resonance biosensors targeting adrenal and cervical cancer detection [34,50,51]. The benchmarked configurations incorporate various multilayer stacks based on noble metals (Ag, Au), 2D materials (PtSe2, black phosphorus), and dielectric enhancements. In particular, Ref. [51] corresponds to a recent contribution from our research group, in which a dual BP–Si3N4 design demonstrated high angular sensitivity due to the synergistic interaction between anisotropic electronic behavior and dielectric confinement. In the present work, two novel configurations were evaluated: BK7–Cu–Si3N4–MoS2 for adrenal cancer detection and BK7–Cu–MoS2–Si3N4 for cervical cancer detection. These systems achieved theoretical sensitivities of 254.64 °/RIU and 196.67 °/RIU, respectively. While these values are modestly lower than those obtained using BP-based or dual-metal systems, they remain competitive and exhibit several advantages that merit emphasis.
First, copper offers a cost-effective and abundant alternative to gold and silver, making it suitable for scalable sensor production. The sensitivity observed here validates the plasmonic potential of copper when integrated within a multilayer stack that includes both a dielectric (Si3N4) and a two-dimensional semiconductor (MoS2). This combination enhances field localization near the sensing interface while mitigating the oxidative instability of the metallic layer.
Second, the integration of MoS2 provides a valuable platform for future biochemical functionalization. Although the current model focuses exclusively on RI-based physical detection, MoS2’s high surface activity, tunable bandgap, and strong light–matter interaction suggest that additional gains in sensitivity could be achieved upon biochemical interface engineering or hybrid functional layering.
Moreover, the simulated systems offer a balanced trade-off between sensitivity and design simplicity. Unlike more intricate BP-based configurations or dual-metal architectures, the proposed structures maintain low complexity and fabrication feasibility without compromising optical performance. Their ability to distinguish small refractive index changes associated with malignant transformation reinforces their applicability in practical diagnostic contexts.

3.9. Potential Fabrication of the Proposed Biosensors

The proposed SPR sensor structures (BK7–Cu–Si3N4–MoS2 and BK7–Cu–MoS2–Si3N4) can be fabricated using established thin-film deposition and 2D material transfer techniques, as outlined below [52,53]:
  • BK7 glass substrates can be cleaned using piranha solution, rinsed with deionized water, and dried under nitrogen.
  • A Cu film (45–55 nm) can be deposited via thermal evaporation or sputtering under high vacuum. Immediate processing is recommended to minimize oxidation.
  • A 7 nm Si3N4 film can be deposited by low-temperature PECVD or ALD, depending on the configuration.
  • Few-layer MoS2 can be transferred using a PMMA-assisted wet transfer method from CVD-grown wafers, followed by PMMA removal and gentle annealing.
  • Optional thermal annealing (~150 °C, inert atmosphere) may be applied to improve interfacial quality and reduce transfer residues.
  • AFM, ellipsometry, and Raman spectroscopy may be used to validate layer thickness and material integrity prior to SPR interrogation.
To stress once more, from a physicochemical standpoint, MoS2 possesses several characteristics that make it particularly favorable for enhancing surface plasmon resonance (SPR) sensing platforms as related 2D materials [54]. First, MoS2 is a 2D transition metal dichalcogenide with a direct bandgap of ~1.8 eV at the monolayer level [55], which facilitates strong light–matter interaction near the visible spectrum, particularly at the commonly used SPR wavelength of 633 nm. Its high in-plane dielectric constant and moderate out-of-plane permittivity contribute to enhanced confinement of the evanescent electromagnetic field near the sensing surface [56]. This interaction not only amplifies the local field intensity but also promotes sharper resonance dips, thereby improving sensitivity and spectral resolution.
Furthermore, as stated, MoS2 exhibits a high surface-to-volume ratio and favorable adsorption sites for biomolecules, which can be exploited in future work for biochemical functionalization [57]. Its optical absorption, although not as intense as that of metallic layers, is sufficient to support hybrid plasmon–exciton coupling in layered structures, especially when integrated with metals like copper that provide strong SPR excitation but suffer from oxidation. The addition of MoS2 in a multilayer stack can improve sensor stability, sharpen resonance features, and allow for the tuning of the resonance angle response without compromising fabrication feasibility. These combined properties justify the selection of MoS2 in the present model as a candidate material for enhancing next-generation SPR biosensor performance.

3.10. Limitations

While the proposed Cu/Si3N4/MoS2-based SPR sensor shows strong theoretical potential, some experimental considerations merit discussion. The fabrication of few-layer MoS2 via PMMA-assisted transfer can introduce challenges such as layer non-uniformity, polymer residues, and interfacial defects, which may affect reproducibility and sensor performance. Though thermal annealing mitigates some issues, achieving consistent optical quality across batches remains non-trivial.
Additionally, integrating MoS2 with Cu and Si3N4 demands careful control of adhesion and layer interfaces to maintain plasmonic efficiency. From a translational perspective, although MoS2 has demonstrated biocompatibility, its long-term behavior under physiological conditions and potential for non-specific adsorption require further study before in vivo application. These limitations, however, do not diminish the material’s promise, but rather outline key areas for future experimental refinement and validation.

4. Conclusions

This work introduced and evaluated a series of Cu/Si3N4/MoS2-based SPR biosensors for the detection of various cancer types through refractive index variation. Four systems (Sys1–Sys4) were systematically optimized by adjusting copper thickness (45.00–55.00 nm), silicon nitride layer thickness (7.00 nm), and the number of MoS2 monolayers (two or three layers) to improve plasmonic sensitivity, angular shift, and spectral performance.
The configuration Sys3 (BK7–Cu–Si3N4–MoS2) demonstrated the best overall sensitivity, reaching 254.64 °/RIU for adrenal cancer and 239.79 °/RIU for cervical cancer. It maintained low detection limits down to 1.96 × 10⁻⁵ RIU, with reasonable figures of merit (FoMs) up to 31.61 RIU−1, despite broader resonance widths and reduced detection accuracy in high-RI cancers. For lower-index analytes such as skin and cervical samples, Sys3 achieved CSF values of 25.77 and 26.06, respectively, confirming its suitability for early-stage diagnostic scenarios. While Sys4 (BK7–Cu–MoS2–Si3N4) showed promising sensitivity for select cases (e.g., 196.67 °/RIU for cervical cancer), it exhibited performance degradation in higher-index conditions, with the FoM dropping below 2.90 RIU−1 and the CSF falling to 0.82 in breast T2 detection. In contrast, Sys2 provided consistently narrow resonance dips and low attenuation, but did not match the high sensitivity achieved by the MoS2-based systems.
The integration of MoS2 into the sensor stack significantly enhanced field confinement and analyte interaction, confirming the potential of these 2D-material-enhanced designs as viable alternatives to noble-metal-based biosensors. Overall, the proposed configurations—particularly Sys3—offer a compelling balance of sensitivity, stability, and material efficiency for the development of advanced label-free optical platforms for cancer diagnostics.

Supplementary Materials

The following supporting information can be downloaded at: https://www.mdpi.com/article/10.3390/sci7020076/s1, Figure S1. Copper thickness optimization. SPR response curves as a function of the angle of incidence for (a) Sys1, (b) Sys2, (c) Sys3, and (d) Sys4. Figure S2. Sensor response characteristics for Sys1–Sys4 across varying Cu thickness (30–55 nm): (a) angular shift, (b) sensitivity gain, (c) attenuation, and (d) FWHM. Figure S3. Silicon nitride thickness optimization. SPR response curves as a function of the angle of incidence for (a) Sys2, (b) Sys3, and (c) Sys4. Figure S4. Sensor response characteristics for Sys2–Sys4 across varying silicon nitride thickness (5–15 nm): (a) angular shift, (b) sensitivity gain, (c) attenuation, and (d) FWHM. Figure S5. Optimization of the number of MoS2 layers. SPR response curves as a function of the angle of incidence for (a) Sys3 and (b) Sys4. Figure S6. Sensor response characteristics for Sys3–Sys4 across varying the number of MoS2 (1–6): (a) angular shift, (b) sensitivity gain, (c) attenuation, and (d) FWHM. Table S1. Metrics of the different systems under consideration. Table S2. Metrics of the different systems under consideration by varying the cooper thickness. Table S3. Metrics of the different systems under consideration by varying the silicon nitride thickness. Table S4. Metrics of the different systems under consideration by varying the number of MoS2 layers. Table S5. Metrics of the different optimized systems for different cancer types.

Author Contributions

Conceptualization, T.T. and C.V.G.; methodology, T.T. and D.F.V.L.; software, C.V.G.; validation, T.T., D.F.V.L. and P.E.V.A.; formal analysis, A.M.M.M.; investigation, T.T. and D.F.V.L.; resources, A.M.M.M. and P.E.V.A.; data curation, D.F.V.L.; writing—original draft preparation, T.T.; writing—review and editing, C.V.G.; visualization, P.E.V.A.; supervision, C.V.G.; project administration, T.T.; funding acquisition, T.T. All authors have read and agreed to the published version of the manuscript.

Funding

This work was funded and supported by Universidad Técnica Particular de Loja under grant no. POA_VIN-56.

Institutional Review Board Statement

Not applicable.

Informed Consent Statement

Not applicable.

Data Availability Statement

The original contributions presented in the study are included in the article/Supplementary Materials. Further inquiries can be directed to the corresponding author.

Acknowledgments

C.V.G. wishes to thank Escuela Superior Politécnica de Chimborazo and Decanato de Publicaciones—ESPOCH—for their hospitality during the completion of this work.

Conflicts of Interest

The authors declare no conflicts of interest.

References

  1. Cheng, L.-Y.; Zhao, J.-Q.; Zou, T.-T.; Xu, Z.-H.; Lv, Y. Cervical Cancer Burden and Attributable Risk Factors across Different Age and Regions from 1990 to 2021 and Future Burden Prediction: Results from the Global Burden of Disease Study 2021. Front. Oncol. 2025, 15, 1541452. [Google Scholar] [CrossRef] [PubMed]
  2. Li, T.; Zhang, H.; Lian, M.; He, Q.; Lv, M.; Zhai, L.; Zhou, J.; Wu, K.; Yi, M. Global Status and Attributable Risk Factors of Breast, Cervical, Ovarian, and Uterine Cancers from 1990 to 2021. J. Hematol. Oncol. 2025, 18, 5. [Google Scholar] [CrossRef] [PubMed]
  3. Zhou, L.; Zhong, Y.; Han, L.; Xie, Y.; Wan, M. Global, Regional, and National Trends in the Burden of Melanoma and Non-Melanoma Skin Cancer: Insights from the Global Burden of Disease Study 1990–2021. Sci. Rep. 2025, 15, 5996. [Google Scholar] [CrossRef] [PubMed]
  4. Fatima, S.; Kumar, V.; Kumar, D. Molecular Mechanism of Genetic, Epigenetic, and Metabolic Alteration in Lung Cancer. Med. Oncol. 2025, 42, 61. [Google Scholar] [CrossRef]
  5. Esmaeili, A.; Awasthi, P.; Tabaee, S. Beyond Immortality: Epstein–Barr Virus and the Intricate Dance of Programmed Cell Death in Cancer Development. Cancer Treat. Res. Commun. 2025, 43, 100880. [Google Scholar] [CrossRef]
  6. Piscone, A.; Gorini, F.; Ambrosio, S.; Noviello, A.; Scala, G.; Majello, B.; Amente, S. Targeting the 8-oxodG Base Excision Repair Pathway for Cancer Therapy. Cells 2025, 14, 112. [Google Scholar] [CrossRef]
  7. Xiong, X.; Zheng, L.-W.; Ding, Y.; Chen, Y.-F.; Cai, Y.-W.; Wang, L.-P.; Huang, L.; Liu, C.-C.; Shao, Z.-M.; Yu, K.-D. Breast Cancer: Pathogenesis and Treatments. Signal Transduct. Target. Ther. 2025, 10, 49. [Google Scholar] [CrossRef]
  8. Xu, M.; Cao, C.; Wu, P.; Huang, X.; Ma, D. Advances in Cervical Cancer: Current Insights and Future Directions. Cancer Commun. 2025, 45, 77–109. [Google Scholar] [CrossRef]
  9. Hossain, R.A.; Murshedul, I.M.; Fuad, A.A.M.; Sagline, M.M.; Zihad, M.M.; Nurul, A.M.; Ashiq, M.M.; Peng, L. Overview of Skin Cancer Types and Prevalence Rates across Continents. Cancer Pathog. Ther. 2025, 3, 89–100. [Google Scholar] [CrossRef]
  10. Singh, A.; Hammer, M.M.; Byrne, S.C. Incidentally Detected Adrenal Nodules on Lung Cancer Screening CT. J. Am. Coll. Radiol. 2025, 22, 291–296. [Google Scholar] [CrossRef]
  11. Lue, J.C.; Radisky, D.C. From Embryogenesis to Senescence: The Role of Mammary Gland Physiology in Breast Cancer Risk. Cancers 2025, 17, 787. [Google Scholar] [CrossRef] [PubMed]
  12. Rosko, A.E.; Huang, Y.; Wall, S.A.; Mims, A.; Woyach, J.; Presley, C.; Williams, N.O.; Stevens, E.; Han, C.J.; Von Ah, D.; et al. Predictive Ability of the Cancer and Aging Research Group Chemotherapy Toxicity Calculator in Hematologic Malignancy. J. Geriatr. Oncol. 2025, 16, 102144. [Google Scholar] [CrossRef] [PubMed]
  13. Chow, J.C.L. Nanomaterial-Based Molecular Imaging in Cancer: Advances in Simulation and AI Integration. Biomolecules 2025, 15, 444. [Google Scholar] [CrossRef] [PubMed]
  14. Karthiga, R.; Narasimhan, K.; Raju, N.; Amirtharajan, R. Automatic Approach for Breast Cancer Detection Based on Deep Belief Network Using Histopathology Images. Multimed. Tools Appl. 2025, 84, 4733–4750. [Google Scholar] [CrossRef]
  15. Fadel, E.F.; Tolba, M.E.M.; Ahmed, A.M.; El-Hady, H.A. Serological and Molecular Detection of Toxoplasma gondii among Cancer Patients in Sohag, Upper Egypt: A Case–Control Study. Sci. Rep. 2025, 15, 5236. [Google Scholar] [CrossRef]
  16. Sadr, S.; Rahdar, A.; Pandey, S.; Hajjafari, A.; Soroushianfar, M.; Sepahvand, H.; Sasani, B.; Salimpour Kavasebi, S.; Borji, H. Revolutionizing Cancer Detection: Harnessing Quantum Dots and Graphene-Based Nanobiosensors for Lung and Breast Cancer Diagnosis. BioNanoScience 2024, 15, 111. [Google Scholar] [CrossRef]
  17. Butt, M.A. Surface Plasmon Resonance-Based Biodetection Systems: Principles, Progress and Applications—A Comprehensive Review. Biosensors 2025, 15, 35. [Google Scholar] [CrossRef]
  18. Kamal Eddin, F.B.; Fan, H.; Liu, Z.; Donati, P.; Amin, Y.; Yap, W.F.; Liang, J.; Pompa, P.P.; He, S. Progress in Surface Plasmon and Other Resonance Biosensors for Biomedical Applications. Adv. Mater. Technol. 2025, 2500536. [Google Scholar] [CrossRef]
  19. Sahoo, P.K.; Bhat, A.A.; Singh, M.; Li, K. Recent Advances of Guided Mode Resonant Sensors Applied to Cancer Biomarker Detection. Photonics 2025, 12, 424. [Google Scholar] [CrossRef]
  20. Abul Rub, F.; Moursy, N.; Alhedeithy, N.; Mohamed, J.; Ifthikar, Z.; Elahi, M.A.; Mir, T.A.; Rehman, M.U.; Tariq, S.; Alabudahash, M.; et al. Modern Emerging Biosensing Methodologies for the Early Diagnosis and Screening of Ovarian Cancer. Biosensors 2025, 15, 203. [Google Scholar] [CrossRef]
  21. Sangeetha, P.; Ayyanar, N.; Prabhakar, G.; Rajaram, S. Study Review of Optical Biosensors Based on 2D Materials. Plasmonics 2025. [CrossRef]
  22. Ashrafi, T.M.S.; Mohanty, G. Surface Plasmon Resonance Sensors: A Critical Review of Recent Advances, Market Analysis, and Future Directions. Plasmonics 2025. [CrossRef]
  23. Ebnonnasir, A.; Narayanan, B.; Kodambaka, S.; Ciobanu, C.V. Tunable MoS₂ Bandgap in MoS₂–Graphene Heterostructures. Appl. Phys. Lett. 2014, 105, 031603. [Google Scholar] [CrossRef]
  24. Liu, W.; Lee, B.; Naylor, C.H.; Ee, H.-S.; Park, J.; Johnson, A.T.C.; Agarwal, R. Strong Exciton–Plasmon Coupling in MoS₂ Coupled with Plasmonic Lattice. Nano Lett. 2016, 16, 1262–1269. [Google Scholar] [CrossRef]
  25. Liu, W.; Wang, Y.; Naylor, C.H.; Lee, B.; Zheng, B.; Liu, G.; Johnson, A.T.C.; Pan, A.; Agarwal, R. Understanding the Different Exciton–Plasmon Coupling Regimes in Two-Dimensional Semiconductors Coupled with Plasmonic Lattices: A Combined Experimental and Unified Equation of Motion Approach. ACS Photonics 2018, 5, 192–200. [Google Scholar] [CrossRef]
  26. Lee, J.; Dak, P.; Lee, Y.; Park, H.; Choi, W.; Alam, M.A.; Kim, S. Two-Dimensional Layered MoS₂ Biosensors Enable Highly Sensitive Detection of Biomolecules. Sci. Rep. 2014, 4, 7352. [Google Scholar] [CrossRef]
  27. Sengupta, J.; Hussain, C.M. Cutting-Edge MoS₂-Based Biosensing Platforms for Detecting Contaminants in Food Samples. TrAC Trends Anal. Chem. 2025, 188, 118239. [Google Scholar] [CrossRef]
  28. Ngan, D.T.T.; Thuy, V.T.; Van Tuan, D.; Dien, N.D.; Tam, P.D. MoS₂/Ag Composite-Based Biosensor with Improved Sensitivity and Selectivity for Glucose Detection. J. Electron. Mater. 2025, 54, 3981–3993. [Google Scholar] [CrossRef]
  29. Tene, T.; Bellucci, S.; Vacacela Gomez, C. SPR Biosensor Based on Bilayer MoS₂ for SARS-CoV-2 Sensing. Biosensors 2025, 15, 21. [Google Scholar] [CrossRef]
  30. Xue, J.; Zhang, Y.; Guang, Z.; Hu, J.; Zhao, F.; Liu, Y.; Shao, L. MoS₂ Surface Plasmon Resonance Based High-Resolution THz Biosensor Using a Dual D-Shaped Channel Micro-Structured Fiber. Opt. Laser Technol. 2025, 180, 111387. [Google Scholar] [CrossRef]
  31. Wu, L.; Chu, H.S.; Koh, W.S.; Li, E.P. Highly Sensitive Graphene Biosensors Based on Surface Plasmon Resonance. Opt. Express 2010, 18, 14395–14400. [Google Scholar] [CrossRef] [PubMed]
  32. Tene, T.; Svozilík, J.; Colcha, D.; Cevallos, Y.; Vinueza-Naranjo, P.G.; Vacacela Gomez, C.; Bellucci, S. The Tunable Parameters of Graphene-Based Biosensors. Sensors 2024, 24, 5049. [Google Scholar] [CrossRef] [PubMed]
  33. Tene, T.; Coello-Fiallos, D.; Palacios Robalino, M.L.; Londo, F.; Vacacela Gomez, C. The Effect of MoS₂ and Si₃N₄ in Surface Plasmon Resonance Biosensors for HIV DNA Hybridization Detection: A Numerical Study. Micromachines 2025, 16, 295. [Google Scholar] [CrossRef] [PubMed]
  34. Senapati, S.; Mishra, M.; Sahoo, N.; Tripathy, S.K. Highly Sensitive Nitride-Based SPR Biosensor for Efficient Adrenal Gland/Blood/Breast/Cervical/Skin Cancer Detection. Sens. Bio-Sens. Res. 2024, 45, 100684. [Google Scholar] [CrossRef]
  35. Kumar, A.; Kumar, A.; Srivastava, S.K. Silicon Nitride-BP-Based Surface Plasmon Resonance Highly Sensitive Biosensor for Virus SARS-CoV-2 Detection. Plasmonics 2022, 17, 1065–1077. [Google Scholar] [CrossRef]
  36. Lu, X.; Yu, X.; Zhou, J.; Chang, M.; Lu, D. An Ultra-Wide Range D-Shaped Fiber SPR Sensor with a Nanostructure of Gold–MoS2 and Sodium for the Simultaneous Measurement of Refractive Index and Temperature. Sensors 2025, 25, 377. [Google Scholar] [CrossRef]
  37. Tene, T.; Guevara, M.; Romero, P.; Guapi, A.; Gahramanli, L.; Vacacela Gomez, C. SARS-CoV-2 Detection by Surface Plasmon Resonance Biosensors Based on Graphene-Multilayer Structures. Front. Phys. 2024, 12, 1503400. [Google Scholar] [CrossRef]
  38. Akib, T.B.A.; Rana, M.M.; Mehedi, I.M. Multi-Layer SPR Biosensor for In-Situ Amplified Monitoring of the SARS-CoV-2 Omicron (B.1.1.529) Variant. Biosens. Bioelectron. 2024, 16, 100434. [Google Scholar] [CrossRef]
  39. Nurrohman, D.T.; Chiu, N.-F. Surface Plasmon Resonance Biosensor Performance Analysis on 2D Material Based on Graphene and Transition Metal Dichalcogenides. ECS J. Solid State Sci. Technol. 2020, 9, 115023. [Google Scholar] [CrossRef]
  40. Panda, A.; Pukhrambam, P.D. Modeling of High-Performance SPR Refractive Index Sensor Employing Novel 2D Materials for Detection of Malaria Pathogens. IEEE Trans. NanoBiosci. 2022, 21, 312–319. [Google Scholar] [CrossRef]
  41. Park, Y.-L.; Chen, B.-R.; Wood, R.J. Design and Fabrication of Soft Artificial Skin Using Embedded Microchannels and Liquid Conductors. IEEE Sens. J. 2012, 12, 2711–2718. [Google Scholar] [CrossRef]
  42. Tene, T.; Tubon-Usca, G.; Tixi Gallegos, K.; Mendoza Salazar, M.J.; Vacacela Gomez, C. MoS₂-Based Biosensor for SARS-CoV-2 Detection: A Numerical Approach. Front. Nanotechnol. 2024, 6, 1505751. [Google Scholar] [CrossRef]
  43. Huang, Y.-H.; Chen, Y.-H.; Darius, E.; Shi, H.-F.; Yeh, C.-H.; Hsu, J.-Y.; Liu, K.-K. Two-Dimensional MoS₂ Field-Effect Biosensor for Highly Sensitive Detection of Cardiac Troponin I. ACS Appl. Mater. Interfaces 2025, 17, 30740–30746. [Google Scholar] [CrossRef] [PubMed]
  44. Crowson, A.N. Basal Cell Carcinoma: Biology, Morphology and Clinical Implications. Mod. Pathol. 2006, 19 (Suppl. 2), S127–S147. [Google Scholar] [CrossRef] [PubMed]
  45. Zhao, Y.; Yao, R.; Ouyang, L.; Ding, H.; Zhang, T.; Zhang, K.; Cheng, S.; Sun, W. Three-Dimensional Printing of HeLa Cells for Cervical Tumor Model In Vitro. Biofabrication 2014, 6, 035001. [Google Scholar] [CrossRef] [PubMed]
  46. Gascoyne, P.R.C.; Wang, X.-B.; Huang, Y.; Becker, F.F. Dielectrophoretic Separation of Cancer Cells from Blood. IEEE Trans. Ind. Appl. 1997, 33, 670–678. [Google Scholar] [CrossRef]
  47. Jockenhövel, F.; Hoermann, R.; Mann, K. Tumors of the Adrenals. Onkologie 1995, 18, 317–323. [Google Scholar] [CrossRef]
  48. Russo, J.; Hu, Y.-F.; Yang, X.; Russo, I.H. Chapter 1: Developmental, Cellular, and Molecular Basis of Human Breast Cancer. J. Natl. Cancer Inst. Monogr. 2000, 2000, 17–37. [Google Scholar] [CrossRef]
  49. Gee, M.S.; Upadhyay, R.; Bergquist, H.; Alencar, H.; Reynolds, F.; Maricevich, M.; Weissleder, R.; Josephson, L.; Mahmood, U. Human Breast Cancer Tumor Models: Molecular Imaging of Drug Susceptibility and Dosing during HER2/neu-Targeted Therapy. Radiology 2008, 248, 925–935. [Google Scholar] [CrossRef]
  50. Karki, B.; Sarkar, P.; Dhiman, G.; Srivastava, G.; Kumar, M. Platinum Diselenide and Graphene-Based Refractive Index Sensor for Cancer Detection. Plasmonics 2024, 19, 953–962. [Google Scholar] [CrossRef]
  51. Tene, T.; Arias, F.A.; Guamán-Lozada, D.F.; Guadalupe Alcoser, M.A.; Gahramanli, L.; Vacacela Gomez, C.; Bellucci, S. Advanced SPR-Based Biosensors for Potential Use in Cancer Detection: A Theoretical Approach. Sensors 2025, 25, 2685. [Google Scholar] [CrossRef]
  52. Schranghamer, T.F.; Sharma, M.; Singh, R.; Das, S. Review and comparison of layer transfer methods for two-dimensional materials for emerging applications. Chem. Soc. Rev. 2021, 50, 11032–11054. [Google Scholar] [CrossRef]
  53. Sakthinathan, S.; Meenakshi, G.A.; Vinothini, S.; Yu, C.L.; Chen, C.L.; Chiu, T.W.; Vittayakorn, N. A Review of Thin-Film Growth, Properties, Applications, and Future Prospects. Processes 2025, 13, 587. [Google Scholar] [CrossRef]
  54. Sindona, A.; Pisarra, M.; Bellucci, S.; Tene, T.; Guevara, M.; Vacacela Gomez, C. Plasmon oscillations in two-dimensional arrays of ultranarrow graphene nanoribbons. Phys. Rev. B 2019, 100, 235422. [Google Scholar] [CrossRef]
  55. Ryou, J.; Kim, Y.S.; Kc, S.; Cho, K. Monolayer MoS2 bandgap modulation by dielectric environments and tunable bandgap transistors. Sci. Rep. 2016, 6, 29184. [Google Scholar] [CrossRef] [PubMed]
  56. Khakbaz, P.; Waldhoer, D.; Bahrami, M.; Knobloch, T.; Pourfath, M.; Davoudi, M.R.; Zhang, Y.; Gao, X.; Peng, H.; Waltl, M. Two-dimensional Bi2SeO2 and Its Native Insulators for Next-Generation Nanoelectronics. ACS Nano 2025, 19, 9788–9800. [Google Scholar] [CrossRef]
  57. Agrawal, A.V.; Kumar, R.; Yang, G.; Bao, J.; Kumar, M.; Kumar, M. Enhanced adsorption sites in monolayer MoS2 pyramid structures for highly sensitive and fast hydrogen sensor. Int. J. Hydrogen Energy 2020, 45, 9268–9277. [Google Scholar] [CrossRef]
Figure 1. (a) Simulated SPR reflectance profiles versus incidence angle; (b) sensitivity improvement compared to the baseline configuration (Sys0); (c) resonance angle shift due to cancer-associated refractive index change; (d) reflectance attenuation at resonance; and (e) FWHM for each system evaluated.
Sci 07 00076 g001
Figure 2. SPR curves as a function of the angle of incidence before/after cancer diagnosis: (a) Sys1, (b) Sys2, (c) Sys4, and (d) Sys3.
Sci 07 00076 g002
Figure 3. Sensor response characteristics for optimized Sys1–Sys4 across varying cancer types: (a) angular shift, (b) sensitivity gain, (c) attenuation, and (d) FWHM.
Sci 07 00076 g003
Figure 4. Sensor metrics of the optimized Sys1–Sys4 when detecting different cancer types: (a) sensitivity to refractive index change, (b) DA, (c) QF, (e) FoM, (f) LoD, and (g) CSF.
Sci 07 00076 g004
Table 1. Configurations considered in the current work.
Sys No.CodeFull NameNick Name
0Sys0Prism/Copper/PBSP/Cu/PBS
1Sys1Prism/Copper/Cancer SampleP/Cu/MCancer
2Sys2Prism/Copper/Si3N4P/Cu/SN/MCancer
3Sys3Prism/Copper/Si3N4/Molybdenum disulfide/Cancer Sample P/Cu/SN/MoS2/MCancer
4Sys4Prism/Copper/Molybdenum disulfide/Si3N4/Cancer SampleP/Cu/MoS2/SN/MCancer
Table 2. Initial parameters.
MaterialRefractive IndexThickness (nm)Refs.
BK-7 (P)1.5151---[37]
Copper (Cu)0.0369 + 4.5393i45.0[38]
Si3N4 (SN)2.03945.00[35]
Molybdenum disulfide (MoS2)5.0805 + 1.1723i0.65[39,40,41]
PBS (M)1.335---[34]
Cancer Sample ( n )1.349---[34]
Table 3. Optimized parameters of the different systems.
MaterialRefractive Index (RI)Thickness (nm)
Sys1
BK7 (P)1.5151---
Cu0.0369 + 4.539355.0
Sys2
BK7 (P)1.5151---
Cu0.0369 + 4.539355.0
Si3N4 (SN)2.03947.0
Sys3
BK7 (P)1.5151---
Cu0.056253 + 4.276045.0
Si3N4 (SN)2.03947.0
Molybdenum disulfide (MoS2)5.0805 + 1.1723 i0.65 * L (L = 2)
Sys4
BK7 (P)1.5151---
Cu0.0369 + 4.539345.0
Molybdenum disulfide (MoS2)5.0805 + 1.1723 i0.65 * L (L = 3)
Si3N4 (SN)2.03947.0
Table 4. Refractive index values for the different cancer types [44,45,46,47,48,49]. The values of RI are reported before (normal) and after the presence of cancer, and other important aspects are reported.
Cancer TypeCell LineRefractive Index (Normal)Refractive Index (Cancerous)Reported Concentration/RatioSpecificity/Detection Method Description
Breast Cancer (Type 1)MDA-MB-2311.3681.39780% cancer cellsSPR detection based on refractive index modulation induced by MDA-MB-231 morphology; label-free physical interaction
Breast Cancer (Type 2)MCF-71.3681.40180% cancer cellsSPR response enhanced by multilayer design; detects RI shift induced by MCF-7 cell optical profile
Cervical CancerHeLa1.3681.39280% cancer cellsSPR configuration using Si3N4; monitors HeLa cell-induced RI variations without surface binding agents
Skin CancerBasal cells1.3681.38280% cancer cellsSPR reflectance profile adjusted to identify basal-cell-induced RI changes in a non-functionalized setting
Adrenal CancerPC-121.3681.38580% cancer cellsSPR simulation of RI shift due to PC-12 cell morphology; detection through physical adsorption effects only
Blood CancerJurkat/JM1.3681.38980% cancer cellsDetection via RI perturbation from Jurkat/JM cells; no biochemical tags or functionalization involved
Table 5. Numerical values of sensor metrics for the optimized SPR biosensors for different cancer types.
Cancer Type S   ( ° / R I U )DA QF (RIU−1)FoM (RIU−1)LoD (10−5)CSF
Sys1
Skin 136.7503.791189.560187.3763.656181.93
Cervical 148.1254.399183.328181.7123.375175.48
Blood 151.4292.676191.165189.3733.301182.98
Adrenal 158.7502.667190.569189.0623.149182.44
Breast T1 165.3572.663190.250189.0043.023182.25
Breast T2 169.1072.664190.316189.2112.956182.39
Sys2
Skin 182.0002.984149.216148.8102.747144.92
Cervical 212.5003.510146.277146.2142.352141.72
Blood 221.0712.203157.428157.4252.261152.68
Adrenal 245.8932.238159.916159.4832.033154.46
Breast T1 273.7502.272162.305160.3241.826155.09
Breast T2 291.9642.287163.384159.6531.712154.33
Sys3
Skin 207.7500.55627.80827.7572.40625.77
Cervical 239.7920.74731.16329.1492.08526.06
Blood 252.3210.46132.95431.6111.98128.45
Adrenal 254.6430.45932.85128.7991.96325.39
Breast T1 221.9640.39528.28321.0352.25217.96
Breast T2 190.7140.33624.06015.8622.62113.19
Sys4
Skin 225.1250.54127.08225.3712.22023.44
Cervical 196.6670.56223.43915.7822.54213.45
Blood 195.1790.32623.34017.2442.56115.00
Adrenal 123.9290.20414.6308.3384.0346.81
Breast T1 56.9640.0926.5712.8988.7772.18
Breast T2 26.6070.0423.0191.16318.7910.82
Table 6. Comparison with state-of-the-art biosensor records.
Configuration S   ( ° / R I U ) Refs.
BK7-Ag-PtSe2-Adrenal212.85[50]
BK7-Au-Ag-Si3N4-Cervical341.00[34]
BK7-Ag-Si3N4-BP-Adrenal390.35[51]
BK7-Ag-Si3N4-BP-Cervical294.27[51]
BK7-Cu-Si3N4-MoS2-Adrenal 254.64This work
BK7-Cu-MoS2-Si3N4-Cervical196.67This work
Disclaimer/Publisher’s Note: The statements, opinions and data contained in all publications are solely those of the individual author(s) and contributor(s) and not of MDPI and/or the editor(s). MDPI and/or the editor(s) disclaim responsibility for any injury to people or property resulting from any ideas, methods, instructions or products referred to in the content.

