1. Introduction
A highly complex mixture of smoke contained in fire effluents comprises the invisible vapor phase and the visible soot phase. At Earth gravity, the concentrations of unburnt gases, including soot, in a buoyancy-controlled fire seem independent of the pyrolysis size [
1,
2,
3,
4,
5]. Luminous radiation becomes significant for a buoyancy-controlled fire with a size greater than 40 cm [
1]. A buoyancy-induced pool-like fire in under-ventilated conditions shields the fuel surface from a substantial portion of the flame radiation due to a soot-laden relatively cold layer or pyrolysis gas [
4]. The heat that transfers to the unburnt fuel is significant from the hot combustion gases such as H
2O, CO
2 and smoke, with temperatures reaching 1000–1200 °C [
6]. Simpler models via emissions factors have been developed to consider the toxic emissions from burnt condensed fuel in a buoyancy-controlled wildfire [
3]. The CO concentration of free-burning fires at Earth gravity is essentially independent of HRR, with a peak of about 5% [
7]. Compared to a laminar flame, a buoyancy-controlled turbulent fire produces less toxic species due to a shorter residence time under conditions of sufficiently high temperatures [
7].
Fire safety, including toxic substances, in an orbiting spacecraft is an important concern. Nominal ambient conditions range from 40% to 21% oxygen, and the air circulation speed is lower than 0.3 m/s due to an HVAC system. In an oxygen-deficient, high-temperature environment such as closed-space fires, a dense smoke containing carbon monoxide, soot and other toxic emissions produces a rapidly lethal atmosphere. This is the main threat to the spacecraft crew’s survivability, because the majority of fire fatalities occur not due to an excessive thermal assault but due to smoke incapacitation. By using a selected gas burner in microgravity, the influence of fuel mixture, oxygen concentration and pressure level on heat flux, flame oscillation and radiative fraction has been widely reported [
8,
9,
10]. With the suppression of buoyancy, in a very mild flow field, the flame strength and growth over a condensed fuel surface are controlled by radiative exchanges excluding soot emission [
11,
12,
13,
14,
15,
16,
17]. The solid flame is quenched at a very low external flow speed [
11,
12,
13,
14,
15] due to a significant radiation loss. Any feedback between ion-driven convection and combustion behavior can be captured thanks to a comprehensive simulation under the influence of an externally applied electric field in zero gravity [
18].
When gravitational forces become miniscule, the scenario considered involves laminar boundary-layer flames due to the absence of natural convection, regardless of its geometrical scale [
11]. A challenge to the predictive methodology is the enormous complexity of the coupled phenomena of toxic species composition and fire growth, which are fundamentally controlled by transient chemical kinetic processes. Heptane and dodecane are designed to simulate some liquids such as mineral oil, synthetics, etc., which could originate from various pieces of machinery in spacecraft. Various soot models are implemented in an existing numerical framework, known as FDS6.7 [
19]. The novelty of this work lays in an investigation of the key phenomena affecting fire yields of major toxic species in favor of evaluating a risk of flame acceleration over a liquid surface under weightless conditions. Due to insurmountable difficulties, only the soot volume fraction and flame shape were determined, thanks to a few pieces of compact measurement apparatus while an airplane flew parabolic trajectories, because a slow velocity flow in microgravity cannot be realized on Earth.
In this work,
Section 2,
Section 3 and
Section 4 describe the numerical models, the model evaluation from an ethylene microgravity flame and the results from the heptane or dodecane diffusion flames, respectively. This is followed by
Section 5, with discussions on the risk of flame acceleration due to an accumulation of unburnt fuel inside the boundary layer that exceeds the Lower Flammability Limit. This work is finished with some major findings in
Section 6. It is discovered that in zero gravity, flame development over a liquid surface has a much greater tendency to emit CO, unburnt hydrocarbons and soot with an increase in oxidizer flow speed or oxygen fraction. This is contrasted to microgravity flames with a fixed gas fuel supply rate [
20,
21], where an inverse dependence of toxic gases’ production on the mainstream flow velocity is observed.
3. Model Evaluation from an Ethylene Flame
The experimental set-up [
20,
21], as schematized in
Figure 1, was used to study flame behavior in microgravity during 10 s with the help of an airplane flying parabolic trajectories. A soot volume fraction higher than 3.8 ppm was measured in a restricting zone of 0.5 cm in thickness and 12 cm in length with the help of an LII (Laser-Induced Incandescence) technique [
20,
21]. The accuracy of the measurement methodology on soot emission for a microgravity ethylene flame is discussed in previous work [
20,
21]. The experimental flame images were recorded with a Canon digital camera through a glazed window.
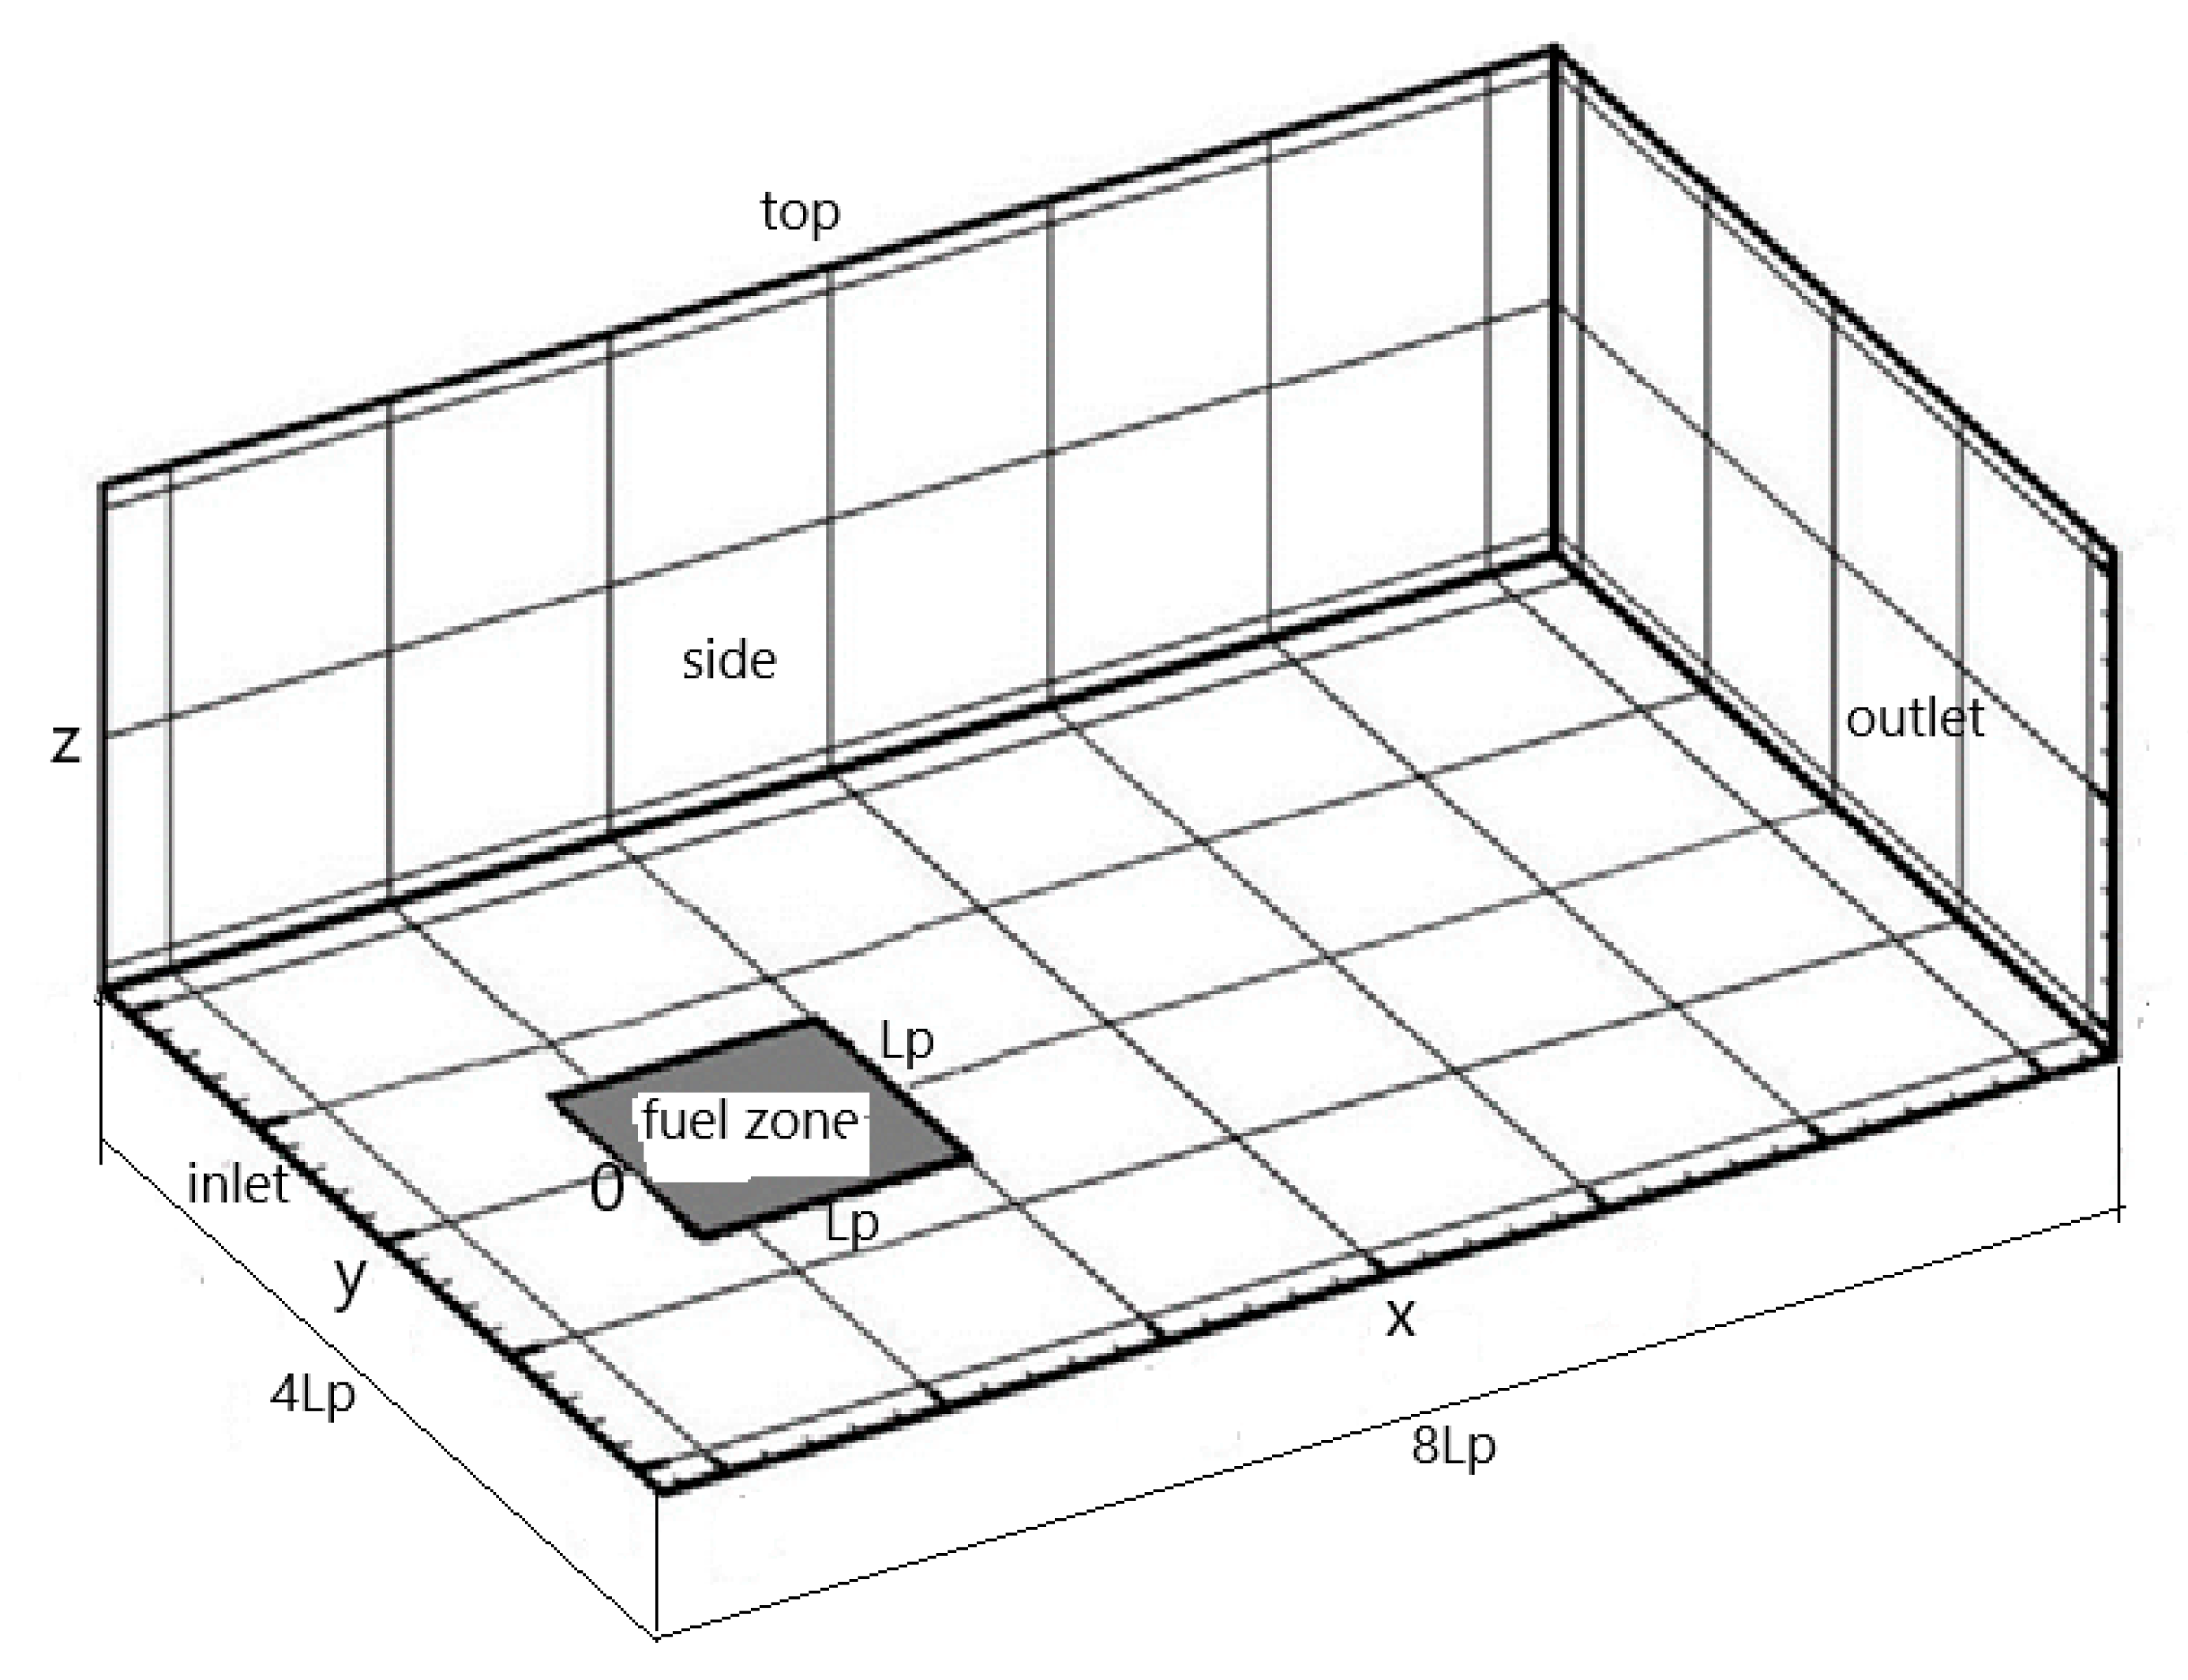
The coordinate system in the numerical simulation is indicated in
Figure 1, and the choice of a computational domain of 4 L
p in width and 8 L
p in length is based on previous studies [
29,
30]. A highly compressed grid system with an excessive domain extension could produce a numerical error over the course of a calculation [
19]. Free slip conditions are assumed for the velocity at the two sides and the top. Zero gradient conditions at the outlet of the domain are applied. An oxygen concentration of Y
o = 0.35 and a uniform velocity of U
o = 0.2 m/s are prescribed at the inlet of x/L
p = −1. A square porous burner with a size of L
p = 5 cm and a gas fuel supply rate of 5 g/m
2s is embedded at the bottom (z = 0) with an entrance length of L
p. An initial temperature of 300 K is assumed for both the fuel and the air streams. The mesh system has been described in our previous publication [
29,
30]. For a physical time of 10 s, 150 CPU hours are required, with a mesh size of 2 mm, by using 20 parallel processors of a Linux cluster. A deviation of about 5% is observed [
30] for the temperature peak by reducing the grid size from 2 to 1 mm; however, the computational time increases to 150 × 2
4 CPU hours.
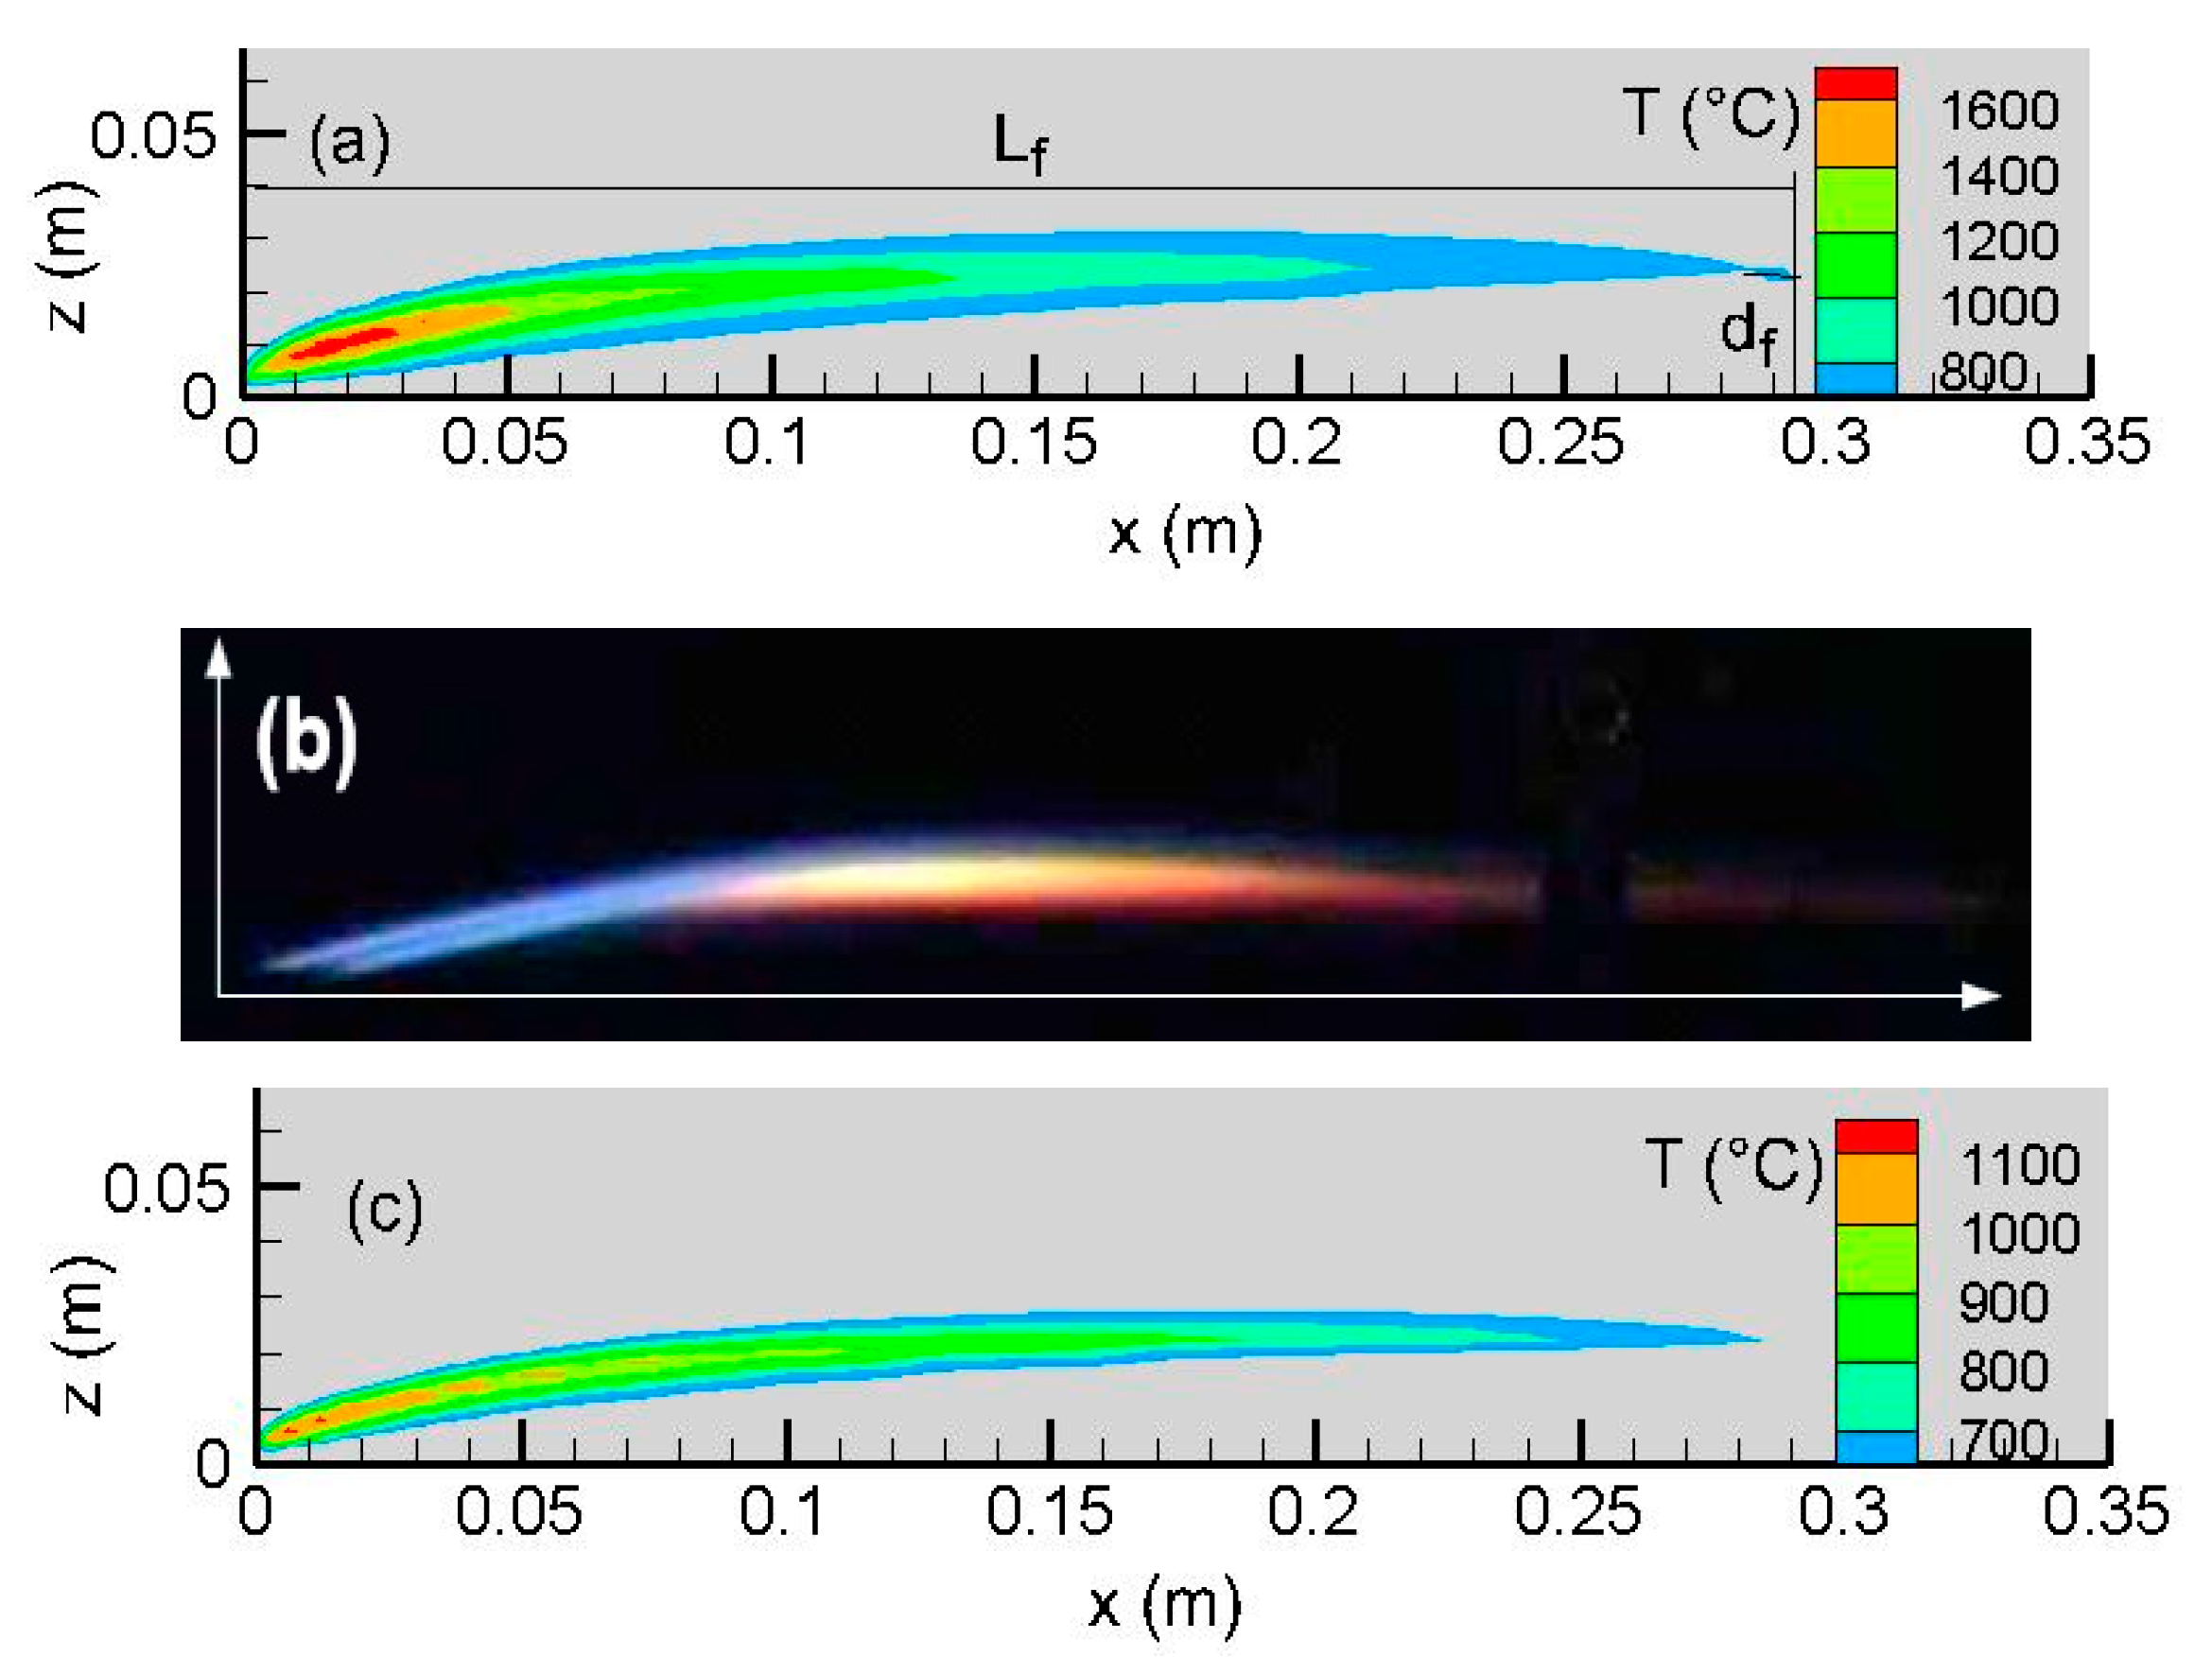
In the absence of natural convection at microgravity, a boundary-layer diffusion flame is established over the fuel surface. As illustrated in
Figure 2, the predicted flame length, L
f, corresponds to the furthest forward (x) location of the isotherm 600 °C and the flame standoff distance, d
f, to the distance of the flame tip from the fuel surface. As shown in the experimental flame image (cf.
Figure 2b), soot glowing is represented by the yellow color as opposed to blue, which is exposed directly to the leading edge with a weak soot emission. The interaction between soot and radiative heat loss becomes the primary factor affecting the transition between a blue region with an elevated temperature and a yellow sooty area with a low temperature. As compared to the experiment (cf.
Figure 2b), a discrepancy with the Moss model [
24] (cf.
Figure 2c) is observed through the entire flame, and an over-estimation of soot emission near the leading edge region greatly enhances radiative heat loss from the flame with a lower temperature of 1100 °C. A low soot trend from the LSP model [
25] at the leading edge tends to increase the peak temperature to 1600 °C. The visible flame significantly exceeds the chemical reaction sheet (cf.
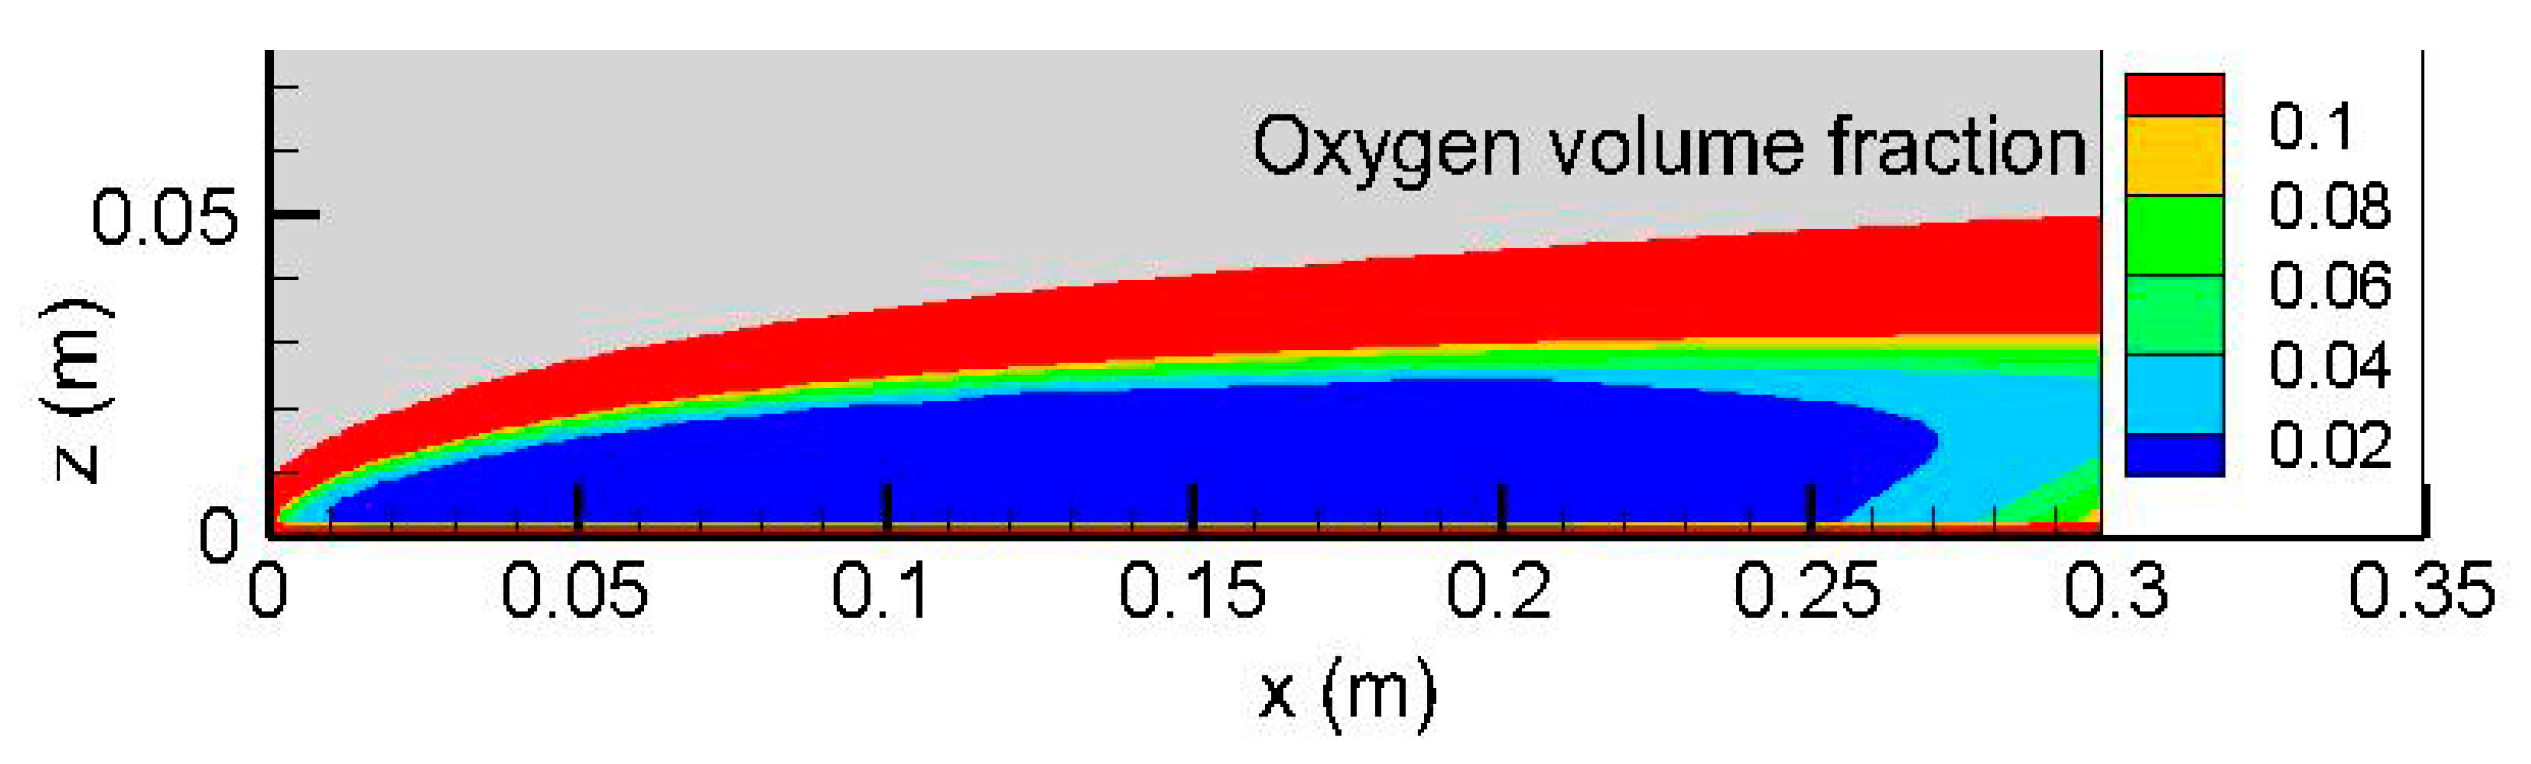
Figure 3) in length and thickness due to the diffusion of heat and mass. The oxygen leakage through a low-strain diffusion flame is typically 2% (cf.
Figure 4), and the detached flame drifts away further downstream.
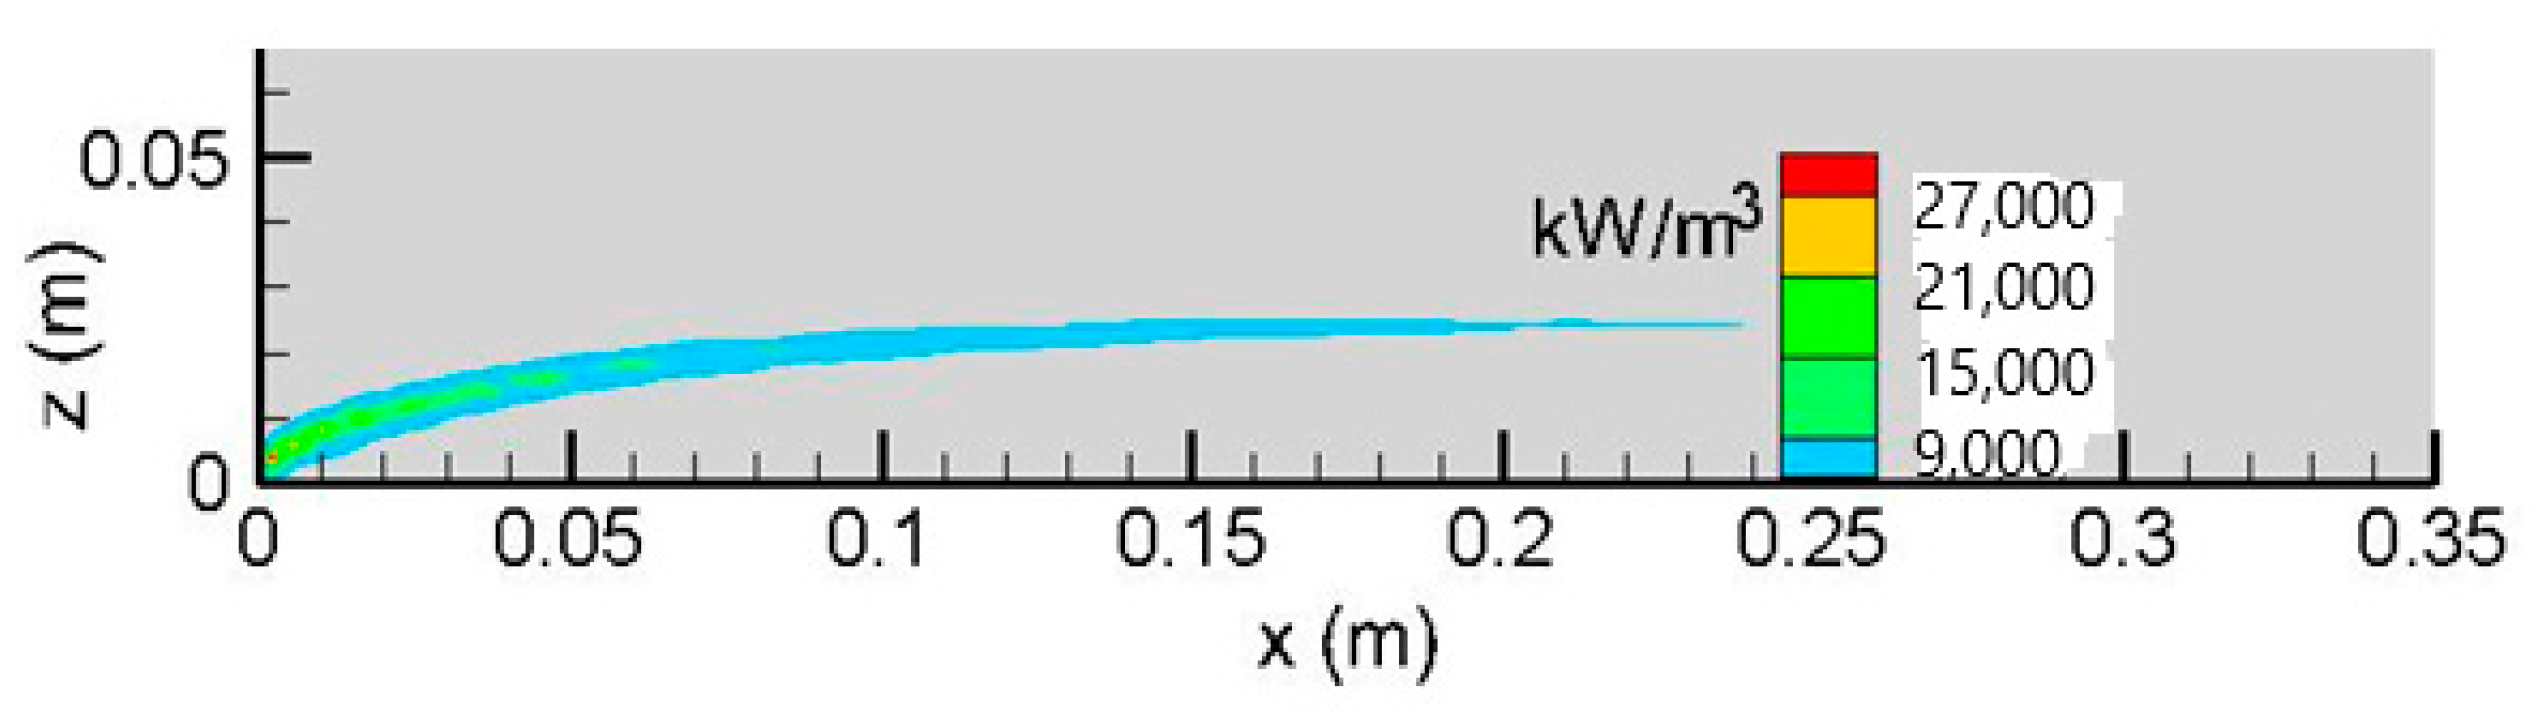
Iso-contours of the HRR per unit volume calculated from Equations (3) and (4) and oxygen concentration on the symmetrical plane (x, z) are illustrated in
Figure 3 and
Figure 4. The flame sheet corresponds to the location of the HRR with an elevated temperature level. As shown in
Figure 4, due to a lack of oxygen in the reactive boundary layer, excessive fuel is burned close to an area of freestream. The flame sheet is significantly lifted above the fuel surface downstream of the leading edge, and the angle of the dividing line between the oxidizer and the fuel-rich zones is roughly 30°. The reaction rate appears to be approximately proportional to the fuel depletion, with a decreasing trend downstream.
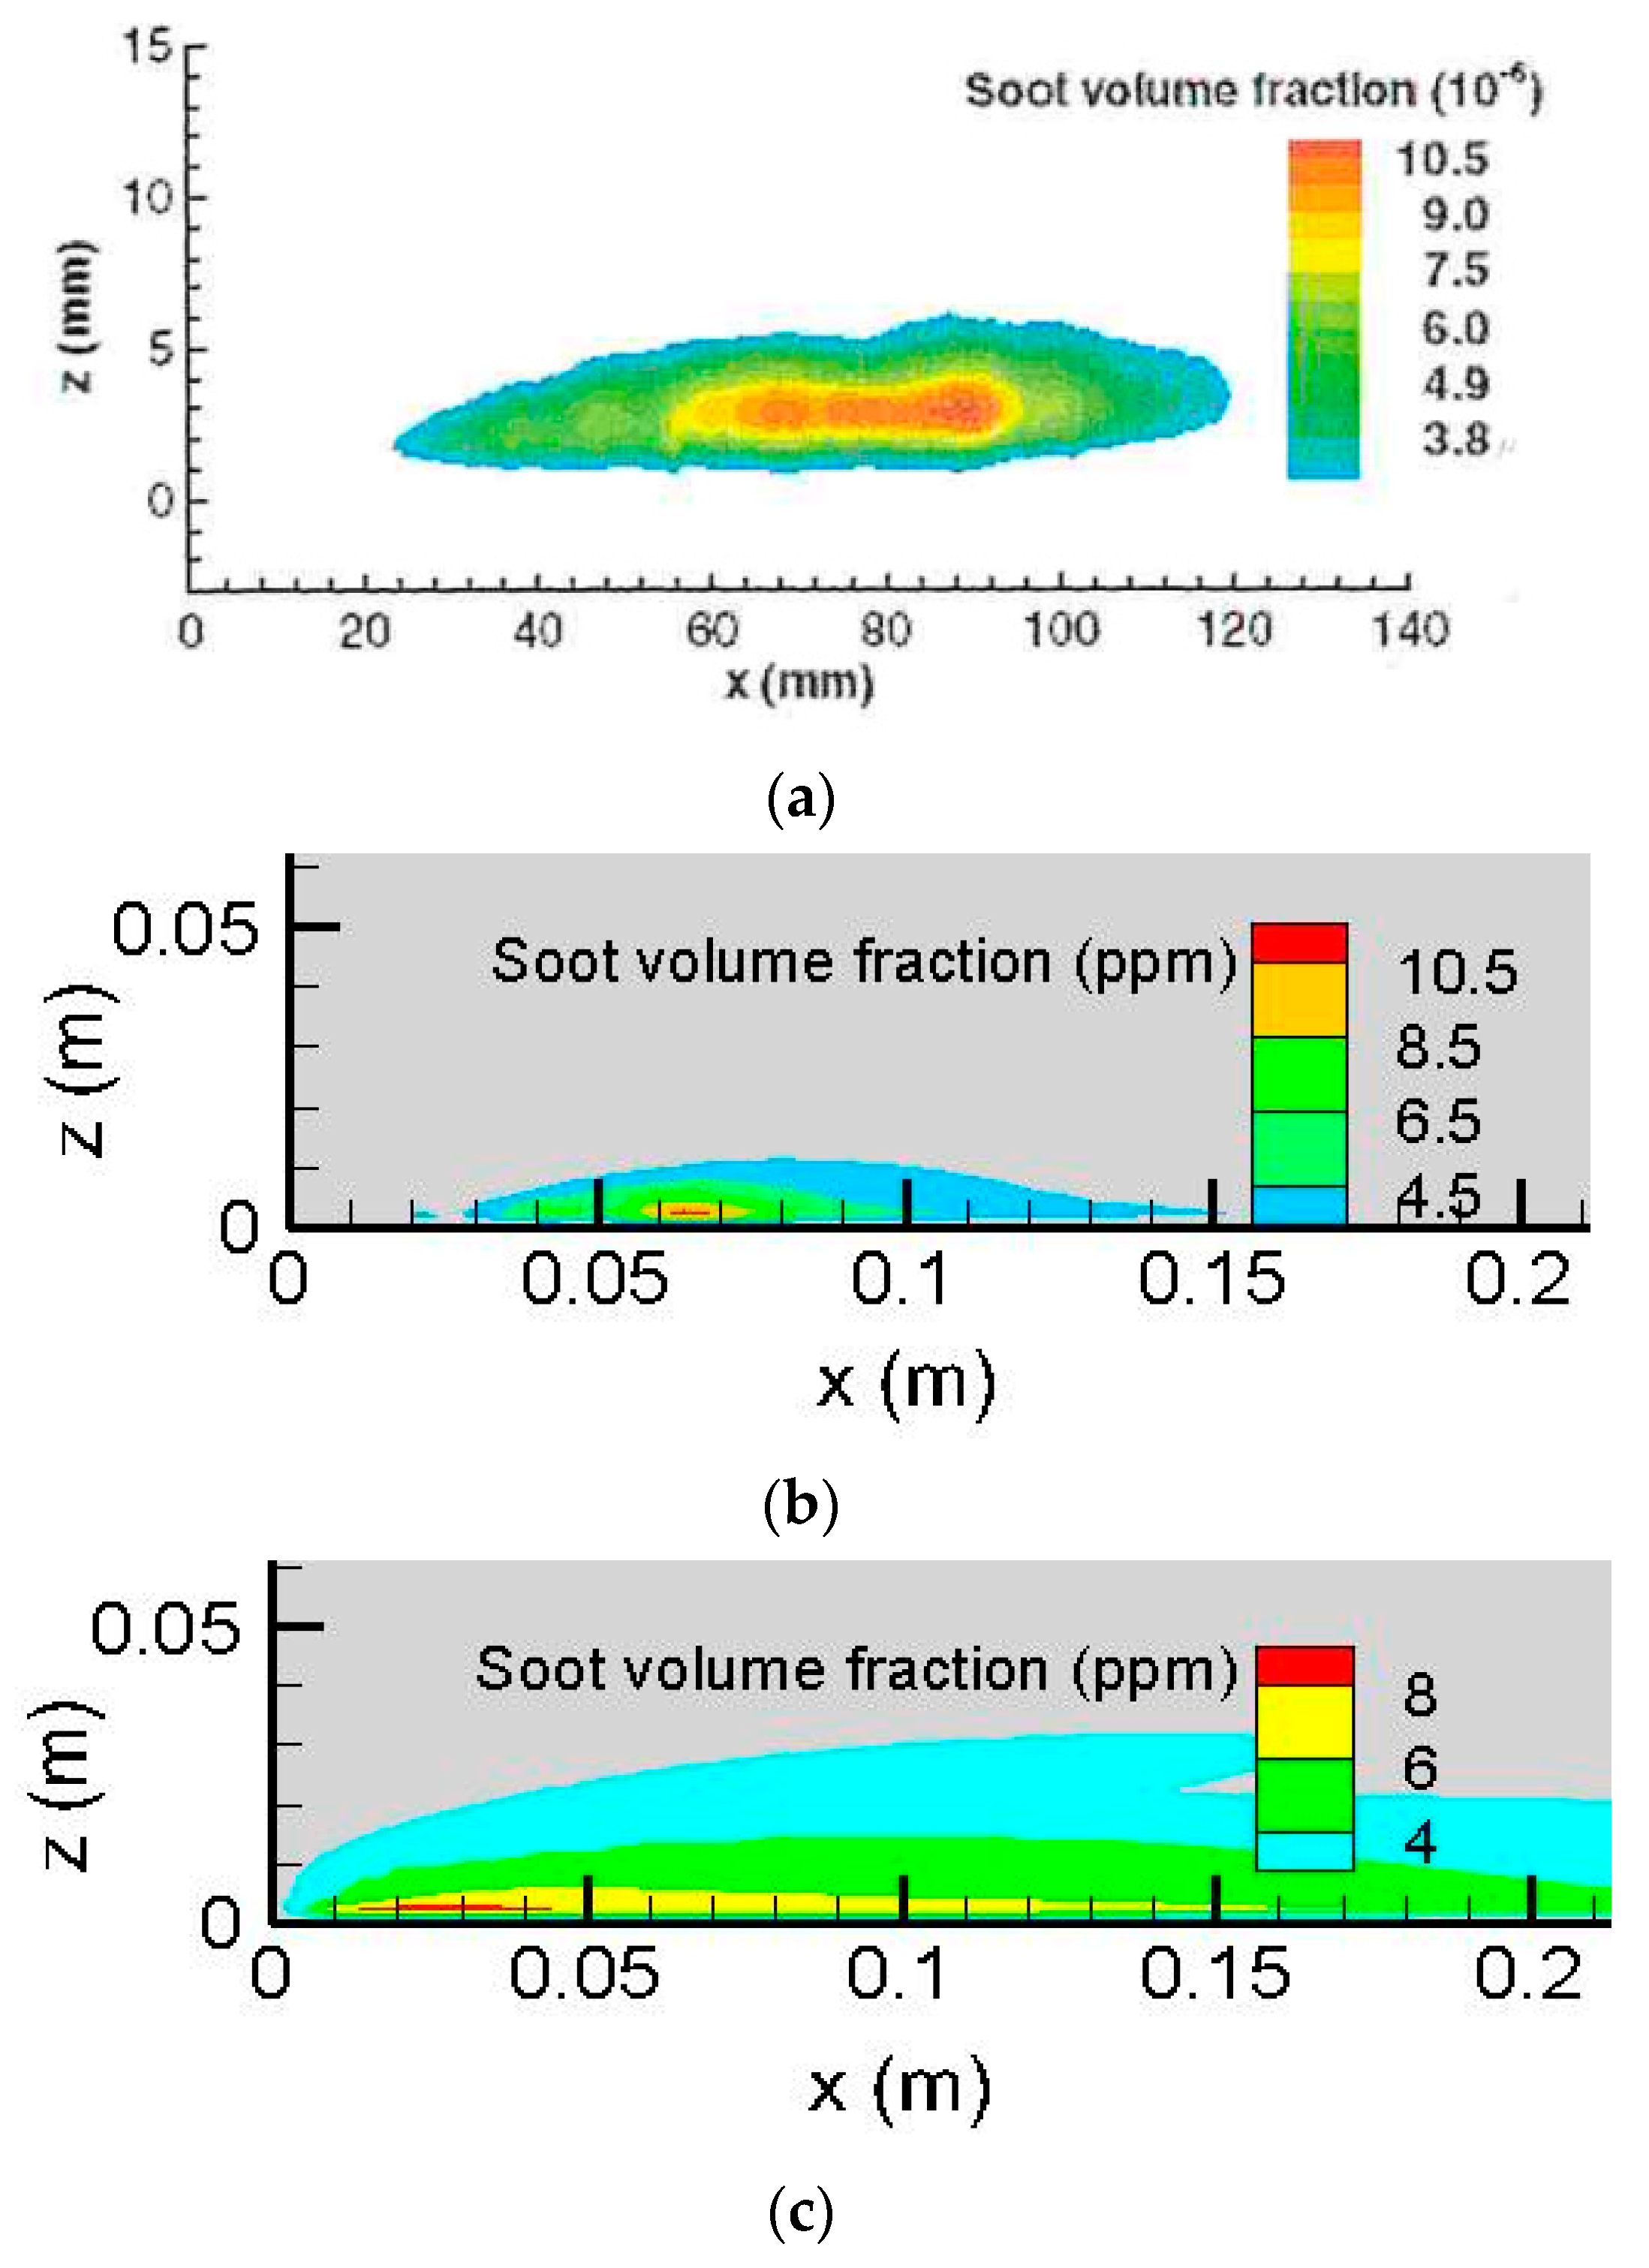
Iso-contours of the computed soot volume fraction at Y
o = 0.35 on the symmetrical plane (x, z) are qualitatively compared to the measured one in
Figure 5a,c with different scales. This allows one to discuss in more detail the soot model’s accuracy and any potential shortcomings in terms of the thickness and length of the soot layer. Quantitative comparisons between experimental measurements and the predicted soot formation from the LSP model are presented in previous work [
30].
It seems that the LSP model [
25] (cf.
Figure 5b) reproduces correctly the experimental trend of soot emission, with a peak of 11.5 ppm. However, in the post-combustion region outside the flame sheet, the computation from the LSP model over-predicts the soot’s thickness in the boundary layer by a factor of one time. The Moss model [
24] (cf.
Figure 5c) over-predicts by a factor of four times the measured value near the leading edge (x < 20 mm). The predicted zone from the Moss model [
24], where the soot volume fraction is higher than 3.8 ppm, significantly exceeds the measured one in length by a factor of about one time. The predicted soot emission thickness from the Moss model is more than the measurement by a factor of five times in the boundary layer. This may be attributed to the potential changes in experimental conditions, e.g., the cleanliness of the window for the laser beam [
20,
21]. The potential sources of these discrepancies might originate from the dominant mechanism for soot burnout by OH and O radicals [
20,
21] in the post-flame region. Since a two-step chemistry model does not allow one to take into account elementary reactions, including OH and O radicals, a simple calibration of the soot empirical parameter to match the measured results is insufficient. A relatively good prediction of both the soot’s formation and the flame shape is obtained from the LSP model [
25], allowing a proper calculation of the radiation heat contribution over a surface of condensed fuels. Thus, the LSP model [
25] is chosen in this work for calculating the mass pyrolysis rates of the liquid fuels in
Section 4.
4. Results on Heptane and Dodecane Flames
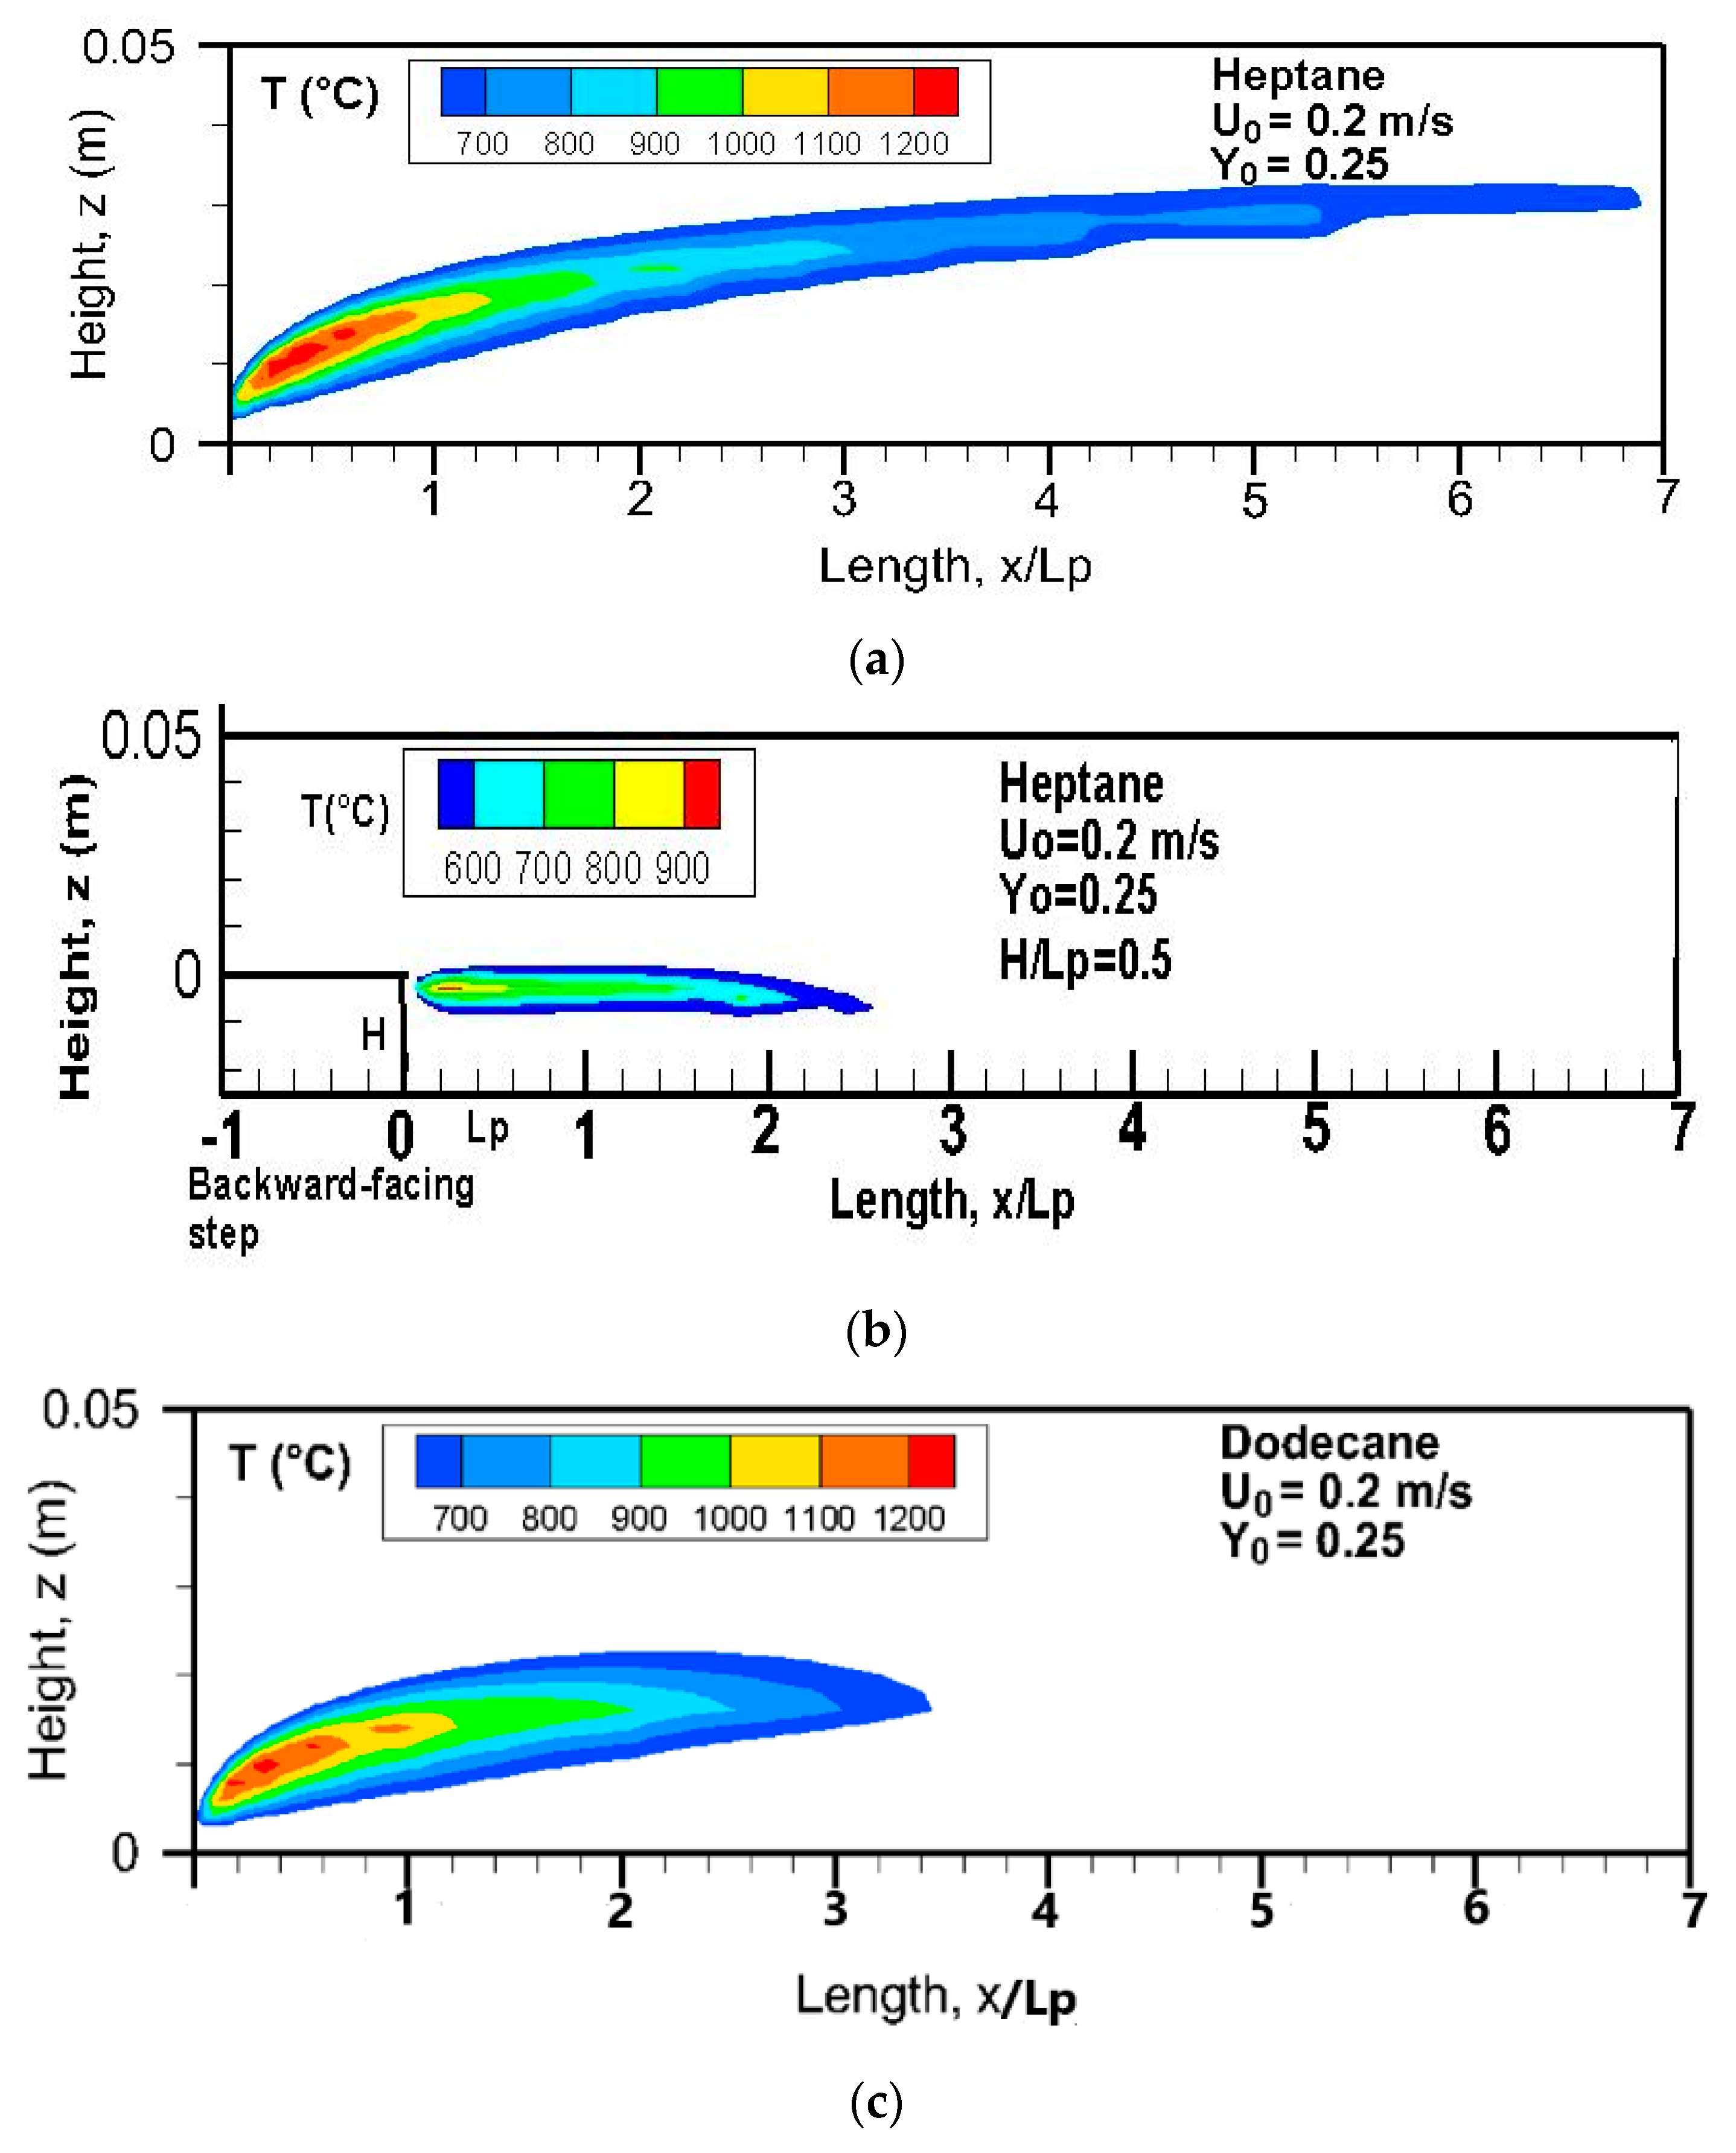
Figure 6a illustrates the visible diffusion flame over a flat heptane surface at Y
o = 0.25. There exists a short blue flame zone with a length of about 2 cm near the leading edge and a long trailing bright-yellow flame due to soot radiation, typical of hydrocarbon diffusion flame. The flame base is attached to the leading edge and moves away from the burning surface with a long tail inside a smooth boundary layer. A stable type of flame from a pool of liquid fuel behind an obstruction in an airflow can be also encountered in the inhabited quarters of orbiting spacecraft. The length of a non-premixed heptane flame is significantly reduced behind a backward-facing step in a crossflow, as shown in
Figure 6b. The oxygen is prevented from penetrating the pyrolysis zone, and thus the zone behind a backward-facing step is filled mostly with the fuel and products. It is inferred that the flame luminance becomes less intense, with a flame temperature below 900 °C. Compared to the heptane flame with a boiling point of 98 °C, dodecane flame (cf.
Figure 6c) with a high boiling point of 216 °C contributes to a reduction of 73% in flame length. In general, over a flat burning surface, an increase in crossflow velocity induces a lengthening of the flame. However, the flame length behind a backward-facing step is practically insensitive to the oxidizer flow velocity, with a constant standoff distance.
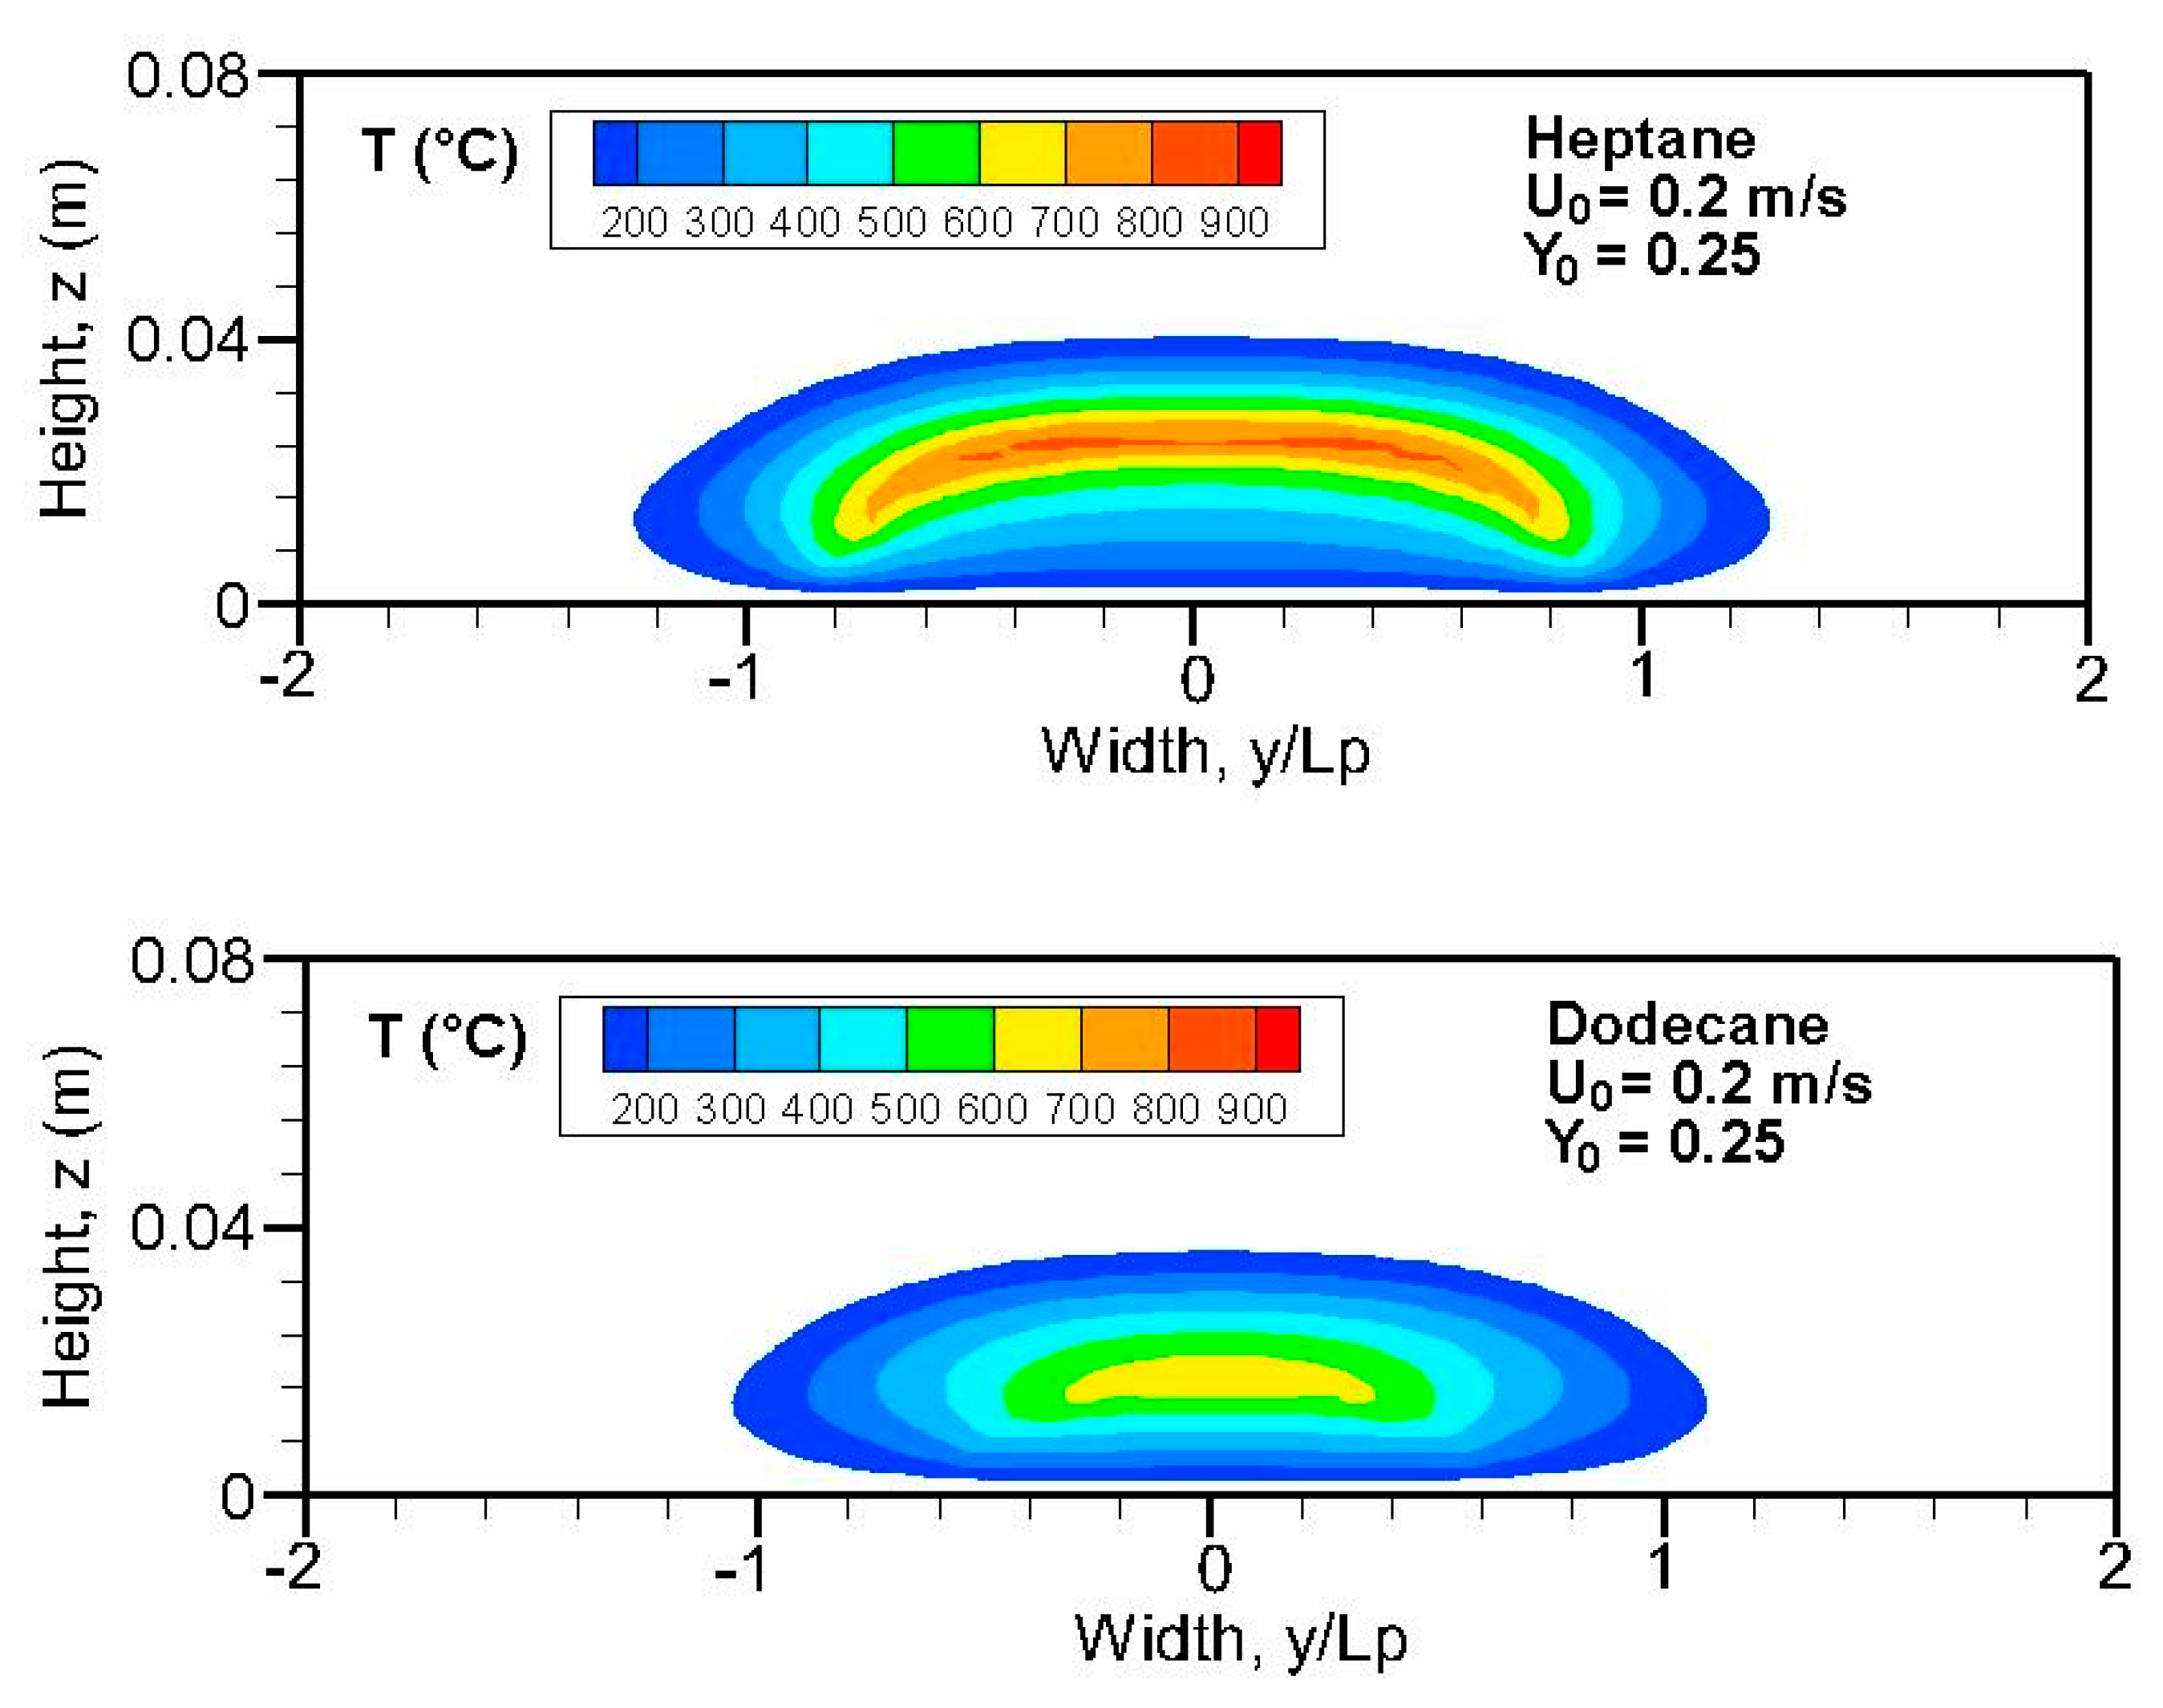
Figure 7 shows iso-contours of the computed temperature above 100 °C for the heptane and dodecane flames in the cross-stream section at the axial position of x/L
p = 2. The higher temperature region of heptane flame exceeds the pyrolysis zone (0.5 < y/L
p < 0.5) due to diffusion of both heat and mass. It is found that a wider and more luminous flame takes place in the fuel-rich zone, and the size of the high-temperature region of dodecane flame in the cross-stream plane is significantly reduced in comparison with that of heptane flame. In absence of natural convection, an increase in oxidizer flow velocity and oxygen concentration allows the sustaining of a large intensive combustion zone with a high temperature. It is noted that radiative heat feedback to the pyrolysis surface is associated with the extension of the flame zone in the cross-stream section. The pyrolysis rate of heptane flame (cf.
Figure 8a) increases rapidly thanks to the wider extent of the high-temperature region in the cross-stream plane, which enhances radiation heat exchanges and, as a consequence, the emitted unburnt volatiles.
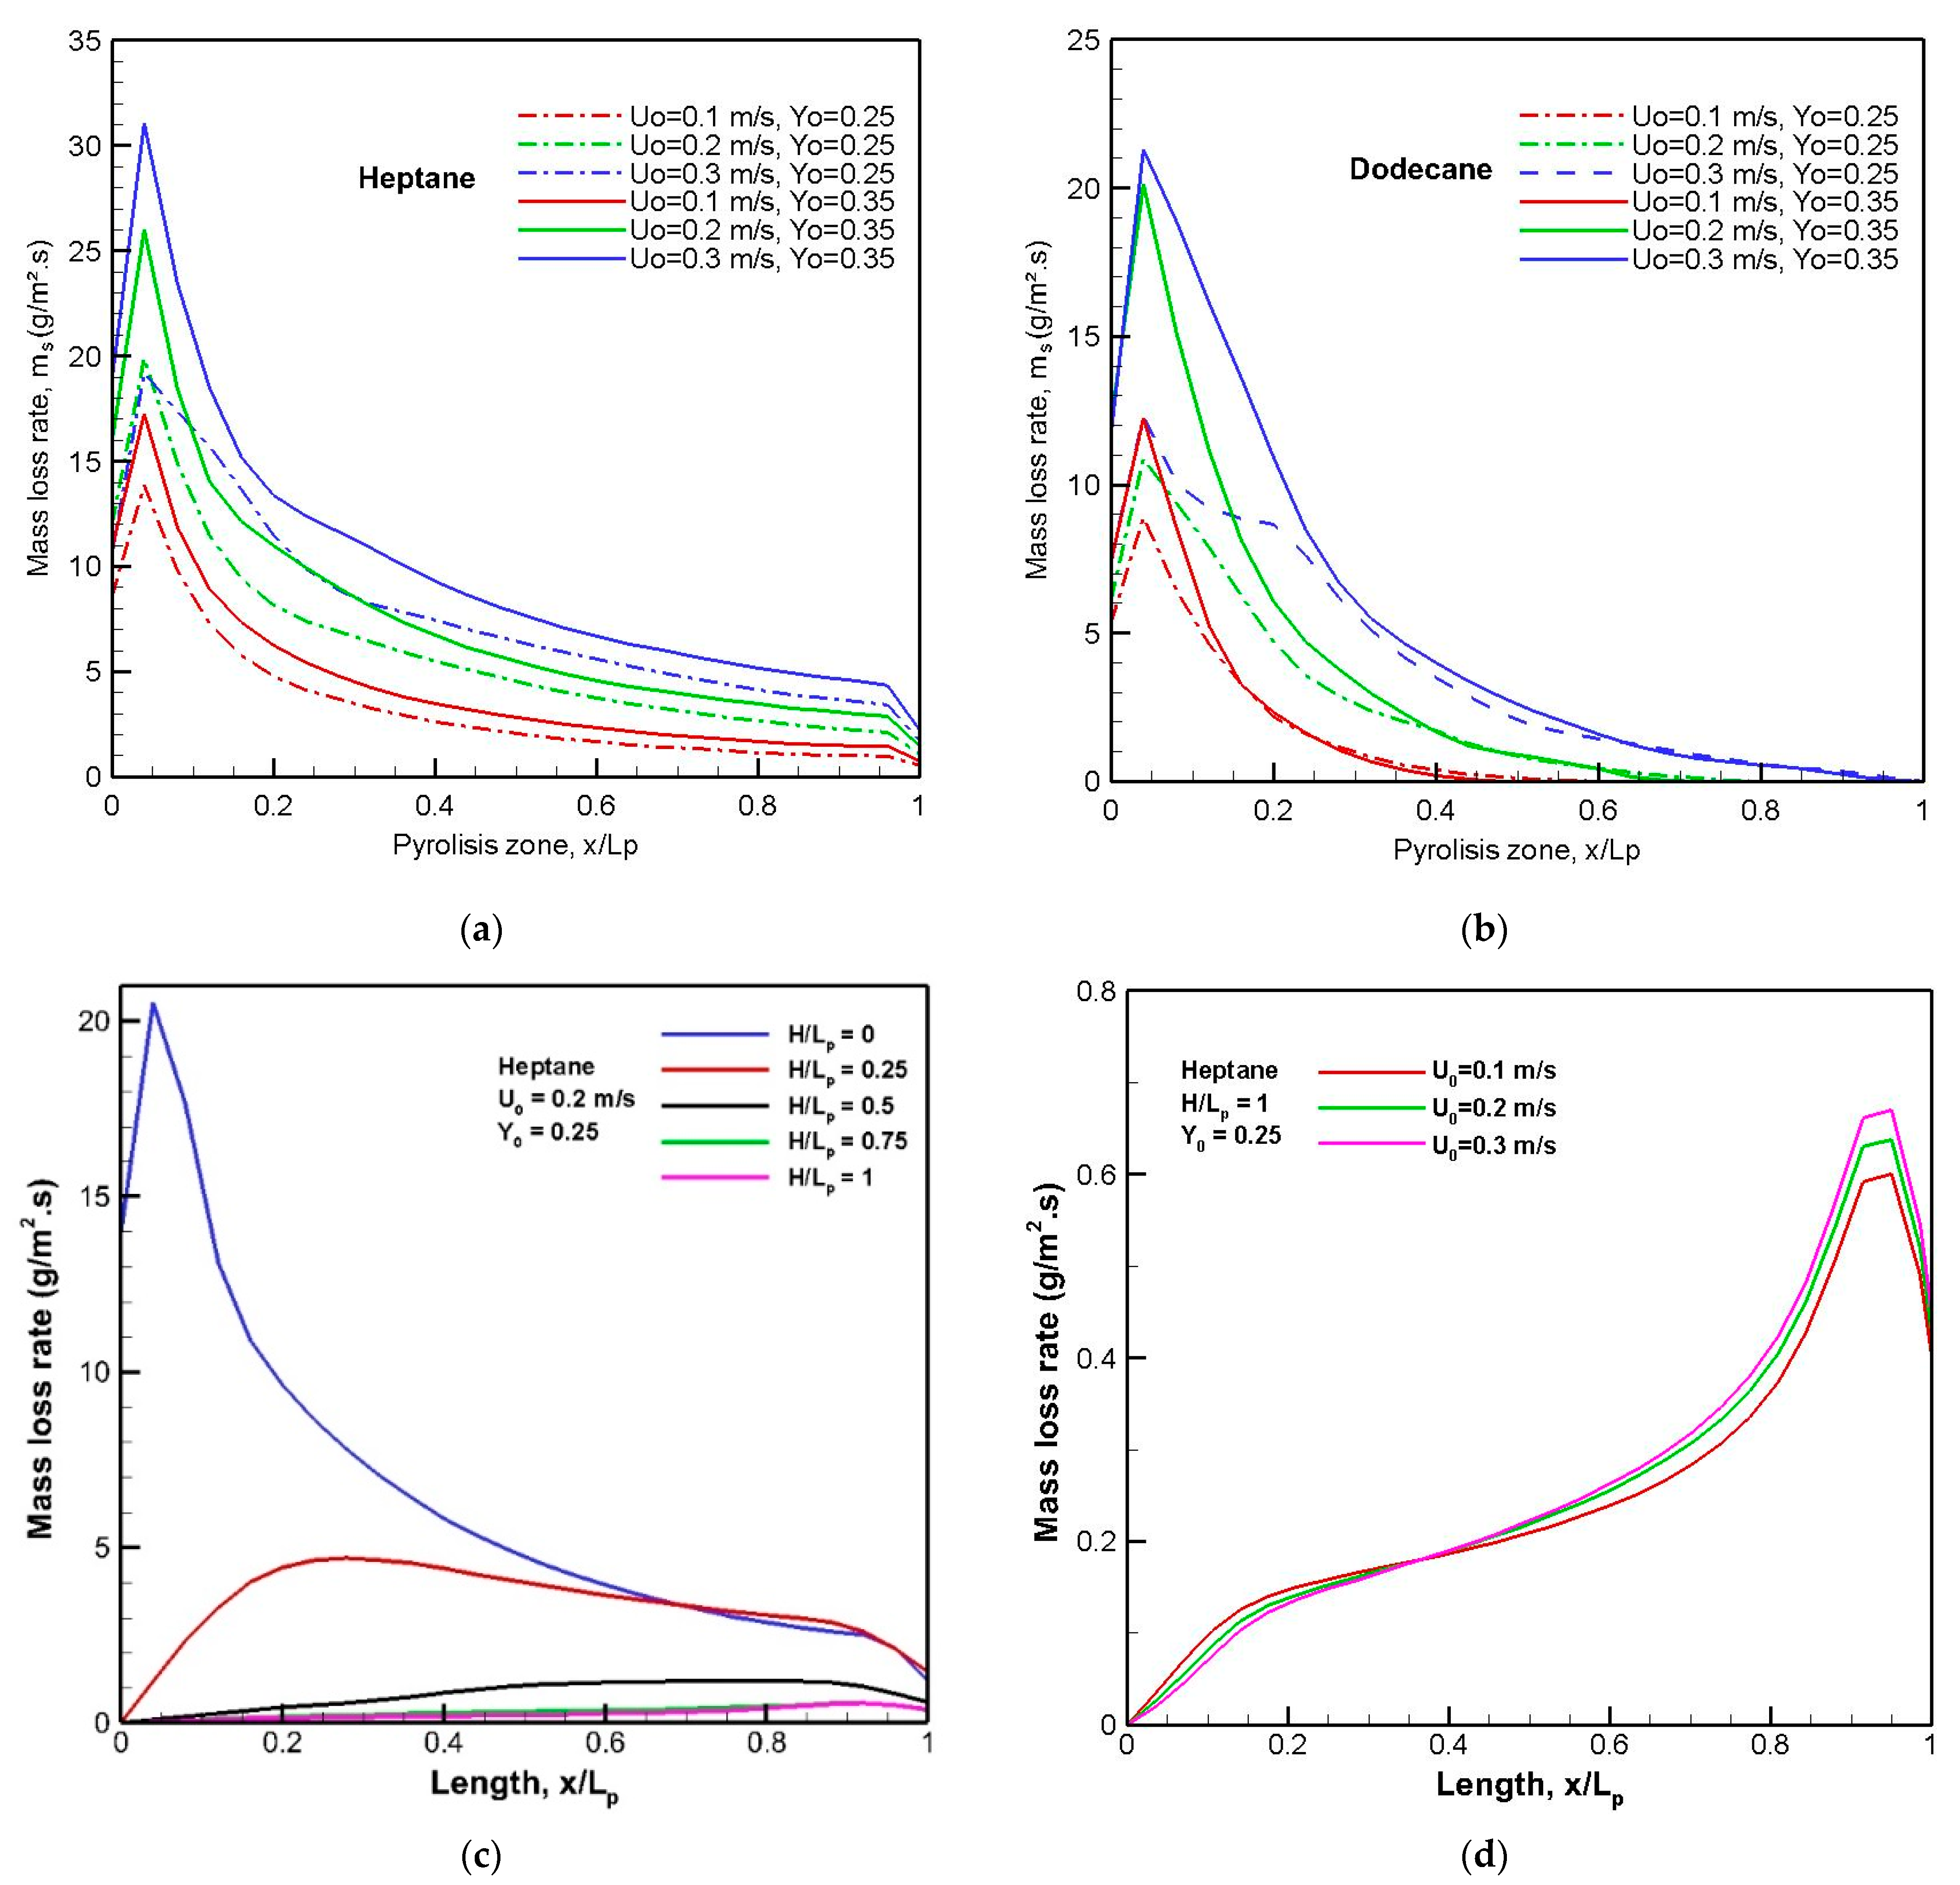
Over a flat liquid surface, the pyrolysis rate at a steady mode, as presented in
Figure 8a,b, exhibits a peak near the leading edge, to which a luminous flame is attached (cf.
Figure 6a,c). The pyrolysis rate (cf.
Figure 8a,b) decreases sharply downstream of the trailing edge due to a reduction in both the flame’s thickness and the temperature level. The peak of the burning rate augments to about 40% with a rise in oxygen concentration from 0.25 to 0.35. An increase in cross-flow velocity tends to enhance the heat exchanges and, consequently, the pyrolysis rate. The mass loss rate is sensitively affected by the fuel type via its boiling point, and the peak of the pyrolysis rate of heptane increases about 40% in comparison with that of dodecane. Moreover, a dodecane flame allows the propagation of the pyrolysis front to be sustained only over a reduced liquid area with x/L
p < 0.8. The zone behind the obstruction provides rather under-ventilated conditions, to reduce the flame length (cf.
Figure 6b), and, consequently, the pyrolysis rate due to weak radiation heat flux over the liquid surface. The effects of the blockage ratio, H/L
p, on the pyrolysis rate from the step-stabilized heptane flame are shown in
Figure 8c,d at various oxidizer flow velocities. As the step height increases, the pyrolysis rate decreases by a factor ranging from 5 to 20 times, because the flame base in the shear layer moves away from the condensed fuel surface (cf.
Figure 6b). The effect of oxidizer flow velocity for a given step height of H/L
p = 1 on the pyrolysis rate is weak, because the burning rate near the leading edge is controlled by convection heat flux, which tends to zero behind an obstruction. It can be seen that fire over a flat heptane burning surface is a greatly feared hazard with a large release of unburnt gases, which are described in the following section.
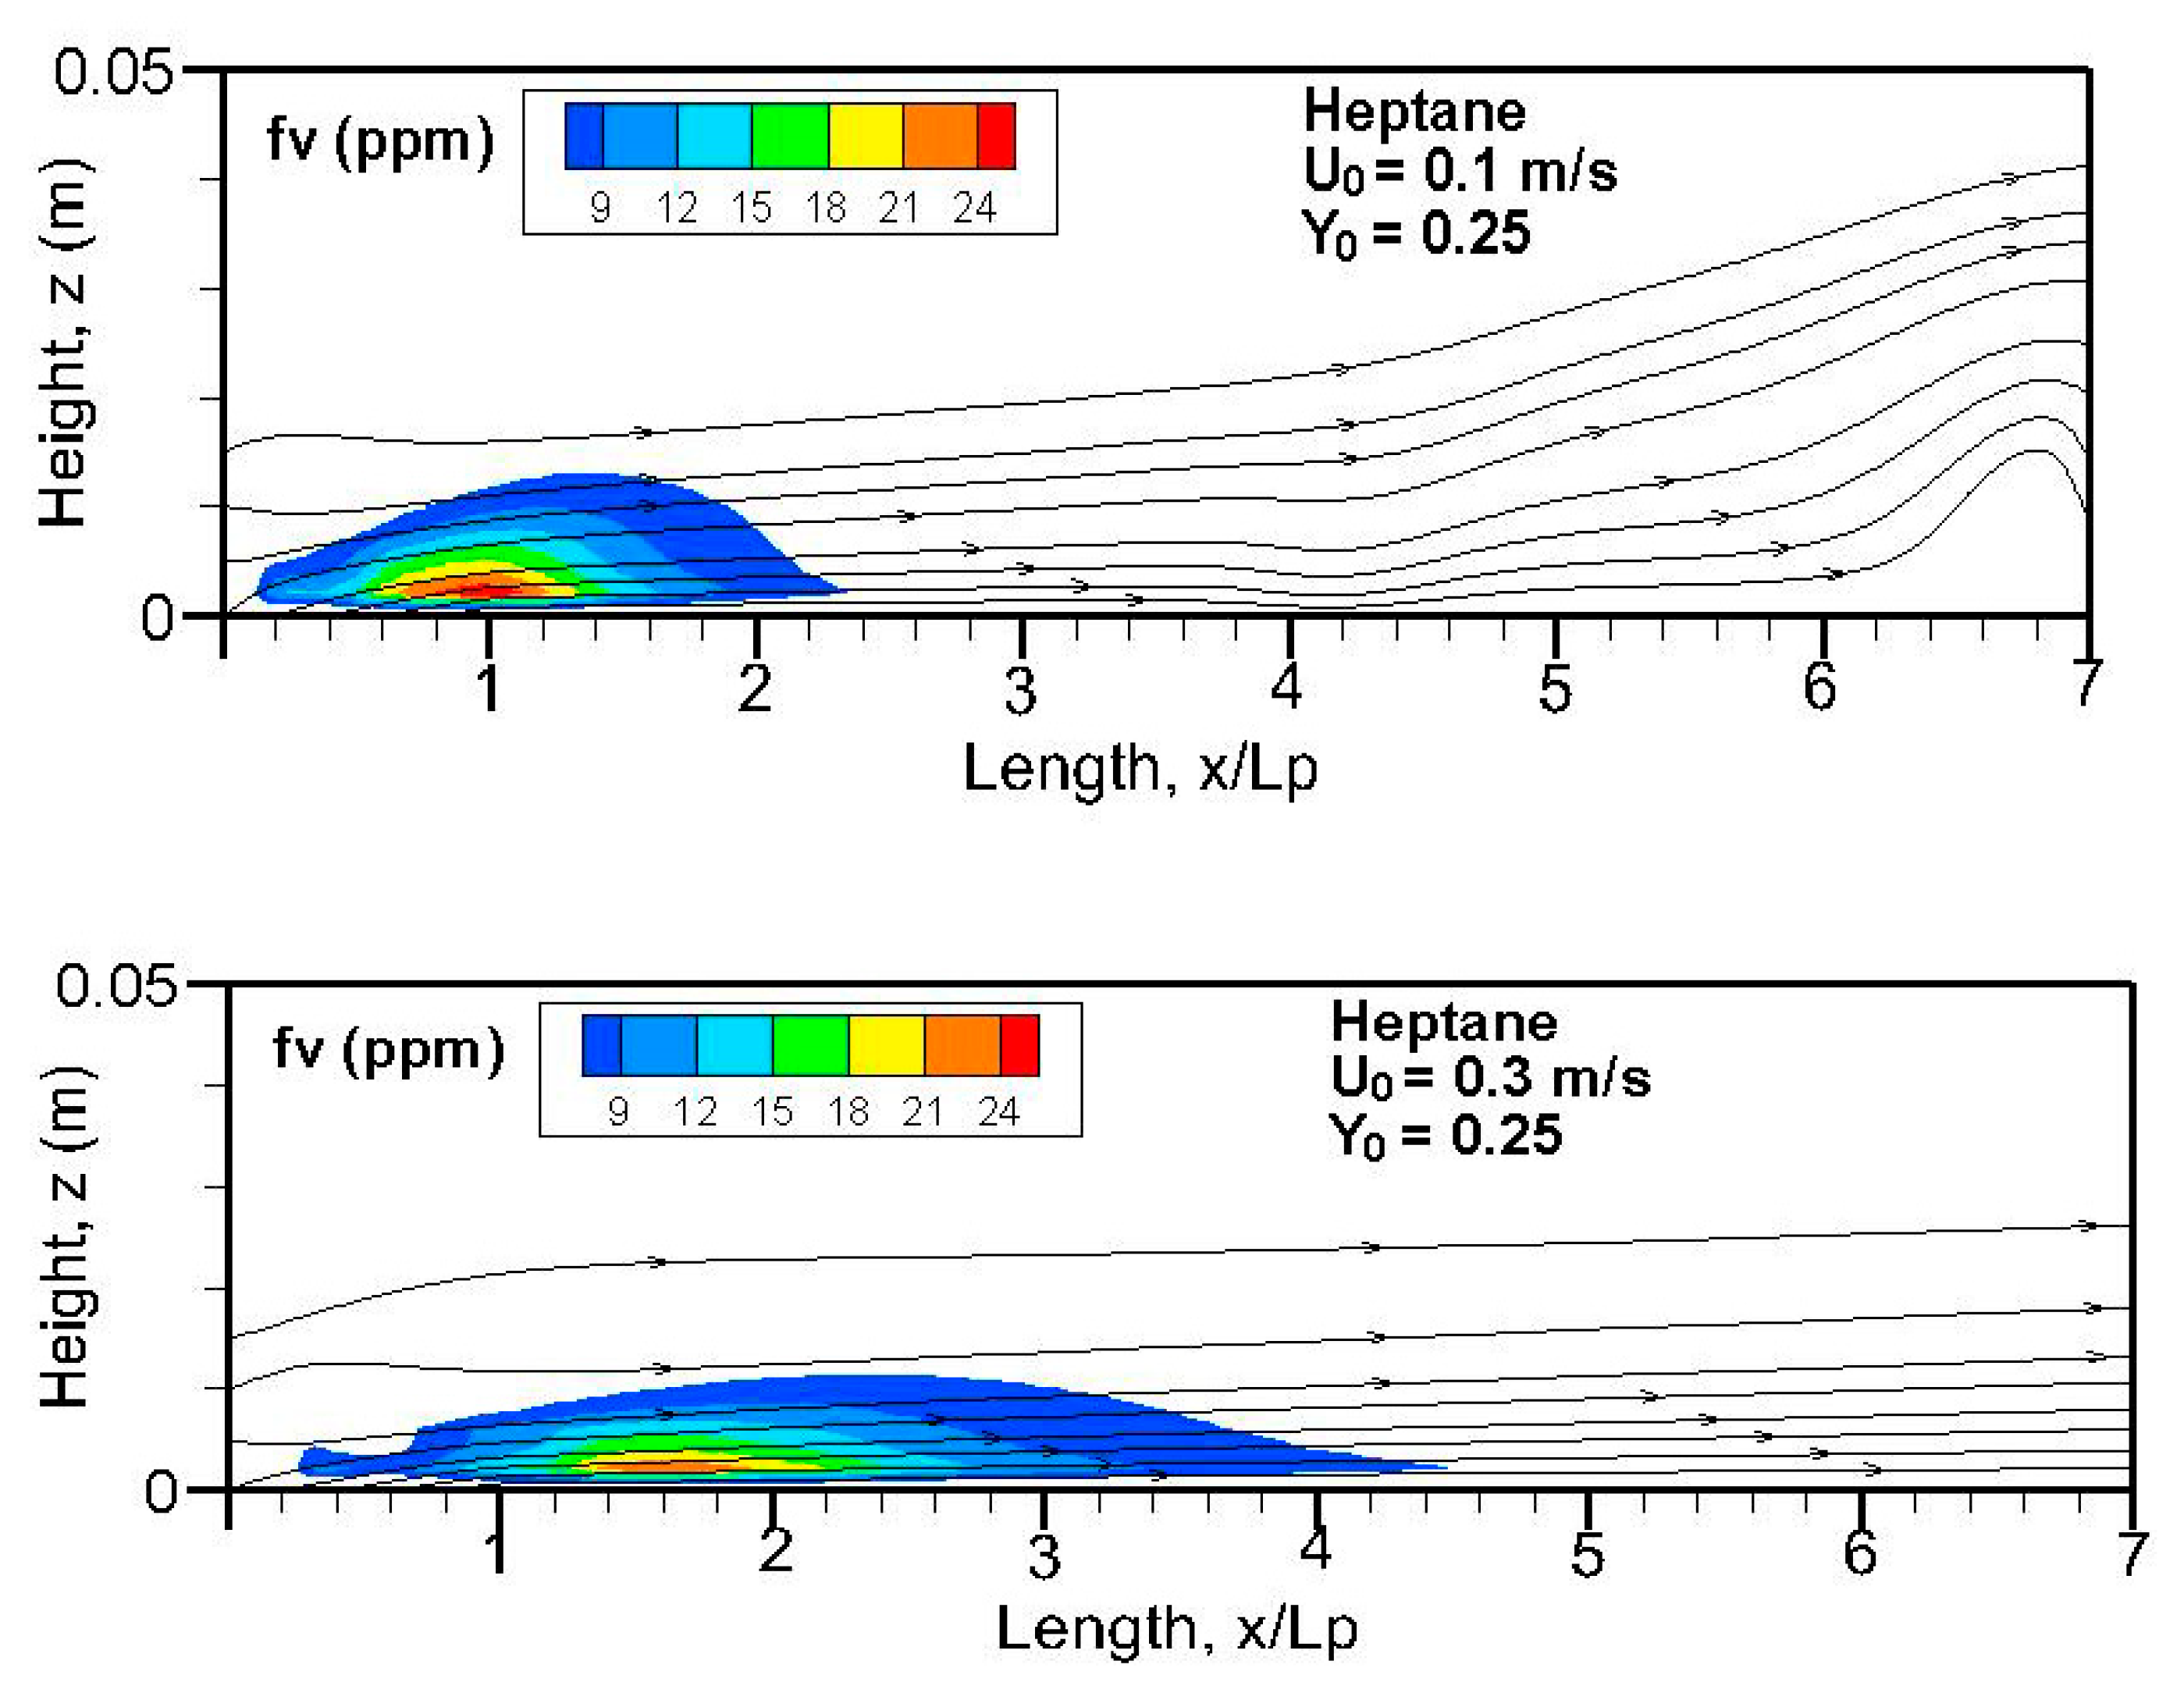
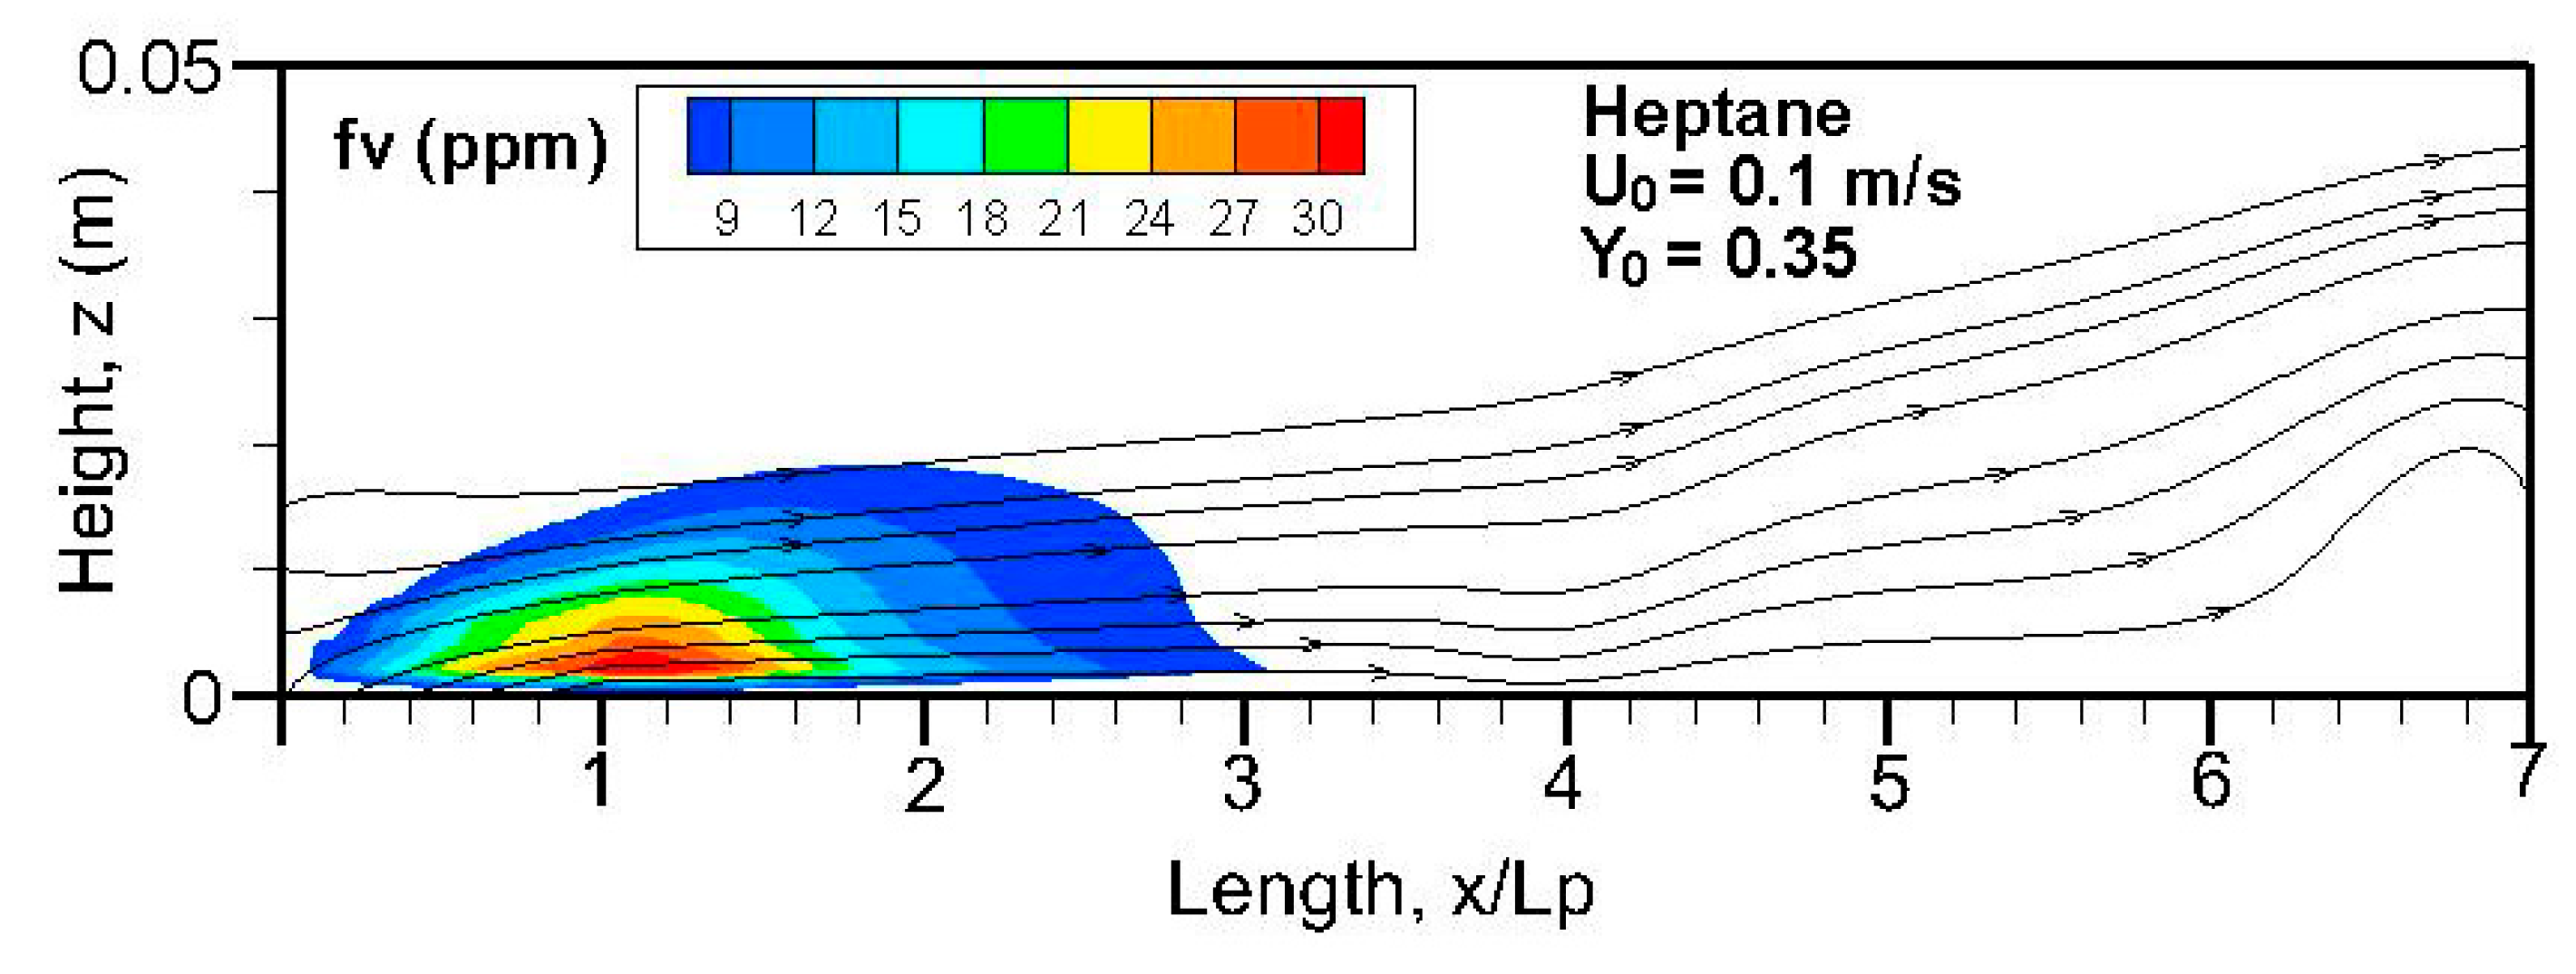
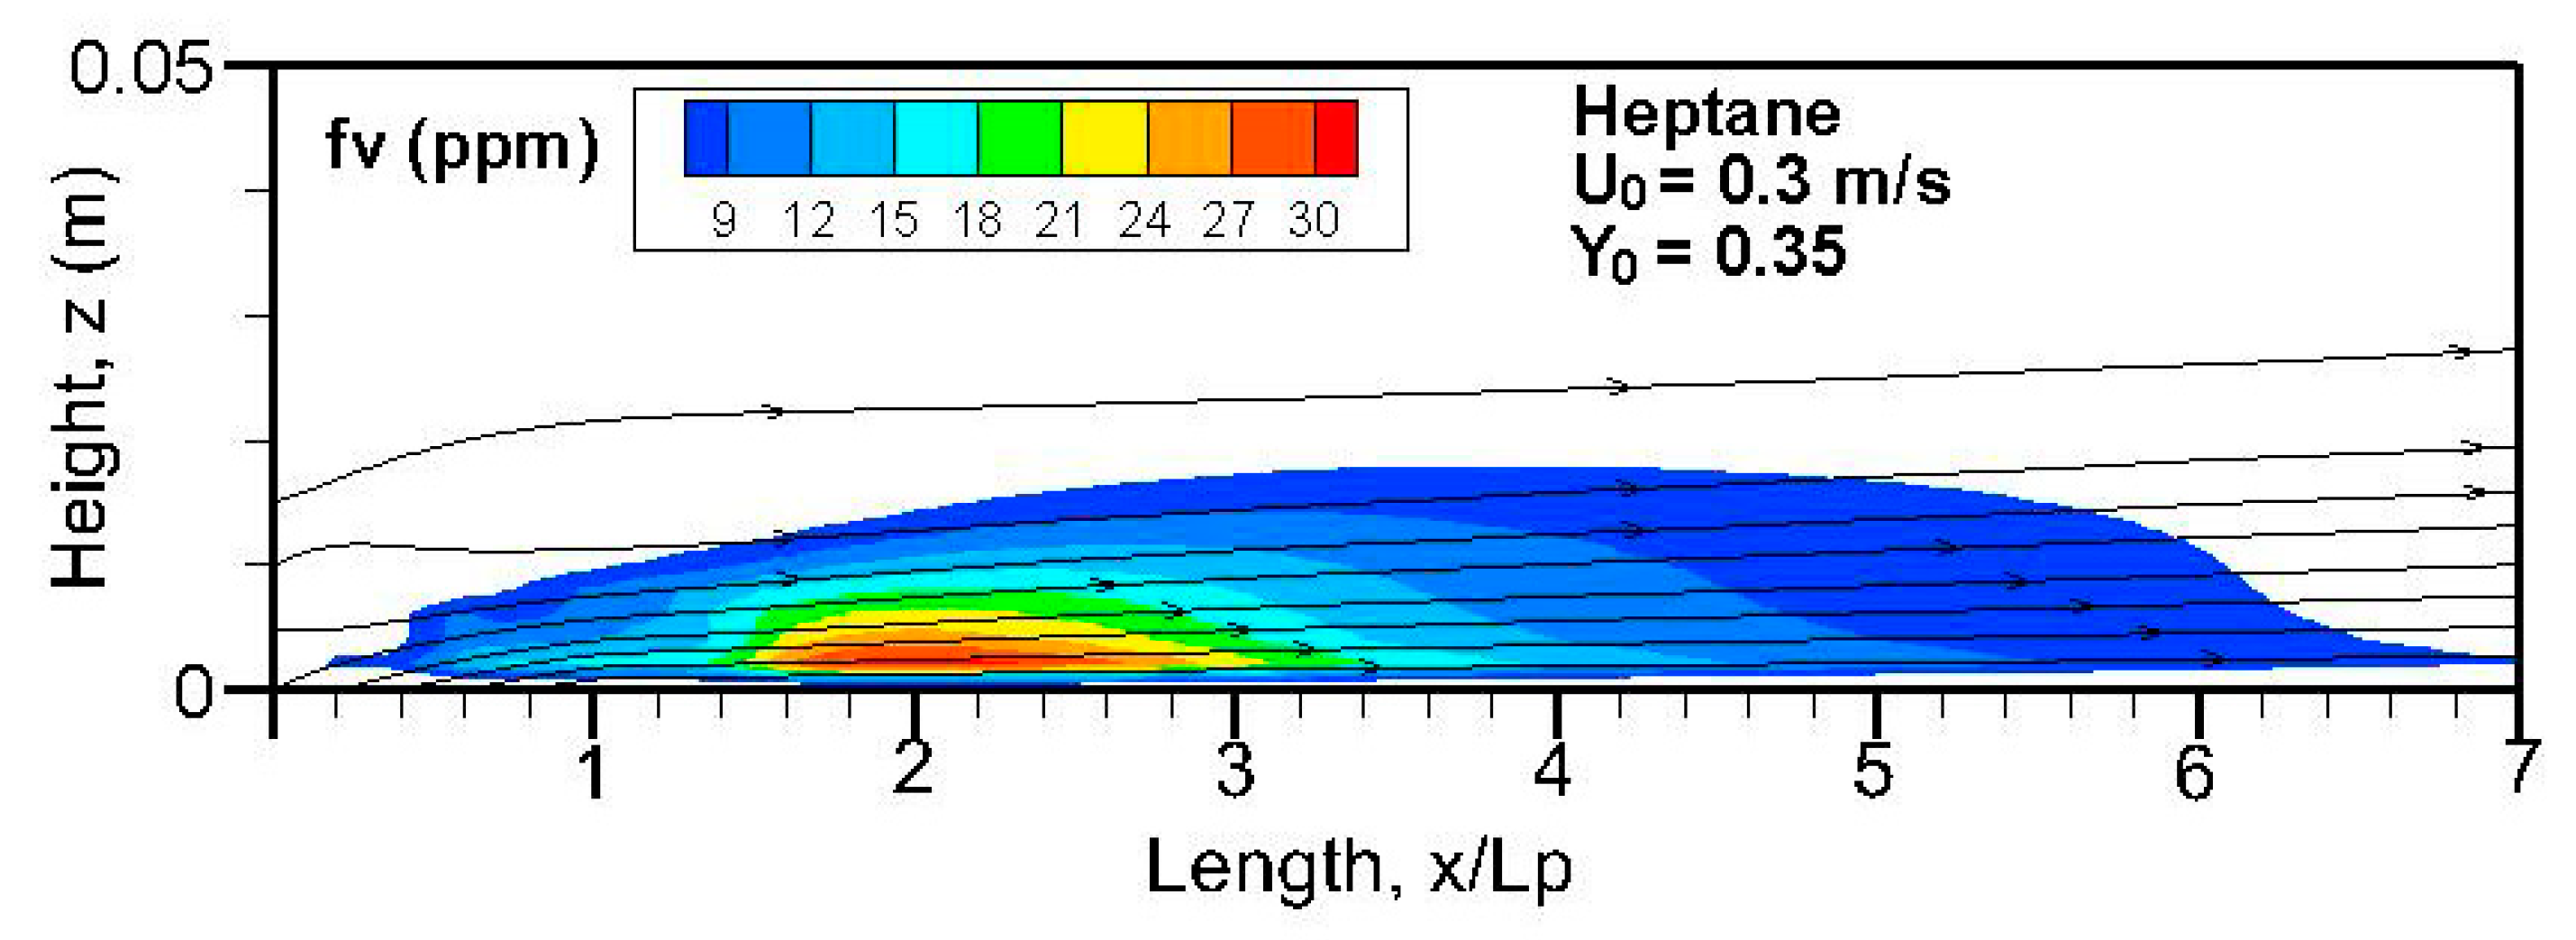
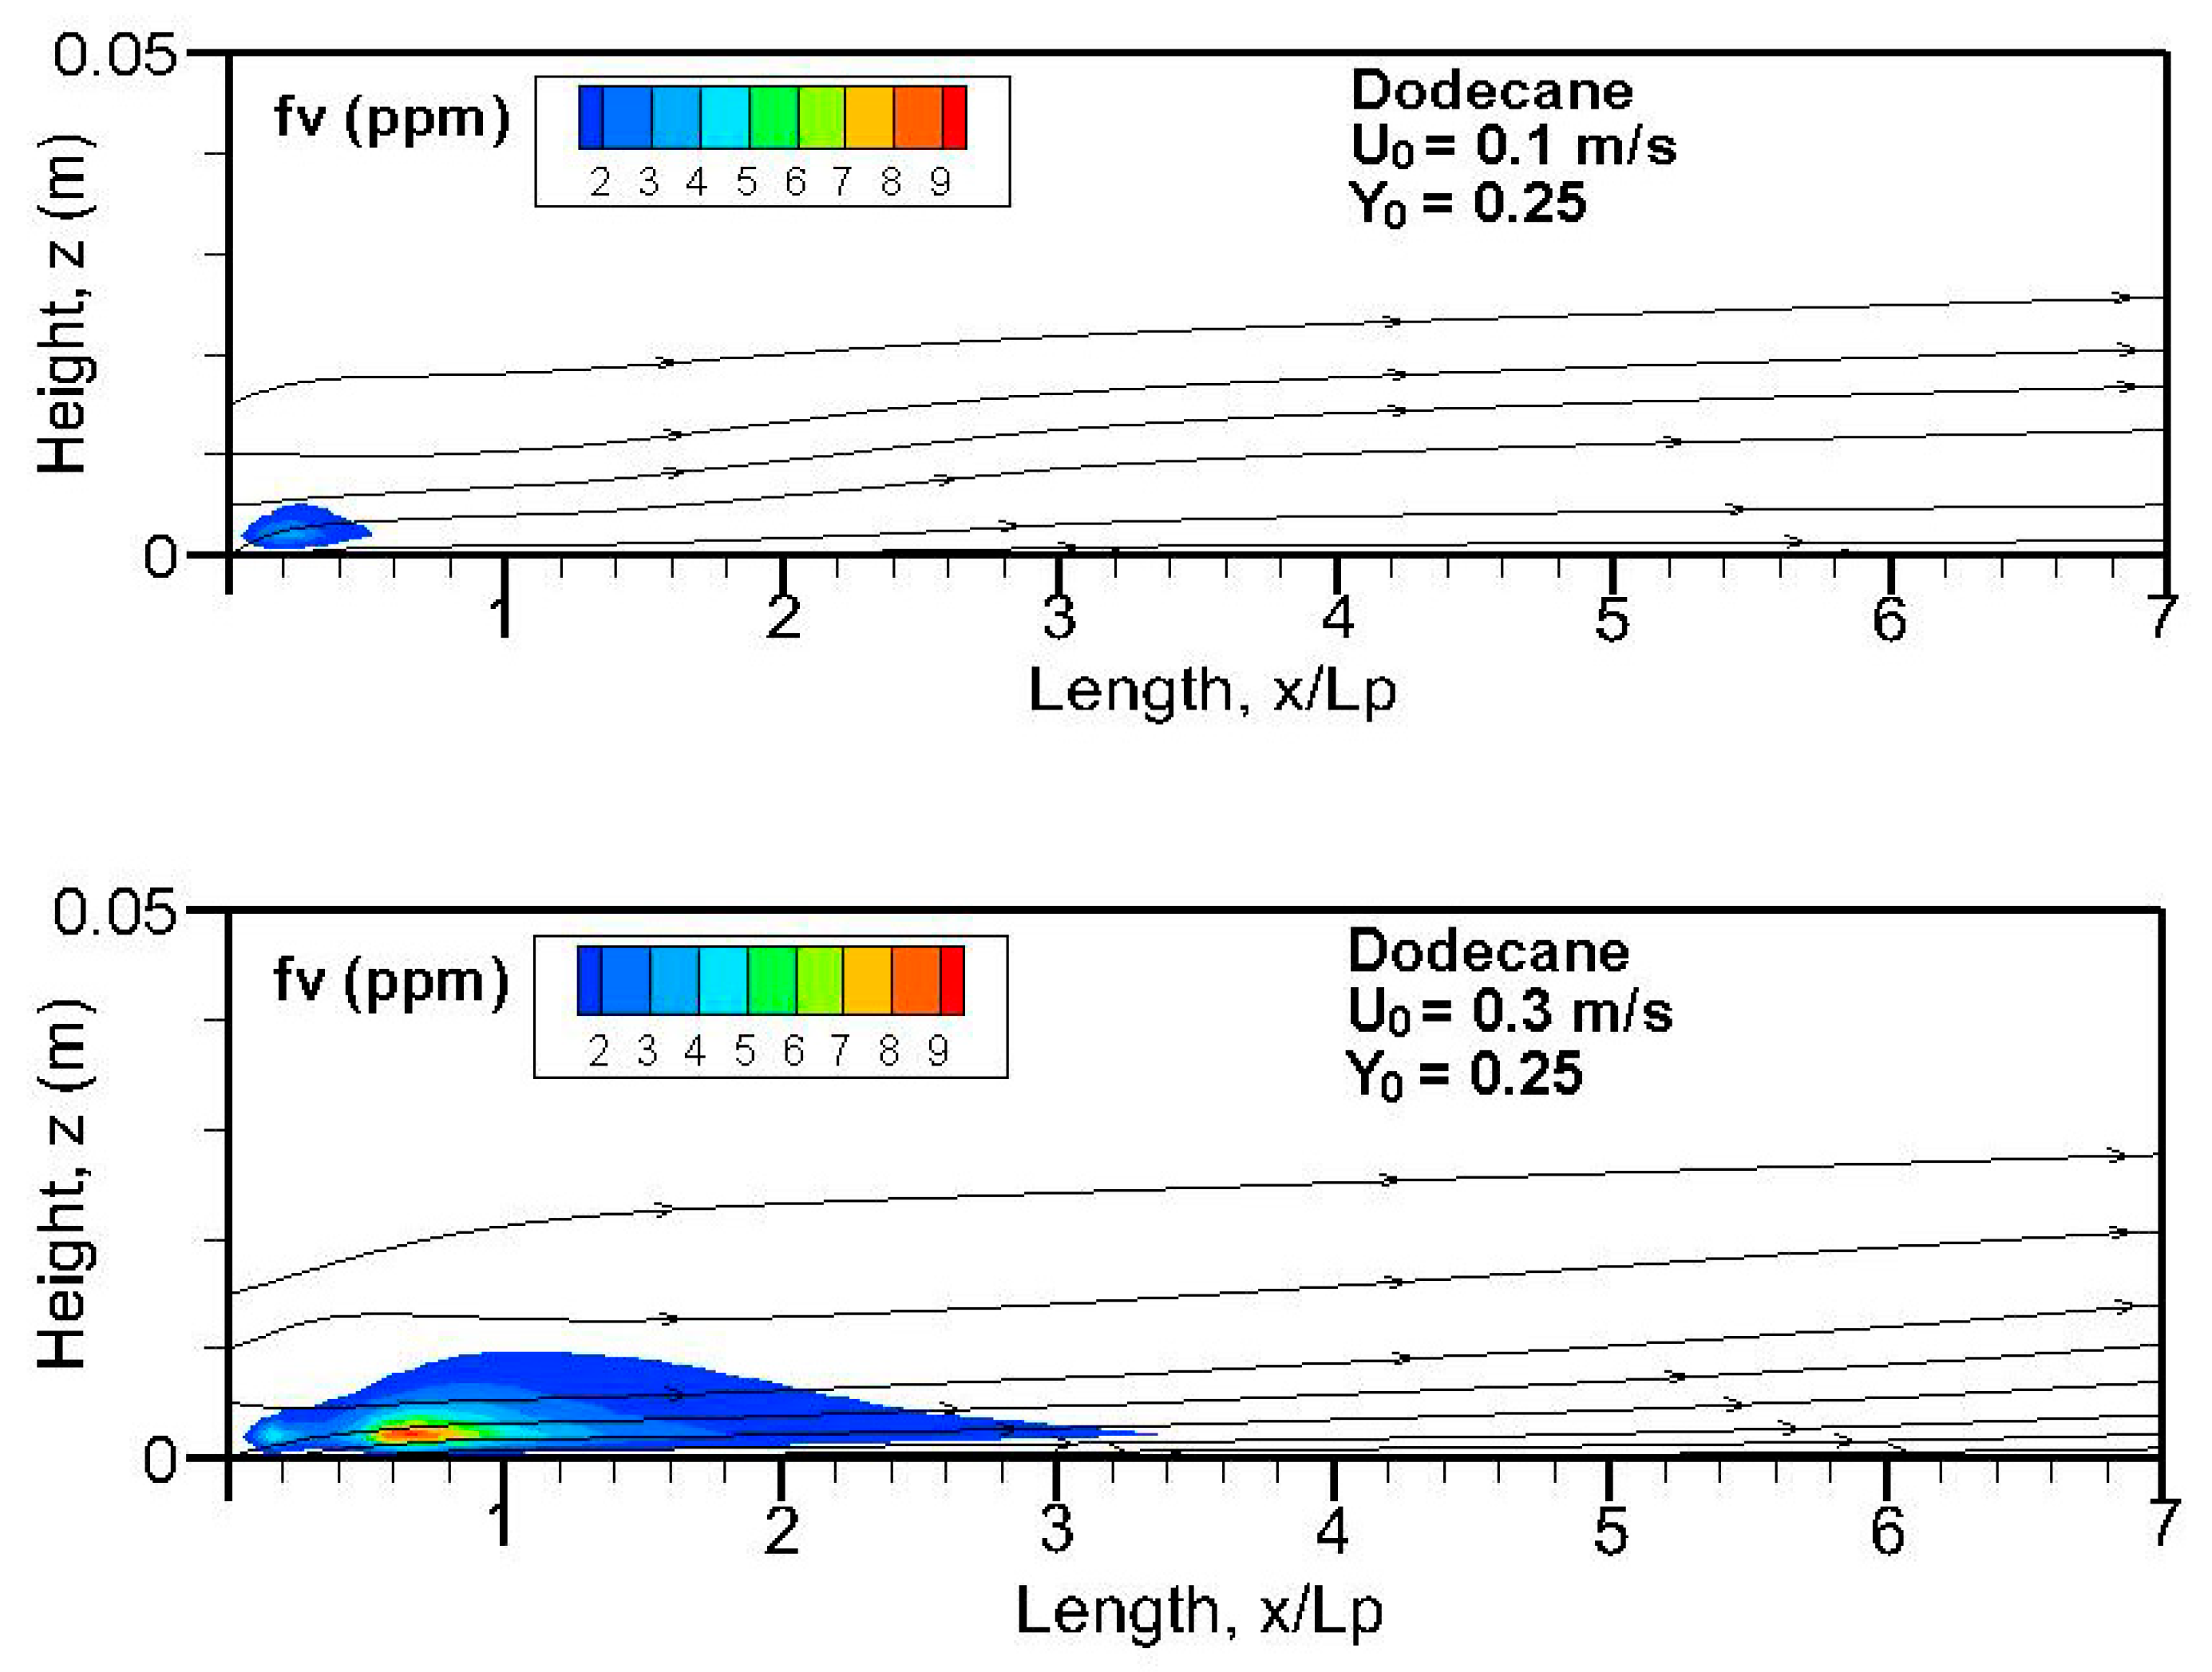
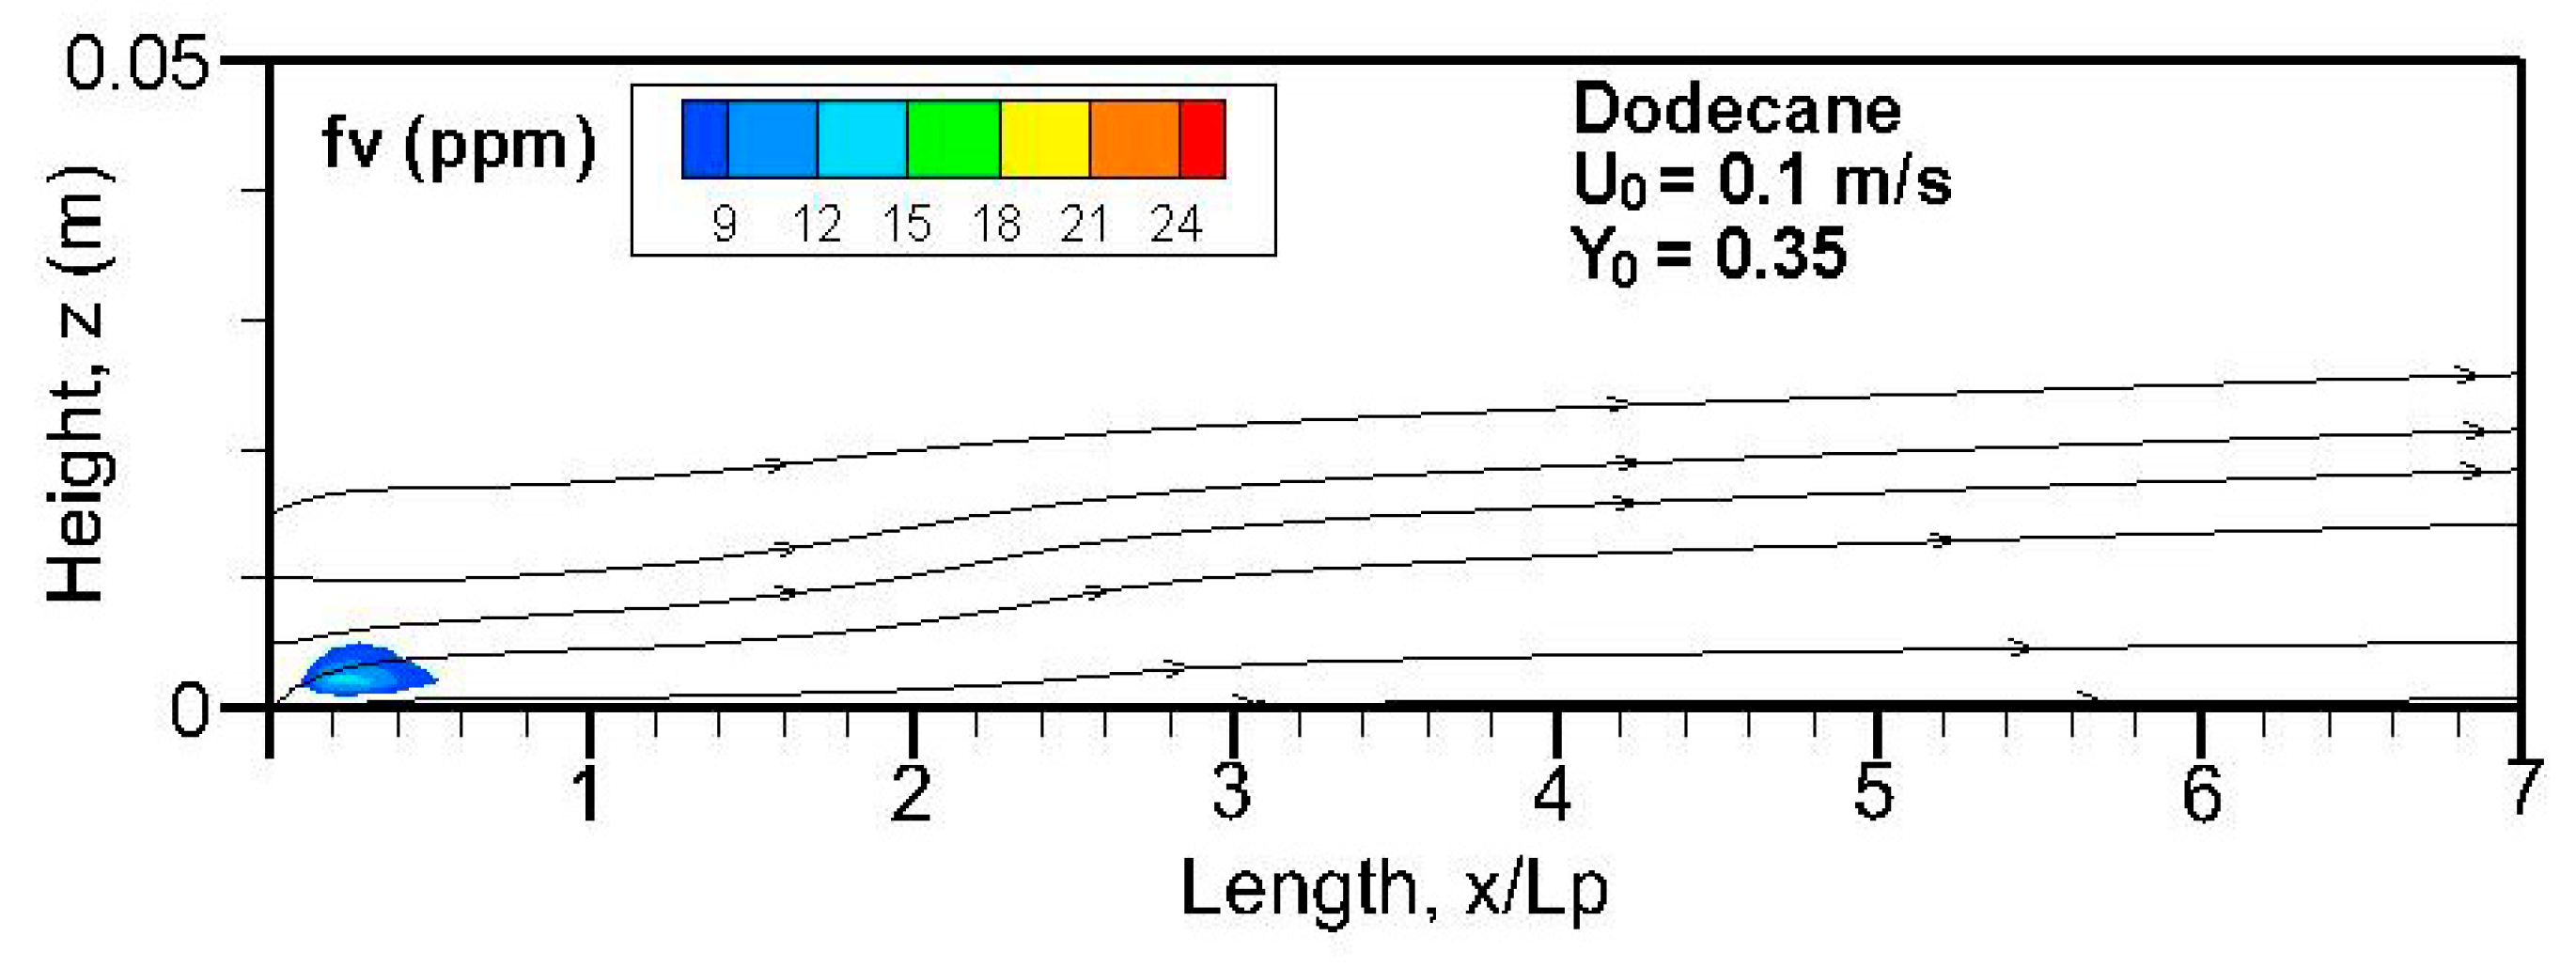
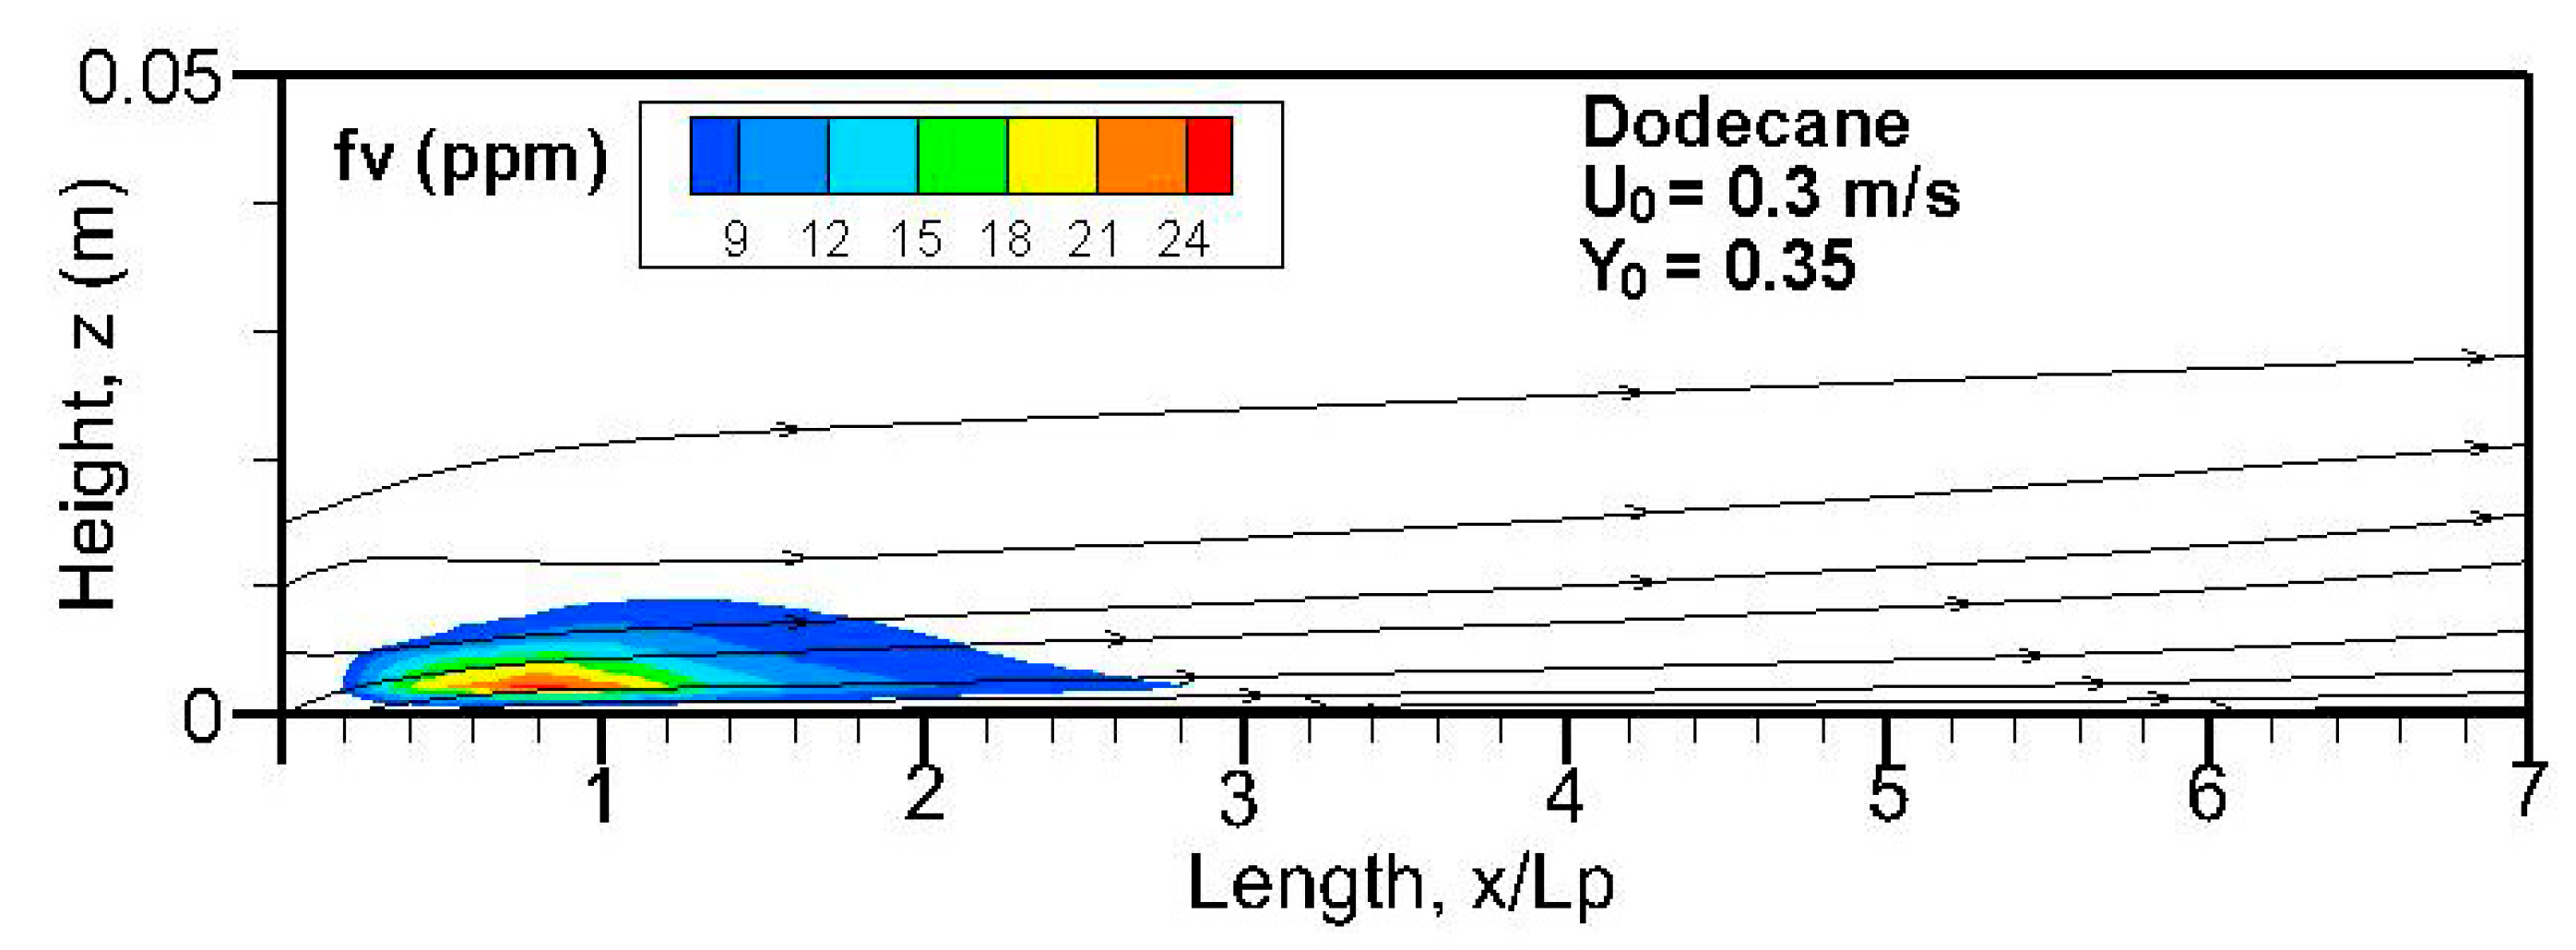
Fields of the computed soot volume fraction higher than 7 ppm in addition to the streamlines on the symmetrical plane (x, z) are plotted in
Figure 9,
Figure 10,
Figure 11 and
Figure 12. Although soot formation processes take place in the high-temperature region near the flame sheet, an accumulation of a soot-laden, relatively cold layer occurs near the wall via thermophoretic effects due to temperature gradient in the boundary layer. The streamlines near the leading edge are somewhat deflected upwards due to the strong pyrolysis rate of the liquid fuel. The zone with a high soot volume fraction shifts towards the trailing edge with a rise in oxidizer flow speed. The extent of the high soot volume fraction in length and thickness at Y
o = 0.35 is roughly 1.5 times that at Y
o = 0.25 with a low pyrolysis rate (cf.
Figure 8a,b). The extent of the soot volume fraction above 7 ppm of the heptane flame is approximately four times that of the dodecane flame due to its reduced pyrolysis zone (x/L
p < 0.8).
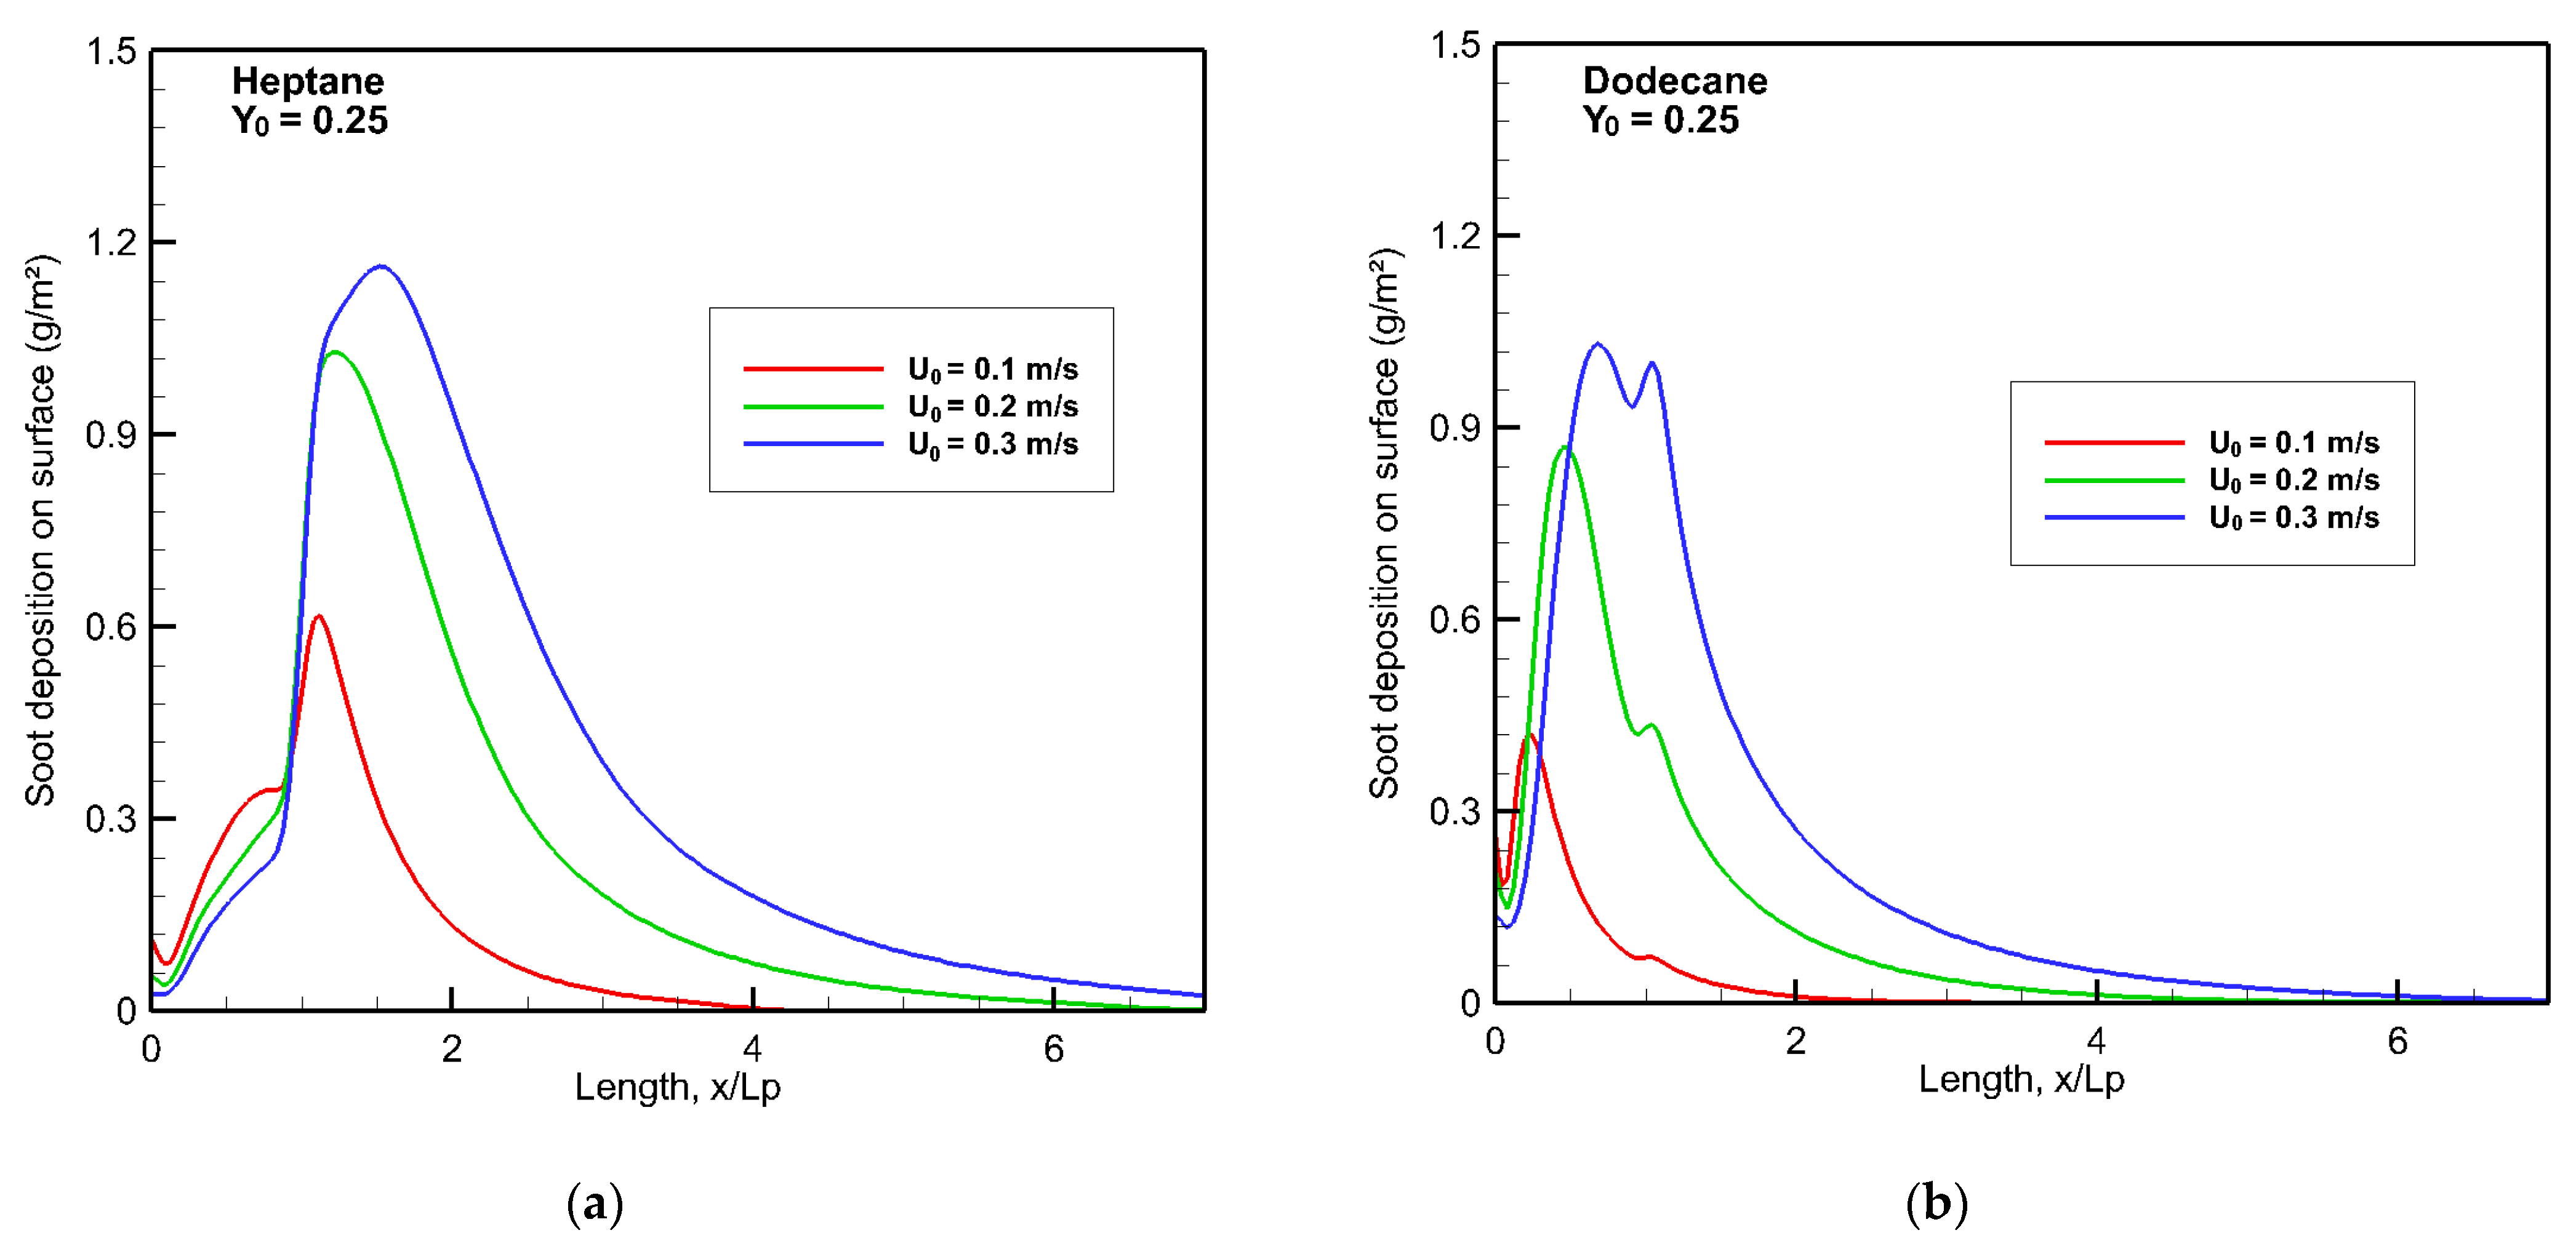
As an illustration, soot deposition (g/m
2) onto a wall surface from the gas phase via the thermophoretic effect at Y
o = 0.25 is given in
Figure 13a,b. The significant soot stratification of heptane flame (cf.
Figure 9 and
Figure 10) with a high crossflow speed of 0.3 m/s leads to a remarkable soot deposition. The peak of soot deposition is beyond the burning region for heptane but, however, within the pyrolysis zone for dodecane. Downstream of the leading edge, soot deposition decays quickly. In comparison with the dodecane flame, the soot deposition of heptane flame increases by a factor of 20% with an increase of U
0. A similar trend is found at Y
o = 0.35 as a function of U
0 for soot deposition.
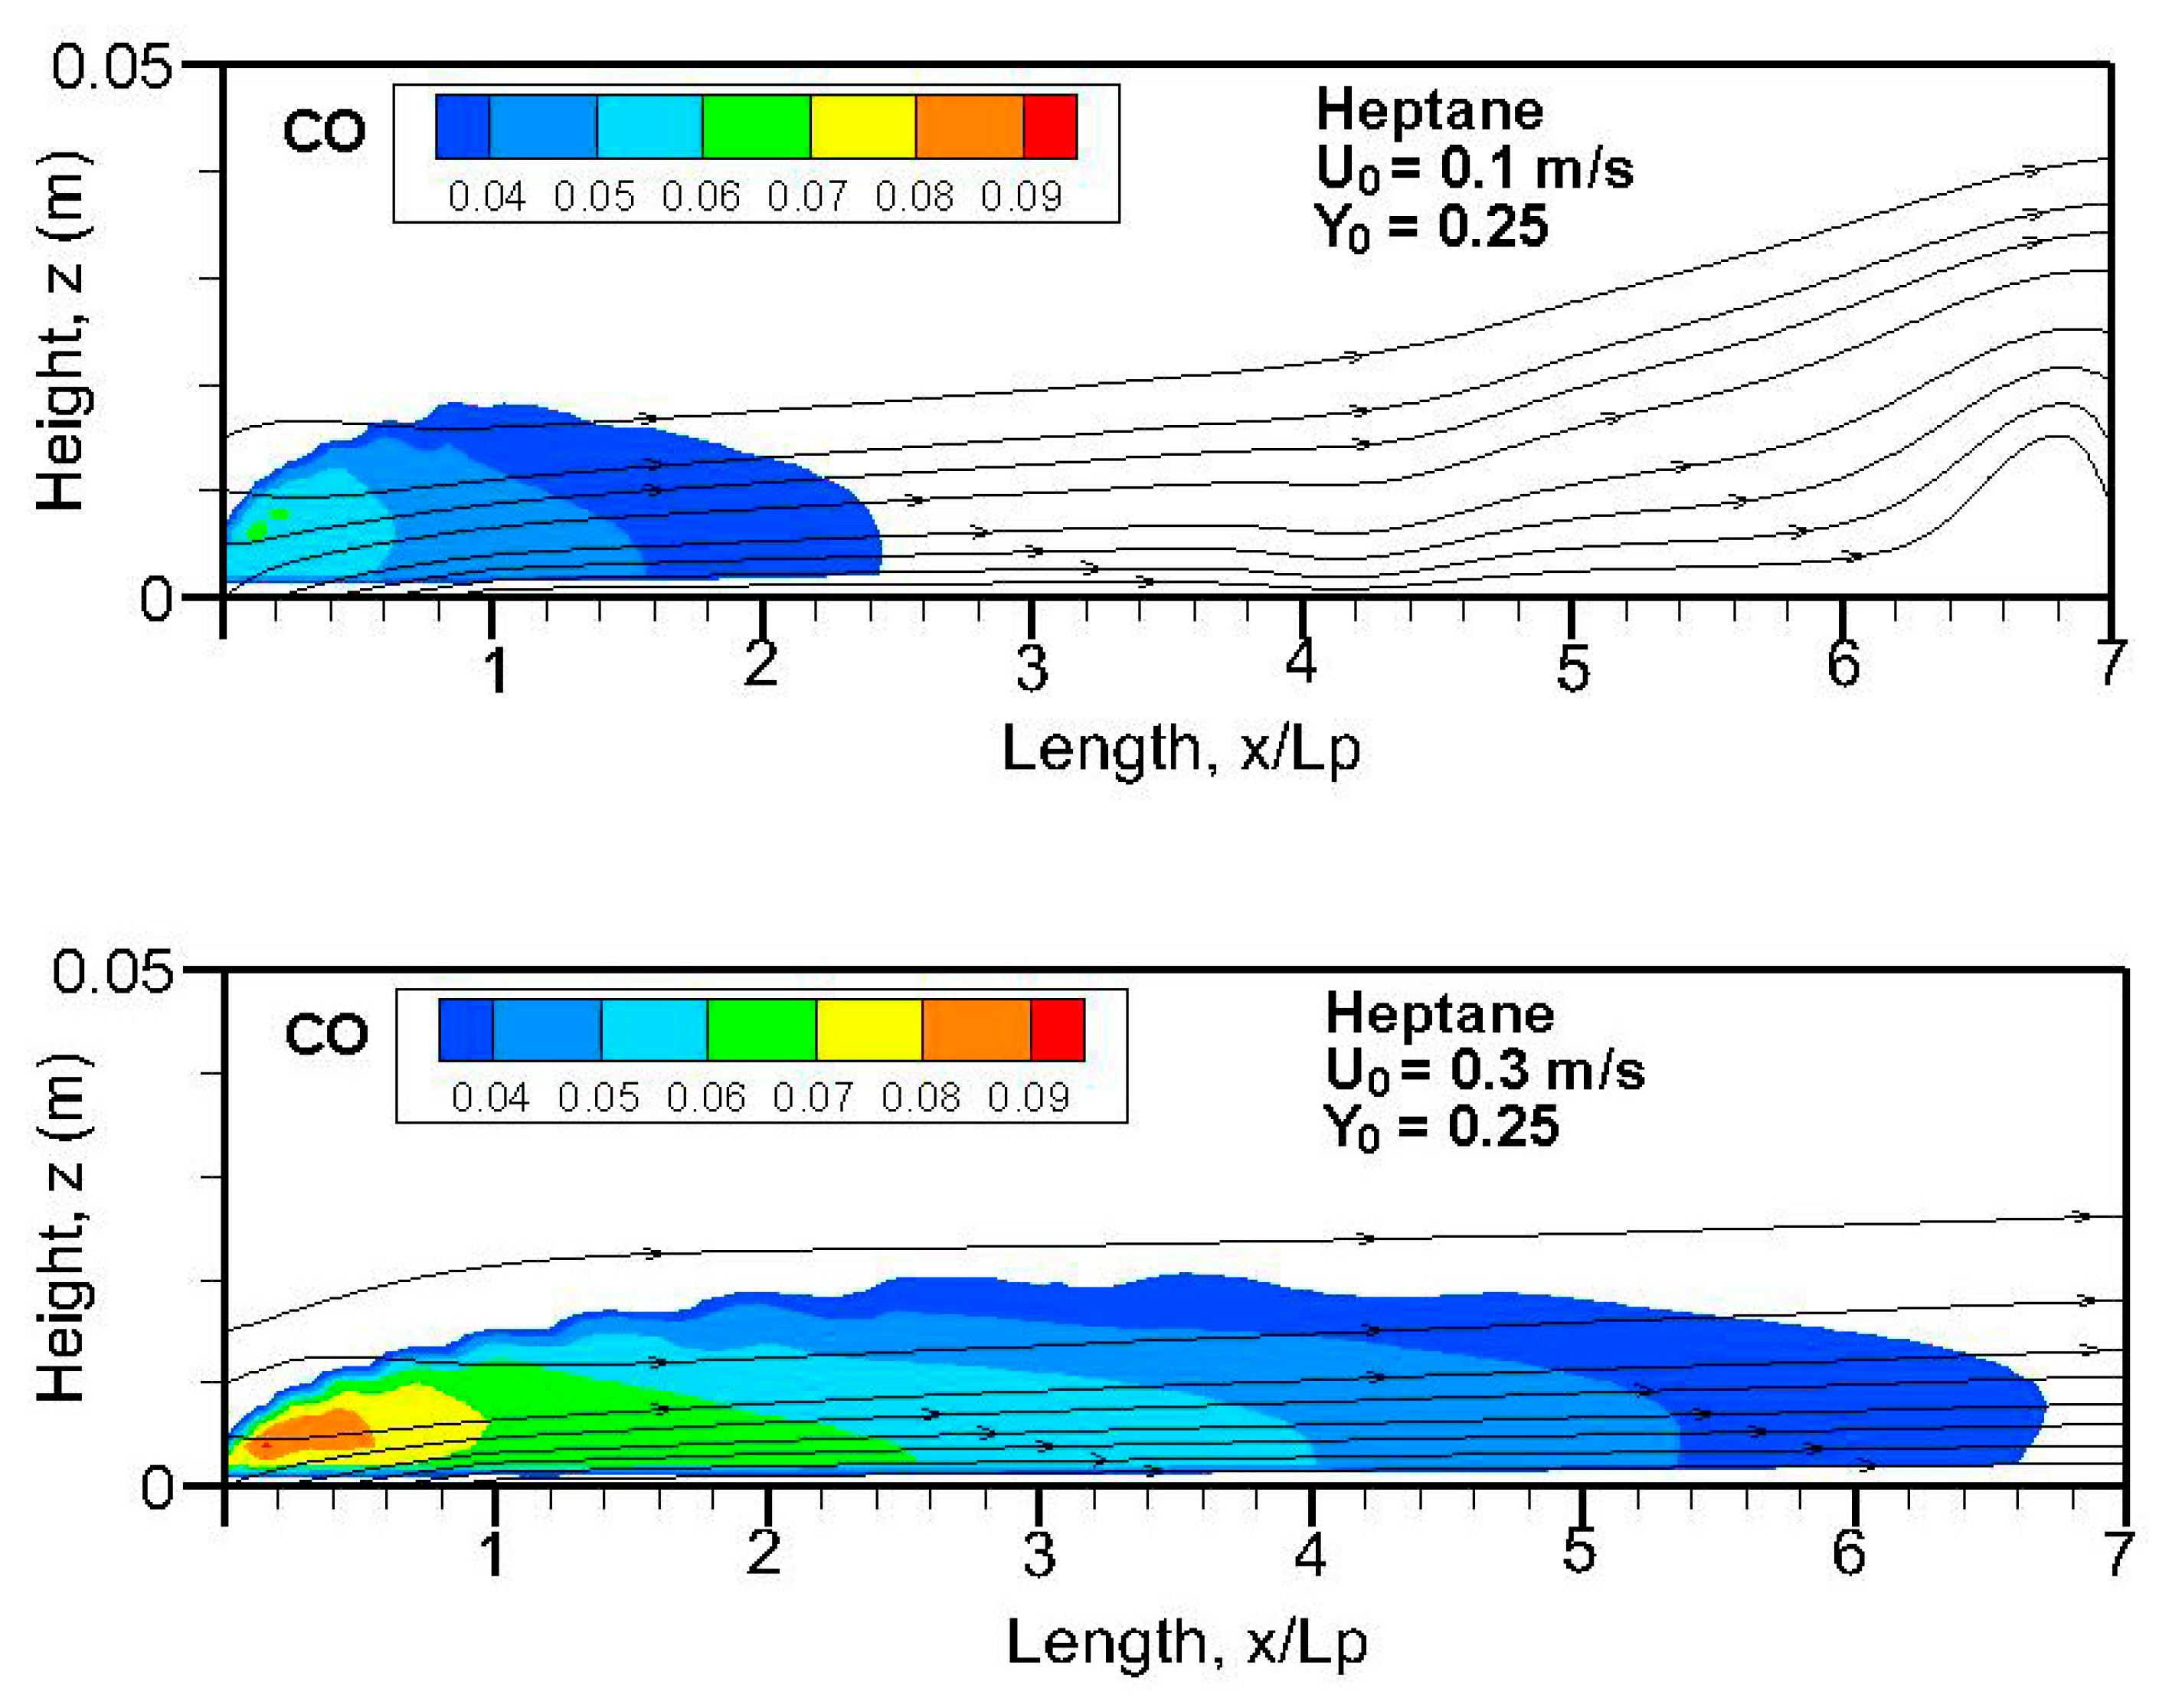
Fields of the computed carbon monoxide on the symmetrical plane (x-z) for the heptane and dodecane flames are illustrated in
Figure 14,
Figure 15,
Figure 16 and
Figure 17. The crossflow assumes transport of the important CO production in the pyrolysis zone downstream far away from the tailing edge. A stronger burning rate of heptane flame (cf.
Figure 11) induces a larger extent of CO production, higher than 4 ppm, compared to that of dodecane flame, regardless of oxygen concentration. In the absence of gravity, the CO production inside the boundary layer diffusion flame reaches a peak of roughly 8–10% near the pyrolysis zone, compared to 3% at Earth gravity [
5,
7].
A mean value of CO along the windward direction (cf.
Figure 14,
Figure 15,
Figure 16 and
Figure 17) is estimated by averaging the integrated CO over the thickness of the boundary layer. The influence of crossflow speed on the curve of mean CO production at two oxygen concentrations is clearly highlighted in
Figure 18a,b. It seems that enhancement of the burning rate (cf.
Figure 8a,b) at a high U
0 prevents fresh air entraining into the pyrolysis region, resulting in an increase of about 40% in the CO peak. A peak of 4% in CO production is found in the pyrolysis zone regardless of the fuel type. A quick decay of CO below 1% downstream is obvious for the dodecane flame, and a CO molar fraction above 3% lasts till x/L
p = 3 for the heptane flame. With respect to CO intoxication, interaction between oxidizer flow speed/oxygen concentration and CO emission is likely to be most important, with a significant scatter in the peak.
Analysis of CO
2 production is useful, because the quantity of air breathed depends upon concentration of inhaled CO
2, which becomes an important factor in fires [
5]. By comparing
Figure 19a,b, the mean CO
2 concentration in the forward direction is essentially independent of the pyrolysis rate and fuel type (cf.
Figure 8a,b). With an elevated oxygen concentration of 0.35, a peak of 10% in CO
2 concentration takes place beyond the chemical reactivity zone at x/L
p = 4. The reduced convective transport at U
0 = 0.1 m/s is conducive to a rapid decrease of CO
2 far away from x/L
p = 4. An elevated oxygen concentration induces a smooth decreasing trend in the CO
2 curve, because an oxygen molar fraction above 15% allows the chemical reaction to be sustained.
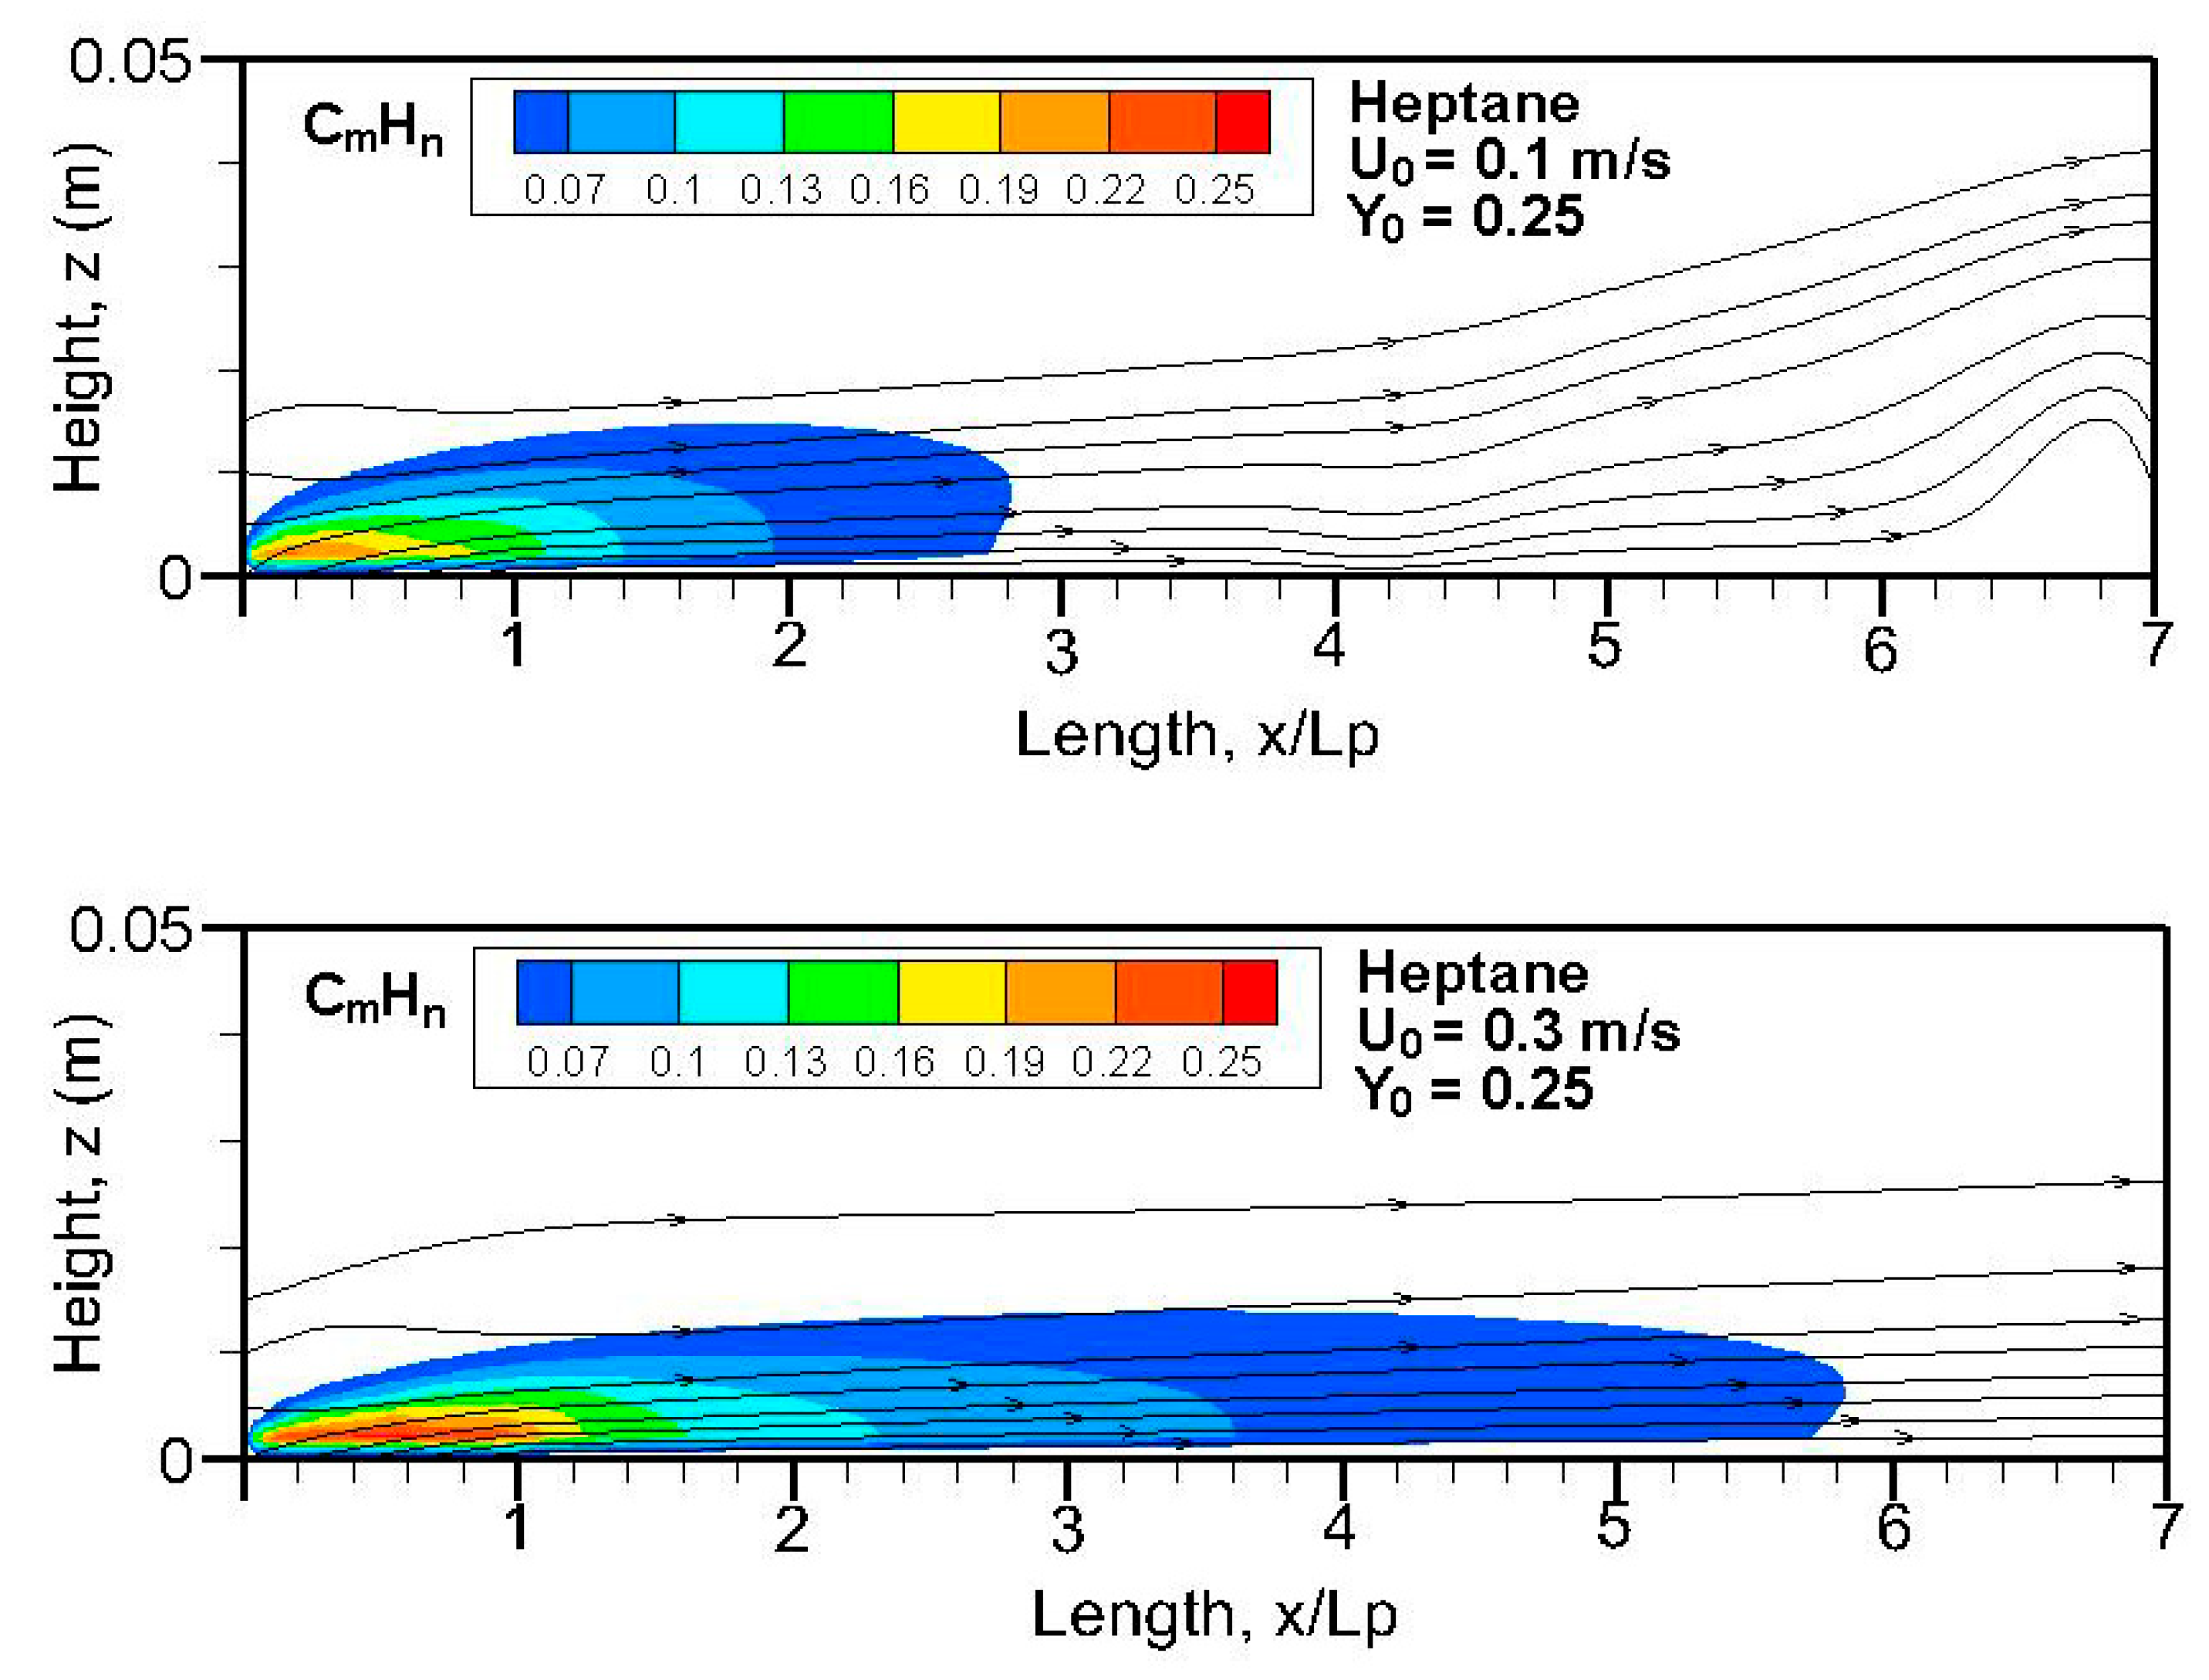
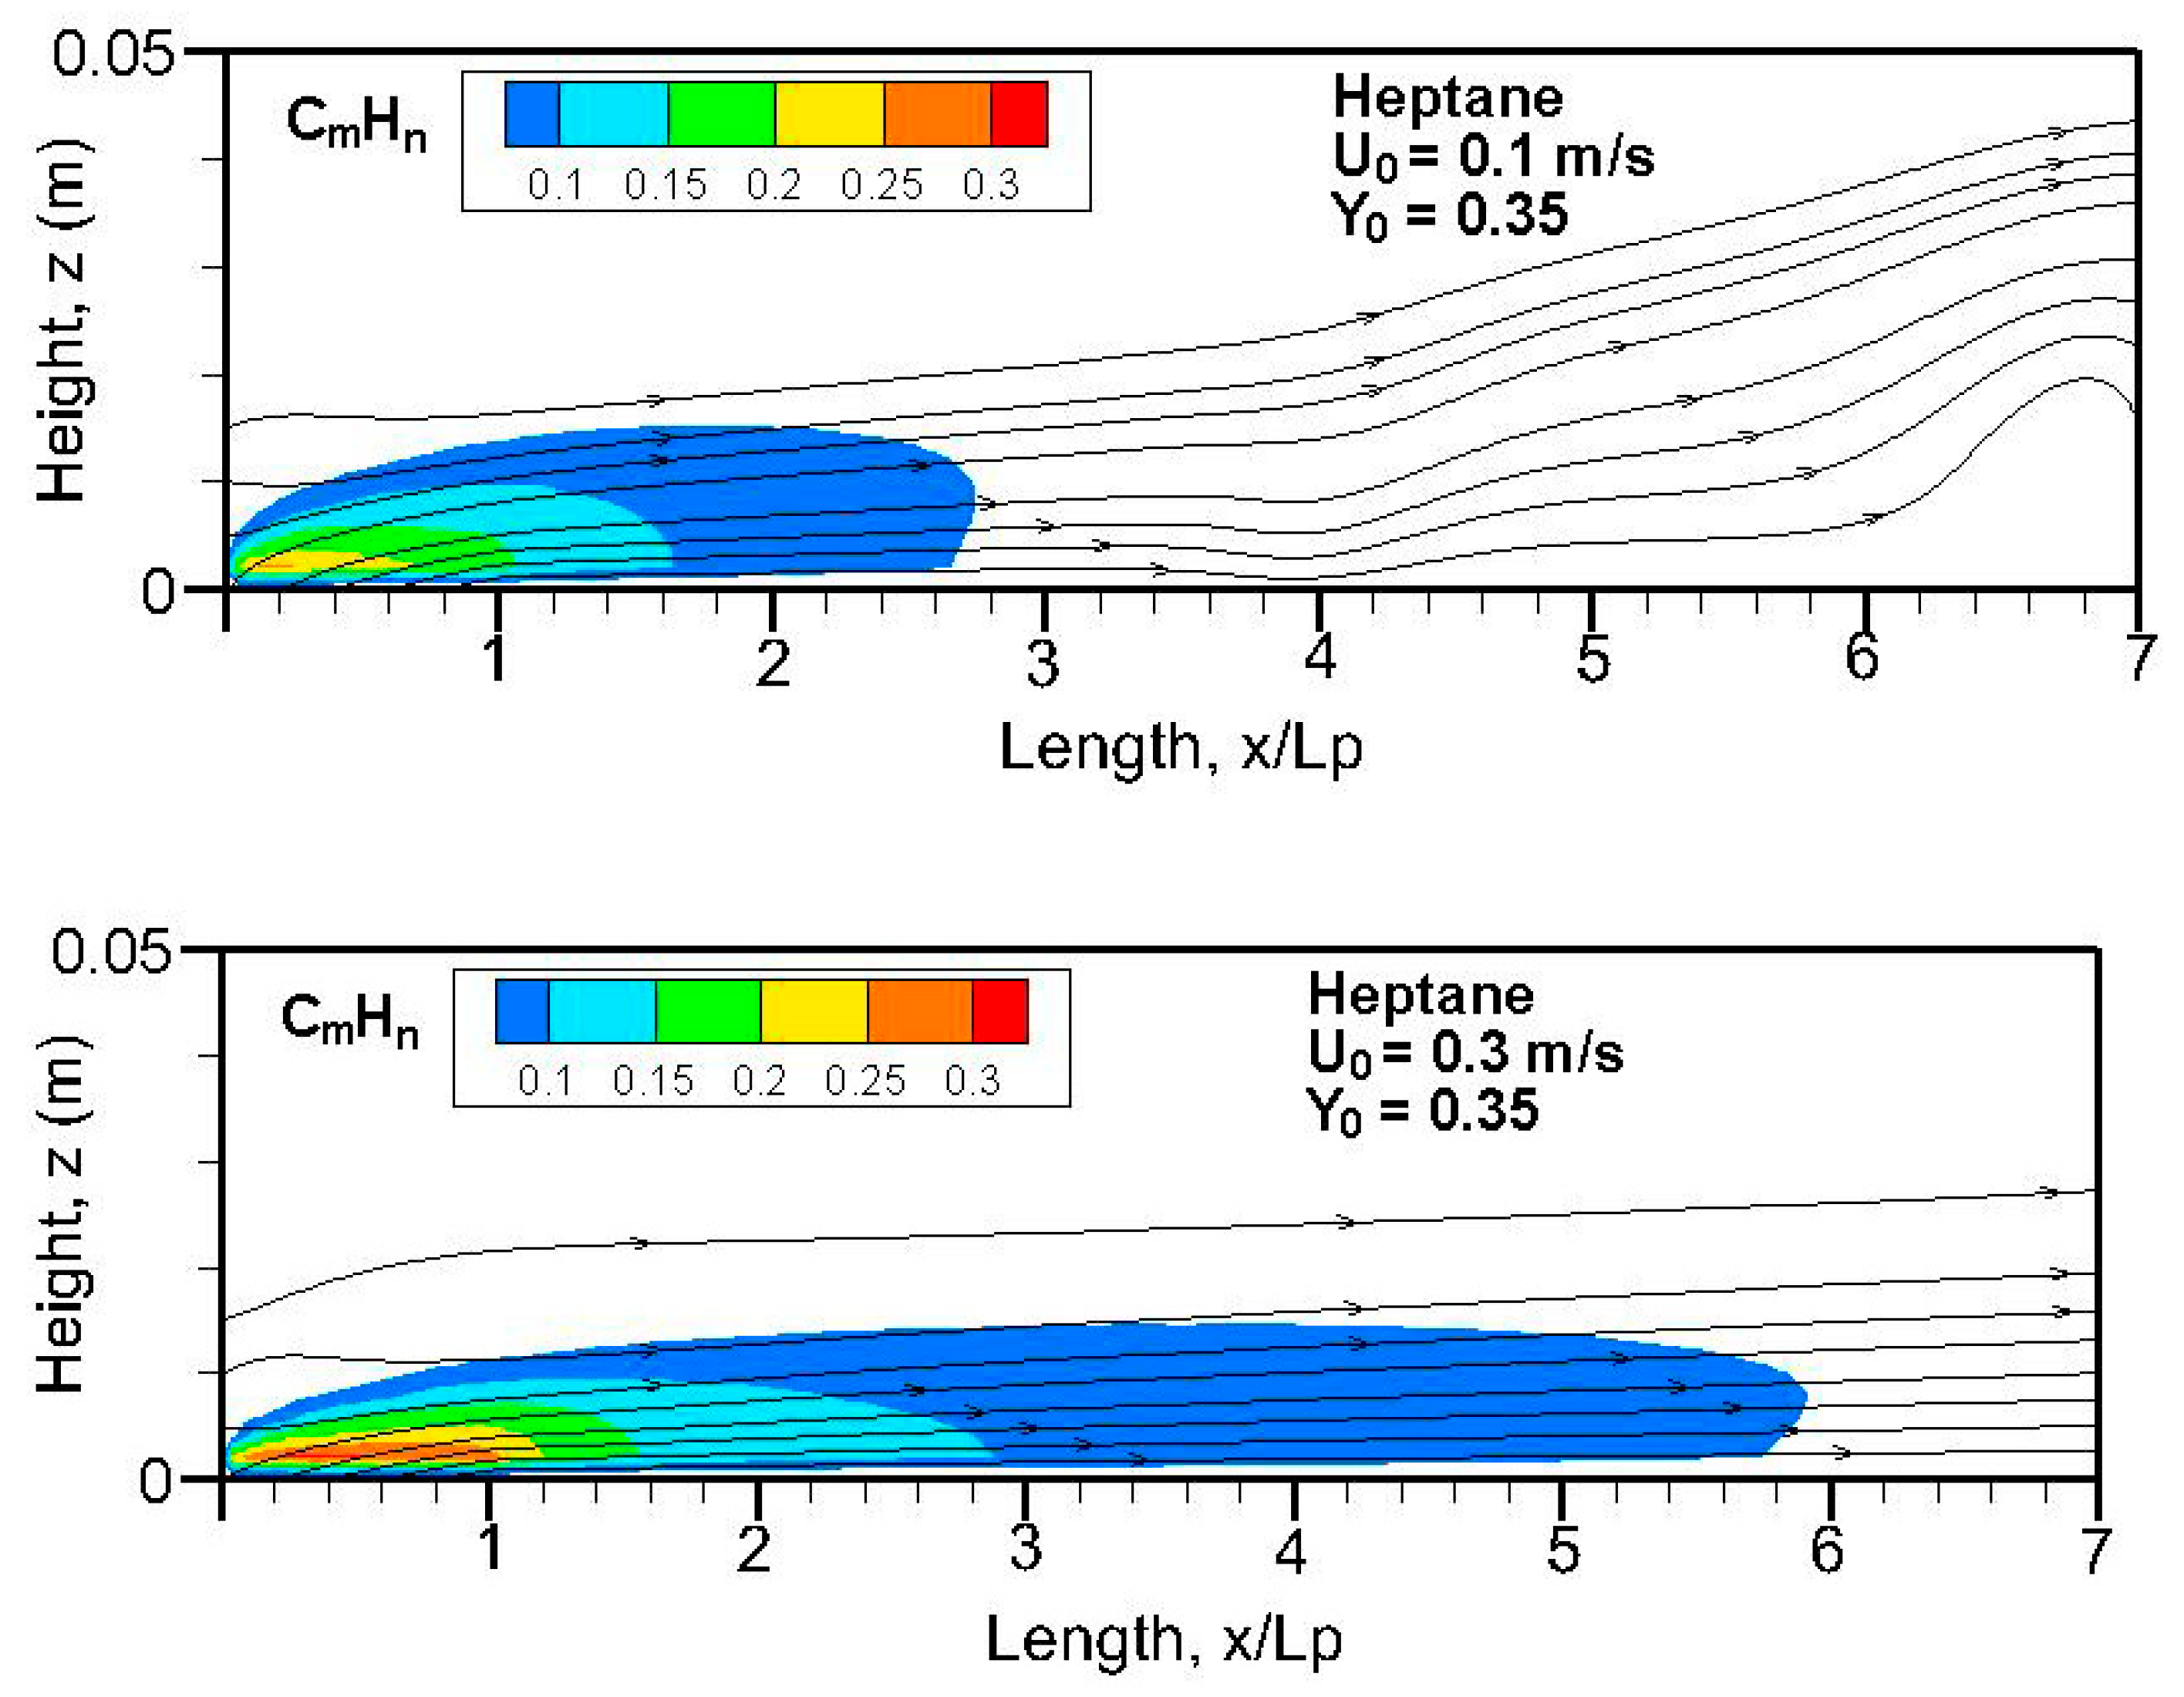
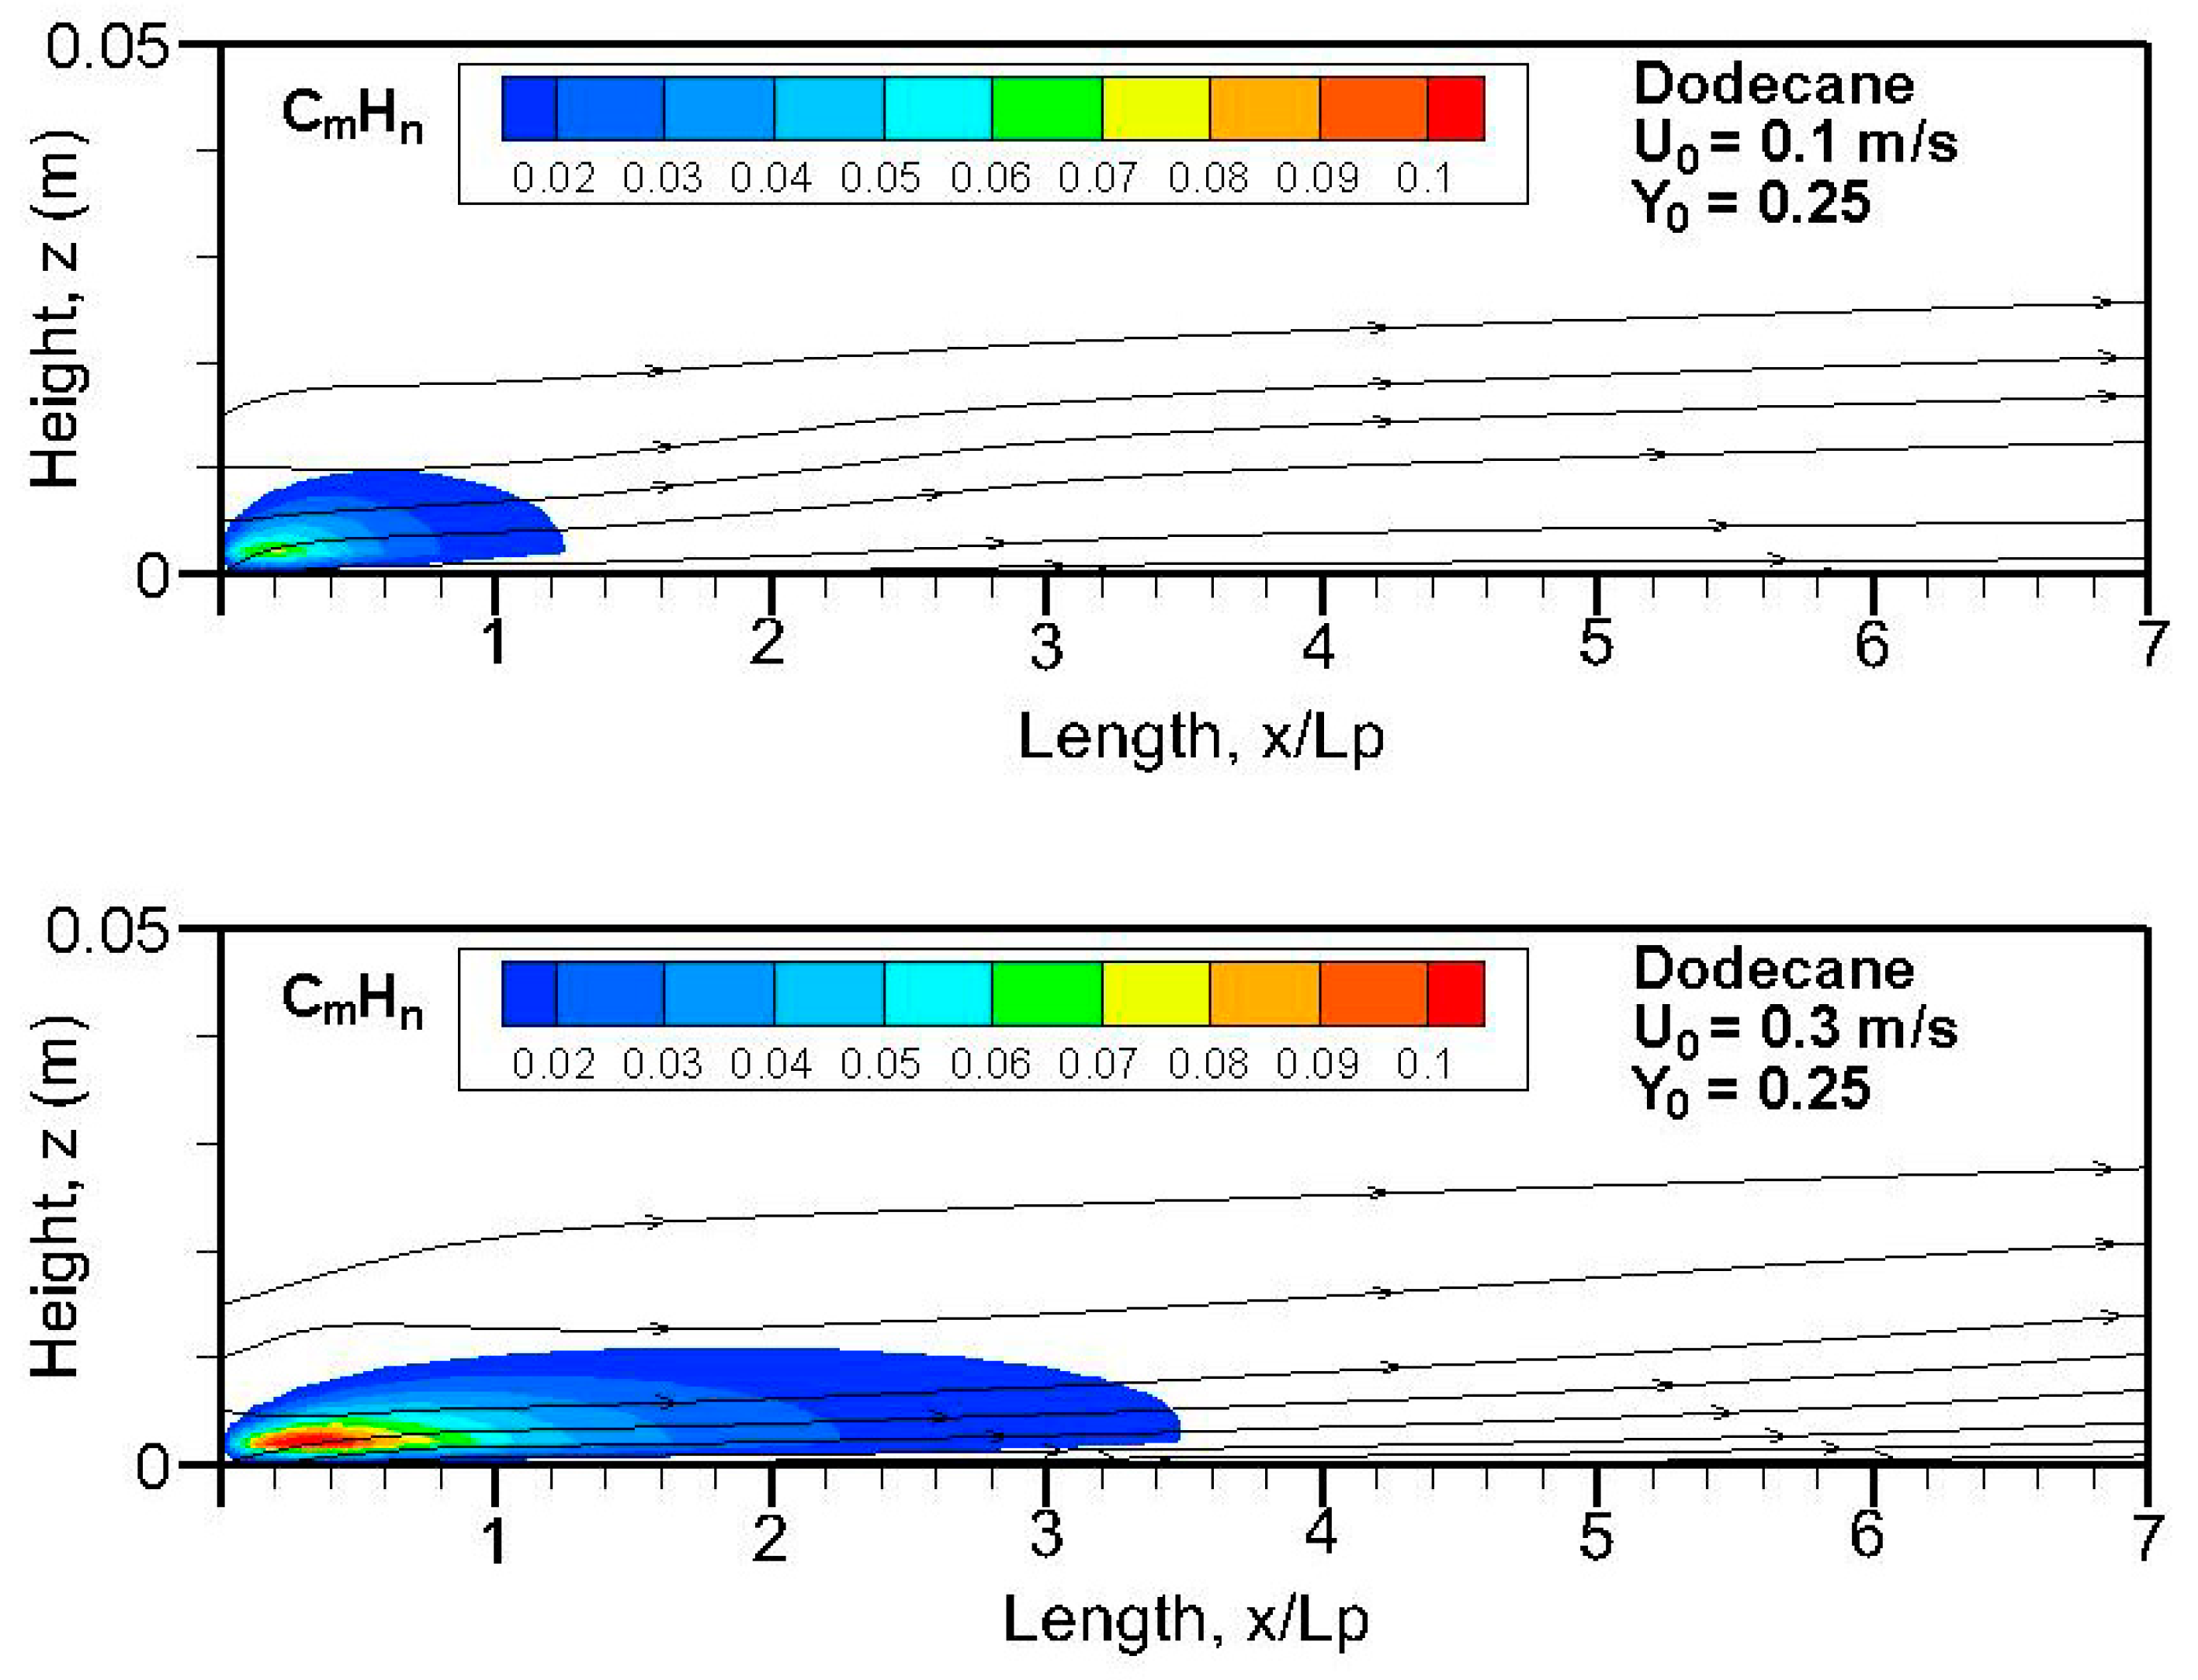
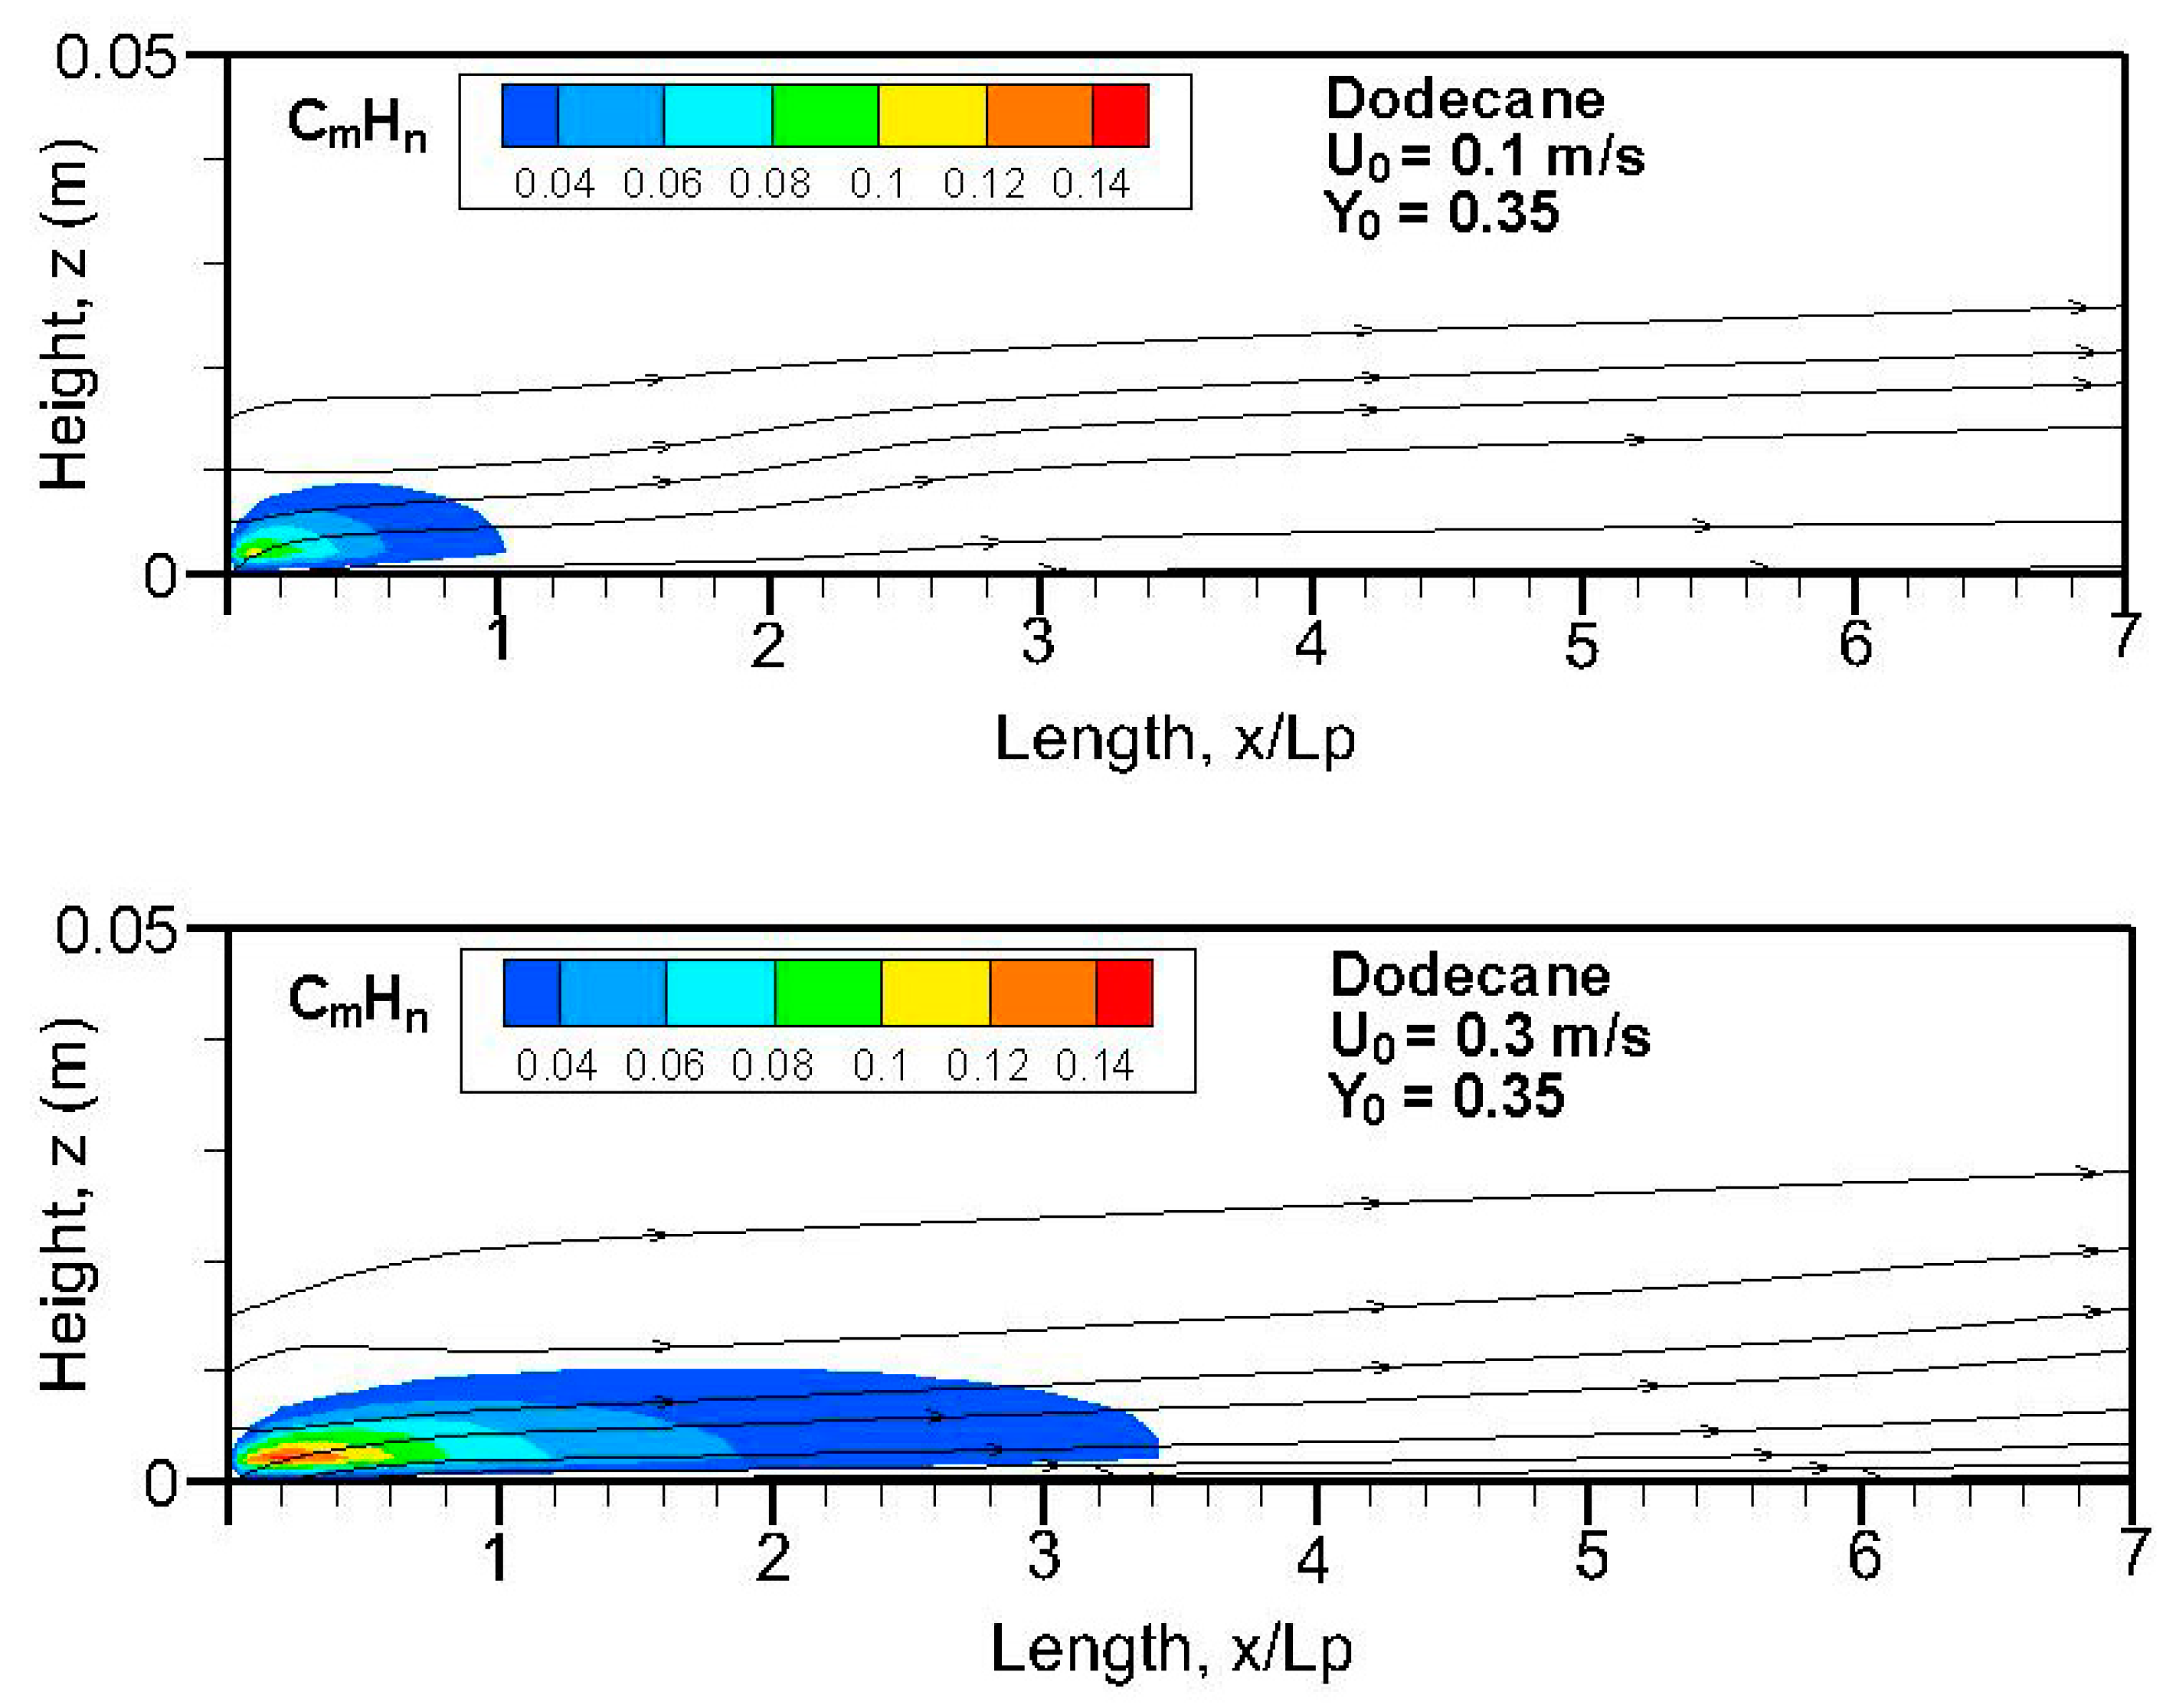
Figure 20,
Figure 21,
Figure 22 and
Figure 23 depict the unburnt hydrocarbons (C
mH
n) field in terms of equivalent primary fuel, e.g., heptane or dodecane, on the symmetrical plane (x, z). A strong pyrolysis rate (cf.
Figure 8a,b) near the leading edge leads to the establishment of an oxygen-starved area, which tends to retard the oxidation of unburnt species. The high pyrolysis rate (cf.
Figure 8a) of heptane flame is conducive to abundant unburnt fuels, and a reduced pyrolysis zone below x/L
p = 0.8 of dodecane flame (cf.
Figure 8b) results in a significant reduction in unburnt hydrocarbons. The unburnt fuel exceeds CO and CO
2 concentrations in the oxygen-starved boundary layer, which prevents the forced convection-driven dispersion of unburnt species.
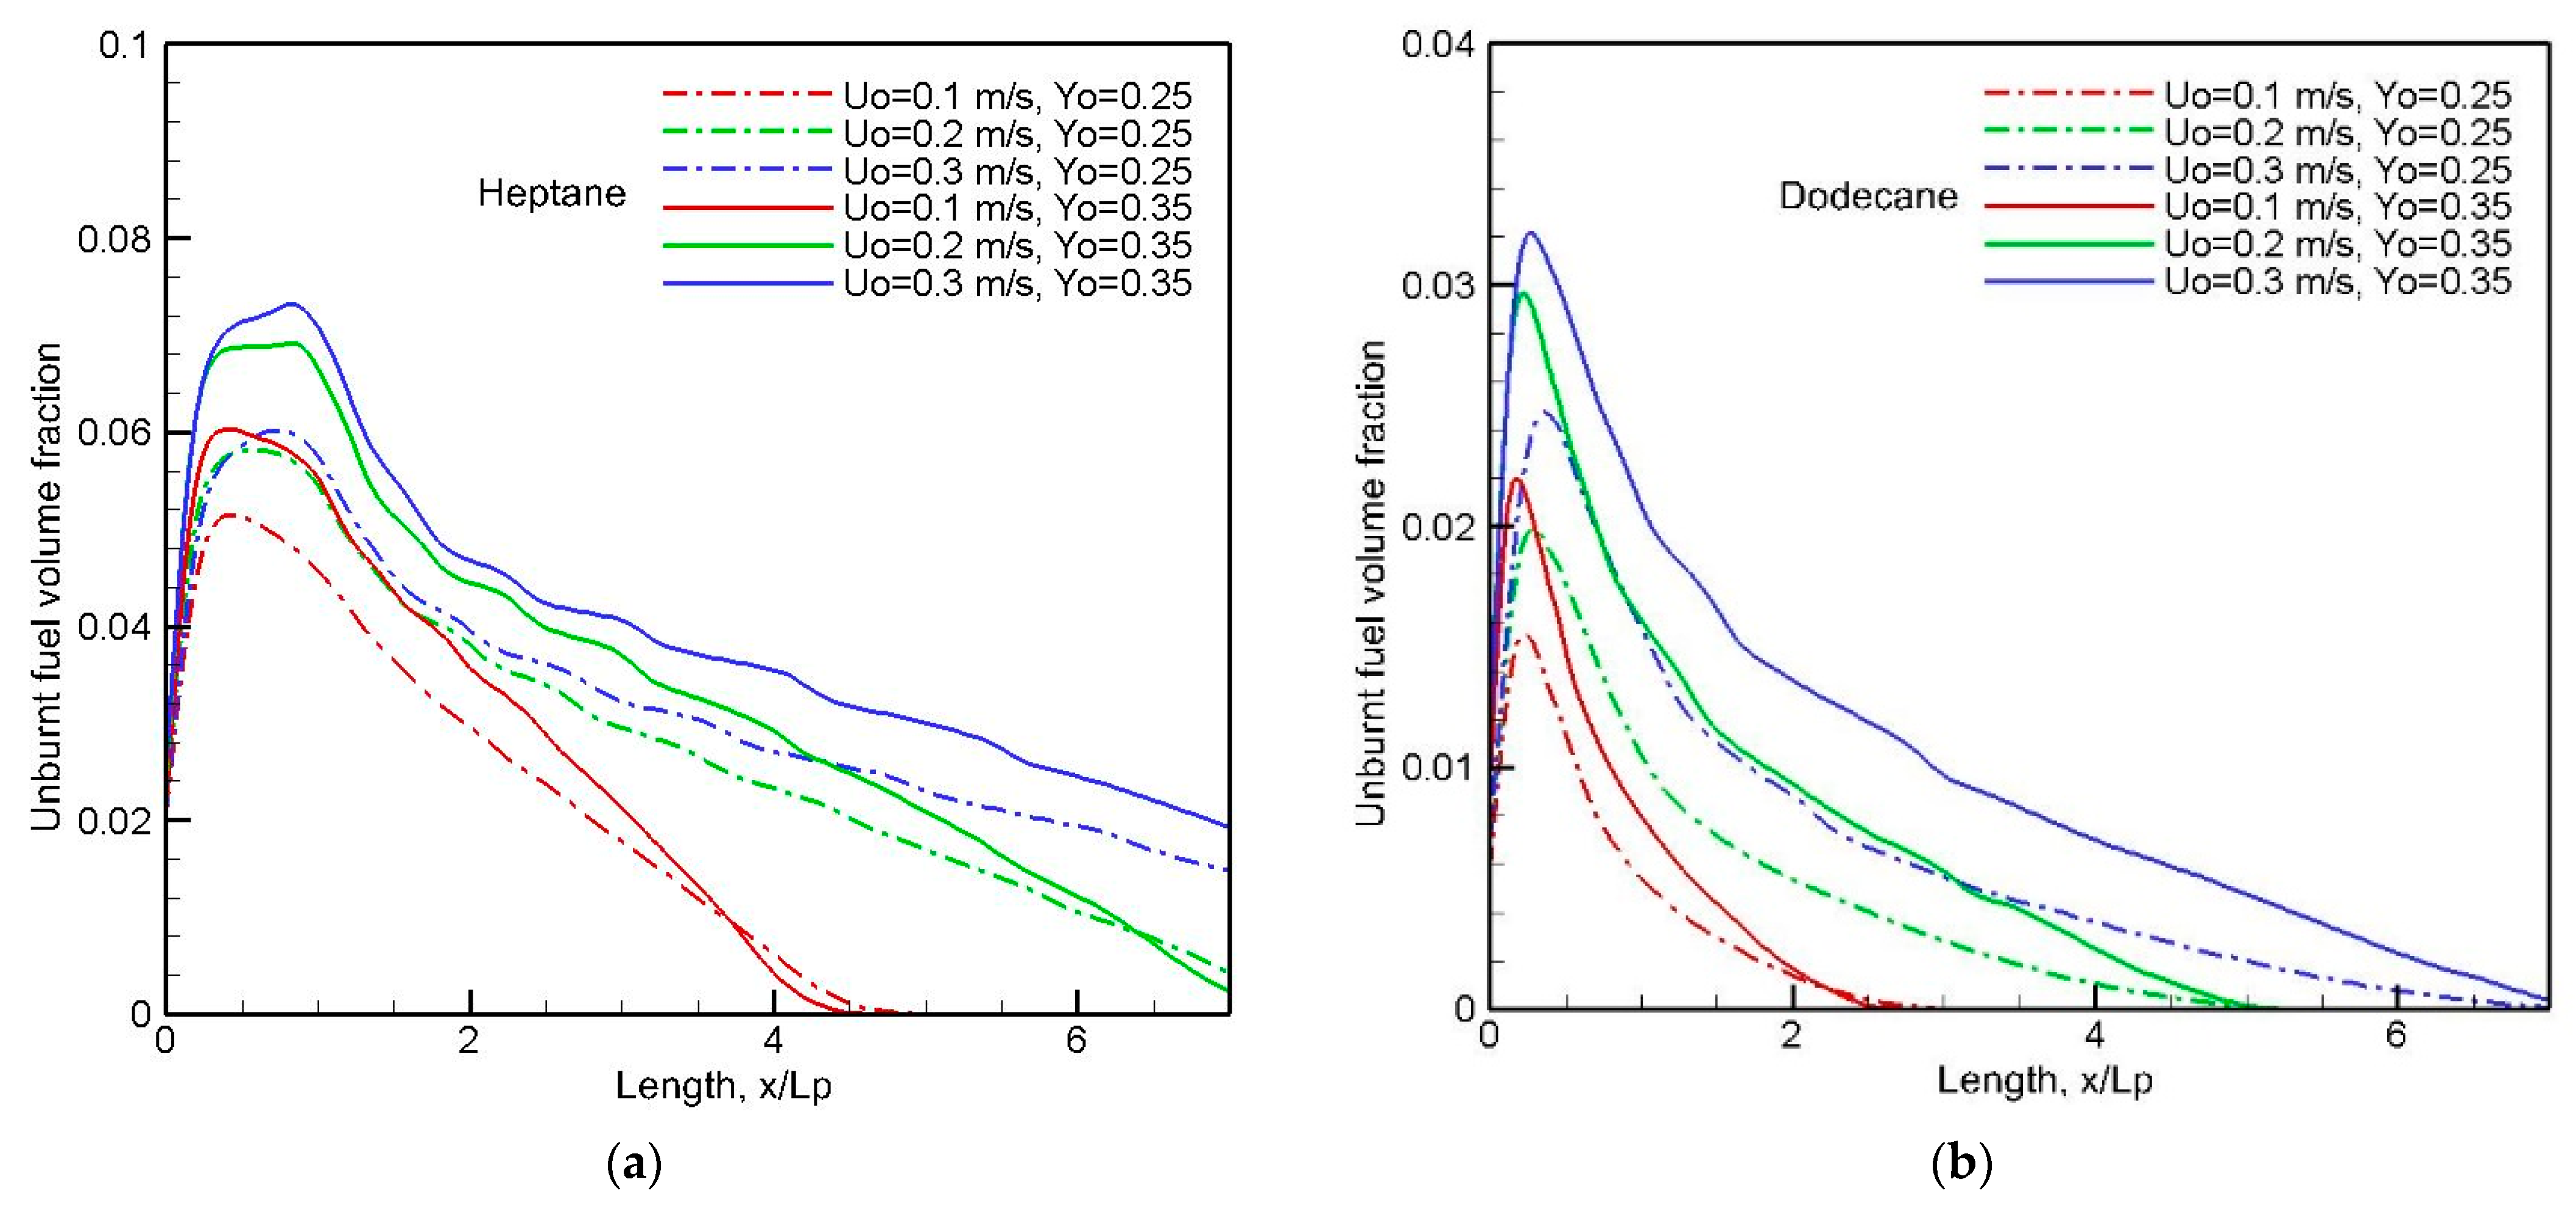
The evolution of the mean unburnt fuel as a function of fuel type, oxygen mass fraction and crossflow speed is illustrated in
Figure 24a,b. A peak of heptane flame takes place around the tailing edge at x/L
p = 1, and a peak of dodecane flame occurs near the leading edge. The unburnt fuel increases with a rise in both crossflow velocity and oxygen concentration; however, the response of the unburnt fuel concentration is less sensitive to a further increase of crossflow speed from 0.2 to 0.3 m/s. The unburnt fuel of the dodecane flame disappears downstream far away from x/L
p = 5 due to convective dilution over a reduced burning zone (x/L
p < 0.8). However, an abundance of unburnt fuel above 2% from the heptane flame is carried by the convective motion at a high crossflow speed. The decreasing slope downstream, as well as the peak in unburnt fuel concentration, depends significantly on the liquid fuel type associated with a boiling point.
5. Discussion
A sensitive augmentation of the pyrolysis rate of heptane (cf.
Figure 8a) by increasing the oxidizer flow speed and oxygen concentration leads to excessive unburnt fuel in the reactive boundary layer. Typically, the theoretical HRR derived from pyrolysis rate of liquid fuel is proportional to oxygen concentration and oxidizer flow speed. The previous work [
30] shows a monotone decrease in combustion efficiency and, as a result, in the effective HRR with an increase in oxidizer flow velocity or oxygen concentration. Therefore, a reduction in the effective HRR with a rise of U
0 and Y
o results in an accumulation of unburnt species (cf.
Figure 20,
Figure 21,
Figure 22 and
Figure 23) in the boundary layer due to a lack of oxygen (cf.
Figure 4). As a function of fuel type, roughly 65–90% of the pyrolysates contributes to the chemical reaction, and about 10–35% of the released fuel is transported by a forward forced convection. Therefore, a microgravity flame would represent a higher hazard due to excessive unburnt fuel compared to that on Earth [
5,
7].
Taking all the results together, the CO
2 (cf.
Figure 19) to CO (cf.
Figure 18) ratio is less than 3, instead of 10 from a buoyancy-controlled flame at Earth gravity [
5], and the unburnt C
mH
n (cf.
Figure 24) to CO (cf.
Figure 18) ratio is less than 2. This implies that unburnt volatiles such as CO and C
mH
n from microgravity flames exceed the corresponding concentration from turbulent buoyancy-induced flame [
7]. This is mainly attributed to a significant reduction in oxygen concentration to 2% in the boundary layer (cf.
Figure 4). According to reference [
31], from theoretical ignition criteria, an inflammation risk occurs if the unburnt fuel concentration is higher than the LFL (Low Flammability Limit) and the gas temperature is above the AIT (Auto-Ignition Temperature), as summarized in
Table 1 [
31].
In all the cases, the mean CO concentration (cf.
Figure 18) is below 4%, which is significantly lower than its LFL (cf.
Table 1) without an inflammation risk. At a more developed stage of diffusion flame, a mean concentration of unburnt hydrocarbons C
mH
n is above 4% for heptane flame (cf.
Figure 24a) and above 1% for dodecane flame (cf.
Figure 24b), which exceeds its corresponding LFL (cf.
Table 1). Moreover, the gas temperature of 900 °C (cf.
Figure 6a,c) in the pyrolysis zone exceeds the AIT during a sufficiently long time. However, the oxygen available, with a concentration below 2% in the boundary layer (cf.
Figure 4), is not enough to induce the inflammation of an excess in unburnt fuel that is higher than the LFL. At Earth gravity, the scientific accuracy and practical applicability of the proposed models were verified in confined nuclear facilities [
31]. Auto-ignition of the extracted smoke close to a stoichiometric fuel–air mixture was visually identified [
31] due to a sudden supply of fresh air with an oxygen concentration of 15%. Based on the theoretical ignition criteria, there is a significant risk of flame acceleration with a sudden supply in oxygen in a hot boundary layer where the major unburnt species are accumulated in a sufficient concentration. A rapid regression rate of liquid fuel over a flat burning surface at a high ventilation rate contributes to the most devastating fire scenario for fire safety in spacecraft environments. On board spacecraft in zero-gravity environments, one fire suppression strategy is to restrict ventilation or create an obstruction just upstream of a fire source. This allows one to significantly reduce the pyrolysis rate of liquid fuels and as a consequence, the concentration of unburnt gases below the LFL to avoid a critical risk of flame acceleration. In manned spacecraft, the air circulation rate significantly affects the concentration of toxic products. Variations in the air circulation system can be approximately taken into account by using a weighting factor for all the results (flame length, toxic species) between the oxidizer flow velocities.
6. Conclusions
The various fire scenarios in a weightless condition are taken into account as a function of ventilation rate, oxygen concentration and fuel type. The capabilities of the two soot models (LSP and Moss) are first evaluated through an ethylene microgravity flame, and the discrepancies between the prediction and the experiment are mainly in the post-combustion region due to neglecting soot oxidation via O and OH radicals. Nevertheless, a relatively good estimation of both the soot emission and the flame shape is obtained from the LSP model, and thus, this soot model is chosen for calculating the mass pyrolysis rate of the liquid fuels on which the flame behavior depends.
In the weightless condition, the impact of oxidizer flow speed, oxygen concentration and fuel type on soot emission, carbon monoxide and unburnt hydrocarbons seems worthy of remark. For the heptane flame, the volume fraction of the unburnt pyrolyzates exceeds 2% along a distance of x/Lp = 7 in the forward layer at a high oxidizer flow speed. For the dodecane flame, the volume fraction of the unburnt pyrolyzates decays quickly to 1% along a short distance of x/Lp = 5 thanks to a reduced pyrolysis zone. The extent in length of the unburnt volatiles such as soot, carbon monoxide and unburnt fuels at Yo = 0.35 is roughly 1.5 times that at Yo = 0.25. For the heptane flame, a rise in the oxygen mass fraction from 0.25 to 0.35 is conducive to an increase in soot concentration of about 25%. The unburnt hydrocarbons from the heptane flame increase by a factor of 2.3 times compared to those from the dodecane flame. The concentration of unburnt volatiles from heptane or dodecane microgravity flame exceeds the corresponding LFL, and the gas temperature in the pyrolysis zone is above the AIT. As a consequence, an accelerating flame may occasionally occur following auto-ignition of the unburnt pyrolyzates when a sudden supply of oxygen takes place.
In fact, a random phenomenon in space and time such as the auto-ignition of stratified unburnt pyrolyzates is not completely understood. The ignition processes of gas-phase combustion attached to a liquid fuel type are fundamentally controlled by transient chemical kinetic processes depending on temperature, thus greatly complicating the numerical modeling. Although, the global approach is not capable of reproducing ignition processes, it is useful for assessing a risk of flame acceleration when major unburnt pyrolyzates have accumulated in a sufficient concentration. The future investigation aims to use a detailed complex kinetics depending on gas temperature and consisting of a hundred species/reactions to fully resolve the ignition processes of unburnt fuel gases in an extremely small computation domain due to a prohibitive CPU time.


