Article

Assessment of Air Quality Perception and Its Effects on Users’ Thermal Comfort in Office Buildings

by
Candi Citadini de Oliveira
1,*,
Ricardo Forgiarini Rupp
1,2 and
Enedir Ghisi
1
1
Laboratory of Energy Efficiency in Buildings, Department of Civil Engineering, Federal University of Santa Catarina, Florianópolis 88037-000, SC, Brazil
2
International Centre for Indoor Environment and Energy, Department of Civil Engineering, Technical University of Denmark, 2800 Kongens Lyngby, Denmark
*
Author to whom correspondence should be addressed.
Submission received: 30 May 2021 / Revised: 4 September 2021 / Accepted: 25 November 2021 / Published: 14 December 2021
(This article belongs to the Special Issue The Impact of Climate Change on All Areas of Knowledge)

Abstract

:
Since people spend most of their time in indoor environments, the objective of this work was to study indoor air quality and its effects on users’ thermal comfort. Based on previous data from a building with a central air-conditioning system and two mixed-mode buildings located in the humid subtropical climate of Florianópolis, southern Brazil, statistical analyses were performed. Each user’s subjective answer obtained through a questionnaire was combined with the corresponding environmental conditions measured by instruments. Results showed that improvement in air quality was associated with the reduction of air temperature and humidity ratio. Also, there was a significant influence of thermal and humidity sensation on air quality satisfaction. Users felt more satisfied or neutral with air quality for being in thermal comfort, and not because of the CO2 concentration—which means that air quality perception is influenced by factors other than CO2. This study recommends implementing an air exchange device in split air-conditioners with air recirculation commonly used in mixed-mode buildings in Brazil. It is important to provide suitable indoor ventilation to reduce pollutant concentration, ensure good air quality and prevent respiratory diseases.

1. Introduction

Nowadays, it is estimated that people spend 60% to 90% of their time in indoor environments such as residences, educational institutions and offices [1,2,3]. In this way, it is important to study indoor air quality and its effects on thermal comfort since they are related to users’ satisfaction, performance and health [4,5,6,7,8]. In fact, research has shown that high concentrations of pollutants have direct and indirect adverse health effects since air-conditioned environments can contribute to respiratory and cardiovascular diseases [9,10].
Air quality is associated with physical, chemical and biological characteristics of indoor air, including the concentration of pollutants like carbon dioxide (CO2). It is known that high CO2 concentration in indoor environments is an outcome of human metabolism and lack of indoor air exchange—mainly due to the air recirculation by air-conditioners [9,11]. One of the main strategies that contribute to the reduction of pollutants concentration and improvement of air quality is suitable air circulation in order to allow air exchange between indoor and outdoor environments [12,13,14,15]. For this purpose, natural ventilation with portable air cleaners and mechanical ventilation systems with particle filters are strategies indicated for removing indoor air pollutants [9,13].
In this context, the relationship between environmental variables, air quality perception and thermal comfort has been researched in distinct places such as climatic chambers [16,17,18], classrooms [19,20,21], residences [22] and offices [23,24]—mostly in Europe, Asia and North America. Thus, the scarcity of analyses involving air quality in Brazil is noteworthy, so more studies are required in the country.
In general, works in climatic chambers found that high air temperature and humidity tend to worsen the air quality perception due to insufficient respiratory cooling [16,18]. In particular, the air inhaled by users was considered warmer, stuffy and less acceptable as temperature and humidity increased. On the other hand, air movement significantly improved air quality satisfaction and users’ thermal comfort; and the use of fans increased air movement and humidity acceptability, without causing discomfort due to dry eyes sensation [16,18]. Also, a study conducted in an educational building with a central air-conditioning system in China found that the indoor environmental quality was considered acceptable under conditions with lower air temperature, relative humidity and CO2 concentration means [21].
Research in offices with central air-conditioning systems in the United States evaluated the effect of air movement on air quality satisfaction for men and women, under low air movement environment [23]. Women felt more satisfied with air quality as air velocity increased, while the opposite was observed for men. A work in naturally ventilated office buildings in Germany verified a weak correlation between the seasons of the year and the indoor air quality perception [24]. However, the authors noticed that the air quality was slightly influenced by dry air perception in winter, while it was slightly related to indoor air temperature satisfaction in summer.
In naturally ventilated houses in India, a weak correlation between indoor air quality perception and thermal sensation and comfort was identified [22]. It was noted that most of the users considered the air quality neutral, despite high outdoor pollutants concentration—which may be explained by the fact that occupants were accustomed to this condition. In addition, research found that users less satisfied with indoor environmental quality had lower learning performance in classrooms [20,21].
The comparison of studies showed that air quality could be influenced by different factors, such as environmental conditions, pollutants concentration and ventilation type. In this way, it is important to carry out further investigations relating to environmental variables, air quality perception and users’ thermal comfort.
The aim of this work is to assess the occupants’ perception related to indoor air quality and its effects on thermal comfort based on data from office buildings located in Florianópolis, southern Brazil. The specific objectives of this study are (1) to evaluate the impact of environmental variables on air quality satisfaction, (2) to analyse the influence of air quality perception on occupants’ thermal comfort, and (3) to raise awareness of the importance of the suitable indoor ventilation to ensure good air quality.

2. Materials and Methods

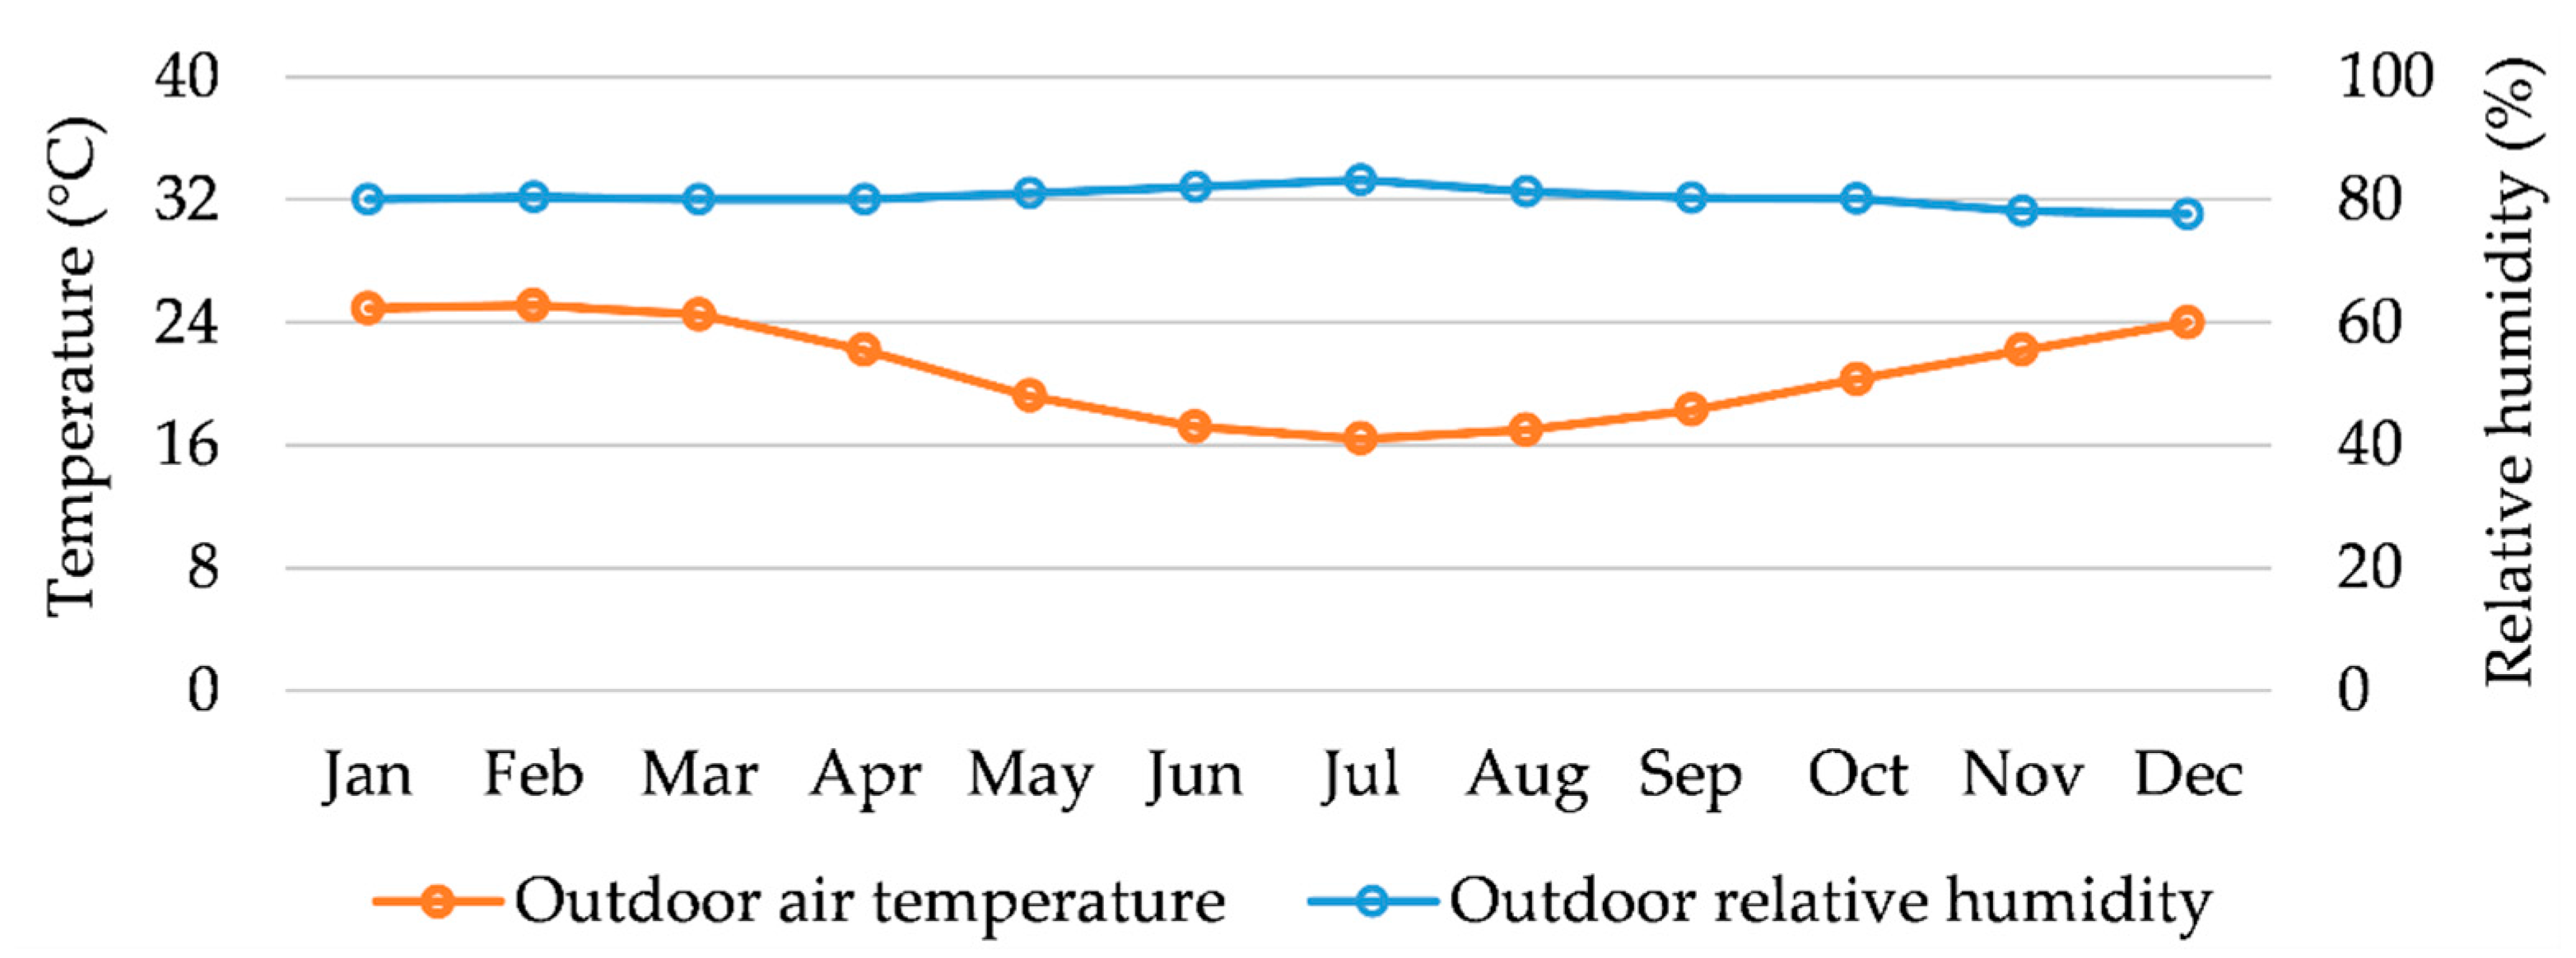
2.1. Study Contextualisation

In this study, analyses were based on data collected in a building with a central air-conditioning system (ACB) and two mixed-mode buildings (MMB1 and MMB2), in which there was alternation between natural ventilation (NV) and air-conditioning (AC) modes according to the users’ preference. All buildings are made of reinforced concrete and have open office environments. Mixed-mode buildings were built in the 1990s, and the building with a central air-conditioning system was built in 1979. The total built area of MMB1 is 6.200 m2, MMB2 is 3.090 m2 and ACB is 27.432 m2. In all buildings, users were free to choose their clothing and there were individual portable fans on some workstations, controlled by the occupants.
The three buildings are located in Florianópolis, southern Brazil. According to the Köppen-Geiger classification [25], the climate is classified as Cfa (humid subtropical climate). The city has hot summers and mild winters, with annual mean outdoor air temperature equal to 20.9 °C, varying from 16.4 °C in July to 25.1 °C in February. Florianópolis is located on an island in the Atlantic Ocean, and the air humidity is high throughout the year, with annual mean outdoor relative humidity equal to 80.4%. Figure 1 shows the mean outdoor air temperature and outdoor relative humidity.
Microclimate stations were used to measure air temperature, globe temperature, air velocity and relative humidity (recorded at five-minute intervals) at 0.60 m from the floor level and near the geometric centre of the rooms, following ASHRAE 55 recommendations [27]. A portable thermo-anemometer was also used for spot measurements of air temperature and air velocity near the air vents of the air-conditioning system, the windows and the portable fans. A CO2 analyser measured the concentration of indoor carbon dioxide at 1.5 m from the floor level. The sensor was placed between 1.5 and 2.0 m from people and walls, according to ISO 16000-1:2004 [28] and ISO 16000-26:2012 [29].
At the same time, subjective data were obtained from electronic questionnaires with general questions about users’ characteristics and questions about thermal, air movement, air humidity and air quality perception. The questionnaires were applied to occupants every 20 min five times during a work shift. Clothing insulation and metabolic rate were estimated according to ASHRAE 55 [27]. Data were collected in situ from April 2015 to March 2016 and covered all seasons, including different environmental characteristics that better represent the climatic reality during the year. Further information on field data collection can be found in [30].

2.2. Statistical Analyses

Originally, each subjective answer of a participant at a given time was combined with the environmental conditions measured at the time of the response. Based on this, the relationship between environmental and subjective variables was assessed through statistical analyses, such as linear regressions, correlations and bar charts. In this work, absolute humidity was considered in all analyses involving humidity, instead of relative humidity [31,32,33]. ISO 7726:1998 [34] states that absolute humidity can be obtained from air temperature and relative humidity measurements, and one way of expressing it is the humidity ratio.
Table 1 shows the parameters and corresponding scales for the questions and answers in the questionnaire. The scales were based on the work [35] and tested in a pilot study. It is noteworthy that air quality perception refers to users’ satisfaction with air quality in their workplaces. Thus, occupants unsatisfied with air quality assessed the problems “Air is stuffy”, “Air is not clean” and “Air is odorous”, which have a seven-point scale: −3 (“It is a big problem”) to +3 (“It is a small problem”), and the extra option “Not” (“It is not a problem”).

3. Results and Discussion

3.1. Data Overview

In order to evaluate the air quality perception and CO2 concentration in indoor environments of office buildings in Florianópolis, 870 environmental and subjective data were analysed.
In this study, we considered the air temperature (Ta), mean daily outdoor air temperature (Tout), globe temperature (Tg), air velocity (Va), relative humidity (RH), mean daily outdoor relative humidity (RHout), humidity ratio (Wa) and carbon dioxide concentration (CO2) (Table 2). In all buildings, the mean air temperature, globe temperature and air velocity were close to 24 °C and 0.1 m/s, respectively. Also, the mean outdoor air temperature and outdoor relative humidity were, respectively, lower and higher in mixed-mode buildings under natural ventilation operation. This indicates that natural ventilation was mainly used during the intermediate seasons (i.e., autumn and spring) and winter. In the fully air-conditioned building, there was a lower standard deviation of air temperature, which means a higher concentration of data around the mean. Furthermore, higher relative humidity and humidity ratio were observed in natural ventilation mode compared to air-conditioning mode, because of the air humidity reduction due to the use of air-conditioning [36].
Regarding the CO2 concentration, higher means and standard deviations were obtained in mixed-mode buildings operating with air-conditioning in comparison to natural ventilation mode and the building with a central air-conditioning system. This result is due to the indoor air exchange absence, mainly due to the air recirculation caused by split air-conditioners in mixed-mode buildings.
In all buildings, similar means were verified between users’ age, weight, height, BMI (Body Mass Index) and metabolic rate (Table 2). Otherwise, clothing insulation was higher in natural ventilation mode in comparison to air-conditioning mode. This result validates the preponderance of natural ventilation use in intermediate seasons and winter (i.e., lower temperatures, so more clothing insulation), whereas the air-conditioning mode was predominantly used in summer (i.e., higher temperatures, so less clothing insulation). None of the buildings had an artificial heating system.

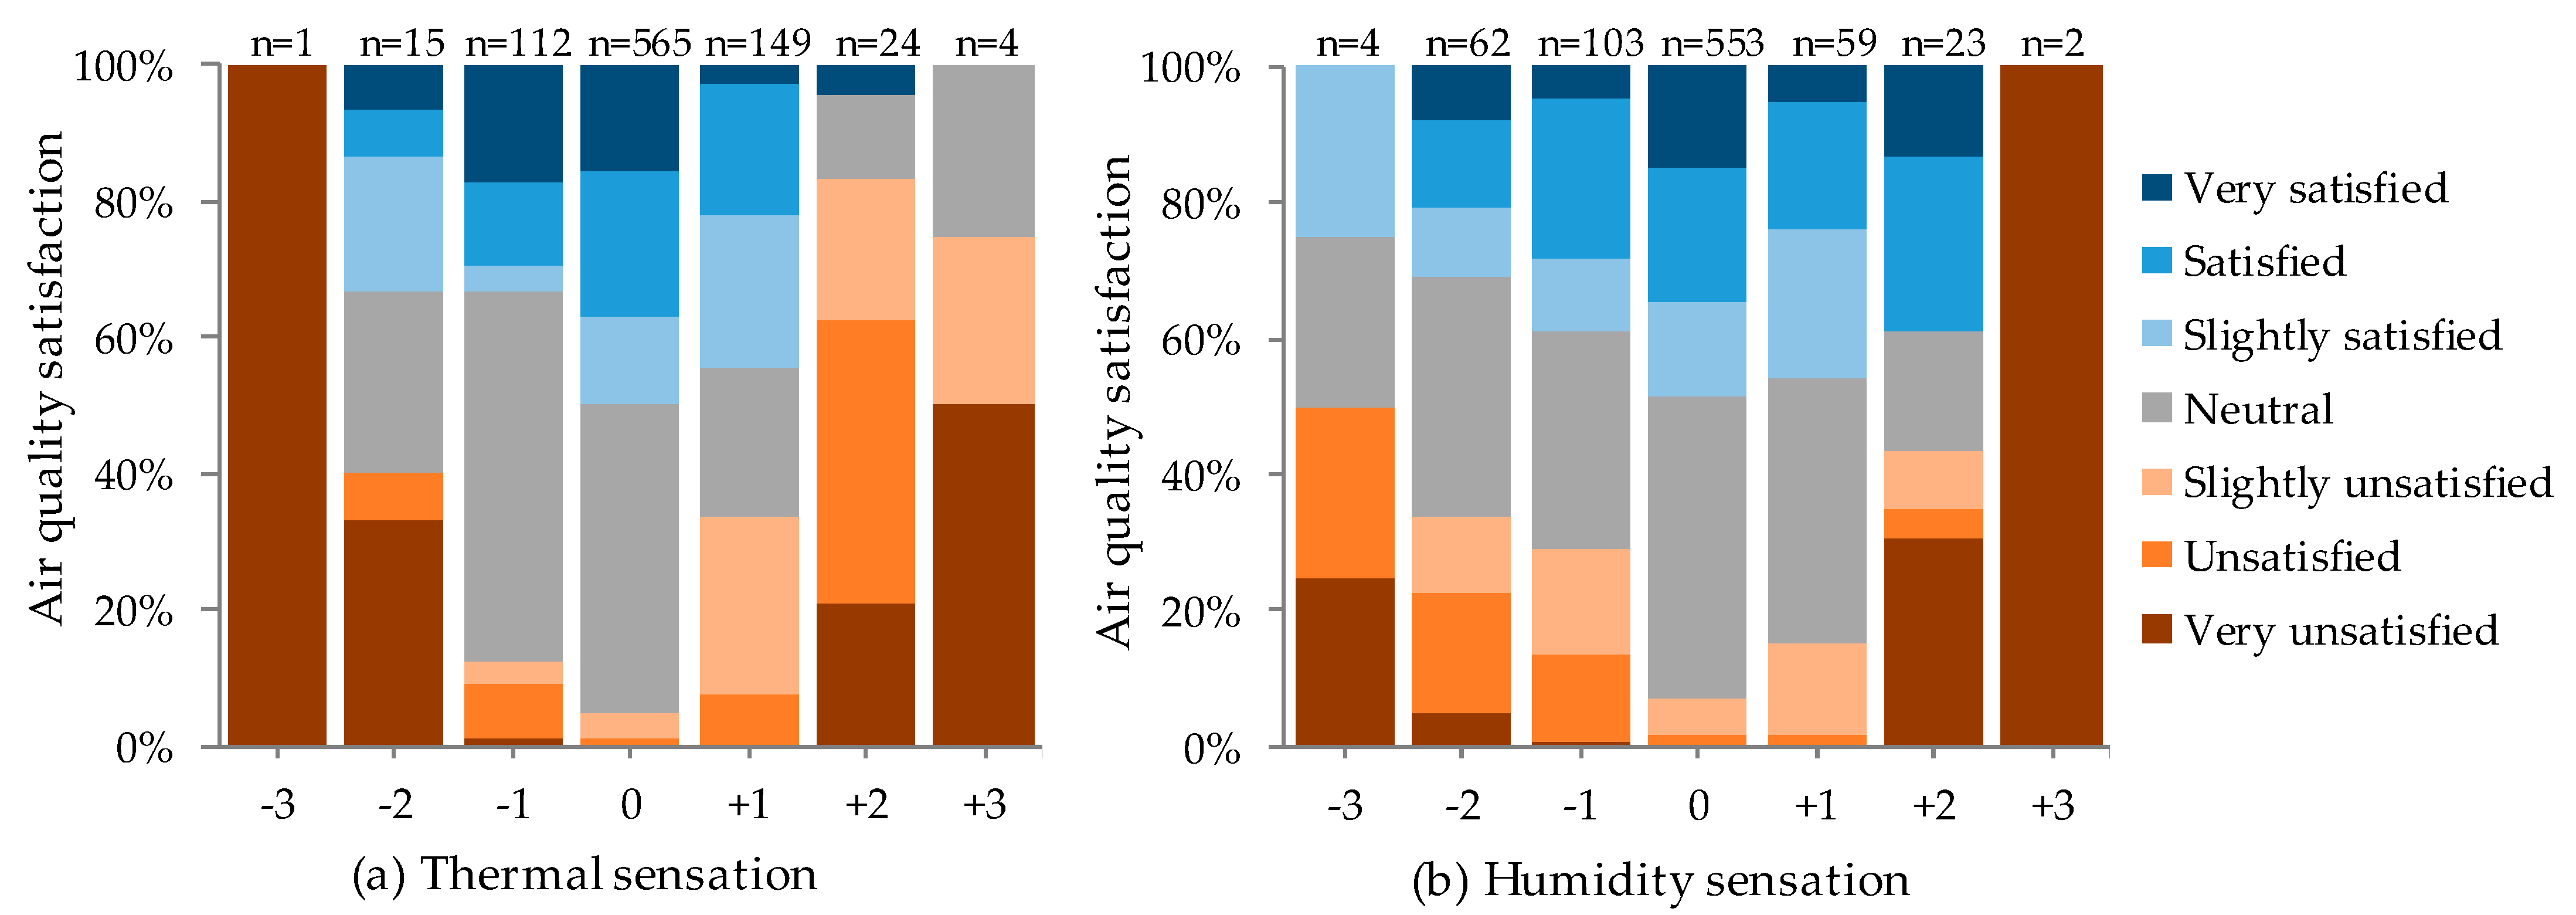
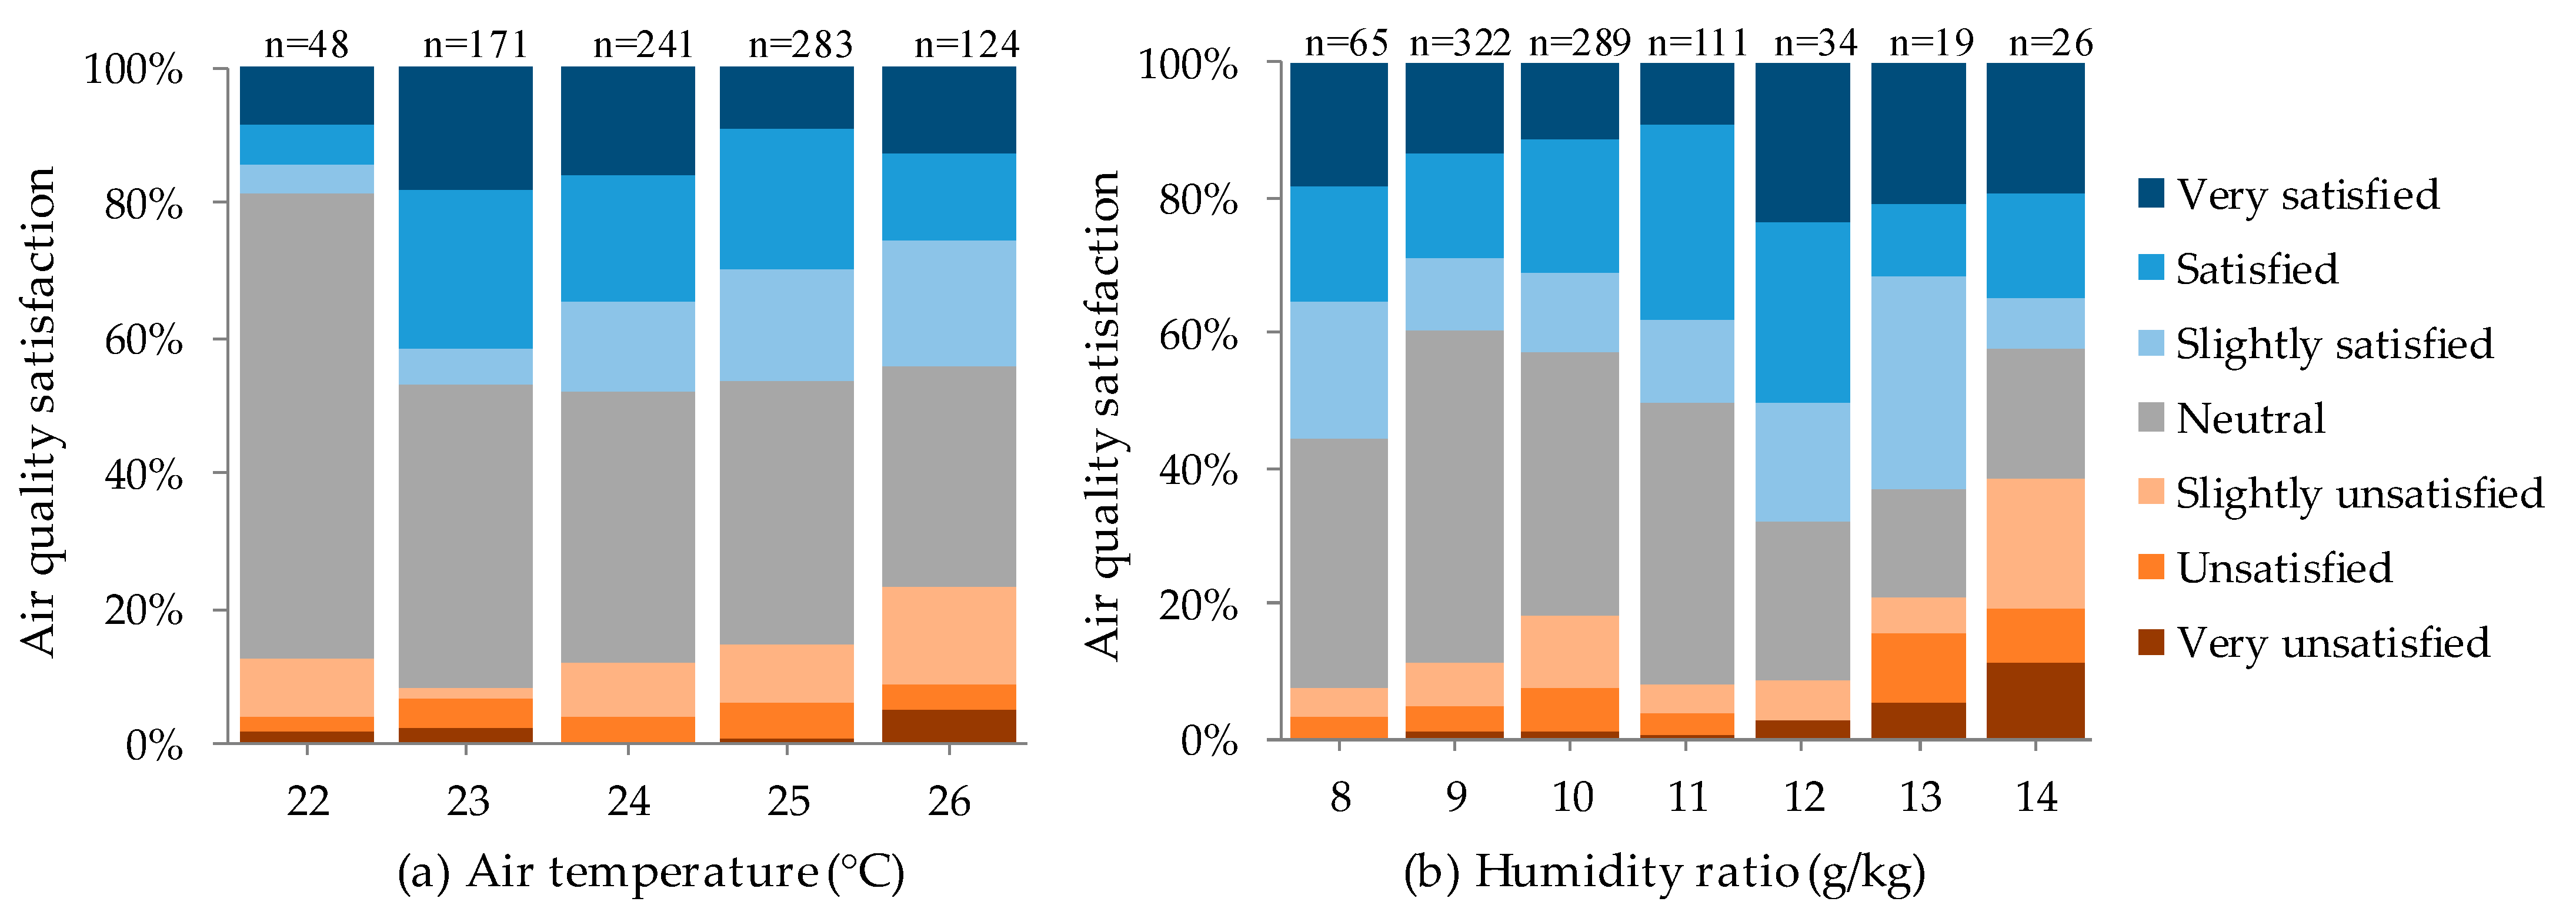
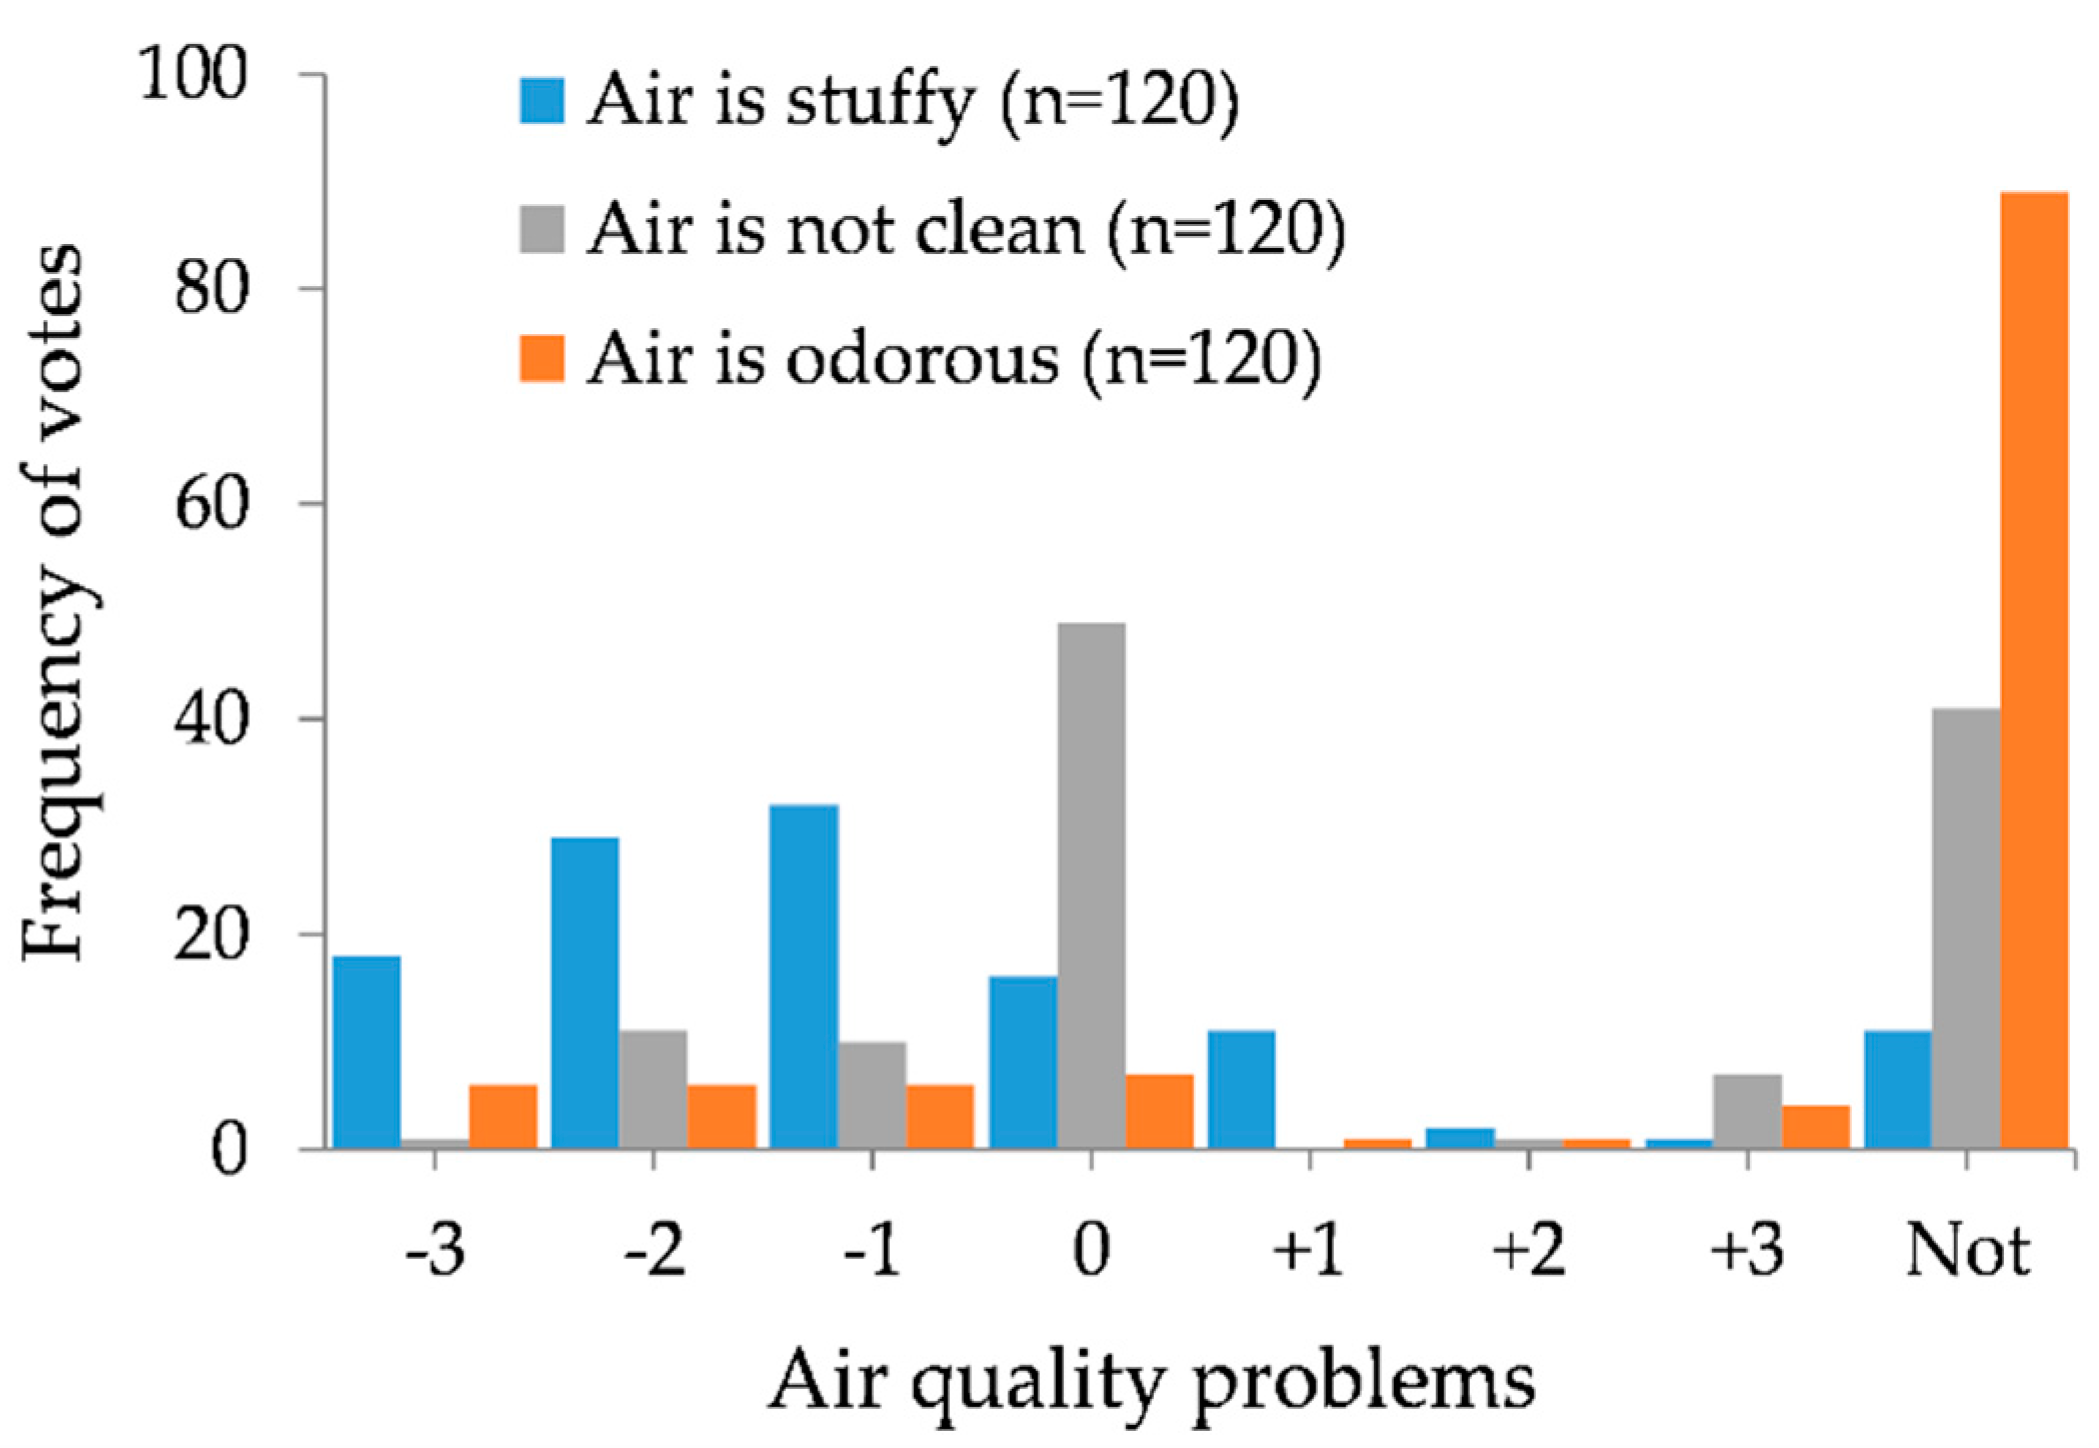
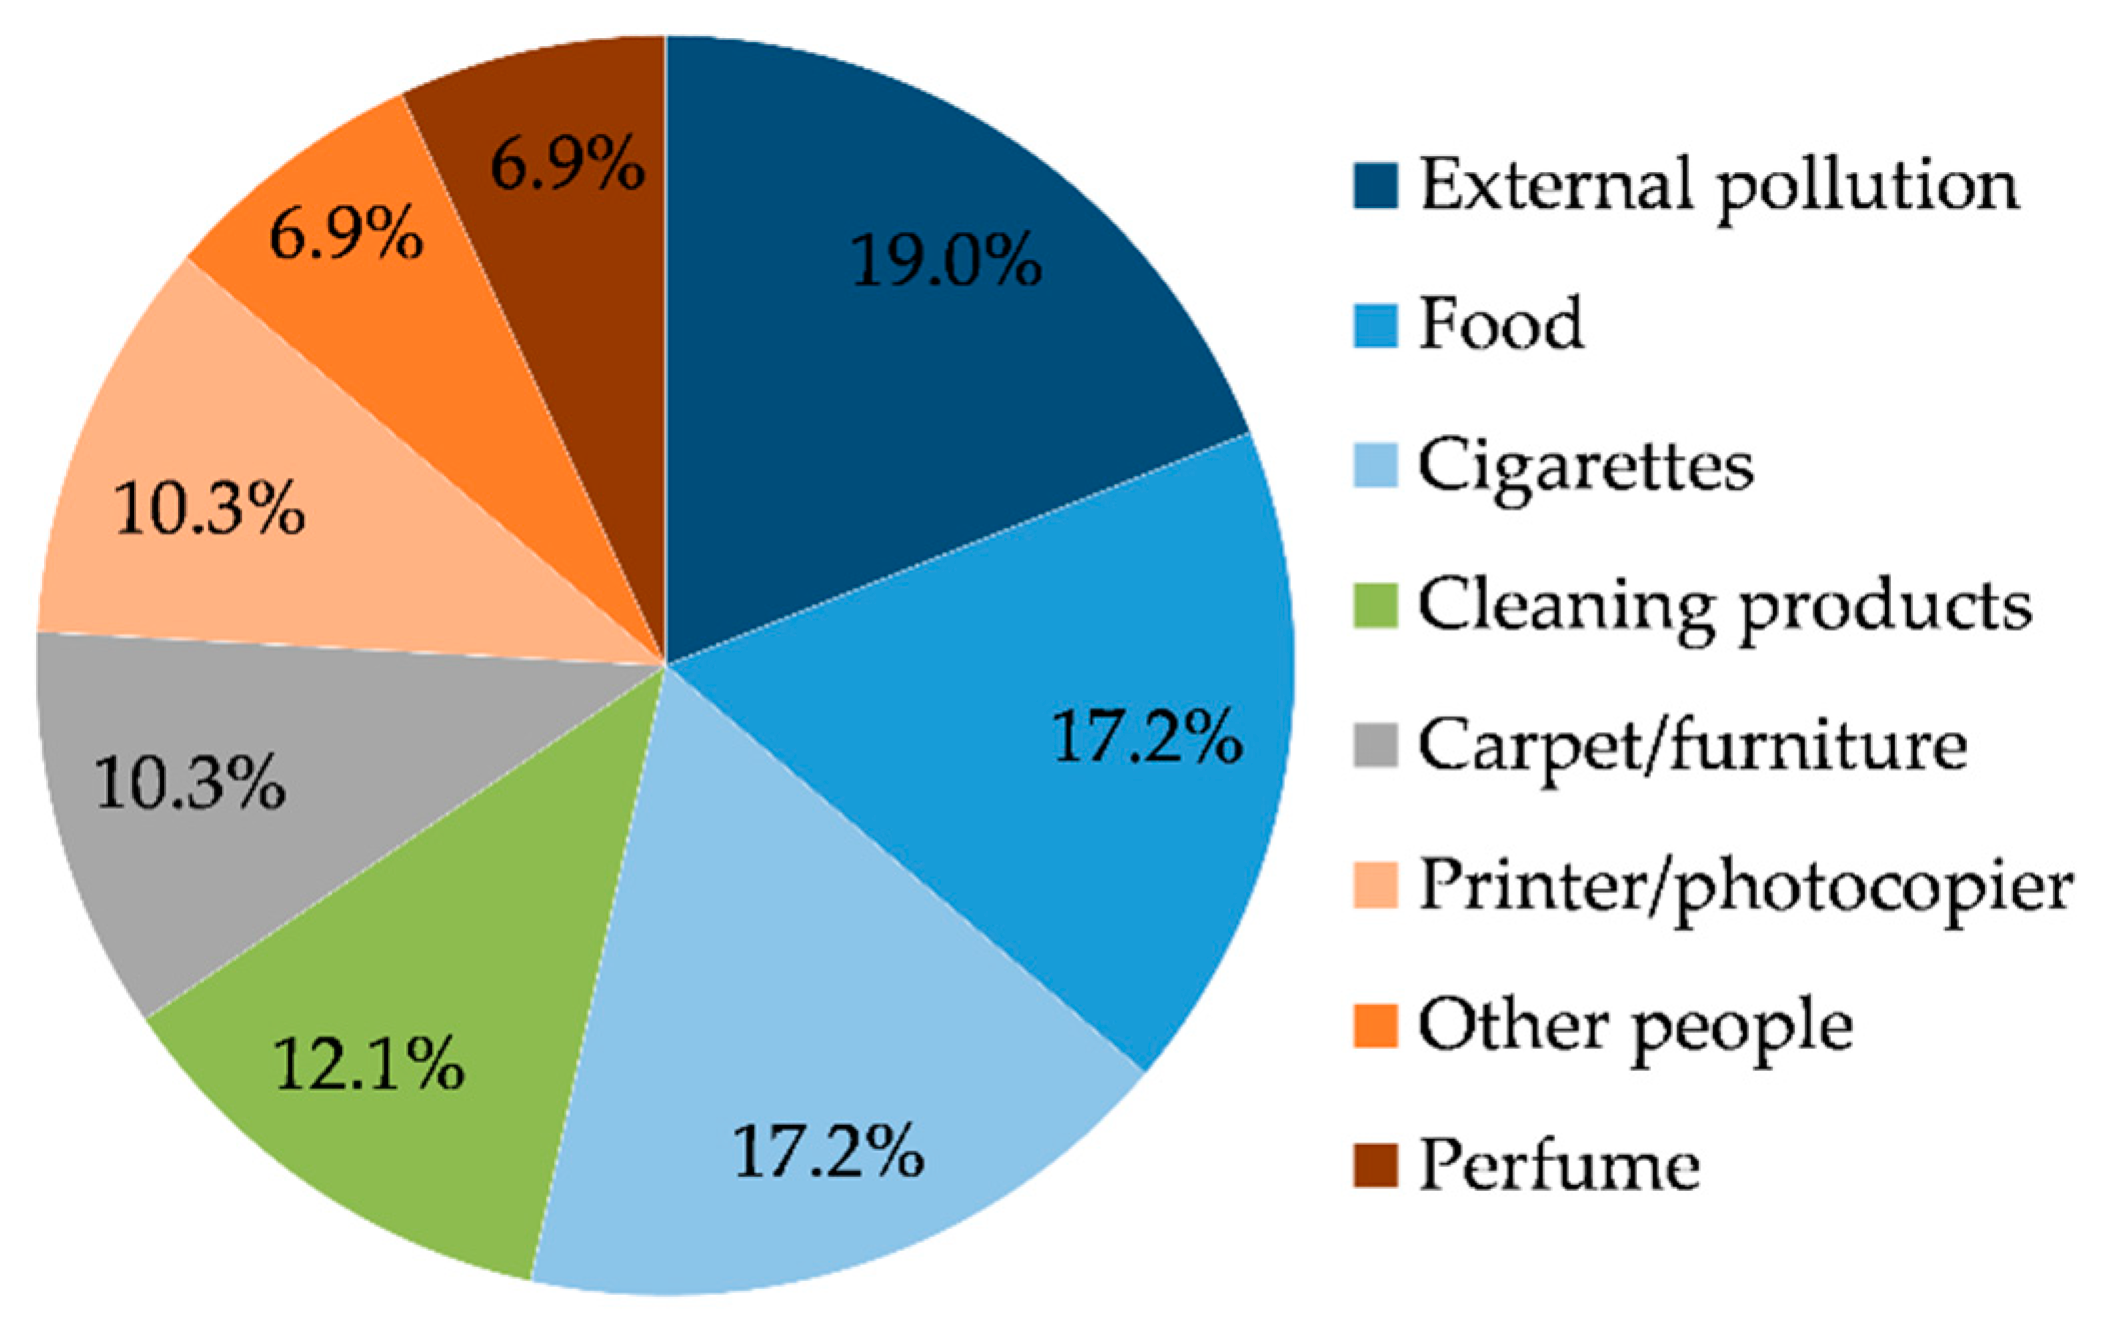
3.2. Air Quality Satisfaction

Figure 2 and Figure 3 show the distribution of air quality satisfaction votes according to environmental and subjective variables related to air temperature and humidity, considering data from all buildings. The intervals of air temperature and humidity ratio with less than ten observations were not considered in the corresponding analyses. In general, there was a slight tendency to increase air quality dissatisfaction and reduce air quality neutrality as increased air temperature and humidity ratio—except for 11 g/kg and 12 g/kg, which had a low percentage of dissatisfaction votes. Similar results were obtained by [16,17,18]. The highest percentages of users satisfied with air quality occurred for air temperature equal to 24 °C (48.1% satisfied) and humidity ratio equal to 12 g/kg (67.7% satisfied) (Figure 2). The regressions between the environmental variables and the air quality satisfaction were significant for air temperature (p < 0.05) and non-significant for humidity ratio (p > 0.05).
Regarding the subjective variables, the votes related to the response “I do not know how to answer” were not included in the analysis of humidity sensation. For subjective votes close to neutral (between −1 and +1), air quality was considered predominantly neutral or satisfactory. On the other hand, extreme subjective votes were associated with high air quality dissatisfaction—above 40% in most cases (Figure 3). Regressions between thermal and humidity sensation and the air quality satisfaction were significant (p < 0.05), so there was a significant influence of subjective variables on air quality perception.
Similar analyses assessed the distribution of air quality satisfaction votes according to thermal, air movement and humidity acceptability. The acceptability condition was related to the predominance of neutrality or satisfaction with air quality (above 90%), while unacceptability was associated with greater air quality dissatisfaction (above 60%).
Table 3 shows the distribution of air quality satisfaction votes according to the building ventilation type for users in thermal comfort and discomfort. Most of the users considered the air quality neutral or satisfactory for thermal comfort conditions, with less than 10% of dissatisfaction votes. By contrast, occupants in thermal discomfort evaluated the air quality neutral or unsatisfactory, with a low percentage of satisfied users. The fully air-conditioned building had the highest percentage of air quality satisfaction for users in thermal comfort and discomfort. Thus, there was a significant influence of air quality perception on users’ thermal comfort.
A similar analysis evaluated the distribution of air quality satisfaction according to the season. It was found that in all seasons, less than 20% of the users considered air quality unsatisfactory. The highest percentages of users satisfied with air quality occurred in summer (70.4%) and autumn (72.0%).
Figure 4 shows the frequency of votes of the air quality problems “Air is stuffy”, “Air is not clean” and “Air is odorous”, assessed by occupants unsatisfied with air quality. The frequency of votes indicating a big problem was much higher than those considering a small problem for the “Air is stuffy” problem. Also, dirty air perception was classified as neutral by the majority of votes in this category. Different than expected, the existence of odour was not classified as a problem by 74.1% of the occupants. The causes of “Air is odorous” problem were investigated, and users were able to choose more than one option per answer (Figure 5). The main reasons that contributed to the problem were the smell of outdoor pollution, food and cigarettes. Otherwise, the factors that contributed less were the smell of other people and perfume.

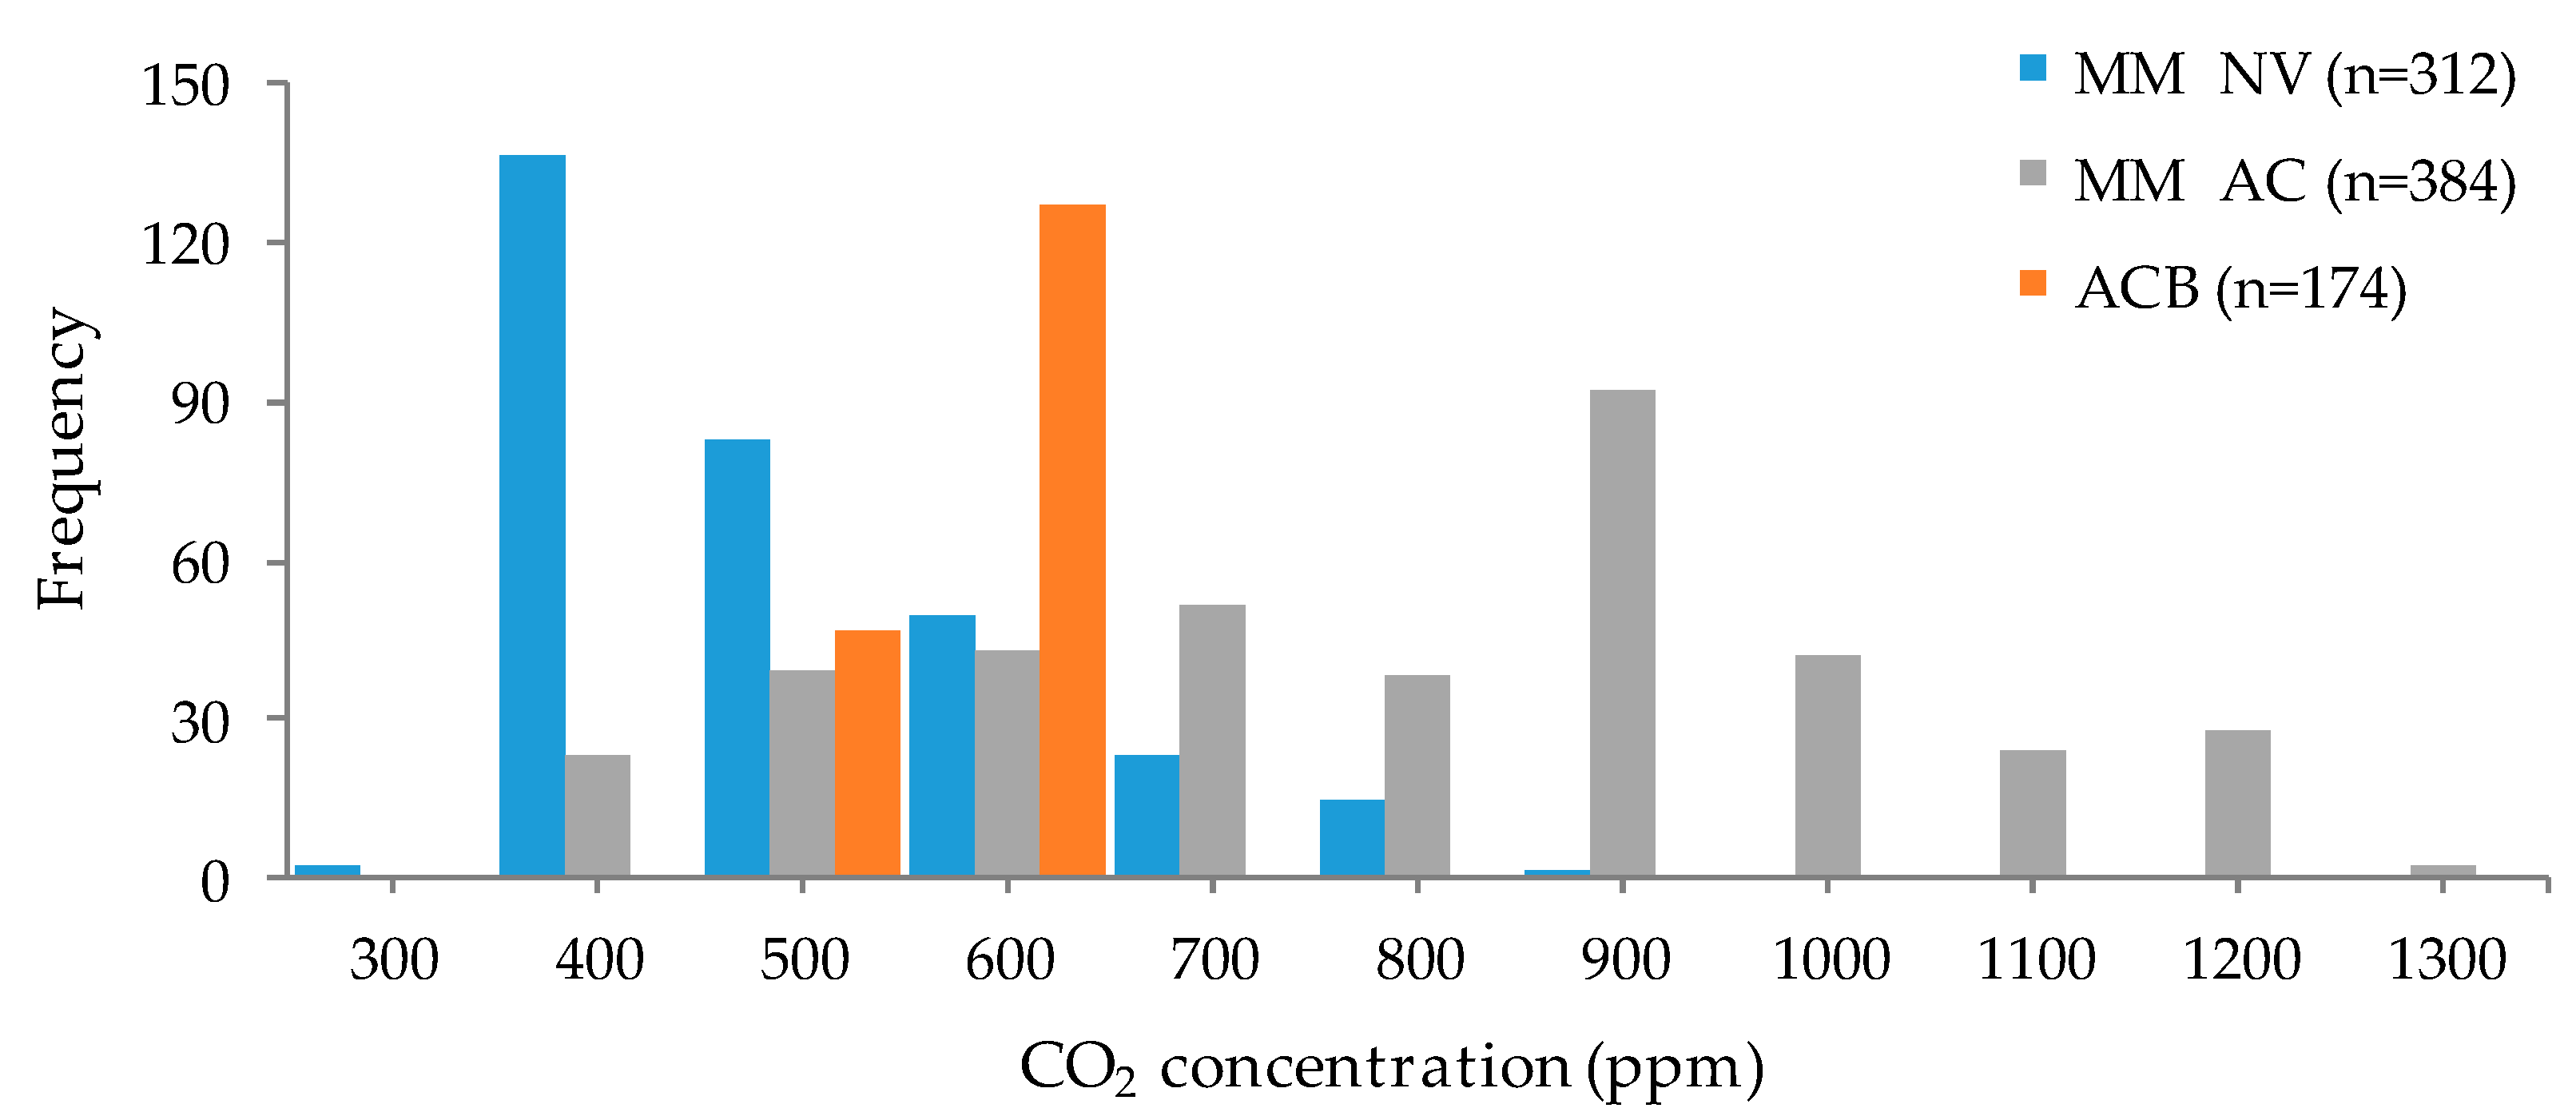
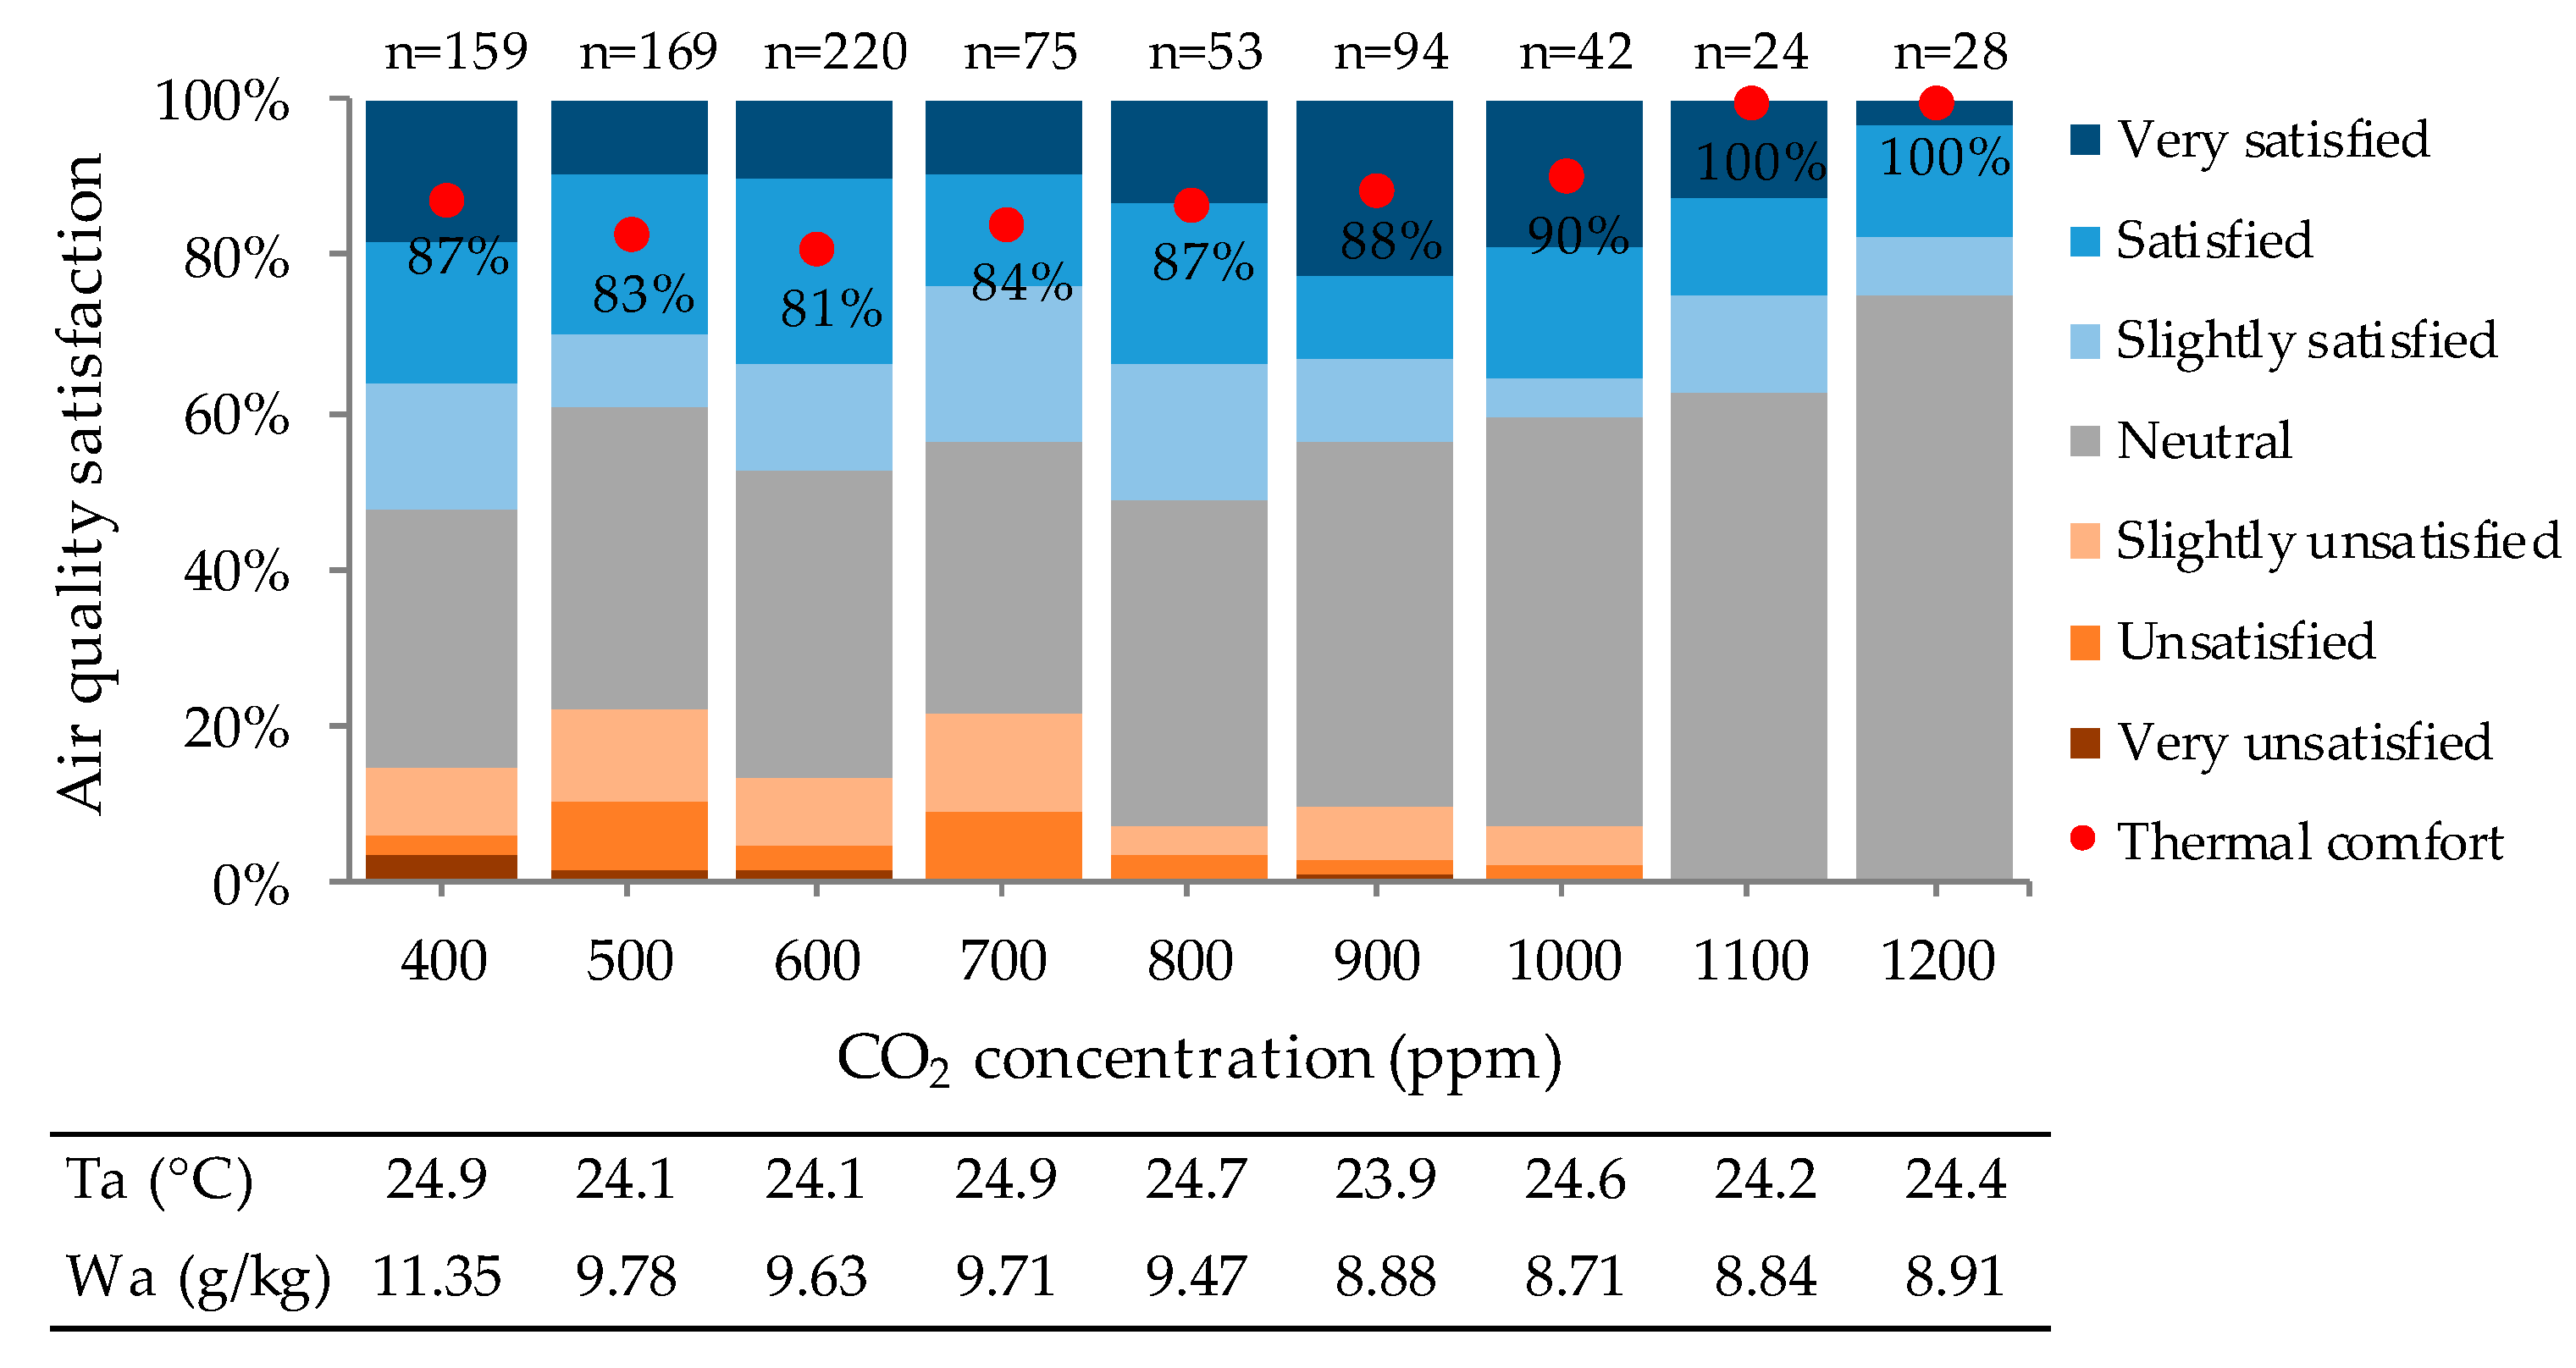
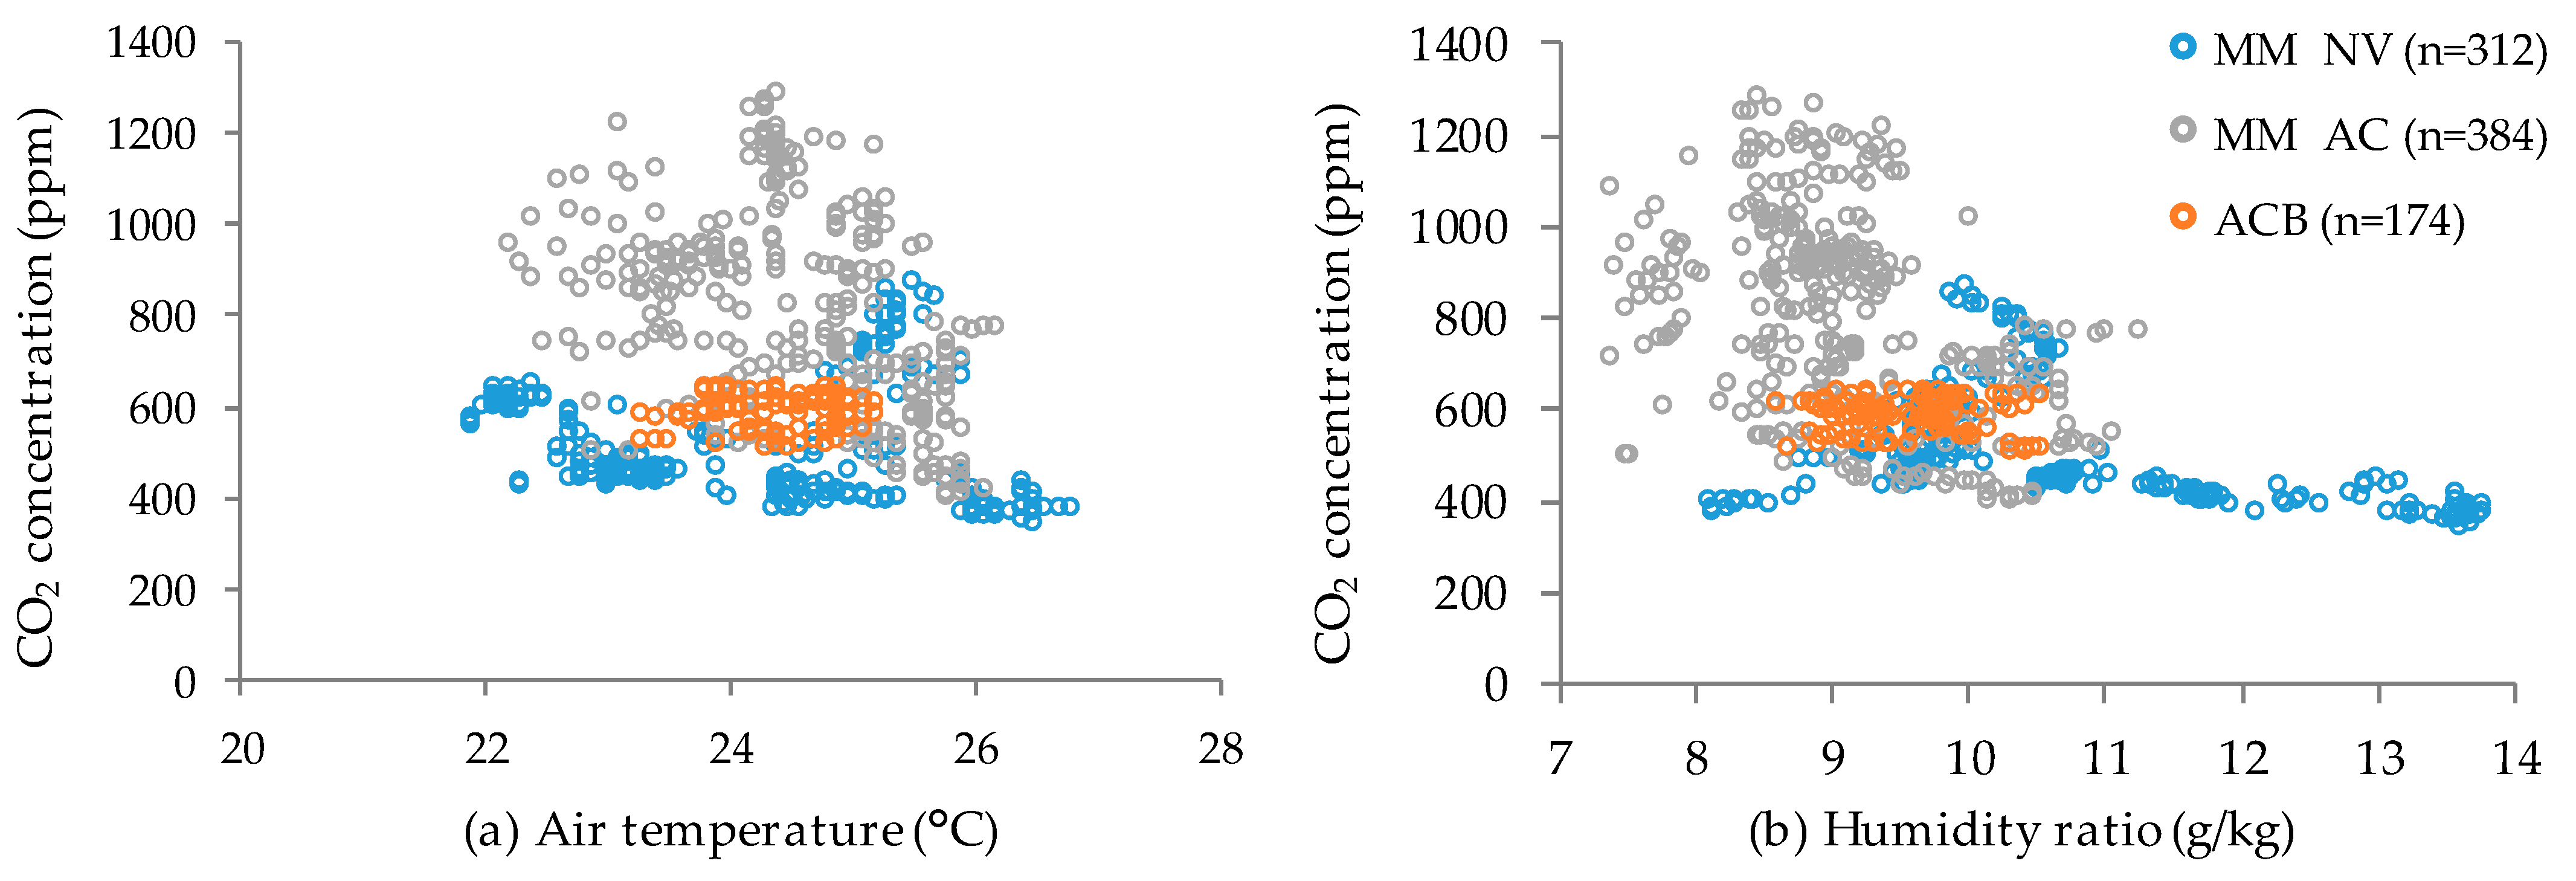
3.3. CO2 Concentration

Figure 6 shows the frequency of indoor CO2 concentration (ppm), according to the building ventilation type. In mixed-mode buildings, the indoor CO2 concentration varied between 300 and 900 ppm (natural ventilation mode) and 400 and 1300 ppm (air-conditioning mode). The indoor CO2 concentrations were about 500–600 ppm in the fully air-conditioned building. Thus, the CO2 concentration range was wider and higher in mixed-mode buildings in comparison to the fully air-conditioned building—as obtained by [19]. It is noteworthy that the CO2 concentration in mixed-mode buildings under natural ventilation operation was predominantly lower compared to other building ventilation types.
In general, the required ventilation rate and CO2 concentration are specified as adequate indoor air quality criteria, although there is no common index according to national and international standards [5]. In Brazil, ANVISA Resolution 09/2003 [37] specifies 1000 ppm, i.e., 0.1% of the air composition, as the maximum recommended CO2 concentration in shared air-conditioned environments. In this study, mixed-mode buildings in air-conditioning mode had high concentration of indoor pollutants, exceeding the recommended limit of 1000 ppm. On the other hand, although there was high energy consumption due to the continuous air-conditioning operation (the windows were sealed), the building with a central air-conditioning system had an air exchange system, which guaranteed CO2 concentration below the recommended limit. Therefore, the implementation of an air exchange device in split air-conditioners used in Brazilian mixed-mode buildings is highly recommended.
Comparing CO2 concentrations for each season, higher mean and standard deviation were obtained in summer (774 ± 214) compared to winter (516 ± 77), with moderate concentration in intermediate seasons (582 ± 195). Thus, the lowest CO2 means occurred in seasons with a predominant use of natural ventilation in mixed-mode buildings, confirming the importance of ventilation to reduce indoor air pollutants. Similarly, studies carried out on residential buildings located in a temperate climate in northern China [13] and Mediterranean and continental climates in Spain [38] also found lower CO2 concentrations when the buildings operated with natural ventilation.
Correlations between air temperature, air velocity and humidity ratio and the CO2 concentration were performed for each building ventilation type (Figure 7). Higher air temperature and humidity ratio were related to lower CO2 concentration in mixed-mode buildings in both operation modes. Also, higher air velocity was related to lower CO2 concentration in mixed-mode buildings under natural ventilation—as expected, because air movement increases pollutants dispersion, reducing CO2 concentration indoors [39]. By contrast, in air-conditioning mode the CO2 concentration was higher as air velocity was greater since there was air recirculation indoors. Some high CO2 concentration in mixed-mode buildings operating with natural ventilation, which occurred when the windows were closed (winter), can be seen. In this case, there was no adequate ventilation of the indoor environments, causing a higher CO2 concentration. Thus, it is important to promote the use of air exchange through mechanical ventilation during these months.
In the building with a central air-conditioning system, air temperature and air velocity were not correlated with the CO2 concentration, while higher humidity ratio was related to lower CO2 concentration (Figure 7). The regressions between the environmental variables and CO2 concentration were significant (p < 0.05), except for air temperature and air velocity in the fully air-conditioned building (p > 0.05). It is noteworthy that the building with a central air-conditioning system largely concentrated this in the centre since it comprises artificial environments with higher control of the environmental conditions.
Similar analyses involved correlations between CO2 concentration and thermal, air movement and humidity sensation, for each building ventilation type. Except for a very weak correlation between CO2 and air movement and humidity sensation in mixed-mode buildings operating with air-conditioning (p < 0.05 and R2 = 0.01), all other correlations were non-significant (p > 0.05).
Figure 8 shows the distribution of air quality satisfaction votes, thermal comfort and mean air temperature and humidity ratio according to CO2 concentration (intervals with less than 10 observations were not taken into account). There was little variation in air quality perception as CO2 concentration increased, with no clear trend between these variables. At high CO2 concentration, there was a higher percentage of neutral votes, decreased air quality satisfaction and absence of air quality dissatisfaction. An increase in CO2 concentration was related to a reduction in mean humidity ratio and an increase in thermal comfort, indicating that higher CO2 occurred when air-conditioners were turned on. Thus, the lack of air quality dissatisfaction may be related to high thermal comfort, even for high CO2 concentration.
The mean CO2 was higher for users satisfied or neutral with air quality (667 ± 224 ppm) compared to dissatisfied occupants (583 ± 155 ppm). This result is because users felt more satisfied or neutral for being in thermal comfort, and not due to higher CO2 concentration. In addition, all building ventilation types showed non-significant relationships (p > 0.05) between CO2 concentration and air quality satisfaction. Therefore, air quality perception was influenced by factors other than CO2.

4. Conclusions

This work assessed the air quality perception and its effects on users’ thermal comfort in office buildings located in Florianópolis, southern Brazil. A total of 870 data from a building with a central air-conditioning system and two mixed-mode buildings were considered. In general, an increase in air temperature and humidity ratio tended to slightly increase dissatisfaction with air quality. The highest percentages of users satisfied with air quality occurred for air temperature equal to 24 °C (48.1% satisfied) and humidity ratio equal to 12 g/kg (67.7% satisfied). This study was limited to air velocity values around 0.1 m/s, which made it difficult to carry out some analyses involving air movement.
A significant influence of thermal and humidity sensation on air quality perception was observed. Air quality was predominantly neutral or satisfactory for subjective votes close to neutral and unsatisfactory for extreme subjective votes. Similarly, the acceptability of environmental variables was related to the predominance of neutrality or satisfaction with air quality (above 90%), while unacceptability was associated with greater air quality dissatisfaction (above 60%). In all buildings, users in thermal comfort evaluated air quality as neutral or satisfactory (more than 90% of votes), and those in thermal discomfort considered the air quality mainly neutral or unsatisfactory. Thus, there was a significant influence of air quality perception on users’ thermal comfort. Air quality problems “Air is stuffy”, “Air is not clean” and “Air is odorous”, assessed by occupants unsatisfied with air quality, were considered mostly a big problem rather than a small problem. Also, the main reasons that contributed to the “Air is odorous” problem were the smell of outdoor pollution, food and cigarettes.
Mixed-mode buildings operating with split air-conditioning with air recirculation had high concentration of indoor pollutants, with some concentrations exceeding the ANVISA Resolution 09/2003 recommended limit of 1000 ppm in Brazil. By contrast, the building with a central air-conditioning system had an air exchange system, which guaranteed CO2 concentrations below the recommended limit. The lowest CO2 concentration in mixed-mode buildings occurred in seasons with a predominant use of natural ventilation, except in winter when the windows were closed. Therefore, this study recommends mechanical ventilation during winter and the implementation of air exchange devices to be used when split air-conditioners are in operation in mixed-mode buildings. Suitable ventilation of indoor environments is important to reduce pollutants concentration, ensure good air quality and prevent respiratory diseases. Therefore, this work warns about the urgent need to improve air exchange in Brazilian buildings.
In general, there was no clear trend between CO2 concentration and air quality satisfaction. Also, an increase in CO2 concentration was related to a humidity ratio reduction and a thermal comfort increase. Thus, users felt more satisfied or neutral with air quality for being in thermal comfort, and not because of CO2—which means that air quality perception is influenced by factors other than CO2. It is noteworthy that this work evaluated air quality only through users’ perception based on votes from an electronic questionnaire and measurements of indoor CO2 concentration. Therefore, it is important that further studies also consider the measurement of parameters related to air quality—such as indoor and outdoor CO2 concentration, the presence of fungi and bacteria, particulate matter, radon and ozone concentration, and volatile organic compounds—in order to obtain a complete assessment of indoor air quality. Furthermore, future research should be carried out in different building types in humid subtropical climates and assess users’ air quality perception separately for different occupants.

Author Contributions

C.C.d.O.: Conceptualization; methodology; formal analysis; data curation, writing—original draft preparation, review and editing. R.F.R.: Supervision; conceptualization; methodology; formal analysis; data collection, writing—review and editing. E.G.: Supervision; writing—review and editing. All authors have read and agreed to the published version of the manuscript.

Funding

This study was financed in part by the Coordenação de Aperfeiçoamento de Pessoal de Nível Superior—Brazil (CAPES)—Finance Code 001. The authors would like to thank the Brazilian National Council for Scientific and Technological Development (CNPq), for the financial support.

Institutional Review Board Statement

Not applicable.

Informed Consent Statement

Not applicable.

Data Availability Statement

Not applicable.

Acknowledgments

Not applicable.

Conflicts of Interest

The authors declare no conflict of interest.

References

  1. Brasche, S.; Bischof, W. Daily time spent indoors in German homes–Baseline data for the assessment of indoor exposure of German occupants. Int. J. Hyg. Environ. Health 2005, 208, 247–253. [Google Scholar] [CrossRef]
  2. European Commission. Indoor Air Pollution: New EU Research Reveals Higher Risks than Previously Thought. 2003. Available online: https://ec.europa.eu/commission/presscorner/detail/en/IP_03_1278 (accessed on 27 January 2020).
  3. Klepeis, N.E.; Nelson, W.C.; Ott, W.R.; Robinson, J.P.; Tsang, A.M.; Switzer, P.; Behar, J.V.; Hern, S.C.; Engelmann, W.H. The National Human Activity Pattern Survey (NHAPS): A resource for assessing exposure to environmental pollutants. J. Expo. Anal. Environ. Epid. 2001, 11, 231–252. [Google Scholar] [CrossRef] [PubMed] [Green Version]
  4. Che, W.W.; Tso, C.Y.; Sun, L.; Ip, D.Y.K.; Lee, H.; Chao, C.Y.H.; Lau, A.K.H. Energy consumption, indoor thermal comfort and air quality in a commercial office with retrofitted heat, ventilation and air conditioning (HVAC) system. Energy Build. 2019, 201, 202–215. [Google Scholar] [CrossRef]
  5. Khovalyg, D.; Kazanci, O.B.; Halvorsen, H.; Gundlach, I.; Bahnfleth, W.P.; Toftum, J.; Olesen, B.W. Critical review of standards for indoor thermal environment and air quality. Energy Build. 2020, 213, 109819. [Google Scholar] [CrossRef]
  6. Kim, J.; Hong, T.; Kong, M.; Jeong, K. Building occupants’ psycho-physiological response to indoor climate and CO2 concentration changes in office buildings. Build. Environ. 2020, 169, 106596. [Google Scholar] [CrossRef]
  7. Candas, V.; Dufour, A. Thermal Comfort: Multisensory Interactions? J. Physiol. Anthropol. 2005, 24, 33–36. [Google Scholar] [CrossRef] [Green Version]
  8. Bellia, L.; Alfano, F.R.A.; Fragliasso, F.; Palella, B.I.; Riccio, G. On the interaction between lighting and thermal comfort: An integrated approach to IEQ. Energy Build. 2021, 231, 110570. [Google Scholar] [CrossRef]
  9. Campos, E.C.; Guedes, B.A.M. Relatório Técnico: Impactos da Pandemia de COVID-19 Sobre Sistemas de ar Condicionado e Climatização [Technical Report: Impacts of COVID-19 Pandemic on Air-Conditioning Systems and Climatization]. 2020. Available online: https://www2.ufjf.br/noticias/wp-content/uploads/sites/2/2020/07/relatorio_tecnico__impactos_da_pandemia_de_covid_19__sobre_sistemas_de_ar_condicionado_e_climatizacao.pdf (accessed on 15 July 2020).
  10. Hoek, G.; Krishnan, R.M.; Beelen, R.; Peters, A.; Ostro, B.; Brunekreef, B.; Kaufman, J.D. Long-term air pollution exposure and cardio-respiratory mortality: A review. Environ. Health 2013, 12, 43. [Google Scholar] [CrossRef] [Green Version]
  11. Hussin, M.; Ismail, M.R.; Ahmad, M.S. Air-conditioned university laboratories: Comparing CO2 measurement for centralized and split-unit systems. J. King Saud Univ.—Eng. Sci. 2017, 29, 191–201. [Google Scholar] [CrossRef] [Green Version]
  12. Hamid, A.A.; Johansson, D.; Bagge, H. Ventilation measures for heritage office buildings in temperate climate for improvement of energy performance and IEQ. Energy Build. 2020, 211, 109822. [Google Scholar] [CrossRef]
  13. Liu, J.; Dai, X.; Li, X.; Jia, S.; Pei, J.; Sun, Y.; Lai, D.; Shen, X.; Sun, H.; Yin, H.; et al. Indoor air quality and occupants’ ventilation habits in China: Seasonal measurement and long-term monitoring. Build. Environ. 2018, 142, 119–129. [Google Scholar] [CrossRef]
  14. Park, D.Y.; Chang, S. Effects of combined central air conditioning diffusers and window-integrated ventilation system on indoor air quality and thermal comfort in an office. Sustain. Cities Soc. 2020, 61, 102292. [Google Scholar] [CrossRef]
  15. Sun, Y.; Hou, J.; Cheng, R.; Sheng, Y.; Zhang, X.; Sundell, J. Indoor air quality, ventilation and their associations with sick building syndrome in Chinese homes. Energy Build. 2019, 197, 112–119. [Google Scholar] [CrossRef]
  16. Toftum, J.; Jorgensen, A.S.; Fanger, P.O. Upper limits of air humidity for preventing warm respiratory discomfort. Energy Build. 1998, 28, 15–23. [Google Scholar] [CrossRef]
  17. Zhai, Y.; Arens, E.; Elsworth, K.; Zhang, H. Selecting air speeds for cooling at sedentary and non-sedentary office activity levels. Build. Environ. 2017, 122, 247–257. [Google Scholar] [CrossRef]
  18. Zhai, Y.; Zhang, H.; Zhang, Y.; Pasut, W.; Arens, E.; Meng, Q. Comfort under personally controlled air movement in warm and humid environments. Build. Environ. 2013, 65, 109–117. [Google Scholar] [CrossRef] [Green Version]
  19. Asif, A.; Zeeshan, M.; Zahanzaib, M. Indoor temperature, relative humidity and CO2 levels assessment in academic buildings with different heating, ventilation and air-conditioning systems. Build. Environ. 2018, 133, 83–90. [Google Scholar] [CrossRef]
  20. Jamaludin, N.M.; Mahyuddin, N.; Akashah, F.W. Assessment on Indoor Environmental Quality (IEQ) with the application of potted plants in the classroom: Case of University Malaya. J. Des. Built Environ. 2017, 17, 1–15. [Google Scholar] [CrossRef]
  21. Lee, M.C.; Mui, K.W.; Wong, L.T.; Chan, W.Y.; Lee, E.W.M.; Cheung, C.T. Student learning performance and indoor environmental quality (IEQ) in air-conditioned university teaching rooms. Build. Environ. 2012, 49, 238–244. [Google Scholar] [CrossRef]
  22. Indraganti, M.; Rao, K.D. Effect of age, gender, economic group and tenure on thermal comfort: A field study in residential buildings in hot and dry climate with seasonal variations. Energy Build. 2010, 42, 273–281. [Google Scholar] [CrossRef]
  23. Choi, J.; Moon, J. Impacts of human and spatial factors on user satisfaction in office environments. Build. Environ. 2017, 114, 23–35. [Google Scholar] [CrossRef]
  24. Wagner, A.; Gossauer, E.; Moosmann, C.; Gropp, T.; Leonhart, R. Thermal comfort and workplace occupant satisfaction–Results of field studies in German low energy office buildings. Energy Build. 2007, 39, 758–769. [Google Scholar] [CrossRef]
  25. Alvares, C.A.; Stape, J.L.; Sentelhas, P.C.; Gonçalves, J.L.M.; Sparovek, G. Köppen’s climate classification map for Brazil. Meteorol. Z. 2013, 22, 711–728. [Google Scholar] [CrossRef]
  26. Ministry of Agriculture, Livestock, and Supply, Brazilian Institute of Meteorology (INE). Climatological Standards (1981–2010). 2018. Available online: https://portal.inmet.gov.br/normais (accessed on 28 November 2021).
  27. American Society of Heating. Refrigerating and Air-Conditioning Engineers. ANSI/ASHRAE Standard 55–2013: Thermal Environmental Conditions for Human Occupancy. 2013. Available online: https://www.ashrae.org/technical-resources/bookstore/thermal-environmental-conditions-for-human-occupancy (accessed on 28 November 2021).
  28. International Organization for Standardization. ISO 16000:1: Indoor Air–General Aspects of Sampling Strategy. 2004. Available online: https://www.iso.org/standard/39844.html (accessed on 28 November 2021).
  29. International Organization for Standardization. ISO 16000:26: Indoor Air–Sampling Strategy for Carbon Dioxide (CO2). 2012. Available online: https://www.iso.org/standard/52140.html (accessed on 28 November 2021).
  30. Rupp, R.F.; Kim, J.; Dear, R.; Ghisi, E. Associations of occupant demographics, thermal history and obesity variables with their thermal comfort in air-conditioned and mixed-mode ventilation office buildings. Build. Environ. 2018, 135, 1–9. [Google Scholar] [CrossRef]
  31. Givoni, B.; Khedari, J.; Wong, N.H.; Feriadi, H.; Noguchi, M. Thermal sensation responses in hot, humid climates: Effects of humidity. Build. Res. Inf. 2006, 34, 496–506. [Google Scholar] [CrossRef]
  32. Nicol, F.; Humphreys, M.; Roaf, S. Adaptive Thermal Comfort Principles and Practice; Routledge: London, UK, 2012. [Google Scholar]
  33. Oliveira, C.C.; Rupp, R.F.; Ghisi, E. Influência da umidade do ar no conforto térmico de usuários de edificações de escritórios localizadas no clima subtropical úmido de Florianópolis/SC [Influence of air humidity on users’ thermal comfort in office buildings located in the humid subtropical climate of Florianópolis/SC]. In Proceedings of the Encontro Nacional de Conforto no Ambiente Construído, João Pessoa, Brazil, 18–20 September 2019. [Google Scholar]
  34. International Organization for Standardization. ISO 7726: Ergonomics of the Thermal Environment–Instruments for Measuring Physical Quantities. 1998. Available online: https://www.iso.org/standard/14562.html (accessed on 28 November 2021).
  35. Ackerly, K.; Brager, G.; Arens, E. Data Collection Methods for Assessing Adaptive Comfort in Mixed-Mode Buildings and Personal Comfort Systems. UC Berkeley–Indoor Environmental Quality (IEQ). 2012. Available online: https://escholarship.org/uc/item/64p9111k (accessed on 20 January 2021).
  36. Damiati, S.A.; Zaki, S.A.; Rijal, H.B.; Wonorahardjo, S. Field study on adaptive thermal comfort in office buildings in Malaysia, Indonesia, Singapore, and Japan during hot and humid season. Build. Environ. 2016, 109, 208–223. [Google Scholar] [CrossRef]
  37. Brazil. Brazilian Health Regulatory Agency (Anvisa), Resolution n. 9. 2003. Available online: http://portal.anvisa.gov.br/documents/10181/2718376/RE_09_2003_.pdf/8ccafc91-1437-4695-8e3a-2a97deca4e10 (accessed on 20 June 2020).
  38. Fernández-Agüera, J.; Domínguez-Amarillo, S.; Alonso, C.; Martín-Consuegra, F. Thermal comfort and indoor air quality in low-income housing in Spain: The influence of airtightness and occupant behaviour. Energy Build. 2019, 199, 102–114. [Google Scholar] [CrossRef]
  39. Suzuki, E.H. Avaliação do Conforto Térmico e do Nível de CO2 em Edifícios de Escritório com Climatização Artificial na Cidade de São Paulo [Evaluation of Thermal Comfort and CO2 level in Office Buildings with Artificial Air-Conditioning in the City of São Paulo]. Master’s Dissertation, Polytechnic School of the University of São Paulo, São Paulo, Brazil, 2010. [Google Scholar]
Figure 1. Mean outdoor air temperature and outdoor relative humidity. Source: Climatological Standards (1981–2010) [26].
Sci 03 00047 g001
Figure 2. Distribution of air quality satisfaction votes according to environmental variables.
Sci 03 00047 g002
Figure 3. Distribution of air quality satisfaction votes according to subjective votes.
Sci 03 00047 g003
Figure 4. Frequency of air quality problems votes.
Sci 03 00047 g004
Figure 5. Causes of “Air is odorous” problem.
Sci 03 00047 g005
Figure 6. Frequency of CO2 concentration according to building ventilation type.
Sci 03 00047 g006
Figure 7. Correlations between environmental variables and CO2 concentration.
Sci 03 00047 g007
Figure 8. Distribution of air quality satisfaction votes, thermal comfort and mean air temperature and humidity ratio according to CO2 concentration.
Sci 03 00047 g008
Table 1. Parameters and respective scales considered in the questionnaire.
ParametersScales
Thermal sensation+3Hot
+2Warm
+1Slightly warm
0Neutral
−1Slightly cool
−2Cool
−3Cold
Thermal acceptability+1Unacceptable
0Acceptable
Thermal comfort+1Uncomfortable
0Comfortable
Air movement sensation+2Very low air movement
+1Low air movement
0Enough air movement
−1High air movement
−2Very high air movement
Air movement acceptability+1Unacceptable
0Acceptable
Humidity sensation *+3Very wet
+2Wet
+1Slightly wet
0Neutral
−1Slightly dry
−2Dry
−3Very dry
Humidity acceptability *+1Unacceptable
0Acceptable
Air quality satisfaction+3Very satisfied
+2Satisfied
+1Slightly satisfied
0Neutral
−1Slightly unsatisfied
−2Unsatisfied
−3Very unsatisfied
* The questions regarding humidity perception had the extra option “I do not know how to answer”.
Table 2. Environmental and occupant-related variables according to building and operation mode.
VariablesMMB1MMB2ACB
(mean ± S.D.)NV (n = 80)AC (n = 55)NV (n = 232)AC (n = 329)AC (n = 174)
EnvironmentalTa (°C)23.4 ± 1.523.8 ± 0.924.4 ± 1.224.6 ± 0.924.4 ± 0.5
Tout (°C)18.7 ± 2.124.5 ± 2.420.2 ± 2.825.2 ± 2.423.2 ± 0.5
Tg (°C)23.4 ± 1.424.5 ± 1.124.5 ± 1.124.9 ± 0.924.7 ± 0.4
Va (m/s)0.1 ± 0.00.1 ± 0.00.1 ± 0.10.1 ± 0.00.1 ± 0.2
RH (%)67 ± 360 ± 269 ± 757 ± 461 ± 3
RHout (%)81 ± 976 ± 085 ± 477 ± 371 ± 7
Wa (g/kg)10.01 ± 0.349.12 ± 0.3610.96 ± 1.529.15 ± 0.849.66 ± 0.51
CO2 (ppm)661 ± 901046 ± 143449 ± 67774 ± 207581 ± 40
Occupant-relatedAge (years)41 ± 846 ± 1037 ± 1236 ± 1140 ± 9
Weight (kg)64 ± 872 ± 1371 ± 1570 ± 1481 ± 16
Height (m)1.65 ± 0.051.69 ± 0.081.68 ± 0.101.67 ± 0.091.75 ± 0.07
BMI (kg/m2)23.5 ± 2.624.9 ± 3.125.0 ± 4.224.7 ± 3.926.4 ± 4.0
Clothing insulation (clo)0.88 ± 0.310.54 ± 0.060.69 ± 0.150.60 ± 0.110.62 ± 0.09
Metabolic rate (met)1.2 ± 0.21.2 ± 0.11.2 ± 0.11.2 ± 0.11.2 ± 0.1
Table 3. Distribution of air quality satisfaction votes according to building ventilation type, for users in thermal comfort and discomfort.
Air Quality SatisfactionThermal Comfort (%)Thermal Discomfort (%)
MM NVMM ACACBMM NVMM ACACB
n = 263n = 339n = 143n = 49n = 45n = 31
+3Very satisfied11.815.919.60.02.20.0
+2Satisfied21.315.034.32.04.419.4
+1Slightly satisfied14.810.617.50.015.616.1
0Neutral45.252.219.630.624.425.8
−1Slightly unsatisfied4.95.94.930.617.819.4
−2Unsatisfied1.90.34.218.431.19.7
−3Very unsatisfied0.00.00.018.44.49.7
Publisher’s Note: MDPI stays neutral with regard to jurisdictional claims in published maps and institutional affiliations.

