Abstract
One of the most basic pieces of information gained from dynamic electromyography is accurately defining muscle action and phase timing within the gait cycle. The human gait relies on selective timing and the intensity of appropriate muscle activations for stability, loading, and progression over the supporting foot during stance, and further to advance the limb in the swing phase. A common clinical practice is utilizing a low-pass filter to denoise integrated electromyogram (EMG) signals and to determine onset and cessation events using a predefined threshold. However, the accuracy of the defining period of significant muscle activations via EMG varies with the temporal shift involved in filtering the signals; thus, the low-pass filtering method with a fixed order and cut-off frequency will introduce a time delay depending on the frequency of the signal. In order to precisely identify muscle activation and to determine the onset and cessation times of the muscles, we have explored here onset and cessation epochs with denoised EMG signals using different filter banks: the wavelet method, empirical mode decomposition (EMD) method, and ensemble empirical mode decomposition (EEMD) method. In this study, gastrocnemius muscle onset and cessation were determined in sixteen participants within two different age groups and under two different walking conditions. Low-pass filtering of integrated EMG (iEMG) signals resulted in premature onset (28% stance duration) in younger and delayed onset (38% stance duration) in older participants, showing the time-delay problem involved in this filtering method. Comparatively, the wavelet denoising approach detected onset for normal walking events most precisely, whereas the EEMD method showed the smallest onset deviation. In addition, EEMD denoised signals could further detect pre-activation onsets during a fast walking condition. A comprehensive comparison is discussed on denoising EMG signals using EMD, EEMD, and wavelet denoising in order to accurately define an onset of muscle under different walking conditions.
1. Introduction
Surface electromyography (EMG) has been widely used to measure the electrical activity of skeletal muscles, and analysis of EMG signals is crucial in many research fields, such as neurological diagnosis, sports medicine, prosthetics, gait rehabilitation, etc. Specifically, the determination of muscle activity onset is the most popular temporal parameter obtained from EMG signals in gait laboratories. Identifying muscle activity onset may help in studies of motor control and performance of efficient gait [1]. However, EMG signals are usually corrupted by ambient noise from other electromagnetic devices (50–60 Hz) and transducer noise at electrode skin junction in their acquisition; therefore, denoising techniques play a vital role in improving the signal to noise ratio (SNR) of EMG signals [2,3]. In this study, we explore appropriate denoising techniques to determine onset of muscle activity under different conditions.
Removing the noise from raw signals is a classic problem in signal processing, and much effort has been made by researchers in filtering [4,5,6]. Low-pass filtering (LPF) is a vastly used conventional method for removing noise due to its ease of implementation; however, it has been limited by requiring a priori information of a signal’s frequency characteristics, in order to choose appropriate cutoff frequency. In addition, LPF results in excessive smoothing and further loss of information and inaccurate identification of EMG onset [7]. Accurate onset determination is crucial to gait, slips, and falls studies, where the reaction time of lower extremity muscles is within a few hundred milliseconds (~175 ms for unexpected slip and 233 ms muscle activation time for normal stance in medial hamstring) [8,9]. As specific time delay is a crucial factor in these studies, premature and delayed cessation may be evaluated by LPF [10] of EMG signals.
In order to counter the time shifting involved in the LPF method, various researchers have proposed linear methods such as the wavelet transform denoising technique [11], and non-linear methods such as Hilbert–Huang transform (HHT) [12]. The HHT approach was proposed by Huang for processing nonlinear and non-stationary signals. The idea behind this algorithm is to decompose a signal into a set of intrinsic mode functions (IMFs) through the empirical mode decomposition (EMD) process, thus involving the signal being analyzed itself instead of the attenuated function. As a result, it presents a data-driven approach in dealing with non-stationarity and/or nonlinearity in the signal and has been readily applied into filtering and denoising [13,14].
In this study, we present a systematic comparison between denoising methods, which reveals the benefits and the drawbacks of each method compared to the other in finding temporal events such as onsets. Four different denoising techniques—LPF, wavelet method, EMD method, and EEMD method—are compared in the real applications. In this experiment, a muscle onset event of medial gastrocnemius (MG) muscle was identified under two different walking conditions: normal and fast walking, and among two different groups consisting of older and younger subjects. In this study, we considered the integrated EMG (iEMG) signal of the MG muscle and kinematic markers such as heel contact (HC) and toe off (TO) of the stance foot as the gold standard for all true events. The aim of this study is to determine how different denoising techniques affect the timing of medial gastrocnemius onset and cessation events.
2. Materials and Methods
2.1. Participants
Participants were recruited from flyers placed around the Virginia Tech campus and the community (Blacksburg, VA). Eight young (aged between 18–30 years old) and eight old participants (age 65–84 years old) of average height (176.25 ± 6.08 cm) participated in the study. The subjects performed walking on 15-m-long walkway with two embedded forceplates. The study was approved by the Virginia Tech Institutional Review Board. The recruited participants reported to be in generally good health, with no cardiovascular, respiratory, neurological, and musculoskeletal abnormalities.
2.2. Apparatus
The walking experiment was conducted on a 15-m linear walking track, embedded with two force plates (BERTEC #K80102, Type 45550-08, Bertec Corporation, OH 43212, USA). A six-camera ProReflex system (Qualysis) was used to collect three-dimensional infra-red passive marker data of participants as they walked over the test floor surface. Kinematic data were sampled and recorded at 120 Hz. Ground reaction forces of participants walking over the test surfaces was measured using two force plates and sampled at a rate of 1200 Hz. An eight-channel EMG Telemetry Myosystem 900 (Noraxon, Scottsdale, AZ, USA), was used to record the temporal activations of MG muscles in the both lower extremity during normal walking. However, the data from left medial gastrocnemius were used in this study, while the other muscle EMG data were a part of another study. The EMG system is composed of one transmitter, one receiver and surface electrodes. The transmitter is portable and powered by a battery (9V), and the receiver telecommunicates to the transmitter. Raw EMG signals were monitored, sampled, and stored by the National Instrument hardware and customized LabVIEW VI. Only those walking trials were used for analysis when subjects placed their left foot in the middle of forceplate. Kinematic events such as HC and TO of both feet were determined by placing four markers at heel and toe (both right and left foot) and the events of were further confirmed by forceplates.
2.3. Data Analysis
2.3.1. Onset and Cessation Points Determination Algorithm
Raw EMG signals recorded during gait were band-pass filtered using a fourth order filter at 20–500 Hz and full-wave rectified [15]. In this study, we used the classical threshold based approach for onset determination [16]. The baseline quiescent portion of EMG record was chosen for data of a 6 msec, starting from −50% of stance. The threshold was defined as shown below:
A threshold of three standard deviations above the baseline was used to identify muscle firing onset and cessation [16]. An algorithm was written with a 3 msec moving window, and muscle onset was assumed to follow two conditions: (1) Muscle activity was above the threshold for at least 0.1 s, and (2) if the muscle activity dropped below the threshold for more than 3% of stance duration (or 5% of gait cycle). The onset was updated to the new rise above the threshold and short duration EMG packet was discarded [17]. All muscle activity onset and cessation times are reported as a percentage of stance duration. Subject means used in statistical analyses were calculated as the mean of the two trials performed by each subject. A four factor analysis of variance (ANOVA) with a Tukey’s posthoc was used to assess statistical differences between the four denoising methodologies (JMP, SAS USA). Alpha level was set at p < 0.05.
2.3.2. Empirical Mode Decomposition Method
The goal of the EMD method is to decompose the original signal into a set of Intrinsic Mode Functions (IMFs) :
where is the th IMF of the signal, represents the number of IMFs, and is a remainder, which is usually a non-zero-mean varying function in a low frequency.
The IMF can be defined through two conditions:
- (1)
- the number of maximums, minimums, and the number of zero crossings must either equal or differ at most by one;
- (2)
- the mean of its upper and lower envelopes must equal zero.
In the EMD process, a sifting algorithm is used to extract the IMFs from the original signal. The IMFs can be extracted out through the following procedure: first, the cubic spline interpolation is used to connect the local extrema (i.e., maxima and minina), in order to form an upper envelope and the lower envelope , then by defining the local mean of the upper and lower envelopes as , the first component is obtained as the difference between the signal and the local mean:
This procedure is repeated until the following condition is satisfied:
where is iteration number for extraction procedure described above, and becomes smaller after each iteration. is usually within the range from 0.2 to 0.3, for the sifting process is a very rigorous limit for the difference between two consecutive siftings [16]. The final is designated as the first IMF . Subsequently, the residue is treated as a new signal and the sifting process is repeated until the residual becomes a constant or a function with only one extremum (maxima or minima) such that no more IMF can be extracted. Given a signal , the procedure for extracting IMFs is illustrated in Figure 1.
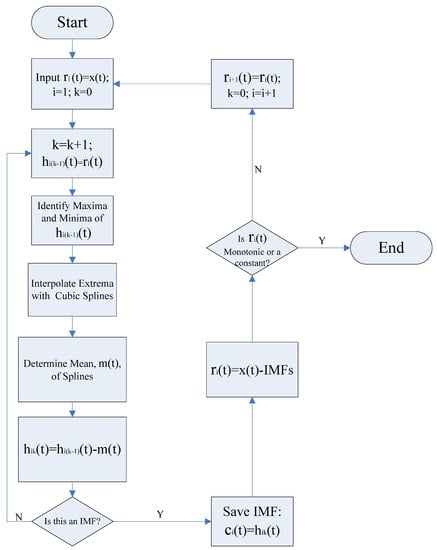
Figure 1.
Flow chart of the empirical mode decomposition (EMD) process for signal decomposition.
2.3.3. Mode Mixing
Mode mixing is defined as any IMF consisting of oscillations of dramatically disparate scales, often caused by intermittency of the driving mechanism. To illustrate such a phenomenon, a signal consisting of two components and is first constructed as:
where , , and . The notation represents a low-frequency sinusoidal component while represents a high-frequency transient component that is quickly decaying. For example, when , , , and , the waveform of the signal is shown in Figure 2a. Because the signal consists of widely disparate scales, i.e., the frequencies of two components (80 Hz and 1600 Hz) are far away from each other, mode mixing occurs when EMD is applied to decompose the signal. This is shown in Figure 2b, where the two components are mixed together in one IMF. To overcome the problem of mode mixing, the Ensemble EMD technique was recently developed [13].
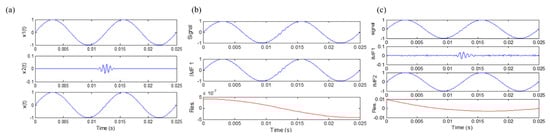
Figure 2.
(a) A simulated signal; (b) EMD results of the simulated signal; (c) ensemble empirical mode decomposition (EEMD) results of the simulated signal.
2.3.4. Ensemble Empirical Mode Decomposition Method
The ensemble empirical mode decomposition (EEMD) method [13] was developed to overcome the mode mixing effect involved in the EMD algorithm. Essentially, EEMD algorithm repeatedly decomposes the original signal into IMFs by using the original EMD algorithm. During each trial of the decomposition process, white noise of finite amplitude is added to the original signal. The ensemble means of the corresponding IMFs generated from each trial are subsequently treated as the IMFs of the EEMD algorithm. Since white noise is added throughout the entire signal decomposition process, no missing scales are present, and mode mixing is effectively eliminated by the EEMD process.
In the EEMD process, each individual trial may produce noisy results, as each decomposition step involves both the signal and added white noise. On the other hand, when the EMD method is applied to a white noise [13,18,19], it acts as an adaptive dyadic filter bank. As a result, the Fourier spectra of different IMFs would collapse onto a single spectrum along the axis of frequency [20]. Consequently, the effect of the added noise can be cancelled out in the ensemble mean when enough trials are performed in the EEMD process [13,21]. The ensemble mean is treated as the true IMF, and the only resident part is the signal, as more and more trials are added in the ensemble process. When EEMD is applied to decompose the signal described above, it can be found mode mixing has been solved, and the results are shown in Figure 2c.
2.3.5. Denoising Algorithm
When the EMD method is used as a denoising tool, it is essential to know whether a specific IMF contains the relevant frequency information. Flandrin et al. [13] developed the adaptive IMF test procedure according to the statistical study on white Gaussian noise and fractional Gaussian noise (fGn), the threshold values are related to the energy of noise on each IMF component.
In our analysis, we have adopted the fGn model for various H values developed by Flandrin et al. [13,18,19] is adopted here. fGn is generalization of white noise, and the statistical properties of fGn are controlled by the parameter H, and the H values range from 0.1 to 0.9, and for each value of H, J = 5000 independent sample paths of fGn were generated through the Wood and Chan [22] algorithm. For a given H value, a set of IMFs were collected via the EMD algorithm for all sample paths (with ).
denotes the H dependent variation of the IMF energy. And can be estimated from
and subsequent values of are given by
where , and the parameter can be found in Table 1. And can be obtained from

Table 1.
Confidence Interval Parameters for the Linear Model.
The noise model can be described as
And the relationship between the threshold value of each IMF and can be identified as
From Equation (10), the adaptive threshold value of each IMF can be identified as:
Based on the above analysis, the denoising procedure using the fGn model can be summarized as follows:
- (1)
- Since the first IMF is mainly composed by high frequency components, it is assumed that the first IMF contains most of noise. Therefore, the noise level can be estimated by computing from Equation (6).
- (2)
- The “noise only” model can be obtained by Equations (6) and (7).
- (3)
- Choose a confidence interval (95% or 99%) and the corresponding parameters from Table 1, so the model is fixed.
- (4)
- Use Equation (11) to calculate the adaptive threshold value for the different IMF components.
- (5)
- Decompose the original signal via the EMD/EEMD method, and compare the IMF energies with the corresponding threshold value.
- (6)
- Reconstruct the signal by keeping only the residual and those IMFs whose energy exceeds the threshold, and then the denoised signal can be obtained.
2.3.6. Wavelet Denoising
A thresholding technique was utilized to denoise EMG signals [18,19]. The EMG signal was decomposed using Daubechies wavelets (db2). Daubechies wavelets are family of orthogonal wavelets defining a discrete wavelet transform [20,21]. Decomposition of EMG signal results in set of wavelet coefficients that correlates to the high frequency sub-bands. The level of decomposition was selected as per signal-to-noise ratio (SNR) from the EMG electrodes. We found that a decomposition level of 5 was adequate and would not remove EMG signal artifacts. The high frequency sub-bands contain details and low frequency sub-bands contain approximation of the signal. Since the details contain the high frequency noise, thus can be omitted to denoise the reconstructed signal. The thresholding technique set all frequency sub-band coefficients below certain threshold to zero and further use these coefficients in an inverse wavelet transformation to reconstruct the EMG signal. From theory, four times the standard deviation of detail coefficients would cover 99.99% of noise. Therefore, a threshold of 4.5 times of standard deviation was chosen.
3. Results
Mean medial gastrocnemius muscle onset time events for low pass filtered EMG signals of sixteen participants (8 young and 8 old) was found to be significantly different from those of iEMG for both normal ( and fast walking () trials (Table 2). For most of the trials earlier onset were detected, when iEMG signals were filtered by low pass filter for normal speed walking trials (Table 3). We found that the duration of muscle activation was significantly different for both normal speed walking () and fast speed walking () for iEMG and low pass filtered signals. Thus, traditional way of low pass filtering was found to result in earlier onsets in normal walking whereas it was found to be advantageous in detecting preparatory pre-activations in fast walking as shown in Figure 3.
Table 2.
Tukey’s Honestly Significant Difference comparison of onset point and time of muscle activation.
Table 3.
Performance matrix of Onset detected by 16 participants with iEMG (integrated EMG) signal, Low –pass filtered (LPF), ensemble empirical mode decomposition (EEMD) denoised, Empirical mode decomposition (EMD) denoised and Wavelet (daubechies) denoising.
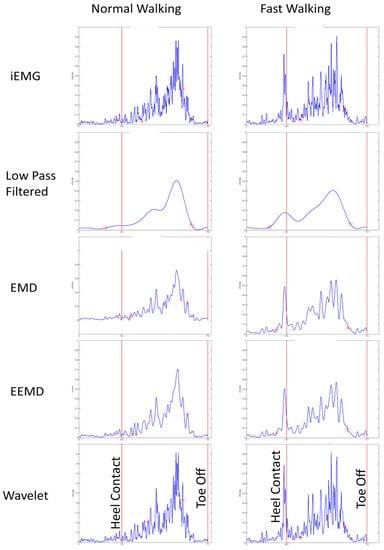
Figure 3.
Onset and cessation for normal and fast walking with iEMG (as standard ground truth) and other denoised EMG signals for one participant.
In all fast walking trials, an earlier preparatory pre-activation was found, which was not detected by our threshold based algorithm for iEMG and wavelet denoised signals. This may be one of the reasons for finding significant difference among onsets for iEMG and LPF and that of Wavelet and LPF (Figure 3). Thus EMD, EEMD, and LPF signals were advantageous, as they were able to detect preparatory pre-activations in fast-speed walking trials (Figure 3 and Figure 4).
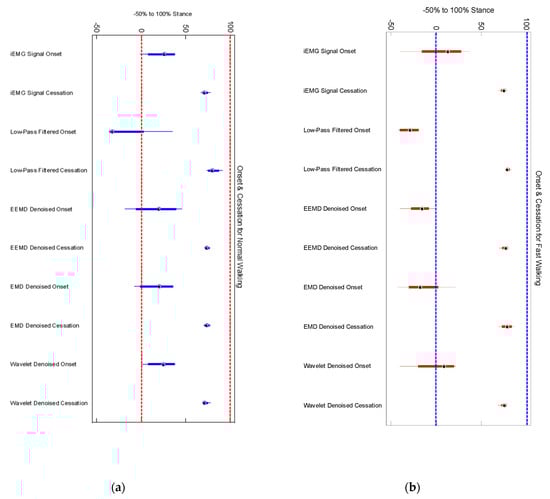
Figure 4.
(a) Normal walking onset and cessation points for four participants; (b) the same four participants walked at 20% higher to normal speed.
We did not find any significant differences among older and younger participants’ muscle activation time for any denoising method (Figure 5). Onset of medial gastrocnemius for young and old participants was found to be starting around heel contact (HC) for normal walking trials (Figure 6a,b) in case of iEMG and wavelet denoised EMG signals, whereas LPF, EMD and EEMD denoising methods showed earlier onsets. EEMD denoised signals showed minimum deviation for normal walking trials muscle onsets among younger participants when compared with iEMG (assumed ground truth standard). The results are summarized in Table 4.
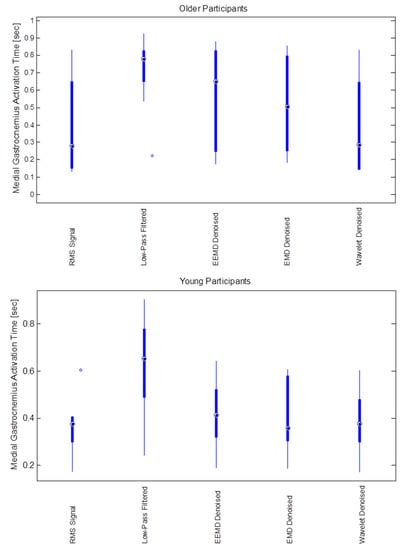
Figure 5.
Medial Gastrocnemius muscle activation duration (s) for different noise filtering methods (RMS, low-pass, EEMD, EMD and wavelet) for older (upper) and younger (lower) participants.
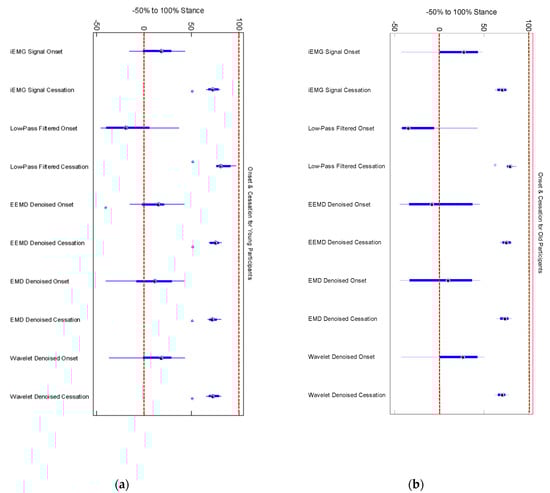
Figure 6.
(a) Onset and cessation points of medial gastrocnemius in 8 young participants (b) Onset and cessation points of medial gastrocnemius in 8 old participants. Low pass filtering showed earlier onset and delayed cessation in both young and old participants.
Table 4.
Muscle onset performance results of threshold based algorithm and various denoising methods.
4. Discussion
Our results showed that low-pass filtering (LPF) of EMG signals will not determine accurate onsets of muscles for normal walking but may be helpful for detection of pre-activations when threshold-based algorithms are used. One of the limitations of our work is that we have used iEMG onset events as gold standard. We also found that iEMG fail to detect pre-activations during fast walking whereas LPF can successfully detect it. Wavelet denoising was found to be the best for normal walking onset detections and EEMD was found to have deviated least in onset detection for normal walking and was able to detect muscle pre-activations during fast walking.
The key point for the EMD/EEMD denoising technique is the energy of the first IMF component, which is assumed as the high-frequency noise in the denoising algorithm. And other IMF components would be estimated based on the energy of the first IMF component. Therefore, it is significant to separate the high-frequency correctly from the original signal. If the energy of the first IMF components is underestimated, the threshold of remaining IMF components would be smaller, it would become difficult to denoise the noise in the EMG signals; whereas if the energy of the first IMF components is overestimated, the useful information in the EMG signals will be removed associated with denoising. Probably the EEMD algorithm can effectively solve the problem of mode mixing, thus the high frequency and small amplitude signal can be separated from the original signal. Thus, the first IMF component would not contain the useful low frequency information, and would only reflect the noisy high frequency information.
To consolidate the theoretical analysis, 16 sets of data (8 from young adults and 8 from older adults) are utilized to testify the same conclusion. An interesting finding was that the EEMD denoising method is more effective for older adults than young adults. In order to better understand the effect, we should look into the basic functional element of a skeletal muscle. Usually striated muscles are classified into two types—Type I and Type Ⅱ [22,23,24]. Type I muscle units are slow tonic fibers, with 70–125 Hz frequency range, and Type Ⅱ muscle units are fast phasic muscle fibers, with 126–250 Hz frequency range. The changes in muscle morphology and muscle function with age include a selective loss of type II muscle fiber area and an increased proportion of type I fibers, especially for the gastrocnemius. Due to this, the frequency spectrum of EMG signal from older adults contains relatively larger frequency range and lower power components comparing to that of EMG signal from young adults. Thus the EMG signal from older adults is much easier to cause mode mixing via EMD algorithm, and this may be the reason for EEMD denoising technique being more effective than EMD denoising method when they are applied to the older adults.
5. Conclusions
This study investigated the effect of the EEMD denoising method, EMD denoising method, wavelet method, and low-pass filtering on EMG temporal events such as onsets and cessation. Our results demonstrate that relying on only low pass filtering might not accurately determine true muscle onset which is a critical temporal parameter of EMG signals. Four different denoising approaches: low-pass filtering, wavelet method, EMD method, and EEMD method, are compared, when applied to determine gastrocnemius muscle onset and cessation in sixteen participants within two different age groups and under two different walking conditions. Wavelet denoised signals predicted onsets much closer to that by iEMG for normal speed walking. There existed a tradeoff in using EEMD denoised signals for normal speed walking onset detection (least deviated from iEMG onset) to fairly accurate detection of pre-activation muscle onsets. Delayed onset of lower extremity muscle is an indication that the activation is stimulated by a stretch stimulus, rather than central nervous system control [25]. Delay of gastrocnemius action until late terminal stance implies influence of passive stretch during dorsiflexion. After comprehensive comparison, we concluded that EEMD denoising method performs best in muscle onset performance considering both normal and walking condition.
Author Contributions
J.Z., R.S. and T.E.L. conceived and designed the experiments; R.S. and J.Z. performed the experiments; R.S. along with J.Z. analyzed the data wrote the manuscript with support from T.E.L. All authors discussed the results and contributed to the final manuscript. All authors have read and agreed to the published version of the manuscript.
Funding
This research was supported by the NSF-Information and Intelligent Systems (IIS) and Smart and Connected Health (1065442, and 1547466, and secondary 1065262).
Acknowledgments
We would like to thank Misha Pavel and Wendy Nilsen for their encouragement in the development of wireless health monitoring systems and fostering the support of wearable wireless health monitoring systems.
Conflicts of Interest
The authors declare no conflict of interest.
References
- Wall-Scheffler, C.M.; Chumanov, E.; Steudel-Numbers, K.; Heiderscheit, B. Electromyography activity across gait and incline: The impact of muscular activity on human morphology. Am. J. Phys. Anthropol. 2010, 143, 601–611. [Google Scholar] [CrossRef] [PubMed]
- De Luca, C.J.; Donald Gilmore, L.; Kuznetsov, M.; Roy, S.H. Filtering the surface EMG signal: Movement artifact and baseline noise contamination. J. Biomech. 2010, 43, 1573–1579. [Google Scholar] [CrossRef] [PubMed]
- Huang, H.; Zhou, P.; Li, G.; Kuiken, T. Spatial filtering improves EMG classification accuracy following targeted muscle reinnervation. Ann. Biomed. Eng. 2009, 37, 1849–1857. [Google Scholar] [CrossRef] [PubMed]
- Shiavi, R.; Frigo, C.; Pedotti, A. Electromyographic signals during gait: Criteria for envelope filtering and number of strides. Med. Biol. Eng. Comput. 1998, 36, 171–178. [Google Scholar] [CrossRef] [PubMed]
- Raez, M.B.; Hussain, M.S.; Mohd-Yasin, F. Techniques of EMG signal analysis: Detection, processing, classification and applications. Biol. Proced. Online 2006, 8, 11–35. [Google Scholar] [CrossRef] [PubMed]
- Stashuk, D. EMG signal decomposition: How can it be accomplished and used? J. Electromyogr. Kinesiol. Off. J. Int. Soc. Electrophysiol. Kinesiol. 2001, 11, 151–173. [Google Scholar] [CrossRef]
- Halbertsma, J.M.; Deboer, R.R. On the Processing of Electromyograms for Computer-Analysis. J. Biomech. 1981, 14, 431. [Google Scholar] [CrossRef]
- Lockhart, T.E. An integrated approach towards identifying age-related mechanisms of slip initiated falls. J. Electromyogr. Kinesiol. 2008, 18, 205–217. [Google Scholar] [CrossRef][Green Version]
- Chambers, A.J.; Cham, R. Slip-related muscle activation patterns in the stance leg during walking. Gait Posture 2007, 25, 565–572. [Google Scholar] [CrossRef]
- Manal, K.; Rose, W. A general solution for the time delay introduced by a low-pass Butterworth digital filter: An application to musculoskeletal modeling. J. Biomech. 2007, 40, 678–681. [Google Scholar] [CrossRef]
- Jiang, C.F.; Kuo, S.L. A comparative study of wavelet denoising of surface electromyographic signals. Conf. Proc. IEEE Eng. Med. Biol. Soc. 2007, 2007, 1868–1871. [Google Scholar] [CrossRef]
- Huang, N.E.; Shen, Z.; Long, S.R.; Wu, M.L.C.; Shih, H.H.; Zheng, Q.N.; Yen, N.C.; Tung, C.C.; Liu, H.H. The empirical mode decomposition and the Hilbert spectrum for nonlinear and non-stationary time series analysis. Proc. R. Soc. Lond. A 1998, 454, 903–995. [Google Scholar] [CrossRef]
- Flandrin, P.; Rilling, G.; Goncalves, P. Empirical mode decomposition as a filter bank. IEEE Signal Proc. Let. 2004, 11, 112–114. [Google Scholar] [CrossRef]
- Bohannon, R.W.; Larkin, P.A.; Cook, A.C.; Gear, J.; Singer, J. Decrease in timed balance test scores with aging. Phys. Ther. 1984, 64, 1067–1070. [Google Scholar] [CrossRef]
- Chechile, R.A. Human motion analysis: Current applications and future directions—Harris, GF, Smith, PA. J. Math. Psychol. 1997, 41, 126. [Google Scholar]
- Difabio, R.P. Reliability of Computerized Surface Electromyography for Determining the Onset of Muscle-Activity. Phys. Ther. 1987, 67, 43–48. [Google Scholar]
- Perry, J.; Bontrager, E.L.; Bogey, R.A.; Gronley, J.K.; Barnes, L.A. The Rancho Emg Analyzer—A Computerized System for Gait Analysis. J. Biomed. Eng. 1993, 15, 487–496. [Google Scholar] [CrossRef]
- Gradolewski, D.; Tojza, P.M.; Jaworski, J.; Ambroziak, D.; Redlarski, G.; Krawczuk, M. Arm EMG Wavelet-Based Denoising System. In Mechatronics-Ideas for Industrial Application; Springer: Cham, Switzerland, 2015; Volume 317, pp. 289–296. [Google Scholar] [CrossRef]
- Mithun, P.; Pandey, P.C.; Sebastian, T.; Mishra, P.; Pandey, V.K. A wavelet based technique for suppression of EMG noise and motion artifact in ambulatory ECG. Conf. Proc. IEEE Eng. Med. Biol. Soc. 2011, 2011, 7087–7090. [Google Scholar] [CrossRef]
- Soangra, R.; Krishnan, V. Wavelet-Based Analysis of Physical Activity and Sleep Movement Data from Wearable Sensors among Obese Adults. Sensors 2019, 19, 3710. [Google Scholar] [CrossRef] [PubMed]
- Lockhart, T.E.; Soangra, R.; Zhang, J.; Wu, X. Wavelet based automated postural event detection and activity classification with single imu—Biomed 2013. Biomed. Sci. Instrum. 2013, 49, 224–233. [Google Scholar] [PubMed]
- Wilkinson, D.J.; Piasecki, M.; Atherton, P.J. The age-related loss of skeletal muscle mass and function: Measurement and physiology of muscle fibre atrophy and muscle fibre loss in humans. Ageing Res. Rev. 2018, 47, 123–132. [Google Scholar] [CrossRef] [PubMed]
- Kramer, I.F.; Snijders, T.; Smeets, J.S.J.; Leenders, M.; van Kranenburg, J.; den Hoed, M.; Verdijk, L.B.; Poeze, M.; van Loon, L.J.C. Extensive Type II Muscle Fiber Atrophy in Elderly Female Hip Fracture Patients. J. Gerontol. Ser. A 2017, 72, 1369–1375. [Google Scholar] [CrossRef] [PubMed]
- Tieland, M.; Trouwborst, I.; Clark, B.C. Skeletal muscle performance and ageing. J. Cachexia Sarcopenia Muscle 2018, 9, 3–19. [Google Scholar] [CrossRef]
- Barnes, W.P. Feedback and Motor Control in Invertebrates and Vertebrates; Springer: Dordrecht, The Netherlands, 2012. [Google Scholar]
© 2020 by the authors. Licensee MDPI, Basel, Switzerland. This article is an open access article distributed under the terms and conditions of the Creative Commons Attribution (CC BY) license (http://creativecommons.org/licenses/by/4.0/).