Article

An Experiment-Based Methodology for Evaluating the Impacts of Full Bandwidth Load on the Hybrid Energy Storage System for Electrified Vehicles

1
Department of Electrical and Computer Engineering, California State University, 5151 State University Drive, Los Angeles, CA 90032-8152, USA
2
Department of Electrical and Computer Engineering, University of North Carolina, 9201 University City Blvd, Charlotte, NC 28223-0001, USA
3
Center for Advanced Vehicular Systems at Mississippi State University, 200 Research Blvd, Starkville, MS 39759, USA
*
Author to whom correspondence should be addressed.
Submission received: 2 October 2018 / Accepted: 10 October 2018 / Published: 21 April 2019
(This article belongs to the Special Issue Electric Vehicles)

Abstract

:
In Electrified Vehicles, the cost, efficiency, and durability of electrified vehicles are dependent on the energy storage system (ESS) components, configuration and its performance. This paper, pursuing a minimal size tactic, describes a methodology for quantitatively and qualitatively investigating the impacts of a full bandwidth load on the ESS in the HEV. However, the methodology can be extended to other electrified vehicles. The full bandwidth load, up to the operating frequency of the electric motor drive (20 kHz), is empirically measured which includes a frequency range beyond the usually covered frequency range by published standard drive cycles (up to 0.5 Hz). The higher frequency band is shown to be more efficiently covered by a Hybrid Energy Storage System (HESS) which in this paper is defined as combination of a high energy density battery, an Ultra-Capacitor (UC), an electrolytic capacitor, and a film capacitor. In this paper, the harmonic and dc currents and voltages are measured through two precision methods and then the results are used to discuss about overall HEV efficiency and durability. More importantly, the impact of the addition of high-band energy storage devices in reduction of power loss during transient events is disclosed through precision measurement based methodology.

1. Introduction

Environmental and energy concerns in recent years [1] persuaded policy makers to encourage the automotive industry to change their direction to produce vehicles with higher fuel economy, lower emission and superior performance [2,3,4,5,6]. To achieve this goal, electrified vehicles have been accepted as surrogates for conventional vehicles. In the US market, Hybrid Electrical Vehicles (HEV) are the dominant type which accounts for around 60 percent of the overall electric vehicles sales in June 2018 [7]. A key component of the power-train is the energy storage system (ESS). An advanced technology ESS is usually a hybridized combination of a battery and an ultra-capacitor (UC) through parallel direct or passive connection [8,9,10,11,12,13,14,15,16,17,18,19] or active connection, via a dc-dc converter [20,21,22,23,24,25,26,27]. In these references, for studying Hybrid ESS (HESS) from sizing, topology, and control strategy aspect, limited bandwidth loads are usually applied. For instance, the standard published drive cycles are normally sampled at a low frequency (e.g., 1 Hz) which limits the bandwidth used to excite the power-train for the actual situation.
In reality, multiplication of multiple transfer functions, each of which represent the dynamic behavior of a subsystem, can define the ratios of ESS current to different exciting inputs of the powertrain. The overall transfer function then is a sophisticated vehicle system model which includes several natural frequencies associated with different mechanical and electrical sub-systems. In addition to natural responses, there are also forced responses at an ESS terminal caused by exciting inputs of the various sub-systems of the power-train which really depend on non-traction and traction load requirement at over time. Inputs such as accelerator and brake pedals and gate signals of power electronic devices can be mentioned as examples of exciting inputs of the system. These natural and force responses induce harmonic currents at the terminal of ESS. For instance, two following phenomena couple higher frequency currents through the ESS [28], the impacts of which on design have been overlooked. First is the variable nature of the load (torque-speed) at the electric motor in automotive applications which induces frequency content above 0.5 Hz (the Nyquist frequency associated with the 1 Hz sampling rate of standard published drive cycles). Variation in surface roughness, harsh acceleration/deceleration or other variation in traction load can be the source of change in torque/speed over time profile. The second is the switching phenomenon in the motor controller, the harmonic currents of which cannot be entirely filtered and are often not well-filtered in electrified vehicles applications. The former is not well addressed in the literature while the latter is only addressed from the motor drive stand point [29] and not from the system level prospective where the motor drive is used in a power-train.
Accurately deriving the dynamics of system model and including all possible forces response with variation rate of higher than 0.5 Hz if not impossible is very challenging and time consuming. In this work characteristics of full bandwidth load of power-train are first specified by testing a general electrified vehicle in electric mode. Then, the concept of bandwidth based HESS design is described for covering the entire bandwidth of the power-train load by allocating different energy storage devices based on their effective bandwidths. Second, an experiment-based method is introduced to reveal the characteristics of the transfer functions for an HEV with minimal AEM (All Electric Mode). Then, using two accurate methods of measurement, the impacts of the full bandwidth load on the DC and harmonic currents of the HESS are quantified. Besides using the measured harmonic currents, the passive configuration of the hybrid energy storage system (meaning no power electronics interfacing energy storage components) of [30] is extended by using a unique methodology. By this method, the composition of the HESS is improved by including additional higher-bandwidth components which address the higher frequency current. For doing so, an analysis is carried out which leads to a method for using the electrical circuit analysis tool available in Simulink to design two high-frequency components (electrolytic and film capacitors). For this study, measured experimental data at the dc input of the motor drive is used while dynamic load stimulus from a motoring test stand is applied to the HESS across the interconnecting power bus. Next, by using a hybrid method, combining the HESS model and measured DC and harmonic currents, power dissipation for different configurations of HESS have been computed which allows the impact of adding each branch of energy storage device on overall power dissipation is identified and compared. In the end, a discussion is presented which shows how the result of high precision experiment-based methodology can be extended for specifying the potential impacts of bandwidth-based designed HESS on overall vehicle efficiency when the full bandwidth load is considered.

2. Limited Bandwidth of Standard Drive-Cycles

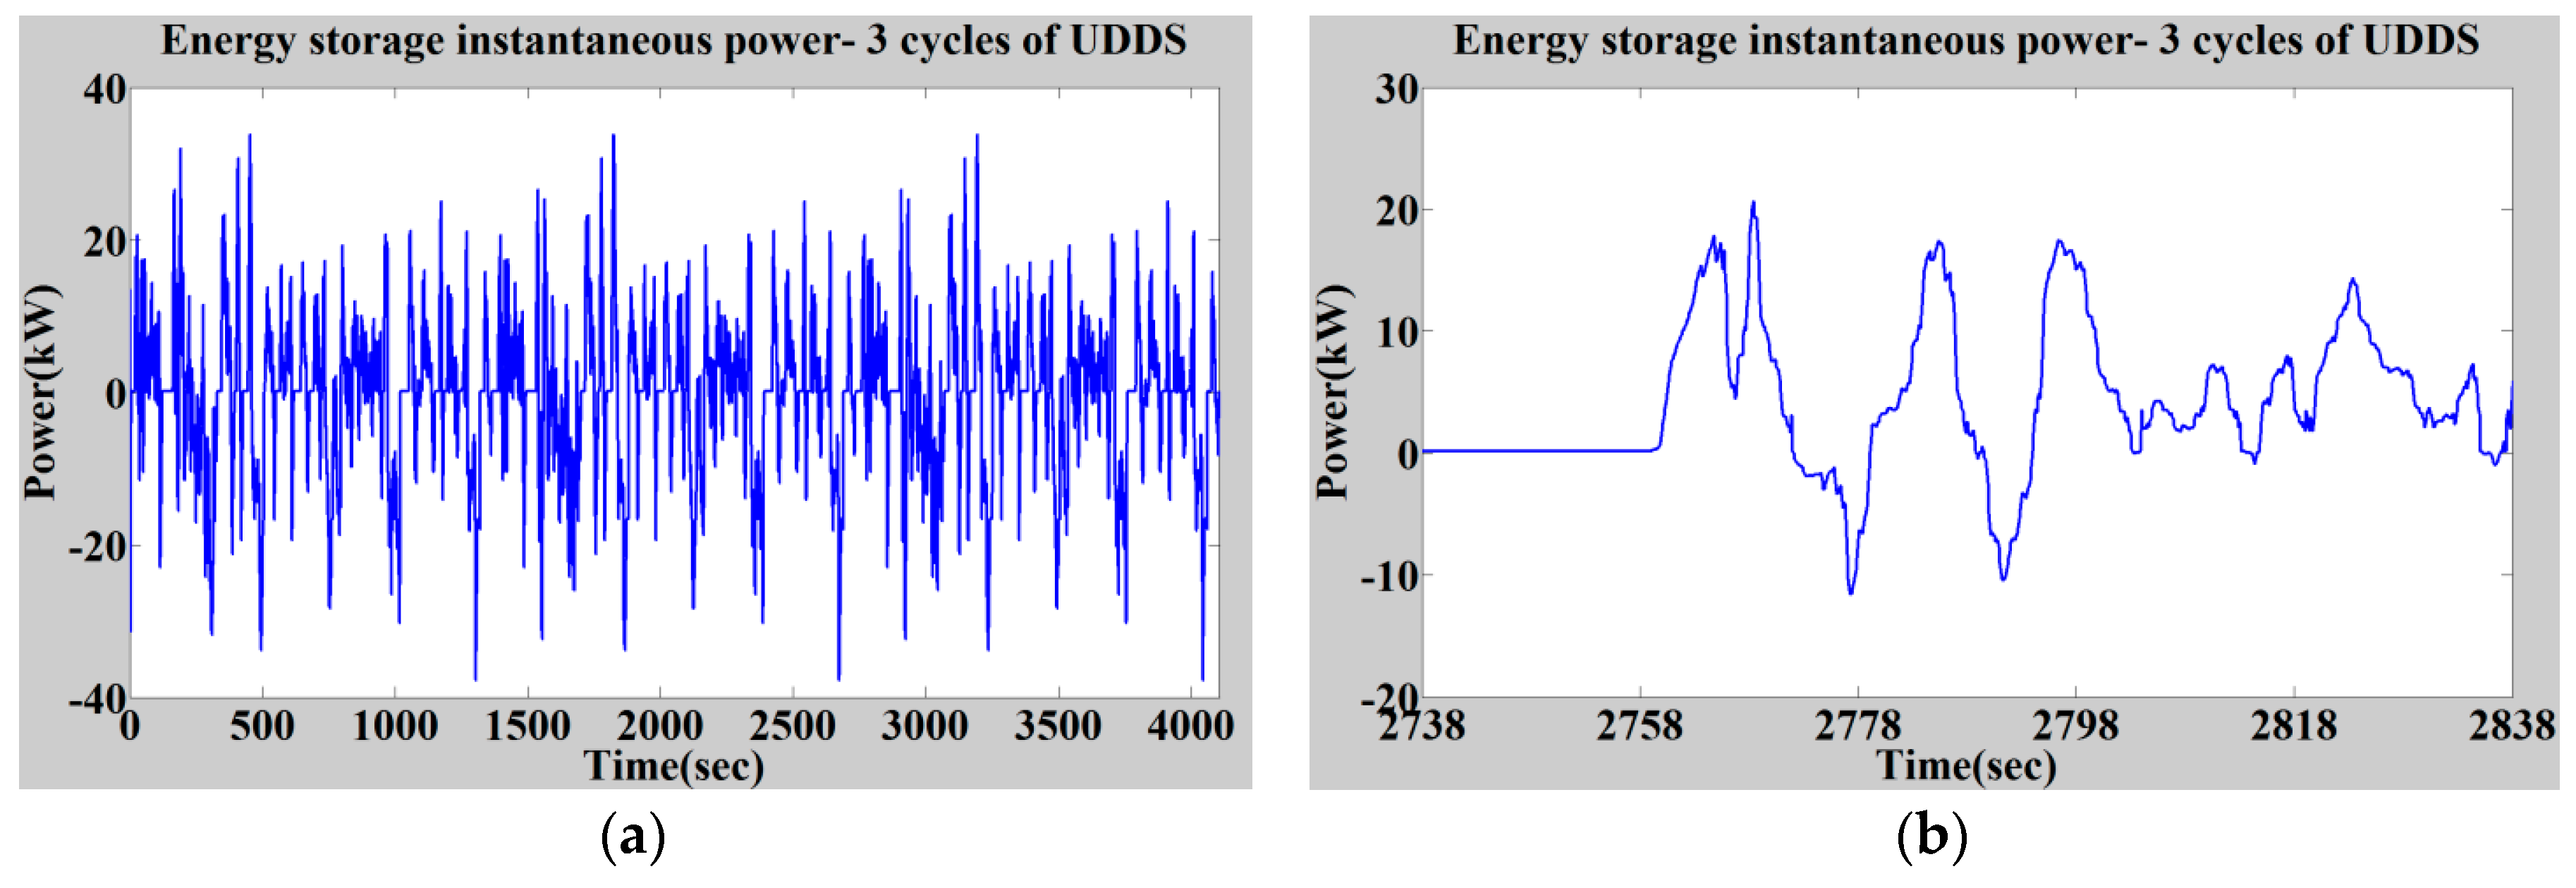
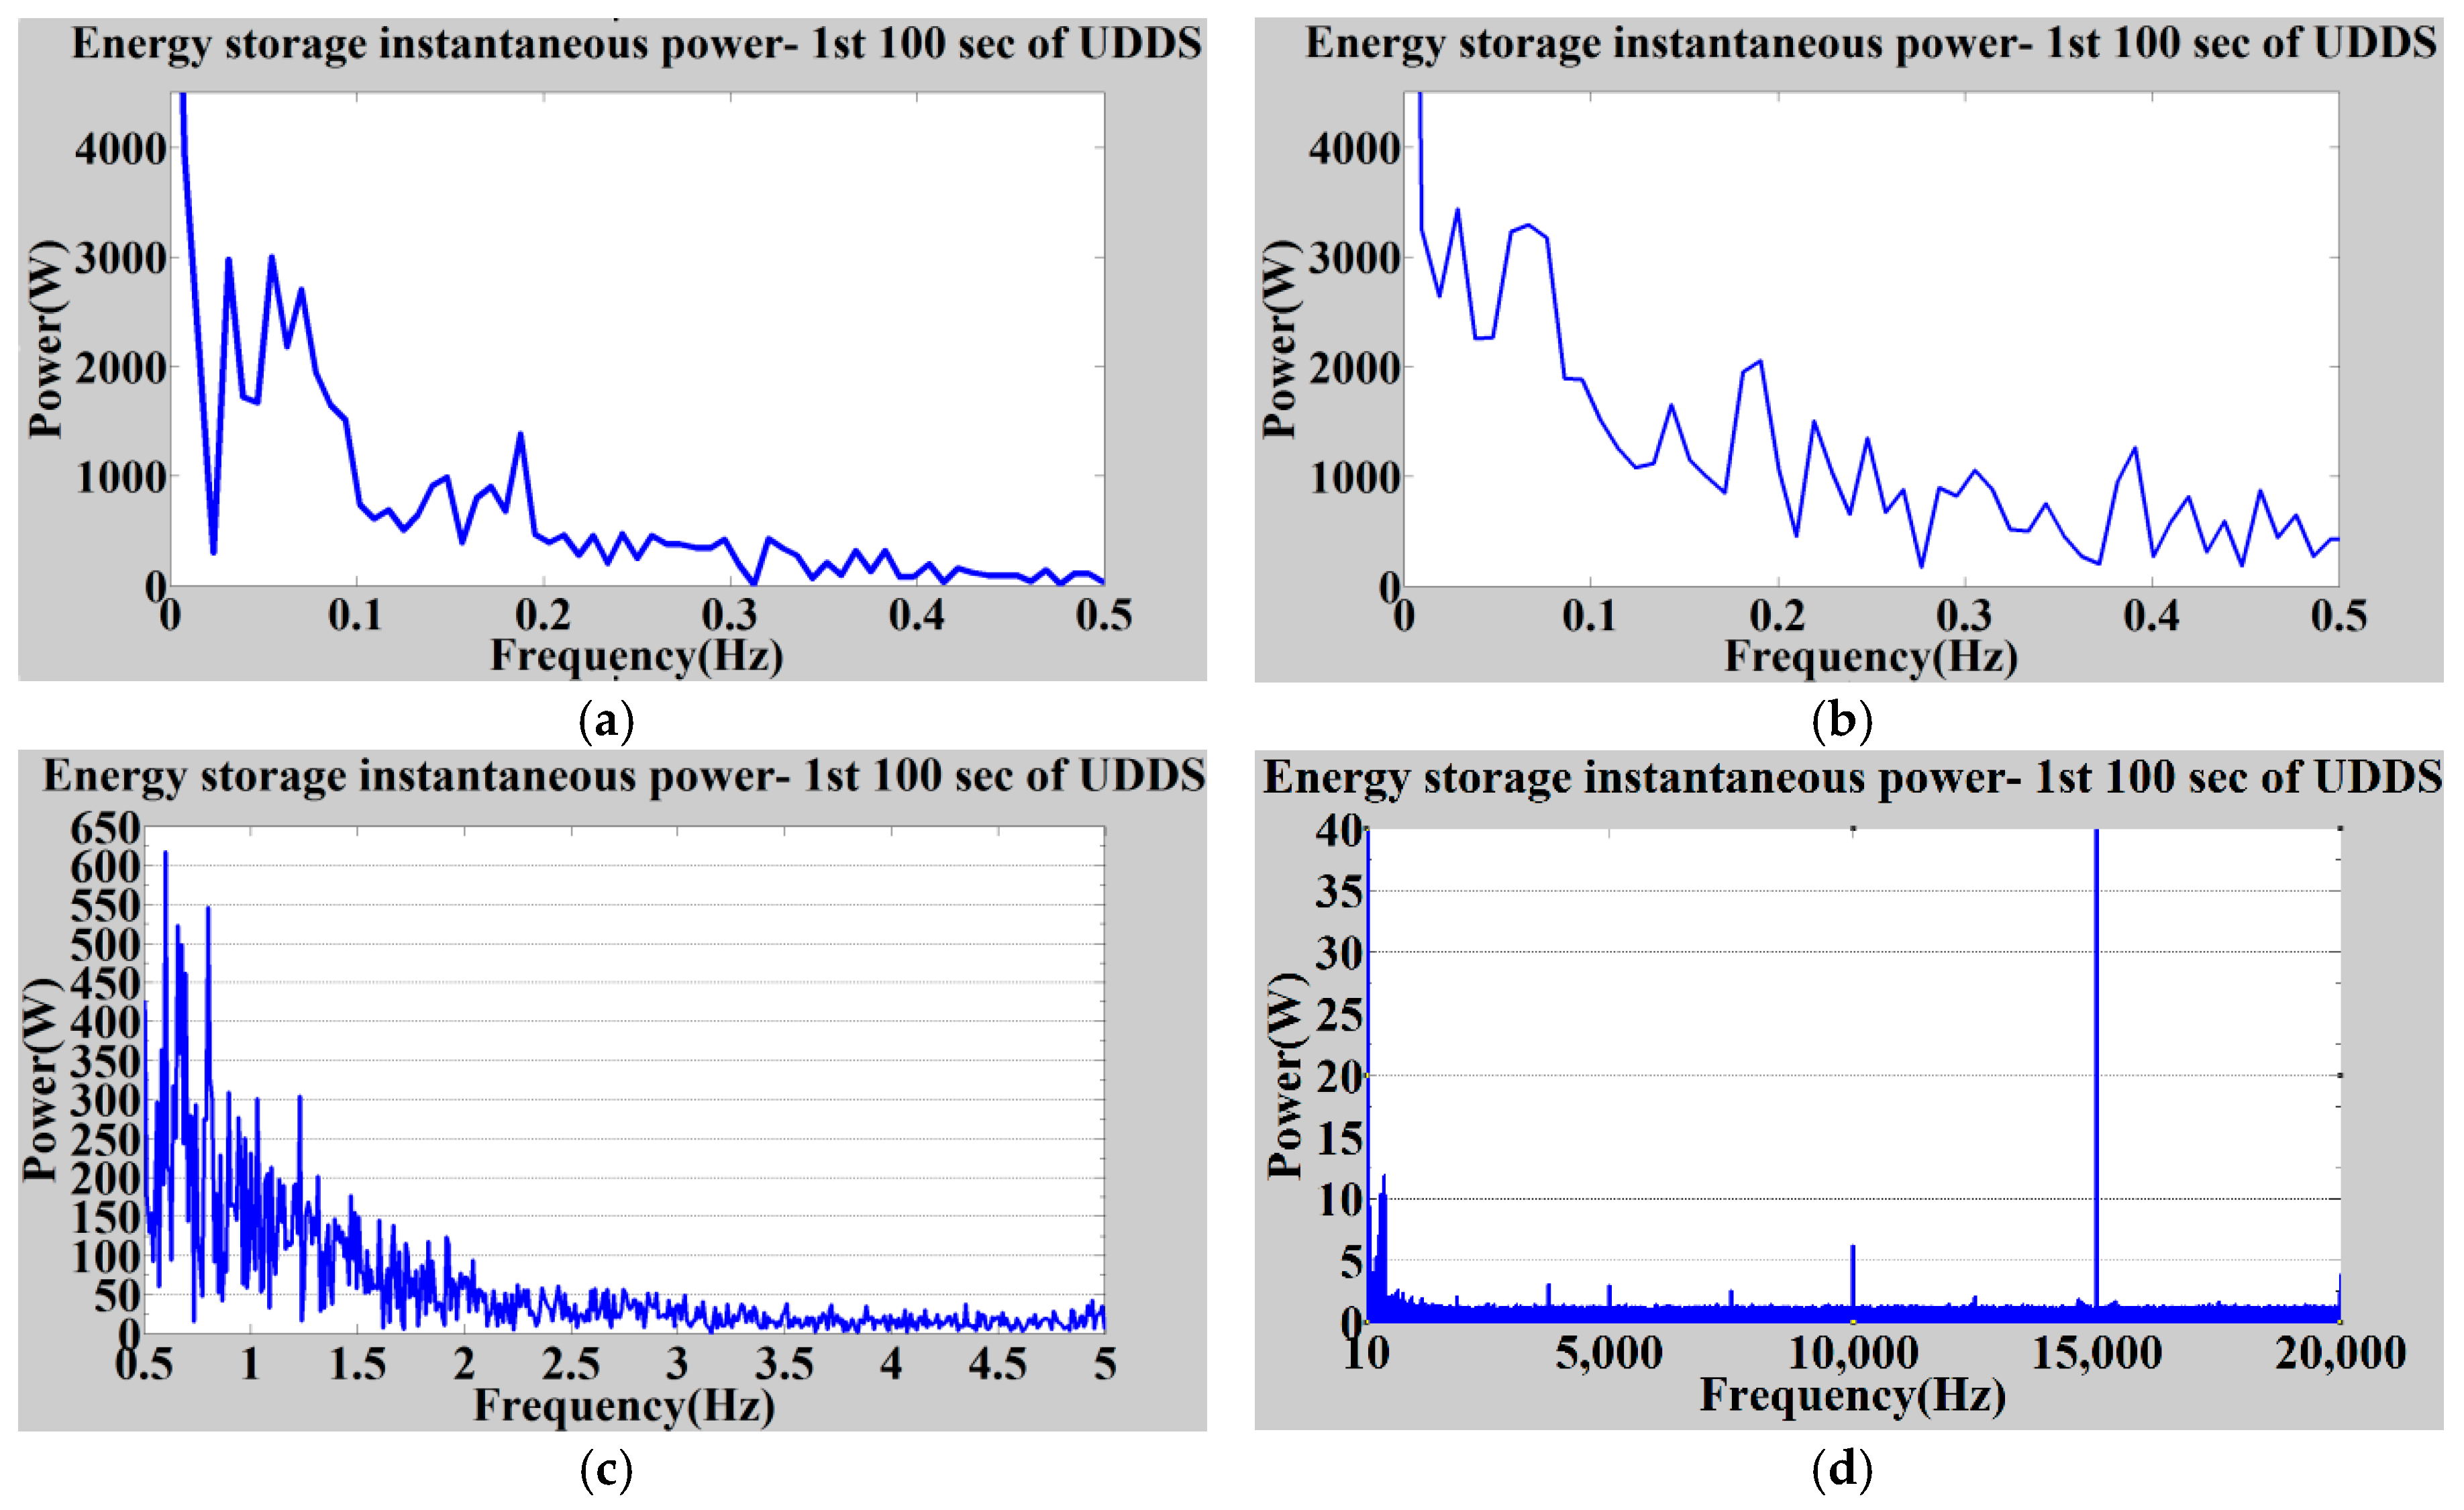
The United States Environmental Protection Agency (EPA) designs standard drive cycles which simulate city (UDDS), highway (HWFET), and high acceleration aggressive (US06) driving conditions. They are usually vehicle speed profiles sampled at 1 Hz over a period of time thereby limiting information available for evaluating or designing HESS at frequencies above that bandwidth (
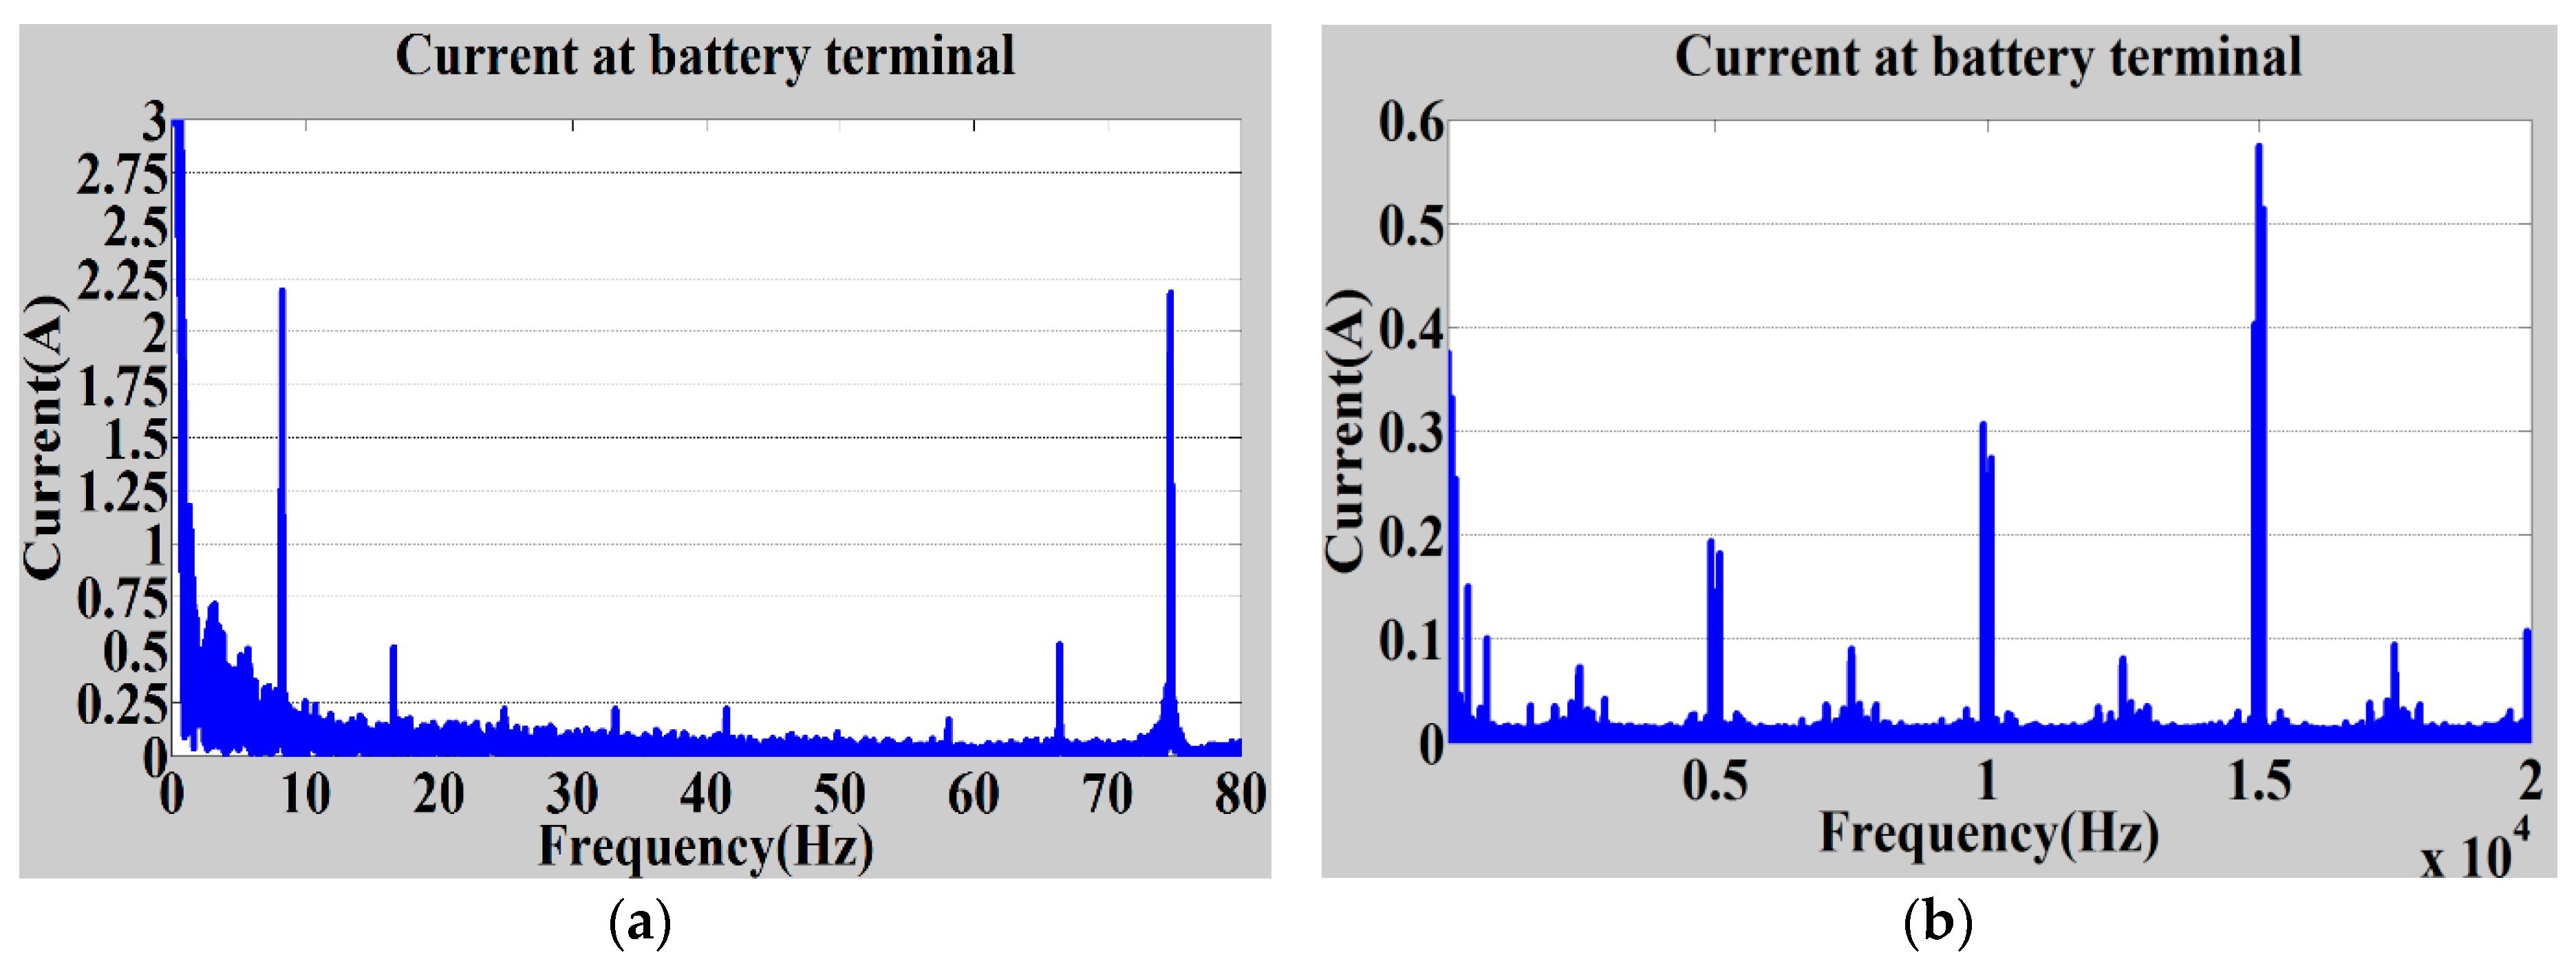
Figure 1a). In reality, the instantaneous power on the HESS side contains content with higher frequency (Figure 1b–d).
The frequency response bandwidth of the battery or even the UC is insufficient to cover this content efficiently, so the resulting dissipation and heating in the ESS will not be predicted. In addition to causing thermal management issues, these harmonics cause power loss which adversely affects the fuel economy. Data shown in Figure 1a is obtained by exciting the model of the reference vehicle of this study by a published 1 Hz UDDS drive cycle. Data illustrated from Figure 1b–d was collected empirically on a chassis dynamometer using a series-hybrid-electric Chevrolet concept car built by the Center for Advanced Vehicular Systems at Mississippi State University for the Department of Energy (DoE) EcoCar competition. The MATLAB Fast Fourier Transform (FFT) function is used to transform the time-domain data into the frequency domain.
In EV’s and HEV’s, several reasons for higher frequency content, other than natural responses regarding natural frequencies of the power-train caused by multiple electrical and mechanical sub-systems, can be listed. First, the most important source of frequency content at a few Hz is the load transition when a driver requests torque. These harmonics are not quantified in the literature. A second potential source is the switching behavior of the inverter in the dc motor drive. Harmonic currents are observed in the dc current, the frequencies and magnitudes of which depend on the type of inverter switching control algorithm. Magnitudes are significant enough so that capacitors or active power filtering devices are necessary [29]. The motor drive switching harmonics are usually studied in isolation from the power-train energy storage. And yet, partially filtered switching harmonics are observed on the power bus at the HESS. A third source is flux linkage harmonics in the permanent magnet motor. Harmonics with a frequency of a few hundred Hz can be measured while stepping torque at a constant speed [31]. A fourth source might exist as a result of common-mode currents associated with the high slew rate dv/dt and di/dt of power devices coupling with parasitic impedances such as those related to electric machines, high voltage cables, heat sinks, or circuit layout. This phenomenon includes AM medium wave (MW) radio disturbances (typically around 530 kHz–1.7 MHz) [32]. This latter phenomenon is not within the scope of this study; this work is limited to harmonics with frequencies below 20 kHz.

3. Bandwidth Based HESS Design

To design a HESS for EV’s or HEV’s which will effectively respond to requested instantaneous power as depicted from Figure 1b–d, a bandwidth-based methodology for designing the HESS is proposed. First, the concept of bandwidth is reviewed from the energy storage view, and then the bandwidth-based HESS design concept is described.

3.1. Energy Storage Devices’ Bandwidths

Analyzing the bandwidth of a simple RC branch helps explains the concept of bandwidth-based HESS design better. This is because at our targeted bandwidth, the capacitors can be estimated by an ideal capacitor and a series resistor. A battery, around a certain operating point, can also be estimated by an ideal capacitor, which is a function of capacity of battery in A.S and rate of change of VOC-SOC curve, and equivalent series resistor. In the Laplace domain, the voltage drop across the resistor and capacitor can be expressed by:
V R ( s ) = R C s 1 + R C s V o u t ( s )
V C ( s ) = 1 1 + R C s V o u t ( s )
where VR, VC and Vout are voltage of resistance, capacitor the overall voltage of RC. When AC power is requested at the output of the RC branch, the ratio of voltage across the capacitor to the output voltage varies depending on the frequency of the applied signal. This relationship can be shown using Bode plots of different RC branches (See Figure A1). For lower frequency, this gain is almost unity, and no drop in magnitude is observed; however, at f = 1 2 π R C , the so called −3 dB bandwidth frequency, the magnitude across the capacitor is reduced by 1/√2. It is natural that for the same magnitude of power (the same AC current and voltage), when the frequency increases, the capacitor voltage reduces; consequently, the resistor voltage increases to meet Kirchhoff’s Voltage Law.
Therefore, when the RC branch represents an energy storage device (ESD), operating beyond the −3 dB bandwidth frequency incurs considerable power dissipation and as a result, the efficiency of energy storage drops significantly. Energy storage devices can be characterized by their bandwidth. ESD classifications can be found in a Ragone plot which is a useful reference for comparing and selecting energy storage devices (see Figure 2). Here ESD’s are characterized by the energy and the power they can make available to a load. First of all, the plot illustrates the power density and the energy density limitation of each type of EDS. For instance, maximum energy density and maximum power density of UC are respectively a couple of tens of kJ/kg and tens of kW/kg. However, more importantly for this study, they provide the bandwidth characteristics of each device. Lines crossing the map show cut off frequencies; for instance, battery bandwidth is about 10 mHz while the bandwidth of UC is less than a Hz. In other words, each component of an ESD supports an optimum frequency band toward the vehicle power-train requirements. It is noted that for estimating typical battery bandwidth, non-linear battery’s model has been linearized around a certain state of charge, in this case, 50 percent.

3.2. Design Concept

In HEVs or EVs, current at the energy storage terminal has a similar spectrum as shown for power in Figure 1b–d. It can be represented in Fourier series form by summation of a DC value and complex sinusoids, the amplitudes and frequencies of which are determined by FFT (Equation (3)).
I E S S , n 1 N n = 0 N 1 ( I k e j 2 π k n / N )
where N is length of samples, n and k represent any point belong to the sample points respectively in time and frequency domain: n   [ 0 , N 1 ]   and   k   [ 0 , N 1 ] .
Therefore, instantaneous power or current at the output of the energy storage is a complex time-domain waveform represented in the frequency domain with a wide bandwidth; it is evident that the bandwidth of battery is insufficient to respond to the applied current efficiently. Hence, to design an efficient HESS for EV’s or HEV’s, suitable ESD elements should be selected by linking the bandwidth characteristics on Ragone plot to the load bandwidth from a Bode plot. Therefore, referring to Figure 2, batteries are typically used for less than 10 mHz; UC is suitable for a frequency band of 10 mHz to 0.2 Hz; Electrolytic capacitors efficient for a frequency band of 0.2 Hz to 2 kHz; and film capacitors are good for 2 kHz to 10 MHz.
In general form, the HESS schematic of Figure 3 can be proposed where three capacitor branches are for modeling the film, electrolytic and UC and two branches for representing two different battery chemistries (one power dense and the other energy dense). Traction and non-traction power loadings are shown as a current source at the output. A dc current source also is shown on the left to model the engine operating point; a small number of discrete operating points are considered for the engine to improve fuel economy [30]. In Figure 3, UC and battery values are shown referred to the high-voltage bus taking into consideration the possibility of using dc/dc converters to interface to the bus. However, with dc/dc converters there is always a trade-off between having them and as a result gaining better performance and not having them and saving money and reducing complexity. In this study, which is the first part of a more comprehensive study, the schematic is simplified to a passive connection of ESD’s to test and validate the idea of bandwidth-based HESS design. In a future study, a new method of active hybridization will be used.
In Figure 3, Ck represents the main non-linear or linear capacitance of ESD while Ckj and Rkj model transient behavior of battery. Rk shows the equivalent series resistance of each ESD. EL, UC, and film are abbreviation for Electrolytic, ultra and film capacitors. “n” stands for ratio of dc/dc converters which interface the batteries to the dc bus.
The methodology of bandwidth-based HESS design is based on two distinct methods, one for low-frequency components and one for high-frequency components. In [30], the first method is explained, and the result of that study is used for selecting the size of the battery and the UC in this manuscript which will be described in Section 4. In Section 5, a higher frequency analysis is used to size electrolytic and film capacitors.

4. Reference Vehicle Model

In reference [30], a methodology was proposed for selecting the size of ESS for a hybrid electric vehicle with minimal AEM. The method is a parametric study over the size of different off-the-shelf batteries and UCs for achieving maximal fuel economy. Each option investigated under the parametric study is implementable meaning that it is realizable in pack form and has necessary features such as SOC balancing. Eventually, four minimal size hybrid and non-hybrid ESS candidates have been discovered for Series HEV with minimal ESS; however, the method can be adapted for any type of electrified vehicles including PHEV and BEV. The specifications of major components of power-train of this reference vehicle are also used for a current study. HESS specification in this study is selected based on what has been learned the minimal size strategy and parametric study. A battery is sized to supply a bandwidth below 0.2 Hz when the engine is off while UC size selected in a way that load with a bandwidth above 0.2 Hz is covered. Although it is unlikely if the energy storage is not capable of meeting load demand engine turns on to meet the deficiency. The power-train specification will be used in this manuscript as the reference power-train for analyzing the impact of full bandwidth load on the performance and size of HESS. Specification of components of power-train in this study is summarized in Table 1.

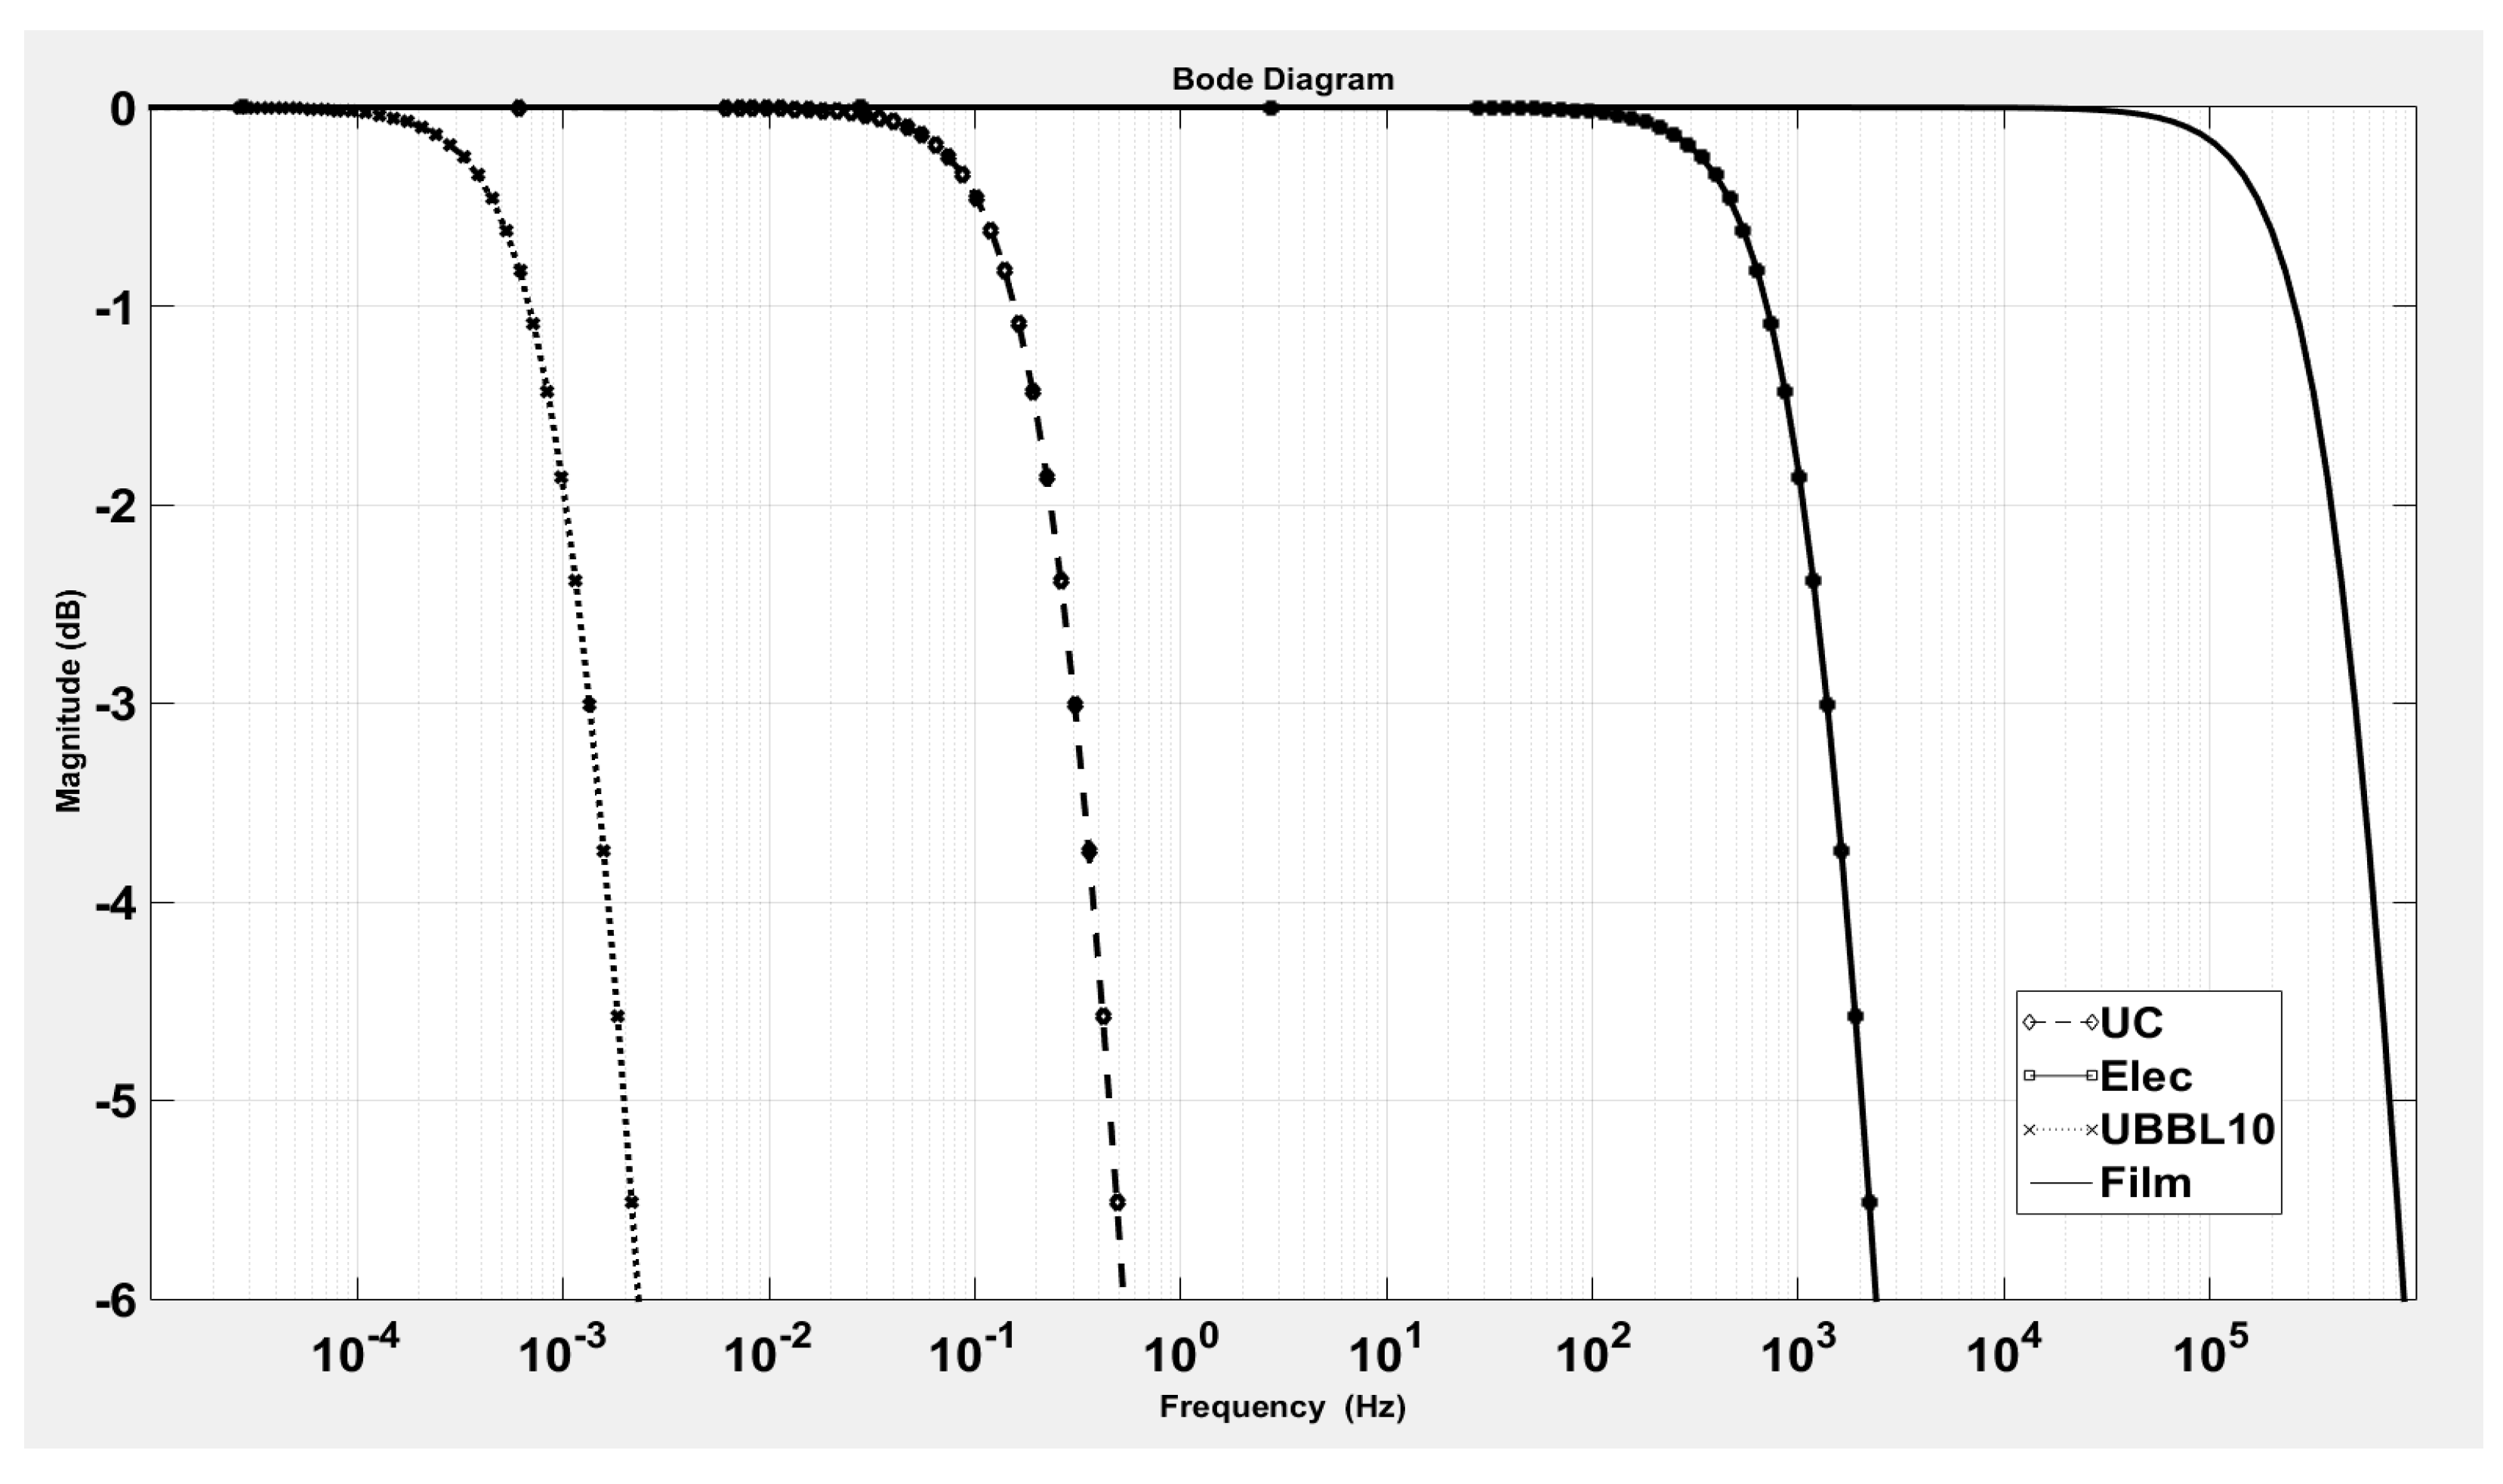
5. HESS Design Analysis for High Bandwidth Components

According to Figure 1b–d in 
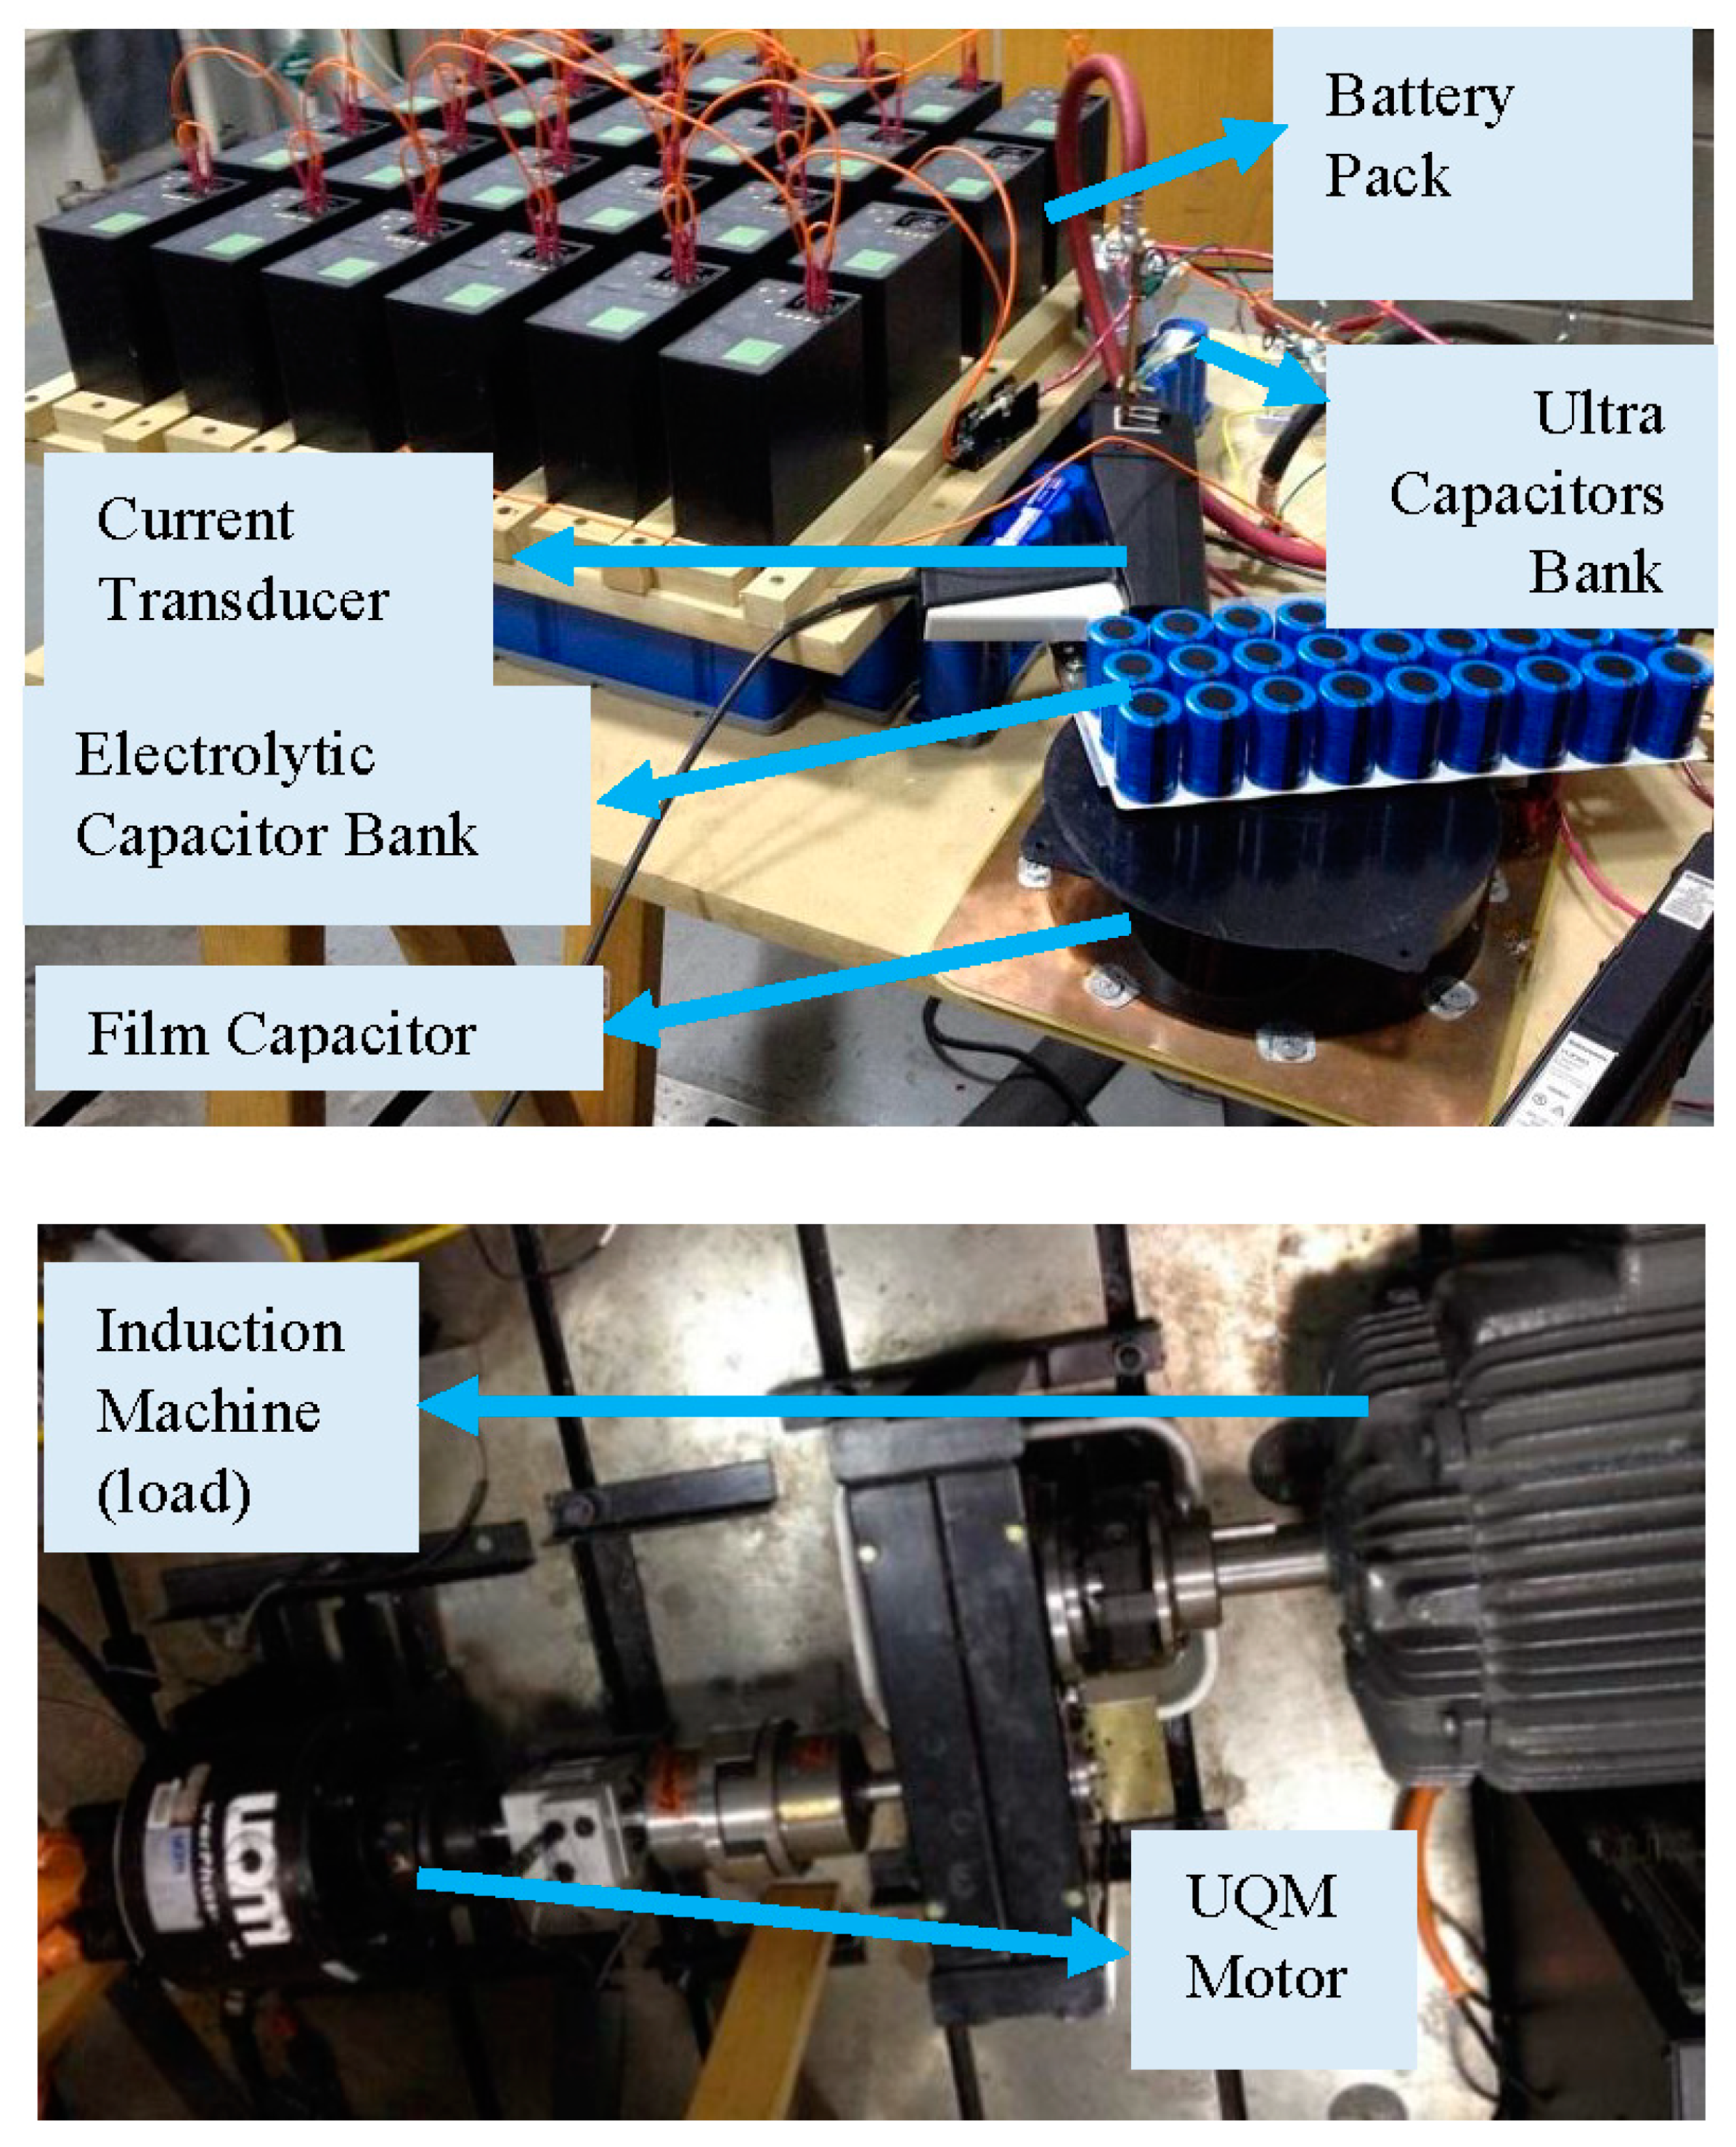
Section 2, dc-link current harmonics with a frequency above 0.5 Hz exist which are not included in the standard drive cycle. Although several potential sources have been identified for this higher bandwidth, there is no classified and standard data like the drive cycle with the higher sampling frequency. Also, the transfer function between ESS current and exciting inputs like pedals, gate signals of power converter devices and also disturbances is very complex to be modeled in enough details which reflect the full bandwidth load at ESS terminal. Therefore, an experiment was used to generate reference data above 0.5 Hz. A UQM 75-kW permanent-magnet motor and matched motor drive is used as the vehicle traction motor; a 55-kW induction machine with a four-quadrant motor drive is mechanically coupled to the UQM to act as a load; and a 330-V battery pack along with 22 UBBL10 modules from UltraLife with two parallel branches provides energy to the UQM drive (Figure 4).
At constant speed, no-load, light-load (17 Nm), heavy-load (52 Nm), and intermediate-load (32 Nm) steps are applied to the motor shaft during one time sequence which simulates a driver’s possible torque requests. In this test, the motor controller is in speed control mode at 500 RPM when the torque steps are carried out. DC current at the input of the motor drive is sampled at 40 kilo-samples per second. The test takes 100 s, where load change happens every 25 s from no load to light, heavy, and finally intermediate load.
This data captured from this subscale test is linearly scaled to 100 kW to represent a YASA-400 motor with peak power of 100 kW. The maximum power here is approximately 2.5 kW while the reference vehicle requires almost 100 kW of peak power to satisfy the US06 drive cycle. The scaled battery current frequency spectrum is illustrated in Figure 5. While the scale factor may be large, it is justified by the expectation that the motor-drive current scales approximately linearly with torque. The MATLAB Fast Fourier Transform (FFT) function is used to transform the time-domain data into the frequency domain.
This data includes frequency spectra associated with load transitions and provide valuable information for designing the high-frequency components of a HESS. The most aggressive step happens at time = 25 s; so the 1.5 s of current samples after this point are selected for sizing electrolytic and film capacitor. This period of time is sufficient to include both load transition harmonic contents (shown in Figure 5a,b) and switching frequency harmonic contents (factors of 15 kHz shown in 
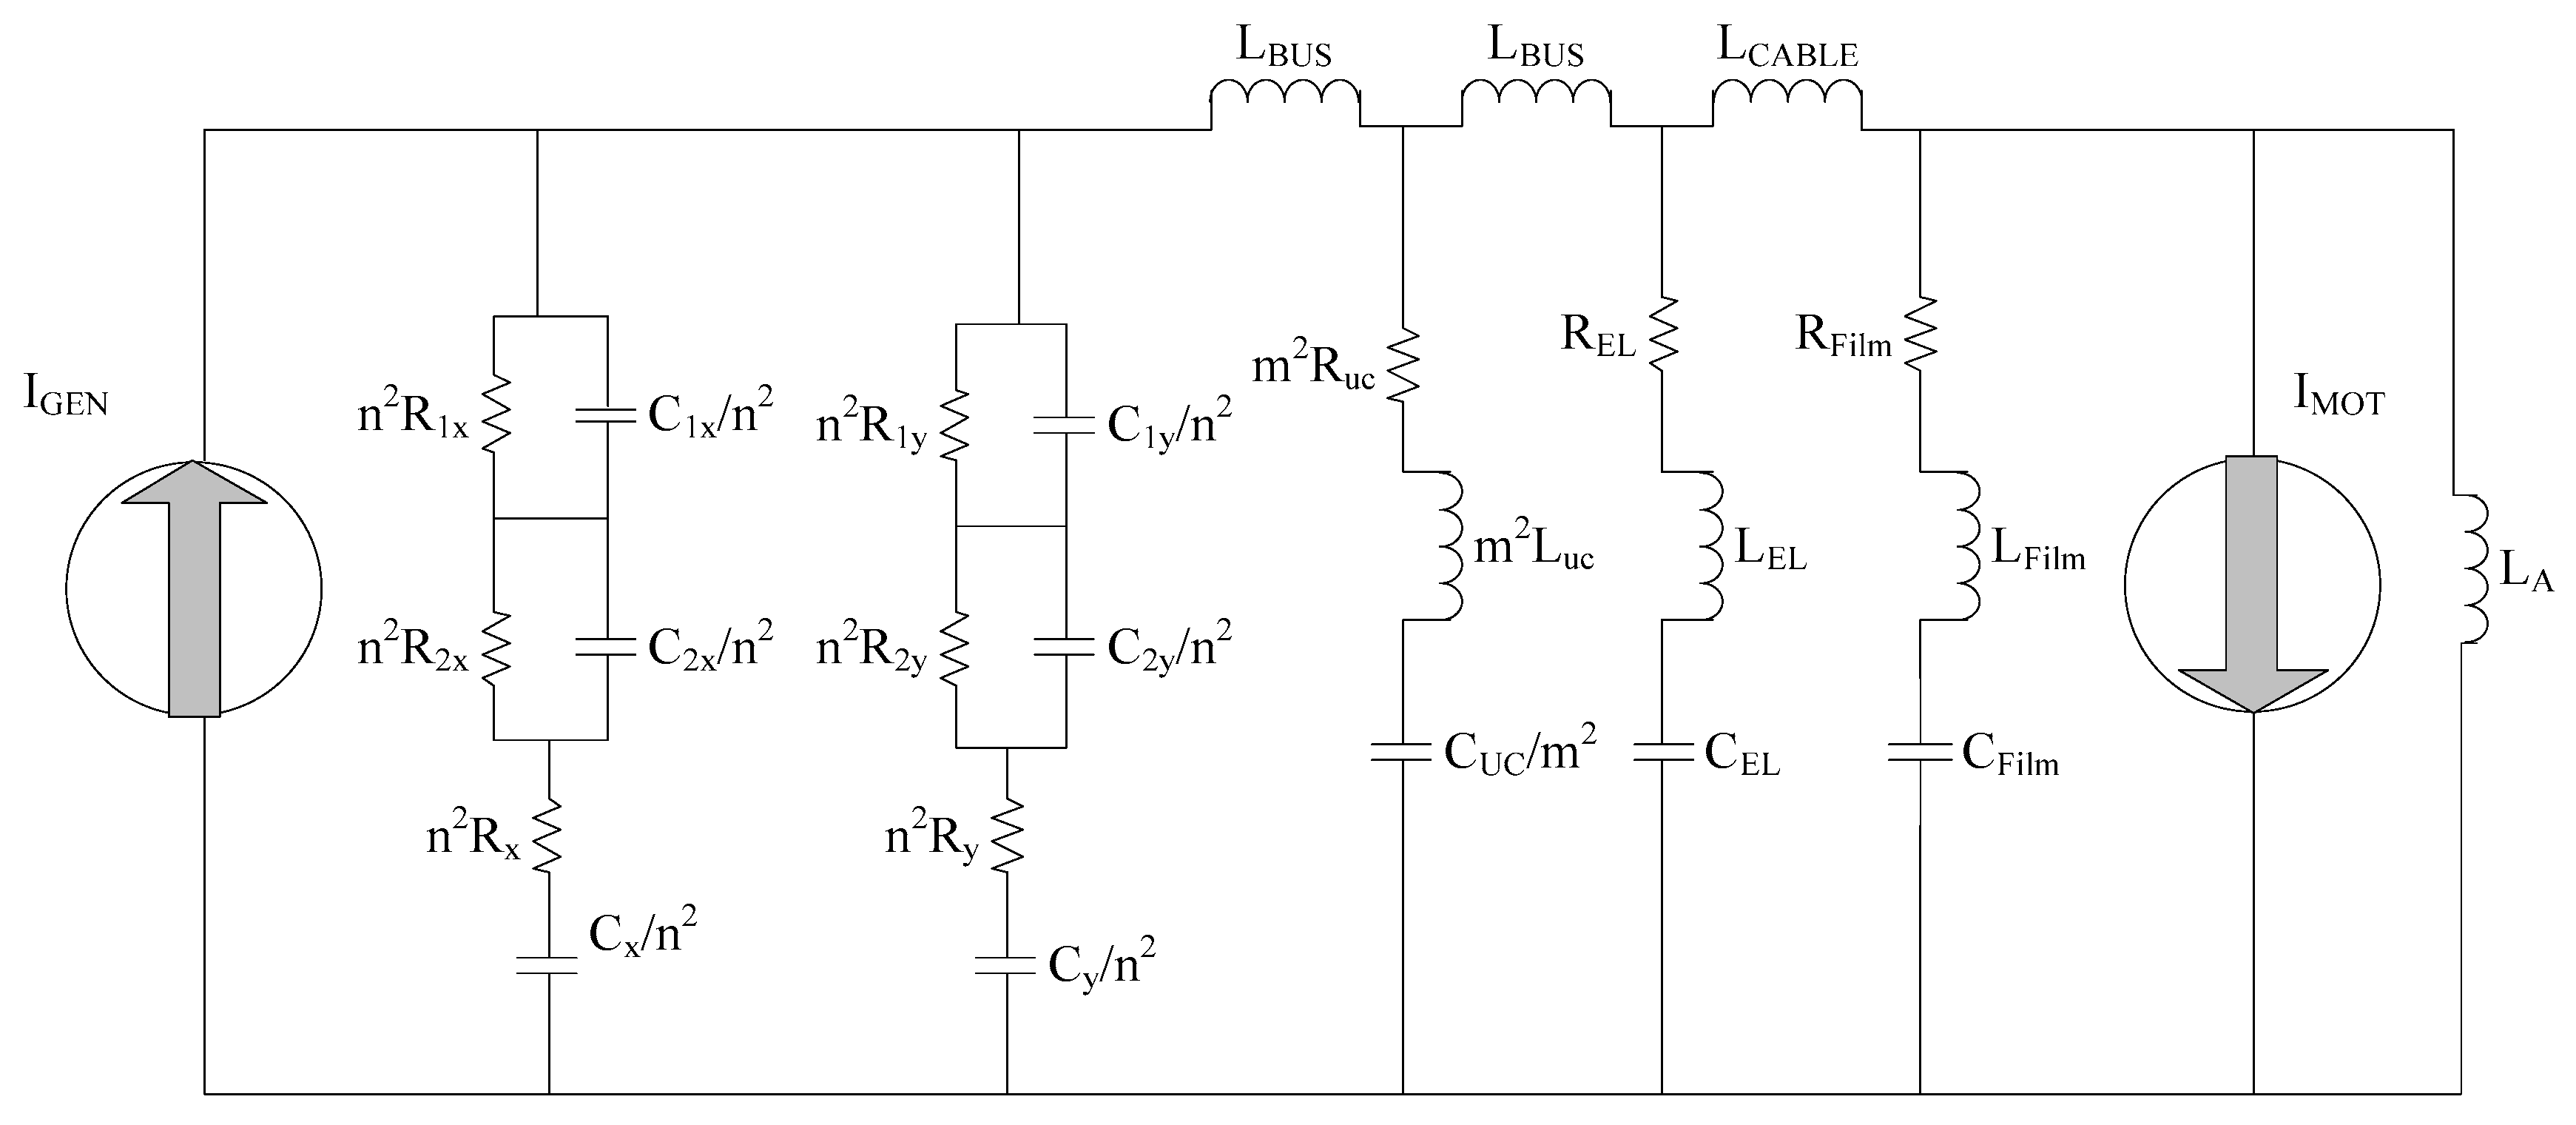
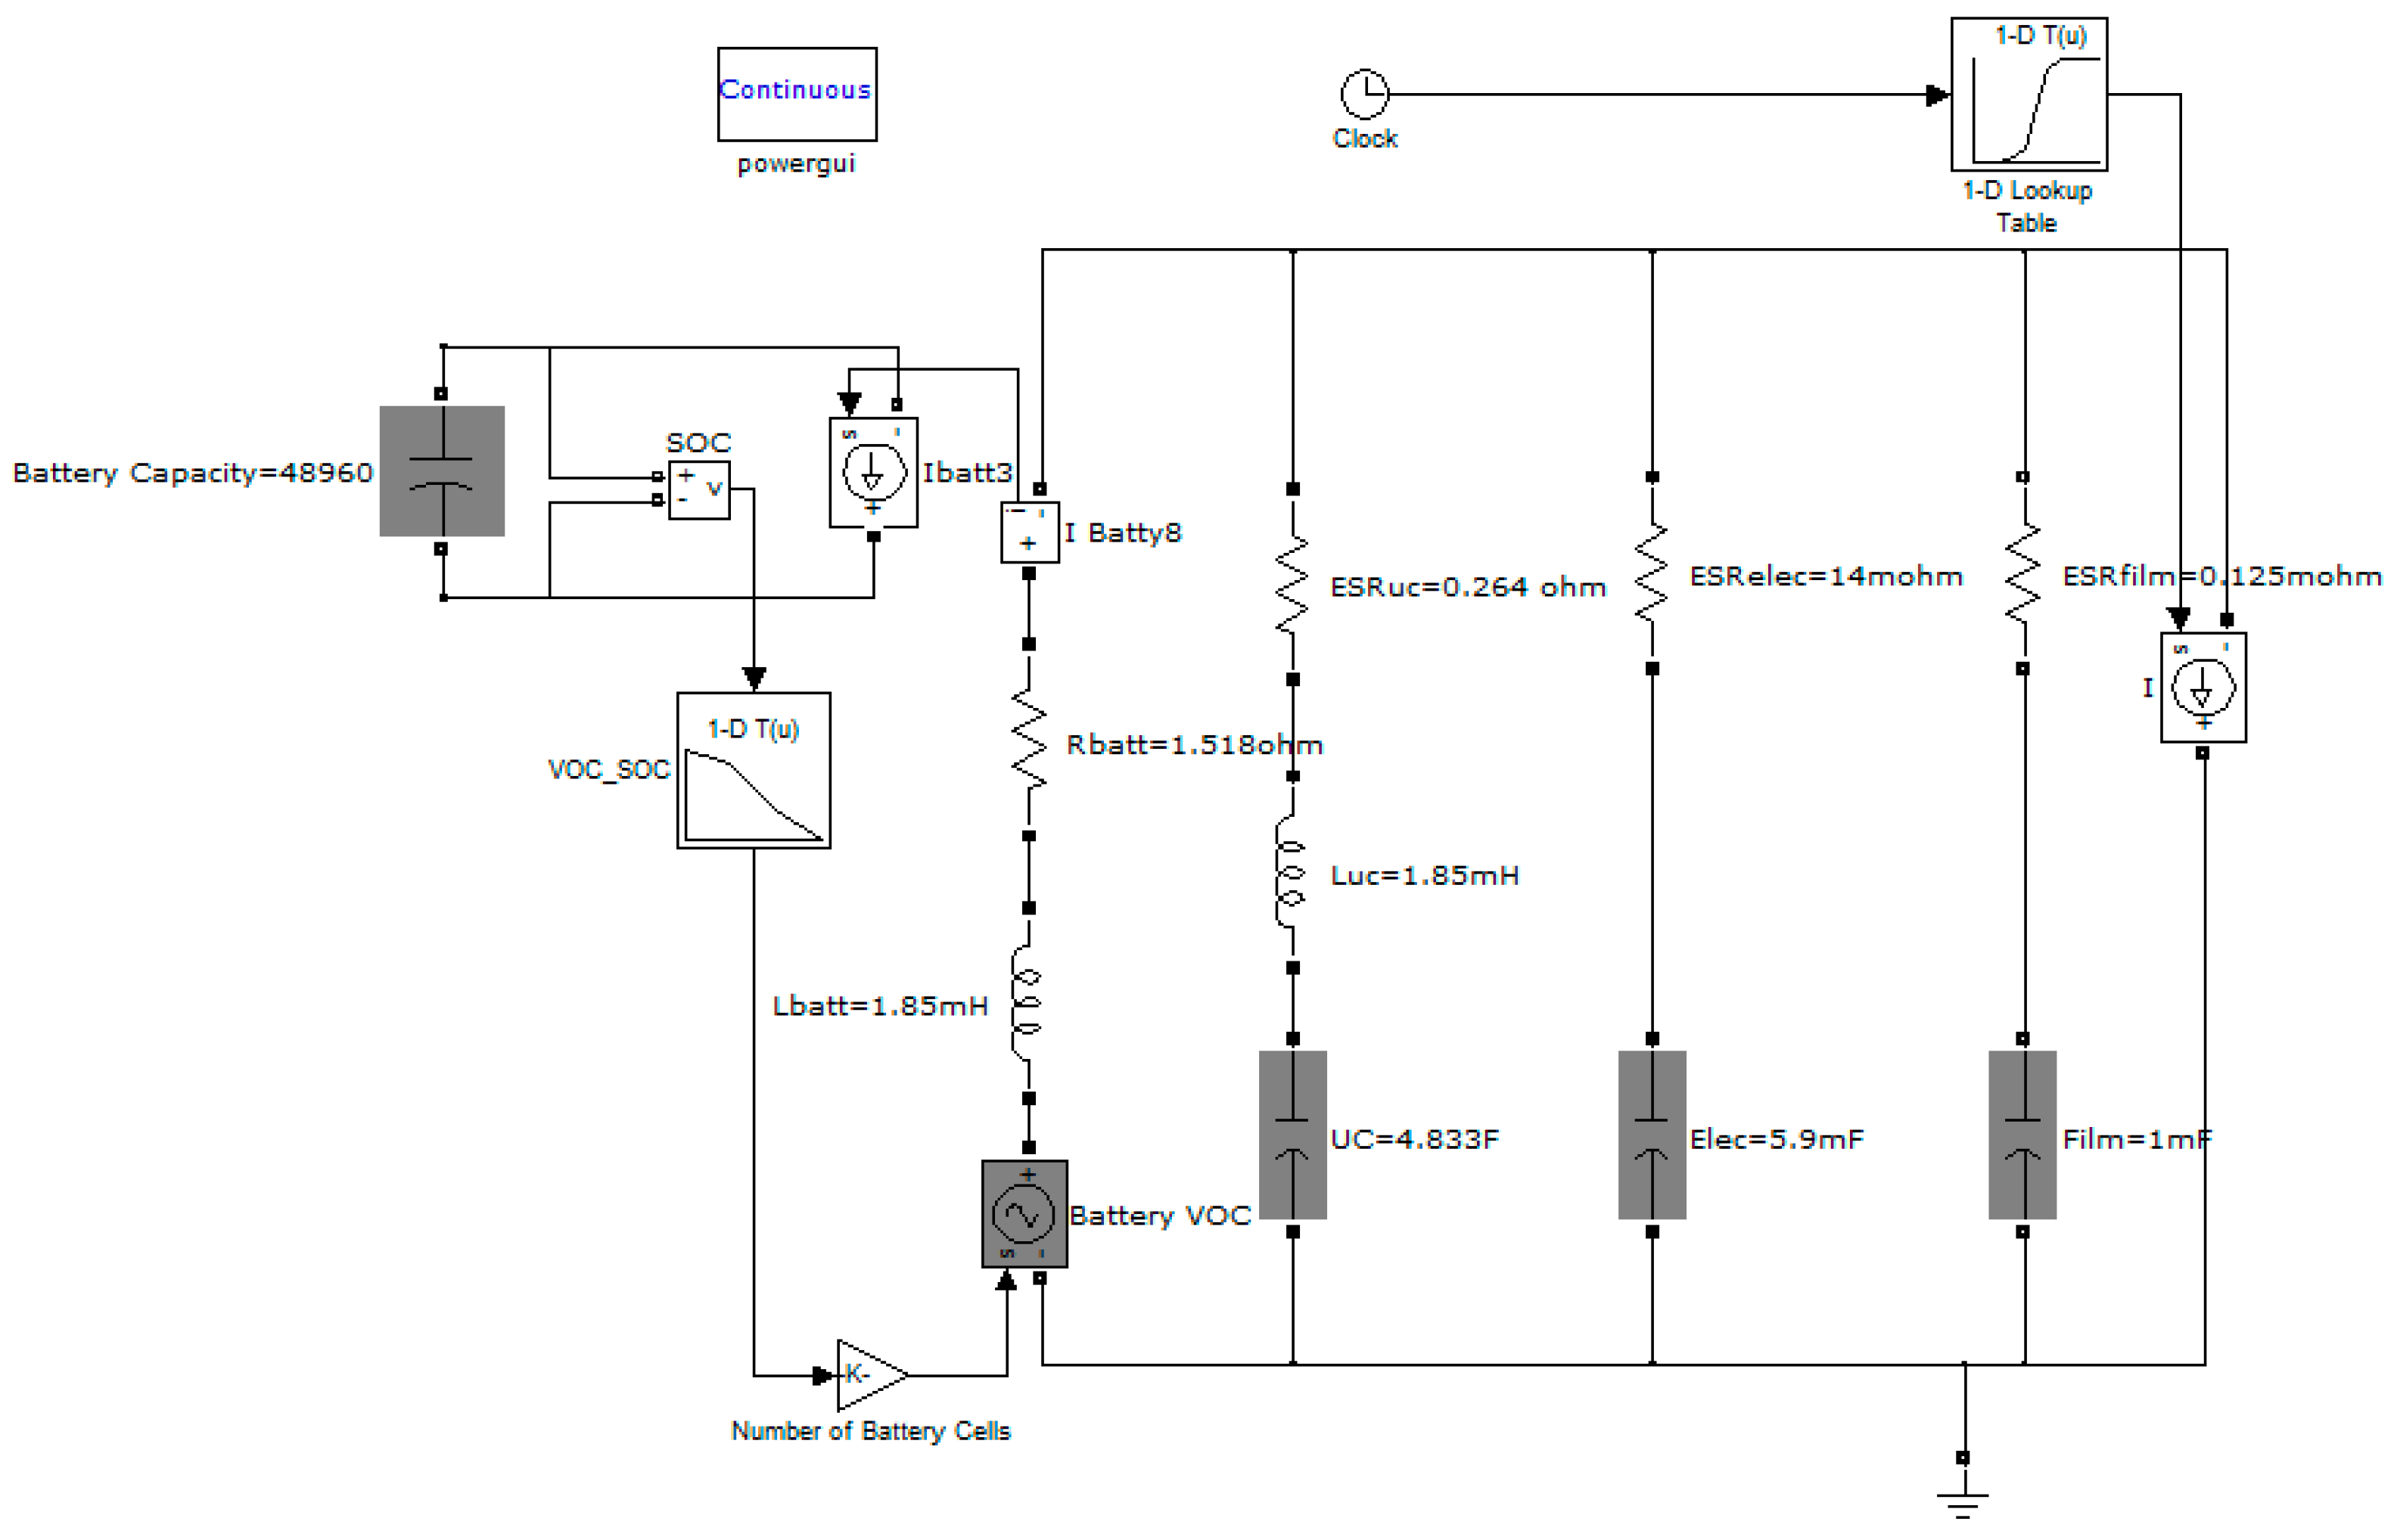
Figure 5b). Empirically measured current is injected at the terminal of the HESS in a time domain study in Simulink (Figure 6). Power dissipation in the UC branch is studied before and after adding electrolytic capacitors without having film capacitors in the HESS. The electrolytic capacitors are sized in a way that the largest peak-to-peak bus voltage ripple is limited to 35 V—almost 10 percent of DC bus nominal voltage. For this purpose, a parametric study over the size of the different off-the-shelf electrolytic capacitor has been carried out. Two options from Kemet and two options from Cornell Doubilier each meeting the specified ripple requirement were studied (Table 2). Parasitic inductance (ESL) of battery and UC branches should be included in the model to model the voltage ripples caused by switching. For electrolytic and film capacitor these ESLs are in the nH range, so they are neglected which also simplifies the process of finding acceptable electrolytic and film capacitor candidates.
A similar study over the size of different available film capacitor options was conducted as well. Film capacitors up to 1000-μF are considered in this second parametric study. A film capacitor from SB electronics was selected and used with the electrolytic capacitors and the UC, the value of which is labeled in the schematic (Figure 6). Table 3 compares RMS values of displacement currents and power losses in various configurations. After adding electrolytic capacitors, without adding film capacitor, the overall power loss is reduced by 25 W (Table 3). This dissipation is not captured when analyzing the published drives cycles alone. As a result of this reduction, overall efficiency is improved. Adding film capacitors reduces the overall power loss by 4 W, but the reduction is smaller than that of the electrolytic capacitor. It is noted that not only during the worst case transition but also during the steady state situation, the electrolytic capacitor contributes to supplying the high-frequency harmonics associated with switching frequency. Therefore, the benefit of adding electrolytic and film capacitors is not limited to load transitions.

6. Experimental Results and Validations

To validate simulation results in Section 5, a prototype HESS was built. A single-string 384-VDC UC is made by connecting two BMOD0006-E16-B02, 160-VDC modules and four BMOD0058-E016-B02, 16-VDC modules in series; both module models are made by Maxwell. Overall capacitance of this branch is 2.217 F which is half of the overall capacitance of one string of UC, 4.833 F, shown in Table 1 and used in the design section of this study. The electrolytic capacitor bank consists of 27 Cornell Doubilier Model380LX221M500K052 in parallel. The overall capacity of the bank is 5.94 mF, very close to values in Table 2. In addition to UC and electrolytic capacitors, a Model 700D348, 600-VDC, 1000-μF film capacitor from SB Electronics, is used. A two-string 330-VDC battery pack is used to provide DC power to the motor. The battery pack is made from twenty-two 30-VDC UBBL10 modules from UltraLife; each string has eleven modules in series. The overall capacity of the package is 4.75 kWh. Specifications of the UC, electrolytic, and film capacitors are listed in Table 4.
In three steps the UC bank, the electrolytic bank, and the film capacitor are added respectively in parallel with the battery while the same test carried out in 
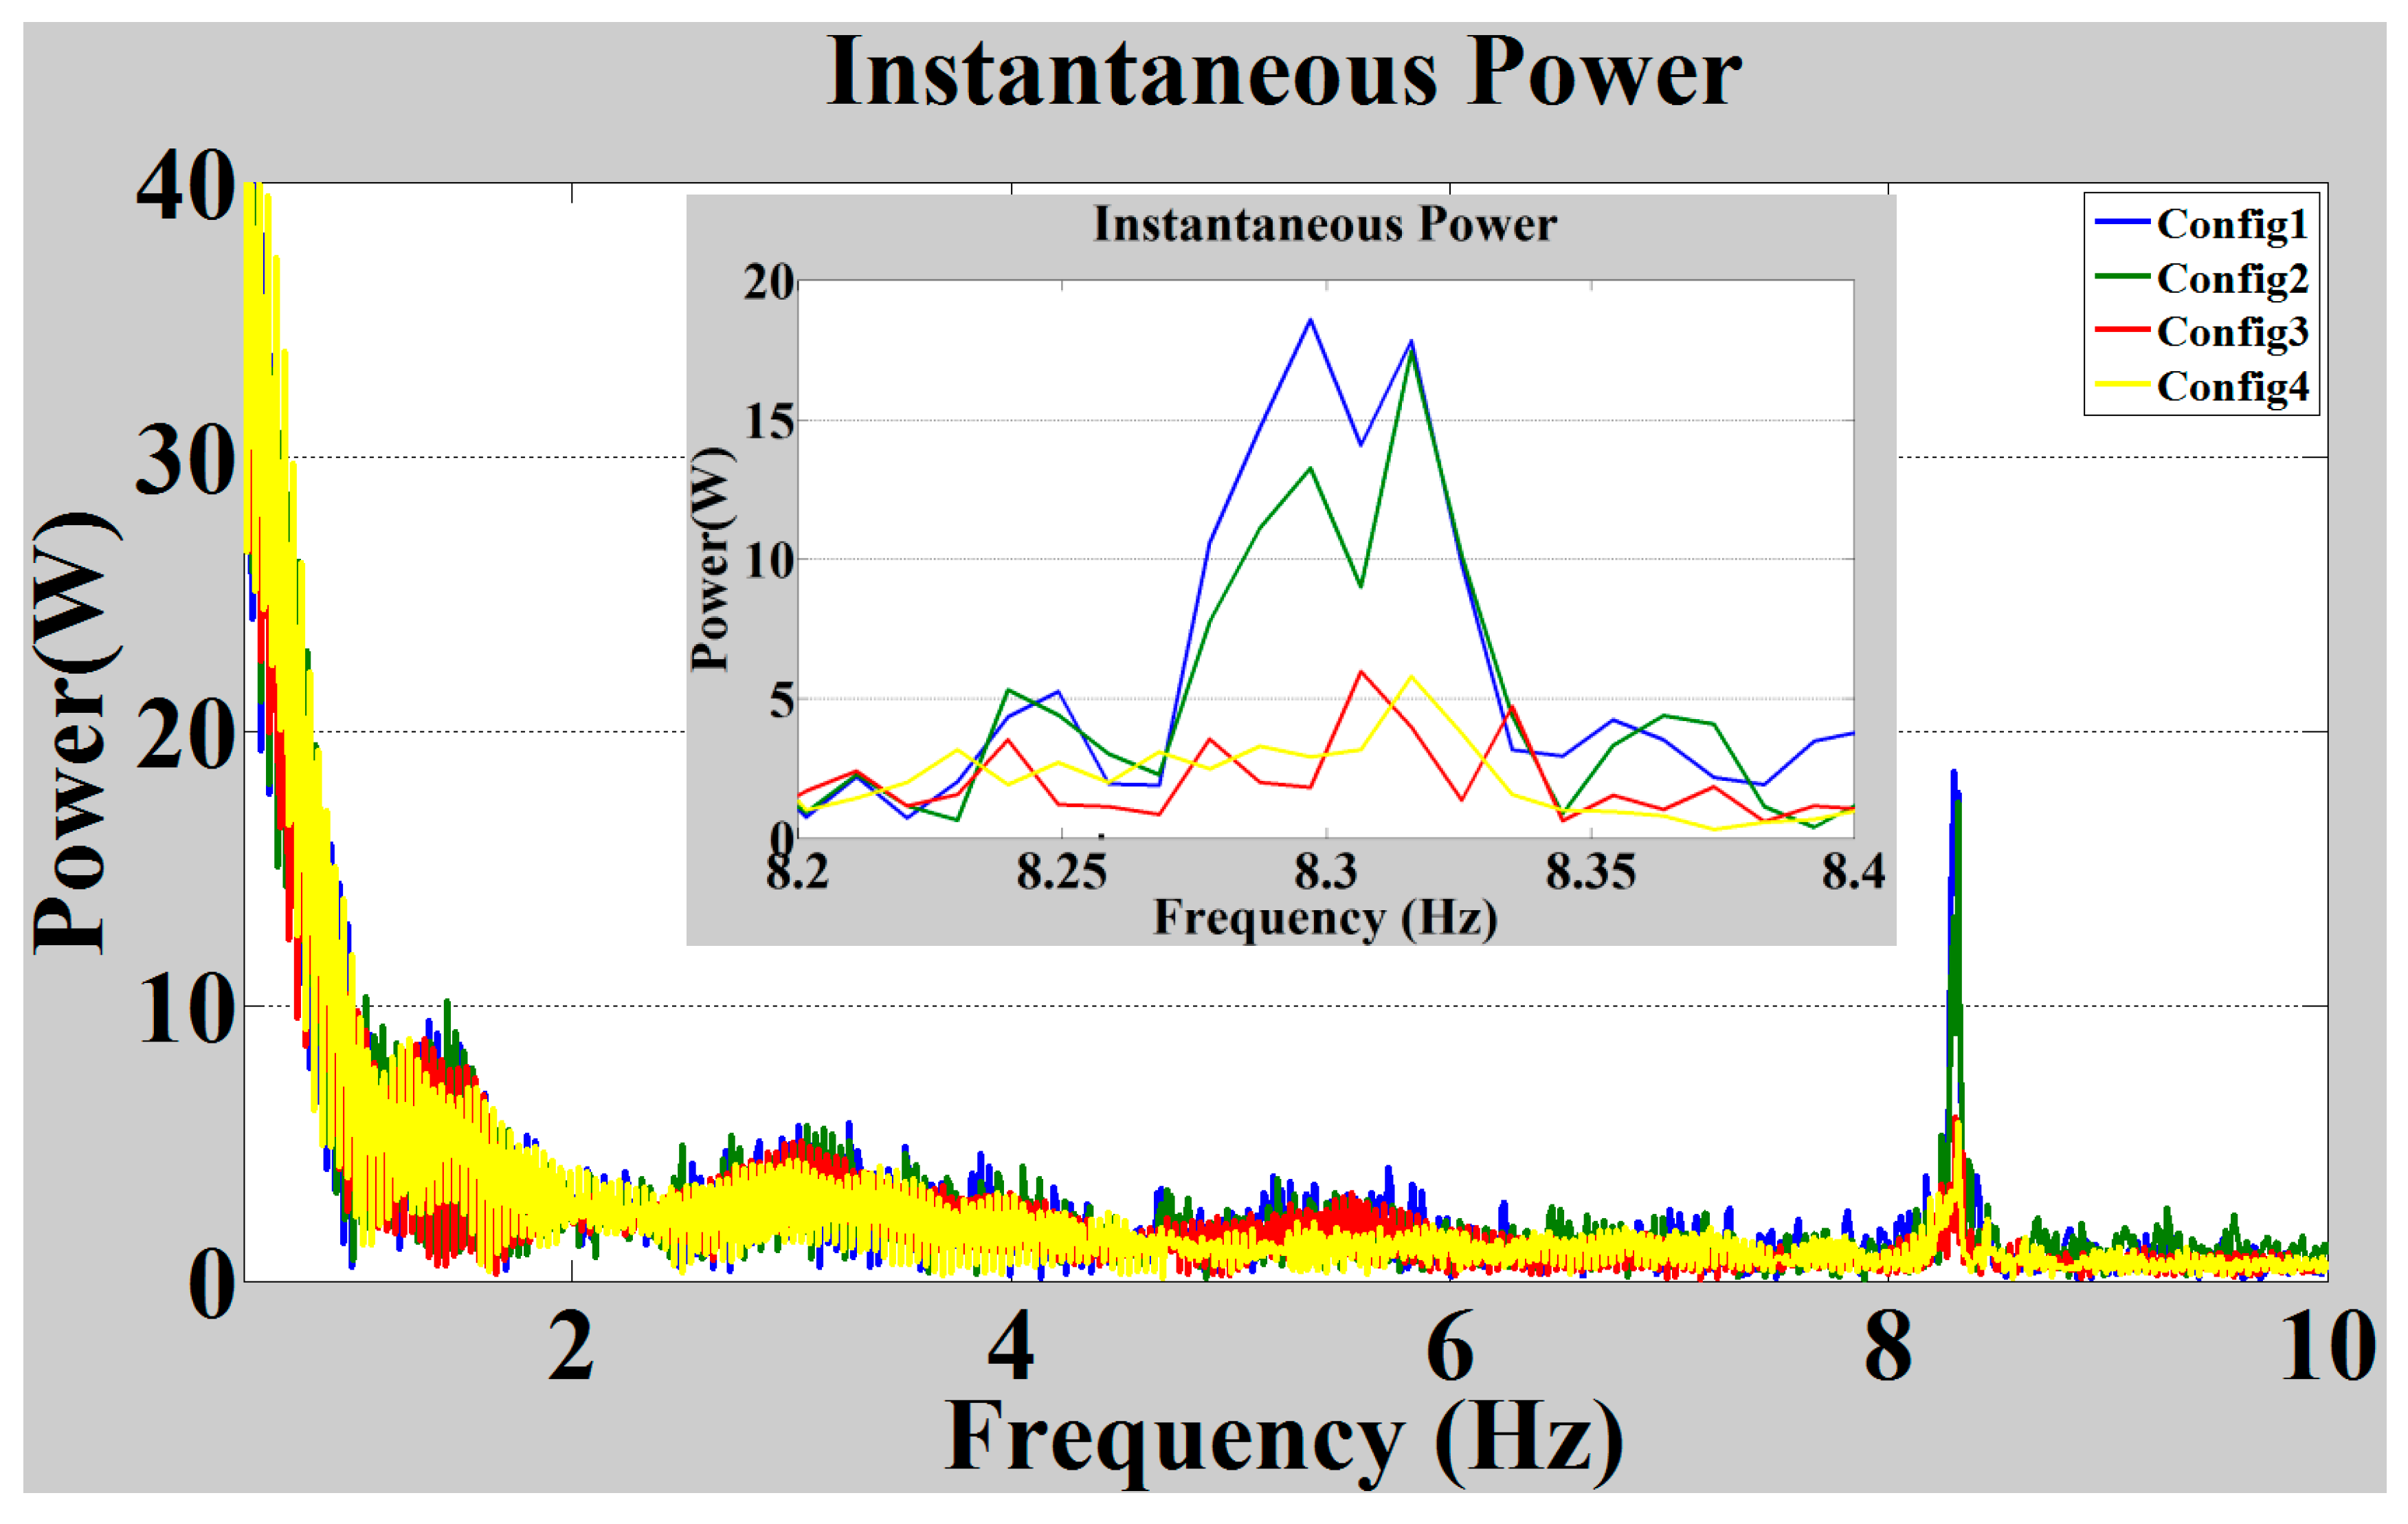
Section 5 is repeated. Four tests corresponding to four possible configurations of HESS a performed at 500 RPM, and the results are compared. For simplification in labeling figures and also simplification in referring to each configuration in the text, these four configurations are named config1 (battery only), config2 (UC added), config3 (UC and electrolytic added), config4 (UC, electrolytic, and film added).
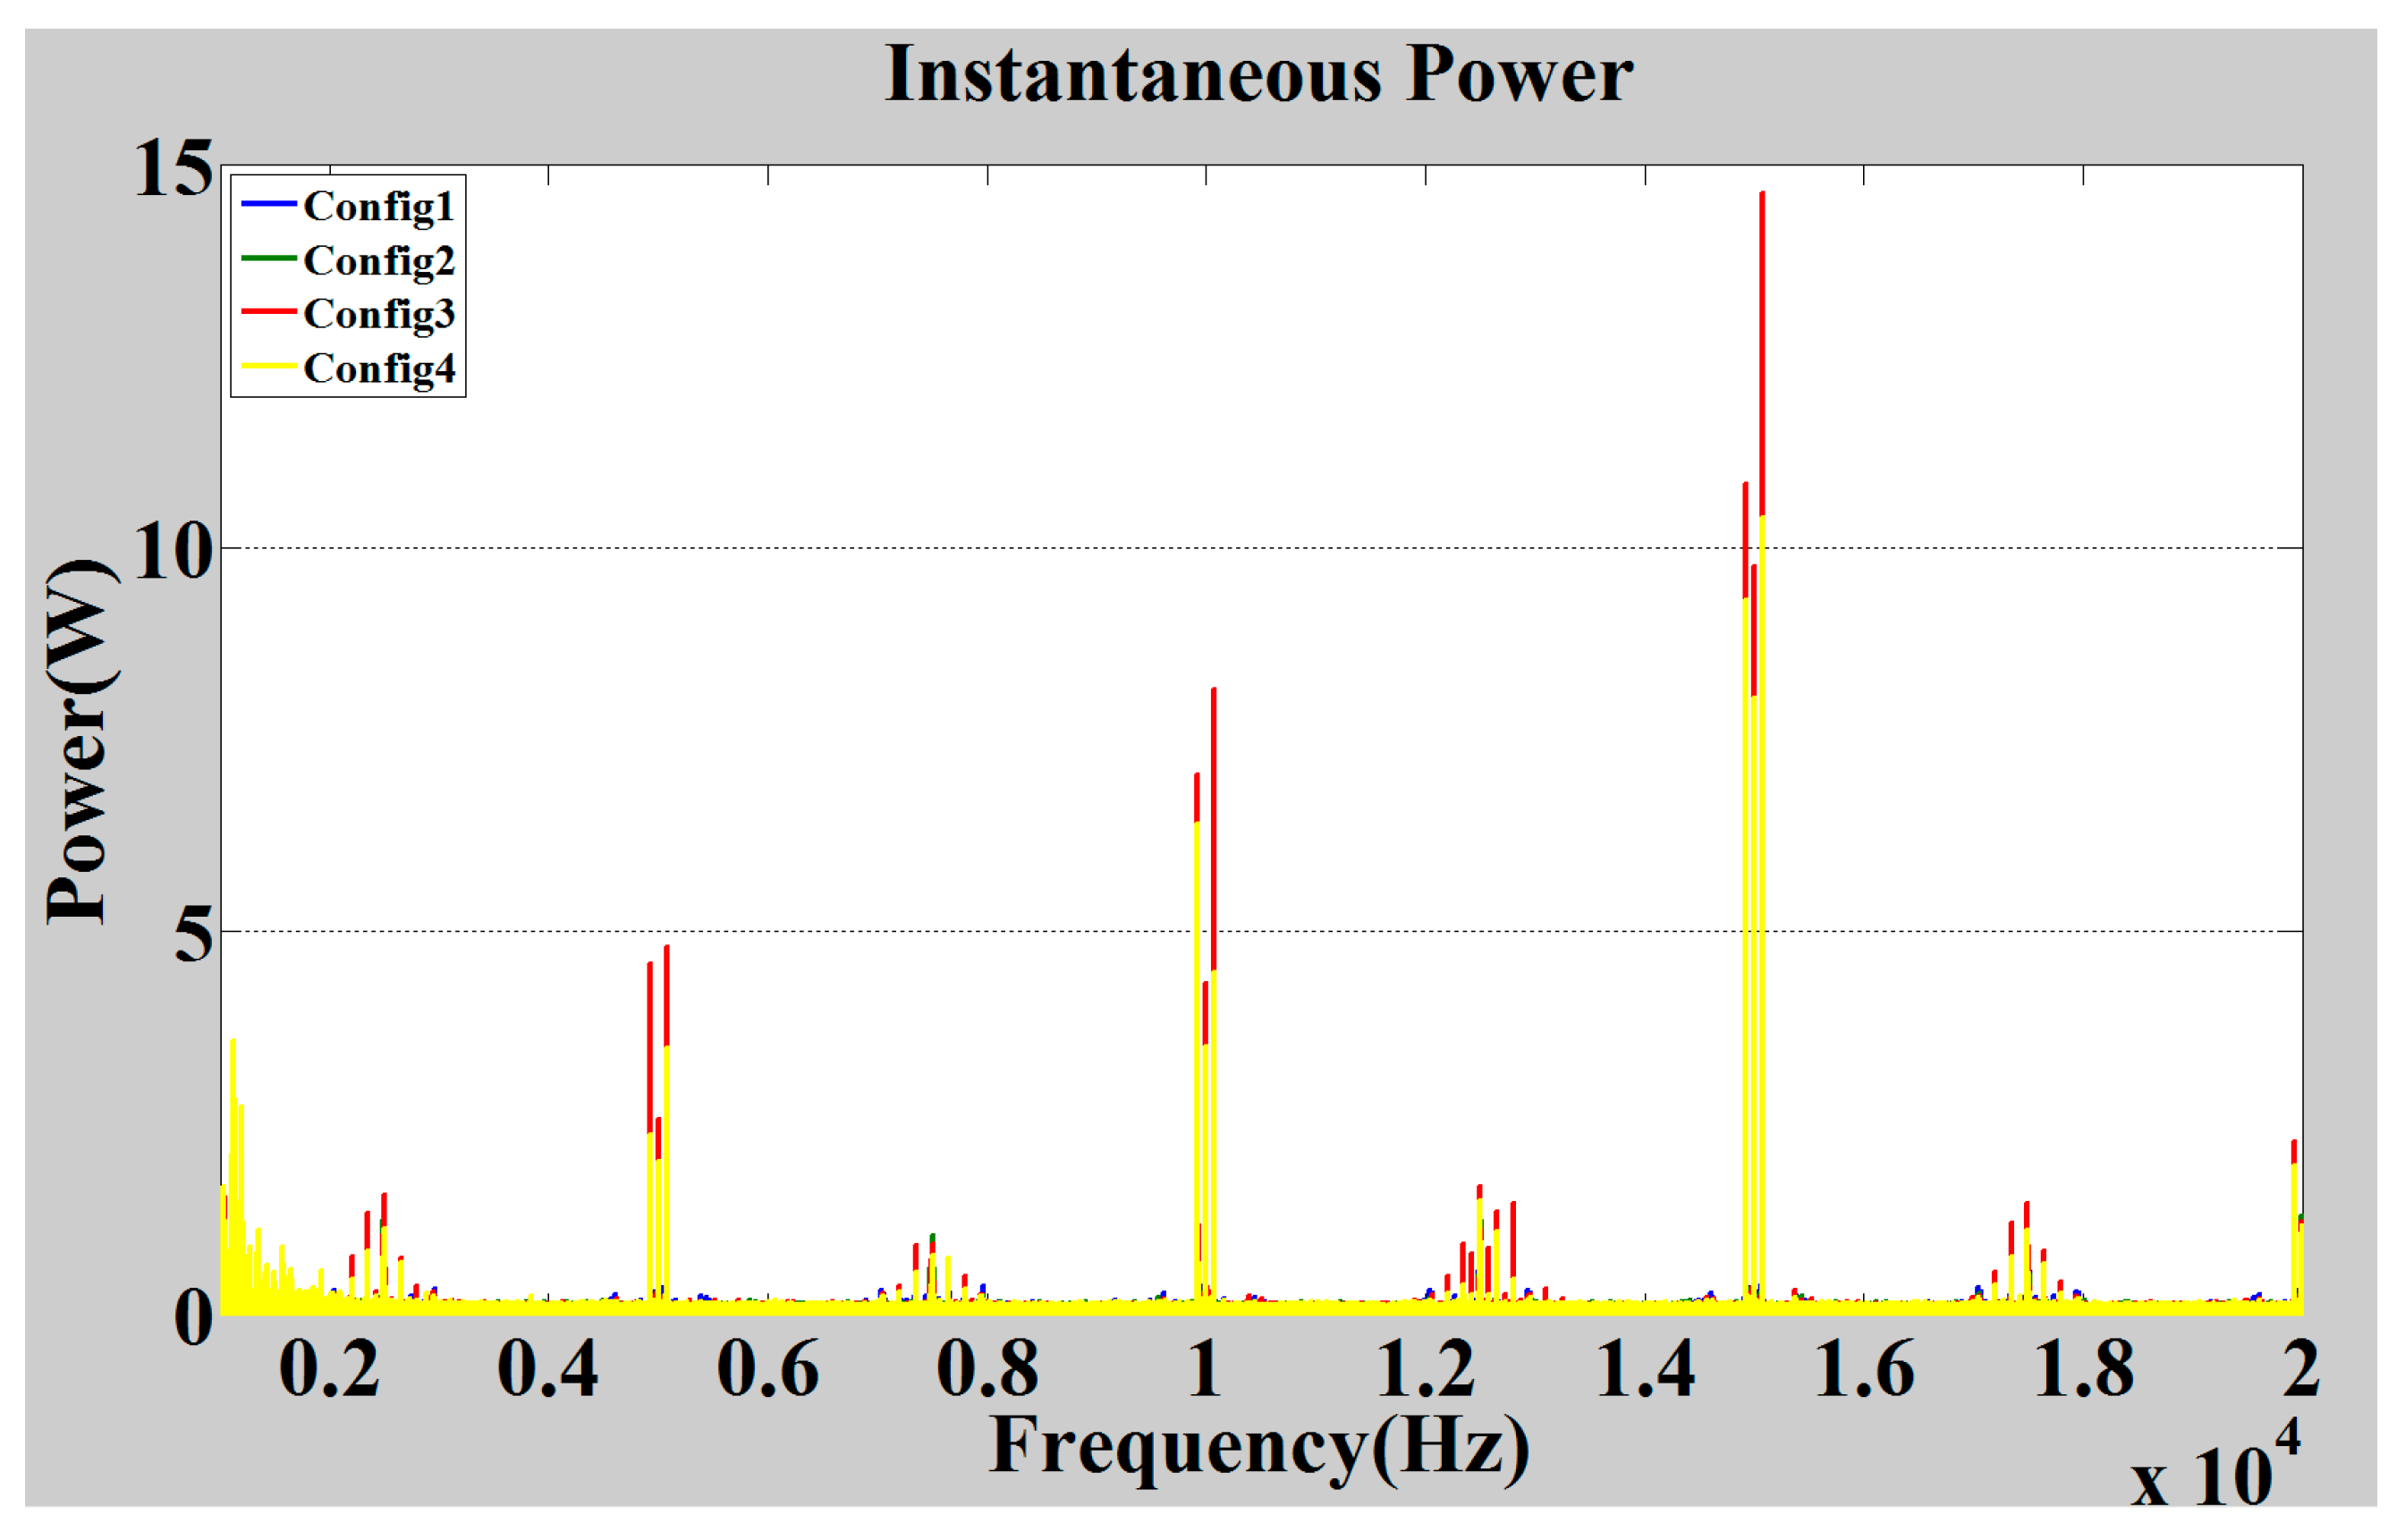
Figure 7 compares instantaneous output power of four configurations of the HESS in the frequency domain from 0.5 Hz to 10 Hz. Instantaneous power is the multiplication of voltage and current, so it shows dynamics associated with both signals at the same time on the same plot which allows the combination of impacts of HESS current reduction and that of voltage ripple reduction to be studied simultaneously. Current reduction leads to the reduction in HESS power dissipation while voltage ripple reduction perhaps additionally reduces the power loss in the motor and its drive. An enlarged window is shown around 8 Hz as an example. Based on this window, config2, the UC added configuration, has less power loss and/or voltage ripple comparing to config1, battery only configuration, at 8 Hz. Similar power loss reductions and/or voltage ripple are observed for config3 comparing with either config1 or config2.
Direct power loss measurement in the prototype energy storage is not simple; however, RMS current on each ESD can be measured precisely. Using a first order model of an ESD, power loss on each element can be estimated by computation. Profiles of ESR versus frequency for each ESD are available in data sheets; constant approximated values of ESRs are also shown in Table 4 which is used for this study. Two methods are used for measuring currents. The first method is measurement carried out by applying Tektronix probes, intermediate amplifiers, and oscilloscope with 3 percent error and 5 MHz bandwidth limitation. For validating the first method, a second method is used by applying a precision power analyzer instrument, Yokogawa PZ4000 and intermediate CT’s, with a 0.2 percent error but a bandwidth limitation of 100 kHz. The results shown in this section were measured by the first method. For presenting power loss data at least two sets of data are averaged while the same initial state of charge (SOC) of the HESS is maintained for each test. The bus voltages after ending each test are very close which shows the SOC of the HESS is about the same at the end of each test. The overall SOC of the HESS is determined by the SOC of the battery as the SOC of other ESD branches are ignored. This is a valid approximation because the energy coming from other ESDs over the duration of the test is negligible compared to the energy from the battery.
Table 5 compares power losses and RMS current for four configurations. Overall power loss for each test decreases when the UC, and then the UC and electrolytic capacitors are introduced to the HESS. Power dissipation in the HESS in config2 and config3 respectively have 9 percent and 14 percent reduction compared to config1. HESS output power for config1, config2, config3, and config4 are in the same range considering 3% measurement error. The decrease in HESS output power in config3, including electrolytic capacitor, or in config4, including electrolytic and film capacitor, might be a result of power loss reduction in either the motor or the motor drive, but as mentioned, because the differences are within the instrument error, a definite judgment cannot be made. Config4, including film capacitor, does not decrease the power dissipation compared to config3 probably because of the limited maximum power of this test. However, data shows a reduction in instantaneous power at the switching frequency and its associated harmonics (See Figure A2). Therefore, it can be noted there is a possibility that this reduction in the switching harmonics is the reason for the overall decline in HESS output power supplied to the motor drive in config4 (with film capacitor) as compared to config3 (without film capacitor). In other words when the film capacitor is present, voltage ripple at the switching frequency and its associated harmonics are smaller which perhaps leads to less power loss in the load (motor and motor inverter), and as a result, the HESS supplies less output power to the load.
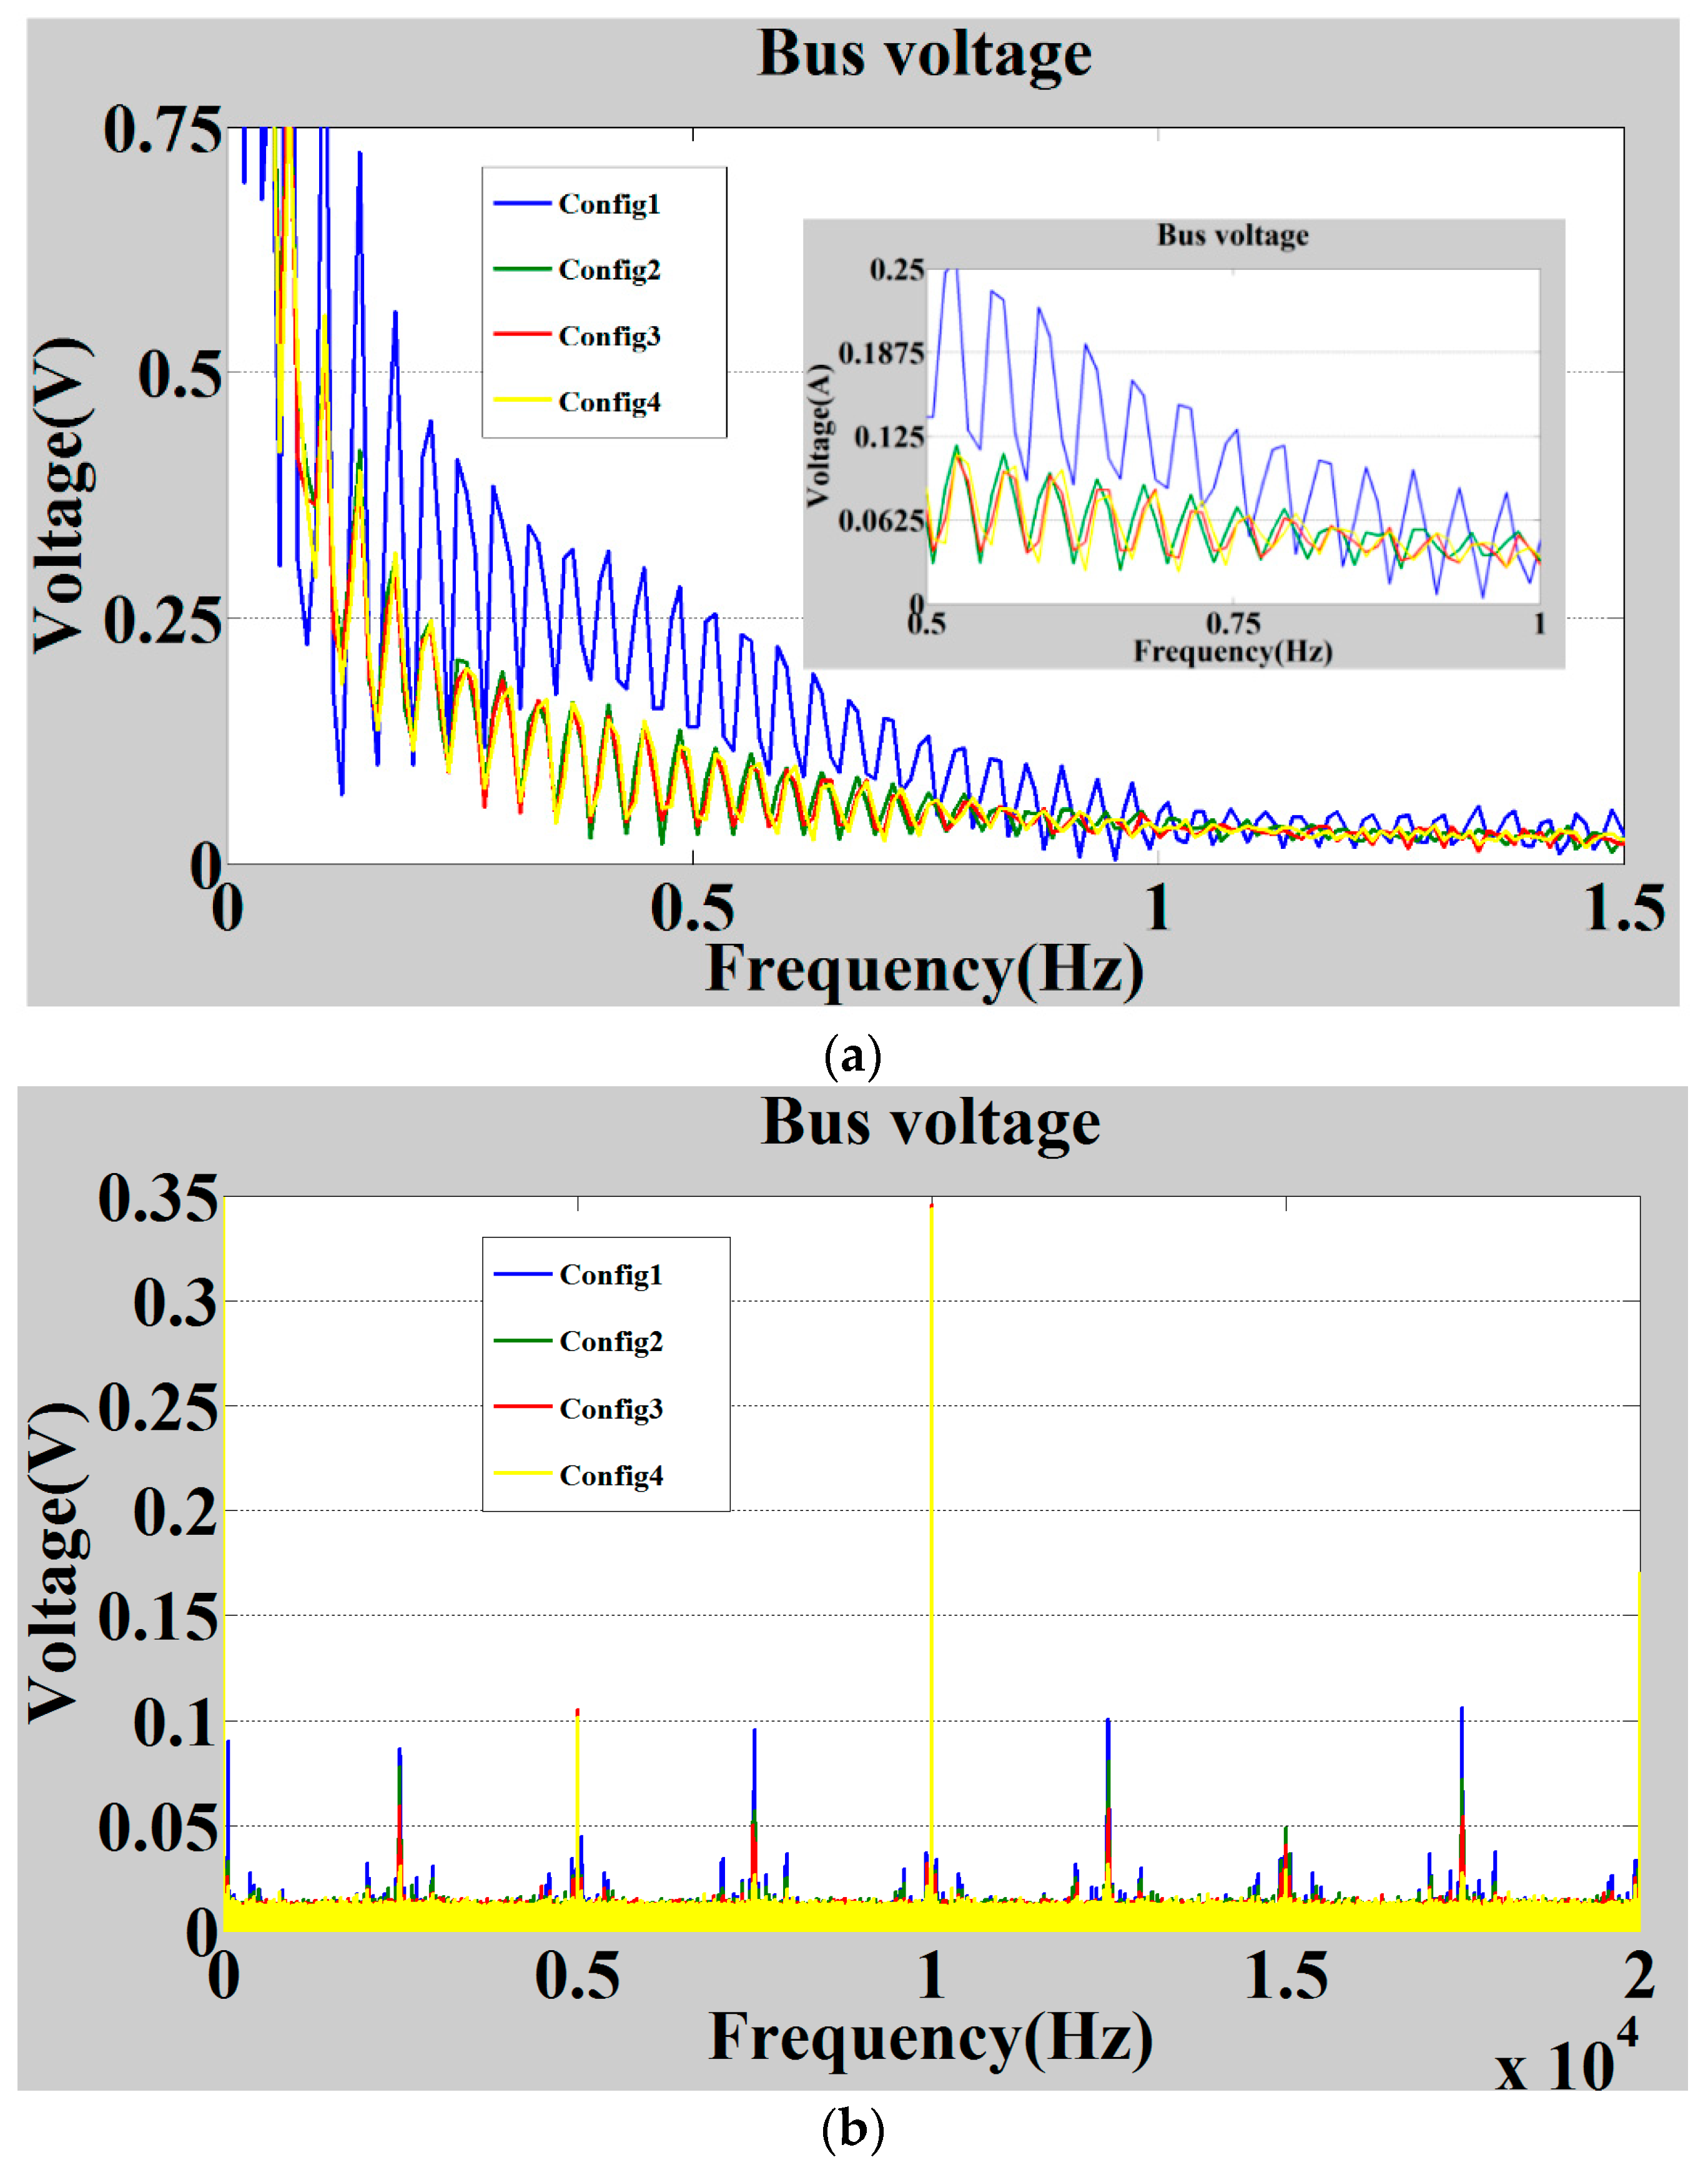
Bus voltages are also compared for four configurations, but because of figure limitation, they cannot be shown in the manuscript (See Figure A3). Voltage ripple reduction is observed comparing config1 and config2; however, ripple reduction is not readily observable from config2 to config3. The enlarged window shows at each frequency voltage magnitudes for both config3 and config4 are smaller than voltage magnitudes for config2 at the same frequency.

7. Discussion

Two distinct adjustments to the expected performance advantages of the HESS can be made by post-processing analysis of the reported power loss reduction in the experimental section. First, the average power delivered by the HESS in the experimental test is 1.822 kW (Table 5) while the average power required by the reference car used in this research is around 7.219 kW. This value is obtained by averaging the absolute waveform of instantaneous power at the HESS terminal where the reference vehicle model is under UDDS simulation. Because both propulsion and re-generation currents cause dissipation in the HESS branches, the absolute value has been considered for averaging. If it is assumed that RMS current at the HESS terminal is proportional to torque, the current in each branch is linearly increased by the ratio of average power, 7.219/1.822 ≈ 4 for the reference vehicle (using the ratio of average power to scale the current is justified by assuming an approximately constant bus voltage). In other words, the power loss in each branch will be increased by 16 = 42. Table 6 shows modified power losses and currents reflecting the scaling of the results to full scale. “Ploss” from Config1 to Config2 is reduced by almost 100 W, and from Config2 to Config3 it is decreased by 30 W.
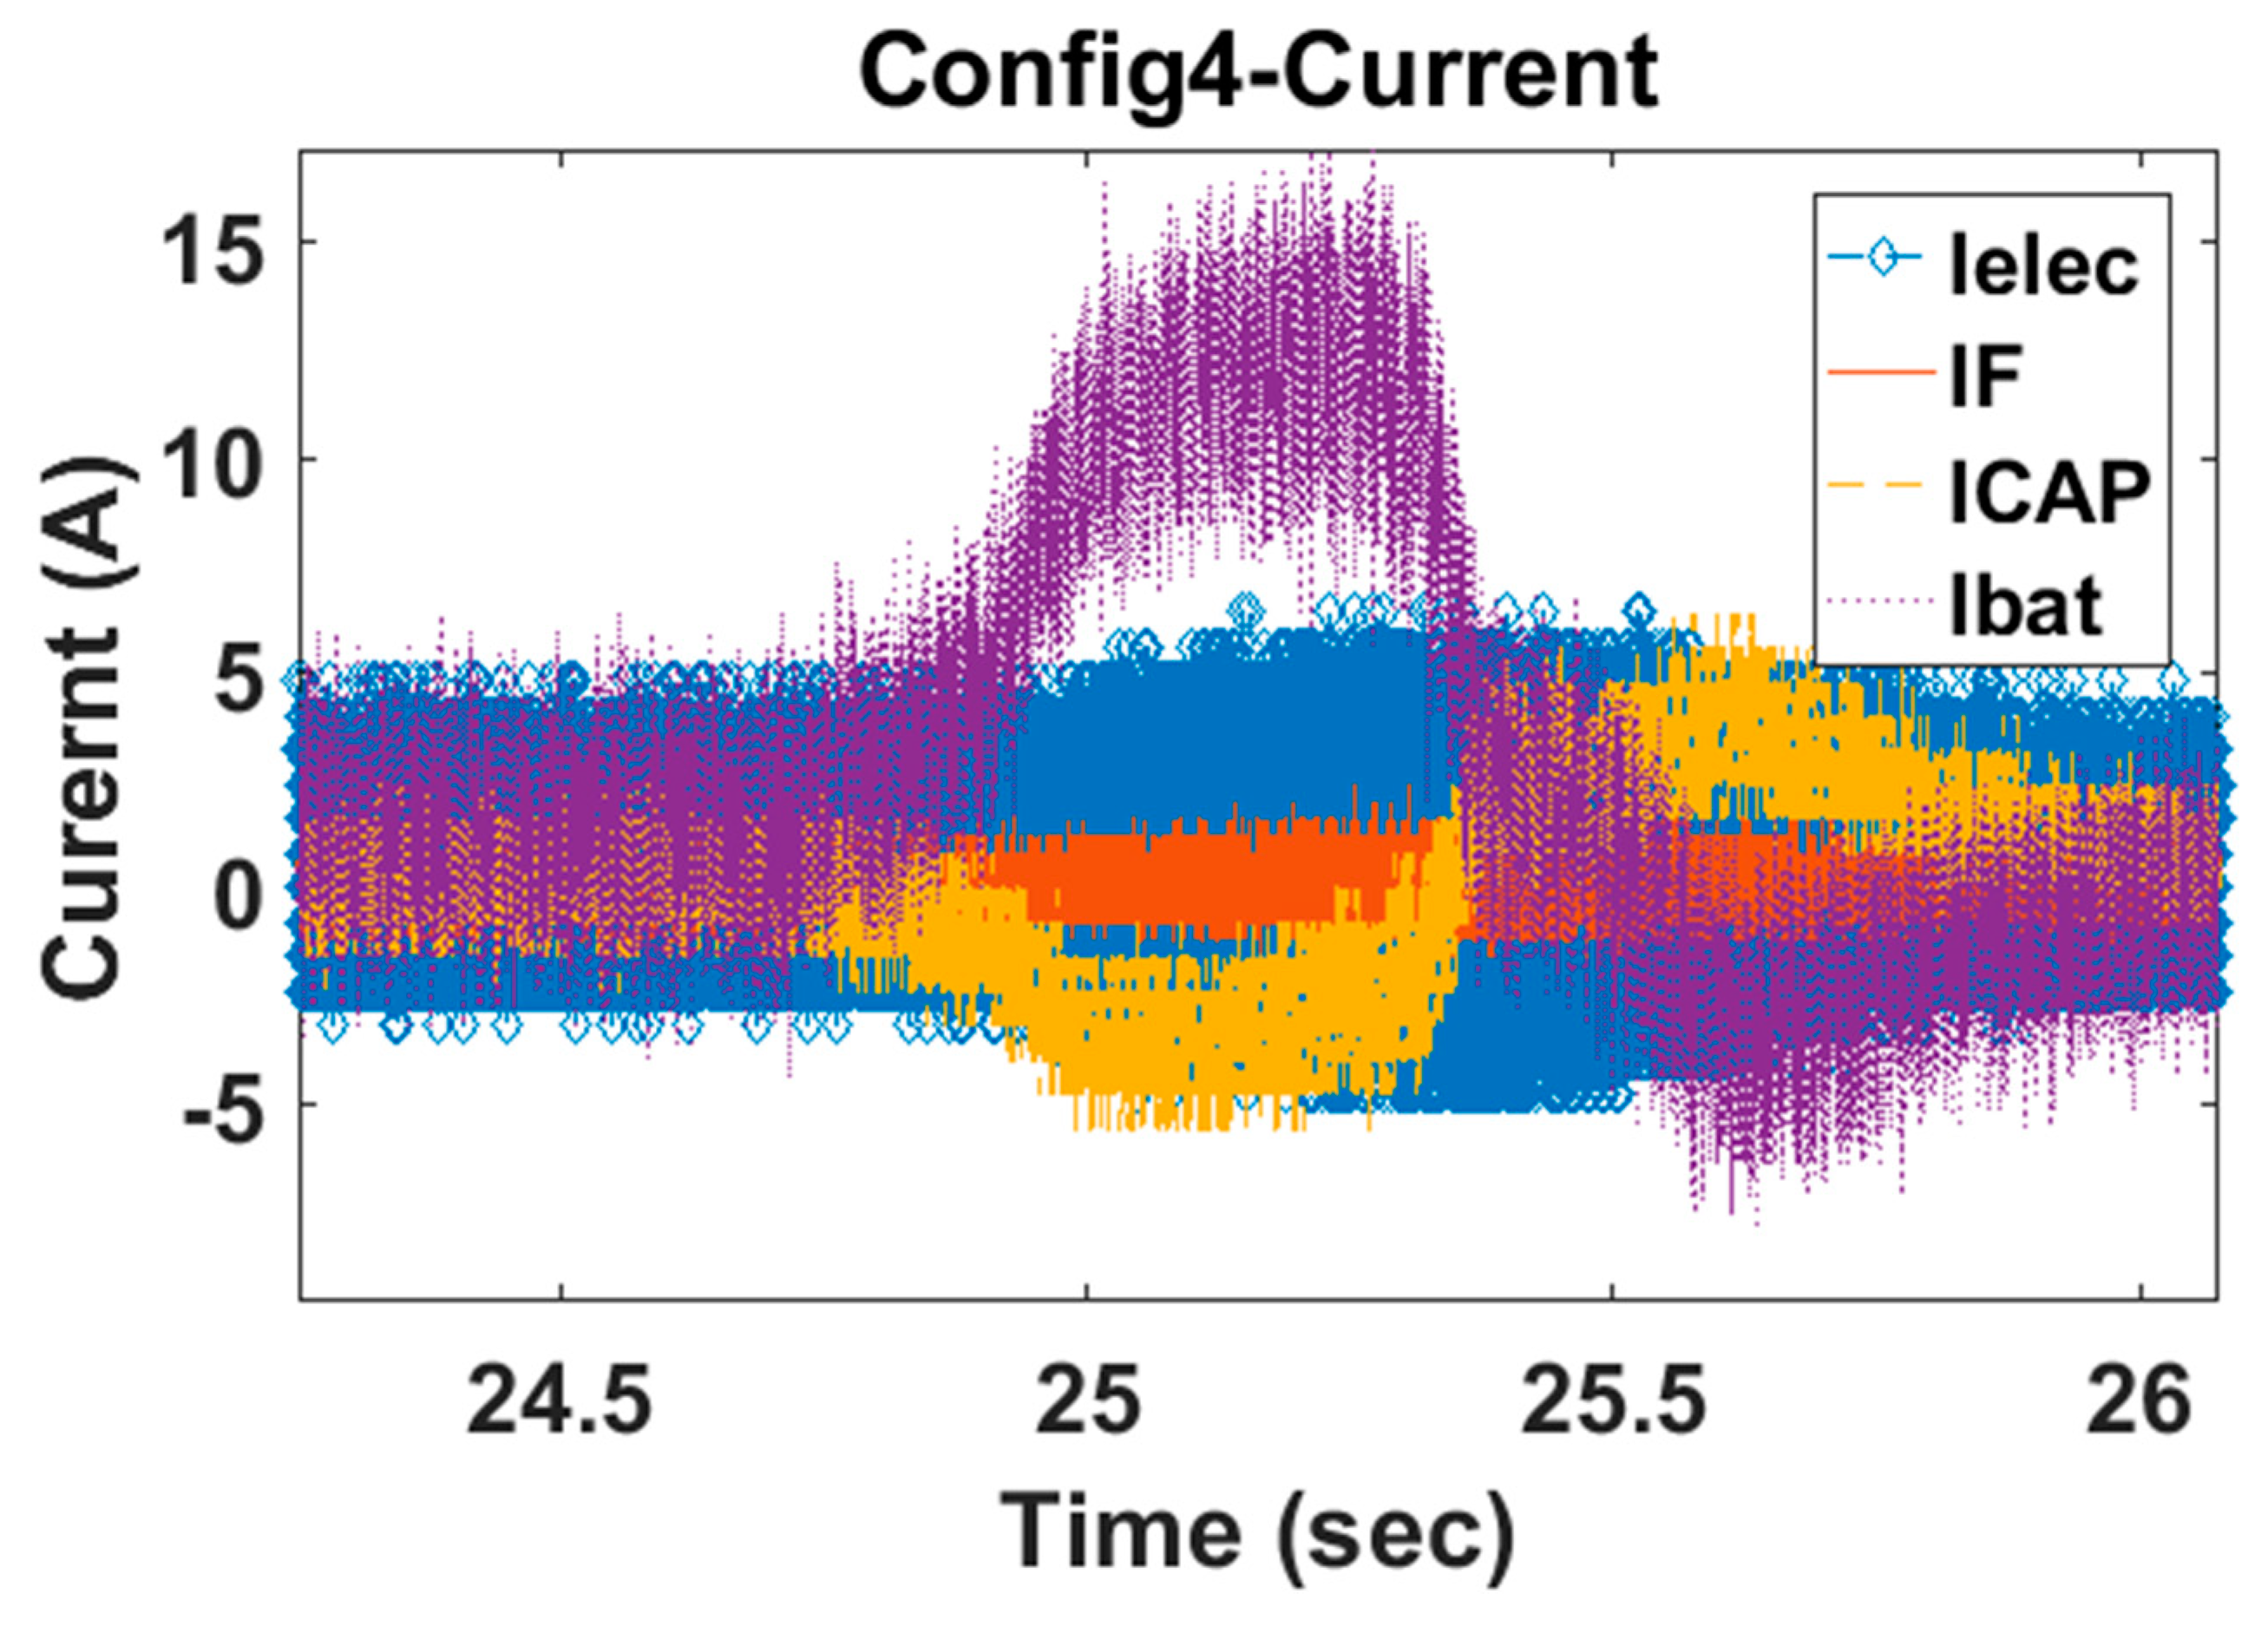
Second, the 100-s test cycle used to model the drive cycle in the experiment is not identical to the real drive cycle regarding the number of transitions (See Figure A4). In a 100 s period in a standard drive cycle, the driver requests continuously variable power. During each transition, the higher bandwidth ESDs give their largest contributions. Increased contributions from UC and electrolytic capacitor are shown in Figure 8 at the first transition (after 25th s when load changes from no load to light load). In other words, when the number of transitions increases the greater reduction in power dissipation is expected to be observed in HESS branches which lead to an expectation of improved fuel economy. Therefore, it is expected that under a real drive schedule, the broad bandwidth design of the HESS leads to more power loss reduction than what has been reported in this work and as a result even greater fuel economy improvement will be achieved in actual vehicles.

8. Conclusions

Using high precision methods, full bandwidth load of an energy storage system in an electrified vehicle was directly measured up to 20 kHz. This data reveals the opportunity to expand the energy storage system of the electrified vehicle to include not only a combination of battery and ultra-capacitor but also to include higher bandwidth energy storage devices like electrolytic and film capacitors. Then, for an example platform of HEV with minimal energy storage system, a methodology of sizing high bandwidth energy storage devices is proposed. For this design, the full bandwidth load, which was empirically measured via two high precision measurement methods, of minimal energy storage system was injected at the terminal of HESS model in Simulink. To validate, an experiment was carried out which discloses the power loss reduction by utilizing bandwidth-based design. A discussion at the end supports the fact that significantly more power loss reduction and consequently more efficiency is expected at a full-scale test on vehicle level.

Author Contributions

M.S. wrote the manuscript, performed, and analyzed the experiment. M.M., and M.S., collaboratively developed the idea. N.S., J.G., Q.G., and M.D., helped in setting up the experiment and data collection. N.S. also edited the manuscript.

Acknowledgments

This work has been partially supported by the Center for Advanced vehicular System at Mississippi State University and partially supported by the Center for Energy and Sustainability at California State University, Los Angeles (NSF HRD-1547723).

Conflicts of Interest

The authors declare no conflict of interest.

Appendix A

Figure A1. Bandwidth of UC, electrolytic capacitor, and film capacitor.
Sci 01 00026 g0a1
Figure A2. Comparing instantaneous power at the output of HESS for four configurations in frequency domain from 0 Hz to 20 kHz.
Sci 01 00026 g0a2
Figure A3. Comparing bus voltage at the output of HESS for four configurations in frequency domain. (a) from 0 Hz to 1.5 Hz; the enlarged window on top is the section of the plot from 0.5 Hz to 1 Hz; (b) from 0 Hz to 20 kHz.
Sci 01 00026 g0a3
Figure A4. Continuously varying nature of drive cycle reflected at energy storage system side. (a) instantaneous power at the HESS terminal of reference vehicle—3 cycles of UDDS; (b) instantaneous power at the HESS terminal of reference vehicle—first 100 s of UDDS.
Sci 01 00026 g0a4

References

  1. U.S. Energy Information Administration. Annual Energy Outlook 2018 with Projections to 2050; Department of Energy: Washington, DC, USA, 2018.
  2. Li, J. Performance-Driven Behavioral Battery Modeling for Large Format Batteries. Ph.D. Thesis, Mississippi State University, Starkville, MS, USA, 2012. [Google Scholar]
  3. Vazquez, S.; Lukic, S.M.; Galvan, E.; Franquelo, L.G.; Carrasco, J.M. Energy Storage Systems for Transport and Grid Applications. IEEE Trans. Ind. Electron. 2010, 57, 3881–3895. [Google Scholar] [CrossRef]
  4. Shahverdi, M.; Mazzola, M.S.; Grice, Q.; Doude, M. Pareto front of energy storage size and series HEV fuel economy using bandwidth-based control strategy. IEEE Trans. Transp. Electr. 2016, 2, 36–51. [Google Scholar] [CrossRef]
  5. Shahverdi, M.; Mazzola, M.S.; Grice, Q.; Doude, M. Bandwidth-based control strategy for a series HEV with light energy storage system. IEEE Trans. Veh. Technol. 2017, 66, 1040–1052. [Google Scholar] [CrossRef]
  6. Sockeel, N.; Shahverdi, M.; Mazzola, M.; Meadows, W. High-fidelity battery model for model predictive control implemented into a plug-in hybrid electric vehicle. Batteries 2017, 3, 13. [Google Scholar] [CrossRef]
  7. May 2017 Dashboard. Available online: http://www.hybridcars.com/may-2017-dashboard/ (accessed on 1 October 2018).
  8. Sikha, G.; Popov, B.N. Performance optimization of a battery-capacitor hybrid system. J. Power Sources 2004, 134, 130–138. [Google Scholar] [CrossRef]
  9. Kan, S.Y.; Verwaal, M.; Broekhuizen, H. The use of battery capacitor combinations in photovoltaic powered products. J. Power Sources 2006, 162, 971–974. [Google Scholar] [CrossRef]
  10. Catherino, H.A.; Burgel, J.F.; Shi, P.L.; Rusek, A.; Zou, X. Hybrid power supplies: A capacitor-assisted battery. J. Power Sources 2006, 162, 965–970. [Google Scholar] [CrossRef]
  11. Cericola, D.; Ruch, P.; Kotz, R.; Novak, P.; Wokaun, A. Simulation of supercapacitor/ Li-ion battery hybrid for pulsed applications. J. Power Sources 2010, 195, 2731–2736. [Google Scholar] [CrossRef]
  12. Paul, B.; Stone, D.A.; Schofield, N. The parallel combination of a VRLA cell and supercapacitor for use as a hybrid vehicle peak power buffer. J. Power Sources 2005, 147, 288–294. [Google Scholar]
  13. Stienecker, A.W.; Stuart, T.; Ashtiani, C. An ultracapacitor circuit for reducing sulfation in lead acid batteries for mild hybrid electric vehicles. J. Power Sources 2005, 156, 755–762. [Google Scholar] [CrossRef]
  14. Henson, W. Optimal battery/ultracapacitor storage combination. J. Power Sources 2008, 179, 417–423. [Google Scholar] [CrossRef]
  15. Holland, C.E.; Weidner, J.W.; Dougal, R.A.; White, R.E. Experimental characterization of hybrid power systems under pulse current loads. J. Power Sources 2002, 109, 32–37. [Google Scholar] [CrossRef]
  16. Ashtiani, C.; Wright, R.; Hunt, G. Ultracapacitors for automotive applications. J. Power Sources 2006, 154, 561–566. [Google Scholar] [CrossRef]
  17. Kim, Y.H.; Kim, S.W.; Lee, S. Development of ultracapacitor modules for 42-V automotive electrical systems. J. Power Sources 2003, 114, 366–373. [Google Scholar]
  18. Frenzel, B.; Kurzweil, P.; Rönnebeck, H. Electromobility concept for racing cars based on lithium-ion batteries and supercapacitors. J. Power Sources 2011, 196, 5364–5376. [Google Scholar] [CrossRef]
  19. Kuperman, A.; Aharon, I.; Kara, A.; Malki, S. A frequency domain approach to analyzing passive battery-ultracapacitor hybrids supplying periodic pulsed current loads. Energy Convers. Manag. 2011, 52, 3433–3438. [Google Scholar] [CrossRef]
  20. Gao, Y.; Ehsani, M. Parametric design of the traction motor and energy storage for series hybrid off road and military vehicles. IEEE Trans. Power Electron. 2006, 21, 749–755. [Google Scholar]
  21. Ehsani, M.; Gao, Y.; Emadi, A. Modern Electric, Hybrid Electric, and Fuel Cell Vehicles. Fundamental, Theory, and Design, 2nd ed.; CRC Press Taylor & Francis Group: Boca Raton, FL, USA, 2010; Chapter 7; p. 13. [Google Scholar]
  22. Wang, L.; Collins, E.G.; Li, H. Optimal Design and Real-Time Control for Energy Management in Electric Vehicles. IEEE Trans. Veh. Technol. 2011, 60, 1419–1429. [Google Scholar] [CrossRef]
  23. Khaligh, A.; Li, Z. Battery, Ultracapacitor, Fuel Cell, and Hybrid EnergyStorage Systems for Electric, Hybrid Electric, Fuel Cell, and Plug-In Hybrid Electric Vehicles: State of the Art. IEEE Trans. Veh. Technol. 2010, 59, 2806–2814. [Google Scholar] [CrossRef]
  24. Cao, J.; Emadi, A. A New Battery/UltraCapacitor Hybrid Energy Storage System for Electric, Hybrid, and Plug-In Hybrid Electric Vehicles. IEEE Trans. Power Electron. 2012, 27, 122–132. [Google Scholar]
  25. Onar, O.C.; Khaligh, A. A Novel Integrated Magnetic Structure Based DC/DC Converter for Hybrid Battery/Ultracapacitor Energy Storage Systems. IEEE Trans. Smart Grid 2012, 3, 296–307. [Google Scholar] [CrossRef]
  26. Lai, J.S.; Nelson, D.J. Energy Management Power Converters in Hybrid Electric and Fuel Cell Vehicles. Proc. IEEE 2007, 95, 766–777. [Google Scholar] [CrossRef]
  27. Tani, A.; Camara, M.B.; Dakyo, B. Energy Management Based on Frequency Approach for Hybrid Electric Vehicle Applications: Fuel-Cell/Lithium-Battery and Ultracapacitors. IEEE Trans. Veh. Technol. 2012, 61, 3375–3386. [Google Scholar] [CrossRef]
  28. Shahverdi, M.; Mazzola, M.S.; Sockeel, N.; Gafford, J. High Bandwidth Energy Storage Devices for HEV/EV Energy Storage System. In Proceedings of the 2014 IEEE Transportation Electrification Conference and Expo (ITEC), Dearborn, MI, USA, 15–18 June 2014. [Google Scholar]
  29. Li, S.; Ozpineci, B.; Tolbert, L.M. Evaluation of a Current Source Active Power Filter to Reduce the DC Bus Capacitor in a Hybrid Electric Vehicle Traction Drive. In Proceedings of the Energy Conversion Congress and Exposition, San Jose, CA, USA, 20–24 September 2009. [Google Scholar]
  30. Masood, S.; Mazzola, M.; Doude, M.; Grice, Q. A hybrid electric vehicle with minimal energy storage system. In Proceedings of the IEEE Transportation Electrification Conference and Expo (ITEC), Dearborn, MI, USA, 15–18 June 2014; pp. 1–6. [Google Scholar]
  31. Wallmark, O.; Galic, J. Prediction of dc-link current harmonics from PM-motor drives in railway applications. In Proceedings of the 2012 Electrical Systems for Aircraft, Railway and Ship Propulsion, Bologna, Italy, 16–18 October 2012. [Google Scholar]
  32. Nelson, J.J.; Adam, M. HEV system EMC Investigation during transient operations. In Proceedings of the 2007 18th International Zurich Symposium on Electromagnetic Compatibility, Munich, Germany, 24–28 September 2007. [Google Scholar]
Figure 1. Comparing bandwidth of standard drive schedule with the bandwidth of measured actual drive schedule. (a) Instantaneous power for UDDS drive cycle (simulating the reference vehicle of this study); frequency: 0 to 0.5 Hz; (b) Instantaneous power for UDDS drive cycle (result of test on EcoCar1 vehicle); frequency: 0 to 0.5 Hz; (c) Instantaneous power for UDDS drive cycle (result of test on EcoCar1 vehicle); frequency: 0.5 to 5 Hz; (d) Instantaneous power for UDDS drive cycle (result of test on EcoCar1 vehicle); frequency: 10 to 20,000 Hz.
Sci 01 00026 g001
Figure 2. Ragone plots: energy-power specification of various energy storage devices [19].
Sci 01 00026 g002
Figure 3. Overall diagram of HESS.
Sci 01 00026 g003
Figure 4. Test configuration for designing high-frequency components of HESS.
Sci 01 00026 g004
Figure 5. Frequency spectrum of the scaled battery current measured at the battery terminal and converted to frequency domain. (a) scaled battery current (500 rpm); frequency: 0 to 80 Hz; (b) scaled battery current (500 rpm); frequency: 80 to 20,000 Hz).
Sci 01 00026 g005
Figure 6. HESS transient time domain study in LTspicefor high frequency.
Sci 01 00026 g006
Figure 7. Comparing instantaneous power at the output of HESS for four configurations in the frequency domain from 0.5 Hz to 10 Hz; the enlarged window on top is a section of the plot around 8 Hz.
Sci 01 00026 g007
Figure 8. Comparing current contribution from each ESD in Config4 during transient situation.
Sci 01 00026 g008
Table 1. Components Specifications of the Power-train.
ComponentSpecification
EngineSubaru EE20, Diesel, 110 kW, 350 Nm at 1800–2400 rpm
GeneratorYASA-400, Permanent magnet, 93 kW at 400 VDC, 328 Nm max torque
MotorYASA-400, Permanent magnet, 93 kW at 400 VDC, 328 Nm max torque
Battery363-V max, 330-V, 4.75 kWh battery pack, 22 UBBL10 modules from UltraLife
UC384-VDC, 4.833 F, a single-string made out of Maxwell’s modules
Table 2. Electrolytic capacitor options.
ManufacturerModelQtyTemperature
(°C)
Overall Capacitance
(mF)
Overall ESR
(mΩ)
Volume
(L)
Mass
(kg)
Overall Current Capability @100 Hz (A)
KemetALS30A682NT45028513.610.52.62.954.8
KemetPEH200YY4470MB21854.716.01.21.418.2
Cornell DubilierDCMC562T450DF2B28511.214.41.71.826.6
Cornell Dubilier3186FH392S450DPA22857.818.51.41.4419.6
Table 3. Comparing RMS values of displacement currents and power losses in various configurations.
ConfigurationUC Average RMS Current (A)Electrolytic RMS Current (A)Film RMS Current (A)UC Average Power (W)Electrolytic Average Power (W)Film Average Power (W)Average Power (W)
UC only244.72 15,810 15,810
UC + electrolytic244.518.95 15,7841.12 15,785
UC + electrolytic + film244.486.934.1215,7800.67≈015,781
Table 4. ESD’s specifications.
Capacitance (mF)Overall ESR (mΩ)
@25 °C 120 Hz
Overall ESR (mΩ)
@25 °C 20 kHz
Ripple Current (A)
@25 °C 120 Hz
Ripple Current (A)
@25 °C 20 kHz
Volume (L)Weight (kg)Cost ($)
UC2217528200 (for 1 s)16.612.922880
Electrolytic5.924.2214.705472.91.21.4200
Film10.50.1252000.76-150
Table 5. Power loss and RMS current comparison for three configurations.
ConfigurationHESS EfficiencyPout-HESS
(W)
Ploss-batt
(W)
Ploss-uc
(W)
Ploss-elec
(mW)
Ploss
(W)
Ibatt-RMS (A)Iuc-RMS (A)Ielec-RM (A)HESS-Irms
(A)
Config196.40%182267.98 67.986.53 6.53
Config296.78%186061.190.74 61.936.191.18 6.59
Config396.84%180158.180.650.5258.826.041.110.196.42
Config496.80%178558.280.650.5558.946.041.110.206.41
Table 6. Power loss and currents on ESDs branches-reference vehicle.
ConfigurationPloss-battPloss-ucPloss-elecPlossIbatt-rmsIuc-rmsIelec-rms
(W)(W)(mW)(W)(A)(A)(A)
Config11088 108826.12
Config297912 99124.764.72
Config393110894124.164.440.76

