Article

Analysis of Cr(VI) Bioremediation by Citrobacter freundii Using Synchrotron Soft X-ray Scanning Transmission X-ray Microscopy

by
Amith G. Anil
1,
Sufal Swaraj
2,
Sankaran Subramanian
1,* and
Praveen C. Ramamurthy
1,*
1
Department of Materials Engineering, Indian Institute of Science, Bangalore 560012, India
2
Synchrotron SOLEIL, L’Orme des Merisiers, Saint-Aubin-BP 48, CEDEX, F-91192 Gif-sur-Yvette, France
*
Authors to whom correspondence should be addressed.
Quantum Beam Sci. 2021, 5(4), 28; https://doi.org/10.3390/qubs5040028
Submission received: 24 August 2021 / Revised: 19 September 2021 / Accepted: 23 September 2021 / Published: 28 September 2021
(This article belongs to the Section Radiation Scattering Fundamentals and Theory)

Abstract

:
Scanning transmission X-ray microscopy (STXM) was utilized for analysing the bioremediation of Cr(VI) by Citrobacter freundii, a species of gram-negative bacteria. The biosorption and bioreduction processes were analysed by the chemical mapping of cells biosorbed at different concentrations of Cr(VI). STXM spectromicroscopy images were recorded at O K-edge and Cr L-edge. A thorough analysis of the X-ray absorption features corresponding to different oxidation states of Cr in the biosorbed cell indicated the coexistence of Cr(III) and Cr(VI) at higher concentrations. This signifies the presence of partially reduced Cr(VI) in addition to biosorbed Cr(VI). In addition, the Cr(III) signal is intense compared with Cr(VI) at different regions of the cell indicating excess of reduced Cr. Speciation of adsorbed Cr was analysed for the spectral features of biosorbed cell and comparison with Cr standards. Analysis of absorption onset, L3/L2 ratio and absorption fine structure concludes that adsorbed Cr is predominantly present as Cr(III) hydroxide or oxyhydroxide. The evolution of absorption features in the duration of biosorption process was also studied. These time lapse studies depict the gradual decrement in Cr(VI) signal as biosorption proceeds. A strong evidence of interaction of Cr with the cell material was also observed. The obtained results provide insights into the biosorption process and chemical speciation of Cr on the cells.

1. Introduction

Heavy metal contamination arising from anthropogenic activities is becoming a major concern. Chromium (Cr), a metal of high commercial importance, is released into the environment in substantial amounts as trivalent (Cr(III)) and hexavalent (Cr(VI)) forms [1]. Increment in Cr(III) release is due to leather, textile and steel manufacturing, while Cr(VI) is extensively released from electroplating and metallurgy industry, chemical manufactures, tanning, dyeing and printing [2]. Groundwater and soil contamination is related to leaching from mining activities and inappropriate disposal of mine tailings [3]. In India, around 1500 metric tons of chromium sulphate waste is released by tanneries annually [4]. Trivalent chromium is benign and essential for humans in trace amounts, whereas hexavalent chromium is a highly toxic mutagen [5]. Hence, sensing and immobilization of hexavalent chromium is increasingly gaining attention.
Conventional remediation methods for Cr contamination such as chemical/electrochemical precipitation, solvent extraction, ion exchange, and membrane separation generate secondary sludge and are not suitable for low pollutant concentration [6]. Bioremediation is a potential, environmentally benign alternative for Cr(VI) removal. Bioremediation does not cause any secondary pollution and is suitable for treating large volumes of wastewater with low metal ion concentrations [7,8]. Bioremediation occurs via the interplay of bioaccumulation, biosorption and reduction processes. Recent studies reveal that reduction plays an important role in Cr(VI) removal. Even though there are numerous records of bioremediation of Cr, the actual mechanism of bio-reduction of Cr(VI) to Cr(III) is still ambiguous [9]. Cr(VI) bioreduction occurs mostly extracellularly and is likely mediated by extracellular reductase enzymes [10]. In some strains of microorganisms, intracellular metal binding proteins and peptides like metallothionein are responsible for bioremediation [11]. However, studies on the main sites of Cr(VI) reduction are very limited. Moreover, the speciation and distribution of bioreduced Cr are sparsely studied. Determining the structural features resulting in selective metal ion immobilization is of great interest in designing superior sensor arrays for environmental monitoring.
Citrobacter freundii species of gram-negative bacteria have been studied as a bioremediation source for Cr(VI). Citrobacter sp. isolated from industrial sludge has been utilized for Cr(VI) removal in draw filled reactor [12]. The efficacy of Citrobacter freundii in the bioremediation of Cr(VI) and Cr(III) has been reported previously [13]. Efforts have been made to understand the underlying mechanism of their bioremediation process [14]. Fourier transform infrared (FTIR) spectral studies indicate the involvement of OH, NH and COOH groups in bioremediation. X-ray photoelectron spectroscopy (XPS) confirm the presence of both Cr(VI) and Cr(III) biosorbed onto the cell. However, these analyses are inconclusive to determine the molecular nature and structure of the moieties responsible for Cr(VI) immobilization and subsequent reduction to Cr(III). The exact mechanism of electron transfer also evades researchers. In addition, desorption studies have shown that the biosorption process is irreversible, indicating a strong interaction of Cr with the cells. Thus, a holistic understanding of the biosorption and bioreduction process is desirable to design better selective sensors and adsorbents for Cr(VI) remediation.
Advanced characterization of both inorganic ions and organic molecules on the biosorbed bacteria at submicrometer scale is required for a better understanding of the underlying process. Scanning transmission X-ray microscopy (STXM) is now routinely used at a spatial resolution of tens of nanometres to provide chemical speciation sensitive images [15]. Chemical sensitivity of STXM is achieved through near edge X-ray absorption fine structure (NEXAFS) spectroscopy [16,17]. Soft X-rays (100–2200 eV) interact with most elements and provide chemical speciation mapping based on bonding structure. STXM with soft X-rays have been utilized to study geomicrobiological processes [18,19,20]. The energy range of soft X-rays falls within the K-absorption edge of biologically relevant nuclei like carbon, nitrogen, phosphorous, and oxygen as well as the L-edge of environmentally relevant transition metals like iron, cobalt, chromium, nickel, manganese etc. STXM can be used to analyse samples in hydrated environments in the “water window” (280–520 eV), wherein X-rays are transparent to water [21]. Moreover, STXM relies on the intrinsic X-ray absorption of the sample and hence does not require any additional probes or markers. However, to successfully correlate the results of STXM, a prior understanding of the bonding structures of the chemical species present in the system is necessary.
In this work, we demonstrate the utilization of STXM in analysing the bioremediation of Cr(VI) by Citrobacter freundii bacteria. Biosorbed bacterial cells were analysed at Cr L-edge and O K-edge. Chemical speciation and spatial distribution of Cr, biosorbed on the bacterial cells were determined through image stacks at Cr L-edge and O K-edge.
The effect of Cr biosorption on the cell surface functionalities were also studied by comparison with STXM signals of pristine bacterial cells. The evolution of Cr L-edge and O K-edge signals with time after the addition of Cr is also evaluated. The obtained results pave way for further in-situ STXM studies required for a molecular level understanding of the process of biosorption and subsequent bio-reduction.

2. Material and Methods

The detailed procedure of bioremediation is reported elsewhere [13,14]. Pure strain of Citrobacter freundii (MTCC No. 8128) was used for bioremediation studies. Sub-cultured bacterial cells were isolated from the culture medium. Potassium dichromate was used as the Cr(VI) source. The pelletized cells were dispersed in different concentrations of Cr(VI) solution (200 ppm, 400 ppm and 600 ppm). The pH of the solution was adjusted to 1 and the mixture was agitated in a rotary shaker at 30 °C for 2 h. The biosorbed cells were separated from the solution by centrifugation at 10,000 rpm for 10 min. The un-adsorbed Cr(VI) was removed by washing multiple times with deionized (DI) water. The resulting bacterial pellet was air dried at 30 °C overnight. Dried samples were re-dispersed in DI water and sufficiently diluted to obtain isolated cells suitable for STXM analyses. 1 µL of each of the diluted samples were drop-casted on silicon nitride window (50 nm thick, 0.5 mm × 0.5 mm; frame 200 µm, 5 mm × 5 mm) and air dried.
STXM investigation was performed at the HERMES beamline at the synchrotron SOLEIL (St. Aubin, France) [22]. STXM uses monochromatic X-ray focused to a spot size of ∼30 nm using a Fresnel zone plate of 25 nm outer zone width. An order sorting aperture (OSA) is mounted between the sample and the zone plate to eliminate higher order X-rays which would cause blurring of the image. A photomultiplier tube (PMT) is placed behind the sample that detects the transmitted photons. The sample itself is raster scanned at the focal plane of the zone plate such that a spatially resolved chemical speciation map of elements such as C, O, or Cr can be obtained based on the X-ray absorption near edge structure spectroscopy (XANES). Figure 1 shows the schematics of a conventional STXM. Isolated bacterial cells were identified in survey scans, viz., high-resolution stacks at O K-edge (526–560 eV) and Cr L-edge (570–590 eV). Absolute energy calibration of the beamline was obtained via measurements of 2 mbar CO2 and aligning the 3 s and 3 p absorption minima features to 292.74 and 294.96 eV respectively [23]. The scanning step size was chosen as 50 nm, while the spectral resolution was varied between 80 meV and 200 meV depending upon the spectral region and expected spectral features. The dwell time for all the stack measurements were kept at 3 ms in order to avoid any X-ray beam related damage or reduction. An average X-ray dosage for a cell after a stack of 200 points is calculated to be <100 MGy.
The analysis of the obtained STXM stacks was done using a combination of analysis software aXis2000 (V11.0) (available at http://unicorn.mcmaster.ca/aXis2000.html (accessed on 13 May 2020)) and MANTiS [24].

3. Results and Discussion

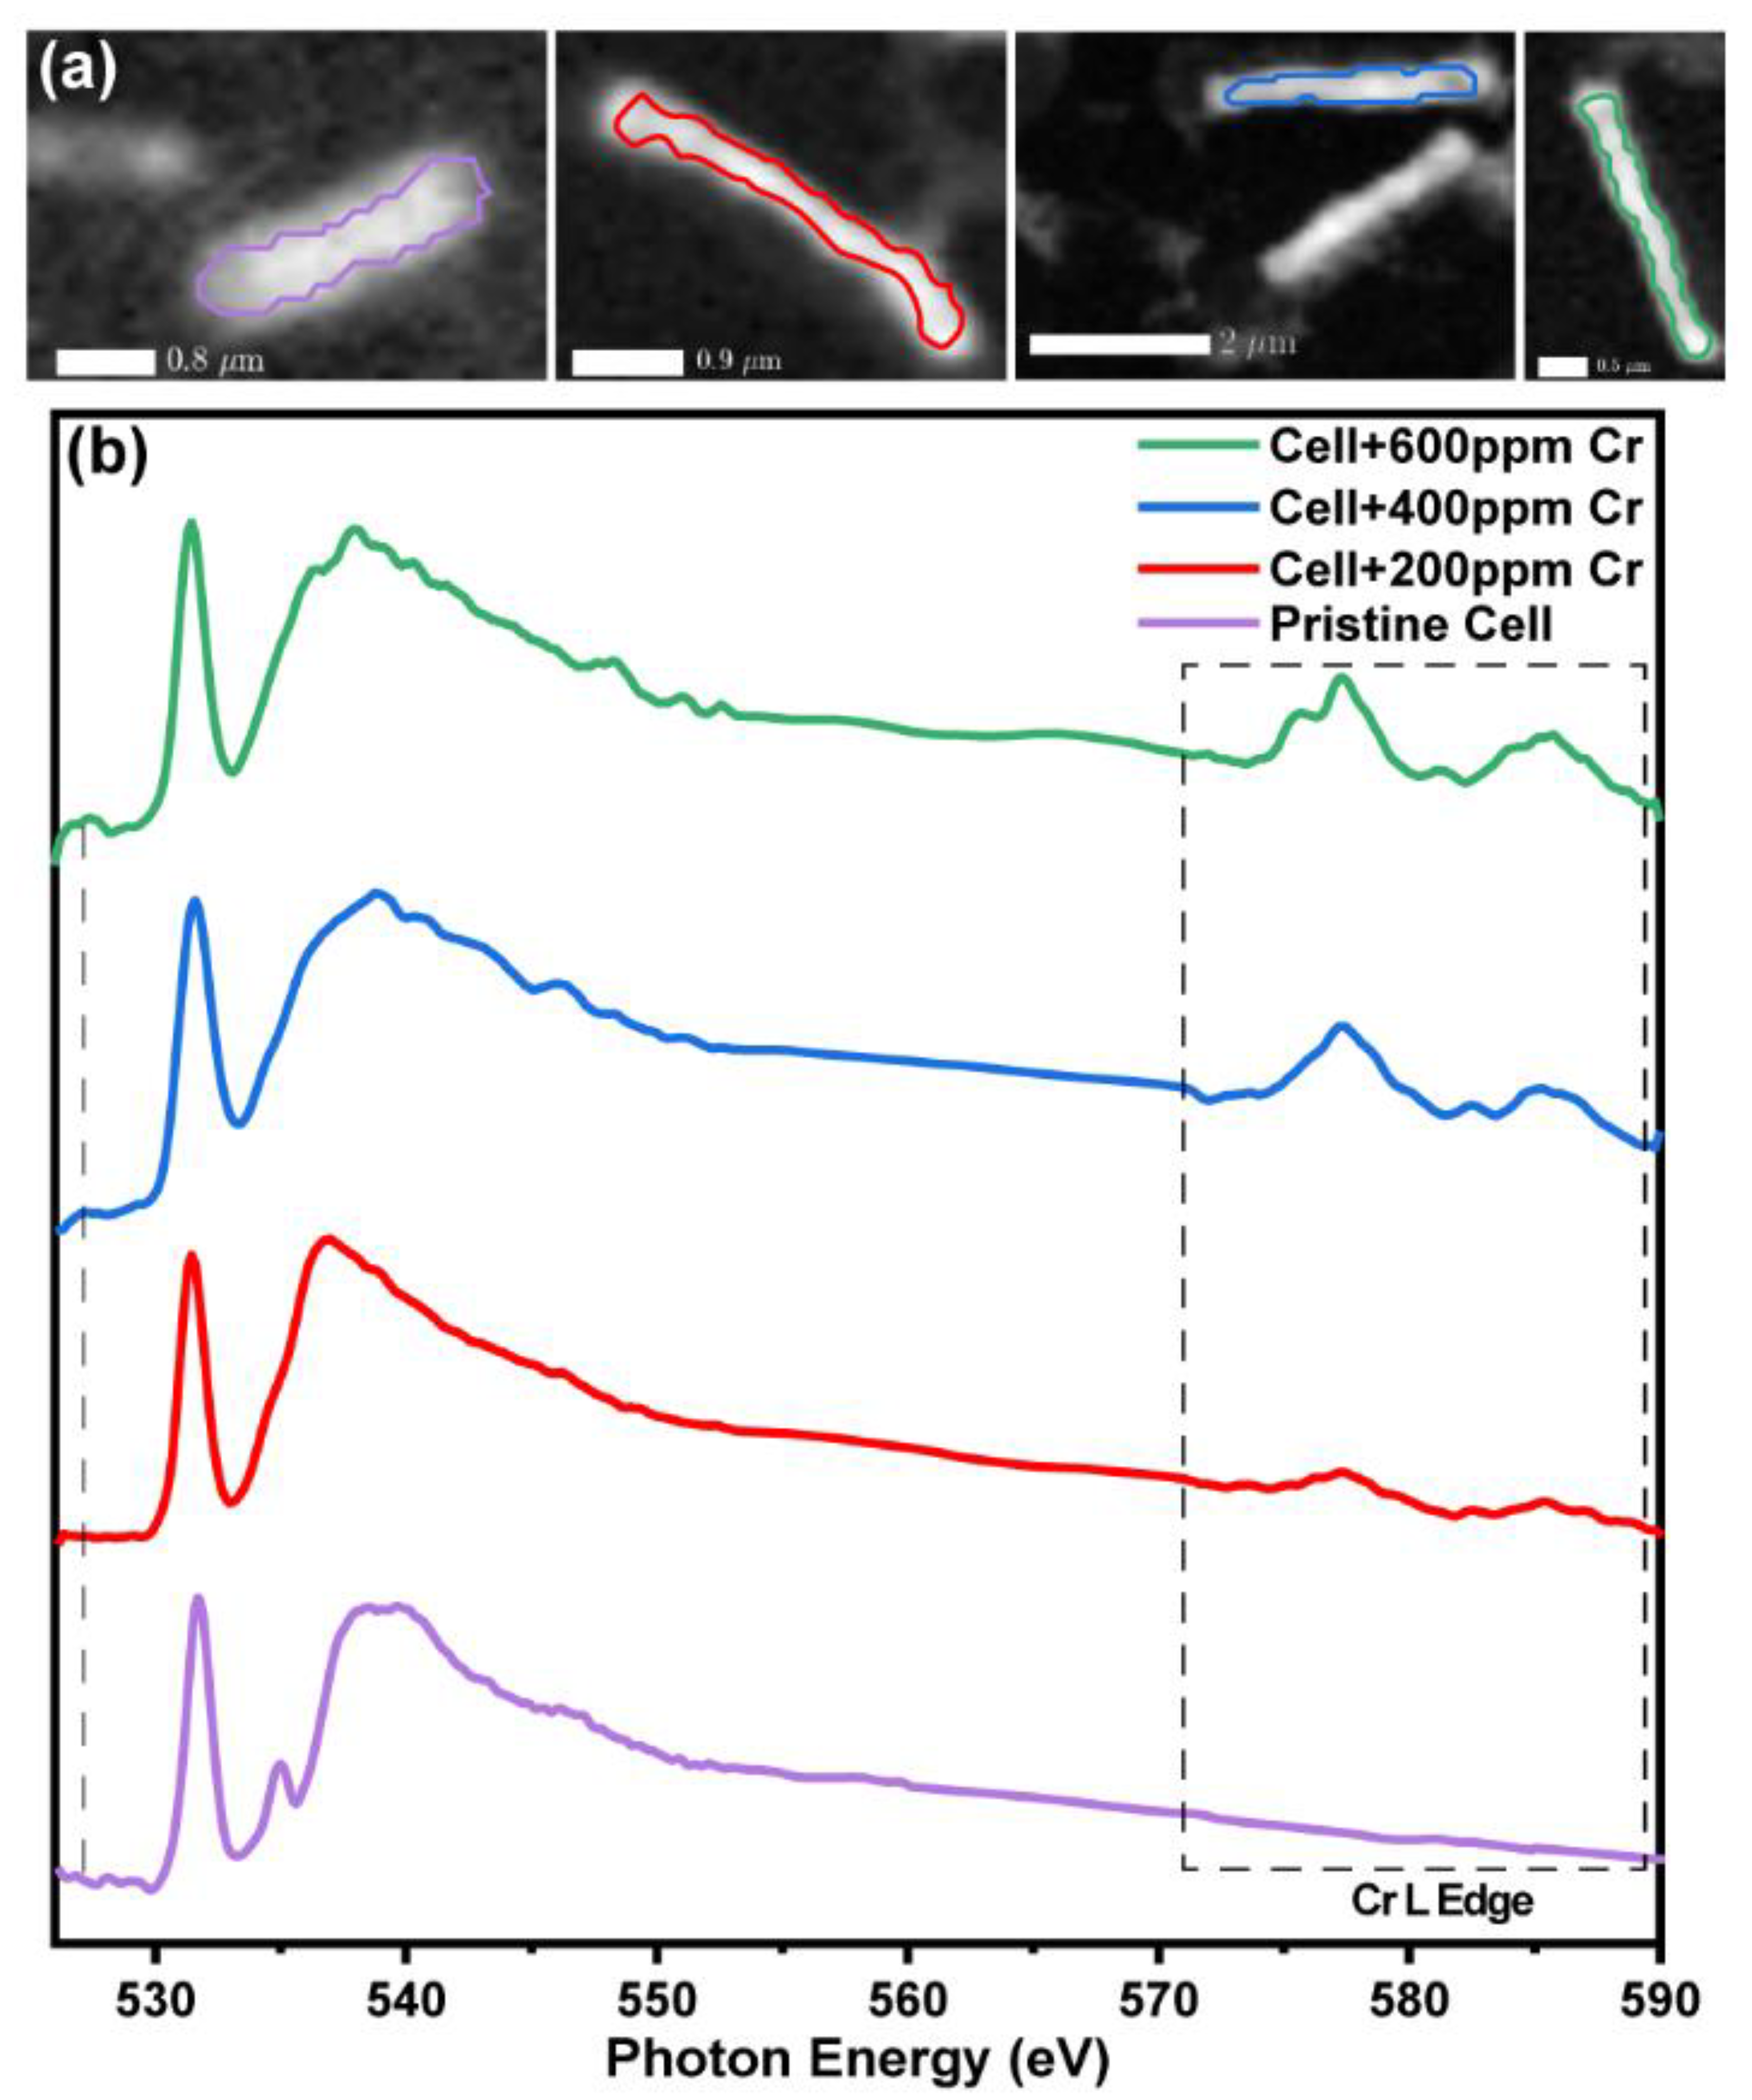
Spectromicrographs of pristine cells and cells biosorbed at various concentrations of Cr are shown in Figure 2a. A comparison of the corresponding spectra from the region of interest is given in Figure 2b. Presence of Cr on the biosorbed cell is confirmed by the appearance of absorption features at the Cr L edge. The intensity of absorption increases with increase in the concentration of Cr used for biosorption. Apparent changes in the O K edge absorption also indicates this.
Different oxidation states of biosorbed Cr, Cr(VI), and Cr(III), can be easily resolved by comparison of sample spectra with reference samples recorded at the O K-edge and Cr L2,3 edge. The high sensitivity of NEXAFS analysis to the oxidation state and coordination geometry of Cr facilitates this. For determining the chemical speciation of Cr, potassium dichromate [K2Cr2O7] was used as Cr(VI) standard, whereas chromium(III) oxide [Cr2O3] and chromium(III) hydroxide [Cr(OH)3] were used as Cr(III) standards.
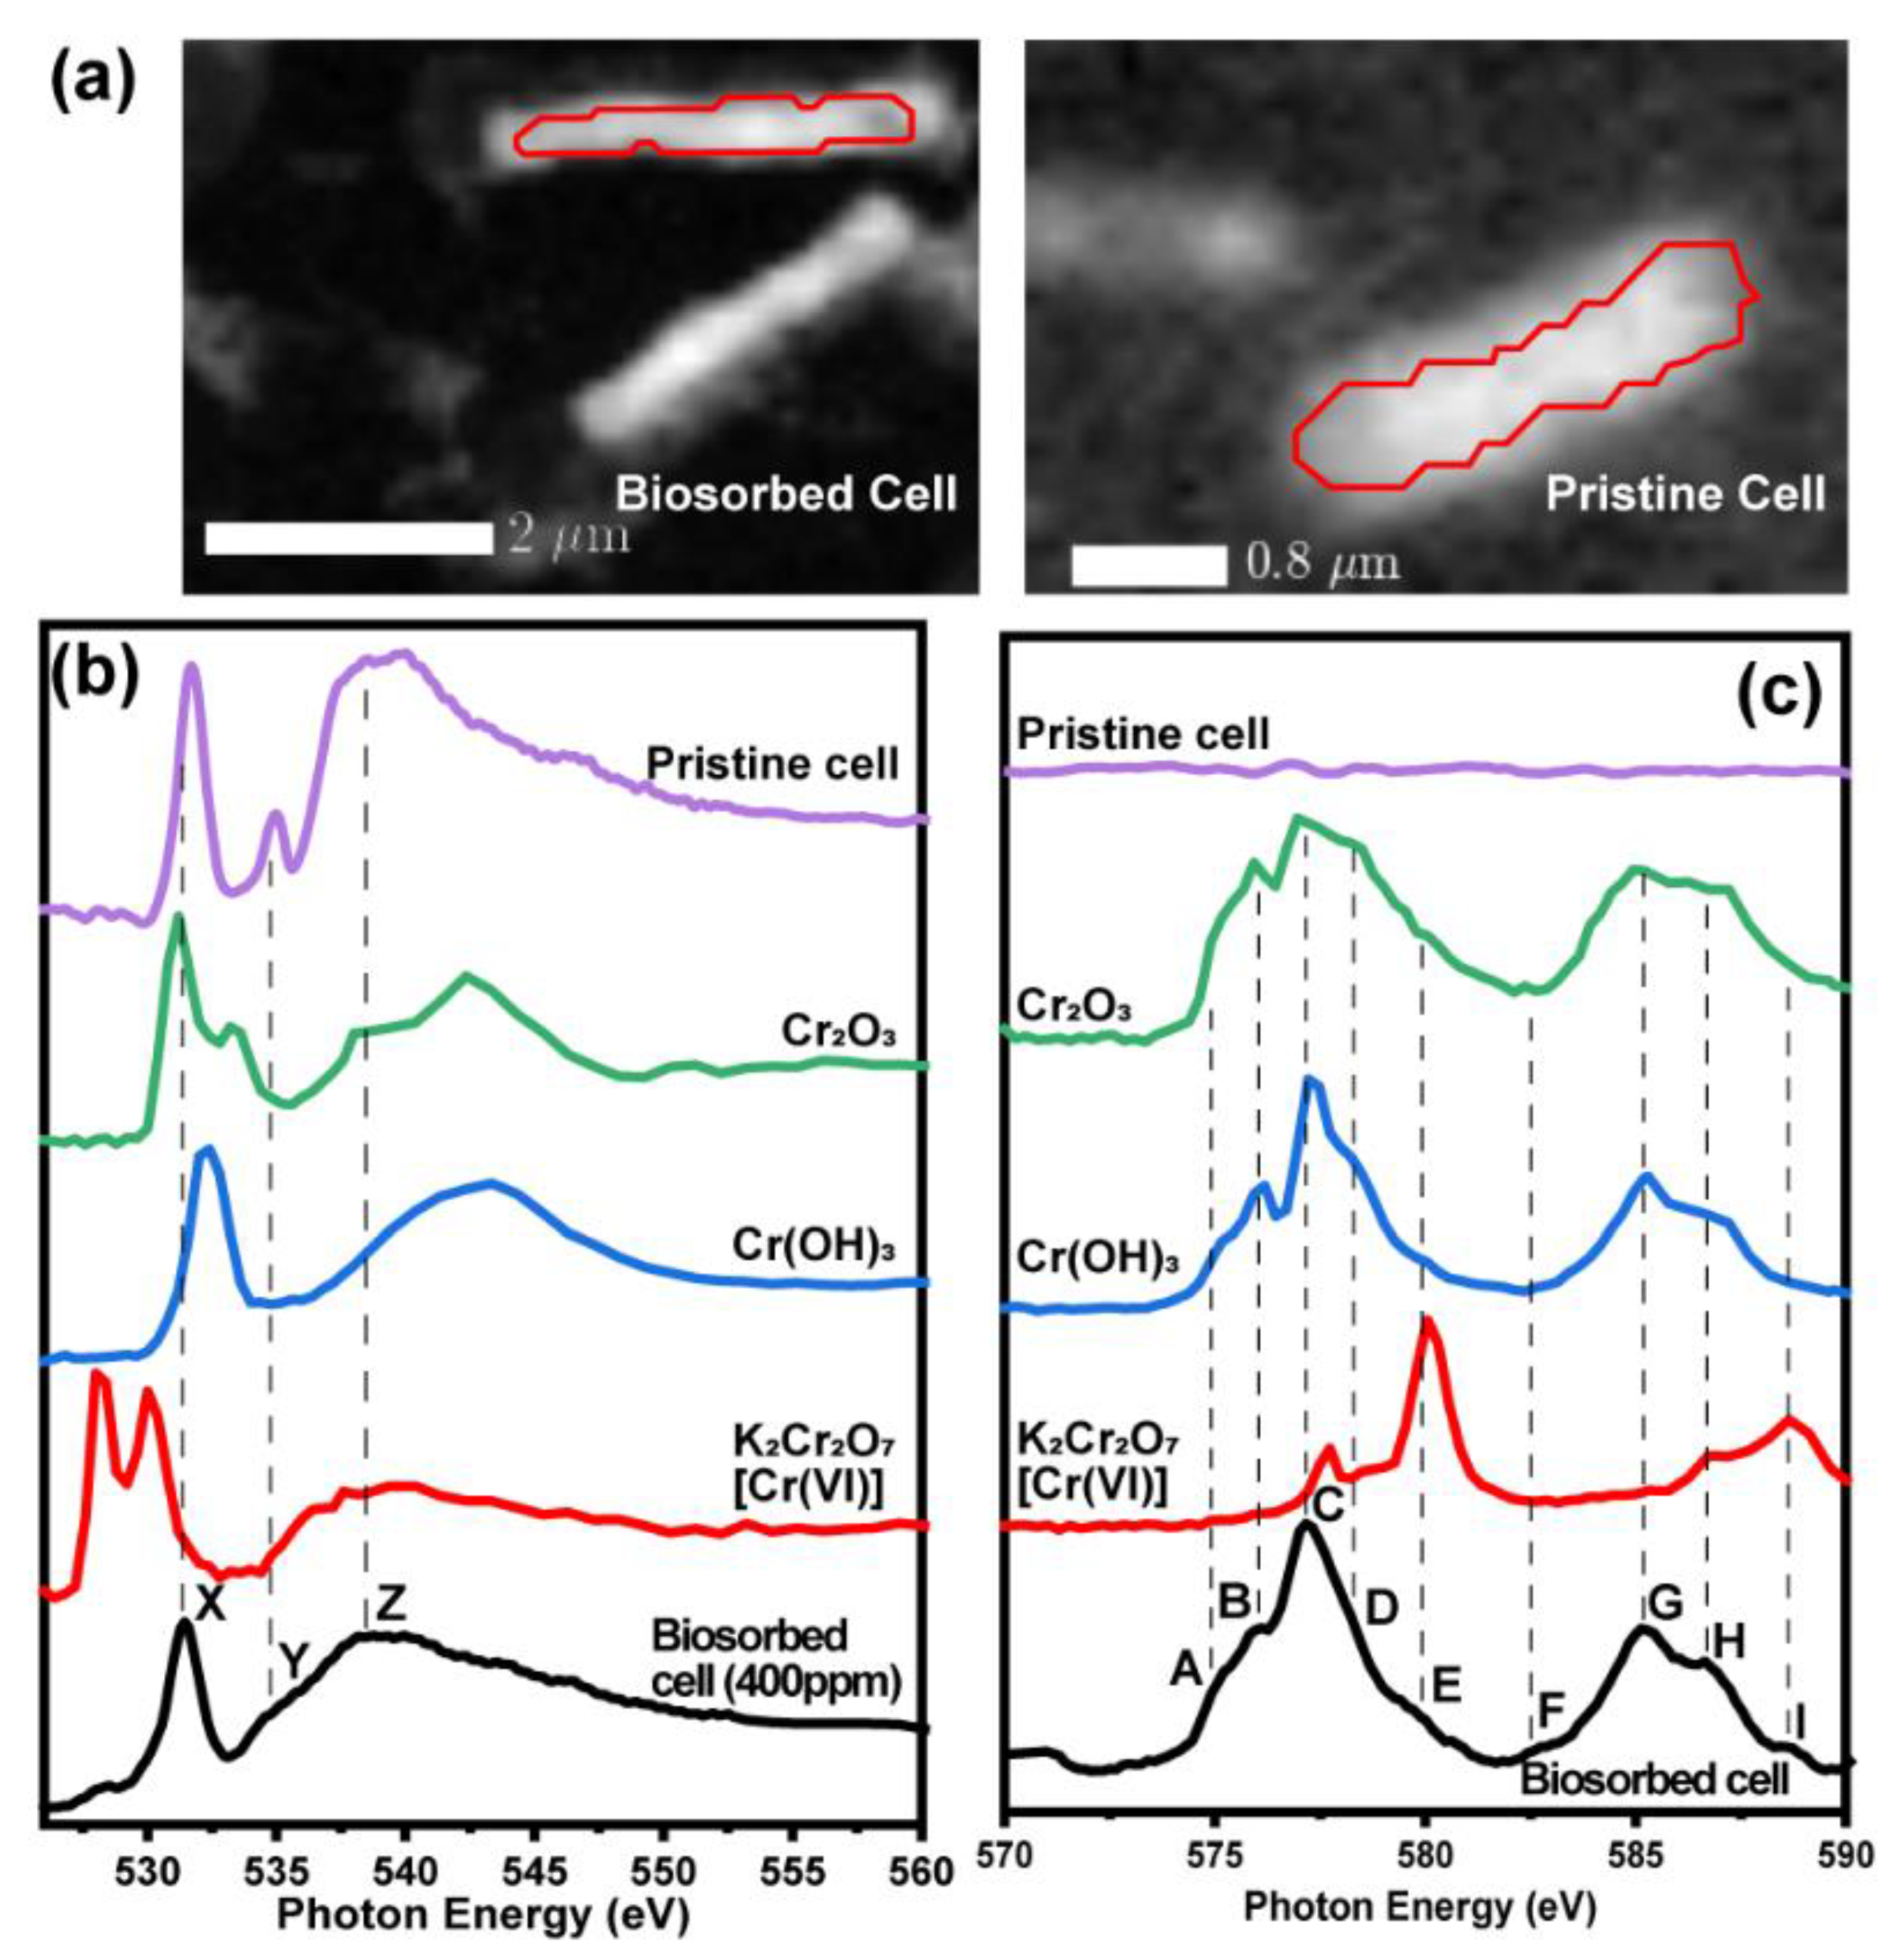
A comparison of the X-ray absorption features of references and sample is provided in Figure 3 and Table S1 (Supplementary Materials). The spectra shown in this figure represent the average of all pixels in the chosen region of interest (marked in the image). These spectra are normalized to the edge-jump and plotted on a common energy scale. Cr L2,3 edge spectra of biosorbed cell has four prominent spectral features at 576.11 eV(B), 577.32 eV(C), 585.29 eV(G) and 586.79 eV(H). Additional shoulder absorptions are observed on the lower and higher energy side of L3 peak at 575.06 eV(A) and 578.37 eV(D), 580.17 eV(E) respectively. A very weak absorption is found at 582.58 eV(F) and at 588 eV(I).
The complex multiplet structure of the Cr L2,3 edge arises from the interaction of the 3d electrons with the 2p core hole. Symmetry and strength of the crystal field around Cr significantly affects its nature and features. Cr L-edge spectra of Cr(VI) exhibits four X-ray absorption with a pre-edge absorption at 577.73 eV, which corresponds to an energy region between C and D on the spectrum of biosorbed cell. This feature, if present in the biosorbed cell, is well superimposed by spectral features that correspond to Cr(III) references, such as those in Cr(OH)3 and Cr2O3. The sharper peak at 580.05 eV, is present only as a shoulder E in the biosorbed cell. It is important to note that Cr L-edge spectra of Cr2O3 and Cr(OH)3 references have almost similar line shape. The noticeable difference is at the C absorption feature which occurs at a slightly lower energy (ΔE = 0.25 eV) for Cr2O3 along with a more intense D shoulder absorption. The C absorption feature of biosorbed cell is more similar to Cr(OH)3 than Cr2O3 which signifies that biosorbed Cr(III) exists majorly in the hydroxide form. The interaction of biosorbed Cr with the bacterial cell could result in distortion of the crystal field environment around Cr. Such distortions cause differences in the Cr L2,3 spectroscopic features of biosorbed Cr compared to the Cr standards. The widening of the spectral feature in the Cr L3 region could be considered as one of these differences (shown in Figure 3c).
The ratio of 577.3 eV (Cr(III)) and 580.06 eV (Cr(VI)) was calculated at different regions of the sample (Figure S1, Supplementary Materials). Higher intensity of Cr(III) absorption is observed, indicating that biosorbed Cr exist primarily in the reduced state, which confirms the bio-reduction of Cr(VI). The primary absorption peak of Cr(VI) appears as a very faint absorption at 580.17 eV(E) in the biosorbed cell. In addition, the L2 peak has a high energy bump (I), around 588 eV, which also belongs to Cr(VI) L2 absorption. The high abundance of Cr(III) suppresses these Cr(VI) signature absorptions. The 528 eV pre-edge absorption and 586.73 eV absorption of Cr(VI) coincides with the C and G absorptions of Cr(III). Therefore, the C and G absorption of the sample could be considered as overlapping contributions of Cr(III) and Cr(VI) [25,26]. Therefore, it can be concluded that there is coexistence of Cr(VI) and Cr(III) indicating the reduction of a significant portion of biosorbed Cr(VI). Furthermore, the L3/L2 intensity ratios of the sample were calculated to be ~1.8, which is closer to that of Cr(OH)3 (1.6) than Cr2O3 (1.2) (Table S2, Supplementary Materials). Analysing the onset positions, L3/L2 ratio and the absorption fine structure, it can be concluded that the biosorbed Cr species is predominantly composed of Cr(III) in hydroxide or oxy-hydroxide form.
The analysis of O K-edge spectra further illustrates the predominance of Cr(III) on the bacterial cells. The O K-edge absorption is characterized by two regions. The pristine cells have a sharp absorption at 531.7 followed by a broad absorption from 535 to 550 eV. The first region arises from the O 1s core level excitation to unoccupied π* molecular orbitals. The second region, between 535 and 550 eV, originates from the σ* transition of O-H, C-O and C = O functional groups [27]. Another prominent absorption occurs on the lower energy side of σ* absorption at 535 eV. The π* absorption of biosorbed cells occurs at 531.59 eV(X) (Figure 3b) and the broad σ* absorption ranges from 533 eV to 550 eV. A slight pre-edge absorption is also observed near 528 eV, which can be attributed to the presence of Cr(VI) [28]. There exists a lower energy shoulder for the σ* absorption at 534.58 eV(Y) (Figure 3b). A slight broadening of the π* peak is indicative of the presence of multiple components (from cell and biosorbed Cr) within the absorption. Cr(VI) has two sharp absorptions at 528 eV and 530 eV corresponding to the transitions to empty t2g and eg molecular orbitals. The intense pre-edge absorption of Cr(VI), is reduced to a slight bump, as seen in the 400 ppm and 600 ppm samples (Figure 2b), indicating the paucity of biosorbed Cr(VI). This feature is absent in the case of the 200 ppm sample. This might be because all of the biosorbed Cr(VI) was reduced to Cr(III) beyond detectable levels. Biosorption at higher concentrations of Cr(VI) (400 ppm and 600 ppm) results in its partial reduction. Consequently, we observe presence of Cr(VI) and Cr(III) simultaneously. Cr(OH)3 and Cr2O3 also exhibit an absorption with two distinct regions. The first region, in this case, corresponds to the oxygen 1s transition to unoccupied t2g and eg molecular orbitals, whereas the second region results from oxygen p state hybridized with Cr 4p and 4s states [25,29]. Cr2O3 also has a shoulder absorption at 533.2 eV, which is absent in all the biosorbed cells. This further proves that biosorbed Cr(III) is present primarily in the form of hydroxide or oxy-hydroxide. O K-edge for the biosorbed cell has a sharp pre-edge absorption at 531.59 eV(X) (Figure 3b). The main absorption is at 536.53 eV(Y) with a lower energy shoulder absorption at 534.58 eV (Y) (Figure 3b). The Y absorption is a signature of the 535 eV peak in the pristine cell. The absorption maxima (Z) could be assigned to the oxygen p states hybridized with Cr (Figure 3b). Therefore, the σ* absorption of biosorbed cells can be considered as a combination of pristine cell and oxygen from Cr species. The apparent shift (−0.3 eV) in the X absorption could be arising from the interaction of Cr species with the cell. The absorption spectrum resembles that of pristine cells, probably due to the abundance of cell bound oxygen nuclei as compared with oxygen associated with Cr.
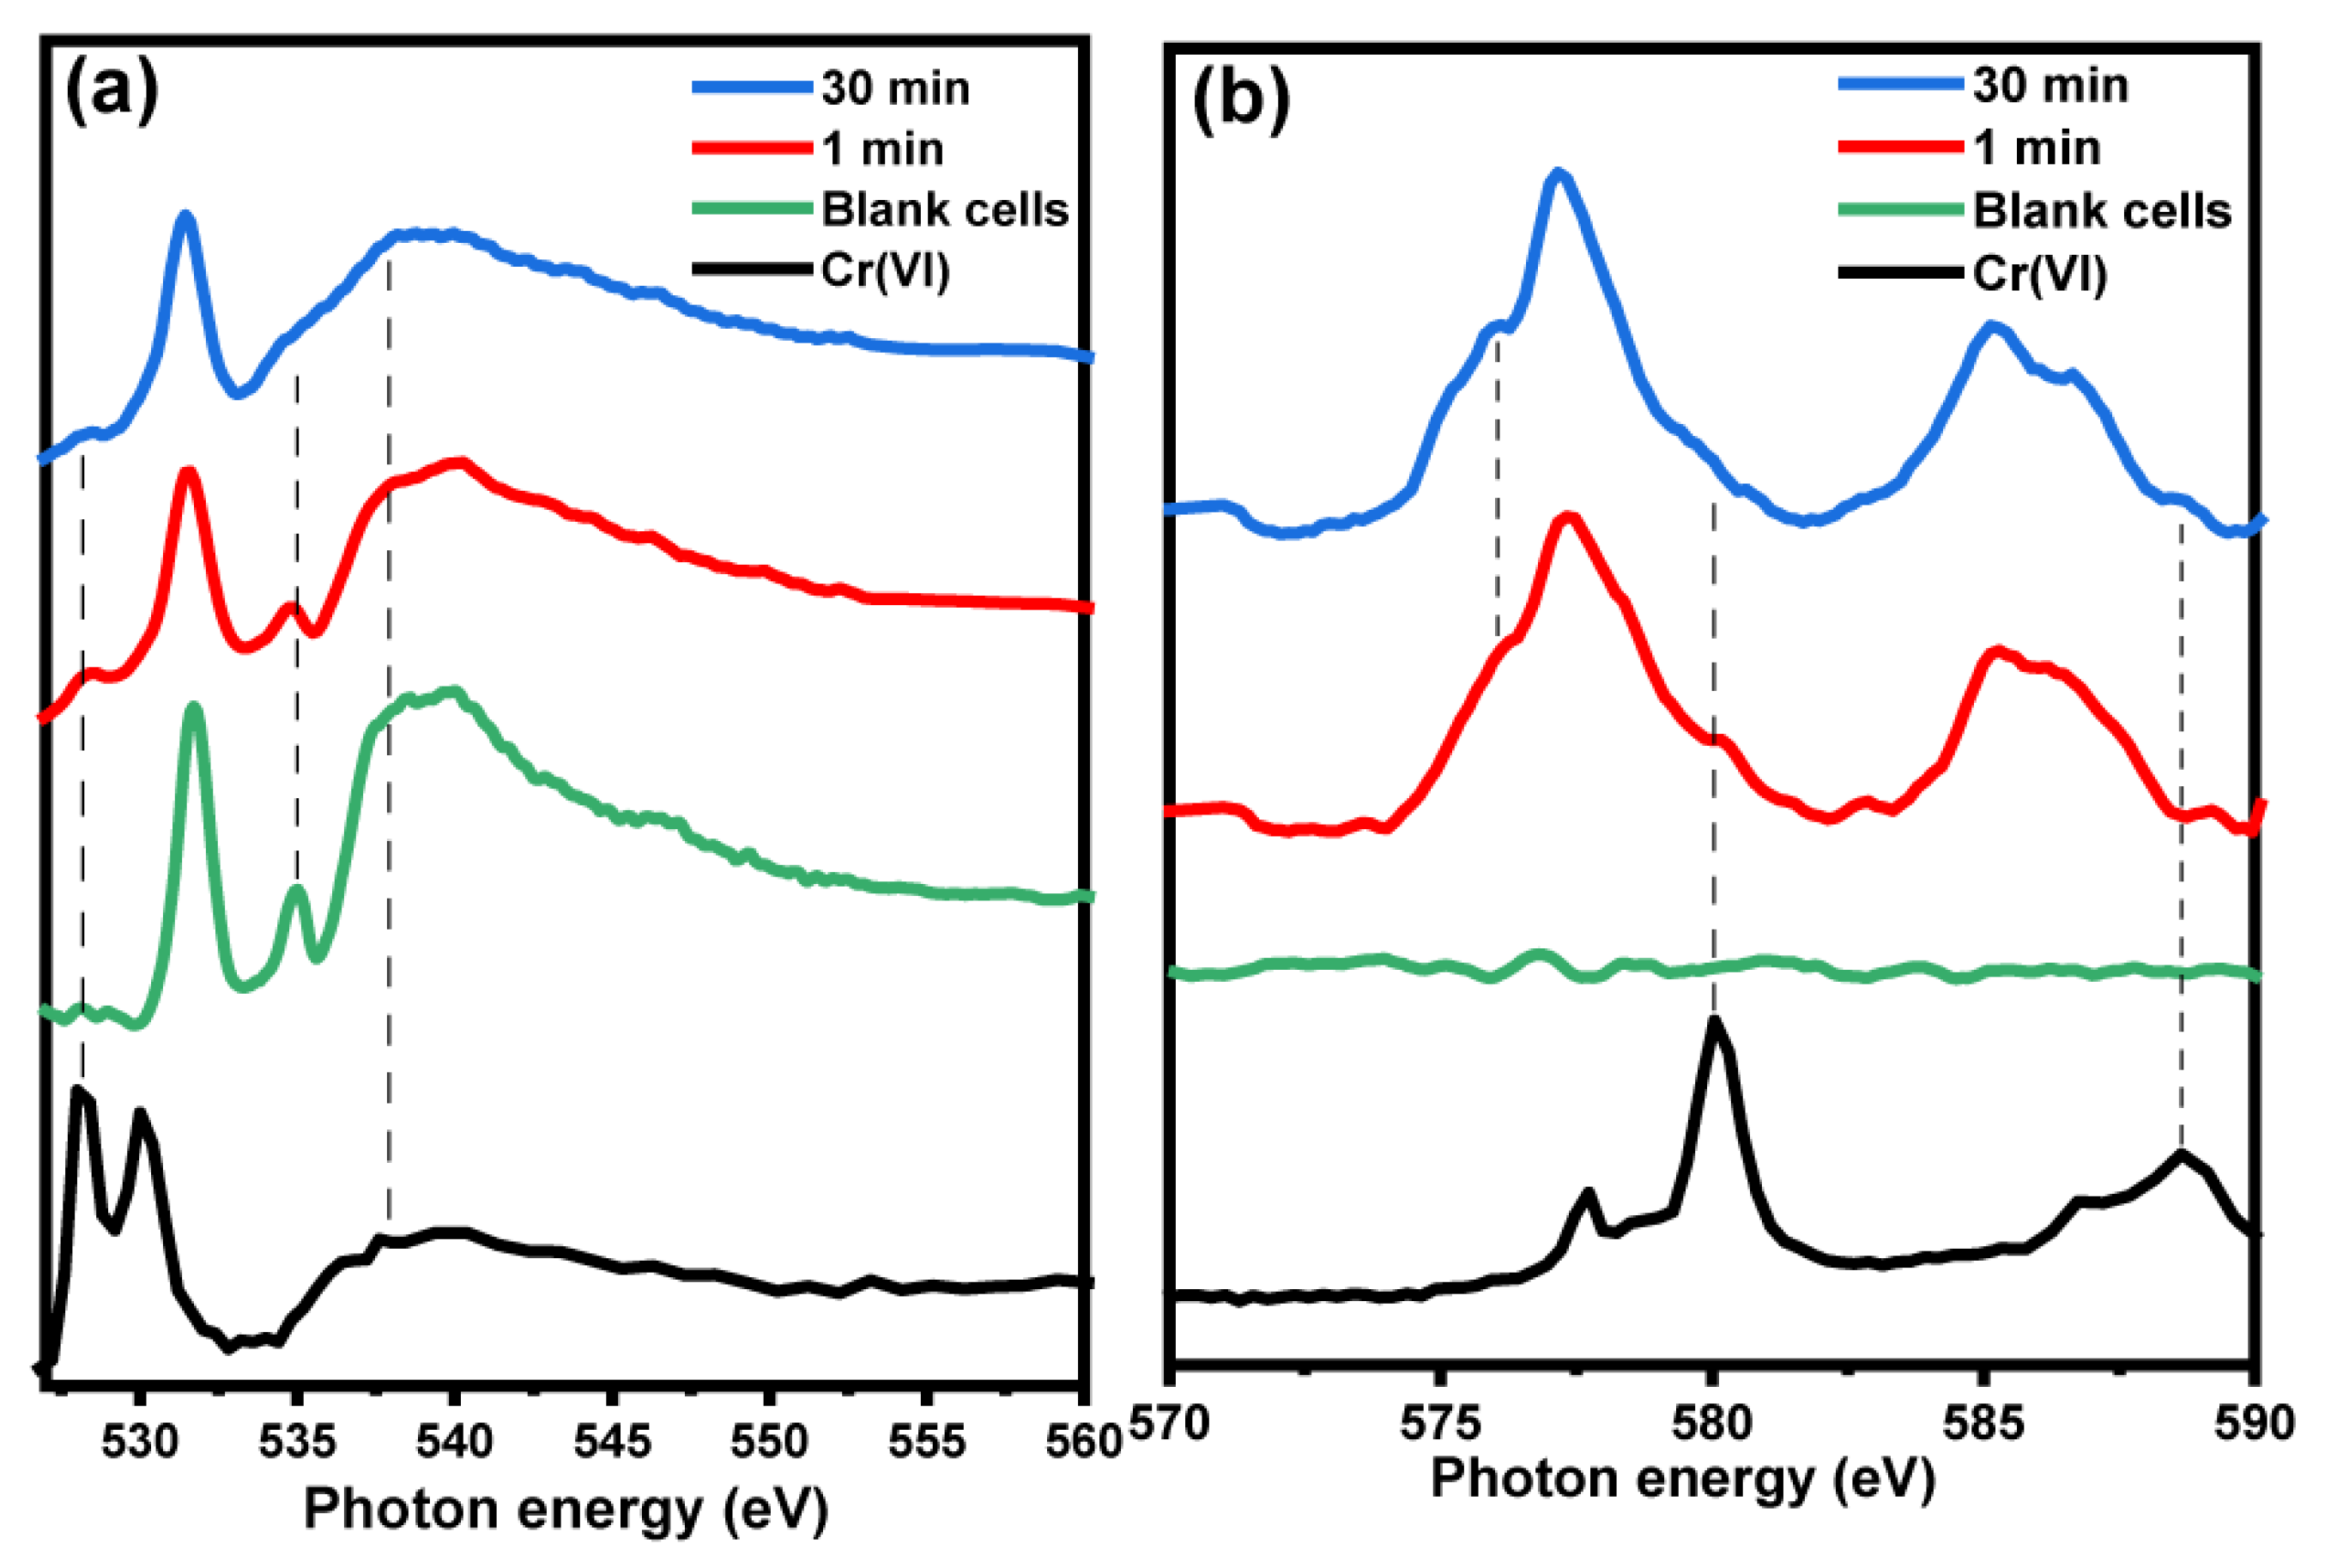
The evolution of O K-edge and Cr L-edge at different durations of the biosorption process was analysed for 200 ppm biosorbed samples, to understand the adsorption of Cr(VI) by the bacterial cells. For this, the cells were isolated after 1 min and 30 min of biosorption. Typical reaction time for the biosorption and bioreduction process is observed to be 20–30 min [14]. The O K-edge pre-edge spectral feature at 528 eV, corresponding to Cr(VI), appears as a prominent bump initially. As biosorption proceeds, this absorption reduces to a slight bump signifying the reduction of Cr(VI) to Cr(III). (Figure 4a). The lower energy shoulder peak (535 eV) of σ* absorption also gets merged to the σ*. The broadening of the σ* peak also occurs with time, indicating the increment in Cr concentration on the cells. In the Cr L-edge, the main absorption of Cr(VI) (580.05 eV) gets suppressed, by the Cr(III) absorption (L3 edge), within 30 min of the reaction. The L2 edge of the biosorbed sample also undergoes significant changes during the biosorption. Initially, the L2 absorption has a single broad peak with a slight high energy shoulder absorption. As time proceeds, we observe that the L2 edge splits to form two distinct absorptions as the amount of bioreduced Cr(III) increases. The intensity of the high energy feature of Cr(VI) L2 edge at 588.64 eV also gets reduced over time. These observations further confirm that biosorbed Cr(VI) gets reduced to Cr(III).

4. Conclusions

Our study demonstrates the utilization of scanning transmission X-ray microscopy in analysing the bioremediation of Cr(VI) by Citrobacter freundii cells. In this preliminary analysis, the obtained results reveal that Cr exist primarily in 3+ oxidation state in the form of hydroxides or oxyhydroxides. Time-dependent analysis also provides an insight into the kinetics of the bio-reduction process. During the initial stages of biosorption, Cr(VI) signatures were observed on the biosorbed cell, which diminished as reduction took place. Within 30 min into biosorption, Cr(III) absorption increases to the point where Cr(VI) signal gets completely suppressed. This study provides a basis for further detailed characterizations required to delineate the bioremediation process. Further analysis across C and N K-edge signal would facilitate the understanding of the nature of the binding sites of Cr.

Supplementary Materials

The following are available online at www.mdpi.com/article/10.3390/qubs5040028/s1, Table S1: X-ray absorption features of biosorbed cells and standard samples, Table S2: Intensity ratio of L3 and L2 peak for samples and references, Figure S1: Ratio of absorption intensity at 577.4 eV [Cr(III)] and 580.6 eV [Cr(VI)] at various regions of 400 ppm sample, Figure S2: Zoomed in spectra of O Kedge and Cr Ledge absorption of biosorbed cells. The low energy bump around 527 eV and high energy bump at 588 eV corresponding to Cr(VI) is seen in 400 ppm and 600 ppm sample.

Author Contributions

Conceptualization, A.G.A. and S.S. (Sufal Swaraj); methodology, S.S. (Sufal Swaraj); software, A.G.A. and S.S. (Sufal Swaraj); validation, S.S. (Sufal Swaraj); formal analysis, A.G.A. and S.S. (Sufal Swaraj); investigation, A.G.A. and S.S. (Sufal Swaraj); resources, S.S. (Sankaran Subramanian) and P.C.R.; data curation, A.G.A.; writing—original draft preparation, A.G.A. and S.S. (Sufal Swaraj); writing—review and editing, S.S. (Sankaran Subramanian) and P.C.R.; visualization, A.G.A.; supervision, S.S. (Sankaran Subramanian) and P.C.R.; project administration, S.S. (Sankaran Subramanian) and P.C.R.; funding acquisition, S.S. (Sankaran Subramanian) and P.C.R. All authors have read and agreed to the published version of the manuscript.

Funding

This work is supported by the Indo-French Centre for the Promotion of Advanced Research (CEFIPRA) and University Grants Commission, New Delhi, India.

Institutional Review Board Statement

Not applicable.

Informed Consent Statement

Not applicable.

Acknowledgments

AGA acknowledges the timely help provided by Shweta Shekar and Sandeep Satyanarayana. The authors would like to thank Synchrotron SOLEIL for providing beamtime at the HERMES beamline.

Conflicts of Interest

The authors declare no conflict of interest.

Abbreviations

STXM, scanning transmission X-ray microscopy; XANES, X-ray absorption near edge structure spectroscopy; NEXAFS, near edge X-ray absorption fine Structure; Cr, Chromium; Cr(VI), hexavalent chromium; Cr(III), trivalent chromium.

References

  1. Stambulska, U.Y.; Bayliak, M.M.; Lushchak, V.I. Chromium(VI) Toxicity in Legume Plants: Modulation Effects of Rhizobial Symbiosis. BioMed Res. Int. 2018, 2018, 8031213. [Google Scholar] [CrossRef]
  2. Rowbotham, A.L.; Levy, L.S.; Shuker, L.K. Chromium in the environment: An evaluation of exposure of the UK general population and possible adverse health effects. J. Toxicol. Environ. Health Part B 2000, 3, 145–178. [Google Scholar] [CrossRef]
  3. Pandey, N.; Shukla, S.K.; Singh, N.B. Water purification by polymer nanocomposites: An overview. Nanocomposites 2017, 3, 47–66. [Google Scholar] [CrossRef]
  4. Sharma, P.; Bihari, V.; Agarwal, S.K.; Verma, V.; Kesavachandran, C.N.; Pangtey, B.S.; Mathur, N.; Singh, K.P.; Srivastava, M.; Goel, S.K. Groundwater contaminated with hexavalent chromium [Cr (VI)]: A health survey and clinical examination of community inhabitants (Kanpur, India). PLoS ONE 2012, 7, e47877. [Google Scholar] [CrossRef] [PubMed] [Green Version]
  5. Mamyrbaev, A.A.; Dzharkenov, T.A.; Imangazina, Z.A.; Satybaldieva, U.A. Mutagenic and carcinogenic actions of chromium and its compounds. Environ. Health Prev. Med. 2015, 20, 159–167. [Google Scholar] [CrossRef] [Green Version]
  6. Mitra, S.; Sarkar, A.; Sen, S. Removal of chromium from industrial effluents using nanotechnology: A review. Nanotechnol. Environ. Eng. 2017, 2, 11. [Google Scholar] [CrossRef]
  7. Cheng, Y.; Yan, F.; Huang, F.; Chu, W.; Pan, D.; Chen, Z.; Zheng, J.; Yu, M.; Lin, Z.; Wu, Z. Bioremediation of Cr(VI) and immobilization as Cr(III) by Ochrobactrum Anthropi. Environ. Sci. Technol. 2010, 44, 6357–6363. [Google Scholar] [CrossRef]
  8. Tarekegn, M.M.; Salilih, F.Z.; Ishetu, A.I. Microbes used as a tool for bioremediation of heavy metal from the environment. Cogent Food Agric. 2020, 6, 1783174. [Google Scholar] [CrossRef]
  9. Fernández, P.M.; Viñarta, S.C.; Bernal, A.R.; Cruz, E.L.; Figueroa, L.I.C. Bioremediation strategies for chromium removal: Current research, scale-up approach and future perspectives. Chemosphere 2018, 208, 139–148. [Google Scholar] [CrossRef]
  10. Tan, H.; Wang, C.; Zeng, G.; Luo, Y.; Li, H.; Xu, H. Bioreduction and biosorption of Cr(VI) by a Novel Bacillus Sp. CRB-B1 strain. J. Hazard. Mater. 2020, 386, 121628. [Google Scholar] [CrossRef]
  11. Ojuederie, O.B.; Babalola, O.O. Microbial and plant-assisted bioremediation of heavy metal polluted environments: A review. Int. J. Environ. Res. Public Health 2017, 14, 1504. [Google Scholar] [CrossRef] [Green Version]
  12. Tekerlekopoulou, A.G.; Tsiflikiotou, M.; Akritidou, L.; Viennas, A.; Tsiamis, G.; Pavlou, S.; Bourtzis, K.; Vayenas, D.V. Modelling of biological Cr(VI) removal in draw-fill reactors using microorganisms in suspended and attached growth systems. Water Res. 2013, 47, 623–636. [Google Scholar] [CrossRef] [PubMed]
  13. Prabhakaran, D.; Braun, J.-J.; Subramanian, S. Comparative studies on the bioremediation of hexavalent and trivalent chromium using Citrobacter Freundii: Part I-effect of parameters controlling biosorption. Int. J. Environ. Res. 2014, 8, 1127–1134. [Google Scholar]
  14. Prabhakaran, D.C.; Riotte, J.; Subramanian, S. Bioremediation of hexavalent and trivalent chromium using Citrobacter Freundii: A mechanistic study. Nat. Resour. Eng. 2016, 1, 1–12. [Google Scholar] [CrossRef]
  15. Liss, K.D.; Chen, K. Frontiers of synchrotron research in materials Science. MRS Bull. 2016, 41, 435–441. [Google Scholar] [CrossRef] [Green Version]
  16. Buckley, C.J.; Foster, G.F.; Burge, R.E.; Ali, S.Y.; Scotchford, C.A. Elemental Mapping of Biological Tissue by X-ray Absorption Difference Imaging in the STXM BT—X-ray Microscopy III; Michette, A.G., Morrison, G.R., Buckley, C.J., Eds.; Springer: Berlin/Heidelberg, Germany, 1992; pp. 423–426. [Google Scholar]
  17. Burge, R.E.; Beswetherick, J.T.; Browne, M.T.; Charalambous, P.S.; Duke, P.J.; Foster, G.F.; Hare, A.R.; Michette, A.G.; Morris, D.; Morrison, G.R.; et al. Scanning X-ray Microscopy. In X-ray Instrumentation in Medicine and Biology, Plasma Physics, Astrophysics, and Synchrotron Radiation; Benattar, R., Ed.; SPIE: Bellingham, WA, USA, 1989; Volume 1140, pp. 528–529. [Google Scholar]
  18. Benzerara, K.; Menguy, N.; Guyot, F.; Skouri, F.; de Luca, G.; Barakat, M.; Heulin, T. Biologically controlled precipitation of calcium phosphate by Ramlibacter Tataouinensis. Earth Planet. Sci. Lett. 2004, 228, 439–449. [Google Scholar] [CrossRef]
  19. Obst, M.; Wang, J.; Hitchcock, A.P. Soft X-Ray spectro-tomography study of cyanobacterial biomineral nucleation. Geobiology 2009, 7, 577–591. [Google Scholar] [CrossRef]
  20. Obst, M.; Schmid, G. 3D Chemical mapping: Application of scanning transmission (Soft) X-ray microscopy (STXM) in combination with angle-scan tomography in bio-, geo-, and environmental sciences. Methods Mol. Biol. 2014, 1117, 757–781. [Google Scholar] [CrossRef]
  21. Hitchcock, A.P.; Dynes, J.J.; Lawrence, J.R.; Obst, M.; Swerhone, G.D.W.; Korber, D.R.; Leppard, G.G. Soft X-ray spectromicroscopy of nickel sorption in a natural river biofilm. Geobiology 2009, 7, 432–453. [Google Scholar] [CrossRef]
  22. Belkhou, R.; Stanescu, S.; Swaraj, S.; Besson, A.; Ledoux, M.; Hajlaoui, M.; Dalle, D. HERMES: A soft X-Ray beamline dedicated to X-Ray microscopy. J. Synchrotron Radiat. 2015, 22, 968–979. [Google Scholar] [CrossRef]
  23. Ma, Y.; Chen, C.T.; Meigs, G.; Randall, K.; Sette, F. High-resolution K-shell photoabsorption measurements of simple molecules. Phys. Rev. A 1991, 44, 1848–1858. [Google Scholar] [CrossRef]
  24. Lerotic, M.; Mak, R.; Wirick, S.; Meirer, F.; Jacobsen, C. MANTiS: A Program for the analysis of X-Ray spectromicroscopy data. J. Synchrotron Radiat. 2014, 21, 1206–1212. [Google Scholar] [CrossRef] [PubMed]
  25. Wang, Z.; Alrehaily, L.; Joseph, J.; Wren, J.C.; Wang, J.; Sham, T.K. Scanning Transmission X-Ray Microscopy studies of chromium hydroxide hollow spheres and nanoparticles formed by gamma radiation. Can. J. Chem. 2017, 95, 1146–1150. [Google Scholar] [CrossRef]
  26. Bae, S.; Hikaru, F.; Kanematsu, M.; Yoshizawa, C.; Noguchi, T.; Yu, Y.; Ha, J. Removal of hexavalent chromium in Portland cement using ground granulated blast-furnace slag powder. Materials 2017, 11, 11. [Google Scholar] [CrossRef] [PubMed] [Green Version]
  27. Sharma, A.; Varshney, M.; Nanda, S.S.; Shin, H.J.; Kim, N.; Yi, D.K.; Chae, K.-H.; Ok Won, S. Structural, electronic structure and antibacterial properties of graphene-oxide nano-sheets. Chem. Phys. Lett. 2018, 698, 85–92. [Google Scholar] [CrossRef]
  28. Kucheyev, S.O.; Sadigh, B.; Baumann, T.F.; Wang, Y.M.; Felter, T.E.; Van Buuren, T.; Gash, A.E.; Satcher, J.H.; Hamza, A.V. Electronic structure of chromia aerogels from soft X-ray absorption spectroscopy. J. Appl. Phys. 2007, 101, 124315. [Google Scholar] [CrossRef]
  29. de Groot, F.M.F.; Grioni, M.; Fuggle, J.C.; Ghijsen, J.; Sawatzky, G.A.; Petersen, H. Oxygen 1s X-Ray-absorption edges of transition-metal oxides. Phys. Rev. B 1989, 40, 5715–5723. [Google Scholar] [CrossRef] [PubMed]
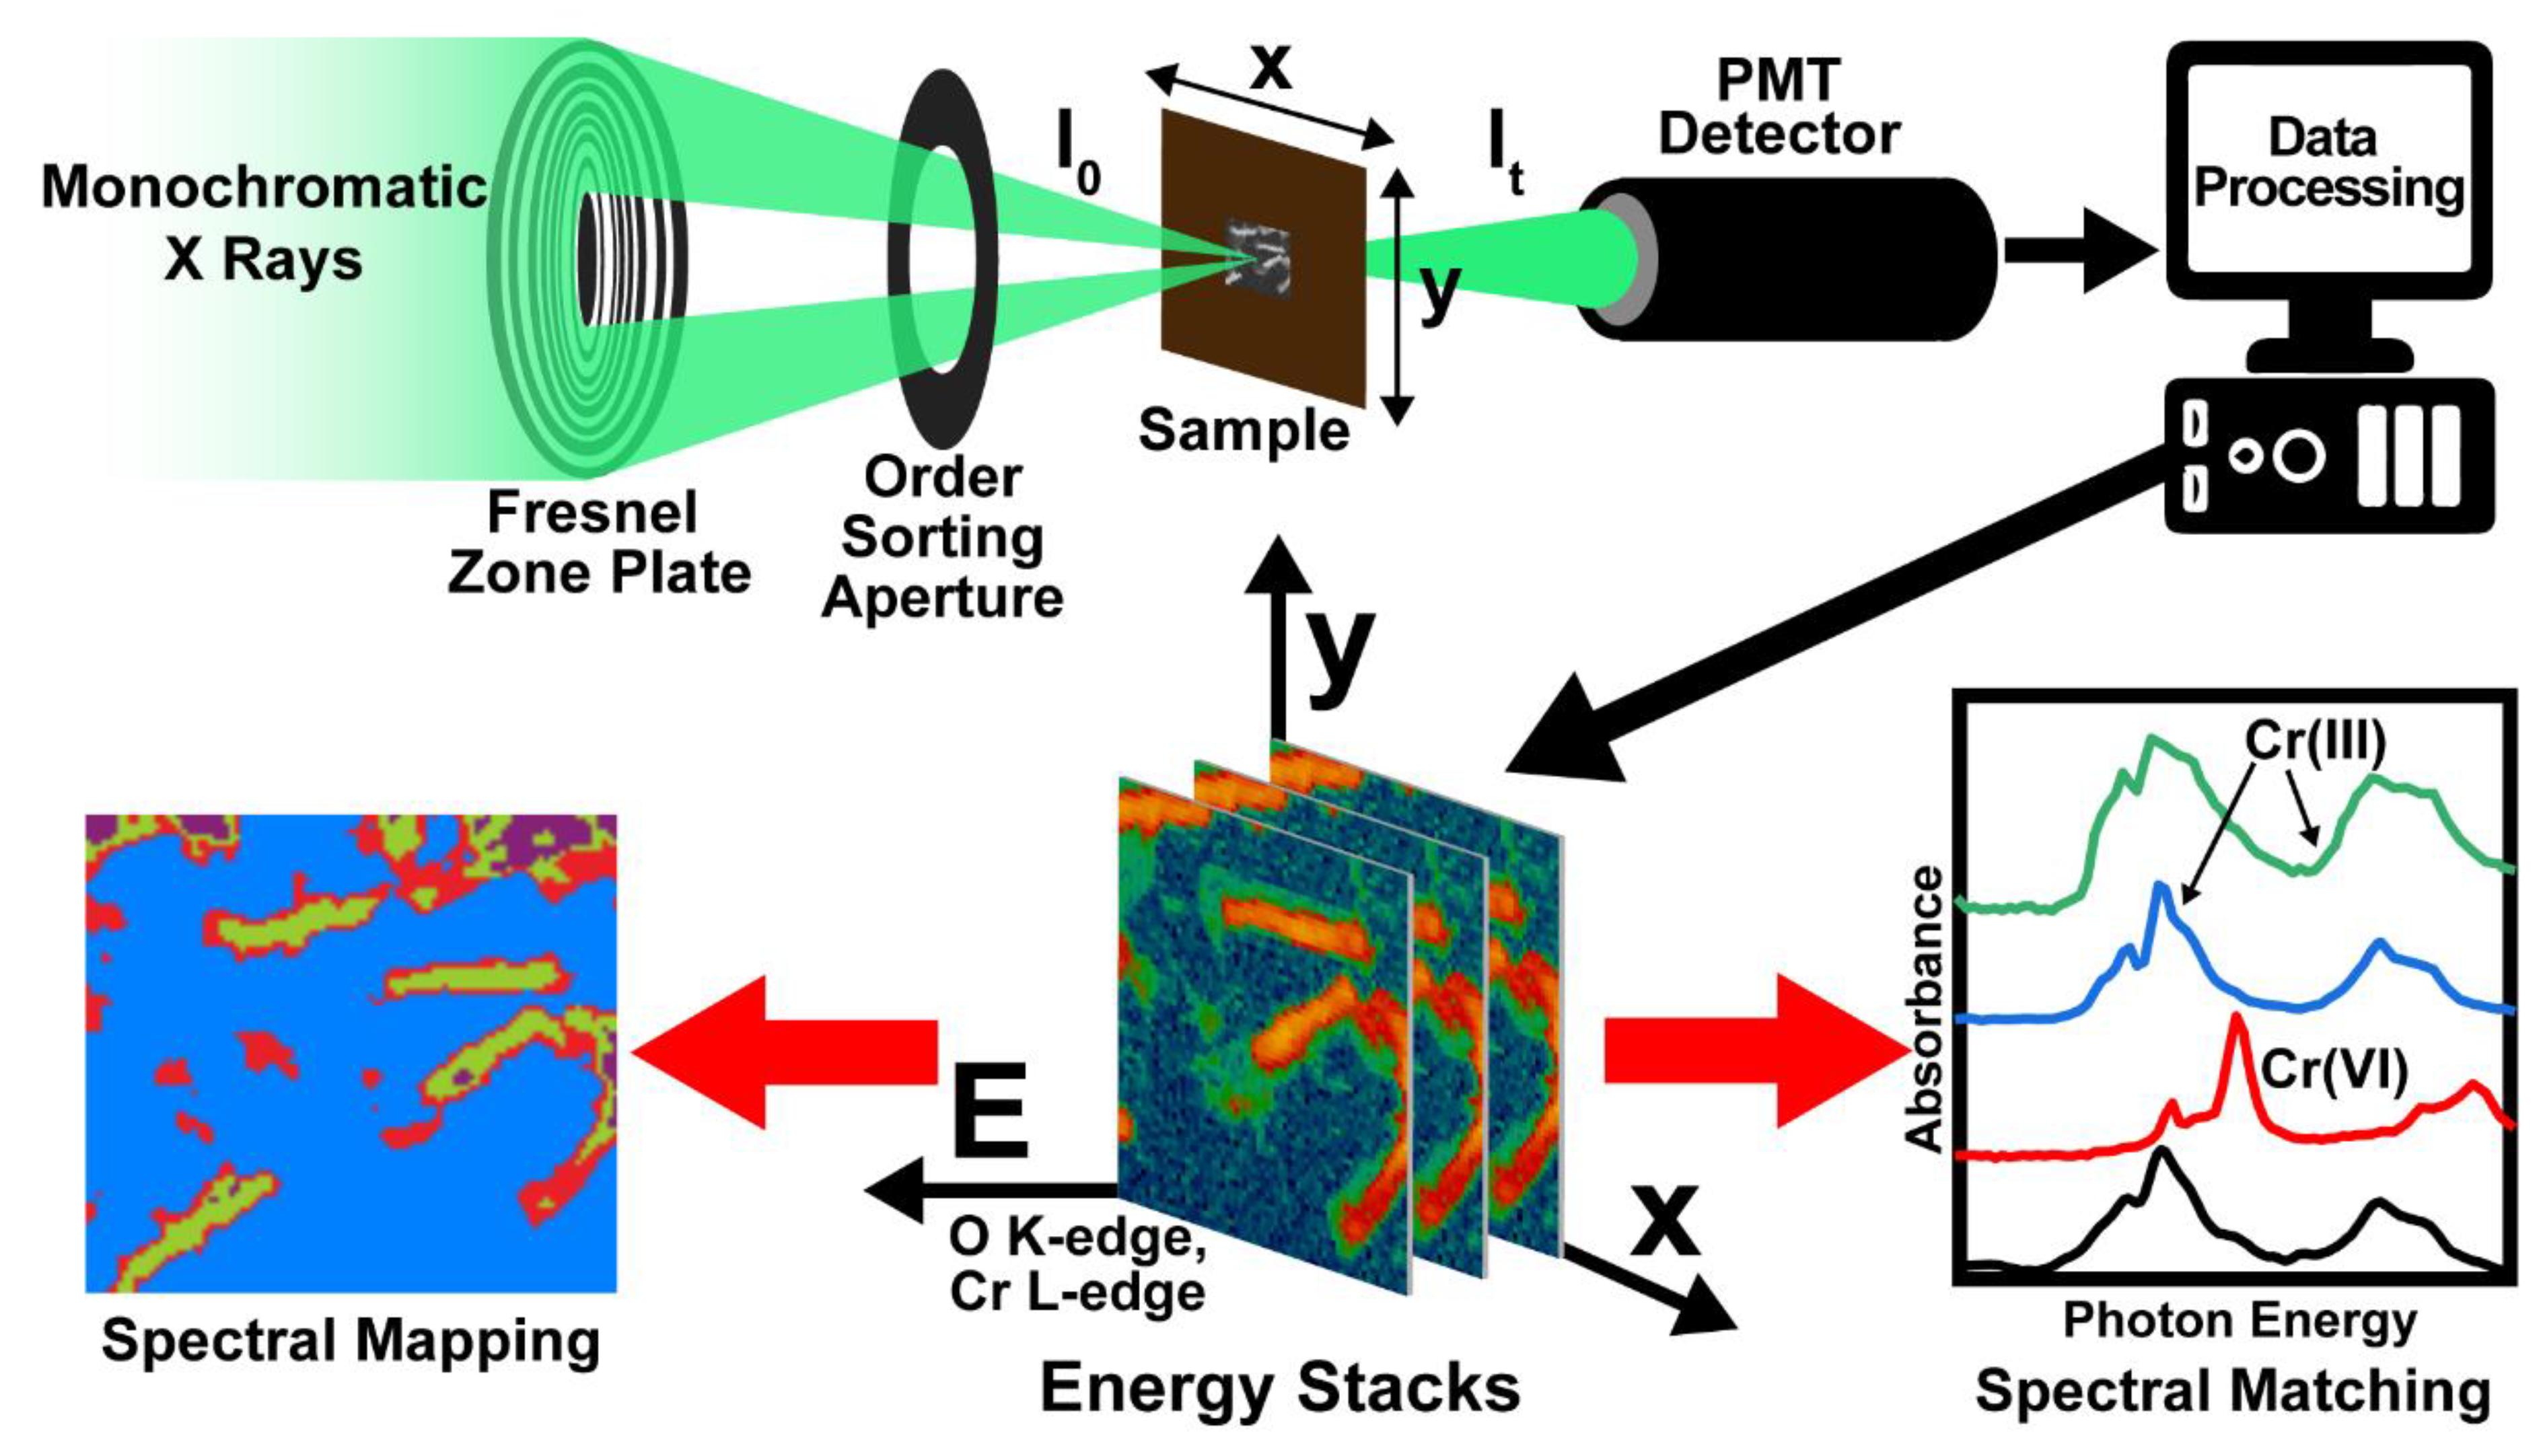
Figure 1. Schematic representation of STXM Analysis.
Qubs 05 00028 g001
Figure 2. (a) Spectromicrographs of pristine cell and cells biosorbed at 200 ppm, 400 ppm and 600 ppm of chromium (left to right). (b) Corresponding spectra at O K-edge and Cr L-edge, from the region of interest marked in the spectromicrograph.
Qubs 05 00028 g002
Figure 3. (a) Spectromicrograph of pristine and biosorbed cells along with the region of interest (in red) from where the spectrum was obtained. Comparison of (b) O K-edge and (c) Cr L-edge spectra of biosorbed cells and standard samples.
Qubs 05 00028 g003
Figure 4. Time-dependent analysis at (a) O K-edge and (b) Cr L-edge.
Qubs 05 00028 g004
Publisher’s Note: MDPI stays neutral with regard to jurisdictional claims in published maps and institutional affiliations.