Use of Space-Resolved in-Situ High Energy X-ray Diffraction for the Characterization of the Compositional Dependence of the Austenite-to-Ferrite Transformation Kinetics in Steels

 ,
,
Abstract
1. Introduction
- (i)
- The carbon content in the graded materials should be well controlled, which is made difficult by the high temperature required for the inter-diffusion heat treatment.
- (ii)
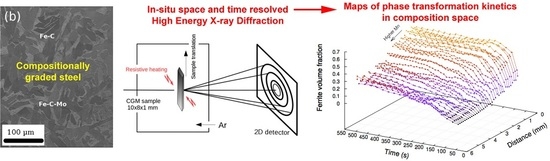
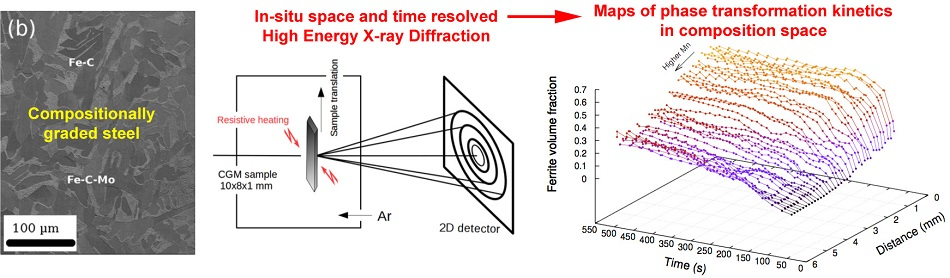
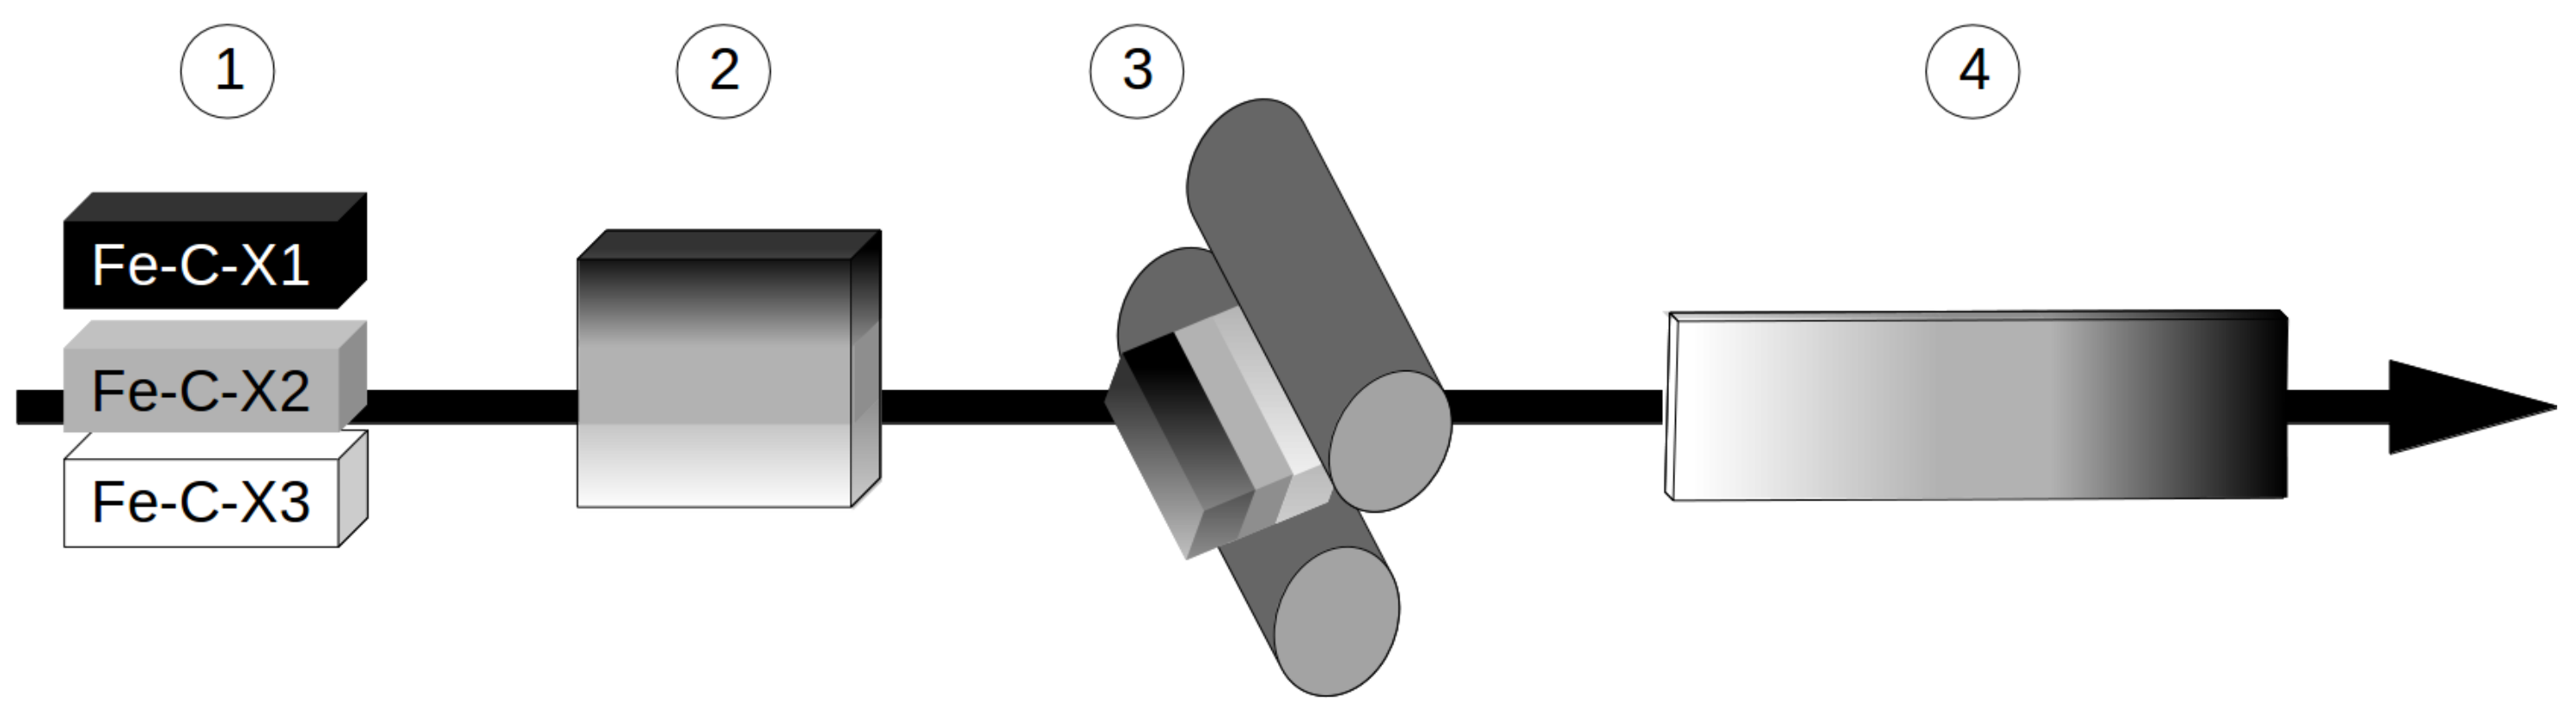
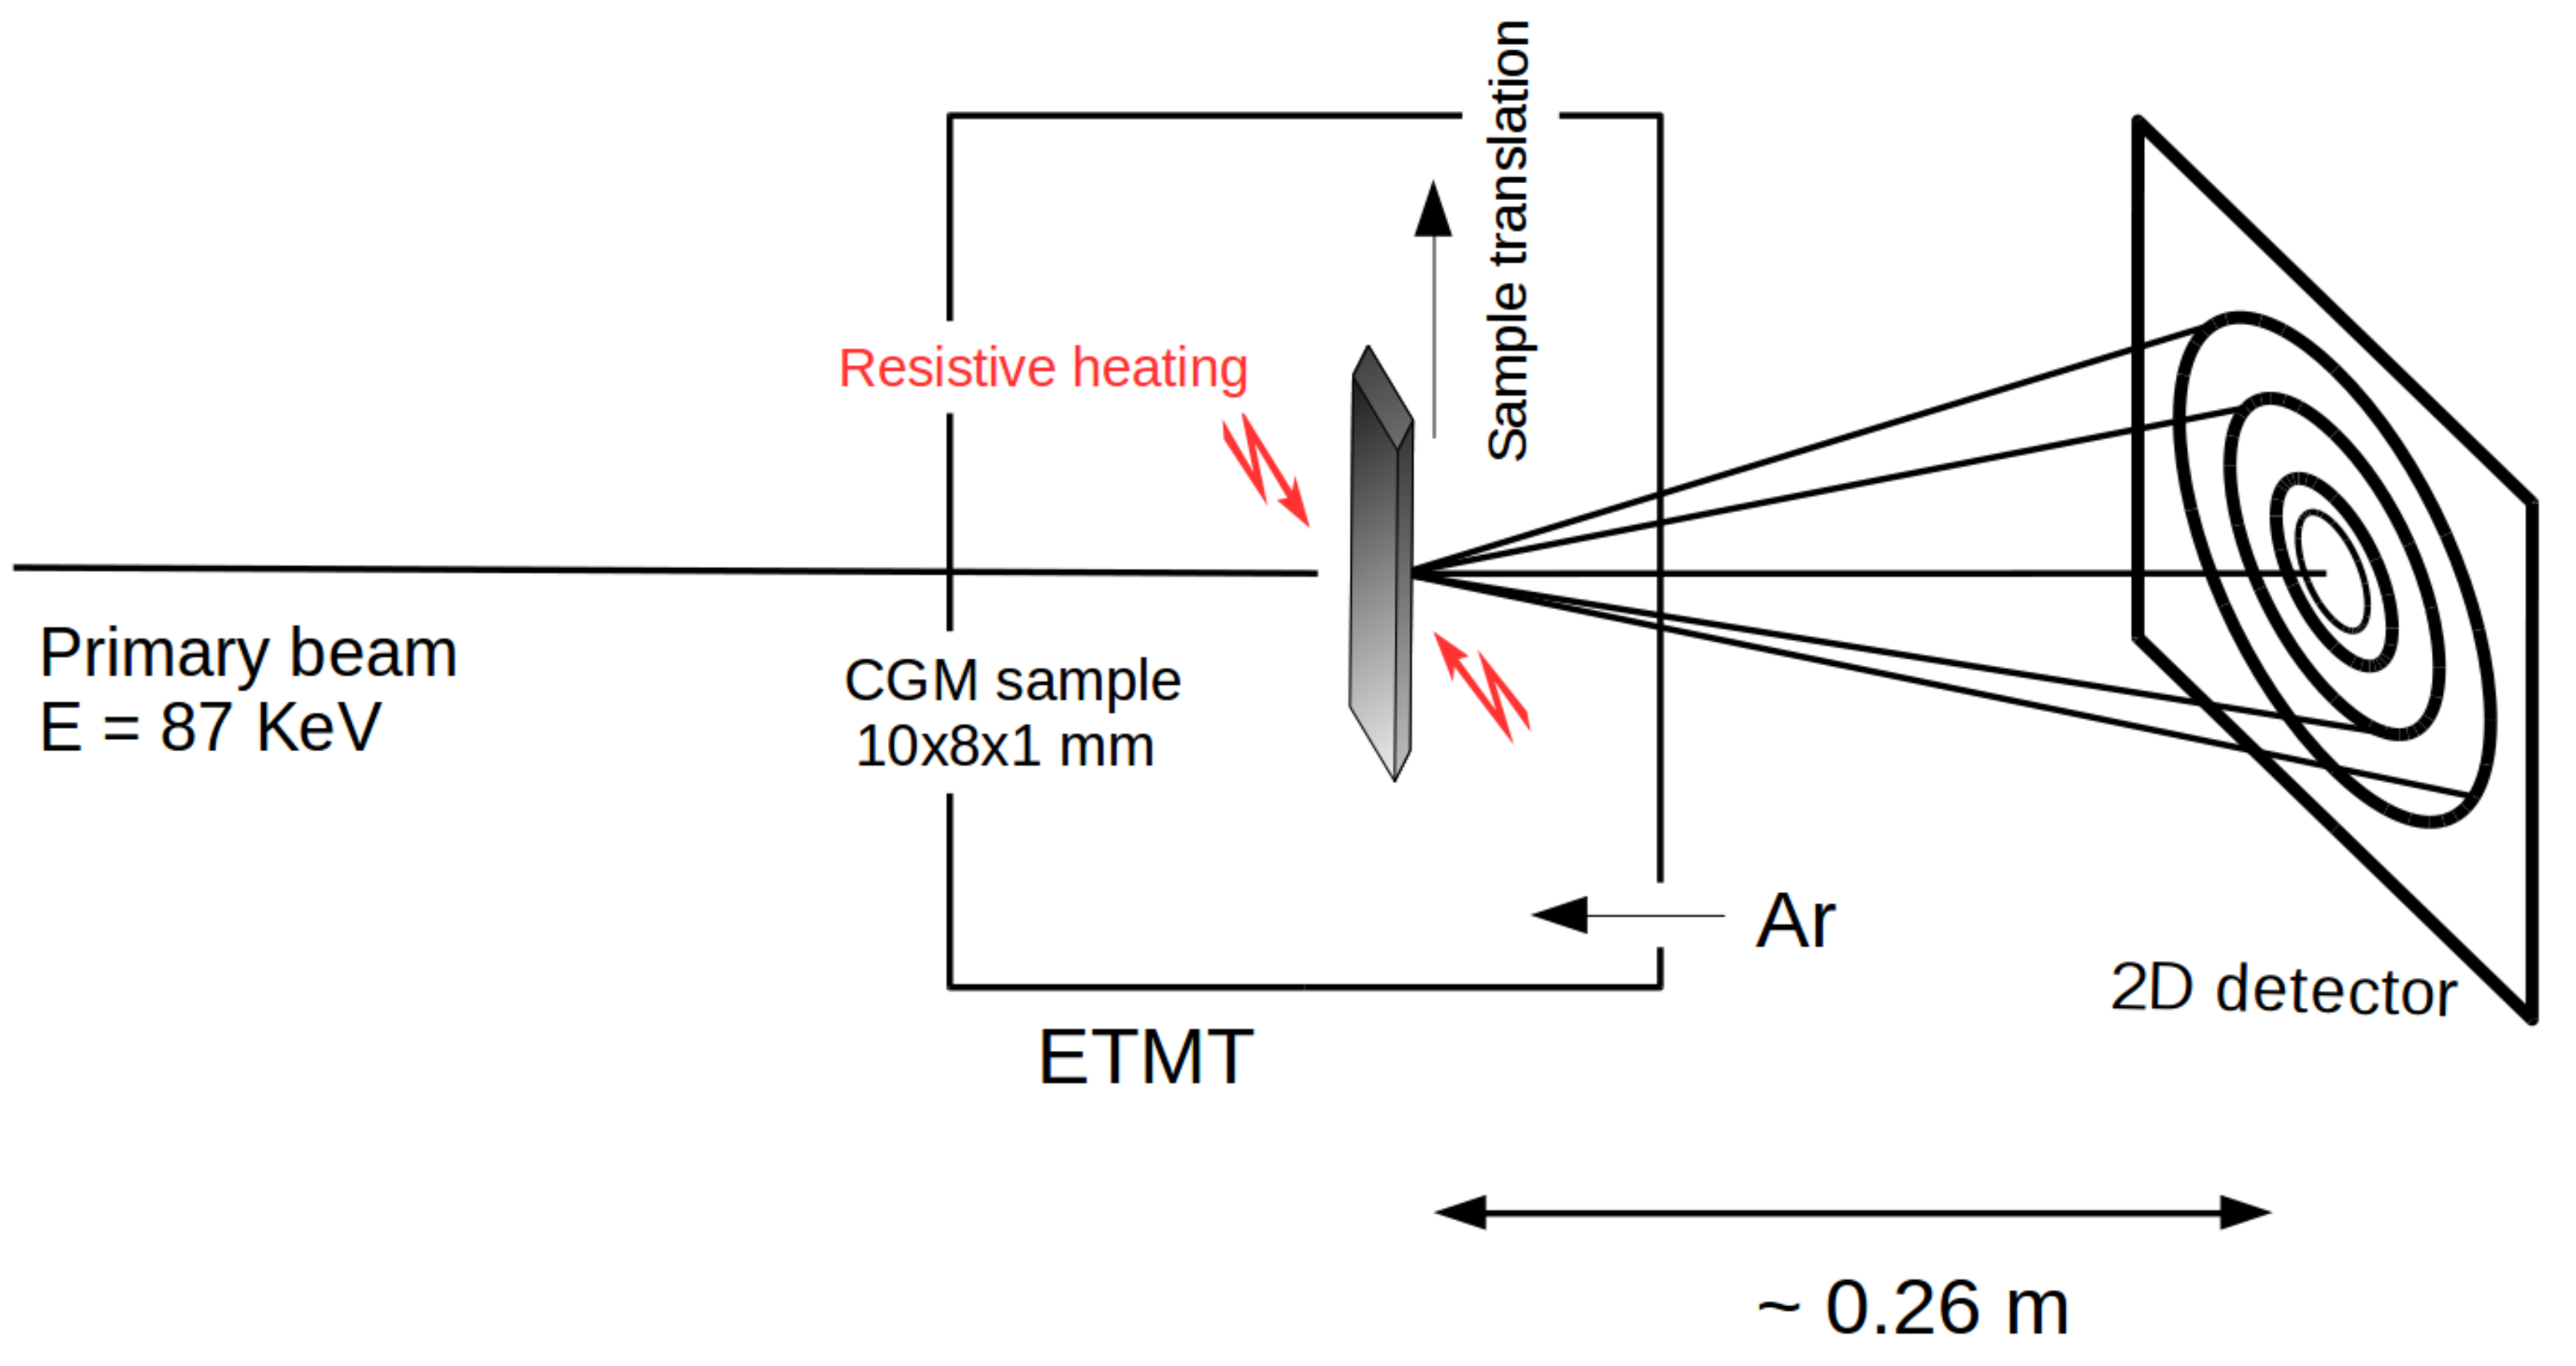
- The spatial extension of the composition gradient should be sufficient as compared to the typical size of a synchrotron beam (∼200 m) so that the sample volume probed for one diffraction pattern can be considered approximately homogeneous in composition. Thus, many alloy compositions can be measured in a single experiment. Besides, it would also ensure that the composition gradients are sufficiently weak to not interfere with the phase transformation itself, since it will have an almost constant composition at the scale of the transformation (a few microns). Such an extension of several mm being difficult to achieve by inter-diffusion alone, a further step of plastic deformation is added to the process.
- (iii)
- The grain size within the sample gradient should be sufficiently small to ensure quantitative and statistic characterization of the phase transformation from the HEXRD data. This requirement is facilitated by the cold plastic deformation step, which results in recrystallization upon heating at the beginning of the in-situ heat treatment. However, this condition has only been partly achieved in the present study, which points towards some possible improvements in future work.
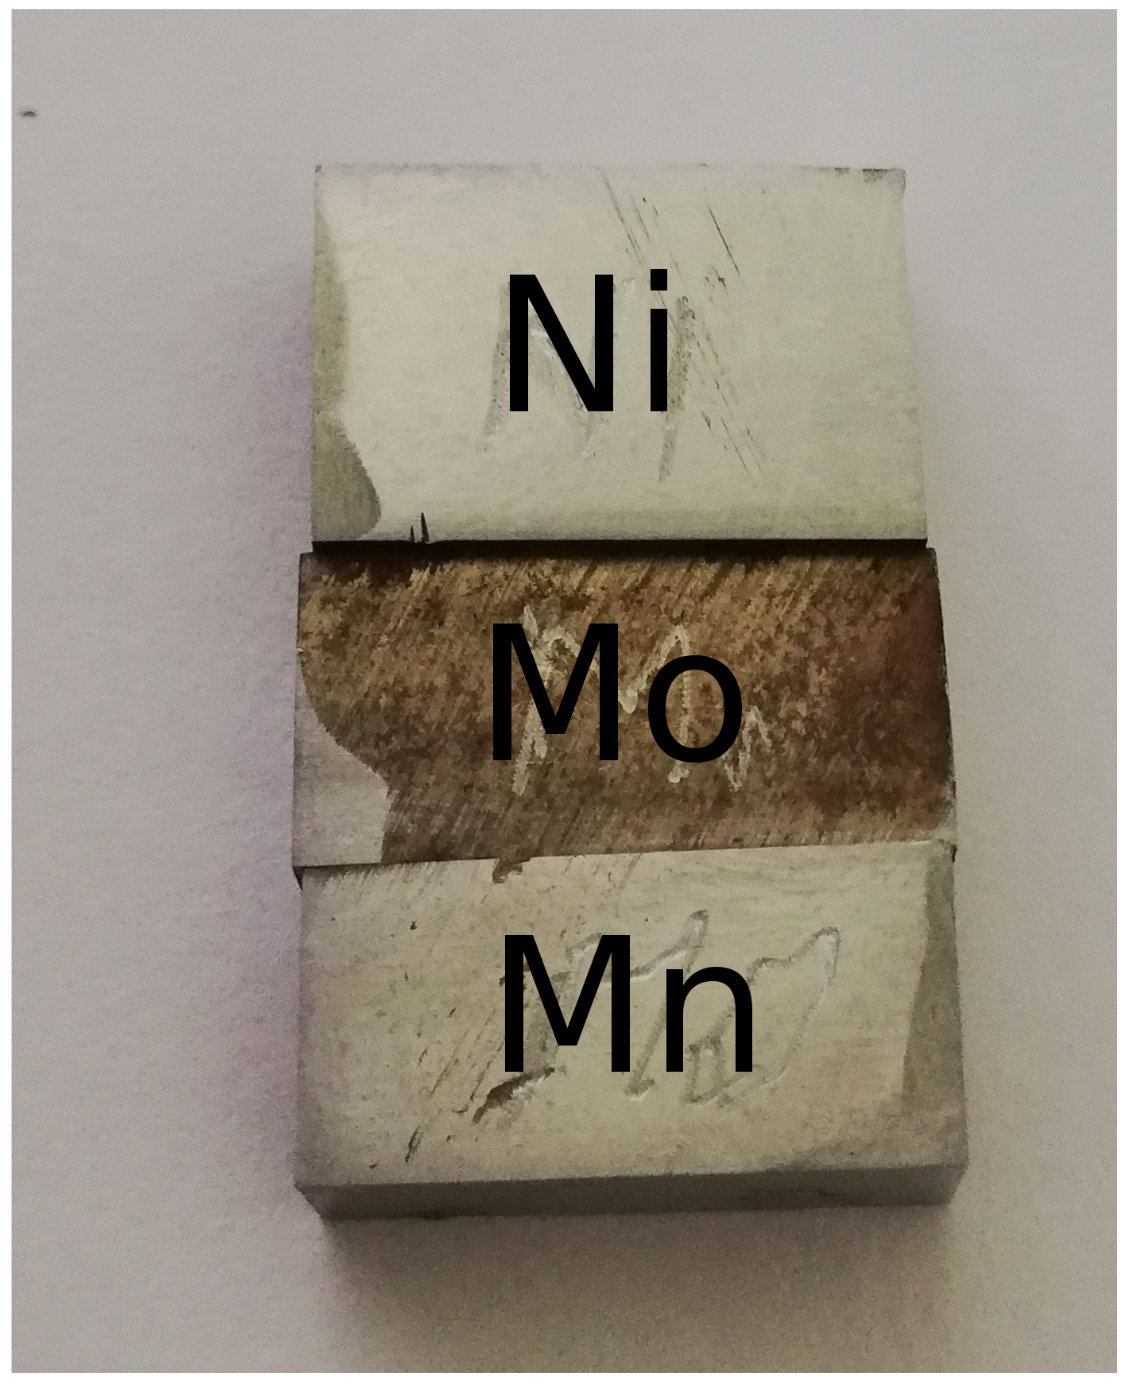
2. Preparation of Compositionally Graded Alloys
3. High Energy X-Ray Diffraction Experiments
3.1. Methodology
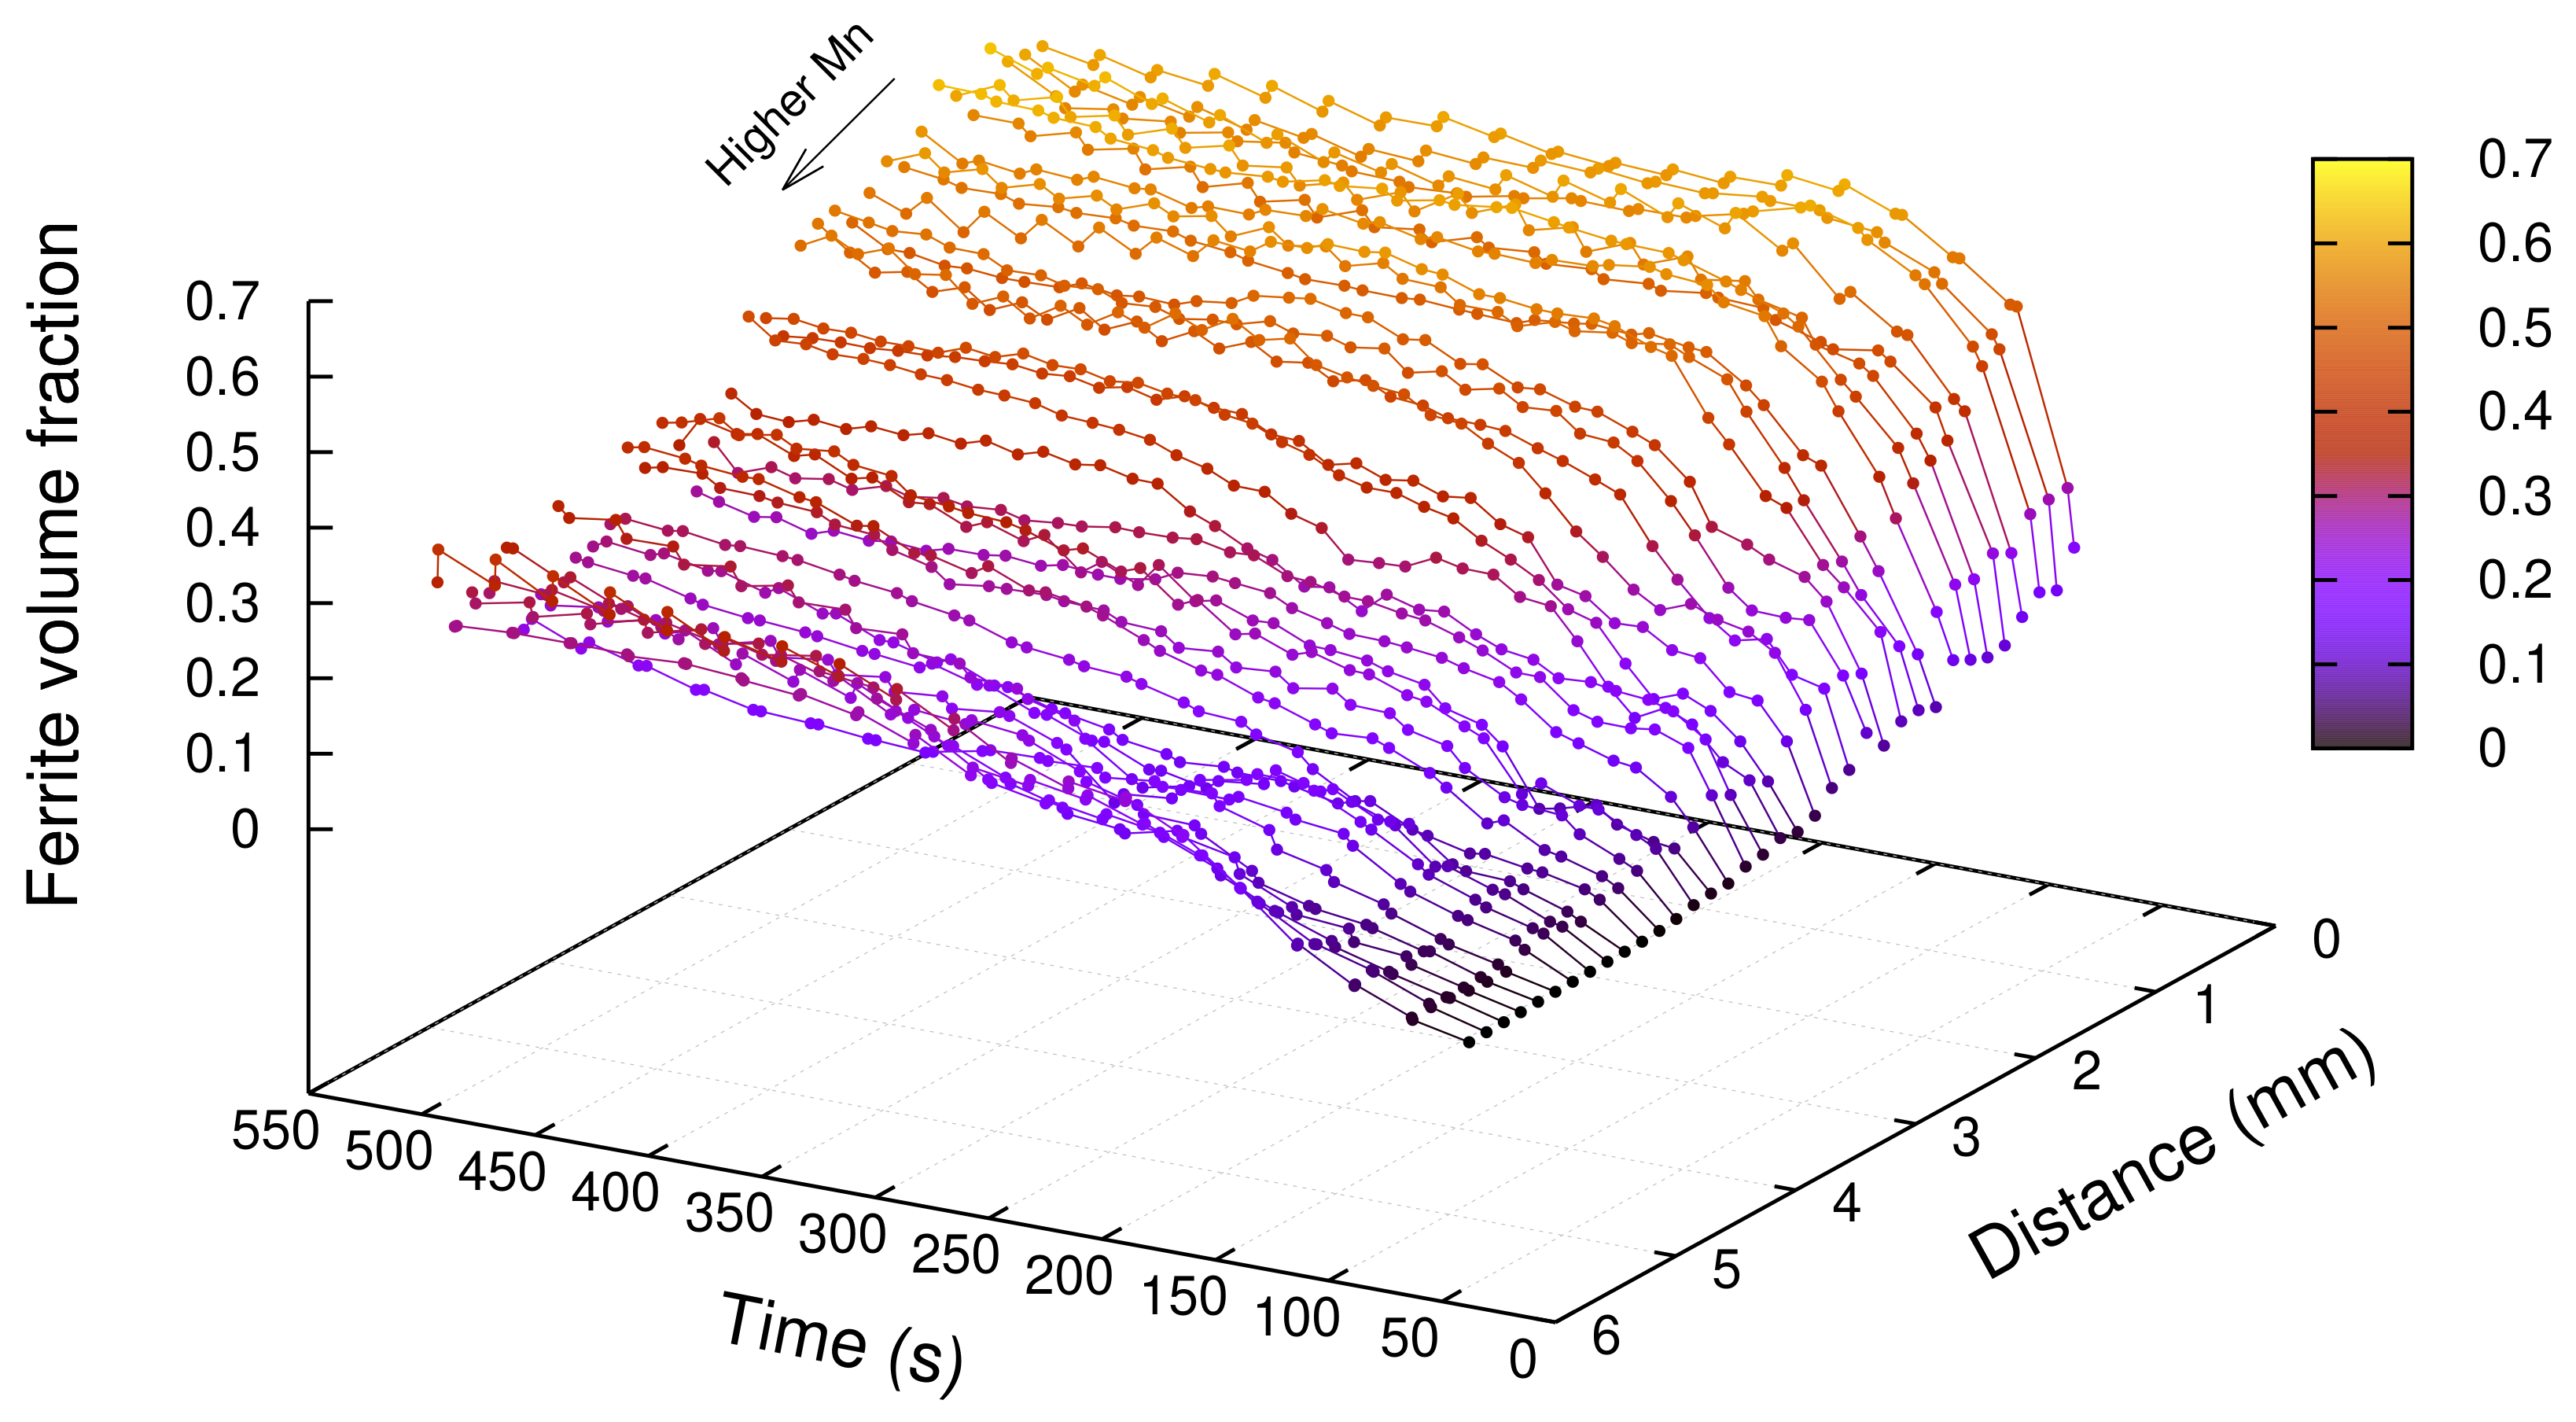
3.2. Results
4. Discussion
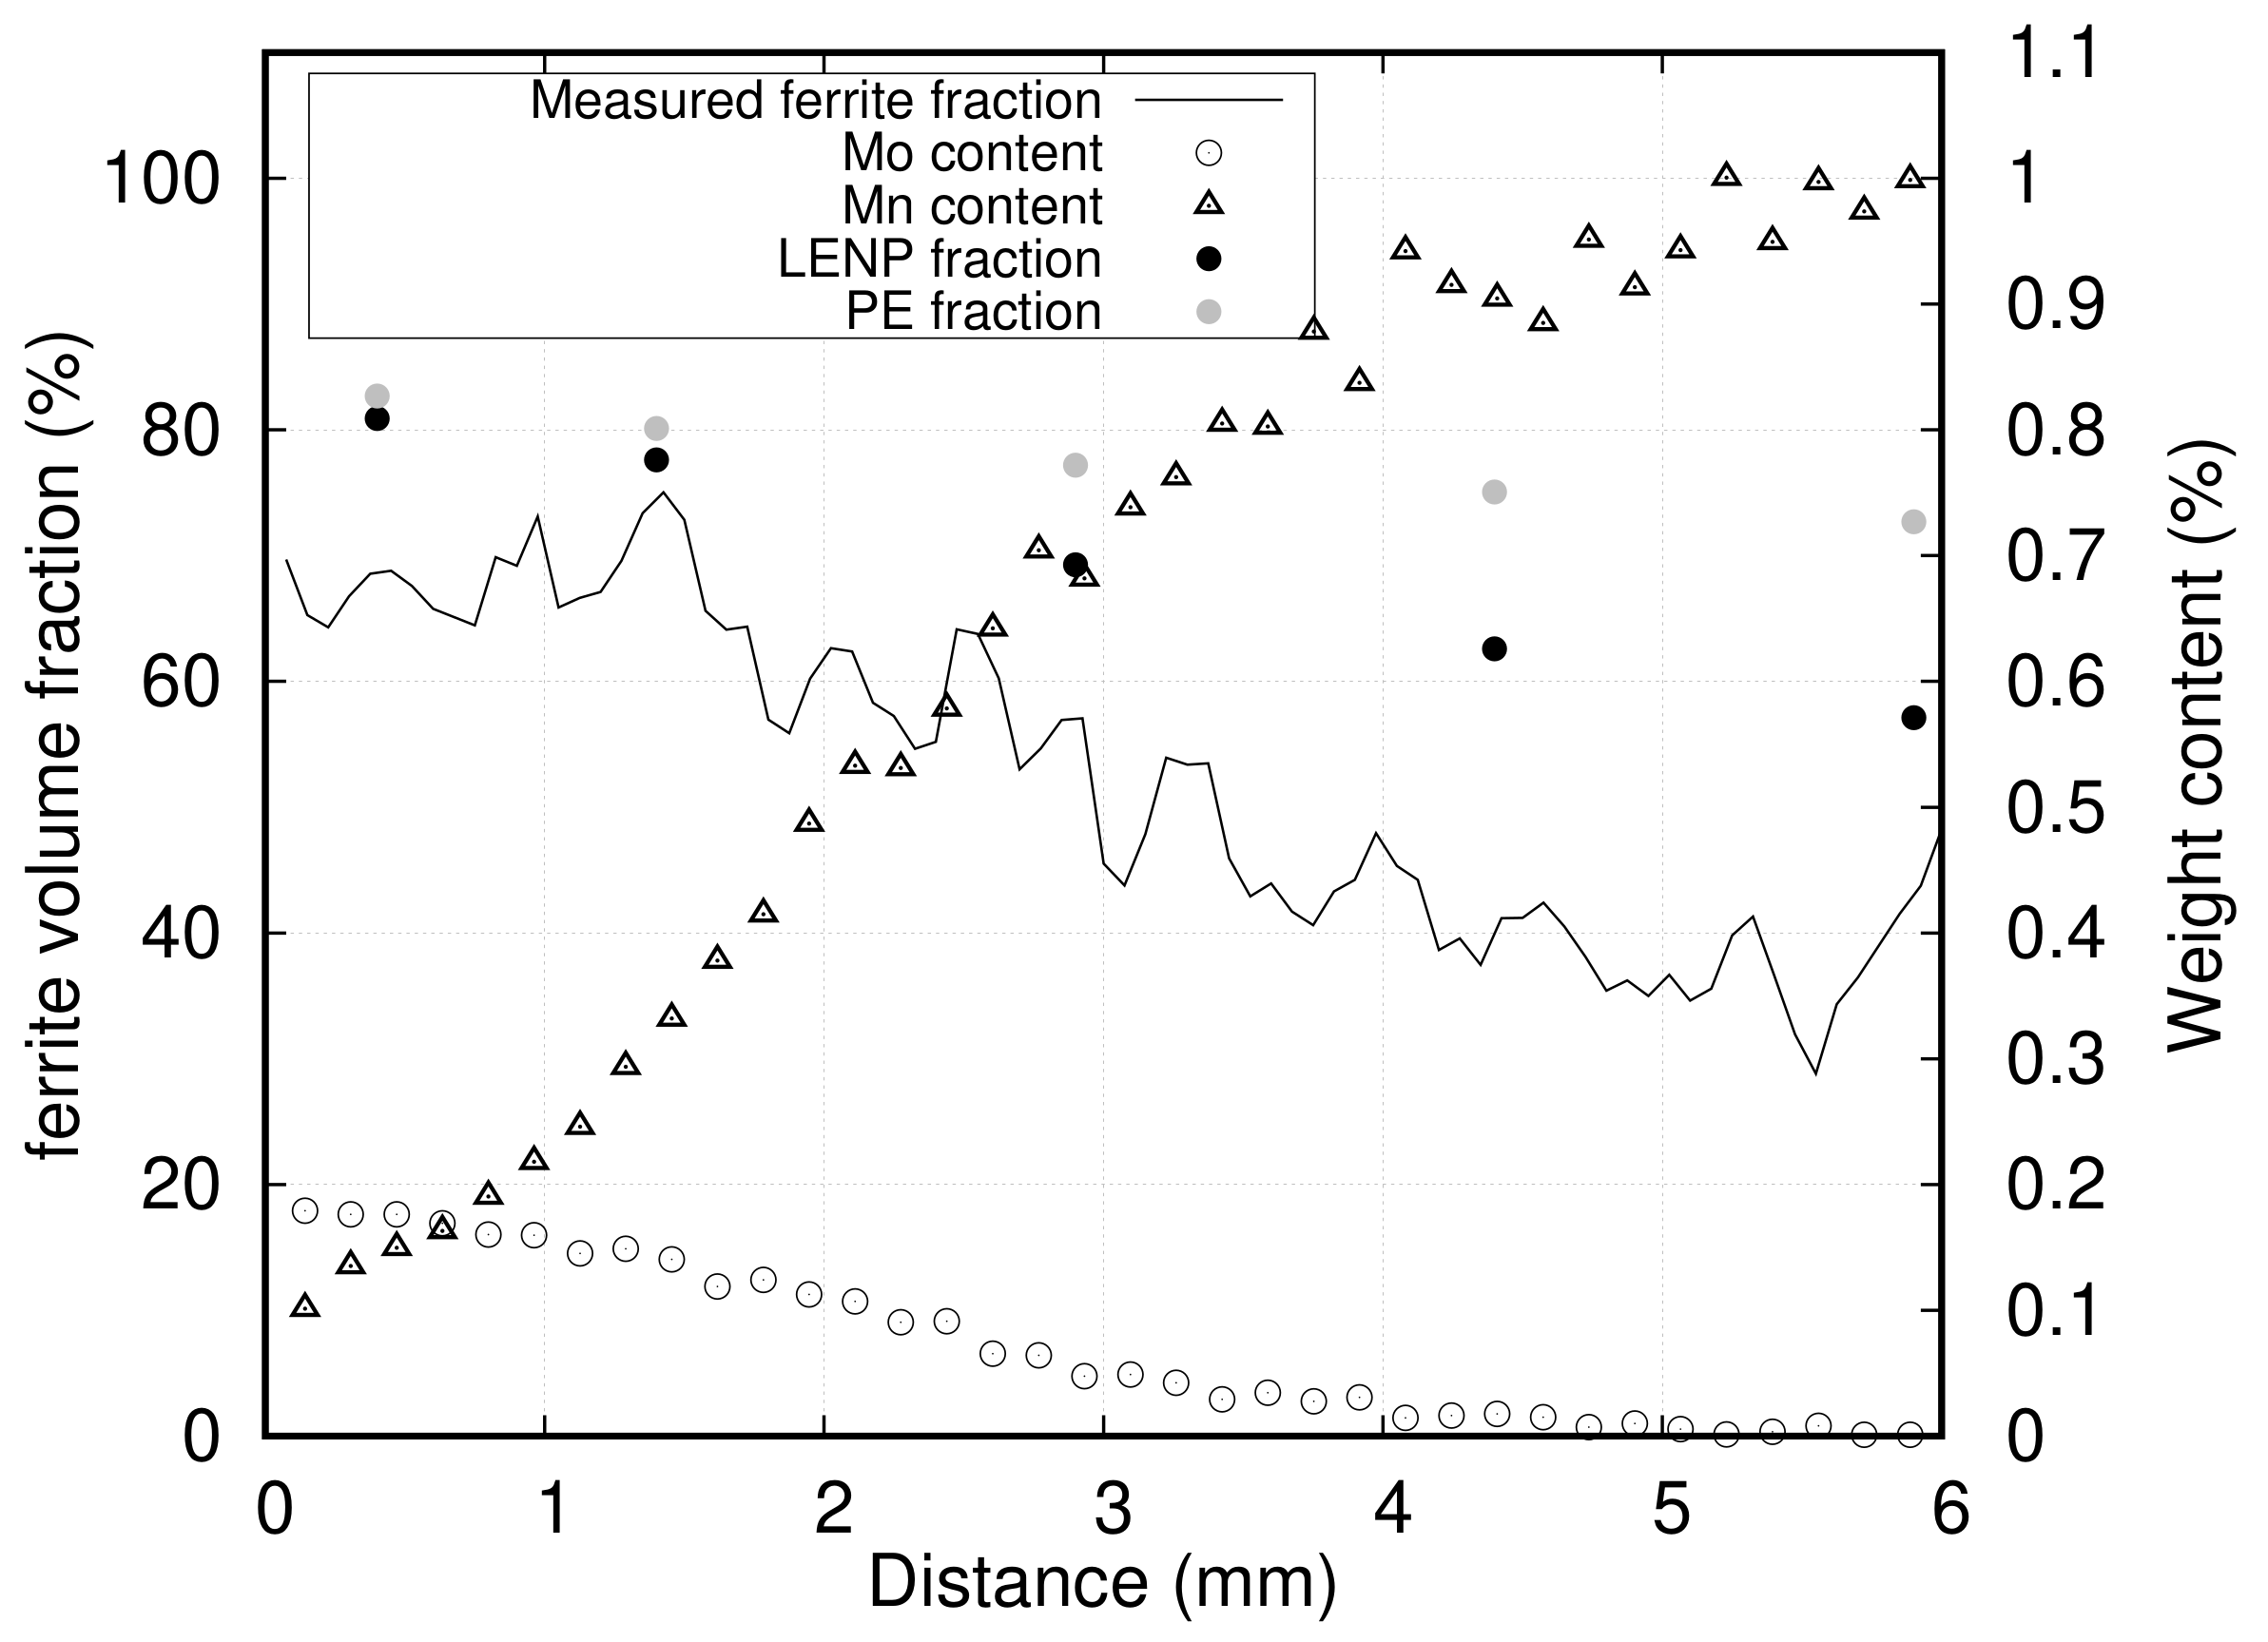
4.1. Effect of Mn on Ferrite Growth
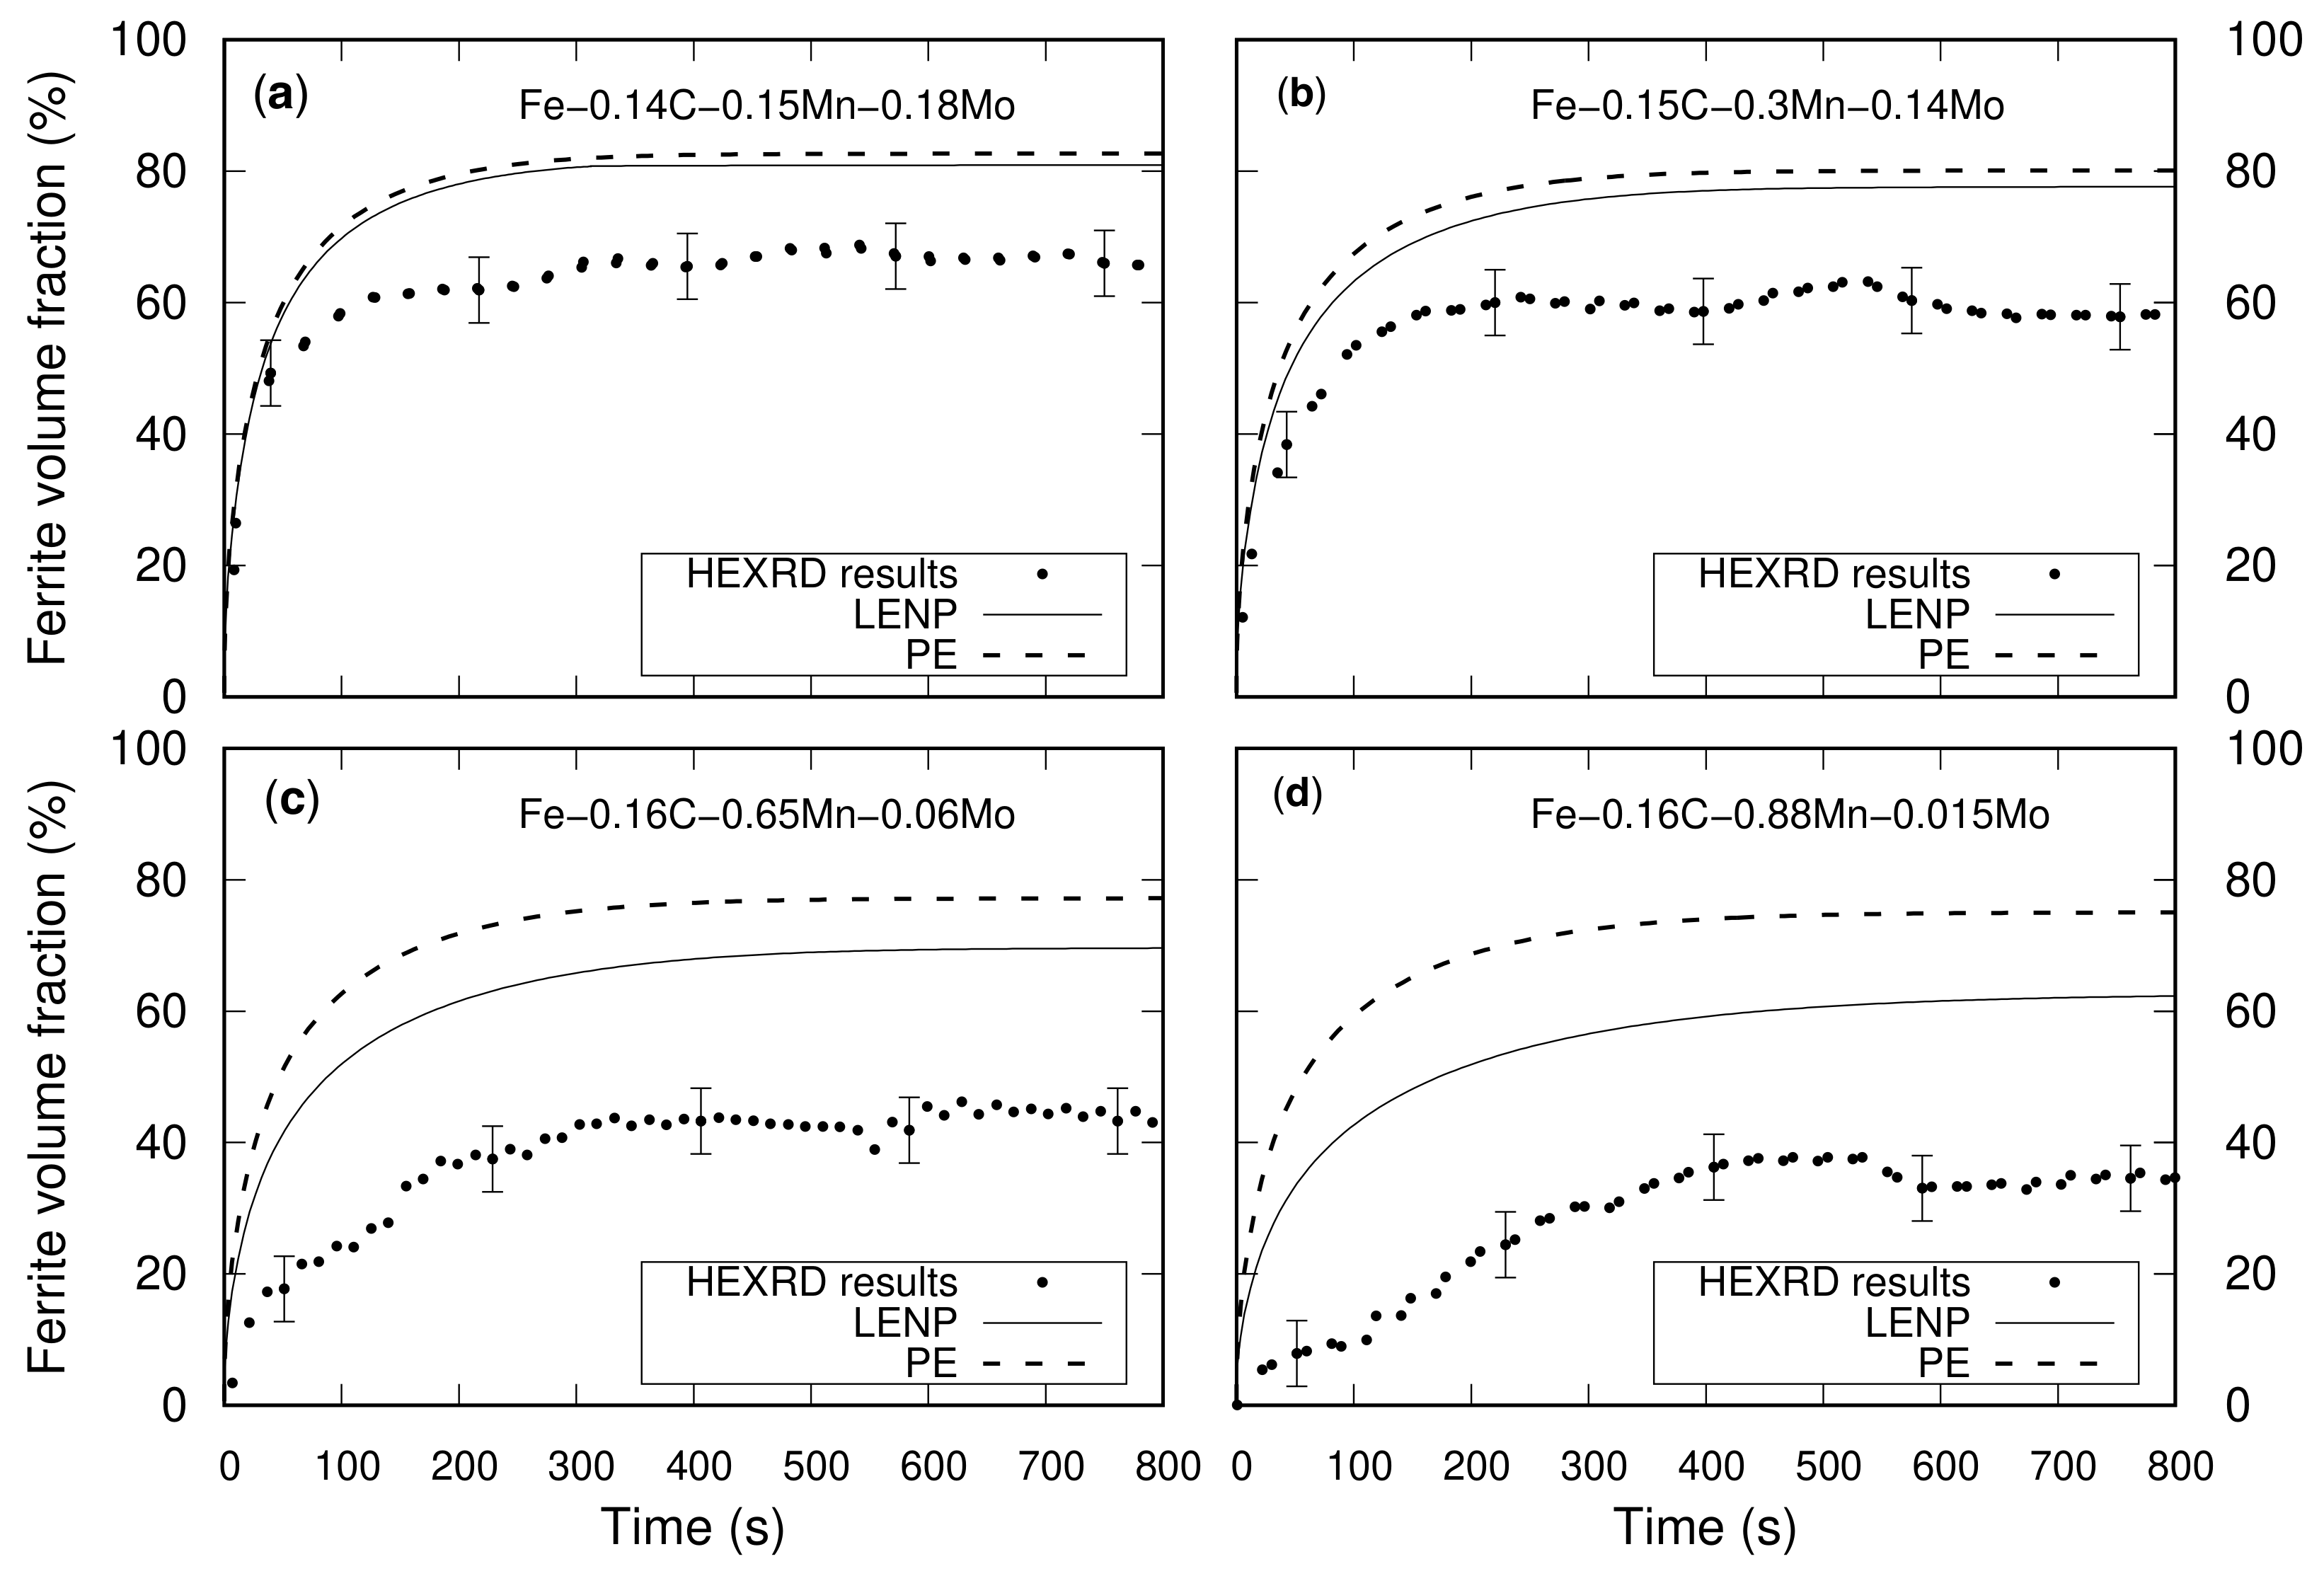
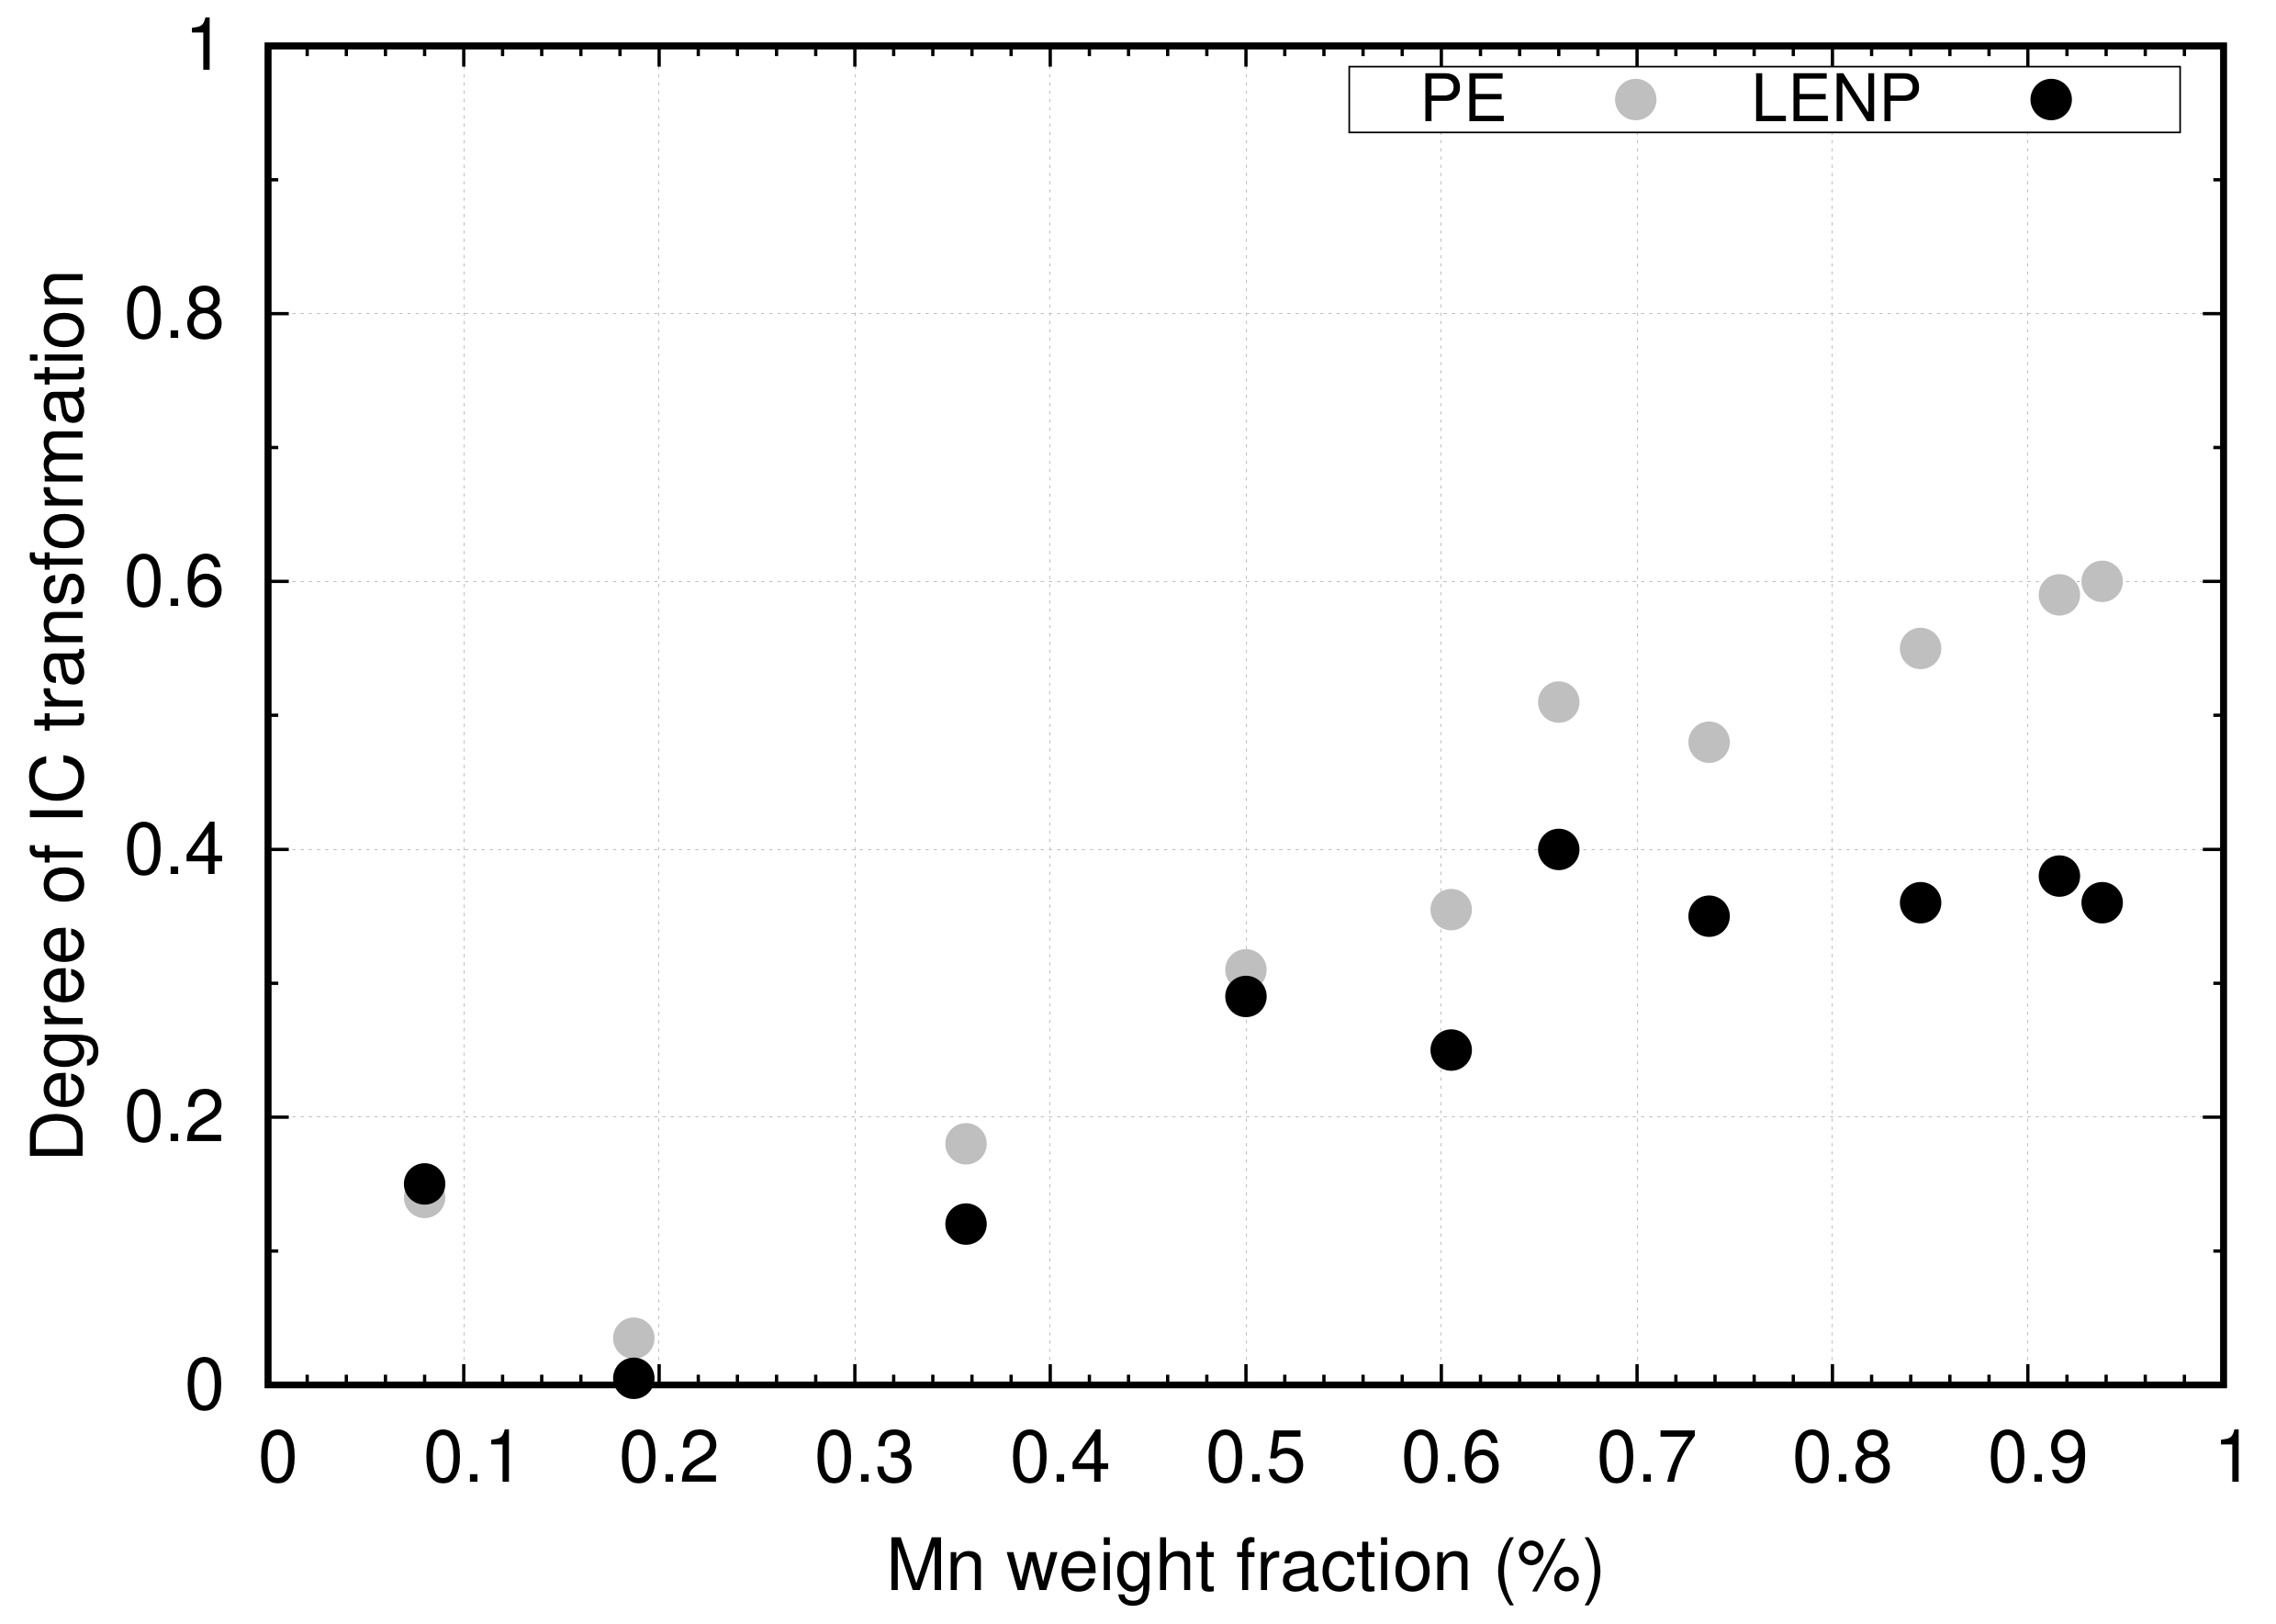
4.2. Effect of Mn and Mo on Ferrite Growth Kinetics
5. Artifacts and Possible Solutions
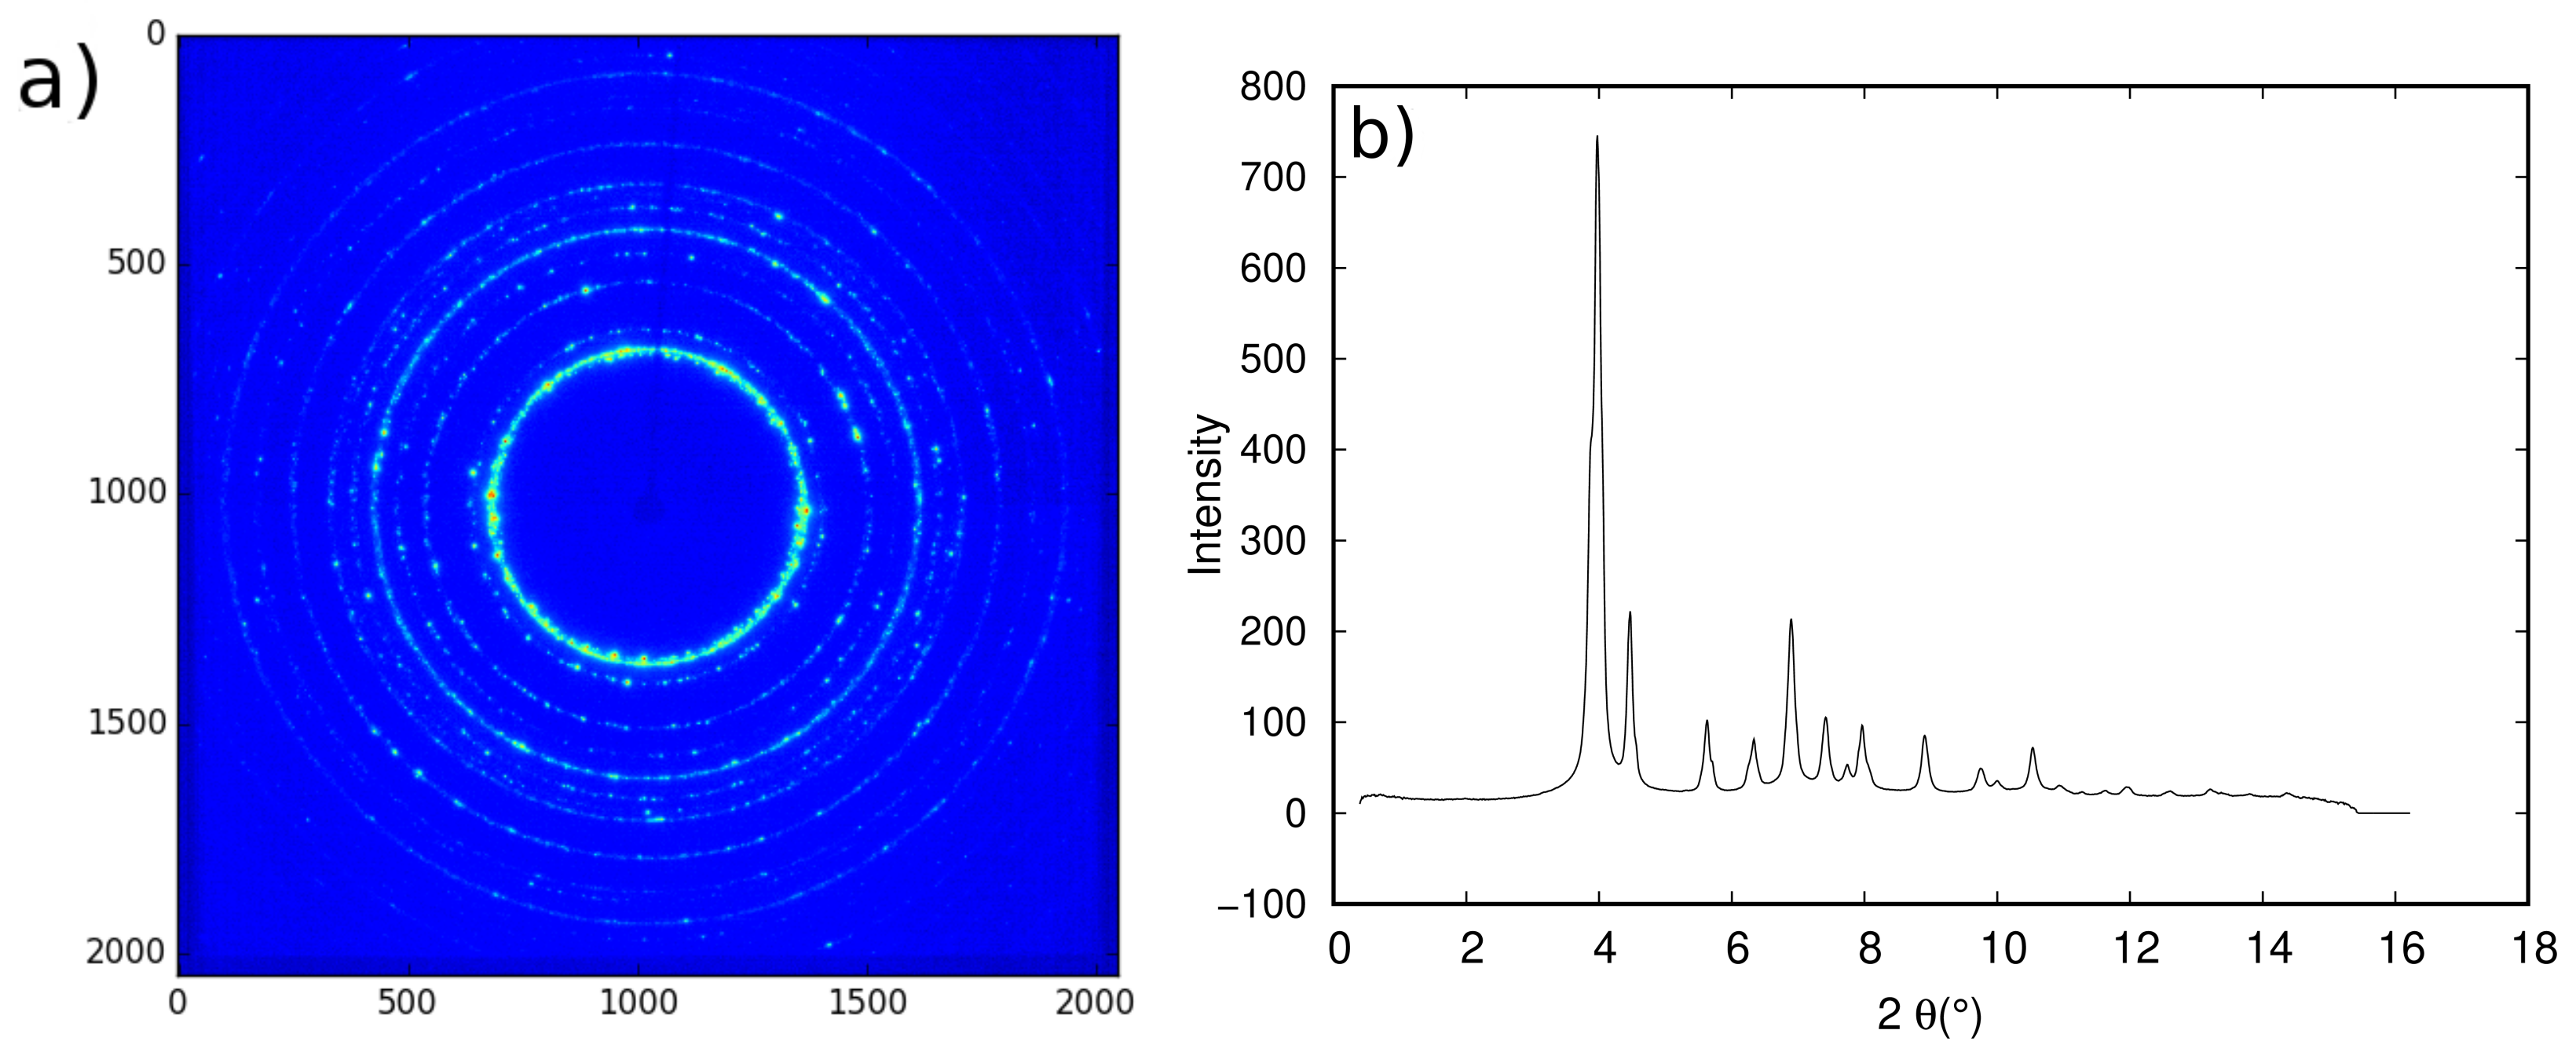
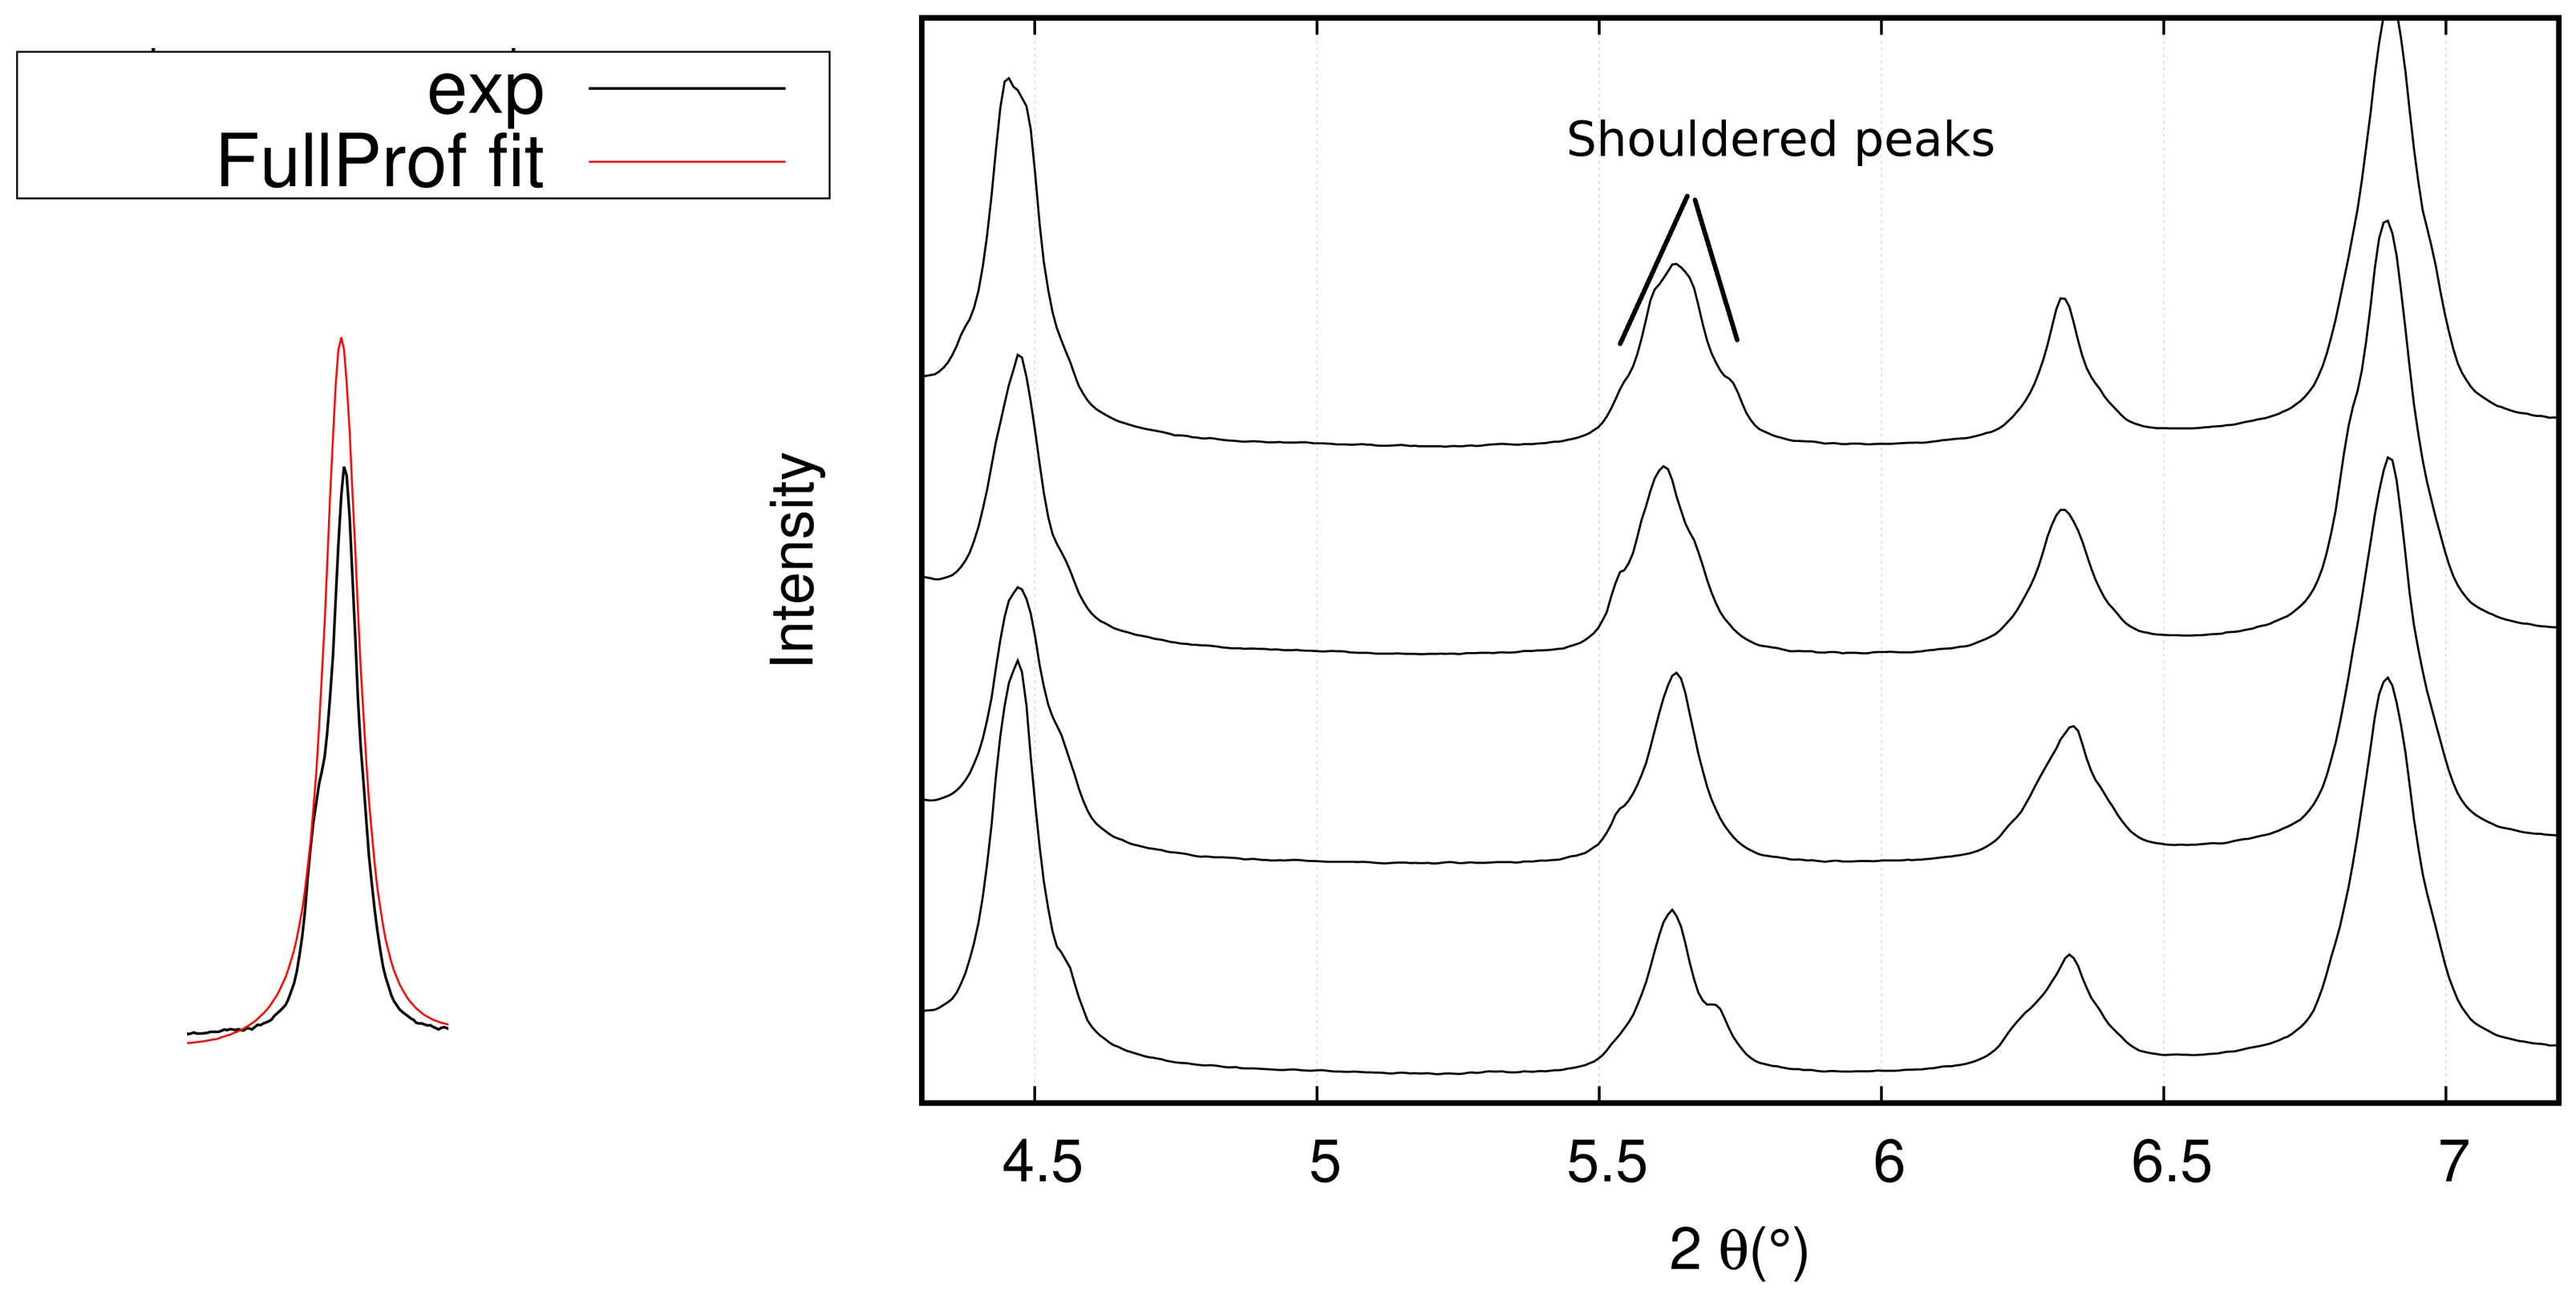
- The first problem was the coarse grain size of the graded samples, which resulted in discontinuous 2D diffraction patterns and subsequent shouldered peaks, making the Rietveld adjustment more difficult and resulting in errors on the calculated phase fractions. One solution to overcome this problem is to use a newly developed furnace with a rotating sample holder. This configuration will lead to an increased number of analyzed grains and an average pattern over the rotation angle, which should in turn translate into more continuous Debye–Scherrer rings. This furnace was already used on a synchrotron beam line in other studies and showed good results [40,41].
- The second problem encountered in developing the methodology was decarburization during phase transformation experiments. As mentioned above, a layer of ferrite was observed on samples surface at the end of HEXRD experiments. This artifact resulted in errors over the measured ferrite fraction. The furnace mentioned above also features superior atmosphere control and should solve this issue as well.
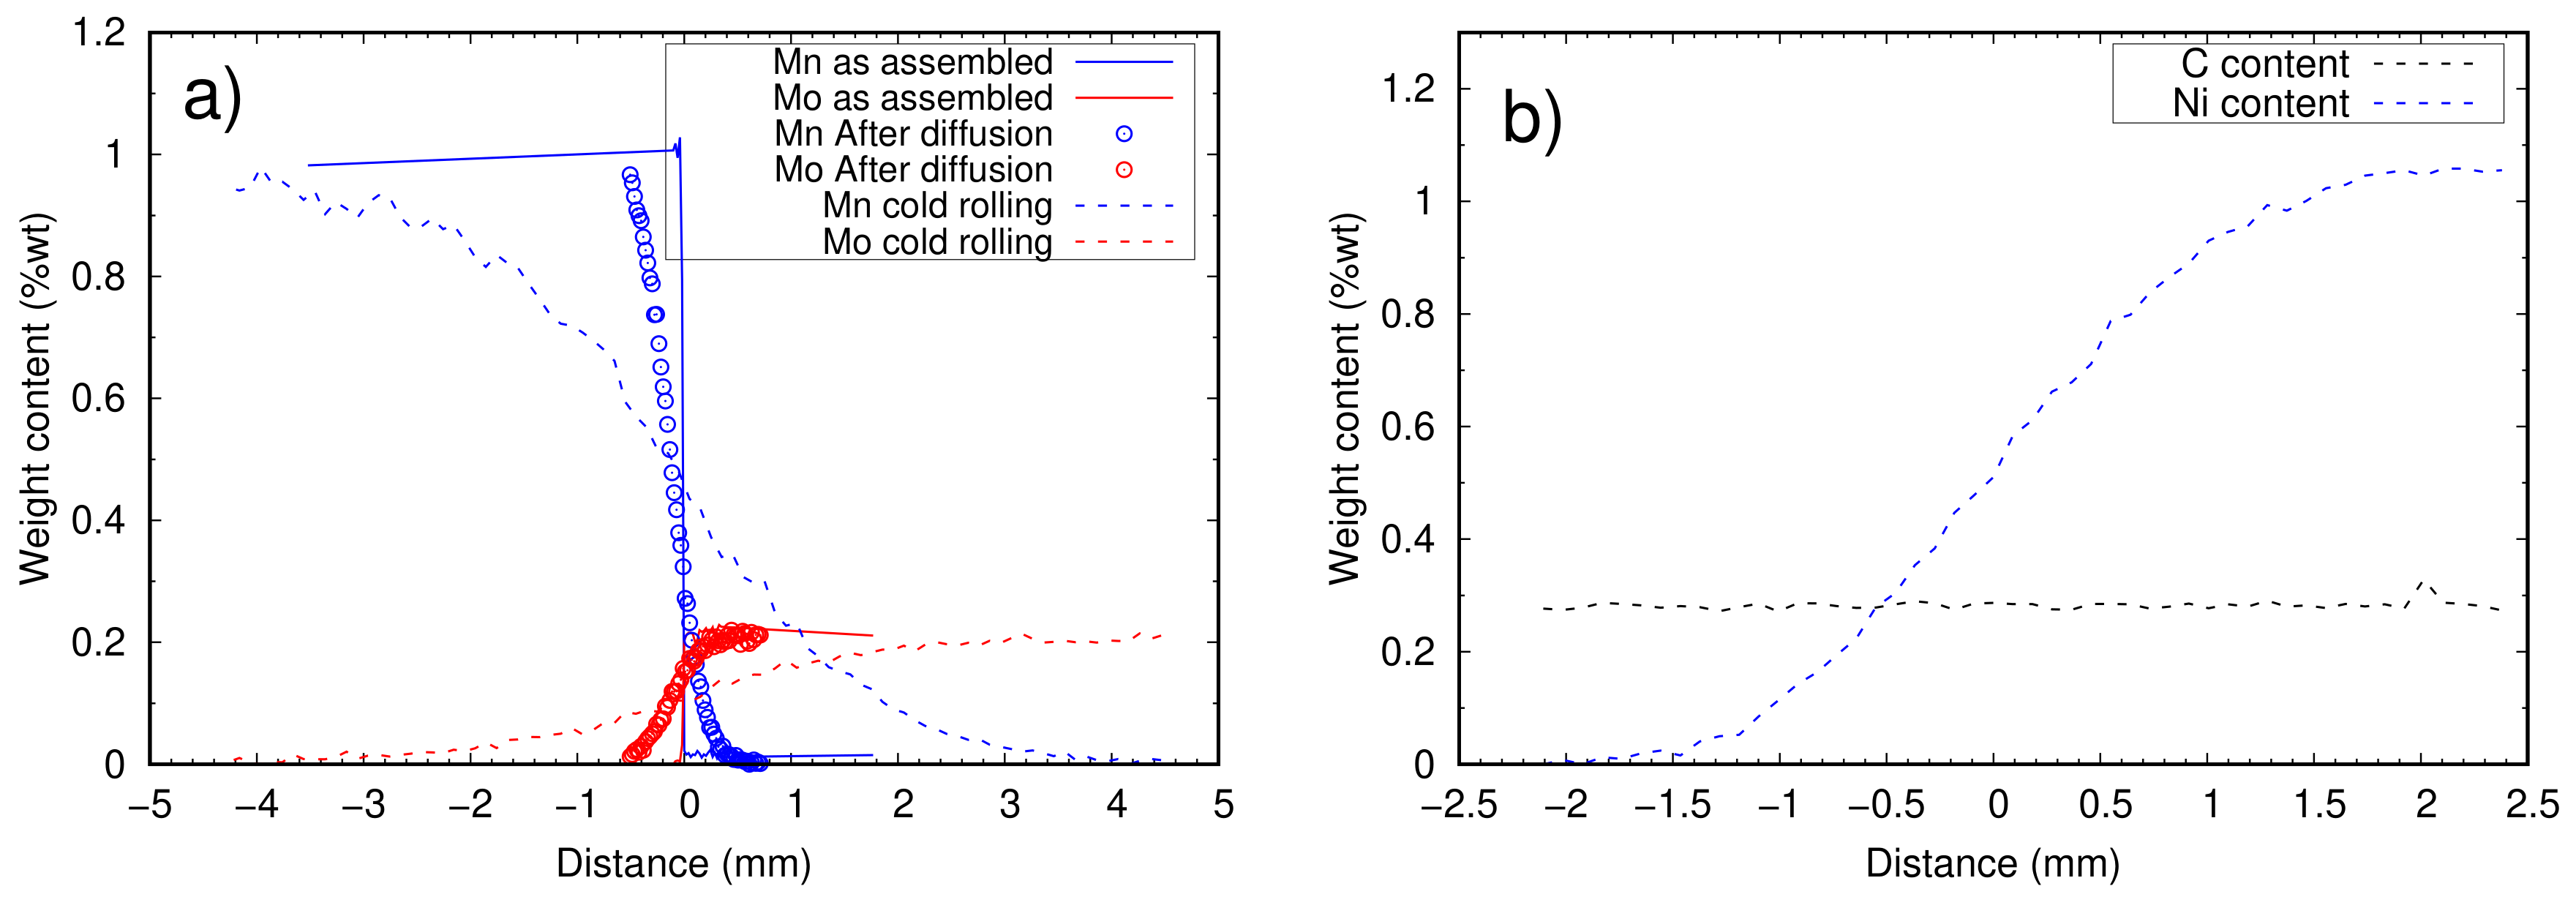
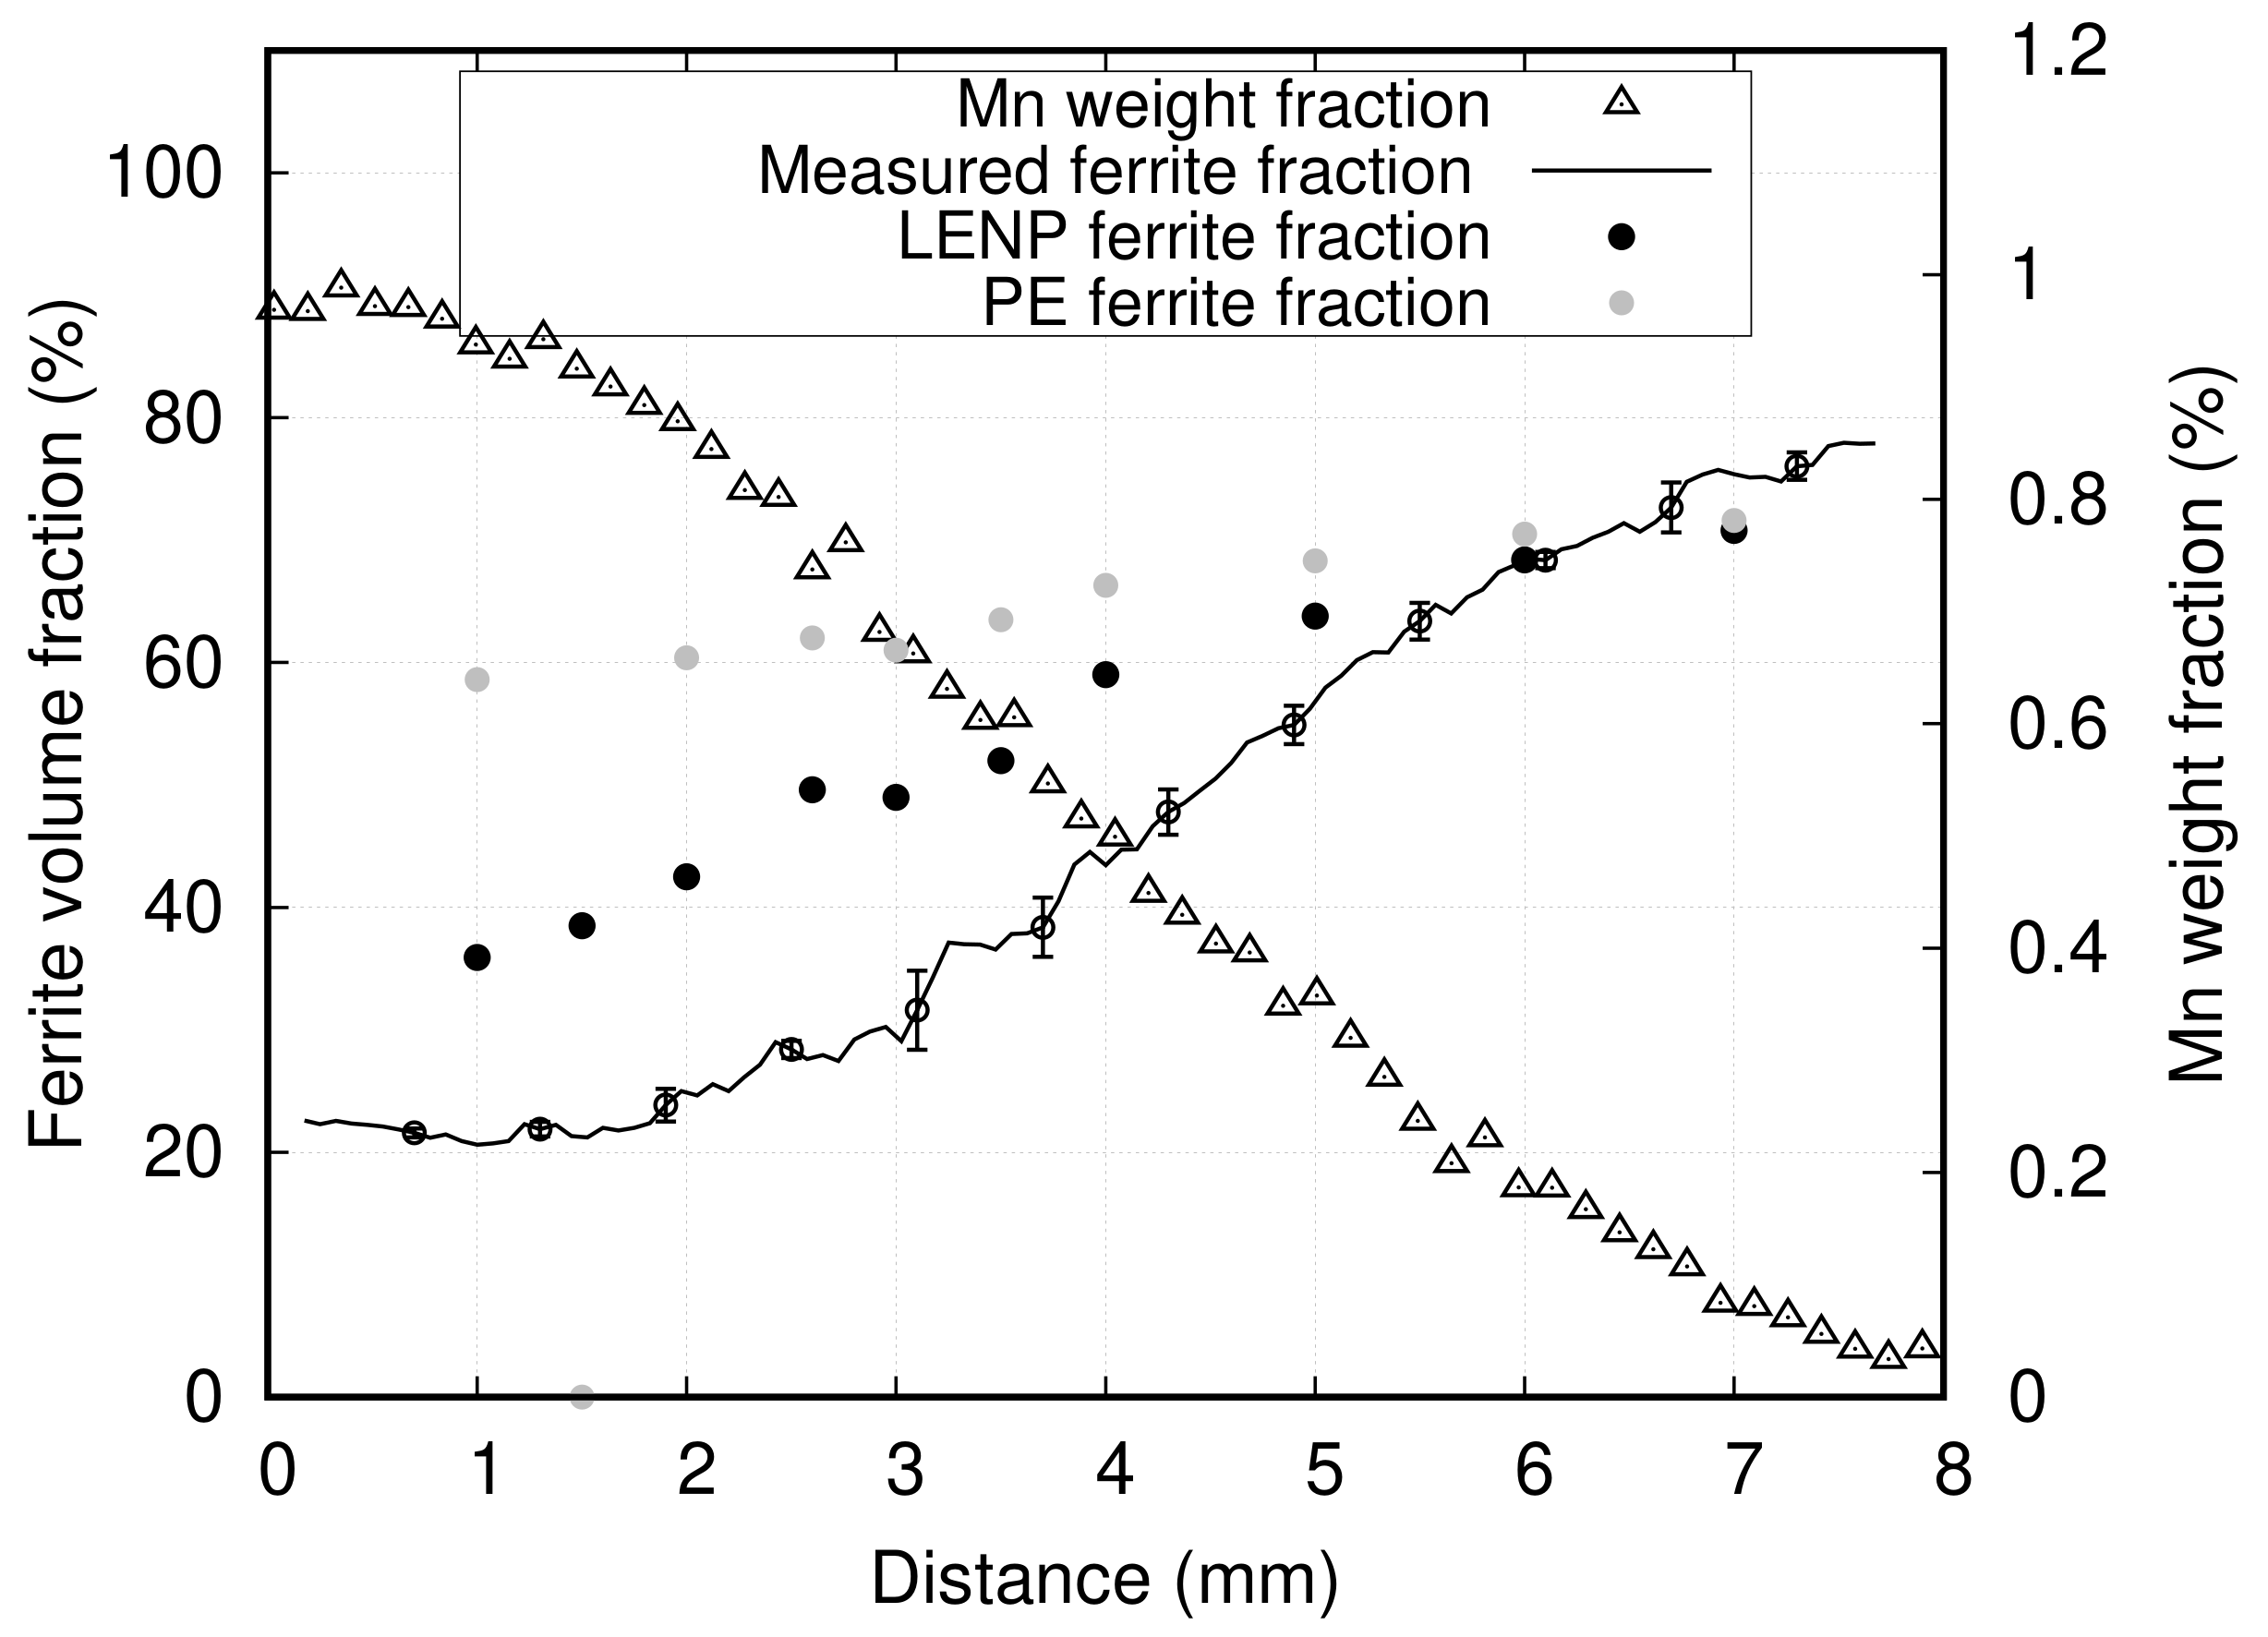
- The last and most important complication was related to the through-thickness gradient of composition generated during cold rolling, due to a deformation disparity between the surfaces and the center of samples, which prevented measuring the transformation at constant composition for a given X-ray beam position. The through-thickness composition profile was measured by EPMA, and only datasets where there was no through-thickness gradient are presented here. A significant number of gradient samples had to be discarded based on this criterion. The many low-reduction passes are suspected to have amplified the through-thickness inhomogeneity of deformation normally expected from rolling. However, we are not able at this point to precisely determine the conditions on the alloy’s rheology, sample geometry, and rolling schedule that would minimize this effect. One of the solutions would be to use higher reductions to promote a more homogeneous deformation. It is thought that this could be achieved with a minimal number of high-reduction hot rolling passes. Alternatively, the plastic deformation step could be skipped altogether and the long composition gradients generated using thermal treatments only. To this end, diffusion should be carried out in the delta ferrite range where the diffusion of substitutional elements is 100 times faster than in austenite. However, this is possible only in low carbon samples. Thus, millimeter scale composition gradients would be formed first and the required amount of carbon would be reintroduced by re-carburizing the samples. Prolonged high temperature treatments without deformation make grain size control particularly challenging with this method. In this case, cyclic austenitization and quench can be used to refine the microstructure [42].
6. Conclusions
Author Contributions
Funding
Acknowledgments
Conflicts of Interest
References
- Bhadeshia, H.; Honeycombe, R. Steels: Microstructure and Properties; Elsevier: Amsterdam, The Netherlands, 2011; Google-Books-ID: 6MtuBqok43MC. [Google Scholar]
- Bhadeshia, H.K.D.H. Diffusional formation of ferrite in iron and its alloys. Prog. Mater. Sci. 1985, 29, 321–386. [Google Scholar] [CrossRef]
- Gouné, M.; Danoix, F.; Ågren, J.; Bréchet, Y.; Hutchinson, C.; Militzer, M.; Purdy, G.; van der Zwaag, S.; Zurob, H. Overview of the current issues in austenite to ferrite transformation and the role of migrating interfaces therein for low alloyed steels. Mater. Sci. Eng. R Rep. 2015, 92, 1–38. [Google Scholar] [CrossRef]
- Enomoto, M. Comparison of alloy element partition behavior and growth kinetics of proeutectoid ferrite in Fe-C-X alloys with diffusion growth theory. ISIJ Int. 1988, 28, 826–835. [Google Scholar] [CrossRef][Green Version]
- Enomoto, M. Local conditions at moving α/γ Boundaries of proeutectoid ferrite transformation in iron alloys. Metall. Mater. Trans. A 2006, 37, 1703–1710. [Google Scholar] [CrossRef]
- Gilmour, J.B.; Purdy, G.R.; Kirkaldy, J.S. Partition of manganese during the proeutectoid ferrite transformation in steel. MT 1972, 3, 3213–3222. [Google Scholar] [CrossRef]
- Purdy, G. The dynamics of transformation interfaces in steels—II. Transformations in FE-C-MO alloys at intermediate temperatures. Acta Metall. 1978, 26, 487–498. [Google Scholar] [CrossRef]
- Gamsjäger, E.; Svoboda, J.; Fischer, F. Austenite-to-ferrite phase transformation in low-alloyed steels. Comput. Mater. Sci. 2005, 32, 360–369. [Google Scholar] [CrossRef]
- Oi, K.; Lux, C.; Purdy, G. A study of the influence of Mn and Ni on the kinetics of the proeutectoid ferrite reaction in steels. Acta Mater. 2000, 48, 2147–2155. [Google Scholar] [CrossRef]
- Van der Ven, A.; Delaey, L. Models for precipitate growth during the γ→α + γ transformation in Fe-C and Fe-C-M alloys. Prog. Mater. Sci. 1996, 40, 181–264. [Google Scholar] [CrossRef]
- Hillert, M. Nature of local equilibrium at the interface in the growth of ferrite from alloyed austenite. Scr. Mater. 2002, 46, 447–453. [Google Scholar] [CrossRef]
- Coates, D.E. Diffusion-controlled precipitate growth in ternary systems I. Metall. Mater. Trans. B 1972, 3, 1203–1212. [Google Scholar] [CrossRef]
- Hutchinson, C.R.; Fuchsmann, A.; Brechet, Y. The diffusional formation of ferrite from austenite in Fe-C-Ni alloys. Metall. Mater. Trans. A 2004, 35, 1211–1221. [Google Scholar] [CrossRef]
- Cahn, J.W. The impurity-drag effect in grain boundary motion. Acta Metall. 1962, 10, 789–798. [Google Scholar] [CrossRef]
- Hillert, M.; Sundman, B. A treatment of the solute drag on moving grain boundaries and phase interfaces in binary alloys. Acta Metall. 1976, 24, 731–743. [Google Scholar] [CrossRef]
- Danoix, F.; Sauvage, X.; Huin, D.; Germain, L.; Gouné, M. A direct evidence of solute interactions with a moving ferrite/austenite interface in a model Fe-C-Mn alloy. Scr. Mater. 2016, 121, 61–65. [Google Scholar] [CrossRef]
- Van Landeghem, H.P.; Langelier, B.; Gault, B.; Panahi, D.; Korinek, A.; Purdy, G.R.; Zurob, H.S. Investigation of solute/interphase interaction during ferrite growth. Acta Mater. 2017, 124, 536–543. [Google Scholar] [CrossRef]
- Guo, H.; Purdy, G.R.; Enomoto, M.; Aaronson, H.I. Kinetic transitions and substititional solute (Mn) fields associated with later stages of ferrite growth in Fe-C-Mn-Si. Metall. Mater. Trans. A 2006, 37, 1721–1729. [Google Scholar] [CrossRef]
- Purdy, G.R.; Brechet, Y.J.M. A solute drag treatment of the effects of alloying elements on the rate of the proeutectoid ferrite transformation in steels. Acta Metall. Mater. 1995, 43, 3763–3774. [Google Scholar] [CrossRef]
- Odqvist, J.; Sundman, B.; Ågren, J. A general method for calculating deviation from local equilibrium at phase interfaces. Acta Mater. 2003, 51, 1035–1043. [Google Scholar] [CrossRef]
- Zurob, H.S.; Panahi, D.; Hutchinson, C.R.; Brechet, Y.; Purdy, G.R. Self-Consistent Model for Planar Ferrite Growth in Fe-C-X Alloys. Metall. Mater. Trans. A 2013, 44, 3456–3471. [Google Scholar] [CrossRef]
- Qiu, C.; Zurob, H.; Hutchinson, C. The coupled solute drag effect during ferrite growth in Fe–C–Mn–Si alloys using controlled decarburization. Acta Mater. 2015, 100, 333–343. [Google Scholar] [CrossRef]
- Sun, W.; Zurob, H.; Hutchinson, C. Coupled solute drag and transformation stasis during ferrite formation in Fe-C-Mn-Mo. Acta Mater. 2017, 139, 62–74. [Google Scholar] [CrossRef]
- Hutchinson, C. A novel experimental approach to identifying kinetic transitions in solid state phase transformations. Scr. Mater. 2004, 50, 285–290. [Google Scholar] [CrossRef]
- Deschamps, A.; Tancret, F.; Benrabah, I.E.; De Geuser, F.; Van Landeghem, H.P. Combinatorial approaches for the design of metallic alloys. C. R. Phys. 2018, 19, 737–754. [Google Scholar] [CrossRef]
- Raabe, D.; Springer, H.; Gutierrez-Urrutia, I.; Roters, F.; Bausch, M.; Seol, J.B.; Koyama, M.; Choi, P.P.; Tsuzaki, K. Alloy Design, Combinatorial Synthesis, and Microstructure–Property Relations for Low-Density Fe-Mn-Al-C Austenitic Steels. JOM 2014, 66, 1845–1856. [Google Scholar] [CrossRef]
- Zhao, J.C.; Zheng, X.; Cahill, D.G. Thermal conductivity mapping of the Ni–Al system and the beta-NiAl phase in the Ni–Al–Cr system. Scr. Mater. 2012, 66, 935–938. [Google Scholar] [CrossRef]
- Zhao, J.C. A combinatorial approach for efficient mapping of phase diagrams and properties. J. Mater. Res. 2001, 16, 1565–1578. [Google Scholar] [CrossRef]
- Sinclair, C.; Hutchinson, C.; Bréchet, Y. The Effect of Nb on the Recrystallization and Grain Growth of Ultra-High-Purity α-Fe: A Combinatorial Approach. Metall. Mater. Trans. A 2007, 38, 821–830. [Google Scholar] [CrossRef]
- De Geuser, F.; Styles, M.; Hutchinson, C.; Deschamps, A. High-throughput in-situ characterization and modeling of precipitation kinetics in compositionally graded alloys. Acta Mater. 2015, 101, 1–9. [Google Scholar] [CrossRef]
- Gumbmann, E.; De Geuser, F.; Deschamps, A.; Lefebvre, W.; Robaut, F.; Sigli, C. A combinatorial approach for studying the effect of Mg concentration on precipitation in an Al–Cu–Li alloy. Scr. Mater. 2016, 110, 44–47. [Google Scholar] [CrossRef]
- Geandier, G.; Aeby-Gautier, E.; Settefrati, A.; Dehmas, M.; Appolaire, B. Study of diffusive transformations by high energy X-ray diffraction. C. R. Phys. 2012, 13, 257–267. [Google Scholar] [CrossRef]
- Esin, V.; Denand, B.; Le Bihan, Q.; Dehmas, M.; Teixeira, J.; Geandier, G.; Denis, S.; Sourmail, T.; Aeby-Gautier, E. In situ synchrotron X-ray diffraction and dilatometric study of austenite formation in a multi-component steel: Influence of initial microstructure and heating rate. Acta Mater. 2014, 80, 118–131. [Google Scholar] [CrossRef]
- Thermo-Calc Software. Available online: www.thermocalc.com (accessed on 15 July 2019).
- Robaut, F.; Crisci, A.; Durand-Charre, M.; Jouanne, D. Practical Aspects of Carbon Content Determination in Carburized Steels by EPMA. Microsc. Microanal. 2006, 12, 331–334. [Google Scholar] [CrossRef] [PubMed]
- Chen, H.; Kuziak, R.; van der Zwaag, S. Experimental Evidence of the Effect of Alloying Additions on the Stagnant Stage Length During Cyclic Partial Phase Transformations. Metall. Mater. Trans. A 2013, 44, 5617–5621. [Google Scholar] [CrossRef]
- Chen, H.; van der Zwaag, S. A general mixed-mode model for the austenite-to-ferrite transformation kinetics in Fe–C–M alloys. Acta Mater. 2014, 72, 1–12. [Google Scholar] [CrossRef]
- Xia, Y.; Miyamoto, G.; Yang, Z.; Zhang, C.; Furuhara, T. Direct measurement of carbon enrichment in the incomplete bainite transformation in Mo added low carbon steels. Acta Mater. 2015, 91, 10–18. [Google Scholar] [CrossRef]
- Xia, Y.; Miyamoto, G.; Yang, Z.G.; Zhang, C.; Furuhara, T. Effects of Mo on Carbon Enrichment During Proeutectoid Ferrite Transformation in Hypoeutectoid Fe-C-Mn Alloys. Metall. Mater. Trans. A 2015, 46, 2347–2351. [Google Scholar] [CrossRef]
- Bénéteau, A.; Weisbecker, P.; Geandier, G.; Aeby-Gautier, E.; Appolaire, B. Austenitization and precipitate dissolution in high nitrogen steels: An in situ high temperature X-ray synchrotron diffraction analysis using the Rietveld method. Mater. Sci. Eng. A 2005, 393, 63–70. [Google Scholar] [CrossRef]
- Bruneseaux, F.; Aeby-Gautier, E.; Geandier, G.; Da Costa Teixeira, J.; Appolaire, B.; Weisbecker, P.; Mauro, A. In situ characterizations of phase transformations kinetics in the Ti17 titanium alloy by electrical resistivity and high temperature synchrotron X-ray diffraction. Mater. Sci. Eng. A 2008, 476, 60–68. [Google Scholar] [CrossRef]
- Grange, R.A. The rapid heat treatment of steel. Metall. Trans. 1971, 2, 65–78. [Google Scholar] [CrossRef]


| Composition wt.% | C | Si | Mn | Mo | Cr | Ni | Al | Other Alloying Elements |
|---|---|---|---|---|---|---|---|---|
| Fe–C | 0.27 | 0.03 | <0.002 | <0.002 | <0.002 | <0.002 | 0.003 | <0.002 |
| Fe–C–Mn | 0.27 | 0.03 | 0.98 | <0.002 | <0.002 | <0.002 | 0.003 | <0.002 |
| Fe–C–Mo | 0.27 | 0.02 | 0.004 | 0.21 | <0.002 | <0.002 | 0.003 | <0.002 |
| Fe–C–Ni | 0.27 | 0.02 | 0.004 | <0.002 | <0.002 | 1.0 | 0.003 | <0.002 |
© 2019 by the authors. Licensee MDPI, Basel, Switzerland. This article is an open access article distributed under the terms and conditions of the Creative Commons Attribution (CC BY) license (http://creativecommons.org/licenses/by/4.0/).
Share and Cite
Benrabah, I.-E.; Van Landeghem, H.P.; Bonnet, F.; Robaut, F.; Deschamps, A. Use of Space-Resolved in-Situ High Energy X-ray Diffraction for the Characterization of the Compositional Dependence of the Austenite-to-Ferrite Transformation Kinetics in Steels. Quantum Beam Sci. 2020, 4, 1. https://doi.org/10.3390/qubs4010001
Benrabah I-E, Van Landeghem HP, Bonnet F, Robaut F, Deschamps A. Use of Space-Resolved in-Situ High Energy X-ray Diffraction for the Characterization of the Compositional Dependence of the Austenite-to-Ferrite Transformation Kinetics in Steels. Quantum Beam Science. 2020; 4(1):1. https://doi.org/10.3390/qubs4010001
Chicago/Turabian StyleBenrabah, Imed-Eddine, Hugo Paul Van Landeghem, Frédéric Bonnet, Florence Robaut, and Alexis Deschamps. 2020. "Use of Space-Resolved in-Situ High Energy X-ray Diffraction for the Characterization of the Compositional Dependence of the Austenite-to-Ferrite Transformation Kinetics in Steels" Quantum Beam Science 4, no. 1: 1. https://doi.org/10.3390/qubs4010001
APA StyleBenrabah, I.-E., Van Landeghem, H. P., Bonnet, F., Robaut, F., & Deschamps, A. (2020). Use of Space-Resolved in-Situ High Energy X-ray Diffraction for the Characterization of the Compositional Dependence of the Austenite-to-Ferrite Transformation Kinetics in Steels. Quantum Beam Science, 4(1), 1. https://doi.org/10.3390/qubs4010001